Introduction
The active process of visual information sampling from the environment is often described as ‘active vision’ (Aloimonos, Weiss, & Bandyopadhyay, 1987;
Findlay & Gilchrist, 2003). The important role of eye movements within this active process was repeatedly emphasized in the literature (e.g.
Findlay, 1998;
Hayhoe & Ballard, 2005;
Henderson & Hollingworth, 1998) and is based on the assumption that the allocation of visual attention mostly corresponds to the direction of the eyes (e.g.
Fischer, 1999;
Henderson, 2007). Highest visual acuity is limited to the small foveal area. Saccades, fast sequential movements, are necessary to bring the fovea from one point to another. Fixations are the periods in between of saccades, when the eyes are relatively stable.
The durations of fixations can vary from less than 100 milliseconds to several seconds resulting in a positive skewed distribution with a pronounced peak between 200 and 250 milliseconds (
Rayner, 1998). Already Buswell (1935) reported a high variability in the duration from one fixation to another. Not surprisingly, variation in this parameter can be found between as well as within subjects (Rayner, Li, Williams, Cave, & Well, 2007). Since visual information processing is specifically related to fixations (e.g.
Dodge, 1900) it is of importance to know more about factors influencing their duration. Research on tasks such as reading (
Rayner, 1978,
1998), visual search (
Vaughan, 1982) and scene perception (Henderson, Weeks, & Hollingworth, 1999) has resulted in a number of models explaining the control of fixation duration. It was suggested that fixations are governed by the information extraction and processing (
Groner & Groner, 1989;
Just & Carpenter, 1980), cognitive processes like a memory buffer (
Shebilske, 1975) and by means of eye movements pre-programming (
Buswell, 1935;
Zingale & Kowler, 1987).
Salthouse and Ellis (
1980) investigated variables that were assumed to have control on the duration of fixations (e.g. stimulus processing time). In their model amplitudes of the prior and not of the successive saccade are of importance for the fixation duration.
In addition to the task relation it was found that also the level of available visual information influences the duration of fixations (
Loftus, 1985; Mannan, Ruddock, & Wooding, 1995; Parkhurst, Culurciello, & Niebur, 2000). For instance, Mannan and colleagues (1995) presented filtered (high- and low-pass) and unfiltered photos and reported longest fixations for the low-pass filtered scenes and shortest for the unfiltered material. Van Diepen and d'Ydewalle (2003) used a gaze contingent mask during visual search, preventing either foveal or peripheral processing of information. Prolonged fixations were reported for both manipulations suggesting that foveal as well as peripheral information modulate the lengths of fixations. Loschky, McConkie, Yang and Miller (2005) presented in a similar procedure a multiresolutional display with high resolution at the fovea that decreased with eccentricity from the gaze centre. Longer fixations were reported if the manipulation was perceivable.
Henderson and Pierce (
2008) reported about two distinct fixation populations, one being under direct control of the current available information, whereas no such relationship could be identified for the other. However, control mechanisms for the temporal sequence of eye movements in natural viewing are yet unknown (
Hegdé, 2008). Since only few studies on the investigation of the time course can be found (e.g. Unema, Pannasch, Joos, & Velichkovsky, 2005) the present research attempts to further explore this question.
Most visual activities require the execution of a saccade about 3-4 times per second (e.g.
Findlay & Gilchrist, 2003). In an everyday task like tea-making, the amplitudes of saccades were found to vary from only a few degrees up to 130 degrees of arc (
Land, 2004; Land, Mennie, & Rusted, 1999). Furthermore, research on scene perception revealed a correlation between saccadic amplitude and image size (
von Wartburg et al., 2007) as well as between the direction of saccades and the general shape of the picture frame (Over, Hooge, Vlaskamp, & Erkelens, 2007). It is known that our eyes are guided to specific locations instead of being randomly distributed over the whole scene (
Buswell, 1935;
Yarbus, 1967). In search for an explanation of saccadic target selection at least two groups of factors can be assumed: (i) the saliency of objects in a scene and (ii) the tasks and intentions of the observer. It has often been suggested that eye guidance is mainly controlled by stimulus properties (
Engel, 1977;
Godijn & Theeuwes, 2002;
Itti & Koch, 2000; Kramer, Irwin, Theeuwes, & Hahn, 1999; Parkhurst, Law, & Niebur, 2002; Torralba, Oliva, Castelhano, & Henderson, 2006). Other authors consider saccadic target selection as being predominantly controlled by the task of the observer (
Findlay, 1997;
Williams & Reingold, 2001). Although recent research suggests that a flexible combination of both approaches can account for the guidance of saccades (
Treisman & Sato, 1990;
van Zoest & Donk, 2004) some evidence is provided that task-demands have a higher priority than saliency features (Einhäuser, Rutishauser, & Koch, 2008;
Foulsham & Underwood, 2008;
Tatler, 2007). Similarly to this account, it has been recently demonstrated that also emotional valences predominate over saliency information (
Calvo & Lang, 2004; Nummenmaa, Hyona, & Calvo, 2006).
Calvo and Avero (
2005) compared the gaze based attentional bias on emotional scenes for high and low trait anxiety subjects on a time course of three seconds. Apart from a higher sensitivity for emotional scenes for high anxiety participants, differences in the probability of the first and last fixation were found in relation to the emotional content. Moreover, viewing times varied in connection with the emotional content. However, for the presentation of facial stimuli of different emotional expressions longer fixation durations were found for fear and shorter for disgust (Wong, Cronin-Golomb, & Neargarder, 2005).
Such findings suggest an interaction not only between eye movement behaviour and the emotional content but also in relation to individual differences. However, a systematic investigation of the time course of eye movements for free viewing of emotional scenes is missing, because in the mentioned studies emotional and neutral stimuli were always presented in parallel. Therefore, the present research aims to explore possible influences on fixations and saccades using two different paradigms. On the one hand, the presentation of different emotional pictures will allow examining for influences of the shown stimuli; on the other hand, the induction of different moods would allow for a more direct comparison of individual differences in relation to parameters of eye movements (see for similar proposals
Isaacowitz, 2006;
Wadlinger & Isaacowitz, 2006).
Several studies of scene perception and visual search demonstrate systematic relationships between fixation durations and saccadic amplitudes.
Antes (
1974) was one of the first reporting a variation in fixations and saccades during free picture exploration: fixations became longer whereas saccadic amplitudes decreased over first several seconds of perception. Nearly at the same time, Karpov, Luria and Yarbus (1968) attributed this effect to the initial phase of global spatial orientation in the picture. The time course of visual search tasks was also characterized by the same tendency (Scinto, Pillalamarri, & Karsh, 1986). The findings were explained as a modification of oculomotor behaviour in accordance to the task demands, i.e. an adjustment of the search strategy. Similar results were reported by
Galpin and Underwood (
2005) in a comparative visual search task (A closer analysis of the task (
Pomplun, 1998;
Pomplun et al., 2001; Velichkovsky, Challis, & Pomplun, 1995) reveals up to three distinct phases in relationship between duration of fixation and amplitude of saccades. In particular, fixations are shortest at the beginning of search, intermediate (with a large variation) during the most of the time of a trial and largest at the end, when the solution to the task is about to be reported.). The authors proposed that the initial pattern of short fixations and long saccades simply serves to find an optimal point to start the search. During the inspection of simple scenes containing seven objects for 1, 3, 5, 9 or 15 fixations,
Irwin and Zelinsky (
2002) also noticed a prolongation of fixations but offered no explanation for this finding. Nevertheless, accuracy of reported objects was higher for larger number of fixations, i.e. with increasing inspection time. Differences in the accuracy reports were strongest between conditions with 1 and 9 fixations but also different to 3 and 5 fixation conditions. Findings of this study suggest a pronounced change in the quality of a visual representation between the 1st fixation up to the 9th fixation (= 174 vs. 2810 ms of viewing time). Obviously, eye movement characteristics as well as the quality of visual representation seem to change considerably within the first few seconds of picture perception. This is also illustrated by Tatler, Gilchrist and Rusted (2003) in a study where subjects inspected natural scenes for variable time intervals, ranging from 1 to 10 seconds. Responses to afterward questions related to the gist or to the spatial layout were already correct with only 2 seconds of inspection time whereas information about object identity did not accumulate within this initial period.
The relationship of fixation duration and saccadic amplitudes is of particular interest due to its possible diagnostic value concerning the two major modes of visual processing (
Unema et al., 2005; Velichkovsky, Dornhoefer, Pannasch, & Unema, 2000; Velichkovsky, Joos, Helmert, & Pannasch, 2005; Velichkovsky, Rothert, Kopf, Dornhoefer, & Joos, 2002). Though earlier statements can be found (
Bernstein, 1947), the distinction of two modes of visual processing and their corresponding pathways in the brain came to prominence with a special issue of
Psychologische Forschung in 1967 (Ingle, Schneider, Trevarthen, & Held, 1967). Following this publication a number of dichotomies have been suggested, e.g. ambient-focal (
Trevarthen, 1968), noticing-examining (
Weiskrantz, 1972), spatial-figural (
Breitmeyer & Ganz, 1976) and ambient-foveal (Stone, Dreher, & Leventhal, 1979).
Ungerleider and Mishkin (
1982) later argued that primates vision is dominated by distinct cortical mechanisms, dorsal and ventral pathways. In a revisited form, this idea laid the foundations for the recent model of
Milner and Goodale (
1995), which has been developed partly through studies of patients with local brain lesions (Milner, Dijkerman, McIntosh, Rossetti, & Pisella, 2003;
Milner et al., 1991). This later model emphasizes the sensorimotor character of dorsal stream processing while attributing conscious identification and recognition to functions of ventral visual pathway.
First attempts to relate these distinctions to the major output of visual processing – that is eye movements – seem to be promising (Burr, Morrone, & Ross, 2001;
Velichkovsky et al., 2002). For example, the experiment by Velichkovsky et al. (2005) demonstrated differences in the recognition of visual stimuli, depending on the duration of fixations and the amplitude of adjacent saccades. During scene inspection the position and duration of each fixation was recorded. Subsequently, the fixated positions were shown as cut-outs together with catch trials and subjects had to classify them as seen or not seen. A higher proportion of correct answers was found for relatively long fixations (> 180 ms) with saccadic amplitudes of less than 5 deg than for short fixations with longer saccades. Correctness of responses for the remaining two fixate-saccade instances (long-long and short-short) did not differ from the focal processing group emphasizing that the combination of fixation and saccade parameters distinguishes two modes of processing. Similar results were obtained with recognition of hazardous events in dynamic traffic scenarios (
Velichkovsky et al., 2002). Considering these data with respect to earlier findings (e.g.
Antes, 1974) the combination of short fixations and long saccades during early phases of scene perception could represent the ambient processing mode while the later dominance of longer fixations together with short saccades can be seen as indices of focal processing.
The aim of the present research is to compare durations of fixations and amplitudes of saccades during early and late phases of scene perception. Recent findings suggest systematic variations within both parameters elucidated by common mechanisms (e.g.
Unema et al., 2005). During initial viewing periods the dominance of shorter fixations and larger saccades was explained by a prevalence of visually guided behaviour, serving mainly for the orientation in the environment (
Norman, 2002). Thus, for a fast registration of the spatial layout a combination of superficial processing (i.e. short fixations) and a scanning of large areas (i.e. long saccadic movements) is the most appropriate. Although influences of the amount or valence of information on the length of this initial period can be assumed, it seems that the ambient processing is mostly finished after the first two seconds of scene inspection (
Irwin & Zelinsky, 2002;
Tatler et al., 2003). After the completion of the orienting phase, a more in depth and object centred analysis requires a complete change in the scanning strategy, which should also be found in eye movement behaviour. Recognition and identification of details requires not only an increase in fixation durations but also several fixations within a certain region, i.e. shorter saccadic movements. Within later periods of scene inspection, longer fixations should be measured in comparison to the initial viewing interval. In order to sequentially process features within a particular region, attention needs to remain within a specific area, which should lead to a decrease in saccadic amplitudes.
A series of four experiments was conducted in order to investigate several factors known to be of importance for eye movement parameters. First, the relationship of fixations and saccades was examined across 4 blocks of free viewing. Recently, changes in fixation durations were described in terms of habituation (Graupner, Velichkovsky, Pannasch, & Marx, 2007). The question if the appearance of distinct processing phases varies over time was explored in Experiment 1. Influences of stimulus characteristics (defined by object density) were analysed in Experiment 2 (It should be noted that experiment 2 was a re-analysis of the data of an earlier study presenting a model for the time course of visual information processing (
Unema et al., 2005). We however used a new scheme in analysis of an almost identical set of the data.). Several studies have investigated gaze patterns while looking at emotional pictures (e.g.
Calvo & Lang, 2004;
Nummenmaa et al., 2006) but less is known about relations between mood and eye movement behavior (
Isaacowitz, 2006;
Wadlinger & Isaacowitz, 2006). Effects of pictures showing different emotional contents were analyzed in Experiment 3. The final experiment was concerned with the investigation of mood influences on fixations and saccades using a within-subjects design.
Experiment 2
Method
Subjects
Fifteen healthy females, ranging in age from 18 to 28 years (mean age 22), gave their written informed consent to participate in the experiment. All subjects had normal or corrected to normal vision and received course credit for participation in the study conducted in conformity with the declaration of Helsinki.
Apparatus
Experiment 2 used the same apparatus as described for Experiment 1. Pictures were displayed using a nVidia/TNT2 64 pro graphic chip and a CRT display (17-inch Dell P990) at 1024 by 768 pixels with a refresh rate of 100 Hz. Viewed from a distance of 60 cm, the screen subtended a visual angle of 31° horizontally and 26° vertically.
Stimuli and Design
Stimuli consisted of images of various indoor scenes, created with Data Becker 3D Apartment Design 2000. Forty-eight 1024 x 768 pixel images with a 24 bit color depth were constructed, half of which had an object density of 16 objects, and the other half contained 8 objects. Since the variation of object density was of interest in this study, each background was shown containing 8 and 16 objects. “Objects” were defined as small, movable objects, excluding doors, shelves, floors, windows and the like. “Background-objects” were kept in low saturation colours. The objects were distributed evenly across the whole scene and had a size range of about 1° to 3.5° in either direction.
Procedure
Each subject was informed of the purpose of the study before signing their consent. Recording took place in two sessions, each lasting approximately fifteen minutes. The images were presented for 20 seconds each, after which a statement was presented in a pop-up window. Half of the statements were true, the other half were false. Subjects had to decide about the correctness of the statement. Calibration and recording of eye data was performed according to the guidelines outlined by
Stampe (
1993). The total duration of the experiment, including the preparation for recording and calibration, was approximately one hour per participant.
Data Analysis
To ensure the comparability eye movement data of the current study was pre-processed by the same routines as described for Experiment 1. Detailed information about the full viewing time is reported in Unema et al. (2005).
Results
Correctness of response data was analyzed using repeated measures ANOVA with object number (8 vs. 16) as within-subjects factor and revealed reliable effects, F(1,14) = 6.91, p = .020, η2 = .330. The percentage of correct answers was higher for 8 objects than for 16 objects (78% vs. 72%).
According to the processing routines described in Experiment 1 for the six seconds viewing interval of the current experiment a total of 14253 fixations and saccades remained for statistical testing. Fixation durations and saccadic amplitudes for the designated viewing interval are shown in
Figure 3A, C. An illustration of one image from the 8 objects condition with overlaid eye-tracking data for early and late phases of processing is shown in
Figure 2B.
Median values for fixation durations and saccadic amplitudes were applied into a 2 (object density) x 2 (processing phase) repeated measures MANOVA. Significant multivariate effects were obtained for the main effect of object density, F(2,13) = 11.94, p = .001, η2 = .647, as well as for processing phase, F(2,13) = 35.81, p < .001, η2 = .846. No interaction between both factors was found, F < 1.
Follow-up ANOVAS revealed significant influences of object density on saccadic amplitudes,
F(1,14) = 24.41,
p < .001, η
2 = .636, but not for the duration of fixations,
F < 1. Examination of the means suggests larger saccadic amplitudes for images containing 8 objects than if 16 objects were available for inspection (
Ms = 5.5 vs. 4.7 deg). Both parameters differed between both processing phases, for fixation durations,
F(1,14) = 71.73,
p < .001, η
2 = .837, as well as for saccadic amplitudes,
F(1,14) = 27.85,
p < .001, η
2 = .665, highly significant differences were found. Inspection of the means revealed shorter fixations at the beginning than in the later processing phase (
Ms = 194 vs. 217 ms, see
Figure 3B). For the amplitudes of saccades, the means yielded a decrease from EPP to LPP (
Ms = 5.6 vs. 4.5 deg, see
Figure 3D).
Discussion
In Experiment 2, influences of the presented stimuli were investigated by a systematic variation of the density of shown objects. Performance in the recognition task decreased if a greater amount of information was available, i.e. larger number of objects.
The availability of more information was assumed to prolong the fixation time in order to make the appropriate processing possible (e.g.
Pomplun et al., 2001). Our data did not reveal such a relationship, maybe due to two reasons. Firstly, a short time interval of only six seconds was analyzed for the purpose of this study and influences of different object densities on fixations might be found later in the time course (
Unema et al., 2005). Secondly, no explicit search instruction was given, which maybe contributed to balancing fixation durations for both density conditions (
Pomplun et al., 2001). However, information density as operationalized in the experiment directly influenced the length of saccades. More available objects reduced the distances among them and required an adaptation of the lengths of saccades (e.g.
Hooge & Erkelens, 1996;
von Wartburg et al., 2007).
A similar distinction in eye movement parameters as in Experiment 1 was found for EPP and LPP. In the early phase ambient processing was evidenced by short fixations and long saccades but shifted to more focal characteristics in the late phase expressed by increased fixation durations and decreased saccadic amplitudes. This behaviour was identical for both object numbers for the duration of fixations but for saccades an additional relation to the information density was found. With more objects shown the saccadic amplitude became shorter probably due to the smaller distances between the objects. However, the relative amplitude differences between EPP to LPP were identical for both object conditions. In conclusion, information density operationalized by the number of objects obviously does not influence the occurrence of ambient and focal gaze patterns in the time course of scene perception.
Experiment 3 was designed to examine the time course of eye movements during the inspection of emotional pictures. According to
Wong et al. (
2005) differences for fixation durations are expected in relation to the emotional valence. Hence, it should be analyzed if this also leads to shifts in the alteration of the early and late characteristics of fixations and saccades.
Experiment 3
Method
Subjects
Twenty-two students of the University of Bonn participated in this experiment; 14 males and 8 females ranging in age from 20 to 35 years (mean age 25). Each subject reported normal or corrected to normal vision and received €12 for their participation in the study conducted in conformity with the declaration of Helsinki.
Stimuli and Design
Images consisted of 80 colour pictures taken from the International Affective Picture System (IAPS) (Lang, Bradley, & Cuthbert, 2005). Applying the procedure suggested by
Mikels et al. (
2005) eighty pictures were selected from the categories fear, disgust, neutral and positive (According to their IAPS number, the fear-related pictures were: 1113, 1301, 1930, 1931, 2120, 3022, 3500, 5972, 6211, 6230, 6260, 6300, 6350, 6370, 6540, 6550, 6940, 9600, 9622, 9800; the disgust-related pictures were: 1275, 2352.2, 3030, 3051, 3061, 3080, 3110, 3120, 3140, 3160, 3400, 8230, 9042, 9290, 9300, 9320, 9373, 9405, 9420, 9570; the neutral pictures were: 2880, 5390, 5510, 5520, 5530, 5740, 7010, 7020, 7030, 7050, 7060, 7100, 7140, 7175, 7224, 7234, 7235, 7490, 7491, 7705; and the positive pictures were: 1640, 1720, 1722, 2040, 2209, 2352, 4603, 4641, 5622, 5623, 8033, 8170, 8210, 8250, 8280, 8300, 8340, 8420, 8510, 8531). Each image was assigned to only one of these categories. For the picture selection we considered additionally the 9-point valence and arousal scales provided in the IAPS norms (valence: fear [2.4], disgust [3.0], neutral [5.0], positive [7.1]; arousal: fear [6.4], disgust [5.9], neutral [2.6], positive [5.3]). Moreover, images across the emotional categories were matched for spatial frequency bands (see for details Delplanque, N’Diaye, Scherer, & Grandjean, 2007) and the number of (emotional) objects. With Adobe Photoshop software, the luminance values were adjusted to a mean of 95 for all categories. Picture size was equivalent to 800 x 600 pixels.
Apparatus
Eye movement data were collected using the binocular Eyegaze Analysis System (LC Technologies, VA, USA), with remote binocular sampling rate of 120 Hz and an accuracy of about 0.45°. Fixations and saccades were defined using the fixation detection algorithm supplied by LC Technologies: A fixation onset was identified if 6 successive samples were detected within a range of less than 25 pixels; accordingly the offset was detected if this criterion was not longer valid. Hence the minimum possible fixation duration was 49.8 ms. Images were presented on a 17inch colour monitor with resolution set to 1280 x 1024. Viewed from a distance of 60 cm, the screen subtended a visual angle of 28° horizontally and 21° vertically.
Procedure
Each subject was informed as to the purpose of the research before signing their consent. A calibration of the eye tracking system was performed after giving the introduction. Subjects were told to freely explore the pictures but concentrating on the scene and not looking away. 250 ms before the image onset a white dot appeared for 250 ms at one of 16 possible equally distributed positions on-screen. This procedure was to provoke a saccade around the picture onset and to have the position of the first fixation at different positions on the image. Each stimulus was shown for 7 seconds followed by a black screen with a fixation cross in the centre. The fixation cross stayed on-screen for a variable time period of 5-7 seconds (intervals of 500 ms) and should be fixated until the next trial began. Order of image presentation and the presentation time of the black screen were randomized. Subjects could freely explore the images and were only instructed to look at the images. After the experimental recording subjects had to rate the valence and arousal of the images using the Self-Assessment Manikin (
Bradley & Lang, 1994).
Data Analysis
The same interval of first six seconds of viewing as described in Experiment 1 was examined.
Results
The post hoc-hoc subjective ratings of the subjects were tested against the IAPS norms stated above. Independent t-tests on the valence and arousal values confirmed the emotional categorization by providing no reliable effects, all t’s < 1.
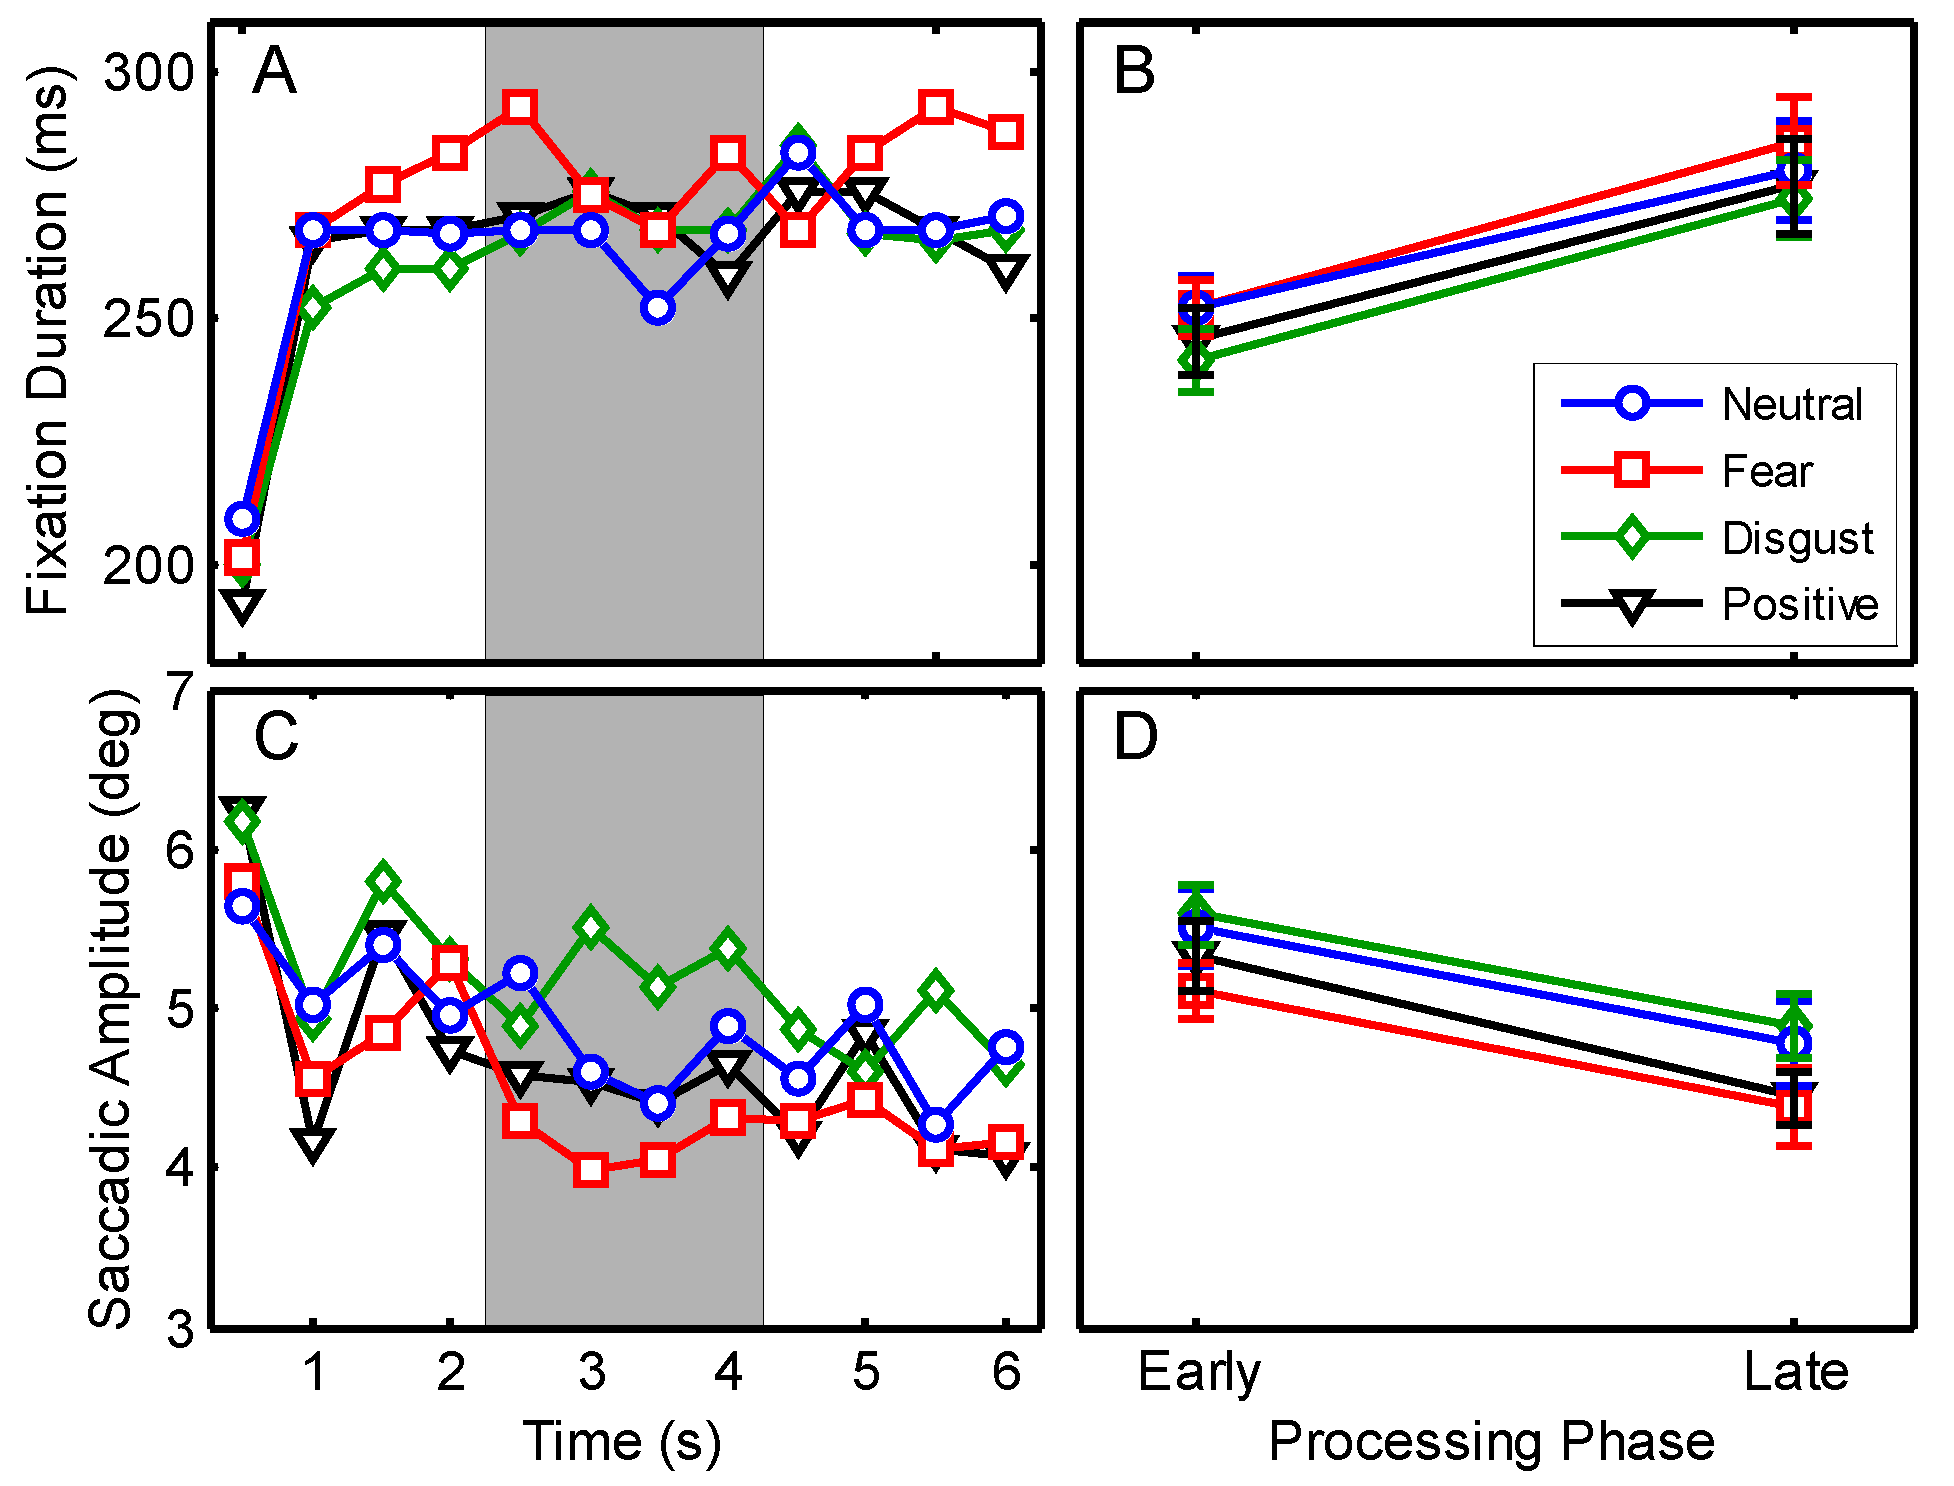
According to the processing routines described in Experiment 1 a total of 28356 fixations and saccades remained for statistical analysis. Fixation durations and saccadic amplitudes for the designated viewing interval are shown in
Figure 4A, C. An illustration of one image from the category fear with overlaid eye-tracking data for early and late phases of processing is shown in
Figure 2C.
A 4 (emotional category) x 2 (processing phase) repeated measures MANOVA was conducted to compare median fixation durations and saccadic amplitudes. Significant multivariate effects were found for the main effects of emotional category, F(6,16) = 4.31, p = .009, η2 = .618, and processing phase, F(2,20) = 47.36, p < .001, η2 = .826. No interaction was obtained between both factors, F < 1. Follow-up ANOVAs confirmed significant differences for the emotional category in the duration of fixations, F(3,63) = 3.33, p = .025, η2 = .137, as well as in the amplitudes of saccades, F(3,63) = 5.34, p = .002, η2 = .203. All pairwise Bonferroni corrected post hoc tests for emotional categories in relation to fixation durations exceeded significance, all ps ≥ .105, due to the conservative correction of the testing. However, for saccadic amplitudes the Bonferroni corrected post hoc testing yielded reliable differences between neutral and fear and between fear and disgust, all ps < .05. Examination of the means revealed that amplitudes were smaller if stimuli belonged to the category fear than for neutral or disgust stimuli (Ms = 4.75 vs. 5.15 and 5.24 deg).
Univariate ANOVAs for processing phase yielded significant differences for fixation durations,
F(1,21) = 53.80,
p < .001, η
2 = .719, and for saccadic amplitudes,
F(1,21) = 27.75,
p < .001, η
2 = .569, with no further interaction. Examination of the means revealed an increase in the duration of fixations from EPP to LPP (
Ms = 247 vs. 279 ms, see
Figure 4B) whereas the saccadic amplitude decreased over time (
Ms = 5.4 vs. 4.6 deg, see
Figure 4D). In contrast to the previous experiments, in this study an additional procedure was included to provoke a saccade whenever a new stimulus was shown (see Procedure). However, in order to test if influences on the relationship between early and late phases can be identified, another 4 (emotional category) x 2 (processing phase) repeated measures MANOVA was applied, excluding data of the first bin (0-500 ms). The results were similar to the original testing; significant effects were obtained for emotional category,
F(6,16) = 5.03,
p = .004, η
2 = .654, and processing phase,
F(2,20) = 13.28,
p < .001, η
2 = .570. No interaction was obtained between both factors,
F < 1. In search for specific influences on the difference between early and late phases, follow-up ANOVAs revealed again significant differences for phase in the duration of fixations,
F(1,21) = 6.38,
p = .020, η
2 = .233, as well as in the amplitudes of saccades,
F(1,21) = 9.33,
p = .006, η
2 = .308.
Discussion
The subjective ratings confirmed the assignment of the used stimuli to the categories fear, disgust, neutral and positive. Among the categories of emotional valences of the images no differences were found in fixation durations but for the amplitudes of saccadic movements. Saccades were shortest for images assessed as fear whereas disgust resulted in largest amplitudes. In contrast to the study by
Wong et al. (
2005), who investigated the relation of visual scanning abilities and emotion identification in normal aging using photographs of human faces with different emotional expressions, no reliable differences were found in fixation durations. Since these authors did not report about saccadic amplitudes, it might be interesting to bring findings of both studies together.
Wong et al. (
2005) found longest fixations for stimuli of fear, the condition, where we obtained the shortest saccades. Moreover, shortest fixations were reported in the category disgust (together with neutral stimuli) for which we obtained the largest saccades. A cautious interpretation of these results would suggest reduced visual exploration for fearful stimuli but expanded scanning (in terms of avoiding tendencies) for stimuli of the category disgust. Considering the results for the distinction of early vs. late processing phases in fixation durations and saccadic amplitudes, the findings are similar as in Experiments 1 and 2. We found an increase in the fixation durations from EPP to LPP together with a decrease for saccadic amplitudes.
Moreover, there are two methodical concerns in relation to this experiment. Another eye-tracking device was used and in contrast to the previous studies a semi-random pre-trial marker was shown which might influence the overall results (see Tatler, 2007 for a discussion of influences of the pre-trial marker). However, a reanalysis of the data excluding the first 500 ms did not reveal any differences. Moreover, results from a study (n = 16) with exactly the same design except for using the EyeLink II system instead of EyeGaze to record eye movements (as in the other experiments) and without pre-trial markers did not remarkably differ from the current observations. In sum, the results suggest that images of different emotional contents influence saccadic amplitudes but ambient and focal characteristics in eye movements for early and late phases are stable across different emotional stimuli.
In the final experiment, the stimuli were kept rather neutral but the sequential behaviour of eye movements was tested in relation to a mood manipulation.
Experiment 4
Method
Subjects
Forty-four students of the Technische Universitaet Dresden participated in this experiment; 7 males and 37 females ranging in age from 18 to 43 years (mean age 22). Each subject reported normal or corrected to normal vision and received either €5 or course credits for their participation in the study conducted in conformity with the declaration of Helsinki.
Stimuli and Design
In this experiment 100 digitalized photographs of landscapes from internet databases
www.confluence.org and
www.webshots.com were used. Photographs were chosen by the following selection criteria: (i) no humans or animals should be visible; (ii) neutral theme and perspective; (iii) no special highlights should be visible (in terms of regions of attention). All images were resized to 1024 x 768 pixels and fitted to 24 bit colour depth (for an example see
Figure 2E).
Additionally, a mood induction procedure (MIP) was executed. Participants were required to write about a personal life event that had either made them feel “happy and positive” or “sad and negative” (
Schwarz & Clore, 1983). In addition to the writing task, a musical MIP was applied in order to intensify the effects and included a selection based on the findings by Västfjäll (2002). Subjects listened Vivaldi “Concerto No. 3 (autumn)”, Yanni “Once Upon a Time” and Mozart “Rondo alla Turca” for the positive MIP and Albinoni „Adagio“for the negative MIP. Participants were naive as to the purpose of the mood induction procedure, a cover story was provided about analyzing the relationship between music and autobiographic memory. The total duration of the MIP was about 10 minutes.
A mood questionnaire consisting of 9 items was applied at two times during the experiment, where participants were asked to rate their happiness, sadness and attention, (
Siemer, 2001). Ratings of happiness, sadness and vigilance were measured based on 3 items for each factor, on a scale ranging from 0 (
not at all) to 100 (
very).
Apparatus
Apparatus used in Experiment 4 were as described in Experiment 1. For the musical MIP, pieces of music were played using a Sony Discman (D-NE300) and presented binaurally via insert earphones (EartoneTM 3A).
Procedure
Each subject was informed as to the purpose of the research before signing their consent. Volunteers were told that they were going to participate in two separate experiments; within the first eye movements are analyzed during perception of natural scenes and the second investigates relationships between music and autobiographic memory. At the beginning, subjects had to complete the questionnaire. The first experiment started with the presentation of 50 photographs, each shown for seven seconds. Calibration and recording of eye data was performed according to the guidelines outlined by
Stampe (
1993). A drift correction was obtained after every fifth photograph. Subjects could freely explore the presented images without any special instruction. During the presentation of the fiftieth image, a computer crash was simulated. The experimenter feigned surprise, exclaimed that “this is an already known software problem” and stated that participant should continue with the second experiment until the problem will be fixed. For this experiment, participants had to move to another table in the same room and were randomly assigned to either positive or negative mood induction procedure. After 10 min, the experimenter stopped the participants and they had to fill out the questionnaire for the second time. Afterwards the participants were told that they were going to complete the first experiment by viewing the remaining 50 photographs.
Following testing, the true purpose of the mood induction procedure was disclosed and participants were informed of their right to withdraw their data from the study. All participants agreed to be included in the study.
Data Analysis
The same interval of first six seconds of viewing as described in Experiment 1 was examined.
Results
Effectiveness of mood manipulation was tested by 3 single repeated measures ANOVAs (happiness, sadness and attention) separately for both groups (positive vs. negative) with the time (before vs. after) as within subject factor. Participants in the positive group described themselves as happier (Ms = 60.61 vs. 71.67), F(1,21) = 14.10, p = .001, η2 = .402, and less sad (Ms = 16.36 vs. 9.24), F(1,21) = 5.90, p = .028, η2 = .211, after the mood induction. Participants in the sad group felt less happy (Ms = 62.58 vs. 38.64), F(1,21) = 27.35, p < .001, η2 = .566, and more negative after writing about a sad event while listening sad music (Ms = 20.76 vs. 51.06), F(1,21) = 35.10, p < .001, η2 = .626. For the happy group vigilance did not differ before and after the manipulation, F < 1, but for sad mood induction a significant decrease was obtained (Ms = 61.67 vs. 53.33), F(1,21) = 12.26, p = .002, η2 = .369.
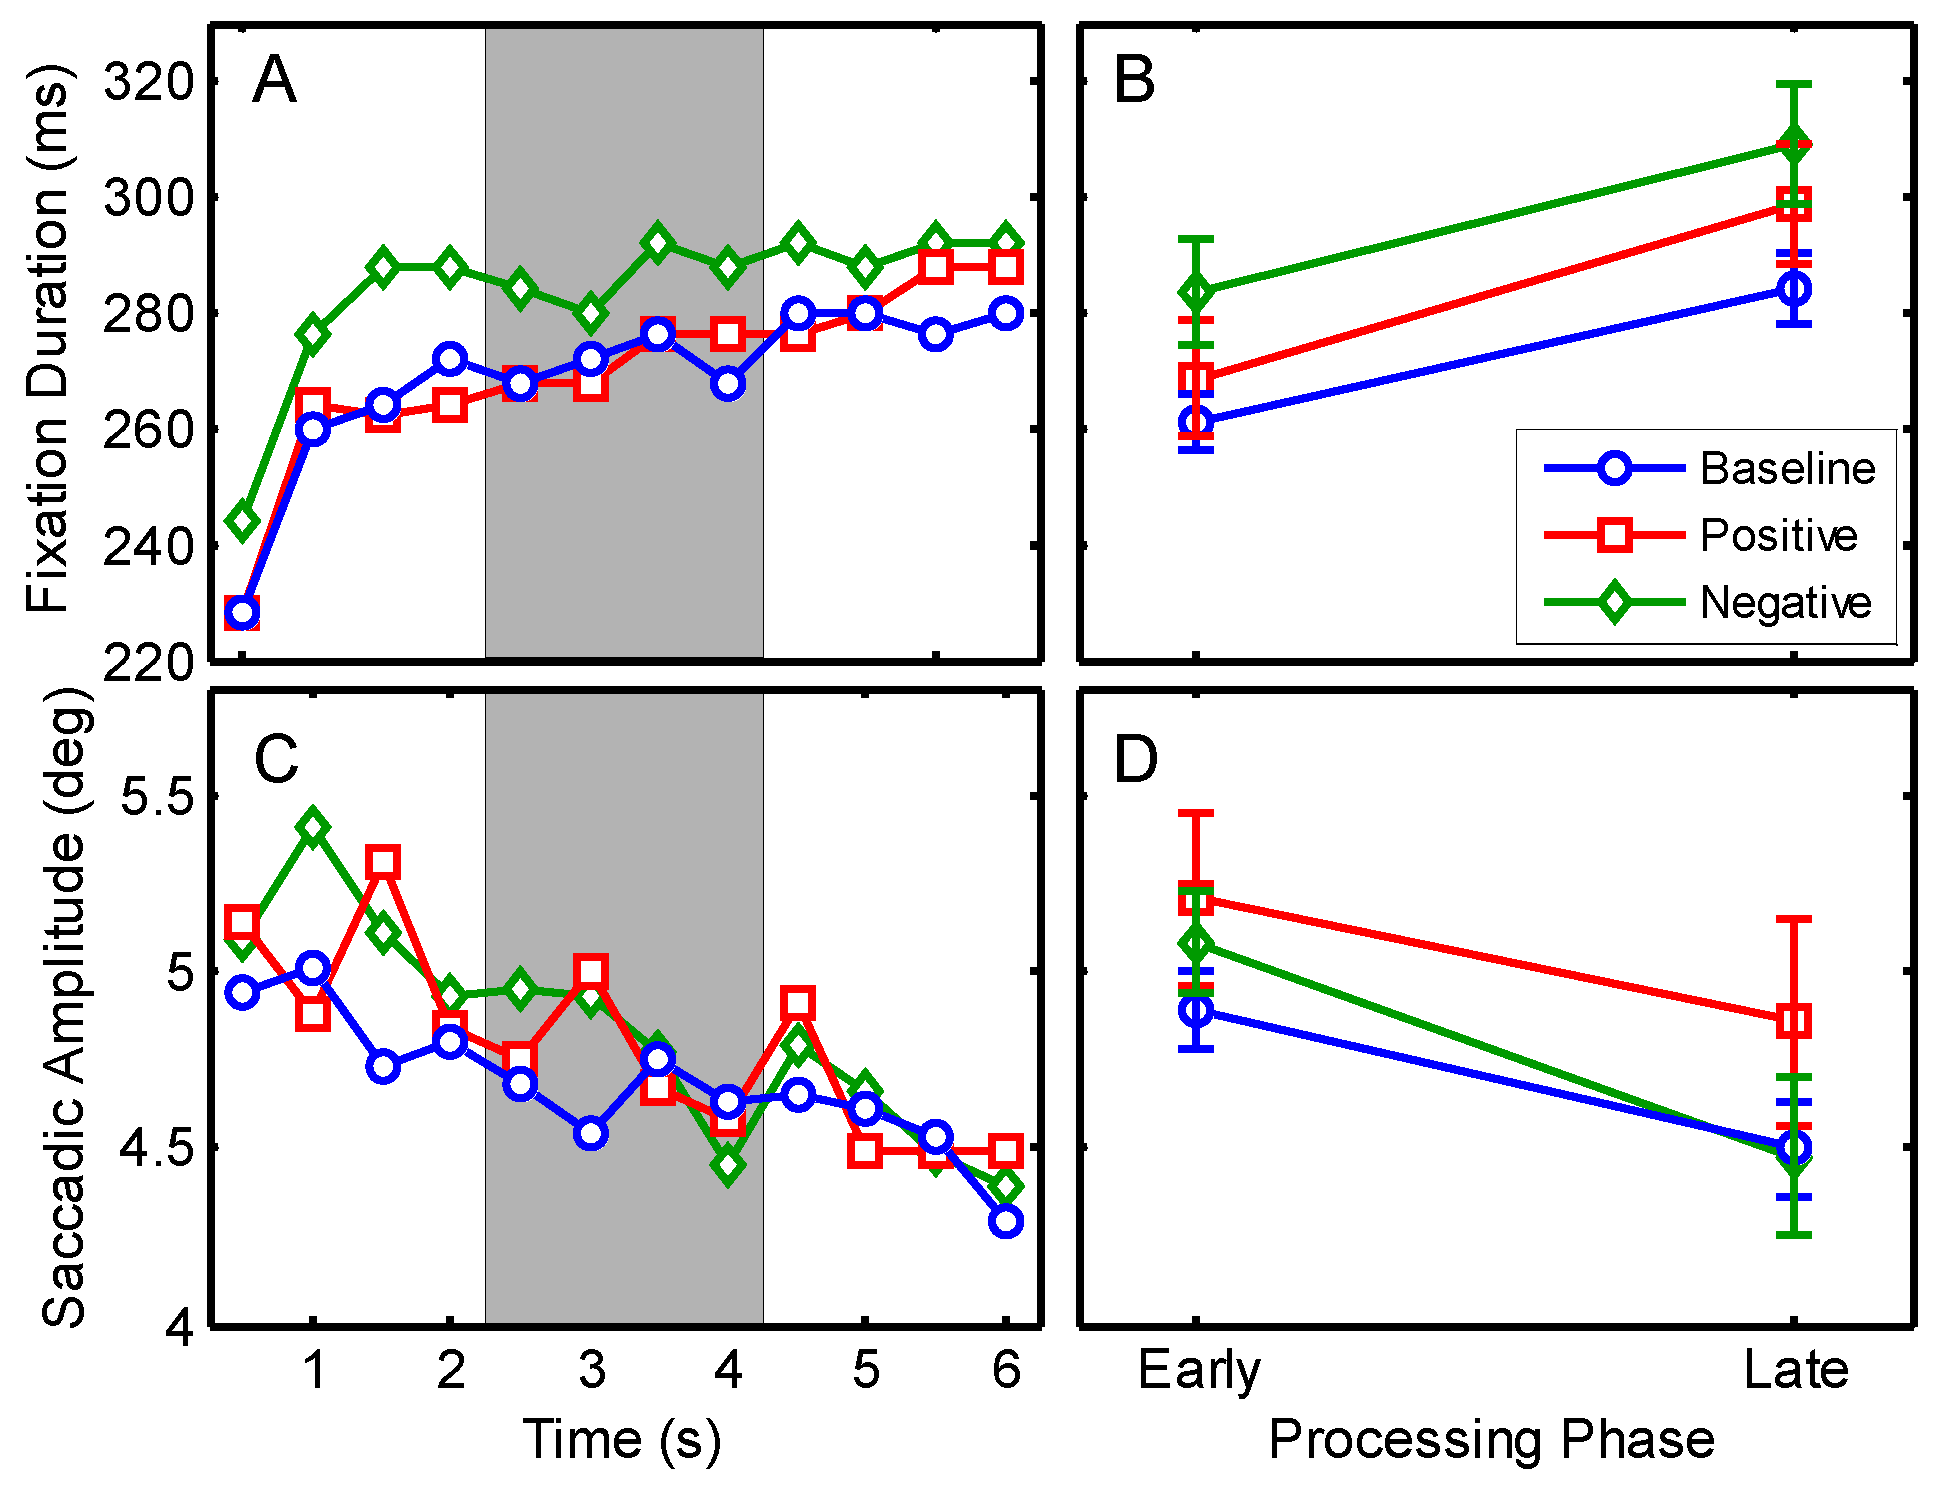
According to the processing routines described in Experiment 1 a total of 58597 fixations and saccades remained for statistical analysis. Fixation durations and saccadic amplitudes for the six seconds viewing interval are shown in
Figure 5A, C. An illustration of one exemplary trial from the negative group after the MIP with overlaid eye-tracking data for early and late phases of processing is shown in
Figure 2D.
In order to investigate the relation between changes in mood and eye movement characteristics, median values of fixations and saccades of the positive and the negative group before the MIP were compared by two paired t-tests. No differences between the groups were obtained, neither for fixation durations, t(21) = 0.50, p = .622, nor for saccadic amplitudes, t(21) = 1.33, p = .198. For the purpose of facilitating statistical analyses data of both groups before the MIP were merged to one baseline condition.
A 3 (mood) x 2 (processing phase) repeated measures MANOVA was conducted to compare median fixation durations and saccadic amplitudes. Significant multivariate effects were found for the main effects of mood, F(4,18) = 4.68, p = .009, η2 = .510, and processing phase, F(2,20) = 38.55, p < .001, η2 = .794. No interaction was obtained between both factors, F(4,18) = 1.57, p = .226,. Follow-up ANOVAs did not confirm significant differences for mood, neither for fixation durations, F(2,42) = 2.62, p = .112, ε = .609, nor for saccade amplitudes, F(2,42) = 1.10, p = .325, ε = .708, due to the Greenhouse-Geisser corrected level of significance.
Univariate ANOVAs for processing phase yielded significant differences for fixation durations,
F(1,21) = 71.56,
p < .001, η
2 = .773, and for saccadic amplitudes,
F(1,21) = 24.60,
p < .001, η
2 = .539, with no further interaction. Examination of the means revealed an increase in the duration of fixations from EPP to LPP (
Ms = 271 vs. 297 ms, see
Figure 5B) whereas the saccadic amplitude decreased over time (
Ms = 5.1 vs. 4.6 deg, see
Figure 5D).
Discussion
In the final experiment, eye movement behaviour was examined in relation to the induction of positive and negative mood. Only very few studies have been addressing this issue so far (e.g.
Isaacowitz, 2005;
Wadlinger & Isaacowitz, 2006). In the experiment, participants’ eye movements were recorded before and after a MIP in order to allow for a direct within group comparison. The subjective mood ratings confirmed that the MIP was adequate in producing a short-term mood change. Multivariate analysis revealed an influence of the factor mood on fixations and saccades but this effect could not be approved with univariate testing on single parameters. One possible reason for this discrepancy could be that individual variances in fixations and saccades are too large and thus override the smaller effect of mood. Maybe a larger sample size (
n = 22 per group in the current experiment) would allow to find reliable effects of mood. Although it is known that the lifetime of a MIP ranges between 5-40 minutes (
Västfjäll, 2002) it might be that the manipulated mood gradually faded away during the recording session. To test this assumption, another mood rating at the end of the experiment would have been required but was not administered.
However, the main interest in Experiment 4 was again the time course in relation to fixations and saccades. For both experimental conditions as well as for the baseline the same characteristics as in the previous experiments were obtained. During the initial viewing period, shorter fixations and larger saccades were registered, which can be interpreted as indication of the ambient processing stage. The late interval revealed clearly the opposite data; fixations of longer durations were measured together with saccades of short amplitudes.
Also in the final experiment, comparing early and late phases of scene inspection revealed a remarkable increase in the duration of fixations whereas the amplitudes of saccades decreased over time. This behaviour was again found to be very stable and no influence of the mood manipulation could be proved out of this experiment. The results demonstrate again that processing in scene perception can be described by at least the two described phases. In conclusion, the manipulation of mood, regardless if positive or negative, has no substantial influence on the characteristics of both gaze parameters in early and late processing phases.
General Discussion
The present research investigated sequences of eye movements during different natural viewing conditions across a period of six seconds. In particular, fixation durations and saccadic amplitudes were examined within the initial interval of two seconds of visual exploration and compared with the final two seconds period of the whole time course. The main finding of the present research is a confirmation of a particular behaviour of fixation durations and saccadic amplitudes within these two phases. Fixations are shorter at the beginning and becoming longer with increasing inspection time, whereas saccades decreased from the initial to the later phase (
cf. Antes, 1974). The particular combination of fixations and saccades within both phases was mentioned earlier and related to the two visual systems approach (
Unema et al., 2005;
Velichkovsky et al., 2005;
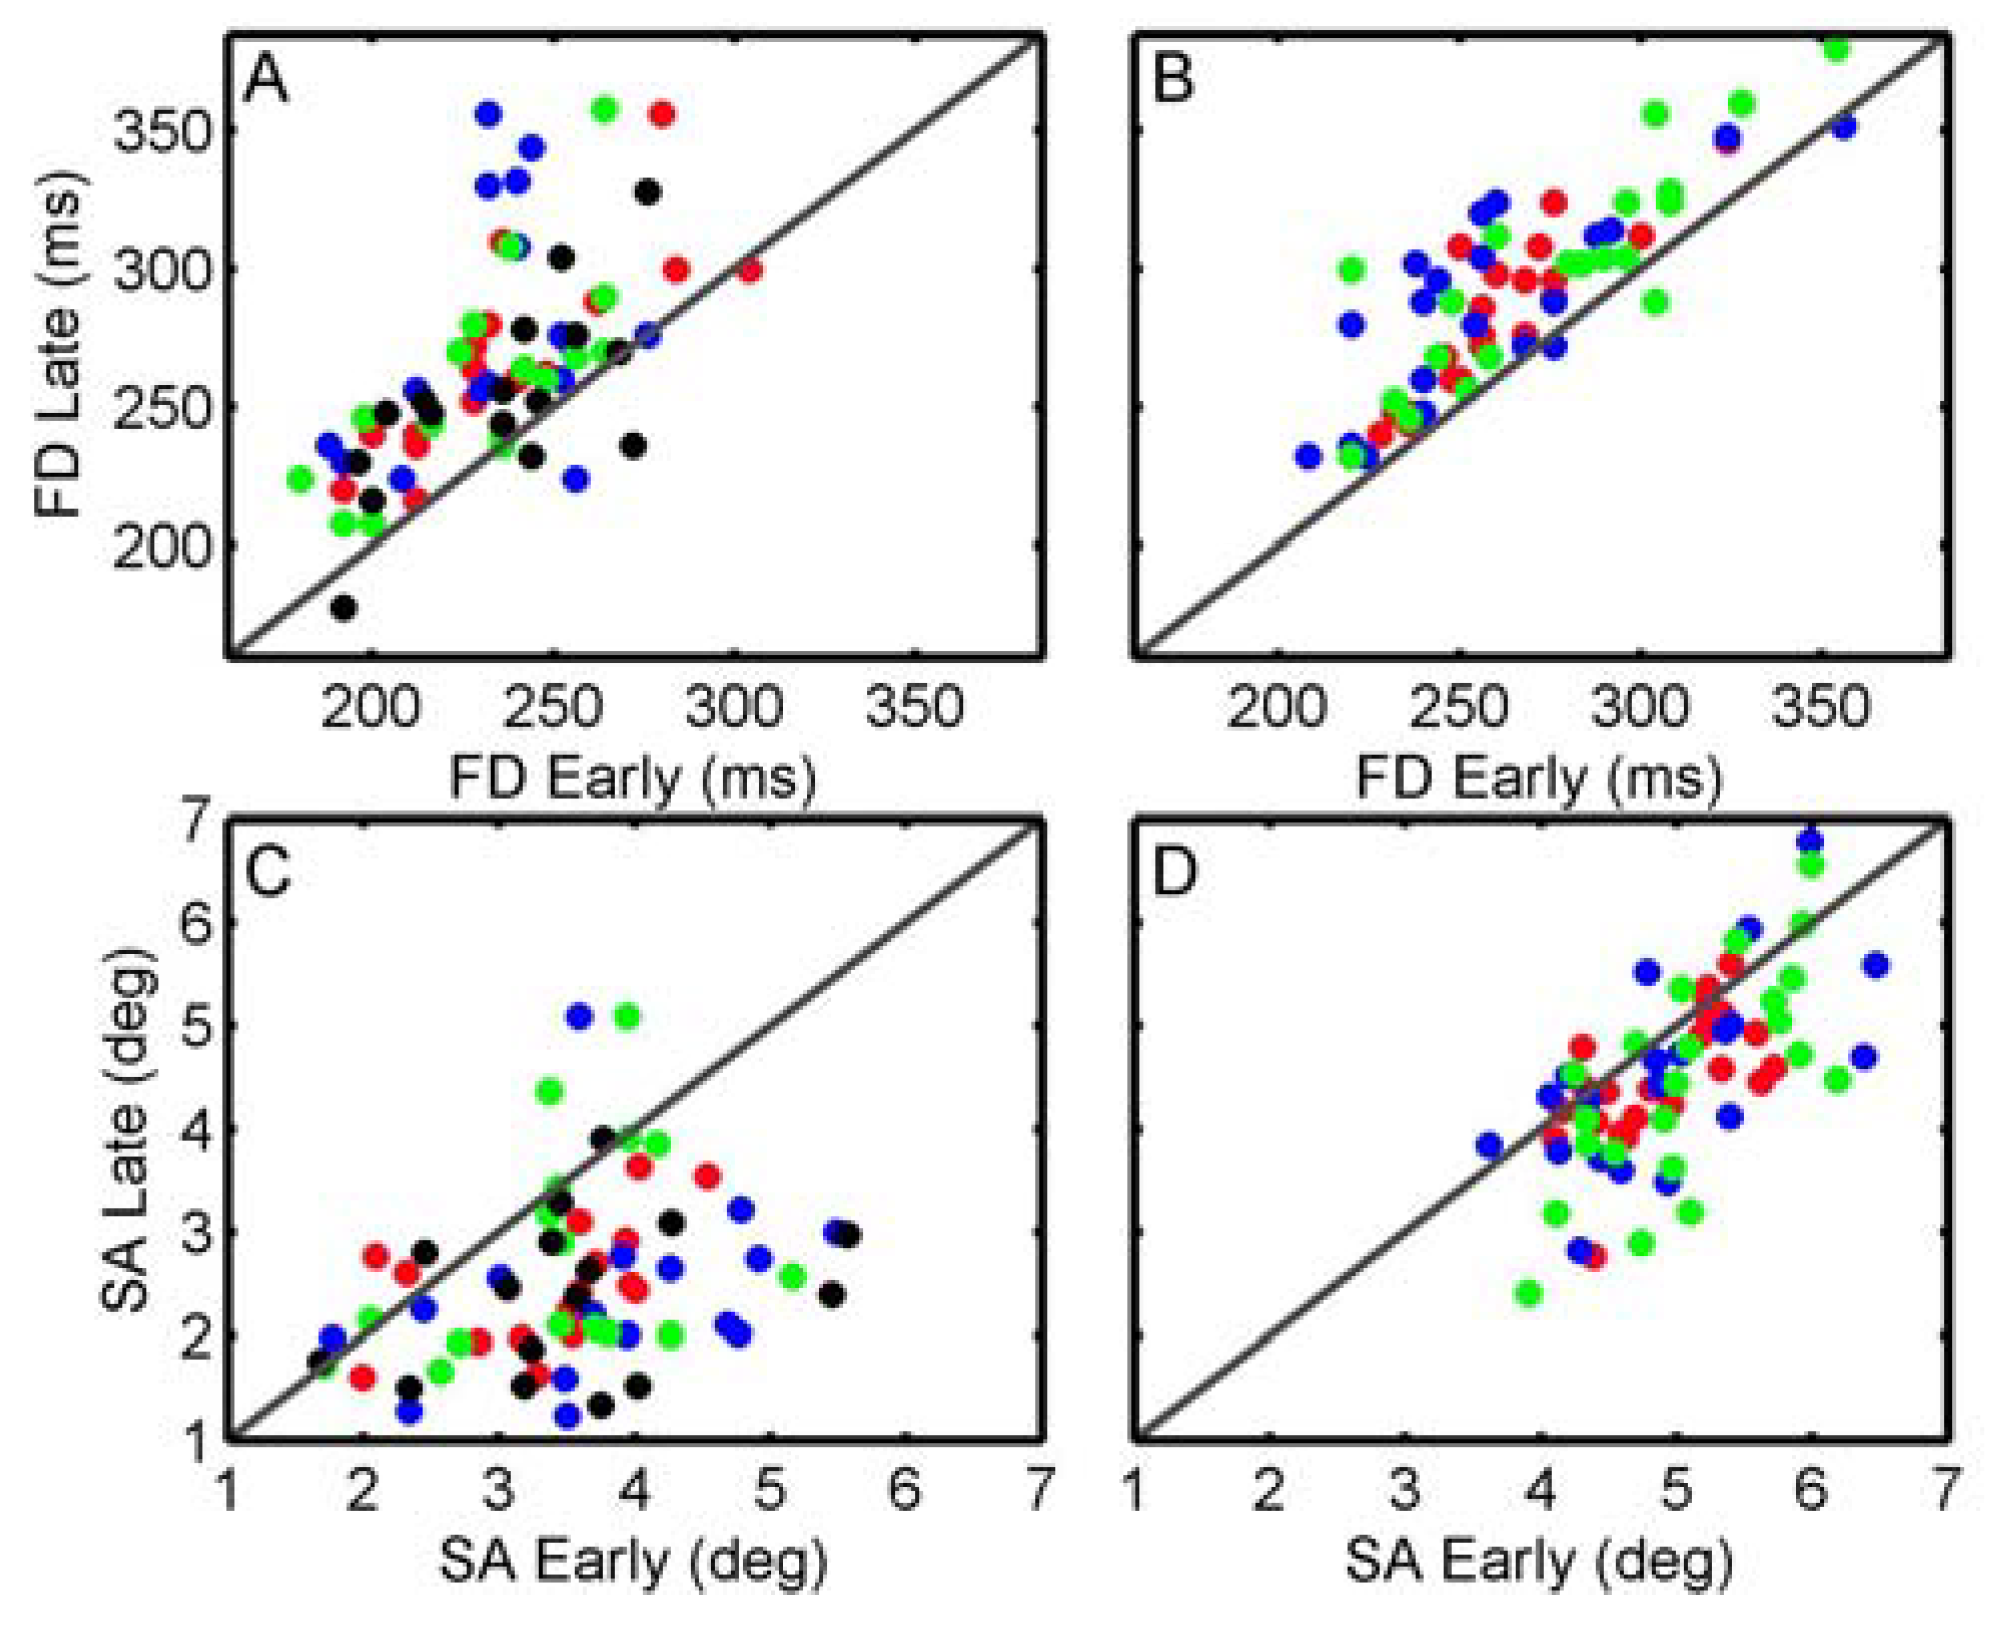
Velichkovsky et al., 2002). Accordingly, eye movement behaviour during the initial period can be classified as ambient whereas the late phases are characterized by a dominance of focal processing expressed by longer fixations and shorter saccades. In the present experiments, factors that are known to influence fixations and saccades (e.g. object density and emotional pictures) were investigated but the characteristics across the inspection time, i.e. increase in fixation durations and decrease in saccadic amplitudes were found to be robust. Considering the total variation of both parameters across the different experiments, the omnipresent differences between early and late phases suggest that the found relationship is a fundamental phenomenon. Moreover, an exemplary examination of the inter-subject variability for the first and the last experiment was applied. Therefore fixation durations (as well as saccade amplitudes) of early vs. late phases for each subject were plotted against each other (see
Figure 6). If the early late distinction would produce also stable effects at the individual level, we should find fixations above the diagonal whereas saccades should be below the diagonal. With only few exceptions, the majority of cases corresponds to the overall results.
While earlier work was rather focused on the examination of the recognition performance (
Velichkovsky et al., 2005) the aim for the current experiments was to test the temporal appearance of both processing modes. According to previous reports, with the onset of a visual scene indications of rather ambient processing are expected (
Antes, 1974;
Galpin & Underwood, 2005;
Scinto et al., 1986). In static scenes the following detailed analysis of objects requires shifting to the focal mode. The results of the presented studies in general confirm this hypothesis.
However, although the results of the four studies agree with the idea that eye movement behaviour reflects the processing at different levels the current work should mainly be seen as another important step in the better understanding of the mechanisms that control for the temporal sequence of eye movements. As recently stated by Hedgé “Although we know that salient image locations tend to elicit eye movements to them, the temporal sequence of eye movements is largely unpredictable” (
Hegdé, 2008, p. 432). Albeit the current research provides promising results, the character of the described analyses is rather of descriptive nature. Even if the appearance of particular eye movement strategies can be assigned to certain periods in the time course, further evidence is needed to strengthen the association between the eye movement patterns and particular processing levels. A first indication was already reported, showing better recognition scores being associated with focal eye movement patterns (
Velichkovsky et al., 2005). However, this was irrespective of the time course of scene perception, whereas the current results clearly suggest a strict time regime for the interplay of both modes.
As demonstrated by
Tatler et al. (
2003), there are considerable differences in the representation of an inspected scene across the viewing time. Hence, future research should explore the advantage of the performance associated to either of the both modes (
see Milner & Goodale, 2008;
Norman, 2002), especially in consideration of the time course as demonstrated here. Moreover, it would be interesting to see how the current findings could be integrated into approaches on the placement of fixations and influences of saliency (e.g.
Foulsham & Underwood, 2008). For instance, it could be assumed that saliency is of greater importance during ambient (i.e. more “bottom-up”) processing than it is for the focal mode (
Einhäuser et al., 2008). Furthermore, the synthesis of two parameters should result in an outcome of four possible combinations, but only two of them are considered here. A better understanding of these mechanisms therefore will require the inclusion of the remaining categories, namely short fixations and saccades as well as long fixations and saccades.
Another point of interest would be a more in depth analysis of the combining mechanisms. In a very recent report by
Henderson and Pierce (
2008) two distinct categories of fixations were suggested, a finding that could be nicely integrated into the two visual systems approach. Fixations that are under direct control of the current available information would be assumed to belong to the focal processing mode. The second type of fixations that was identified by the authors could fit more into the concept of ambient processing, since no direct influences of the particular visual information were found. However, it can only be speculated but it would be interesting to see if the consideration of the amplitudes of saccades can contribute to further clarification of this issue. Similarly, the investigation of simultaneously presented distractors could provide further insights into the dynamic balance of both processing modes (e.g.
Graupner et al., 2007; Pannasch, Dornhoefer, Unema, & Velichkovsky, 2001).
For the first time, the interplay of fixation durations and saccadic amplitudes was systematically investigated distinguishing between early and late processing phases in free viewing conditions. While participants viewed naturalistic stimuli (e.g. paintings, photographs) we examined long term characteristics, object density, instruction, emotional content and mood manipulation in relation to their influences on eye movement behaviour. The results discussed here suggest that the inspection of naturalistic material will always lead to the pronounced temporal gaze behaviour. However, it remains open if the interplay of both assumed systems can also be found for the inspection of artificial or abstract stimuli (
Hegdé, 2008). If the first two seconds mainly serve the organization of the spatial layout of a visual scene then the absence of such a layout should have clear affects on the discussed characteristics. In addition, it needs to be clarified how shifts between ambient and focal processing modes are provoked. In the current research the presentation of a new stimulus was considered as the onset of a new environment evoking processing at the ambient level. First indications of a dynamic balance between both systems were reported by Velichkovsky et al. (2002) analyzing hazard perception in a dynamic environment. However, it remains open for further research how these temporal characteristics and the grade of transition from one system to the other is achieved.
The current research provides not only further evidence that a relative dominance of one of the two visual systems is manifested in eye movement behaviour; activity of both systems seems to follow a strict time course following the inspection of an image. Recognizing whether the environment is being processed in rather ambient or focal mode based on eye movement parameters opens new perspectives for the investigation of visual system but also for new applications such as attention-sensitive interfaces (e.g.
Velichkovsky et al., 2002). Future work based on combined measurements of eye movements and neurophysiological data will help to specify in a more direct way the different modes of visual information processing.