
Exposure to Polybrominated Diphenyl Ethers and Phthalates in China: A Disease Burden and Cost Analysis


1
Key Lab of Health Technology Assessment, National Health Commission of the People’s Republic of China (Fudan University), Shanghai 200032, China
2
Key Laboratory of Public Health Safety, Ministry of Educational, School of Public Health, Fudan University, Shanghai 200032, China
*
Author to whom correspondence should be addressed.
Toxics 2022, 10(12), 766; https://doi.org/10.3390/toxics10120766
Submission received: 20 October 2022
/
Revised: 2 December 2022
/
Accepted: 6 December 2022
/
Published: 8 December 2022
(This article belongs to the Section Exposome Analysis and Risk Assessment)
Abstract
:Increasing evidence indicates that endocrine-disrupting chemicals (EDCs) cause a variety of adverse health outcomes and contribute to substantial disease burden. This study summarized the exposure status of polybrominated diphenyl ethers (PBDEs) and phthalates (PAEs) in China and evaluated the disease burden attributable to PBDEs and PAEs in 2015. The results showed that PBDE and PAE concentrations were higher in coastal areas. The disease burden attributable to PBDEs was 0.77 million cases, and the economic costs were CNY 18.92 billion. Meanwhile, 3.02 million individuals suffered from diseases attributable to PAEs, and the economic costs were CNY 49.20 billion. The economic burden caused by PBDEs and PAEs accounted for 0.28% and 0.72% of China’s Gross Domestic Product (GDP) in 2015, respectively. When comparing China’s results from 2010, it was determined that the GDP ratio of economic costs caused by PAEs in 2015 (0.72%) was lower than in 2010 (1.42%). Finally, compared with the results of the European Union and North America, the GDP ratios of economic costs caused by PAEs in 2015 were 0.19% in Canada (lower than China), 0.29% in the United States (lower than China), and 1.44% in the European Union (higher than China). This study provides important reference values for China’s health governance, and further research should be conducted in the future.

1. Introduction
Endocrine-disrupting chemicals (EDCs), known as environmental hormones, cause health effects on individuals or groups, mainly by interfering with endocrine functions. Examples of EDCs include pesticides, industrial compounds, and heavy metals [1]. Progressively more research has found that EDCs are associated with a variety of adverse health outcomes [2], such as intellectual disability, breast cancer, obesity, and diabetes [3]. In the past two decades, China has introduced numerous policies and regulations on the prevention and control of EDCs and made progress on researching, monitoring, and limiting the use of EDCs [4]. However, currently there is still insufficient understanding of the risks of EDCs. In the Global Burden of Disease Study (GBD), the only focus has been on the burden of disease attributable to lead exposure, while the adverse consequences of exposure to other EDCs have not been assessed [5].
Since the adverse effects of EDCs in humans were first identified [6], increasing evidence has supported the presumption that EDC exposure is associated with substantial disease burden. For example, several studies have reported the substantial burden of disease and economic costs due to EDC exposure in the European Union (EU). In 2014, the Health and Environment Alliance (HEAL) completed the first study on the economic costs of EDC exposure; it showed that the economic losses caused by EDCs were EUR 13–20 billion [7]. Trasande et al. reported that the economic costs attributable to EDCs in the EU in 2010 were EUR 157 billion, accounting for 1.28% of the Gross Domestic Product (GDP) that year [8]. Another study conducted in the United States (US) found that the economic costs of EDC exposure were 2.33% of GDP in 2010, much higher than they were in Europe [9]. A recent study found that the economic costs of EDC exposure in the general population in Canada were CAD 24.6 billion, much lower than those in the US (USD 340 billion) and the EU (USD 217 billion) [10]. Nevertheless, EDC exposure still causes a significant disease burden in Canada, accounting for 1.25% of Canada’s GDP [10]. China has become the world’s largest consumer of synthetic chemicals, including phthalates (PAEs) and polybrominated diphenyl ethers (PBDEs), which are widely used in industrial production [11,12] and commonly detected in the environment [13,14,15]. PAE and PBDE exposure have become a growing concern. In 2010, a study conducted by Peking University assessed the burden of disease and the economic costs attributable to PAEs among the general Chinese population [16]. After the Taiwan plasticizer incident in 2011, the use of PAEs was gradually restricted. Recently, the World Health Organization (WHO) reported that PBDEs in e-waste could affect thyroid function and impair children’s cognitive development [17], but there is still a lack of research on the disease burden caused by PBDE exposure in China. Meanwhile, with the increasing number of studies, the data conditions for assessing the disease burden caused by PBDE exposure are now available in China. This research ultimately focused on PBDEs and PAEs.
In this disease burden analysis, we assessed the burden of disease attributable to PBDEs in the general Chinese population, filling a gap in the results of related studies. Then, in light of the Taiwan plasticizer incident, this study assessed the disease burden attributable to PAEs in the general Chinese population in 2015 and compared the results with different years and other countries. Finally, this study compared the disease burden between PBDEs and PAEs and provided evidence for the prevention of priority pollutants.
2. Materials and Methods
2.1. Exposure Assessment
In this part of the study, we compiled and summarized the literature related to PBDE and PAE levels in different human tissues and fluids, including serum, cord blood, and breast milk. The literature was searched and classified through the China National Knowledge Infrastructure (CNKI, the largest Chinese database in the world), WAN-FANG DATA (a Chinese professional academic database named after CNKI), PubMed, and Web of Science between 2010 and 2020. Ultimately, 13 articles related to PBDE concentrations (Table S1) and 14 articles related to PAE concentrations (Table S2) were included in this study, and the relevant results were analyzed using ArcGIS 10.2 software.
2.2. Study Design
This study was designed to investigate the EDC-attributable disease burden in China. The epidemiological and toxicological evidence supported 6 exposure–response relationships between EDCs and various diseases. The EDCs evaluated were PBDEs and PAEs, and the categories for health outcomes were intellectual disability, breast cancer, thyroid cancer, adult diabetes, adult obesity, and male infertility [8,18,19,20,21,22].
We applied a model first used by the Institute of Medicine, which remains widely used to this day and is presented in Equations (1) and (2), to estimate the disease burden and costs attributable to EDC exposure [23]:
Attributable disease burden = disease rate × attributable fraction × population size
Attributable cost = disease rate × attributable fraction × population × cost per case
An attributable fraction (AF) refers to the “proportional reduction in average disease risk over a specified time interval that would be achieved by eliminating the exposure(s) of interest from the population while distribution of other risk factors in the population remained unchanged [24]” and can be estimated by the following equation:
Note: The AF is determined using (i) the prevalence of exposure (Pe), i.e., the exposed proportion of the entire population, and (ii) relative risk (RR), or conversion from the corresponding odds ratio (OR) obtained from epidemiological studies [23].
2.3. Data Collection
Data for the AFs of the target diseases caused by PBDEs were calculated using Equation 3 (Table S3), and the AFs of the target diseases caused by PAEs were calculated by Peking University in 2010 (Table S4) [16]. This assessment was based on the premise that the PAE levels and OR values for the target diseases were comparable between the general Chinese and European populations (Tables S5–S7), and the AFs of the general Chinese population in 2015 were comparable to those of the general Chinese population in 2010 (Table S8). The Pe of PBDEs, the OR values of the target diseases caused by PBDEs, and the prevalence rates of the target diseases were obtained through meta-analysis (if only one study was available, the present study used its research data directly). The literature was searched and classified through CNKI, WAN-FANG DATA, PubMed, and Web of Science, and the PRISMA guidelines were followed. Figures S1 and S2 depict the specific literature retrieval process. Pe could not be obtained directly from the literature, so we included 11 papers about PBDEs’ detection rate and used the meta-analysis results for detection rate to estimate Pe (Table S9). The ORs for thyroid cancer and breast cancer were derived from relevant studies in China [18,21,22]. For intellectual disability, due to a lack of corresponding data in China, data from Europe and the US at the same exposure levels were used for estimation [19,20]. The literature on the prevalence rate of the target diseases is detailed in Tables S10–S15. It should be noted that the prevalence rate is somewhat time-dependent, so this study collected the literature about prevalence rates between 2011 and 2020 to ensure that the derived prevalence rate was representative of the situation around 2015. A uniformly designed Excel form was used for data extraction, and the extracted content contained basic information from the literature. A meta-analysis was performed using the meta package (R3.6.2). Heterogeneity testing revealed that the detection rate for PBDEs, the ORs of the target diseases caused by PBDEs, and the prevalence rates of the target diseases in different studies were heterogeneous, so a random effects model was used to combine them in the meta-analysis (p < 0.05).
2.4. Estimates of Economic Costs
The economic costs for each disease were calculated by applying a cost-of-illness approach to direct costs, indirect costs, and intangible costs. The cost per case was summarized and combined using the meta-analysis (Figure S3, Tables S16–S19). Given that the estimates spanned more than a decade from 2006 to 2019, in order to make these results comparable, the Consumer Price Index (CPI) was used to uniformly adjust them to 2015 prices (data from China’s National Bureau of Statistics). Figure S4 shows the data input/output process.
2.5. Statistical Analysis
ArcGIS 10.2 was used to assess the spatial and temporal distribution of PBDE and PAE exposure in the general population of China, and R3.6.2 was used to conduct the meta-analysis.
3. Results
3.1. Spatial and Temproal Distribution of PBDE and PAE Levels in the General Chinese Population
The results showed that studies on PBDE levels were mainly concentrated in the coastal areas and a few inland areas of China (Figure 1A). People in the Guangxi, Guangdong, Shandong, and Zhejiang provinces of China were exposed to higher PBDE concentrations than elsewhere. The total concentrations of PBDEs in the serum of Laizhou Bay residents in Shandong Province were the highest, reaching 64.5 ng/g lipid, and the average concentration of PBDEs in the breast milk of lactating women in Beijing was 3.24 ng/g lipid.
Similarly, China’s PAE-related exposure assessment studies were mostly concentrated in the eastern region (Figure 1B). Among them, the Northeast, Jiangsu Province, Zhejiang Province, and the Pearl River Delta region had higher PAE concentrations. The average concentrations of PAEs in the urine of the general population in Guangdong Province were as high as 552 μg/L.
3.2. Attributable Disease Burden Caused by PBDEs and PAEs in China
Table 1 shows the estimated disease burden caused by PBDEs and PAEs in the general Chinese population in 2015. The number of PBDE-related disease cases was 0.77 million, with thyroid cancer having the highest number of cases among the three PBDE-related target diseases.
In 2015, 3.02 million individuals suffered from PAE-related diseases; the highest number of cases was male infertility, followed by diabetes and adult obesity.
3.3. Estimate of Costs for Disorders Associated with PBDE and PAE Exposure in China
Table 2 shows the economic costs of the target diseases attributable to PBDEs and PAEs. The economic costs of thyroid cancer associated with PBDEs were CNY 15.38 billion, while PBDE-related breast cancer resulted in economic losses of CNY 3.23 billion. The economic costs of intellectual disability were the lowest among the three PBDE target diseases at approximately CNY 310 million. Overall, the total economic costs were about CNY 18.92 billion. The economic burden caused by PBDEs accounted for 0.28% of GDP in 2015.
In 2015, the health costs of the target diseases caused by PAEs were CNY 49.20 billion. The economic costs of male infertility were CNY 31.46 billion, while the economic costs of diabetes were CNY 16.01 billion, and those of adult obesity were CNY 1.73 billion. The economic burden of diseases attributable to PAEs as a share of GDP was 0.72%.
3.4. Comparison of Disease Burden Attributable to PAEs between Different Years
In this study, the results of the evaluations in 2010 and 2015 were compared, mainly through case numbers, economic costs, and GDP ratios (Table 3). First, the number of disease cases caused by PAEs was 2.54 million in 2010, which was less than the number of disease cases (3.02 million) determined by this study (2015). As for economic costs, the evaluation results in 2010 showed that the economic losses caused by PAE exposure were CNY 57.20 billion, which were higher than those found in this study (CNY 49.20 billion). Finally, the total economic costs attributable to PAEs accounted for 0.72% of GDP in 2015, which was lower than it was in 2010 (1.42%).
3.5. Comparison of Attributable Disease Burdens between Different Countries
In order to compare the disease burden between different countries, this study calculated the economic costs of EDC exposure as a share of GDP, which was a reasonable approach for comparing the impact of disease burden on the national economies of different countries without having to account for currency exchange rates. For intellectual disability attributable to PBDEs, the number of disease cases was similar between China and the US, but far higher than the number of cases in the EU and Canada. China’s economic costs in terms of impact on GDP were far lower than the economic costs in the US, the EU, and Canada (Table 4).
As for PAEs, the number of cases in China far exceeded the number of cases in the US, the EU, and Canada (Table 4). The total costs of diseases attributable to PAE exposure accounted for 0.19% of GDP in Canada (lower than China), 0.29% of GDP in the US (lower than China), and 1.44% of GDP in the EU (higher than China).
4. Discussion
In this study, we estimated the disease burden and economic costs attributable to PBDEs and PAEs. First, it was determined that the number of disease cases attributable to PBDEs was 0.77 million, and the economic costs were CNY 18.92 billion. When compared with results from other countries, the number of intellectual disability cases in China was similar to the number in the US, but far higher than the number in the EU and Canada. However, the impact of the economic costs of intellectual disability on GDP was far lower in China than in the US, the EU, and Canada. PAE-related diseases affected 3.02 million individuals, and the healthcare costs attributable to PAEs were CNY 49.20 billion. Compared with the results for China in 2010, there were more disease cases in 2015, but the economic costs were lower than they were in 2010. When comparing China with other countries, we found that the total costs of disease attributable to PAE exposure accounted for 0.19% of GDP in Canada (lower than China), 0.29% of GDP in the US (lower than China), and 1.44% of GDP in the EU (higher than China). Finally, when comparing the disease burden caused by PBDEs and PAEs in this study, it was found that the disease burden and economic costs associated with PAEs were substantial, which could provide a basis for the prevention and control of key pollutants.
This study summarized the literature on exposure concentrations of PBDEs and PAEs. At present, human exposure data are limited, so they need to be supplemented in the future. However, based on the available data, several important exposure–response relationships could be established for subsequent disease burden analysis.
Current studies on the disease burden associated with PBDEs have mainly focused on neurotoxicity. Gaylord et al. reported that the economic costs of IQ loss and intellectual disability attributable to PBDEs were USD 4551.65 billion from 2001 to 2016 [25]. Another study conducted by the EU found that the economic costs of intellectual disability caused by PBDEs in 2010 were EUR 9.59 billion [8]. These results reflect the substantial disease burden caused by PBDEs, which are consistent with our findings. This study also focused on breast cancer and thyroid cancer, which fills the gap in related research and has considerable public health significance.
In this study, the disease burden caused by PAEs was compared in time and space. First, a study conducted by Peking University assessed the disease burden and economic costs associated with PAE exposure in the general Chinese population in 2010 [16]. The results showed that the costs of disease caused by PAE exposure were as high as CNY 57.20 billion, accounting for 1.42% of GDP in 2010, which was higher than it was in 2015. The reasons for the difference between 2010 and 2015 are as follows: after the Taiwan plasticizer incident in 2011, the EU issued a related ban on phthalic plasticizers [26], and the use of phthalic plasticizers in the Chinese market was also restricted.
The economic costs attributable to PAE exposure in the general Chinese population in 2015 were higher than in the US and Canada but lower than in the EU [8,9]. These differences may be related to differences in policies between China, the EU, and North America. The EU, North America, and other developed countries have attached great importance to the control of EDCs since the 1990s and formulated relevant management regulations and strategic control plans. For example, the US has established a two-level screening and testing program and has included a variety of EDCs on its priority pollutant control list [27]. Similar to the US, Canada used a risk-based strategy for the regulation of chemicals under the Canadian Environmental Protection Act of 1999 [28]. As for the EU, the disease burden due to PAE exposure in the general Chinese population in 2010 was comparable to that in the EU (1.42% vs. 1.44%) [8,16]. However, the disease burden due to PAE exposure in the general Chinese population in 2015 was lower than it was in the EU, which may be explained by the restrictions placed on the use of plasticizers following the Taiwan plasticizer incident.
This study mainly focused on PBDEs and PAEs. However, organophosphate esters (OPEs), bisphenol A (BPA), dichlorodiphenyltrichloroethane (DDT), and heavy metals have also been reported to account for a proportion of the disease burden, such as intellectual disability, childhood obesity, adult diabetes, and female uterine fibroids. For example, a study in the US found that OPE exposure caused economic losses of USD 593.67 billion between 2001 and 2016 [25]. In 2010, the economic costs of childhood obesity caused by BPA were USD 2.4 billion in the US [9] and EUR 1.54 billion in the EU [8]. However, there is still a lack of relevant studies in China, and further attention should be paid to common EDCs for a comprehensive disease burden assessment.
China has become the world’s largest consumer of synthetic chemicals. The general population is widely exposed to EDCs, which fully reflects the necessity of assessing the disease burden attributable to EDCs in China. Our research is forward-looking and will help fill the gaps in this type of research; it will also provide important reference values for China’s health governance. This study evaluated the disease burden of breast cancer and thyroid cancer attributable to PBDEs. It provides a scientific basis for the implementation of health policies and protection of the population’s health to a great extent.
It must be acknowledged that the costs estimated in this study represent only a fraction of the total costs of exposure to PBDEs and PAEs in the general Chinese population. First, China lacked data on the indirect economic burden of some diseases, such as intellectual disability and thyroid cancer. For example, thyroid cancer is a chronic disease that has a long course of disease and is life-threatening, so its indirect economic burden can be very high. Second, in view of the current relevant research basis, our study only evaluated six exposure–response relationships. However, PBDE and PAE exposure can increase the risk of many other diseases. For example, many recent studies have shown associations between PBDEs and PAEs with pediatric and adult liver diseases, particularly non-alcoholic fatty liver disease (NAFLD) [29]. Future studies should add to the assessment of the corresponding disease burden. This study evaluated a small subset of EDCs that had to have sufficiently robust exposure, toxicological, and epidemiological evidence to be eligible for inclusion in the analysis [30]. However, other EDCs may lead to a variety of diseases, which can also cause a substantial disease burden. Ultimately, this study focused on assessing the effects of exposure to two individual chemicals rather than combined exposure to EDCs, so further exploration of how different EDCs collectively cause diseases should be undertaken [31].
The results of this study may be subject to uncertainty. First, with time changes, every link of the disease burden constantly changes. The results of the study are an estimate obtained after comprehensive consideration of various factors. Second, the AFs of some diseases in this study were calculated directly. The two required parameters were odds ratio and prevalence of exposure. Because some diseases lacked relevant data in China, European and US data were used instead. Therefore, the AF calculations were based on the assumption that these data could represent the general Chinese population.
5. Conclusions
This study performed an analysis of the disease burden attributable to EDC exposure in China, with the following key conclusions:
- (1)
- The number of disease cases attributable to PBDEs was 0.77 million, and the economic costs were CNY 18.92 billion. The number of intellectual disability cases was similar to that of the US, but far higher than the number in the EU and Canada; however, the economic costs they accounted for in China’s GDP were far lower than those in the US, the EU, and Canada.
- (2)
- A total of 3.02 million individuals suffered from PAE-related diseases, and the healthcare costs attributable to PAEs were CNY 49.20 billion. There were more disease cases in 2015 than in 2010, but the economic costs were lower in 2015 than in 2010. When compared with other countries, we found that the total costs of disease attributable to PAE exposure accounted for 0.19% of GDP in Canada (lower than China), 0.29% of GDP in the US (lower than China), and 1.44% of GDP in the EU (higher than China).
- (3)
- The disease burden caused by PAEs was more substantial than PBDEs, which could provide a basis for the prevention and control of key pollutants.
Supplementary Materials
The following supporting information can be downloaded at https://www.mdpi.com/article/10.3390/toxics10120766/s1; Figures S1–S4, and Tables S1–S19 are in the Supplementary Materials. References [32,33,34,35,36,37,38,39,40,41,42,43,44,45,46,47,48,49,50,51,52,53,54,55,56,57,58,59,60,61,62,63,64,65,66,67,68,69,70,71,72,73,74,75,76,77,78,79,80,81,82,83,84,85,86,87,88,89,90,91,92,93,94,95,96,97,98,99,100,101,102,103,104,105,106,107,108,109,110,111,112,113,114,115,116,117,118,119,120,121,122,123,124,125,126,127,128,129,130,131,132,133,134,135,136,137,138,139,140,141,142,143,144,145,146,147,148,149,150,151,152,153,154,155,156,157,158,159,160,161,162,163,164,165,166,167,168,169,170,171,172,173,174,175,176,177,178,179,180,181,182,183,184,185,186,187,188,189,190,191,192,193,194,195,196,197,198,199,200,201,202,203,204,205,206,207,208,209,210,211,212,213,214,215,216,217,218,219,220,221,222,223,224,225,226,227,228,229,230,231,232] is in the Supplementary Materials.
Author Contributions
Conceptualization, Y.Z.; methodology, Y.Z. and H.W.; formal analysis, Y.Z. and H.W.; investigation, Y.Z. and H.W.; resources, Y.Z.; data curation, Y.Z.; writing—original draft preparation, H.W.; writing—review and editing, Y.Z. and H.W.; supervision, Y.Z.; project administration, H.W. All authors have read and agreed to the published version of the manuscript.
Funding
The research reported in this publication was supported by the National Natural Science Foundation of China Grant 82273585 (Yunhui Zhang) and the Shanghai 3-year Public Health Action Plan Grant GWV-10.1-XK11 (Yunhui Zhang). The authors declare no competing financial interests.
Institutional Review Board Statement
Approval by the Institutional Review Board was not required, as this study involved de-identified human data.
Informed Consent Statement
Not applicable.
Data Availability Statement
Data regarding CPI were obtained from China’s National Bureau of Statistics.
Acknowledgments
We thank the authors of previous studies that assessed the economic costs of endocrine-disrupting chemicals, which we based this research on.
Conflicts of Interest
The authors declare no conflict of interest.
References
- Gore, A.C. Endocrine-Disrupting Chemicals. JAMA Intern. Med. 2016, 176, 1705–1706. [Google Scholar] [CrossRef] [PubMed]
- Kahn, L.G.; Philippat, C.; Nakayama, S.F.; Slama, R.; Trasande, L. Endocrine-disrupting chemicals: Implications for human health. Lancet Diabetes Endocrinol. 2020, 8, 703–718. [Google Scholar] [CrossRef]
- Gore, A.C.; Chappell, V.A.; Fenton, S.E.; Flaws, J.A.; Nadal, A.; Prins, G.S.; Toppari, J.; Zoeller, R.T. EDC-2: The Endocrine Society’s Second Scientific Statement on Endocrine-Disrupting Chemicals. Endocr. Rev. 2015, 36, E1–E150. [Google Scholar]
- Yang, X.; Liu, H.; Liu, J.; Wang, L.; Wang, Z.; Wu, S.; Shi, L. Status quo of management of endocrine disrupting chemicals in abroad and corresponding strategies for China. J. Ecol. Rural. Environ. 2018, 34, 104–113. [Google Scholar]
- Collaborators, G.R.F. Global burden of 87 risk factors in 204 countries and territories, 1990–2019: A systematic analysis for the Global Burden of Disease Study 2019. Lancet 2020, 396, 1223–1249. [Google Scholar]
- Herbst, A.L.; Ulfelder, H.; Poskanzer, D.C. Adenocarcinoma of the vagina. Association of maternal stilbestrol therapy with tumor appearance in young women. N. Engl. J. Med. 1971, 284, 878–881. [Google Scholar] [CrossRef]
- HEAL. Health Costs in the European Union—How Much Is Related to EDCs? 2014. Available online: http://www.envhealth.org/IMG/pdf/18062014_final_health_costs_in_the_european_union_how_much_is_related_to_edcs.pdf (accessed on 16 October 2022).
- Trasande, L.; Zoeller, R.T.; Hass, U.; Kortenkamp, A.; Grandjean, P.; Myers, J.P.; DiGangi, J.; Bellanger, M.; Hauser, R.; Legler, J.; et al. Estimating burden and disease costs of exposure to endocrine-disrupting chemicals in the European union. J. Clin. Endocrinol. Metab. 2015, 100, 1245–1255. [Google Scholar] [CrossRef]
- Attina, T.M.; Hauser, R.; Sathyanarayana, S.; Hunt, P.A.; Bourguignon, J.P.; Myers, J.P.; DiGangi, J.; Zoeller, R.T.; Trasande, L. Exposure to endocrine-disrupting chemicals in the USA: A population-based disease burden and cost analysis. Lancet Diabetes Endocrinol. 2016, 4, 996–1003. [Google Scholar] [CrossRef]
- Malits, J.; Naidu, M.; Trasande, L. Exposure to Endocrine Disrupting Chemicals in Canada: Population-Based Estimates of Disease Burden and Economic Costs. Toxics 2022, 10. [Google Scholar] [CrossRef]
- Abbasi, G.; Li, L.; Breivik, K. Global Historical Stocks and Emissions of PBDEs. Environ. Sci. Technol. 2019, 53, 6330–6340. [Google Scholar] [CrossRef] [Green Version]
- Net, S.; Sempere, R.; Delmont, A.; Paluselli, A.; Ouddane, B. Occurrence, fate, behavior and ecotoxicological state of phthalates in different environmental matrices. Environ. Sci. Technol. 2015, 49, 4019–4035. [Google Scholar] [CrossRef] [PubMed]
- Pei, J.; Yao, H.; Wang, H.; Li, H.; Lu, S.; Zhang, X.; Xiang, X. Polybrominated diphenyl ethers (PBDEs) in water, surface sediment, and suspended particulate matter from the Yellow River, China: Levels, spatial and seasonal distribution, and source contribution. Mar. Pollut. Bull. 2018, 129, 106–113. [Google Scholar] [CrossRef] [PubMed]
- Miao, W.; Chen, Y.; An, D.; Chen, Y.; Qiang, J. Research on pollution status and control measure of PAEs. Heilongjiang Environ. J. 2019, 43, 80–83. [Google Scholar]
- Tian, H.; Shu, W.; Zhang, X.; Wang, Y.; Cao, J. Study on organic pollutants in source water of Yangtze and Jialing Rivers (Chongqing Section). Resour. Environ. Yangtze Basin 2003, 118–123. [Google Scholar]
- Cao, Y.; Li, L.; Shen, K.; Liu, J. Disease burden attributable to endocrine-disrupting chemicals exposure in China: A case study of phthalates. Sci. Total Environ. 2019, 662, 615–621. [Google Scholar] [CrossRef]
- WHO. Children and Digital Dumpsites: E-Waste Exposure and Child Health; WHO: Geneva, Switzerland, 2021. [Google Scholar]
- He, Y. Polychlorinated Biphenyl and Polybrominated Diphenyl Ether Exposure Associated with Breast Cancer Risk: A Case-control Study. Ph.D. Thesis, Shantou University Medical College, Shantou, China, 2017. [Google Scholar]
- Braun, J.M.; Yolton, K.; Stacy, S.L.; Erar, B.; Papandonatos, G.D.; Bellinger, D.C.; Lanphear, B.P.; Chen, A. Prenatal environmental chemical exposures and longitudinal patterns of child neurobehavior. Neurotoxicology 2017, 62, 192–199. [Google Scholar] [CrossRef]
- Lyall, K.; Croen, L.A.; Weiss, L.A.; Kharrazi, M.; Traglia, M.; Delorenze, G.N.; Windham, G.C. Prenatal Serum Concentrations of Brominated Flame Retardants and Autism Spectrum Disorder and Intellectual Disability in the Early Markers of Autism Study: A Population-Based Case-Control Study in California. Environ. Health Perspect. 2017, 125, 087023. [Google Scholar] [CrossRef]
- He, Y.; Peng, L.; Zhang, W.; Liu, C.; Yang, Q.; Zheng, S.; Bao, M.; Huang, Y.; Wu, K. Adipose tissue levels of polybrominated diphenyl ethers and breast cancer risk in Chinese women: A case-control study. Environ. Res. 2018, 167, 160–168. [Google Scholar] [CrossRef]
- Zhang, Q.; Hu, M.; Wu, H.; Niu, Q.; Lu, X.; He, J.; Huang, F. Plasma polybrominated diphenyl ethers, urinary heavy metals and the risk of thyroid cancer: A case-control study in China. Environ. Pollut. 2020, 269, 116162. [Google Scholar] [CrossRef]
- Institute of Medicine. Costs of Environment-Related Health Effects: A Plan for Continuing Study; National Academy Press: Washington, DC, USA, 1981. [Google Scholar]
- Rockhill, B.; Newman, B.; Weinberg, C. Use and misuse of population attributable fractions. Am. J. Public Health 1998, 88, 15–19. [Google Scholar] [CrossRef] [Green Version]
- Gaylord, A.; Osborne, G.; Ghassabian, A.; Malits, J.; Attina, T.; Trasande, L. Trends in neurodevelopmental disability burden due to early life chemical exposure in the USA from 2001 to 2016: A population-based disease burden and cost analysis. Mol. Cell. Endocrinol. 2020, 502, 110666. [Google Scholar] [CrossRef] [PubMed]
- Li, J.; Tang, R.; Xu, G.; Li, X. The hazards and countermeasures of plasticizer in food. China New Technol. Prod. 2013, 180–181. [Google Scholar]
- Lei, X.; Xiu, G.; Wang, Z.; Yan, L.; Chen, J. Management and screening system of endocrine disruptor compounds in foreign countries and establishment of priority list. Chem. Word 2017, 58, 51–56. [Google Scholar]
- Chemicals Management Plan Science Committee. Committee Report: Advancing Consideration of Endocrine-Disrupting Chemicals under the Canadian Environmental Protection Act, 1999. 2018. Available online: https://www.canada.ca/en/health-canada/servies/chemical-substances/chemicals-management-plan/science-committee/meeting-records-reports/committee-report-july-18-19-2018.html#a3 (accessed on 16 October 2022).
- Midya, V.; Colicino, E.; Conti, D.V.; Berhane, K.; Garcia, E.; Stratakis, N.; Andrusaityte, S.; Basagaña, X.; Casas, M.; Fossati, S.; et al. Association of Prenatal Exposure to Endocrine-Disrupting Chemicals With Liver Injury in Children. JAMA Netw. Open 2022, 5, e2220176. [Google Scholar] [CrossRef] [PubMed]
- Trasande, L.; Vandenberg, L.N.; Bourguignon, J.P.; Myers, J.P.; Slama, R.; Vom Saal, F.; Zoeller, R.T. Peer-reviewed and unbiased research, rather than ‘sound science’, should be used to evaluate endocrine-disrupting chemicals. J. Epidemiol. Community Health 2016, 70, 1051–1056. [Google Scholar] [CrossRef] [Green Version]
- Bopp, S.K.; Barouki, R.; Brack, W.; Dalla Costa, S.; Dorne, J.C.M.; Drakvik, P.E.; Faust, M.; Karjalainen, T.K.; Kephalopoulos, S.; van Klaveren, J.; et al. Current EU research activities on combined exposure to multiple chemicals. Environ. Int. 2018, 120, 544–562. [Google Scholar] [CrossRef]
- Zhao, X.; Yang, X.; Du, Y.; Li, R.; Zhou, T.; Wang, Y.; Chen, T.; Wang, D.; Shi, Z. Polybrominated diphenyl ethers in serum from residents living in a brominated flame retardant production area: Occurrence, influencing factors, and relationships with thyroid and liver function. Environ. Pollut. 2021, 270, 116046. [Google Scholar] [CrossRef]
- Wang, Y.; Li, M.; Ayeguli, A.; Haiqimu Khan, A.; Liu, Z. Association between polybrominated diphenyl ethers levels in umbilical cord blood and birth outcomes of neonates in Urumqi. Prev. Med. 2020, 32, 526–529. [Google Scholar]
- Guo, J.; Miao, W.; Wu, C.; Zhang, J.; Qi, X.; Yu, H.; Chang, X.; Zhang, Y.; Zhou, Z. Umbilical cord serum PBDE concentrations and child adiposity measures at 7 years. Ecotoxicol. Environ. Saf. 2020, 203, 111009. [Google Scholar] [CrossRef]
- Xu, B.; Wu, M.; Wang, M.; Pan, C.; Qiu, W.; Tang, L.; Xu, G. Polybrominated diphenyl ethers (PBDEs) and hydroxylated PBDEs in human serum from Shanghai, China: A study on their presence and correlations. Environ. Sci. Pollut. Res. Int. 2018, 25, 3518–3526. [Google Scholar] [CrossRef]
- Wang, Y.; Liu, S.; Zhao, H.; Zhao, G.; Chen, J.; Zhai, G.; Zhao, H. Polybrominated diphenylethers (PBDEs) and their hydroxylated metabolites (OH-PBDEs) in female serum from Dalian, China. Int. J. Hyg. Environ. Health 2016, 219, 816–822. [Google Scholar] [CrossRef] [PubMed]
- Yang, L.; Lu, Y.; Wang, L.; Chang, F.; Zhang, J.; Liu, Y. Levels and Profiles of Polybrominated Diphenyl Ethers in Breast Milk During Different Nursing Durations. Bull. Environ. Contam. Toxicol. 2016, 97, 510–516. [Google Scholar] [CrossRef] [PubMed]
- Lv, Q.X.; Wang, W.; Li, X.H.; Yu, L.; Zhang, Y.; Tian, Y. Polychlorinated biphenyls and polybrominated biphenyl ethers in adipose tissue and matched serum from an E-waste recycling area (Wenling, China). Environ. Pollut. 2015, 199, 219–226. [Google Scholar] [CrossRef] [PubMed]
- Huang, F.; Wen, S.; Li, J.; Zhong, Y.; Zhao, Y.; Wu, Y. The human body burden of polybrominated diphenyl ethers and their relationships with thyroid hormones in the general population in Northern China. Sci. Total Environ. 2014, 466–467, 609–615. [Google Scholar] [CrossRef] [PubMed]
- Chen, Z.J.; Liu, H.Y.; Cheng, Z.; Man, Y.B.; Zhang, K.S.; Wei, W.; Du, J.; Wong, M.H.; Wang, H.S. Polybrominated diphenyl ethers (PBDEs) in human samples of mother-newborn pairs in South China and their placental transfer characteristics. Environ. Int. 2014, 73, 77–84. [Google Scholar] [CrossRef] [PubMed]
- Shi, Z.; Jiao, Y.; Hu, Y.; Sun, Z.; Zhou, X.; Feng, J.; Li, J.; Wu, Y. Levels of tetrabromobisphenol A, hexabromocyclododecanes and polybrominated diphenyl ethers in human milk from the general population in Beijing, China. Sci. Total Environ. 2013, 452–453, 10–18. [Google Scholar] [CrossRef] [PubMed]
- Wang, H.S.; Jiang, G.M.; Chen, Z.J.; Du, J.; Man, Y.B.; Giesy, J.P.; Wong, C.K.; Wong, M.H. Concentrations and congener profiles of polybrominated diphenyl ethers (PBDEs) in blood plasma from Hong Kong: Implications for sources and exposure route. J. Hazard. Mater. 2013, 261, 253–259. [Google Scholar] [CrossRef]
- Chao, H.R.; Tsou, T.C.; Huang, H.L.; Chang-Chien, G.P. Levels of breast milk PBDEs from southern Taiwan and their potential impact on neurodevelopment. Pediatr. Res. 2011, 70, 596–600. [Google Scholar] [CrossRef]
- Wu, K.; Xu, X.; Liu, J.; Guo, Y.; Li, Y.; Huo, X. Polyhrominated Diphenyl Ethers in Umbilical Cord Blood and Relevant Factors in Neonates from Guiyu, China. Environ. Sci. Technol. 2010, 44, 813–819. [Google Scholar] [CrossRef]
- Chen, G.; Huang, W.; Li, H.; Huang, W. Phthalate exposure during pregnancy and its relationship with birth outcomes in Guangzhou. Chin. J. Environ. Occup. Med. 2021, 38, 573–579. [Google Scholar]
- Qiu, J.; Wu, H.; Mao, B.; Tang, C.; Chen, B. Correlation between phthalates exposure and neurobehavioral development in infants from a community of Shanghai. J. Environ. Occup. Med. 2019, 36, 300–305. [Google Scholar]
- Sun, X. Associations of Prenatal Exposure to Phthalates with Fetal Hormones and Early Childhood Growth. Ph.D. Thesis, Huazhong University of Science and Technology, Wuhan, China, 2019. [Google Scholar]
- Lei, C.; Zheng, D.; Mou, L.; Cheng, Y.; Tan, Z.; Dai, X.; Zhong, H. Urinary phthalate metabolites in children aged 5–6 years in some rural areas of Chongqing. J. Environ. Health 2019, 36, 520–522. [Google Scholar]
- Zhang, Y. Effect of Phthalate Exposure during Three Gestation Period on Birth Weight and Gender-Dependent Manner: A Birth Cohort Study in China. Ph.D. Thesis, Anhui Medical University, Hefei, China, 2017. [Google Scholar]
- Chen, C.; Wang, X.; Wang, Z.; Guo, J.; Zhao, Y.; Dong, J.; Sun, X.; Shi, Y.; Wang, Y. Analysis of phthalates exposure in college students. J. Environ. Health 2016, 33, 335–338. [Google Scholar]
- Gao, C.; Liu, L.; Ma, W.; Zhu, N.; Liu, L.; Li, Y. Residue and health risk assessment of phthalate metabolites in urine of young adults in Northeast China. J. Nat. Sci. Heilongjiang Univ. 2015, 32, 654–660. [Google Scholar]
- Wu, W. Study of Phthalate Exposure and Impacts on Children’s Growth and Development. Ph.D. Thesis, Huazhong University of Science and Technology, Wuhan, China, 2015. [Google Scholar]
- Wang, H. Impact of Exposure to Phthalates and Bisphenol A on Growth and Development of School Children. Ph.D. Thesis, Fudan University, Shanghai, China, 2013. [Google Scholar]
- Li, L.; Tian, X.; Zhang, X.; Ha, L. Blood Level of PAEs in Child-bearing Period Women. J. Environ. Health 2011, 28, 792–794. [Google Scholar]
- Miao, H.; Zhang, L.; Lai, J.; Sun, L.; Zhao, Y.; Li, J. A study on the correlation of phthalate metabolites in umbilical cord blood of 161 newborns with birth indicators in Beijing. Chin. J. Prev. Med. 2020, 54, 768–773. [Google Scholar]
- Sheng, Y. Phthalate levels pregnant women serum and risk of hypertensive disorder complicating pregnancy. Ph.D. Thesis, Guangxi Medical University, Nanning, China, 2019. [Google Scholar]
- Yaghjyan, L.; Sites, S.; Ruan, Y.; Chang, S.H. Associations of urinary phthalates with body mass index, waist circumference and serum lipids among females: National Health and Nutrition Examination Survey 1999–2004. Int. J. Obes. 2015, 39, 994–1000. [Google Scholar] [CrossRef] [Green Version]
- Li, Y.L.; Lv, J.; Du, Z.P.; Feng, S.; Sheng, J.; Jin, Z.X.; Liu, K.Y.; Gao, H.; Li, X.D.; Cao, H.J.; et al. The levels of phthalate exposure and associations with obesity in an elderly population in China. Ecotoxicol. Environ. Saf. 2020, 201, 110749. [Google Scholar] [CrossRef]
- Hou, J.W.; Lin, C.L.; Tsai, Y.A.; Chang, C.H.; Liao, K.W.; Yu, C.J.; Yang, W.; Lee, M.J.; Huang, P.C.; Sun, C.W.; et al. The effects of phthalate and nonylphenol exposure on body size and secondary sexual characteristics during puberty. Int. J. Hyg. Environ. Health 2015, 218, 603–615. [Google Scholar] [CrossRef]
- Buser, M.C.; Murray, H.E.; Scinicariello, F. Age and sex differences in childhood and adulthood obesity association with phthalates: Analyses of NHANES 2007–2010. Int. J. Hyg. Environ. Health 2014, 217, 687–694. [Google Scholar] [CrossRef]
- Zhang, Y.; Meng, X.; Chen, L.; Li, D.; Zhao, L.; Zhao, Y.; Li, L.; Shi, H. Age and sex-specific relationships between phthalate exposures and obesity in Chinese children at puberty. PLoS ONE 2014, 9, e104852. [Google Scholar] [CrossRef] [PubMed]
- Dong, R.; Zhao, S.; Zhang, H.; Chen, J.; Zhang, M.; Wang, M.; Wu, M.; Li, S.; Chen, B. Sex Differences in the Association of Urinary Concentrations of Phthalates Metabolites with Self-Reported Diabetes and Cardiovascular Diseases in Shanghai Adults. Int. J. Environ. Res. Public Health 2017, 14, 598. [Google Scholar] [CrossRef] [PubMed]
- Huang, T.; Saxena, A.R.; Isganaitis, E.; James-Todd, T. Gender and racial/ethnic differences in the associations of urinary phthalate metabolites with markers of diabetes risk: National Health and Nutrition Examination Survey 2001–2008. Environ. Health 2014, 13, 6. [Google Scholar] [CrossRef] [Green Version]
- Duan, Y.; Sun, H.; Han, L.; Chen, L. Association between phthalate exposure and glycosylated hemoglobin, fasting glucose, and type 2 diabetes mellitus: A case-control study in China. Sci. Total Environ. 2019, 670, 41–49. [Google Scholar] [CrossRef]
- Lind, P.M.; Zethelius, B.; Lind, L. Circulating levels of phthalate metabolites are associated with prevalent diabetes in the elderly. Diabetes Care 2012, 35, 1519–1524. [Google Scholar] [CrossRef] [PubMed]
- Han, X.; Cui, Z.; Zhou, N.; Ma, M.; Li, L.; Li, Y.; Lin, H.; Ao, L.; Shu, W.; Liu, J.; et al. Urinary phthalate metabolites and male reproductive function parameters in Chongqing general population, China. Int. J. Hyg. Environ. Health 2014, 217, 271–278. [Google Scholar] [CrossRef] [PubMed]
- Hauser, R.; Meeker, J.D.; Duty, S.; Silva, M.J.; Calafat, A.M. Altered semen quality in relation to urinary concentrations of phthalate monoester and oxidative metabolites. Epidemiology 2006, 17, 682–691. [Google Scholar] [CrossRef] [Green Version]
- Wang, Y.X.; You, L.; Zeng, Q.; Sun, Y.; Huang, Y.H.; Wang, C.; Wang, P.; Cao, W.C.; Yang, P.; Li, Y.F.; et al. Phthalate exposure and human semen quality: Results from an infertility clinic in China. Environ. Res. 2015, 142, 1–9. [Google Scholar] [CrossRef]
- Liu, L.; Bao, H.; Liu, F.; Zhang, J.; Shen, H. Phthalates exposure of Chinese reproductive age couples and its effect on male semen quality, a primary study. Environ. Int. 2012, 42, 78–83. [Google Scholar] [CrossRef]
- Liu, X.; Zhou, X.; Chen, W.; Jia, F.; Zhang, M.; Chen, J.; Wu, M.; Chen, B.; Li, S. Association between exposure to phthalates and type 2 diabetes in middle and old age. Shanghai J. Prev. Med. 2019, 31, 443–447. [Google Scholar]
- Chen, Y.; Miao, M.; Liang, H.; Chen, Y.; Ji, H.; Ren, Y.; Liu, X.; Zhou, Y.; Wang, Z.; Yuan, W. Effects of prenatal exposure to polybrominated diphenyl ethers (PBDEs) on the second to fourth digit ratio in children aged 4 years. Int. J. Hyg. Environ. Health 2021, 231, 113639. [Google Scholar] [CrossRef] [PubMed]
- Pan, C.; Lu, Q.; Yao, Q.; Tian, Y.; Gao, Y. Polybrominated diphenyl ethers exposure in late pregnancy and child growth at 8 years of age. Chin. J. Environ. Occup. Med. 2020, 37, 1042–1049. [Google Scholar]
- Fu, Z.; Sun, G.; Sun, W.; Liu, L.; Li, W.; Li, Q.; Wang, D. Exposure levels and correlation of polybrominated diphenyl ethers in serum, hair, and nail of workers from a deca-brominated diphenyl ether manufacturing plant. J. Environ. Occup. Med. 2020, 37, 579–585. [Google Scholar]
- Luan, M.; Liang, H.; Yang, F.; Yuan, W.; Chen, A.; Liu, X.; Ji, H.; Wen, S.; Miao, M. Prenatal polybrominated diphenyl ethers exposure and anogenital distance in boys from a Shanghai birth cohort. Int. J. Hyg. Environ. Health 2019, 222, 513–523. [Google Scholar] [CrossRef]
- Luan, M.; Liang, H.; Wang, Z.; Ji, H.; Liu, X.; Liu, X.; Yuan, W.; Miao, M. Concentrations and influencing factors of polybrominated diphenyl ethers in cord blood of newborns in Minhang District of Shanghai. J. Environ. Occup. Med. 2019, 36, 1–10. [Google Scholar]
- Ji, H.; Liang, H.; Wang, Z.; Miao, M.; Wang, X.; Zhang, X.; Wen, S.; Chen, A.; Sun, X.; Yuan, W. Associations of prenatal exposures to low levels of Polybrominated Diphenyl Ether (PBDE) with thyroid hormones in cord plasma and neurobehavioral development in children at 2 and 4 years. Environ. Int. 2019, 131, 105010. [Google Scholar] [CrossRef]
- Liu, X. The Prospective Nested Case-Control Study of the Association between Persistent Organic Pollutants Exposure and Gestational Diabetes Risk. Ph.D. Thesis, Nanchang University, Nanchang, China, 2019. [Google Scholar]
- Lin, M. Study on the Concentration and Trend of Persistent Organic Halogenated Compounds in Serum of Weifang City and Yantai City. Ph.D. Thesis, Minzu University of China, Beijing, China, 2019. [Google Scholar]
- Song, Q.; He, X.; Si, J.; Jin, Y.; Chen, S.; Zhang, Y. Prenatal exposure to polybrominated diphenyl ethers and intrauterine growth retardation in newborns: A nested case-control study. J. Environ. Occup. Med. 2018, 35, 209–217. [Google Scholar]
- Cui, C.; Tian, Y.; Zhang, L.; Gao, Y.; Jin, J.; Wang, P.; Ding, W.; Wang, X.; Shi, R.; Wang, Y. Polybrominated diphenyl ethers exposure in breast milk in Shanghai, China: Levels, influencing factors and potential health risk for infants. Sci. Total Environ. 2012, 433, 331–335. [Google Scholar] [CrossRef]
- Ding, W. Preliminary Study on Human Exposure to Brominated Flame Retardants in Typical Areas. Ph.D. Thesis, Minzu University of China, Beijing, China, 2011. [Google Scholar]
- He, P.; Chen, G.; Zheng, X. Prevalence of intellectual disability and concurrent impairments among Chinese children, 1987–2006. Chin. J. Public Health 2017, 33, 1417–1421. [Google Scholar]
- Zhang, X.; Wang, P.; Wang, Y. Current status of children aged 0~6 years old from Yangzhou city in 2007. Matern. Child Health Care China 2014, 29, 424–427. [Google Scholar]
- Wang, X. Investigation in the Status of Women Disabilities in Henan Province in 2006. Ph.D. Thesis, Zhengzhou University, Zhengzhou, China, 2012. [Google Scholar]
- Kwok, H.W.; Cui, Y.; Li, J. Perspectives of intellectual disability in the People’s Republic of China: Epidemiology, policy, services for children and adults. Curr. Opin. Psychiatry 2011, 24, 408–412. [Google Scholar] [CrossRef]
- Yin, H.; Huang, X. Analysis on Intellectual Disability Prevalence and Rehabilitation Demands in Zhejiang Province. Zhejiang Prev. Med. 2011, 23, 1–4. [Google Scholar]
- Chen, R.; Chen, G.; Song, X.; Zhang, L.; Zheng, X. Epidemiological study on disabilities among ethnic minorities in China. Chin. J. Epidemiol. 2010, 31, 538–543. [Google Scholar]
- Zheng, R.; Liang, F.; Bai, J.; Hu, Y.; Bai, Q.; Pan, L.; Li, Z. Women’s diseases in Lanzhou, 2014–2018. Mod. Prev. Med. 2019, 46, 3897–3901. [Google Scholar]
- Zhang, M.; Qiao, C.; Huang, Q.; Tang, M.; Liu, X. Prevalence of common gynecological diseases in Pudong New Area from 2011 to 2017. J. Reprod. Med. 2019, 28, 1088–1091. [Google Scholar]
- Zhang, J. Analysis of screening results of breast and cervical benign and malignant lesions in women of Dalian from 2016 to 2017. Med. J. Chin. People’s Health 2019, 31, 123–124+130. [Google Scholar]
- Gu, L.; Ma, X. Analysis on prevalence of gynecological diseases from 2009 to 2018 in Fengxian district, Shanghai. Nurs. Integr. Tradit. Chin. West. Med. 2019, 5, 19–21. [Google Scholar]
- Sun, X.; Jiang, Y.; Liu, H.; Zhang, X.; Huo, Y.; Han, P.; Sun, L.; Cao, W. Investigation of female breast disease in Zhengzhou. J. Pract. Med. 2017, 33, 2045–2048. [Google Scholar]
- Ren, C. The Screening of Cervical Cancer and Breast Cancer in Four Counties of Yibin City, 2013–2015. J. Occup. Health Damage 2017, 32, 94–97. [Google Scholar]
- Geng, X.; Li, S.; Li, S.; Wang, X.; Zhang, B.; Huang, X. Investigation on the prevalence of breast disease, gynecological disease and thyroid disease among women in Xinjiang and Buxer Country. Women’s Health Res. 2017, 171–172. [Google Scholar]
- Deng, S.; Liu, C. Investigation on the situation of gynecological diseases among the community women in Weihai city. Chin. J. Women Child. Health 2017, 8, 83–86. [Google Scholar]
- Zheng, R.; Zeng, H.; Zhang, S.; Chen, T.; Chen, W. National estimates of cancer prevalence in China, 2011. Cancer Lett. 2016, 370, 33–38. [Google Scholar] [CrossRef] [PubMed]
- Si, Q. Analysis of cervical cancer and breast cancer in Dongsheng District from 2010 to 2014. Women’s Health Res. 2016, 232+240. [Google Scholar]
- Shao, Y.; Yin, G.; Xia, S. Analysis of breast cancer screening of 25,054 rural women of Yizheng in Jiangsu Province. J. Clin. Med. Pract. 2016, 20, 190–192. [Google Scholar]
- Qu, X. Analysis of cervical and breast cancer screening results in 81,642 women. Guide China Med. 2016, 14, 167–168. [Google Scholar]
- Huang, G.; Chen, X.; Zhang, X. Analysis of breast diseases in Xiangyang city. J. Xiangyang Vocat. Tech. Coll. 2016, 15, 33–34. [Google Scholar]
- Hu, M. Results of cervical and breast cancer screening in Qinhuai District, Nanjing, 2013–2015. Jiangsu J. Prev. Med. 2016, 27, 244–245. [Google Scholar]
- Zhou, D.; Xu, J.; Yang, L. Cervical cancer and breast cancer screening results among three hundred thousand rural women in Taizhou city. Chin. Rural. Health Serv. Adm. 2015, 35, 640–642. [Google Scholar]
- Zhi, M. The prevalence of breast cancer in rural women aged 35-64 years and the role of early intervention in community. Guide China Med. 2015, 13, 45–46. [Google Scholar]
- Zhang, L. Epidemiological Survey of Breast Diseases among Women of Childbearing Age in 25 Countries/Districts of 6 Province in China. Ph.D. Thesis, Peking Union Medical College, Beijing, China, 2015. [Google Scholar]
- Gong, J. Analysis of cervical cancer and breast cancer screening results among 76,881 rural women in Zhangjiagang city. Matern. Child Health Care China 2015, 30, 4962–4963. [Google Scholar]
- Zhou, W.; Fang, Y.; Ma, Y. Incidence of malignant tumor in Shaoxing of Zhejiang Province: 2012 report. Chin. J. Health Manag. 2014, 8, 110–115. [Google Scholar]
- Tan, L.; Gao, W.; Ren, S.; Liu, J. Analysis of 308,987 cases of breast cancer screening in Hunan Province. Matern. Child Health Care China 2014, 29, 510–512. [Google Scholar]
- Sun, X. Analysis of screening results of two cancers in 2626 women in Pingchao area. Qingdao Med. J. 2014, 46, 457–458. [Google Scholar]
- Liang, H.; Zhang, Z. Investigation and analysis of breast diseases in 8000 rural women in Qingyang City. Health Vocat. Educ. 2014, 32, 110–112. [Google Scholar]
- Li, M.; Han, L.; Gao, Q. Screening results of breast cancer in women of childbearing age in Beijing in 2011. Chin. J. Women Child Health Res. 2014, 25, 40–42. [Google Scholar]
- Gong, X.; Liang, H.; Qin, Q.; Liang, T.; Li, H.; Zhang, N. Analysis of female disease census in Yulin in 2010. Matern. Child Health Care China 2014, 29, 359–361. [Google Scholar]
- Chen, H.; Li, X.; Liao, Y.; Huang, J. Analysis of women’s disease census in Yuzhong District, Chongqing from 2008 to 2013. Chongqing Med. 2014, 43, 2643–2644. [Google Scholar]
- Zhao, R. Analysis of 7824 cases of breast diseases in Pukou District of Nanjing. Chin. J. Women Child. Health 2013, 4, 59+62. [Google Scholar]
- Xu, J.; Wang, A. Investigation and study on distribution of breast diseases in women of childbearing age in Linyi city. Matern. Child Health Care China 2013, 28, 4204–4207. [Google Scholar]
- Li, B.; Geng, G.; Wang, H.; Tian, C. The analysis on prevalence rate and pathogenic factors of mammary gland disease of 20,000 healthy check-up women in inner Mongolia. J. Dis. Monit. Control. 2013, 7, 397–398. [Google Scholar]
- Bao, H.; Meng, W.; Zhu, J. Analysis of breast cancer screening results among women aged 35–69 years in Jinghu District. Matern. Child Health Care China 2013, 28, 3087–3090. [Google Scholar]
- Zhang, M.; Huang, Z.; Zheng, Y. Estimates and prediction on incidence, mortality and prevalence of breast cancer in China, 2008. Chin. J. Epidemiol. 2012, 33, 1049–1051. [Google Scholar]
- Yin, X. Analysis of “two cancers” screening in women of age in Ma’anshan city. J. Anhui Health Vocat. Tech. Coll. 2012, 11, 105–106. [Google Scholar]
- Yang, G. Analysis of breast disease survey results of 3066 women in Jiyuan City in 2011. Chin. J. Mod. Drug Appl. 2012, 6, 134–135. [Google Scholar]
- Xu, L.; Zhong, Q.; Xu, W. Comparative analysis of breast examination results of 2832 urban and rural women in Fuyang City. Chin. Rural. Health Serv. Adm. 2012, 32, 412–413. [Google Scholar]
- Tang, Y.; Xu, M. A retrospective analysis of the general survey of women’s diseases in Suichang Country for ten consecutive years. Chin. Rural. Health Serv. Adm. 2012, 32, 409–410. [Google Scholar]
- Tan, H.; Yang, W.; Wang, C.; Cheng, X.; Kong, F.; Sun, S.; Zeng, F.; Hu, K. Report of general investigation of breast diseases among 5000 women in Huichuan district. Matern. Child Health Care Child 2012, 27, 1310–1311. [Google Scholar]
- Sun, L.; Sheng, Z.; Gu, Y.; Zang, Y.; Yu, Q.; Bian, Y.; He, Y.; Chen, W.; Xie, M. Analysis of common gynecological diseases in Wuxi in 2011. Matern. Child Health Care Child 2012, 27, 1849–1850. [Google Scholar]
- Ma, Y. Analysis of the methods and results of gynecological disease survey in Tianzhu Tibetan Autonomous Country. China Health Care Nutr. 2012, 22, 4074. [Google Scholar]
- Kong, J.; Yang, R. Analysis on the incidence of breast diseases among women in Yongjing Country. Matern. Child Health Care Child 2012, 27, 793–794. [Google Scholar]
- Ding, X.; Li, L.; Liu, W.; Jiang, Y.; Zhang, Q.; Tian, Y. Analysis of women’s disease survey in Qiaokou District of Wuhan. Chin. J. Women Child Health 2012, 3, 176–178. [Google Scholar]
- Xu, P.; Gui, Y.; Li, J.; Guo, L.; Wu, J.; Chen, J. Analysis of 3501 cases of breast disease screening. Natl. Med. Front. China 2012, 7, 89+59. [Google Scholar]
- Wang, M. Analysis on the examination and treatment of common diseases among women in Zaozhuang City from 2006 to 2010. Chin. Community Dr. 2011, 13, 339–340. [Google Scholar]
- Wang, C. Screening results of breast cancer among 10,004 women in Zunyi city in 2009. Ph.D. Thesis, Zunyi Medical University, Zunyi, China, 2011. [Google Scholar]
- Li, Y.; Li, Y. Analysis on the results of gynecological disease survey in Huinong District from 2005 to 2010. Chin. Community Dr. 2011, 13, 333–334. [Google Scholar]
- Du, J.; Zhou, C.; Zeng, L.; Wang, W.; Luo, X.; Xiao, Z.; Wang, H. Analysis on the General Survey Result of Gynecological Disease in Tujia-Miao Autonomous Prefecture from 2006 to 2010 Xiangxi. Chin. Prim. Health Care 2011, 25, 40–41. [Google Scholar]
- Cui, J.; Lv, H. Survey results on gynecological malignant tumors in Pudong New Area of Shanghai from 2004 to 2009. Shanghai J. Prev. Med. 2011, 23, 116–118. [Google Scholar]
- Zhu, X.; Xie, J. Analysis of 112,344 cases of gynecological diseases in Haizhu District from 2001 to 2010. Chin. Community Dr. 2011, 13, 344–346. [Google Scholar]
- Wang, X.; Jin, T. Analysis of breast diseases in 35,628 women of childbearing age. Nei Mong. J. Tradit. Chin. Med. 2012, 31, 58–59. [Google Scholar] [CrossRef] [Green Version]
- Zhu, Q. Analysis of breast screening results of 1389 women. Chin. Rural. Health Serv. Adm. 2011, 31, 421–422. [Google Scholar]
- Chai, Q. Breast cancer screening of rural women in Jiangshan city. Zhejiang Prev. Med. 2011, 23, 66–67. [Google Scholar]
- Gong, J.; Zhou, J. Prevalence and incidence of malignant tumors in physical examination population in Shanxi Province from 2012 to 2015. J. Huzhou Univ. 2018, 40, 44–49. [Google Scholar]
- Chen, H.; Zhan, D.; Feng, B.; Li, W.; Liu, T.; Zhai, J.; Wang, X.; Sun, H.; Luo, Y. Epidemiological study on adult thyroid disease in Jilin Province. Chin. J. Ctrl. Endem. Dis. 2017, 32, 241–244. [Google Scholar]
- Chen, Y.; Guo, L.; Zhang, Y.; Shi, J.; Ren, J.; Huang, H.; Dai, M.; Li, N. Estimation and prediction on incidence, mortality and prevalence of thyroid cancer in China, 2008. Chin. J. Dis. Control Prev. 2014, 18, 200–203. [Google Scholar]
- Xue, L.; Lai, Y.; Li, W. Analysis on characteristics of cancer prevalence in Fujian province in 2009. J. Trop. Med. 2011, 11, 1421–1424. [Google Scholar]
- Hu, L.; Huang, X.; You, C.; Li, J.; Hong, K.; Li, P.; Wu, Y.; Wu, Q.; Wang, Z.; Gao, R.; et al. Prevalence of overweight, obesity, abdominal obesity and obesity-related risk factors in southern China. PLoS ONE 2017, 12, e0183934. [Google Scholar] [CrossRef] [PubMed] [Green Version]
- Tong, X.; Wang, X.; Wang, D.; Chen, D.; Qi, D.; Zhang, H.; Wang, Z.; Lu, Z.; Li, W. Prevalence and ethnic pattern of overweight and obesity among middle-aged and elderly adults in China. Eur. J. Prev. Cardiol. 2019, 26, 1785–1789. [Google Scholar] [CrossRef] [PubMed]
- Zhang, X.; Zhang, M.; Zhao, Z.; Huang, Z.; Deng, Q.; Li, Y.; Pan, A.; Li, C.; Chen, Z.; Zhou, M.; et al. Geographic Variation in Prevalence of Adult Obesity in China: Results From the 2013–2014 National Chronic Disease and Risk Factor Surveillance. Ann. Intern. Med. 2020, 172, 291–293. [Google Scholar] [CrossRef]
- Chen, Y.; Peng, Q.; Yang, Y.; Zheng, S.; Wang, Y.; Lu, W. The prevalence and increasing trends of overweight, general obesity, and abdominal obesity among Chinese adults: A repeated cross-sectional study. BMC Public Health 2019, 19, 1293. [Google Scholar] [CrossRef] [Green Version]
- Wang, R.; Zhang, P.; Gao, C.; Li, Z.; Lv, X.; Song, Y.; Yu, Y.; Li, B. Prevalence of overweight and obesity and some associated factors among adult residents of northeast China: A cross-sectional study. BMJ Open 2016, 6, e010828. [Google Scholar] [CrossRef] [Green Version]
- Zhang, L.; Wang, Z.; Wang, X.; Chen, Z.; Shao, L.; Tian, Y.; Zheng, C.; Li, S.; Zhu, M.; Gao, R. Prevalence of overweight and obesity in China: Results from a cross-sectional study of 441 thousand adults, 2012–2015. Obes. Res. Clin. Pract. 2020, 14, 119–126. [Google Scholar] [CrossRef]
- Yu, S.; Xing, L.; Du, Z.; Tian, Y.; Jing, L.; Yan, H.; Lin, M.; Zhang, B.; Liu, S.; Pan, Y.; et al. Prevalence of Obesity and Associated Risk Factors and Cardiometabolic Comorbidities in Rural Northeast China. Biomed. Res. Int. 2019, 2019, 6509083. [Google Scholar] [CrossRef] [PubMed] [Green Version]
- Luo, H.; Li, J.; Zhang, Q.; Cao, P.; Ren, X.; Fang, A.; Liao, H.; Liu, L. Obesity and the onset of depressive symptoms among middle-aged and older adults in China: Evidence from the CHARLS. BMC Public Health 2018, 18, 909. [Google Scholar] [CrossRef] [PubMed] [Green Version]
- Hua, J.; Zhang, L.; Gao, D.; Huang, Y.; Ning, P.; Cheng, P.; Li, Y.; Hu, G. Prevalence of Overweight and Obesity among People Aged 18 Years and Over between 2013 and 2018 in Hunan, China. Int. J. Environ. Res. Public Health 2020, 17, 4048. [Google Scholar] [CrossRef] [PubMed]
- Tian, Y.; Jiang, C.; Wang, M.; Cai, R.; Zhang, Y.; He, Z.; Wang, H.; Wu, D.; Wang, F.; Liu, X.; et al. BMI, leisure-time physical activity, and physical fitness in adults in China: Results from a series of national surveys, 2000–2014. Lancet Diabetes Endocrinol. 2016, 4, 487–497. [Google Scholar] [CrossRef] [PubMed] [Green Version]
- Wang, K.; Wang, D.; Pan, L.; Yu, Y.; Dong, F.; Li, L.; Wang, L.; Liu, T.; Zeng, X.; Sun, L.; et al. Prevalence of Obesity and Related Factors among Bouyei and Han Peoples in Guizhou Province, Southwest China. PLoS ONE 2015, 10, e0129230. [Google Scholar] [CrossRef] [PubMed]
- Hu, F.; Xu, L.; Zhou, J.; Zhang, J.; Gao, Z.; Hong, Z. Association between Overweight, Obesity and the Prevalence of Multimorbidity among the Elderly: Evidence from a Cross-Sectional Analysis in Shandong, China. Int. J. Environ. Res. Public Health 2020, 17, 8355. [Google Scholar] [CrossRef]
- Liu, T.; Zhou, X.; Li, W.; Peng, Y.; Liu, X.; Wang, J.; Ren, T.; Wang, L.; Yuan, P. Prevalence of Overweight and Obesity in Adult Population in Mianyang, Sichuan Province. J. Sichuan Univ. 2017, 48, 946–948+959. [Google Scholar]
- Xie, D.; Chen, W. Epidemiological analysis of overweight and obesity among adults in Nanhai District, Foshan City, 2010. South China J. Prev. Med. 2013, 39, 59–61+64. [Google Scholar]
- Liu, X.; An, X.; Shi, P. Relationship between overweight and obese with common chronic diseases in Shijingshan district of Beijing. Chronic. Pathemathol. J. 2014, 15, 48–51. [Google Scholar]
- Xu, H.; Cai, B.; Huang, C.; Wang, H.; Sun, F.; Zheng, H.; Lu, C. Investigation of common chronic diseases for adults in Nantong City. Mod. Prev. Med. 2015, 42, 457–460. [Google Scholar]
- Chen, Q.; Hua, C.; Zhou, B.; Wang, F.; Xu, X. Analysis on prevalence of overweight and obesity and their relation with diabetes, hypertension, dyslipidemia among adults in Pinghu City. Shanghai J. Prev. Med. 2016, 28, 361–365. [Google Scholar]
- Su, Y. Epidemiological characteristics of obesity and relationship of body mass index of obesity and waist circumference with dyslipidemia among rural adults in Haining. Chin. J. Health Lab. Tec. 2017, 27, 2389–2392. [Google Scholar]
- Deng, Y.; Liu, X.; He, Y.; Wang, X.; Tian, K.; Han, Q.; Wei, K. The epidemiological characteristics and related risk factors of overweight, obesity and central obesity among Fangshan District of Beijing adults in 2017. J. Med. Pest. Control. 2019, 35, 846–849. [Google Scholar]
- Liu, W.; Wang, L.; Liu, S. Analysis of overweight and obesity epidemic among Han residents in rural area of Handan city. Chin. J. Hosp. Stat. 2019, 26, 411–414. [Google Scholar]
- Fu, F.; Zhang, Y.; Wu, X. Prevalence of adult obesity and its correlation with hypertension in Diankou town, 2018. Pract. Prev. Med. 2020, 27, 849–852. [Google Scholar]
- Bi, Y.; Lu, J.; Wang, W.; Mu, Y.; Zhao, J.; Liu, C.; Chen, L.; Shi, L.; Li, Q.; Wan, Q.; et al. Cohort profile: Risk evaluation of cancers in Chinese diabetic individuals: A longitudinal (REACTION) study. J. Diabetes 2014, 6, 147–157. [Google Scholar] [CrossRef]
- Hu, M.; Wan, Y.; Yu, L.; Yuan, J.; Ma, Y.; Hou, B.; Jiang, X.; Shang, L. Prevalence, Awareness and Associated Risk Factors of Diabetes among Adults in Xi’an, China. Sci. Rep. 2017, 7, 10472. [Google Scholar]
- Li, Y.; Teng, D.; Shi, X.; Qin, G.; Qin, Y.; Quan, H.; Shi, B.; Sun, H.; Ba, J.; Chen, B.; et al. Prevalence of diabetes recorded in mainland China using 2018 diagnostic criteria from the American Diabetes Association: National cross sectional study. BMJ 2020, 369, m997. [Google Scholar] [CrossRef]
- Wang, L.; Gao, P.; Zhang, M.; Huang, Z.; Zhang, D.; Deng, Q.; Li, Y.; Zhao, Z.; Qin, X.; Jin, D.; et al. Prevalence and Ethnic Pattern of Diabetes and Prediabetes in China in 2013. JAMA 2017, 317, 2515–2523. [Google Scholar] [CrossRef]
- Xu, Y.; Wang, L.; He, J.; Bi, Y.; Li, M.; Wang, T.; Wang, L.; Jiang, Y.; Dai, M.; Lu, J.; et al. Prevalence and control of diabetes in Chinese adults. JAMA 2013, 310, 948–959. [Google Scholar] [CrossRef]
- Yan, X.; Xia, H.; Li, H.; Deng, X.; Yang, L.; Zhao, S.; Zou, J.; Luo, Y.; Cao, S. Diabetes in Shenzhen, China: Epidemiological investigation and health care challenges. J. Glob. Health 2017, 7, 011102. [Google Scholar] [CrossRef] [PubMed]
- Ruan, Y.; Yan, Q.H.; Xu, J.Y.; Yang, Q.D.; Yao, H.H.; Li, R.; Shi, Y. Epidemiology of Diabetes in Adults Aged 35 and Older from Shanghai, China. Biomed. Environ. Sci. 2016, 29, 408–416. [Google Scholar] [PubMed]
- Wang, Q.; Zhang, X.; Fang, L.; Guan, Q.; Guan, L.; Li, Q. Prevalence, awareness, treatment and control of diabetes mellitus among middle-aged and elderly people in a rural Chinese population: A cross-sectional study. PLoS ONE 2018, 13, e0198343. [Google Scholar] [CrossRef] [PubMed]
- Zhang, F.L.; Xing, Y.Q.; Guo, Z.N.; Wu, Y.H.; Liu, H.Y.; Yang, Y. Prevalence and risk factors for diabetes and impaired fasting glucose in Northeast China: Results from the 2016 China National Stroke Screening Survey. Diabetes Res. Clin. Pract. 2018, 144, 302–313. [Google Scholar] [CrossRef] [Green Version]
- Du, W.; Su, J.; Cui, L.; Miao, W.; Zhou, J.; Qin, Y. Prevalence, awareness, treatment and control of diabetes among six areas in Jiangsu Province. Chin. J. Prev. Contr. Chron. Dis. 2020, 28, 893–897. [Google Scholar]
- Fang, K.; Ma, A.; Li, H.; Dong, J.; Xie, J.; Xie, C.; Qi, K.; Zhou, Y.; Zhao, Y.; Dong, Z. Prevalence and Risk Factors of Diabetes Mellitus and Impairment Fasting Glucose among Residents Aged 40–79 Years in Beijing. Chin. Gen. Pract. 2019, 22, 1014–1020. [Google Scholar]
- Guo, L.; Cui, P.; Qin, N.; Liu, M.; Cui, J.; Zhai, M. Prevalence and influencing factors of diabetes among residents in Rencheng district, Jining city. J. Jining Med. Univ. 2020, 43, 411–414. [Google Scholar]
- Li, L.; Zeng, J.; Xue, J.; Yang, Q.; Zhong, W. Epidemiological characteristics of diabetes in Jingzhou, Hubei Province. Mod. Prev. Med. 2018, 45, 1553–1555. [Google Scholar]
- Pan, Y.; Jiang, G.; Chang, G.; Li, J.; Xin, P. Analysis on prevalence and risk factors of diabetes mellitus in Tianjin. Chin. J. Prev. Contr. Chron. Dis. 2015, 23, 908–912. [Google Scholar]
- Xie, W.; Zhang, J.; Zhu, Q.; Dai, Y. The prevalence of diabetes among adult residents in Jiangsu province. Jiangsu J. Prev. Med. 2019, 30, 522–525. [Google Scholar]
- Zhang, B.; Tian, Y.; Jing, L.; Yan, H.; Li, S.; Shi, L.; Zhang, Y.; Gao, Z.; Xu, B.; Xing, L. Morbidity and influence factors of diabetes mellitus among urban residents (≥40 years) in Liaoning Province. Chin. J. Prev. Contr. Chron. Dis. 2020, 28, 823–827. [Google Scholar]
- Zhang, L.; Zhang, Q.; He, T.; Li, Q.; Tang, Y.; Pan, J. Prevalence characteristics of diabetes and pre-diabetes among adult residents in Hubei province. Chin. J. Public Health 2017, 33, 1345–1349. [Google Scholar]
- Zhang, Q.; Wang, B.; Tian, L.; Quan, J.; Jia, X.; Li, Y.; Wang, D.; Li, X.; Liu, J. The prevalence of diabetes mellitus among rural residents with different ethnicity in Gansu Province. Chin. Prev. Med. 2018, 19, 266–271. [Google Scholar]
- Zhang, Q.; Ling, H.; Ying, C.; Zhao, M.; Wang, H.; Lv, X.; Li, W. Analyzing the morbidities and risk factors of diabetes mellitus and impaired glucose regulation among urban residents in Xuzhou. Chin. J. Prev. Contr. Chron. Dis. 2013, 21, 277–281. [Google Scholar]
- Zhou, Z.; Zheng, D.; Wu, H.; Li, R.; Xu, S.; Kang, Y.; Cao, Y.; Chen, X.; Zhu, Y.; Xu, S.; et al. Epidemiology of infertility in China: A population-based study. BJOG 2018, 125, 432–441. [Google Scholar] [CrossRef] [Green Version]
- Cong, J.; Li, P.; Zheng, L.; Tan, J. Prevalence and Risk Factors of Infertility at a Rural Site of Northern China. PLoS ONE 2016, 11, e0155563. [Google Scholar] [CrossRef] [Green Version]
- Meng, Q.; Ren, A.; Zhang, L.; Liu, J.; Li, Z.; Yang, Y.; Li, R.; Ma, L. Incidence of infertility and risk factors of impaired fecundity among newly married couples in a Chinese population. Reprod Biomed. Online 2015, 30, 92–100. [Google Scholar] [CrossRef] [Green Version]
- Wang, M. Investigation and analysis of the prevalence and related situation of infertility in Beijing from 2016 to 2018. Diet Health 2019, 6, 279–280. [Google Scholar]
- Yu, F.; Luo, S.; Chen, Y.; Wu, C. Investigation and analysis of prevalence and related situation of infertility in Foshan City. Chin. J. Women Child. Health 2015, 6, 49–51. [Google Scholar]
- Cao, Y. An epidemiological survey of infertility of childbearing couple in Jiaxing city. Mod. Chin. Dr. 2012, 50, 25–27. [Google Scholar]
- Qiao, G.; Fang, X.; Bai, T. A current status of infertility prevalence and a study on medical treatment tendency of rural city. Guide China Med. 2012, 10, 4–6. [Google Scholar]
- Xu, A.; Zhang, R.; Zhang, L.; Zhu, L. Status investigation and analysis of influencing factors of infertility in Dali city. Mod. Chin. Dr. 2020, 58, 1–3. [Google Scholar]
- Ou, H.; Liang, Q.; Peng, C. Status and influencing factors of infertility in married couples. Qingdao Med. J. 2017, 49, 379–381. [Google Scholar]
- Lin, L.-P.; Kuan, C.-Y.; Hsu, S.-W.; Lee, T.-N.; Lai, C.-I.; Wu, J.-L.; Lin, J.-D. Outpatient visits and expenditures for children and adolescents diagnosed with autism spectrum disorders and co-occurring intellectual disability: An analysis of the national health insurance claims data. Res. Autism Spectr. Disord. 2013, 7, 1625–1630. [Google Scholar] [CrossRef]
- Chiang, P.H.; Chang, Y.C.; Lin, J.D.; Tung, H.J.; Lin, L.P.; Hsu, S.W. Healthcare utilization and expenditure analysis between individuals with intellectual disabilities and the general population in Taiwan: A population-based nationwide child and adolescent study. Res. Dev. Disabil. 2013, 34, 2485–2492. [Google Scholar] [CrossRef]
- Xu, J.; Nicholas, S.; Wang, J.; Yang, Y. A retrospective analysis of hospital treatment expenditures among young and middle age patients with cancer, 2013-2017 under health reform. Int. J. Health Plan. Manag. 2020, 35, 878–887. [Google Scholar] [CrossRef]
- Yin, X.; Xu, Y.; Man, X.; Liu, L.; Jiang, Y.; Zhao, L.; Cheng, W. Direct costs of both inpatient and outpatient care for all type cancers: The evidence from Beijing, China. Cancer Med. 2019, 8, 3250–3260. [Google Scholar] [CrossRef] [Green Version]
- Liao, X.Z.; Shi, J.F.; Liu, J.S.; Huang, H.Y.; Guo, L.W.; Zhu, X.Y.; Xiao, H.F.; Wang, L.; Bai, Y.N.; Liu, G.X.; et al. Medical and non-medical expenditure for breast cancer diagnosis and treatment in China: A multicenter cross-sectional study. Asia Pac. J. Clin. Oncol. 2018, 14, 167–178. [Google Scholar] [CrossRef]
- Li, X.; Fang, Y.; Wang, M.; Zhang, W. Analysis on the Disease Composition and Cost of Tumor Patients with Chemotherapy of a Hospital in 2015. Chin. Med. Rec. 2017, 18, 63–66. [Google Scholar]
- Bai, Y.; Qu, H.; Pu, H.; Dai, M.; Cheng, N.; Li, H.; Chang, S.; Li, J.; Kang, F.; Hu, X. Cancer burden in the Jinchang cohort. Chin. J. Epidemiol. 2016, 37, 306–310. [Google Scholar]
- Liu, J.; Du, J.; Zou, Q. Analysis of Influencing Factors of Hospitalization Exposure during Breast Cancer Surgery Patients. Chin. Med. Rec. 2015, 16, 49–51. [Google Scholar] [CrossRef] [PubMed]
- Zhang, M. Study on the Economic Burden and Cost-Effectiveness Analysis of Screening in Six Common Cancers. Ph.D. Thesis, Lanzhou University, Lanzhou, China, 2014. [Google Scholar]
- Bao, J. Research on the Economic Burden of Six Common Cancers in Gansu Province. Ph.D. Thesis, Lanzhou University, Lanzhou, China, 2014. [Google Scholar]
- Li, H.; Huang, Y.; Huang, R.; Li, J. Standard treatment cost of female breast cancer at different TNM stages. Chin. J. Oncol. 2013, 35, 946–950. [Google Scholar]
- Wang, M.; Hu, X.; Zheng, S.; Kou, J.; Lu, Y.; Zhang, R.; Wan, X.; Li, X.; Yang, L.; Bai, Y. Analysis of direct medical expenses of common malignant tumors in the reproductive system of elderly women. Chin. J. Gerontol. 2010, 30, 3551–3553. [Google Scholar]
- Lv, L. The Efficacy Analysis of the Community-based Screening Program in the Consequences and Costs for Breast Cancer Treatment. Ph.D. Thesis, Fudan University, Shanghai, China, 2010. [Google Scholar]
- Sun, J. Estimation of the Burden of Malignant Neoplasms in Shandong Province. Ph.D. Thesis, Shandong University, Jinan, China, 2008. [Google Scholar]
- Hu, J.; Wei, Y.; Zhou, Z. Analysis on the Effect of First Round Price Adjustment of Medical Service in Wenzhou. Health Econ. Res. 2020, 37, 17–20. [Google Scholar]
- Hao, W.; Zhang, X.; Yu, Y.; Zhao, J.; Ge, Z.; Ding, B.; Sun, X.; Liu, H.; Wen, S.; You, J. Clinical significance and cost-benefit analysis of serum calcitonin assay in diagnosis and treatment of medullary thyroid carcinoma. Chin. J. Otorhinolaryngol. Head Neck Surg. 2019, 54, 506–509. [Google Scholar]
- Chen, D.; Liu, S.; Tan, X.; Zhao, Q. Assessment of hospital length of stay and direct costs of type 2 diabetes in Hubei Province, China. BMC Health Serv. Res. 2017, 17, 199. [Google Scholar] [CrossRef] [Green Version]
- Huang, Y.; Vemer, P.; Zhu, J.; Postma, M.J.; Chen, W. Economic Burden in Chinese Patients with Diabetes Mellitus Using Electronic Insurance Claims Data. PLoS ONE 2016, 11, e0159297. [Google Scholar] [CrossRef]
- Le, C.; Lin, L.; Jun, D.; Jianhui, H.; Keying, Z.; Wenlong, C.; Ying, S.; Tao, W. The economic burden of type 2 diabetes mellitus in rural southwest China. Int. J. Cardiol. 2013, 165, 273–277. [Google Scholar] [CrossRef]
- Li, H.F.; Cai, L.; Golden, A.R. Short-Term Trends in Economic Burden and Catastrophic Costs of Type 2 Diabetes Mellitus in Rural Southwest China. J. Diabetes Res. 2019, 2019, 9626413. [Google Scholar] [CrossRef] [Green Version]
- Wang, W.; Fu, C.W.; Pan, C.Y.; Chen, W.; Zhan, S.; Luan, R.; Tan, A.; Liu, Z.; Xu, B. How do type 2 diabetes mellitus-related chronic complications impact direct medical cost in four major cities of urban China? Value Health 2009, 12, 923–929. [Google Scholar] [CrossRef]
- Chen, X.; Tang, L.; Chen, H.; Zhao, L.; Hu, S. Accessing the impact of complications on the costs of Type 2 diabetes in urban China. Chin. J. Diabetes 2003, 11, 238–241. [Google Scholar]
- Dong, W.; Lou, Q.; Wu, L.; Wu, H.; Mao, F.; Jiang, Y.; Zhang, S.; Qi, L.; Zhang, Y.; Ma, S. Direct economic burden of type 2 diabetes mellitus and its influencing factors among community patients. Chin. J. Public Health 2019, 35, 1457–1460. [Google Scholar]
- Guo, Z.; Shi, W.; Ma, M.; Yang, L.; Liu, Y. A study on the prevalence and economic burden of disease of hypertension and diabetes in Guilin City. Chin. J. Dis. Control Prev. 2015, 19, 887–889+893. [Google Scholar]
- He, R.; Cai, L.; Dong, J.; Tao, J.; Zhang, S. Analysis of the prevalence and Economic Burden of Diabetes in Guandu District of Kunming. J. Kunming Med. Univ. 2014, 35, 12–14. [Google Scholar]
- Li, Q.; Zhou, S.; Chen, P.; Wu, L. Study on the Economic Burden of Diabetic Diseases in Shenzhen. Health Econ. Res. 2021, 38, 63–66. [Google Scholar]
- Lin, M.; Jia, X.; Chen, S. Analysis medical cost on influential factor of old age diabetic in Chengdu region. Sichuan Med. J. 2010, 31, 1014–1016. [Google Scholar]
- Liu, G.; Cai, L.; Shu, Z.; Ye, Y.; Feng, R.; Zhao, K.; He, J.; Mao, H. Analysis of Economic Burden of diabetes in Luoping Country of Yunnan Province. Mod. Prev. Med. 2012, 39, 799–800+805. [Google Scholar]
- Ming, X.; Yang, L.; Sun, Q.; Haung, S.; Wang, M.; Wei, H. The Disease Economic Burden and Influence of Diabetes in Sichuan Province. Health Econ. Res. 2019, 36, 29–31+37. [Google Scholar]
- Qin, J.; Zhang, Y.; Zhang, L.; Rui, D.; Mao, L.; Wang, L.; Wu, N. Prevalence of non-communicable diseases and economic burden of patients in 8 typical cities. Chin. J. Public Health 2014, 30, 5–7. [Google Scholar]
- Qiu, Y.; Ye, L.; Li, X.; Lu, W. Economic burden of type 2 diabetes mellitus in Shanghai. Chin. Health Resour. 2005, 69–71. [Google Scholar]
- Wang, J.; Liu, Z.; Wang, W.; Fu, C.; Xu, B. Cost of illness in outpatient visit with type 2 diabetes mellitus in Shanghai. Chin. Health Resour. 2008, 3, 127–129. [Google Scholar]
- Wang, X.; Hu, D.; Zhu, Y.; Shi, F.; Guo, H. An Empirical Study on the Economic Burden of Diabetes in Jiangsu Province. Chin. Prim. Health Care 2020, 34, 5–9. [Google Scholar]
- Xiang, Y.; Wei, S.; Su, J.; Song, P.; Zhao, R.; Xie, Y. Analysis on epidemiological characteristics and economic burden of chronic disease among adults in Futian District, Shenzhen. Mod. Prev. Med. 2015, 42, 3169–3171. [Google Scholar]
- Zhang, K.; Jiang, L.; Qiu, X.; Li, C. Study on the direct economic burden of diseases about middle-aged and old patient with chronic diseases in Nanjing. Jiangsu Prev. Med. 2009, 20, 4–7. [Google Scholar]
- Zhang, Z.; Chen, J.; Tang, Z.; Hu, R.; Lu, B. Study on direct health expenditure of diabetes mellitus in China. Chin. Health Resour. 2007, 162–163+168. [Google Scholar]
- Zheng, Y.; Wu, J.; Chen, Z.; Wang, Y.; Sun, H. Economic burden and influencing factors of insured patients with type 2 diabetes mellitus in Hedong District of Tianjin. Chin. J. Health Stat. 2013, 30, 904–906. [Google Scholar]
- Li, Q.; Cai, L.; Cui, W.; Wang, G.; He, J.; Golden, A.R. Economic burden of obesity and four obesity-related chronic diseases in rural Yunnan Province, China. Public Health 2018, 164, 91–98. [Google Scholar] [CrossRef]
- Popkin, B.M.; Kim, S.; Rusev, E.R.; Du, S.; Zizza, C. Measuring the full economic costs of diet, physical activity and obesity-related chronic diseases. Obes. Rev. 2006, 7, 271–293. [Google Scholar] [CrossRef]
- Qin, X.; Pan, J. The Medical Cost Attributable to Obesity and Overweight in China: Estimation Based on Longitudinal Surveys. Health Econ. 2016, 25, 1291–1311. [Google Scholar] [CrossRef]
- Zhang, J.; Shi, X.; Liang, X. Economic costs of both overweight and obesity among Chinese urban and rural residents, in 2010. Chin. J. Epidemiol. 2013, 34, 598–600. [Google Scholar]
- Zhao, W.; Zhai, Y.; Hu, J.; Wang, J.; Yang, Z.; Kong, L.; Chen, C. Economic burden of obesity related chronic diseases in China. Chin. J. Epidemiol. 2006, 555–559. [Google Scholar] [CrossRef] [PubMed]
- Zheng, X.; Qiu, Y. Disease burden of infertility in China. Chin. J. Public Health 2012, 28, 257–260. [Google Scholar]
Figure 1.
(A) Spatial and temporal distribution of PBDE levels in the general Chinese population (ng/g lipid). (B) Spatial and temporal distribution of PAE levels in the general Chinese population (μg/L). Note: The darker the area, the higher the exposure levels (median exposure concentration of PBDEs and PAEs in this area). The regions with gray marks had no data. (China, 2011–2020). Abbreviations: PBDEs, polybrominated diphenyl ethers; PAEs, phthalates.
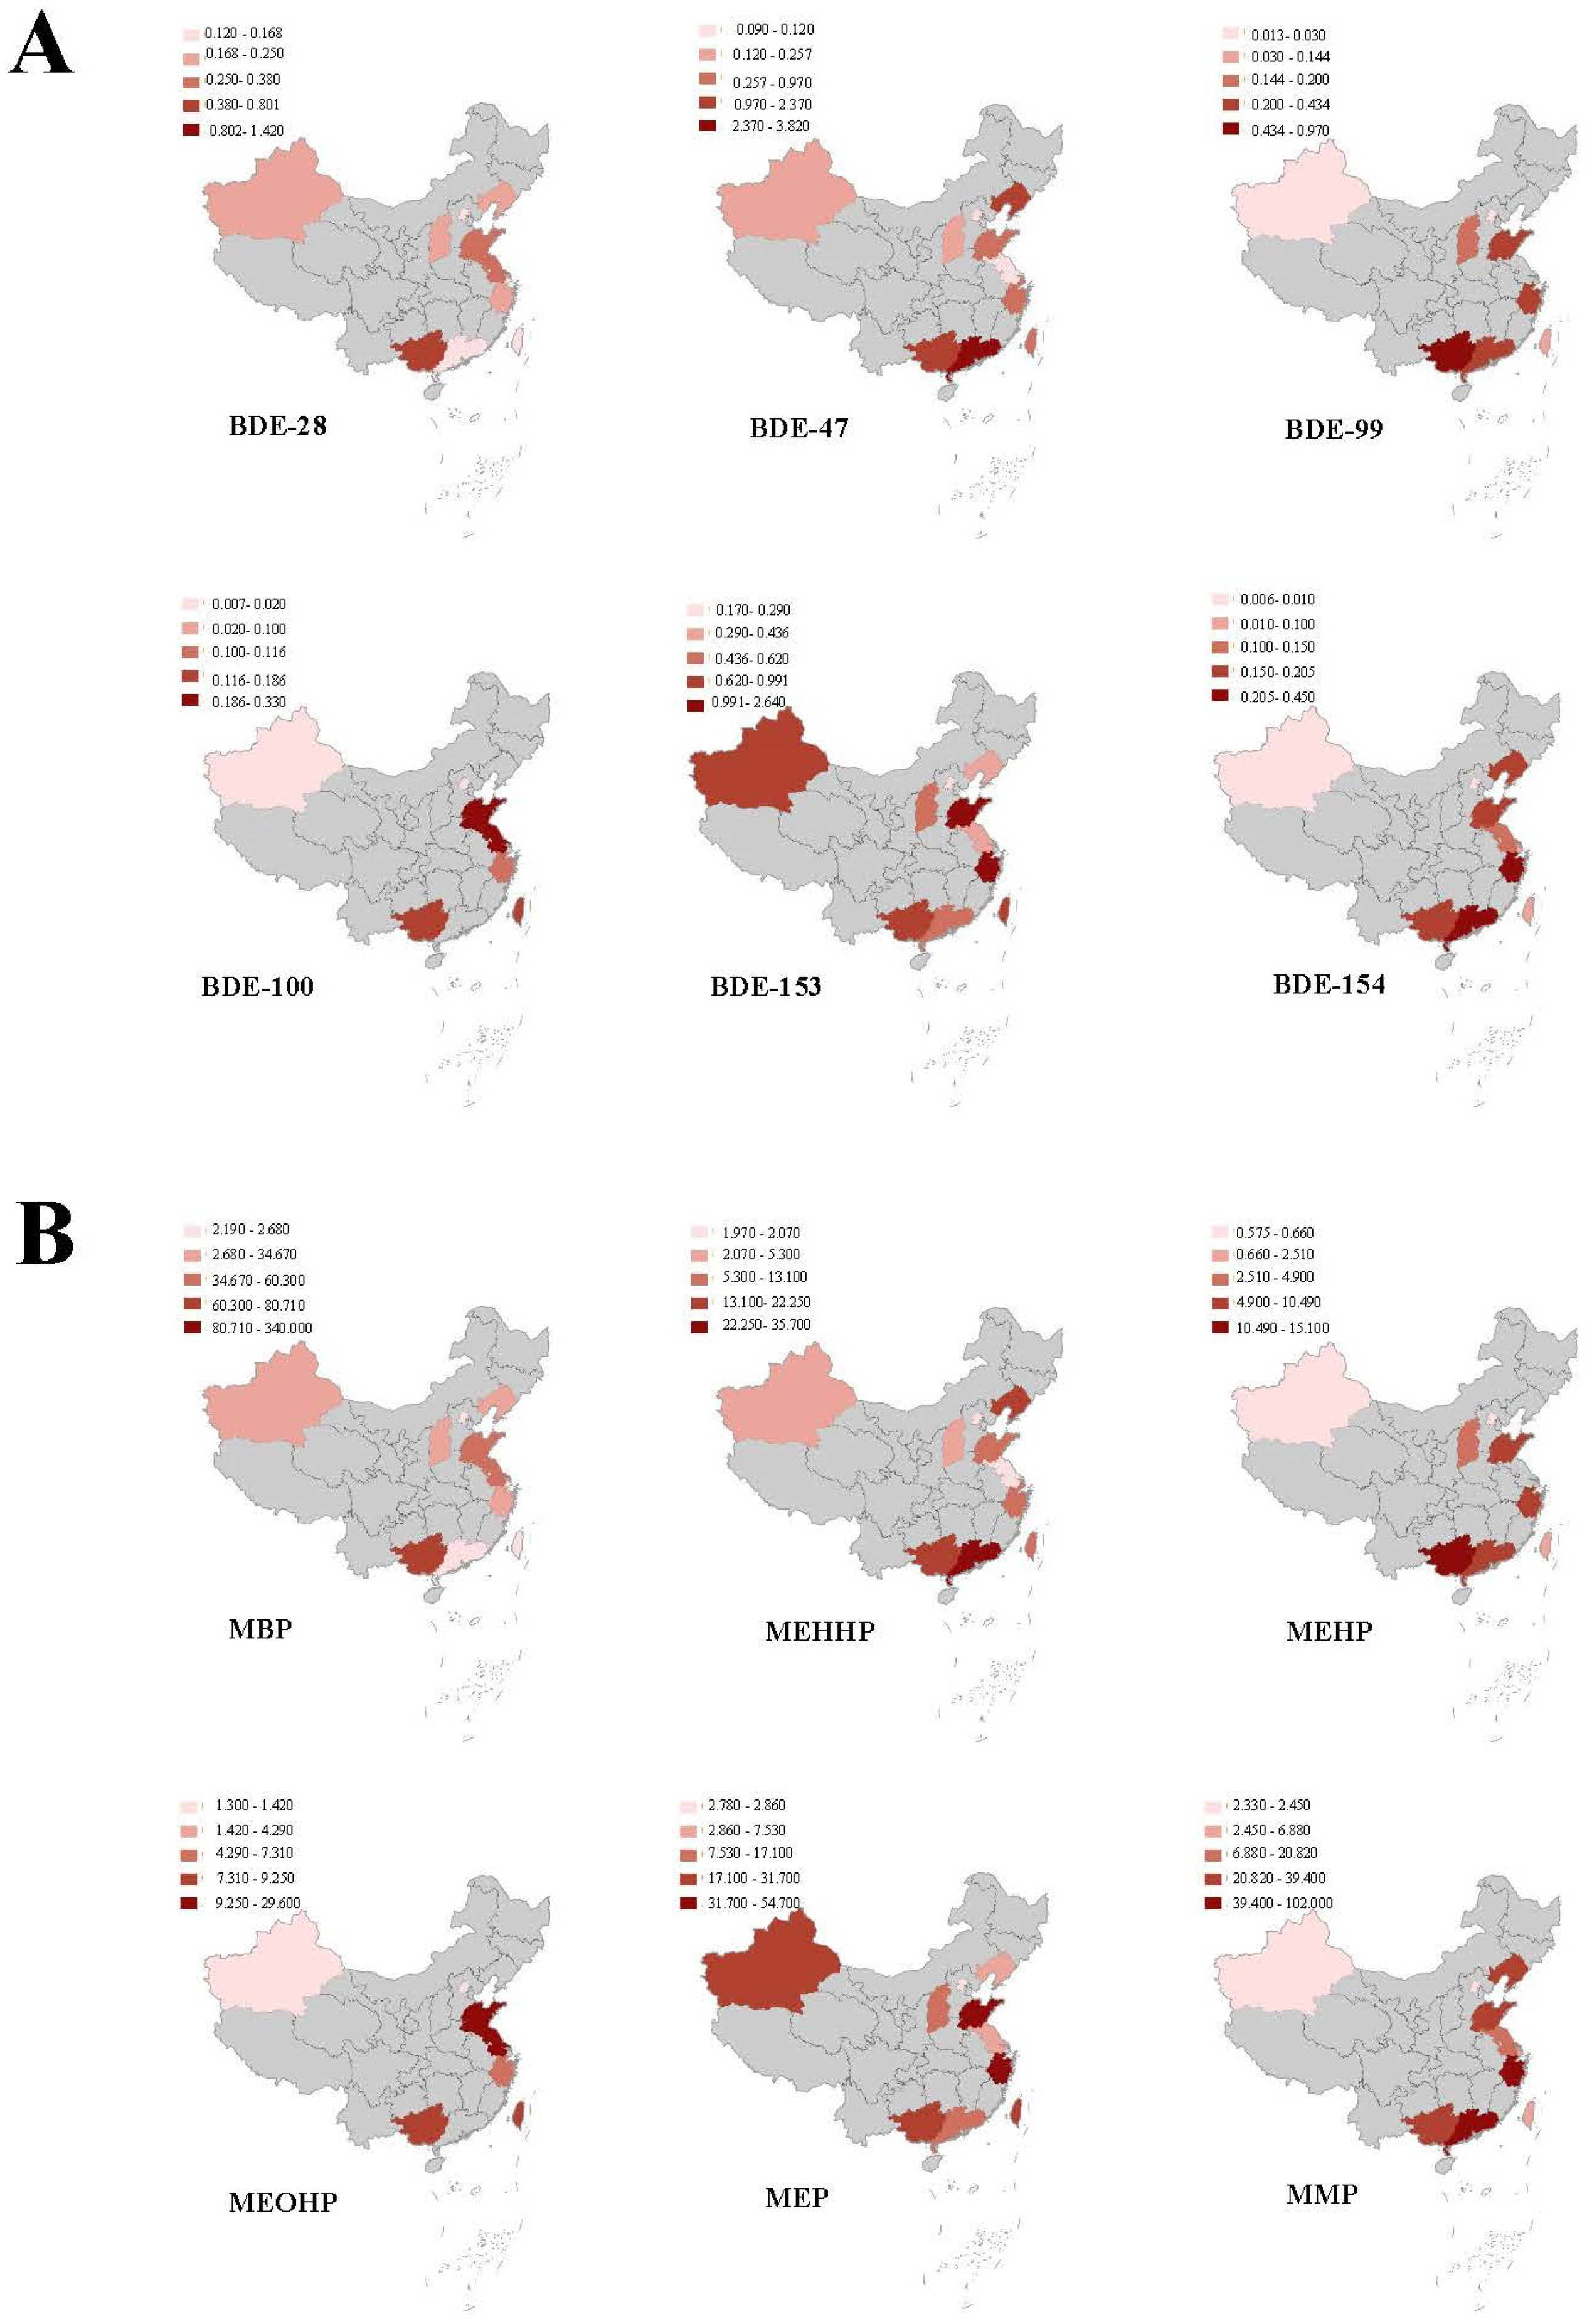

Table 1.
Attributable disease burden caused by PBDEs and PAEs in the general Chinese population in 2015.
Table 1.
Attributable disease burden caused by PBDEs and PAEs in the general Chinese population in 2015.
| EDCs | Health Outcomes | Target Population | Base Case (Ten Thousand) | Low Case | High Case |
|---|---|---|---|---|---|
| PBDEs | Intellectual disability | All neonates | 5.2 | 4.4 | 6.2 |
| Breast cancer | All women | 11.8 | 8.8 | 15.8 | |
| Thyroid cancer | All adults | 60.0 | 17.6 | 204.7 | |
| PAEs | Diabetes | Adults aged 40–59 years | 89.9 | 75.5 | 104.3 |
| Adult obesity | Adults aged 40–59 years | 83.7 | 72.5 | 94.8 | |
| Male infertility | Men aged 20–39 years | 128.9 | 76.4 | 183.7 |
Abbreviations: EDCs, endocrine-disrupting chemicals; PBDEs, polybrominated diphenyl ethers; PAEs, phthalates.
Table 2.
Estimate of costs for disorders associated with PBDE and PAE exposure in the general Chinese population (2015).
Table 2.
Estimate of costs for disorders associated with PBDE and PAE exposure in the general Chinese population (2015).
| Exposure–Response Relationship | Base Estimate (Billion CNY) | Low Estimate | High Estimate |
|---|---|---|---|
| PBDE and intellectual disability | |||
| Direct disease cost | 0.31 | 0.26 | 0.37 |
| Indirect disease cost | - | - | - |
| Intangible disease cost | - | - | - |
| Total disease cost | 0.31 | 0.26 | 0.37 |
| PBDE and breast cancer | |||
| Direct disease cost | 2.24 | 1.67 | 3.00 |
| Indirect disease cost | 0.99 | 0.74 | 1.33 |
| Intangible disease cost | - | - | - |
| Total disease cost | 3.23 | 2.41 | 4.33 |
| PBDE and thyroid cancer | |||
| Direct disease cost | 15.38 | 4.51 | 52.50 |
| Indirect disease cost | - | - | - |
| Intangible disease cost | - | - | - |
| Total disease cost | 15.38 | 4.51 | 52.50 |
| PAE and diabetes | |||
| Direct disease cost | 7.10 | 5.96 | 8.24 |
| Indirect disease cost | 4.08 | 3.42 | 4.73 |
| Intangible disease cost | 4.83 | 4.06 | 5.61 |
| Total disease cost | 16.01 | 13.44 | 18.58 |
| PAE and adult obesity | |||
| Direct disease cost | 0.84 | 0.72 | 0.95 |
| Indirect disease cost | 0.90 | 0.78 | 1.02 |
| Intangible disease cost | - | - | - |
| Total disease cost | 1.73 | 1.50 | 1.97 |
| PAE and male infertility | |||
| Direct disease cost | 30.59 | 18.14 | 43.61 |
| Indirect disease cost | 0.50 | 0.30 | 0.71 |
| Intangible disease cost | 0.36 | 0.22 | 0.52 |
| Total disease cost | 31.46 | 18.66 | 44.84 |
Abbreviations: PBDEs, polybrominated diphenyl ethers; PAEs, phthalates.
Table 3.
Comparison of attributable disease burdens in the general Chinese population in 2010 and 2015.
Table 3.
Comparison of attributable disease burdens in the general Chinese population in 2010 and 2015.
| Exposure–Response Relationship | 2010 | 2015 | ||
|---|---|---|---|---|
| Disease Burden (Thousand) | Economic Costs (Billion CNY) | Disease Burden (Thousand) | Economic Costs (Billion CNY) | |
| PAE and diabetes | 676.1 | 10.92 | 899.0 | 16.01 |
| PAE and adult obesity | 820.1 | 21.66 | 837.0 | 1.73 |
| PAE and male infertility | 1043.2 | 24.62 | 1289.0 | 31.46 |
Abbreviation: PAEs, phthalates.
Table 4.
Comparison of the attributable disease burden between China (2015) and the US, the EU, and Canada (2010).
Table 4.
Comparison of the attributable disease burden between China (2015) and the US, the EU, and Canada (2010).
| Exposure–Response Relationship | US | EU | Canada | China |
|---|---|---|---|---|
| Disease Burden | ||||
| PBDE and intellectual disability | 43,000 cases | 3290 cases | 1610 cases | 52,000 cases |
| PBDE (account for GDP) | 17.98% | 0.65% | 0.47% | 0.005% |
| PAE and diabetes | 1300 cases | 20,500 cases | 225 cases | 899,000 cases |
| PAE and adult obesity | 5900 cases | 53,900 cases | 2093 cases | 837,000 cases |
| PAE and male infertility | 240,100 cases | 618,000 cases | 1395 cases | 1,289,000 cases |
| Total (account for GDP) | 0.29% | 1.44% | 0.19% | 0.72% |
Abbreviations: PBDEs, polybrominated diphenyl ethers; PAEs, phthalates; GDP, Gross Domestic Product.
Publisher’s Note: MDPI stays neutral with regard to jurisdictional claims in published maps and institutional affiliations. |
© 2022 by the authors. Licensee MDPI, Basel, Switzerland. This article is an open access article distributed under the terms and conditions of the Creative Commons Attribution (CC BY) license (https://creativecommons.org/licenses/by/4.0/).
Share and Cite
MDPI and ACS Style
Wang, H.; Zhang, Y. Exposure to Polybrominated Diphenyl Ethers and Phthalates in China: A Disease Burden and Cost Analysis. Toxics 2022, 10, 766. https://doi.org/10.3390/toxics10120766
AMA Style
Wang H, Zhang Y. Exposure to Polybrominated Diphenyl Ethers and Phthalates in China: A Disease Burden and Cost Analysis. Toxics. 2022; 10(12):766. https://doi.org/10.3390/toxics10120766
Chicago/Turabian StyleWang, Hang, and Yunhui Zhang. 2022. "Exposure to Polybrominated Diphenyl Ethers and Phthalates in China: A Disease Burden and Cost Analysis" Toxics 10, no. 12: 766. https://doi.org/10.3390/toxics10120766
Note that from the first issue of 2016, this journal uses article numbers instead of page numbers. See further details here.