Article

A Rapid Method to Noninvasively Measure the Viscoelastic Properties of Synthetic Polymers Using Mechanical Vibrations and Photonics

by
Frederick H. Silver
1,2,*,
Michael Gonzalez-Mercedes
2 and
Arielle Mesica
2
1
Department of Pathology and Laboratory Medicine, Robert Wood Johnson Medical School, Rutgers, The State University of New Jersey, Piscataway, NJ 08854, USA
2
OptoVibronex, LLC., Ben Franklin Tech Partners, Bethlehem, PA 18015, USA
*
Author to whom correspondence should be addressed.
Photonics 2022, 9(12), 925; https://doi.org/10.3390/photonics9120925
Submission received: 20 October 2022 / Revised: 16 November 2022 / Accepted: 26 November 2022 / Published: 1 December 2022
(This article belongs to the Special Issue Recent Advances in Optical Coherence Tomography)

Abstract

:
Noninvasive measurement of the viscoelastic properties of both natural and synthetic polymers is important for the analysis of implant design and performance as well as in industrial material development. In this study, we used vibrational optical coherence tomography (VOCT) to compare the elastic and viscoelastic properties of silicone polymers with standard tensile stress–strain measurements. VOCT uses acoustic vibrations and infrared light to measure the resonant frequency of viscoelastic materials. The elastic modulus was calculated from the in-phase deformation of the material at fixed frequencies using an empirical calibration curve. Viscous loss was measured after pulsing the samples based on the ratio of mechanovibrational peak widths to heights. The results showed that the optimal cure time and modulus values obtained using VOCT were like those obtained using conventional tensile testing. VOCT could capture results that were comparable to conventional testing while not destroying the material, suggesting its usefulness for in vivo and in situ measurements as well as for early quality control environments during end-use application and fabrication experiments. We conclude that VOCT is a new technique that is comparable to conventional testing for noninvasively and nondestructively measuring the viscoelastic properties of polymers.

1. Introduction

The ability to noninvasively measure the mechanical properties of highly viscoelastic polymeric materials, such as silicone and soft tissues, is an important aspect of implant design and tissue characterization. The lack of methods to rapidly characterize engineered commercial products in end-use applications and the need to interpret the behavior of human tissues in vivo are important aspects of material characterization. One example where modulus measurement is important in implant design is to minimize modulus mismatches between the host tissue and implants. This is an important criterion for minimization of vascular and hernia device failures [1]. Beyond implant design, determination of mechanical properties of tissues is needed to diagnose fibrosis of tissues associated with inflammation, wound healing, and tissue diseases [2]. For these reasons, it is important to be able to measure modulus values of implants and tissues in end-use applications.
Uniaxial and multiaxial tensile and compressive tests have been used for decades to determine the viscoelastic properties of polymeric materials and tissues. New characterization methods have been introduced, including microindentation, digital image correlation, circular probe AFM, oscillatory shear deformation, micropipette aspiration, and mechanical wave speed measurement [3,4,5,6,7,8,9,10,11,12,13,14]. These tests are time-consuming, require specialized instrumentation, lack clear calibration methods, and result in irreversible changes to the materials being tested.
Digital image correlation (DIC) and elastography have been used to generate viscoelastic information on several different synthetic polymers. DIC applies axial and transverse creep strains that are then analyzed to generate viscoelastic information [4]. Multimode ultrasound viscoelastography (MUVE) applies focused ultrasound pulses to both generate and capture images of deformations at submillimeter resolution in 3D format [12].
Tissue characterization tests in vitro include indentation and circular probe AFM studies using consecutive creep and oscillation steps [13]. AFM nanoindentation studies [11] and cyclic indentation loading [9] provide information on both cellular and tissue biomechanics. Other methods that have been reported include (1) compressive mechanical tests in unconfined compression [5], (2) oscillatory shear deformation of specimens with a frequency sweep protocol and a strain sweep protocol, (3) simple-shear rheometric studies [8] using grid resolution automated tissue elastography (GRATE), (4) sinusoidal shear displacements [10], (5) rheometric shear studies using a flat steel rotational plate geometry and a flat fixed steel plate [14], and (6) dynamic mechanical analysis in three-point bending [7]. All these tests provide valuable information about implant and tissue viscoelasticity, but the practicality of these tests is bottlenecked by efficiency issues as these tests are time-consuming or have barriers to entry given some of these methods require specialized equipment that is sometimes not commercially available. Other tests require constant calibration, and the substrates tested need to be discarded after destructive testing, which limits the usefulness of the results as they cannot be compared to in vivo environments.
Other limitations of some of these tests include the inability to (1) simply measure the elastic modulus, (2) identify the mechanical properties of individual components of composite materials, (3) rapidly characterize both the elastic and viscoelastic properties, (4) identify cracks or points of stress concentration in processed materials, (4) and noninvasively image and mechanically characterize materials in end-use applications. A noninvasive testing method that does not subject the processed product to external loading would allow one to test the final product without preventing its subsequent use. Even simple uniaxial tensile testing is time-consuming. The technique needs to be modified for materials that are highly viscoelastic, and the value of modulus is strain and strain rate dependent.
The strain rate dependence of the modulus of highly viscoelastic materials can be established by separating the elastic and viscous components of the mechanical response. This is achieved by conducting incremental stress–strain testing [3]. Incremental stress–strain testing involves applying a set deformation and then measuring the initial stress as well as the stress at equilibrium after full relaxation has occurred [3]. The stress at equilibrium divided by the applied strain yields the elastic modulus, while the initial stress minus the equilibrium stress is the stress lost due to molecular rearrangements (viscous loss) [3]. Even incremental stress–strain testing is very time-consuming and is not particularly useful in everyday characterization of materials as the relaxation time may be very long, especially for tissues. In contrast, vibrational optical coherence tomography (VOCT) is a new technique that can be used to rapidly determine the elastic modulus as well as the moduli of the major components of a composite material [15,16,17,18].
VOCT combines vibrational testing and optical coherence tomography to facilitate mechanical testing of highly viscoelastic tissues and synthetic polymers. This technique provides an OCT image of the sample along with measurements of the transverse deformation that results from application of sinusoidal acoustical mechanical waves to the sample. Materials that have been previously characterized using VOCT include silicone rubber, skin, muscle, cartilage, tendon, nerve, vascular tissue, cornea, blood vessels, and skin cancers in vitro and in vivo [15,16,17,18]. The results of VOCT studies include measurement of a mechanovibrational spectrum of the major components of each tissue along with elastic moduli of each component and its relative contribution to the tissue properties [15,16,17,18]. The purpose of this paper is to present new data on the use of VOCT to characterize filled silicone rubber samples. Using VOCT, it is possible to analyze the viscoelastic behavior of both tissues and synthetic polymers.

2. Materials and Methods

2.1. Specimen Preparation

The silicone examined was silicone elastomeric joint sealant (General Electric advanced silicone window and door sealant in white, manufactured by the Henkel Corporation, Rocky Hill, CT, USA). The silicone sealant was placed into 3D-printed molds and allowed to cure for varying periods of time between 3 and 7 days. The 3D molds were shaped to conform with ASTM D638 Type IV dog-bone-shaped test specimen standards. The specimens were simultaneously tested using VOCT and uniaxial incremental strains in tension to test the ability of VOCT to accurately and nondestructively characterize material modulus. To ensure the study was rigorous, 5 specimens were cured for 3 days and 4 specimens each were cured for 5, 7, and 14 days. To standardize the curing protocol, all specimens were allowed to stand in open air at room temperature in the molds and then equilibrated for one hour prior to testing after being removed from the mold.

2.2. Measurement of Tensile Stress–Strain Curves of Silicone in Uniaxial Tension

Specimens were tested in uniaxial tension at 22 °C by adding strain increments after each force measurement as described previously [15,16,17,18]. Varying axial deformations between 10% and 200% were applied through adjustment of a graduated translation stage. The resulting axial force (F) was measured using a force gauge (Series 3 Model M3-100 manufactured by Mark-10 Corporation, Copiague, NY, USA) and recorded for subsequent calculations. Transverse forces were applied to the specimen by positioning an acoustic loudspeaker (A106 Pro, JYM Electronics Co., Ltd., Shajing Town, Shenzhen, China) 2.5 inches from the specimen. An app downloaded on an I5 computer was used to drive the speaker with sinusoidal waveforms at varying frequencies as described previously [15,16,17,18].

2.3. Measurement of Polymer Elastic Modulus (Stiffness) and Sample Image

Optical coherence tomography is a technique that uses infrared light that is reflected to a detector from different depths in a specimen to create an image. By applying an acoustic force and measuring the change in transverse displacement of the specimen as a function of frequency, it is possible to measure the stiffness of tissue components as described previously [15,16,17,18].

2.3.1. OCT Images of Filled Silicone Polymers

OCT image collection was accomplished using a Lumedica Spectral Domain OQ 2.0 Labscope (Lumedica Inc., Durham, NC, USA) operating in the scanning mode at a wavelength of 840 nm. The device generates a 512 × 512 pixel image with a transverse resolution of 15 μm and an A-scan rate of 13,000/s. All grayscale OCT images were color-coded to enhance the image details as described previously [15,16,17,18]. The images were used to locate where the VOCT measurements were made.

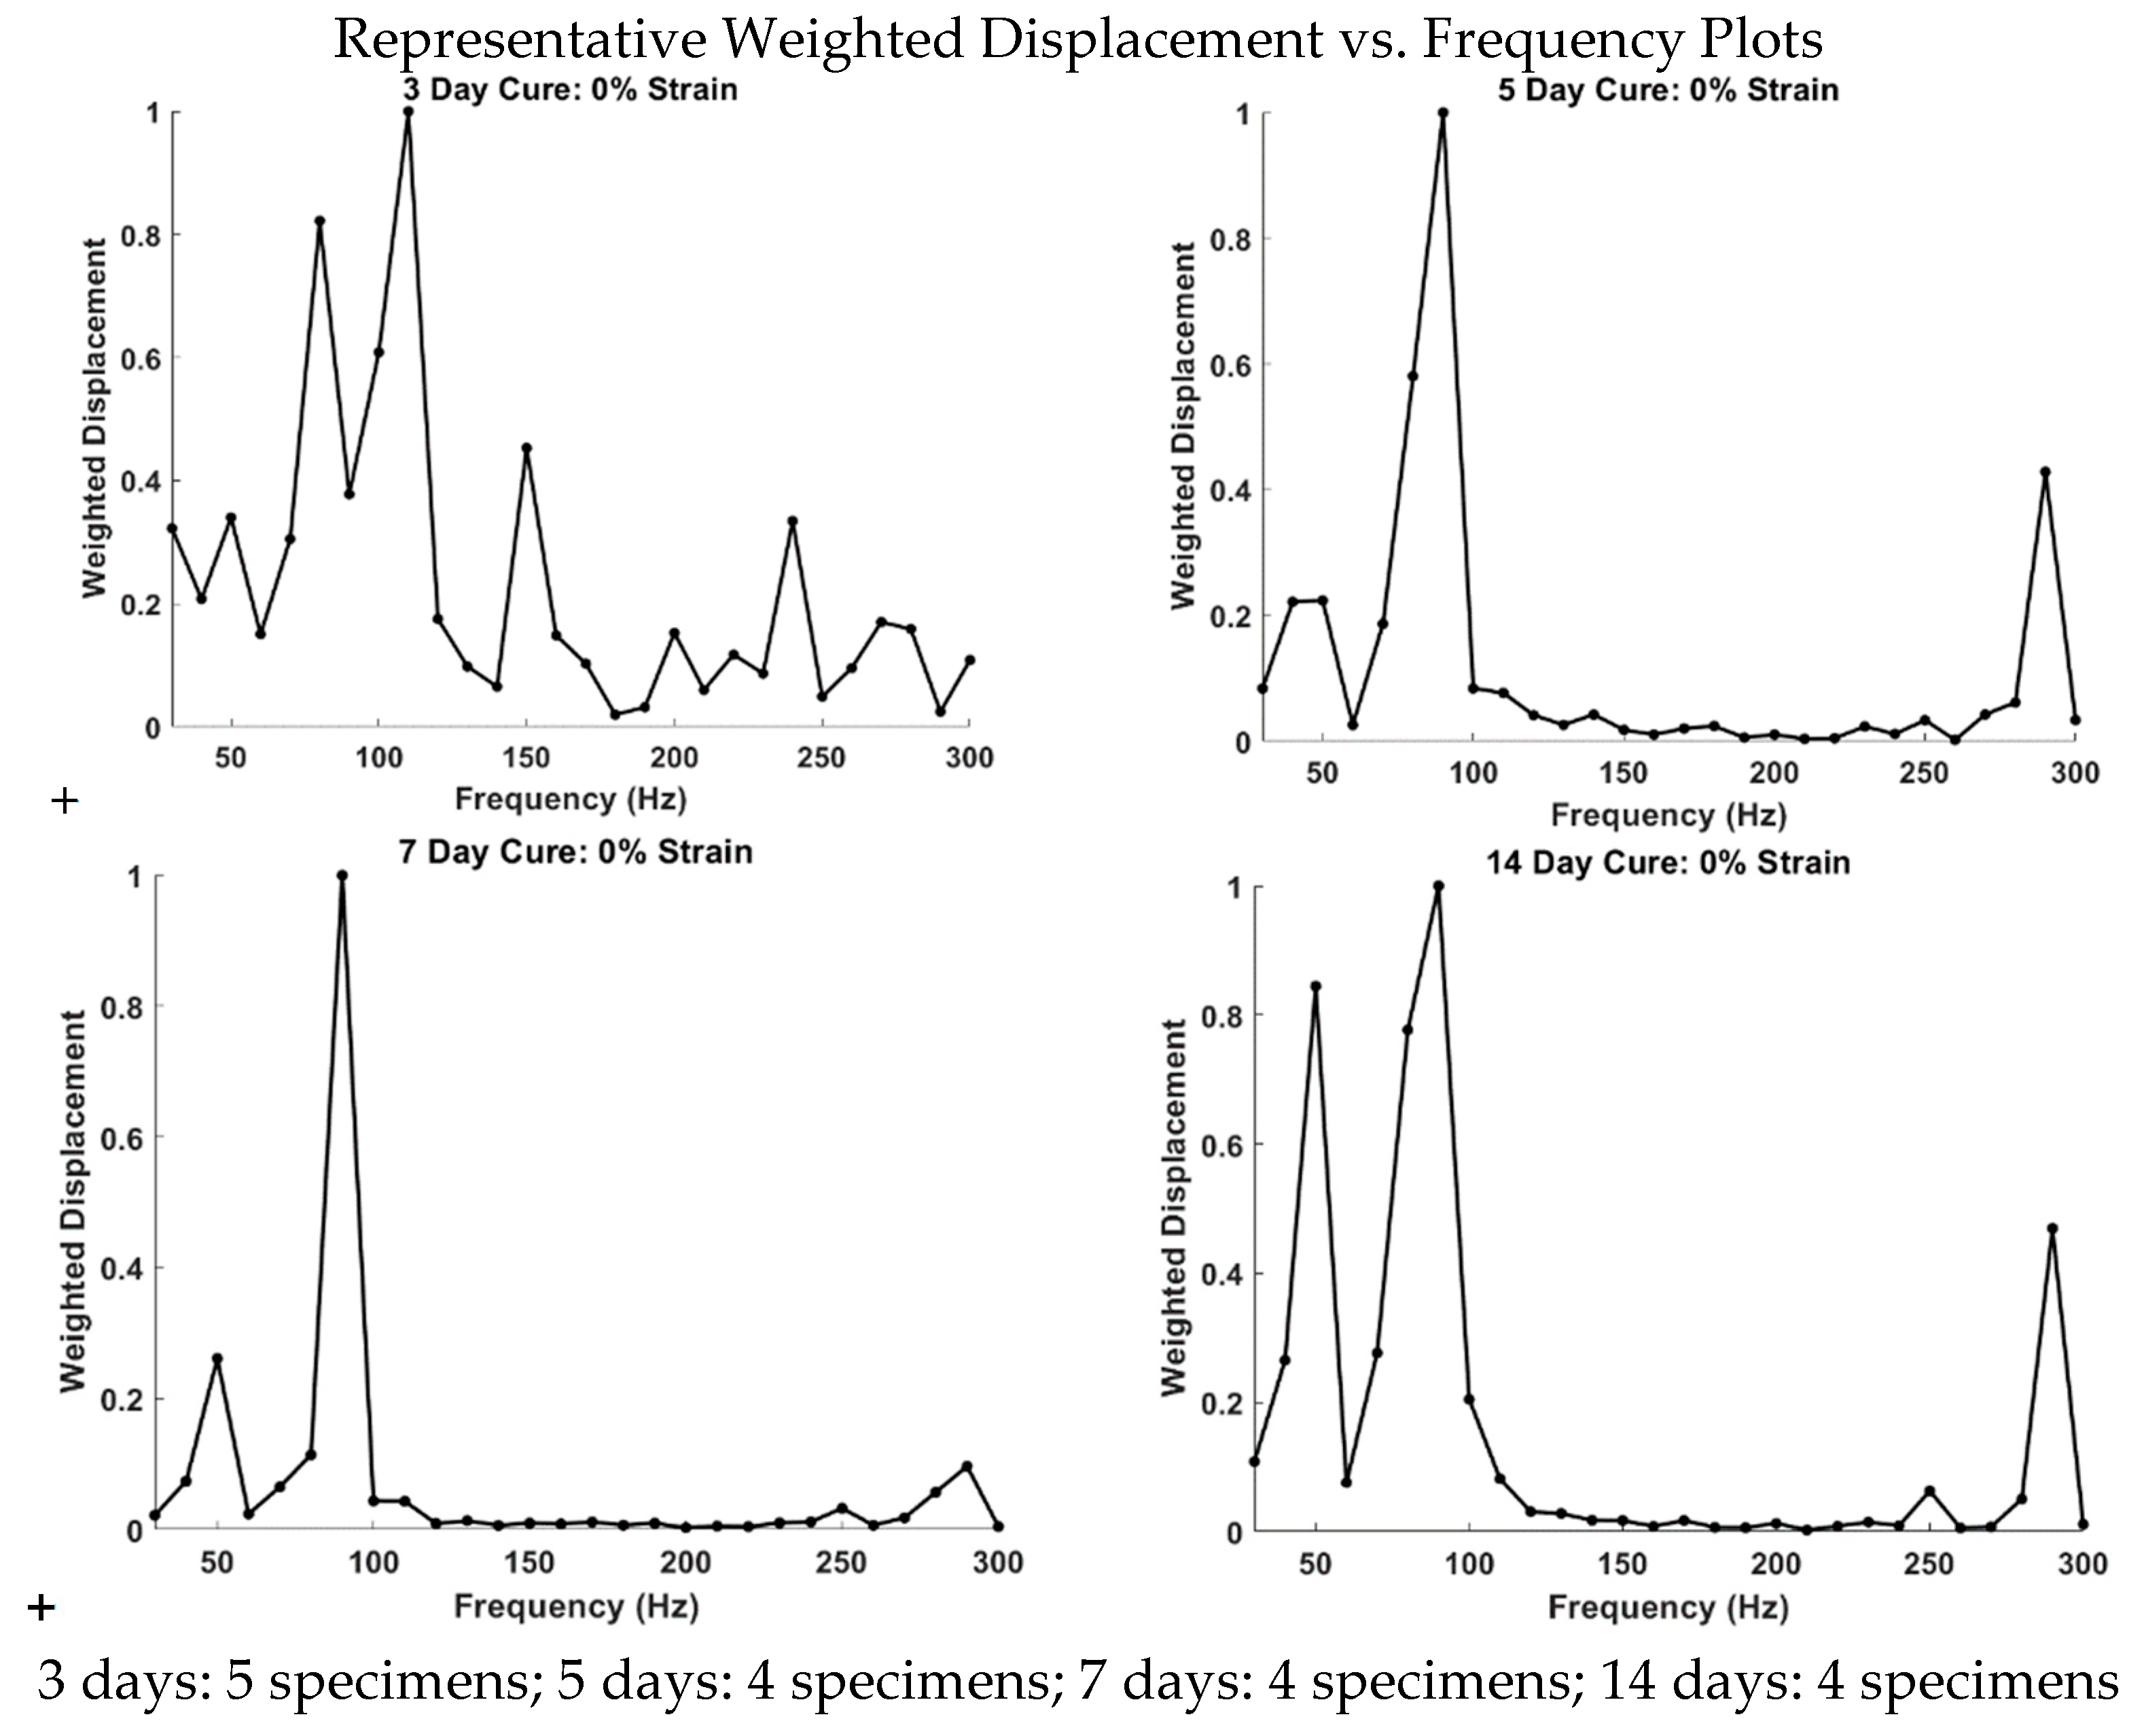
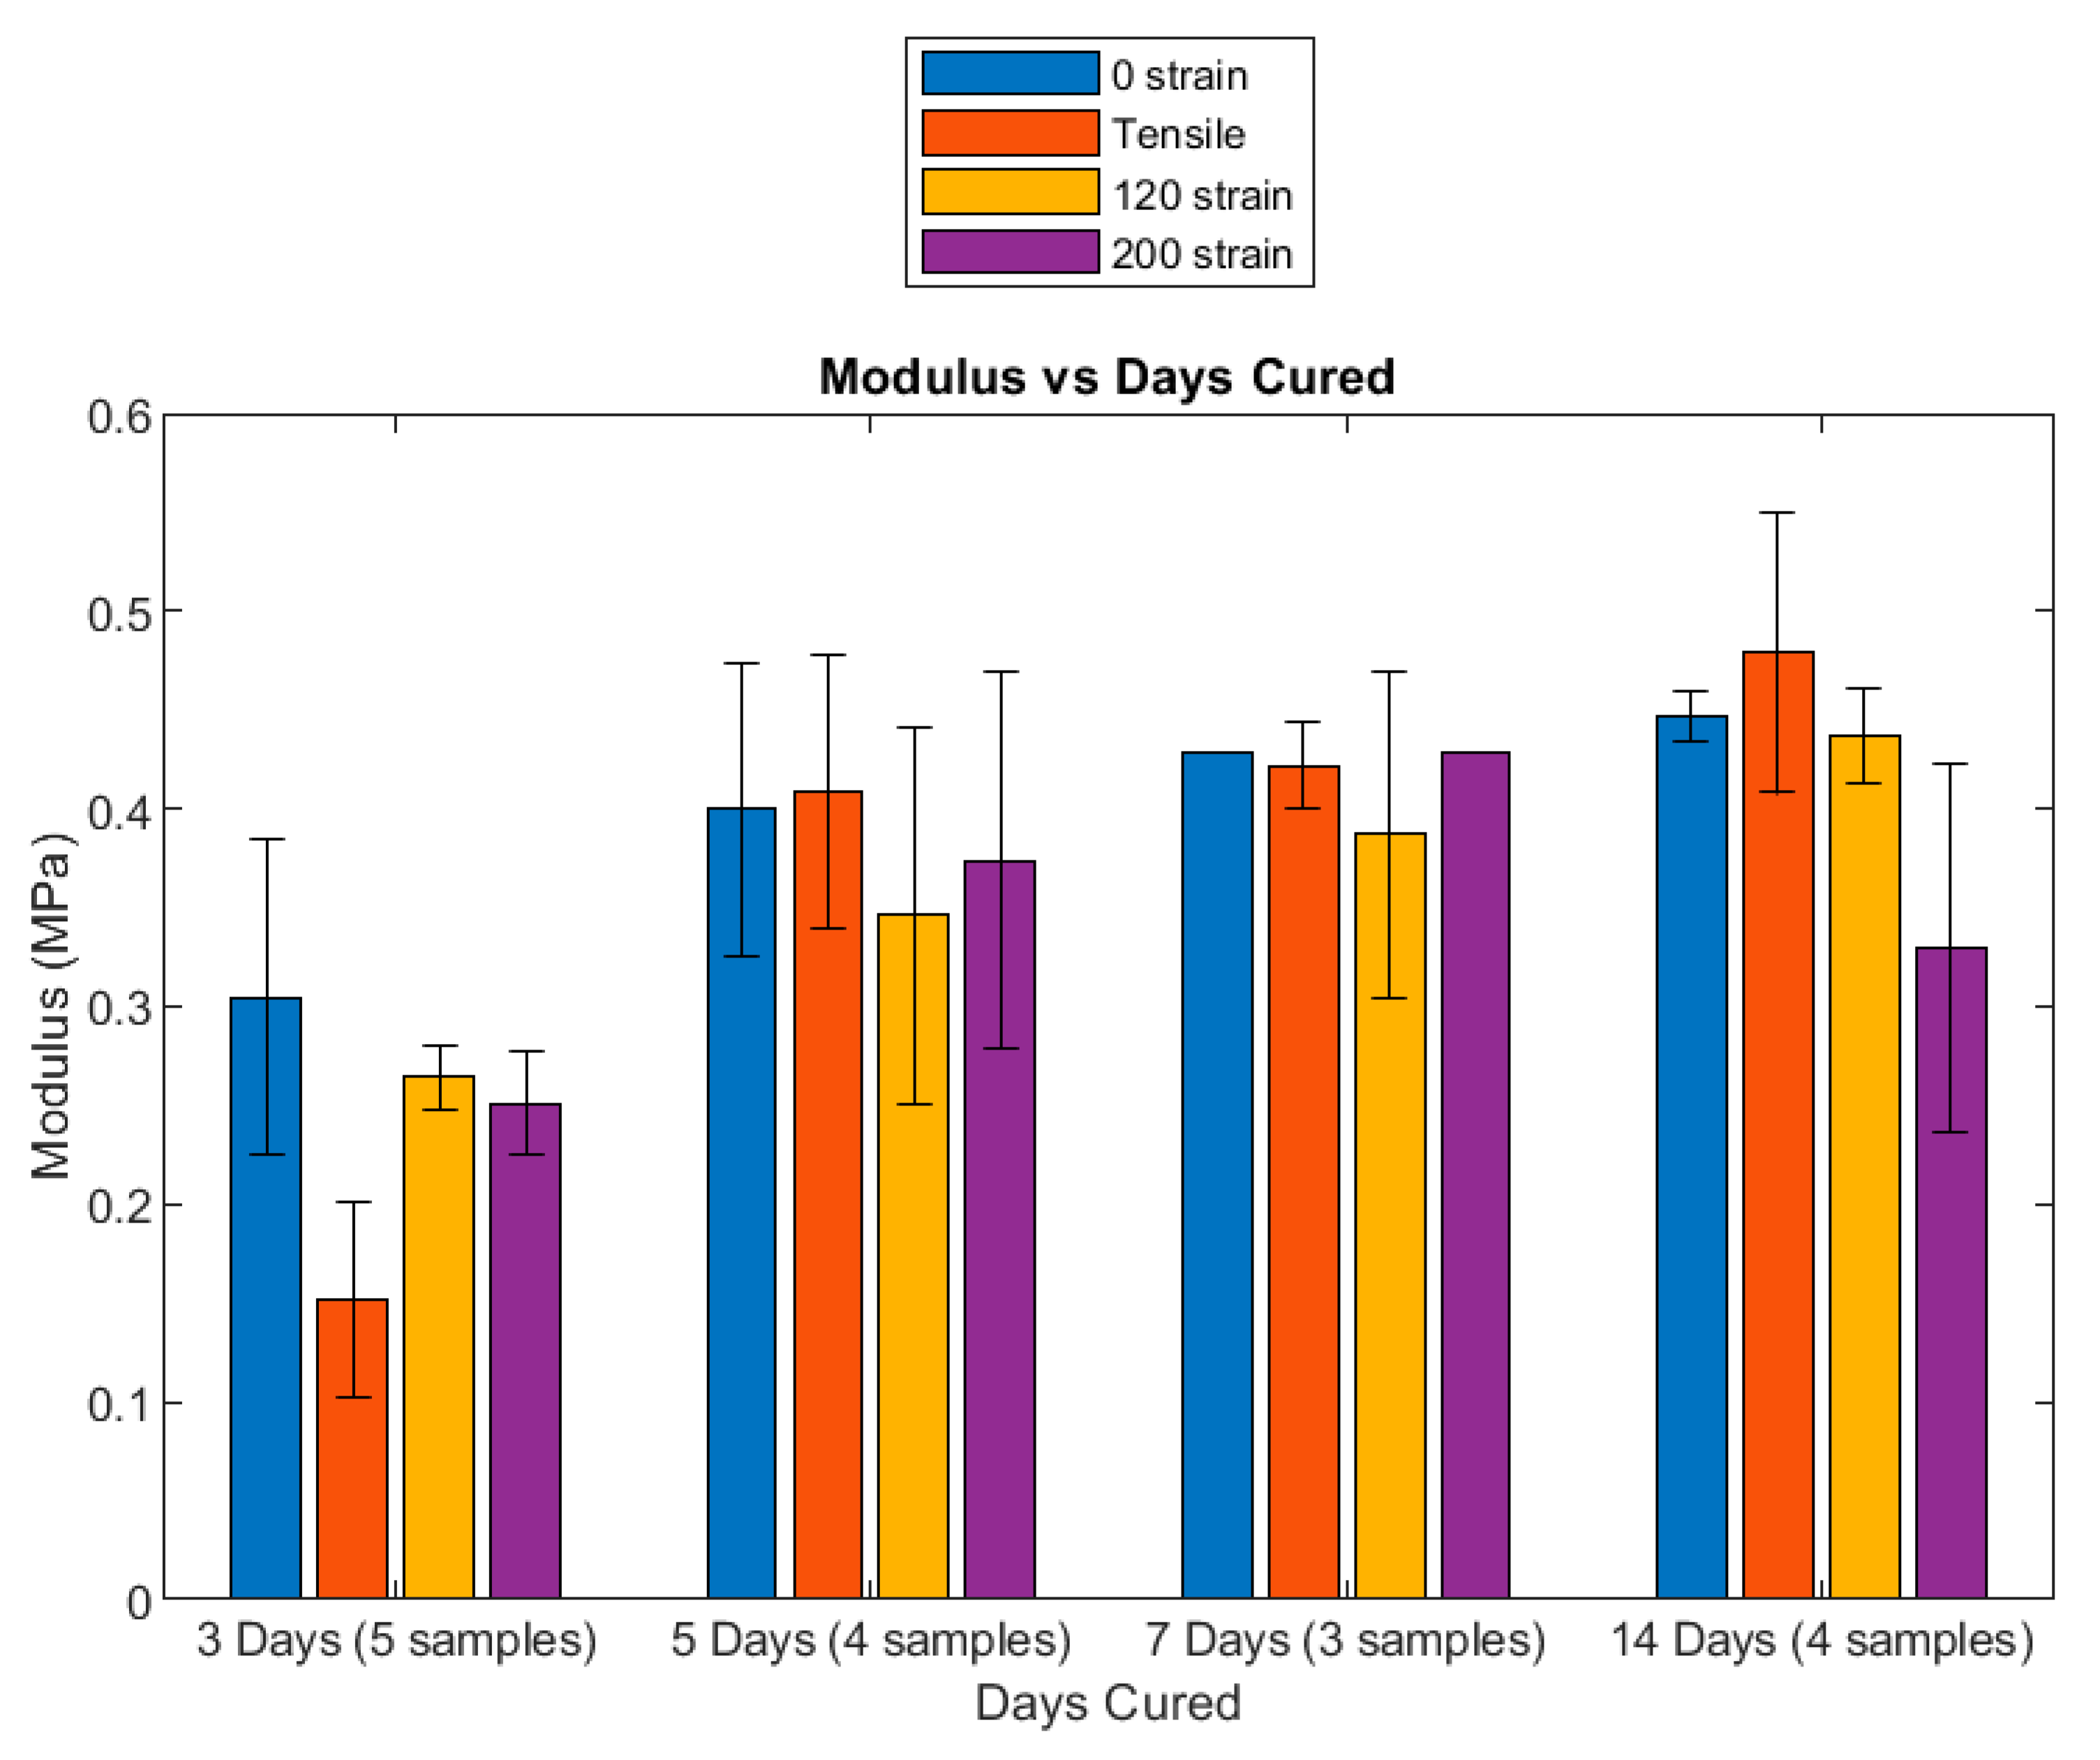
2.3.2. Measurement of Resonant Frequency and the Elastic Modulus

The OQ Labscope was modified by adding a speaker that was 2 inches in diameter to vibrate the tissue at 55 dB SPL in the VOCT studies using a sinusoidal sound wave generated by a tone generator app [9,11]. The Labscope was also modified to collect and store single unprocessed image data that were used to calculate sample displacements (amplitude information) from amplitude line data. Raw OCT image collection was accomplished the Lumedica Spectral Domain OQ 2.0 Labscope (Lumedica Inc., Durham, NC, USA) operating in the fixed point mode. Data were processed using MATLAB software R2020a version 9.8 as discussed previously [15,16,17,18]. The displacement of the tissue was detected by measuring the frequency dependence of the deformation based on the reflected infrared light, and the output signal was filtered to collect only vibrations that were in phase (elastic component) with the sinusoidal sound input. The vibrations for each frequency were collected and stored in the cloud for further analysis as a mechanovibrational spectrum. The mechanovibrational spectral peaks were normalized by dividing by the largest peak in each spectrum to correct for speaker orientation and varying sound levels that occurred during data collection in different samples. Figure 1 contains normalized weighted displacement versus frequency graphs of the silicone specimens at varying cure times. VOCT data of each sample were collected as the displacement of the sample by the applied acoustic sound of known frequency. The data were then passed through a Fourier transform using MATLAB software to determine the frequency at which the samples vibrated.
The resonant frequency of a polymeric material is defined as the frequency at which the maximum in-phase displacement occurs with the input sound in the amplitude data. The measured resonant frequencies were converted into elastic modulus values using a calibration equation (Equation (1)) developed based on in vitro uniaxial mechanical tensile testing and VOCT measurements carried out on the same sample at the same time as reported previously [15]. The resonant frequency of each sample was determined by measuring the displacement of the tissue resulting from transversely applied sinusoidal audible sound driving frequencies ranging from 30 to 300 Hz in steps of 10 Hz. The peak frequency (the resonant frequency), fn, was defined as the frequency at which the displacement was maximized after the vibrations due to the speaker were removed. This relationship is an empirical modification of the general equation relating to resonant frequency of a rod and its longitudinal elastic modulus [19].

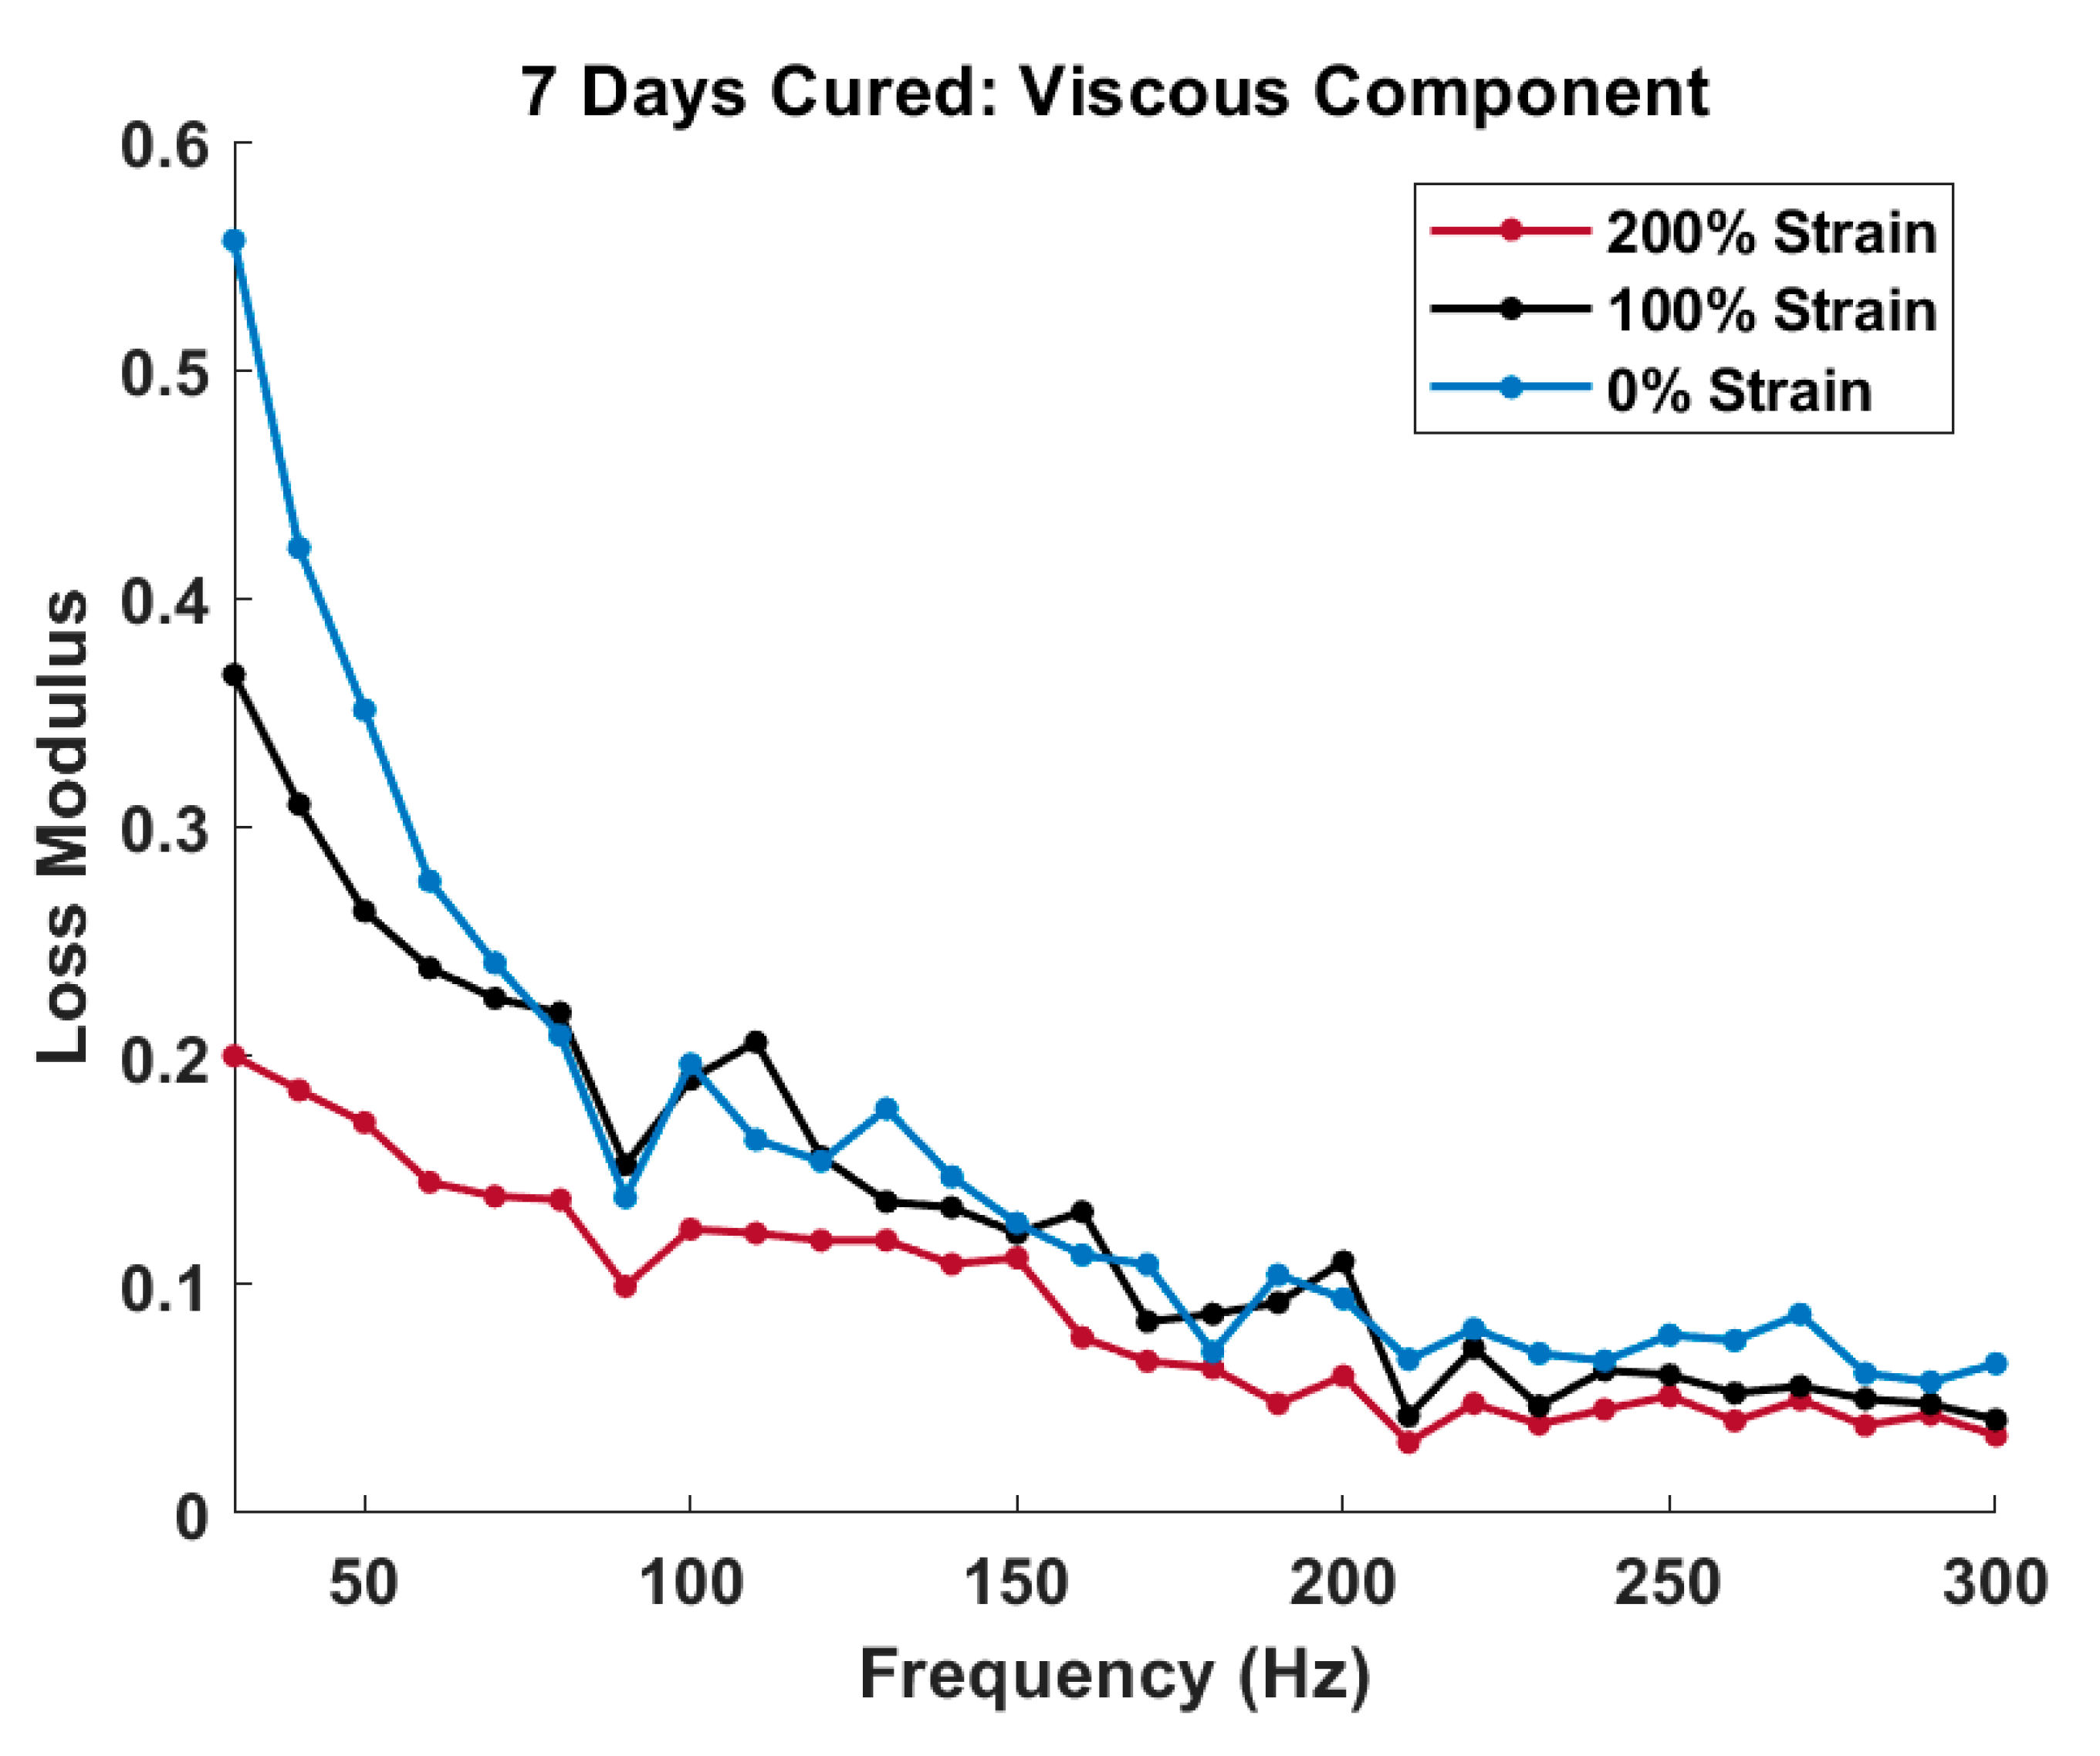
2.3.3. Measurement of Loss Modulus

The viscous component of the modulus measurements was measured as a fraction of the elastic modulus captured using mechanovibrational peaks at each frequency studied. To achieve this, the specimen underwent a variation of the VOCT protocol in which the specimen was subjected to three pulses of audible sound at known frequency from 30 to 300 Hz in steps of 10 Hz. The sample vibrational spectrum was then measured, and the peak heights and widths were analyzed as a function of frequency. The viscous component was captured by dividing the change in frequency at the half-height of the peak, or 3 decibels down from the maximum peak in the power spectrum, by the driving frequency. The viscous component of the elastic modulus was recorded as a fraction. After the samples were subjected to three pulses of sound of known frequency, the viscous component was obtained by dividing the change in frequency at the half height of the peak by the driving frequency. This method is known as the half-height bandwidth method [15,16,17].

2.4. Soft Polymeric Materials

As soft polymers have a density very close to 1.0, Equation (1) is valid for most tissues found in the body and many soft polymers. Here, the thickness (d) is in m and is determined from the OCT and photographic images, fn2 is the square of the resonant frequency, and E is the tensile elastic modulus in MPa as discussed previously [15,16,17,18]. Equation (1) was used to calculate the modulus values.
E*d = 0.0651*fn2 + 233.16

3. Results

VOCT was used to measure the elastic moduli and viscous losses of the silicone sealant specimens at increasing strains in concurrence with uniaxial tensile testing. The specimens were allowed to relax for 90 s between strain increments.
The results showed that regardless of the percent strain, the resonant peaks observed throughout all the data were at 80 ± 10, 150 ± 10, and 240 ± 10 Hz. However, the peaks at 150 ± 10 and 240 ± 10 Hz appeared to be harmonics of the 80 Hz peak and were thus considered multiples of the 80 Hz characteristic peak. The 80 Hz peak denoted the highest average displacement and was therefore referred to as the resonant frequency and used to determine the modulus of the specimen. The level of cure for each specimen was subjected to directly correlated to the amount of crosslinking time in the specimen. The magnitude of the observed peaks in the frequency spectrum and the modulus values obtained with VOCT were used to infer the optimal curing time.

3.1. Characterization of Filled Silicone Polymers

Representative weighted displacement versus frequency plots for all cured specimens at 0% strain were constructed (Figure 1). The optimal curing time for a silicone polymer is affected by a multitude of factors. These factors include intrinsic material characteristics and industry metrics, which can be addressed by VOCT analysis. By assessing the standardized weighted displacement versus frequency plots, the resonant frequency and subsequently the modulus can be obtained. Moreover, by comparing the magnitude of the peaks in each spectrum, the uniformity in crosslinking in each specimen can be deduced as well. The specimens cured for 3 days showed peaks at the resonant frequency and its harmonics (80 ± 10, 160 ± 10, and 240 ± 10 Hz) but also showed peaks at 110 and 270 Hz. The specimens cured for 5 and 7 days showed peaks at the resonant frequency (80 ± 10 Hz) and its harmonic of 240 ± 10 Hz with an additional peak at 290 Hz. The specimens cured for 14 days showed extra peaks at 50 Hz and, like the specimens cured for 5 and 7 days, a peak at 290 Hz. The extra peaks and their magnitude relative to the resonant frequency peak showed that a curing period of 3 or 14 days is not optimal if crosslinking uniformity is essential to the end application. The lack of extra peaks of high magnitude in the specimens cured for 5 and 7 days showed that these curing times were optimal for uniformity in crosslinking.
Figure 2 highlights the ability of VOCT to be used to determine material modulus nondestructively and accurately. A comparison of the modulus values obtained by VOCT and conventional tensile testing showed that the modulus for the specimens cured for 7 days as calculated by VOCT was well within one standard deviation of the tensile test.

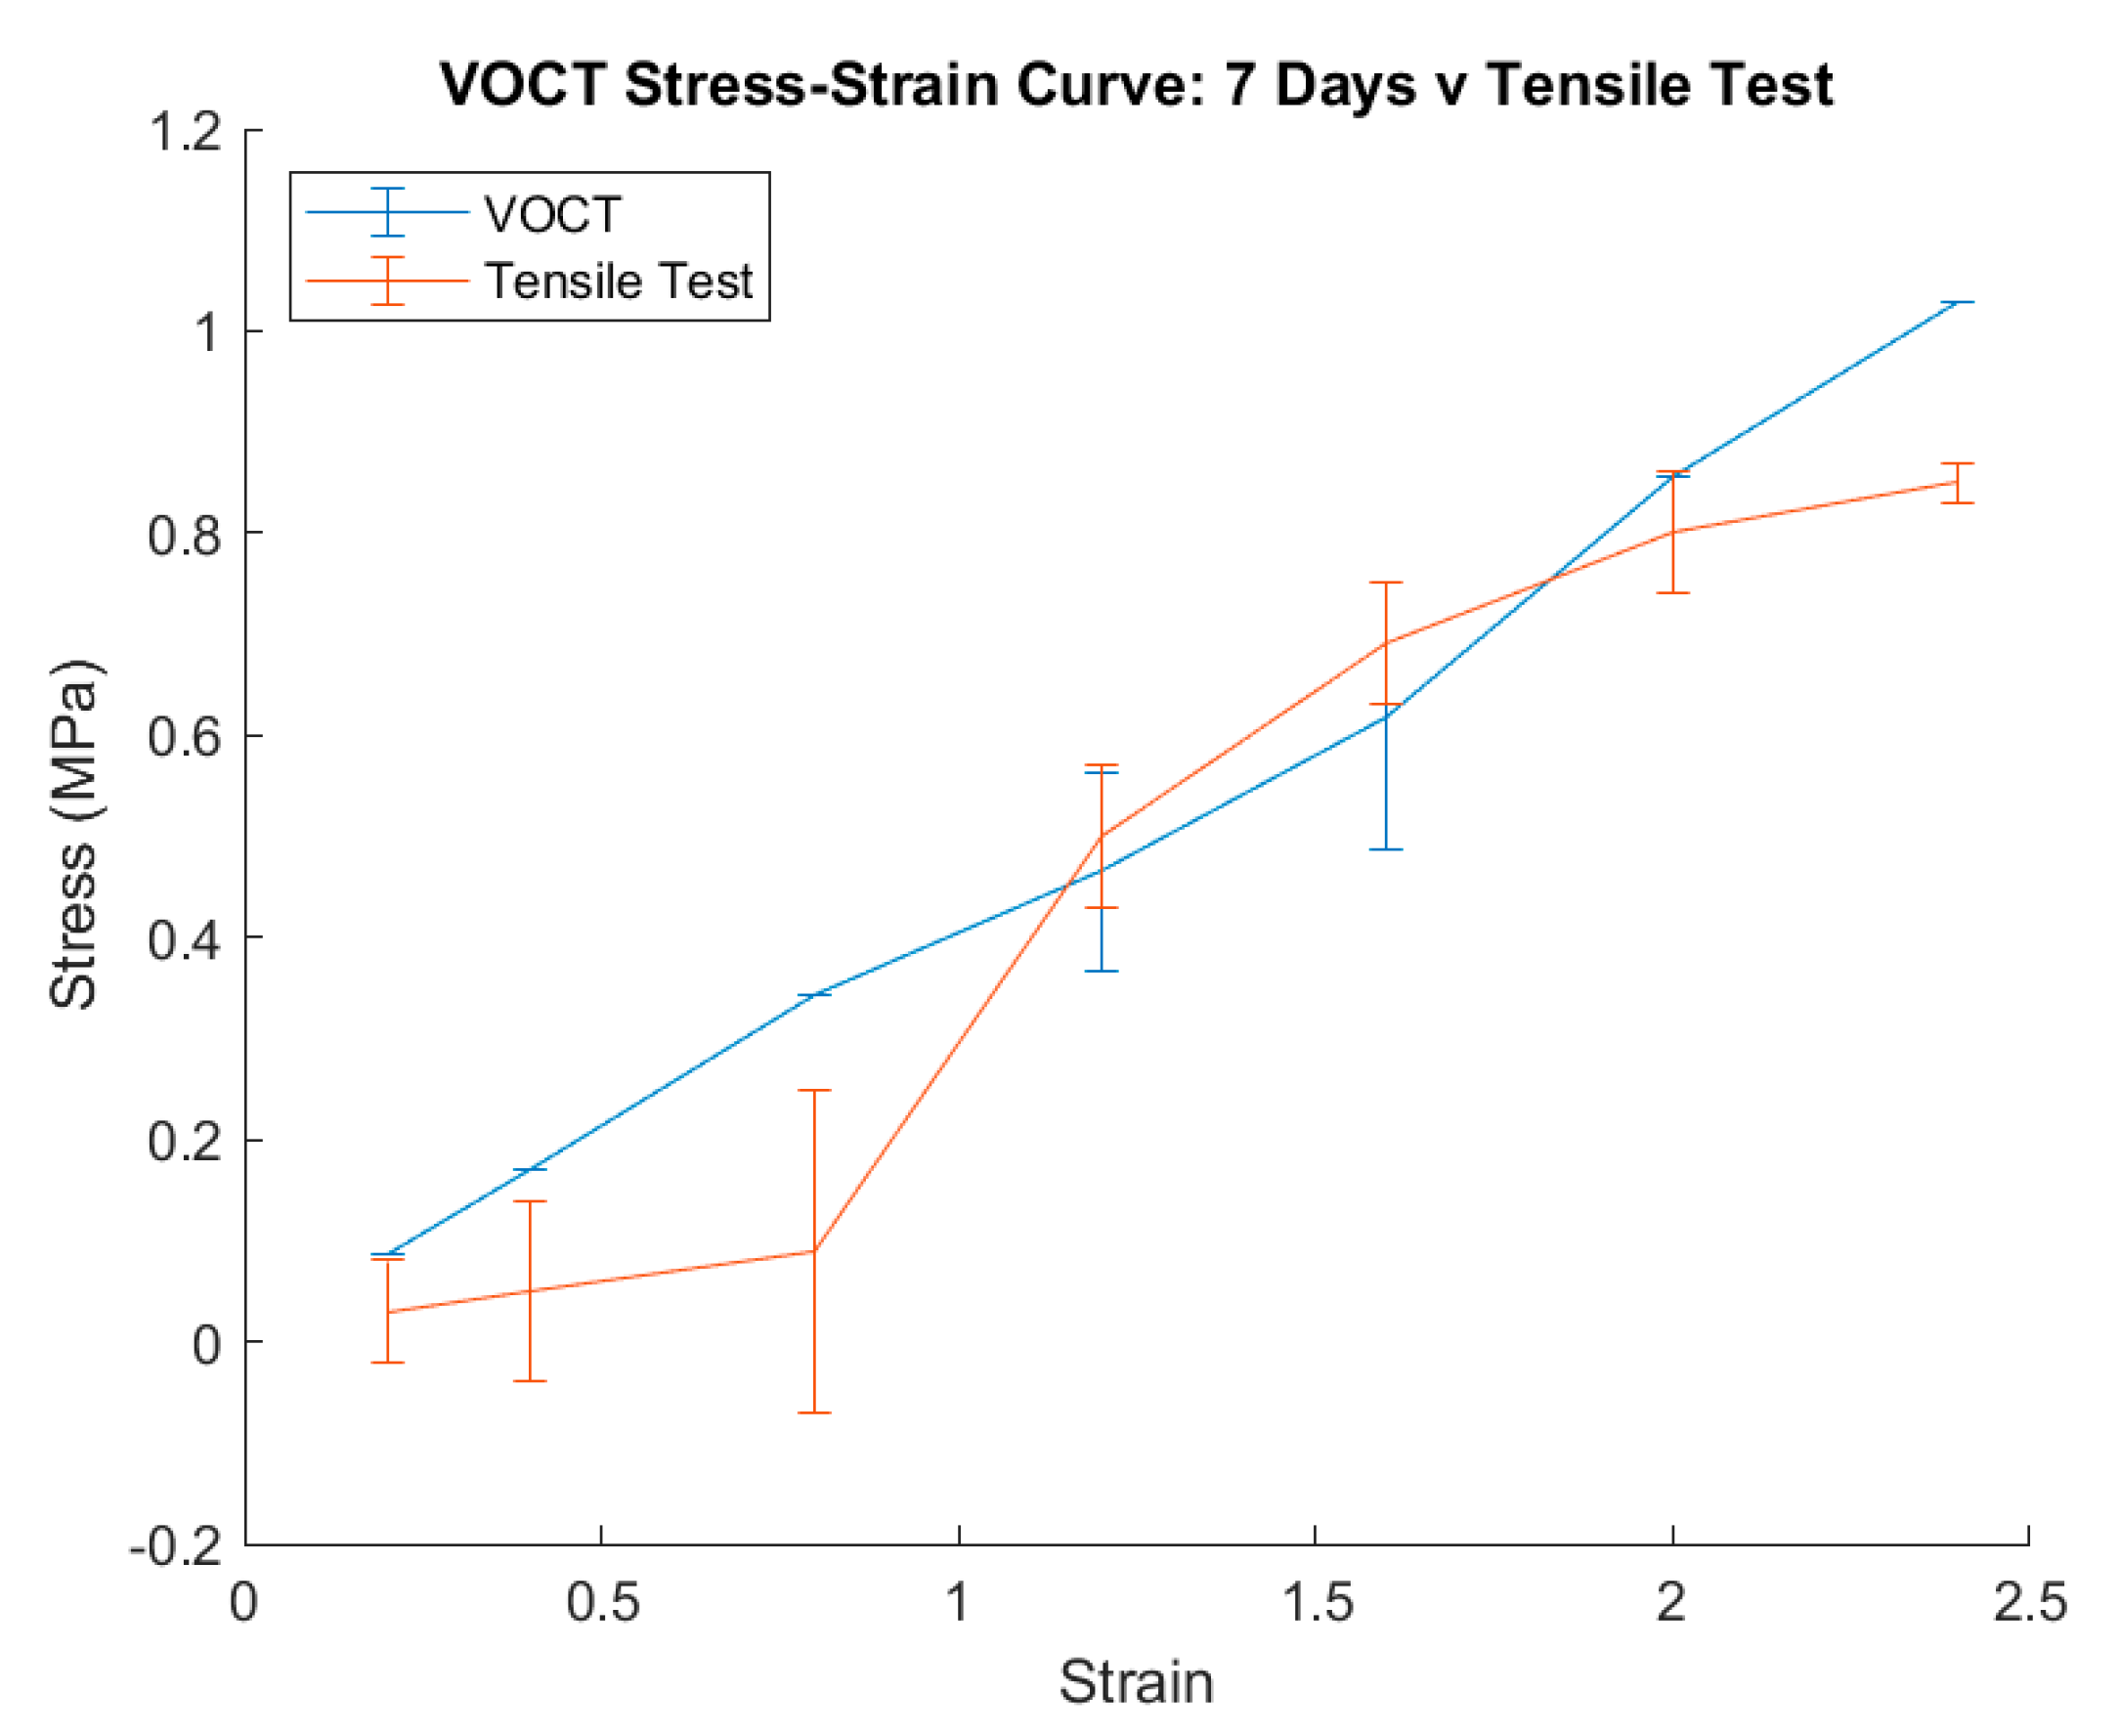
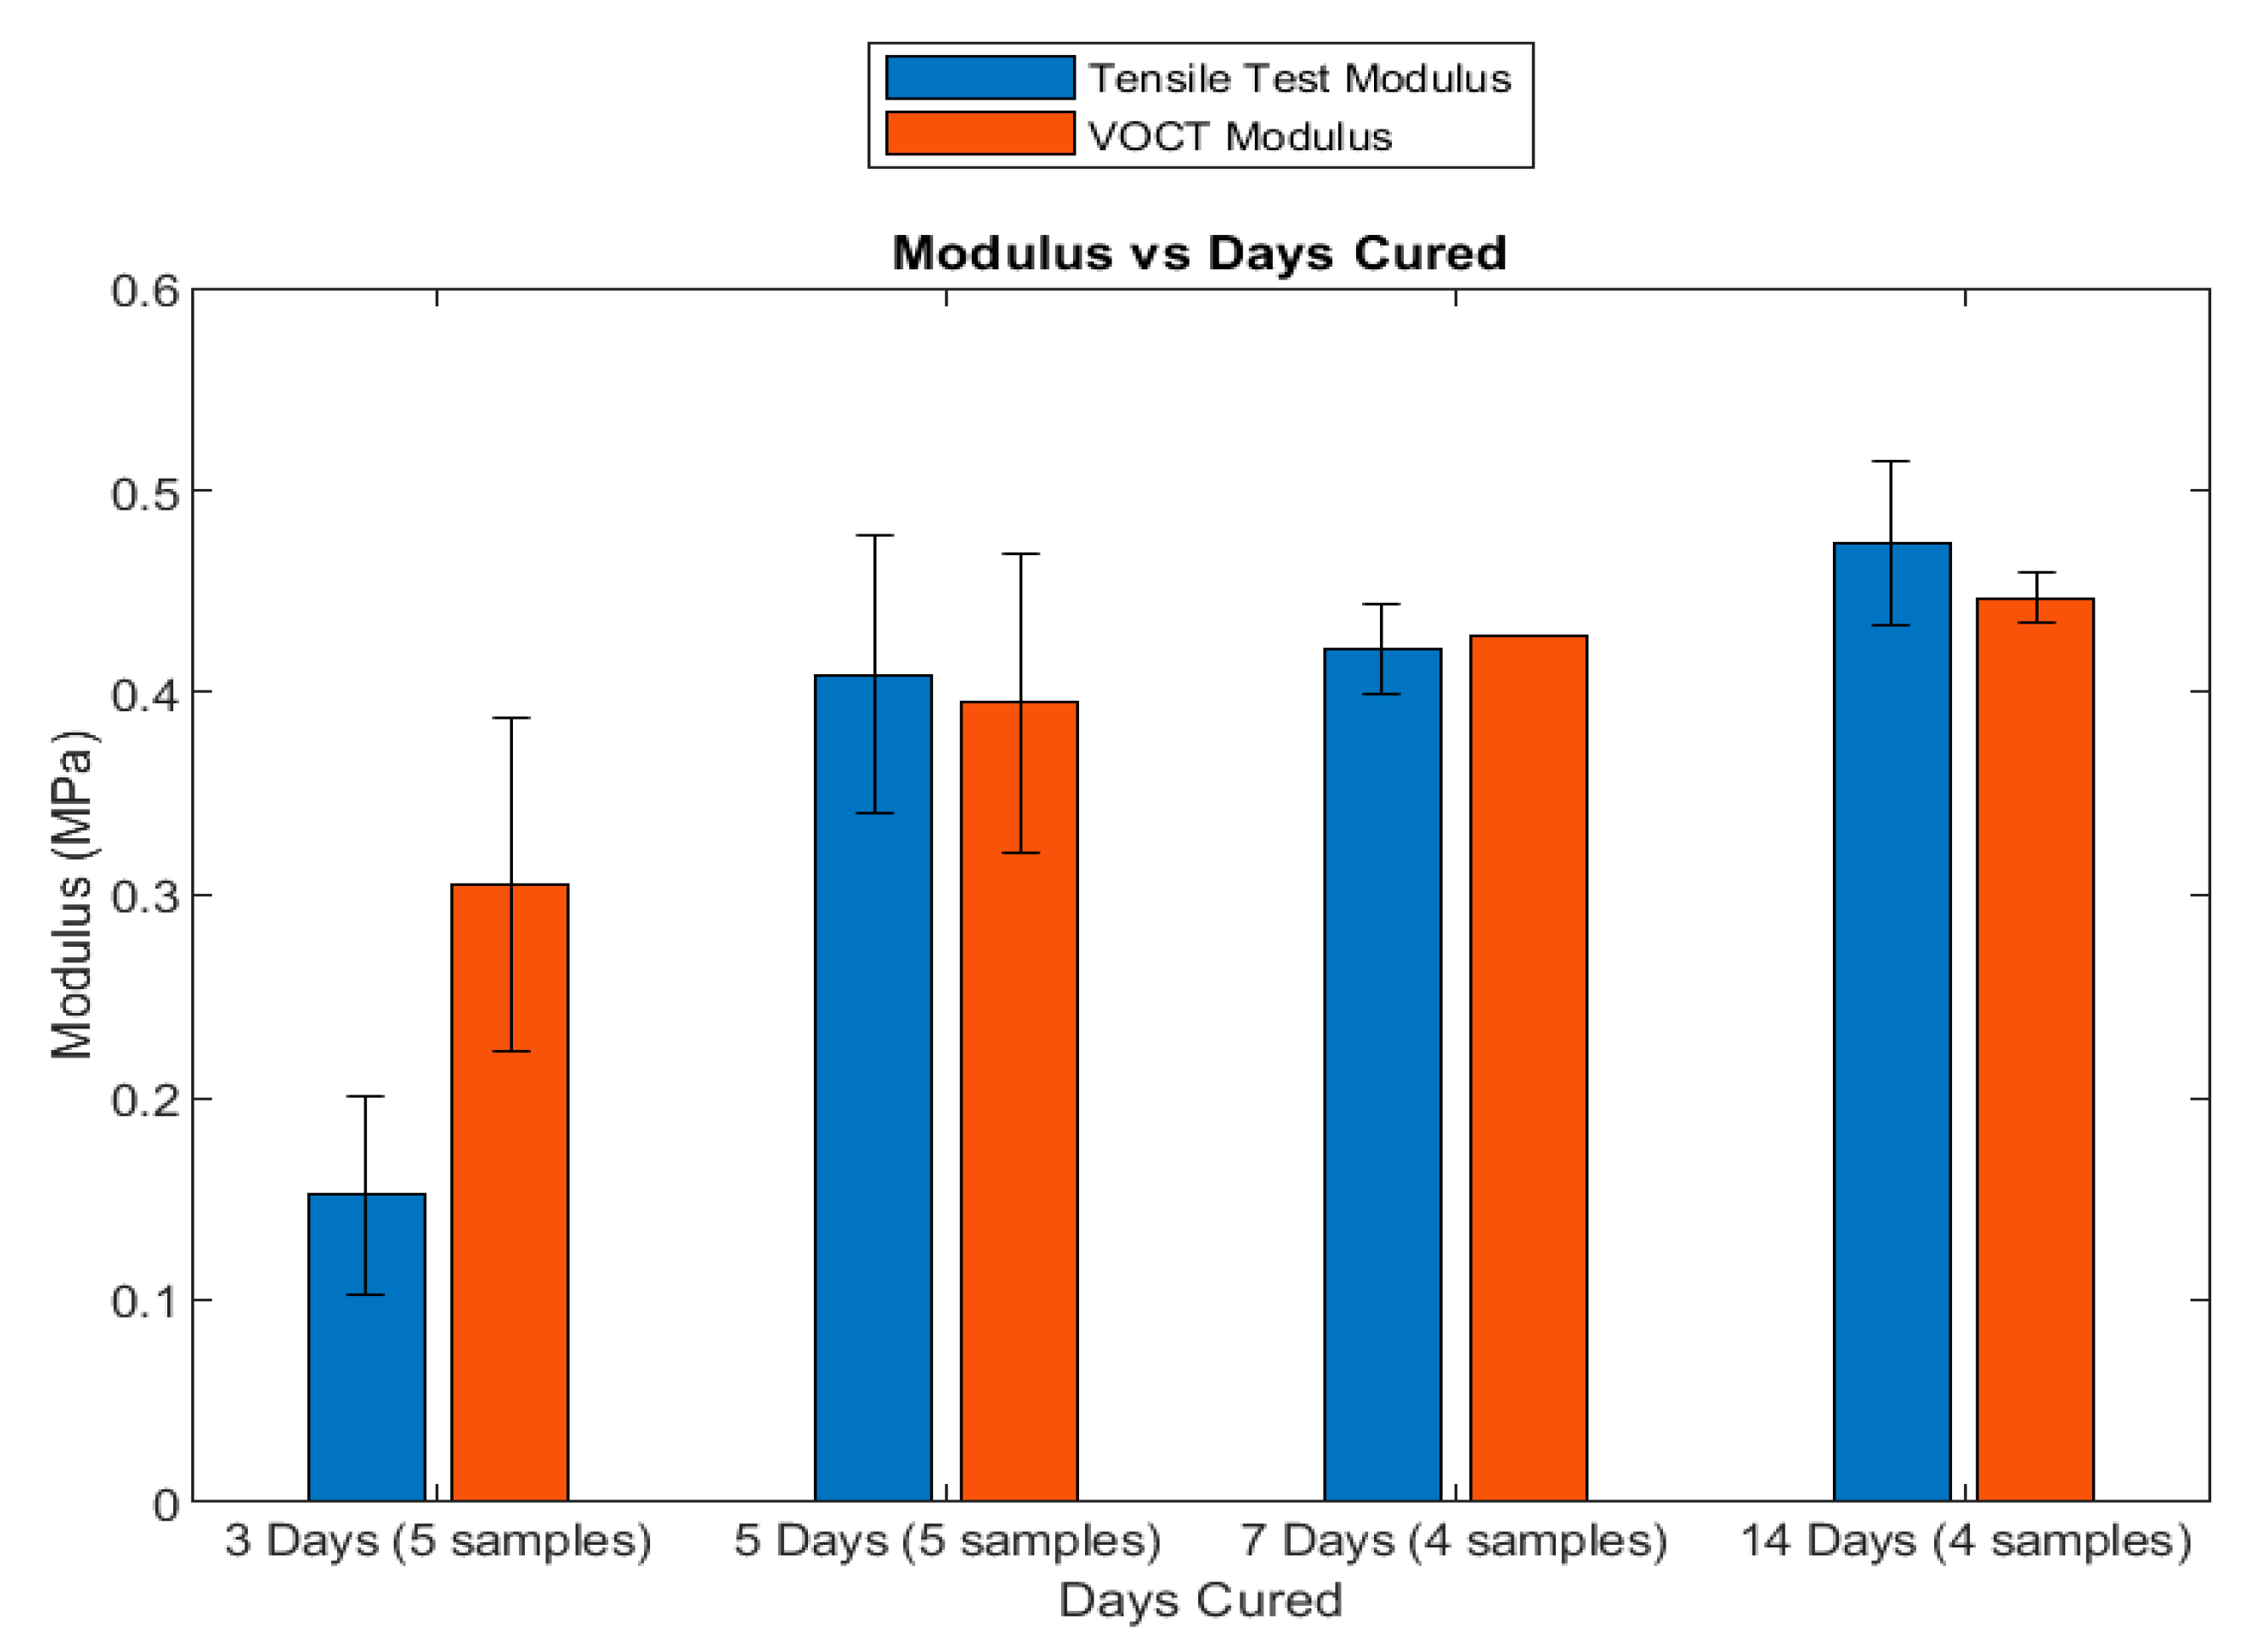
3.2. Tensile and VOCT Stress–Strain Curves of Silicone Specimens

To further assess VOCT as a favorable alternative to conventional tensile testing, the stress–strain curve for the optimal curing time of 7 days was plotted with the back-calculated VOCT stress–strain curve for comparison. The VOCT stress–strain curve was constructed by back-calculating the stress values from the modulus obtained using the resonant frequency and the strain used during incremental strain tensile testing of the same specimen. This has strong implications for the usefulness of VOCT in quickly assessing material stress-strain relationship during fabrication, quality control testing, or prior to implant installation in such a manner that the material is not destroyed in the process and can still be used after VOCT testing rather than needing to be thrown away or remade due to the destructive nature of conventional material characterization tests. Given that the material’s modulus is calculated using the resonant frequency, this ability of VOCT implies that stress–strain relationships for tissue and implants in vivo can be constructed if either the material’s strain or stress states are known. All raw data can be accessed at optovibronex.com

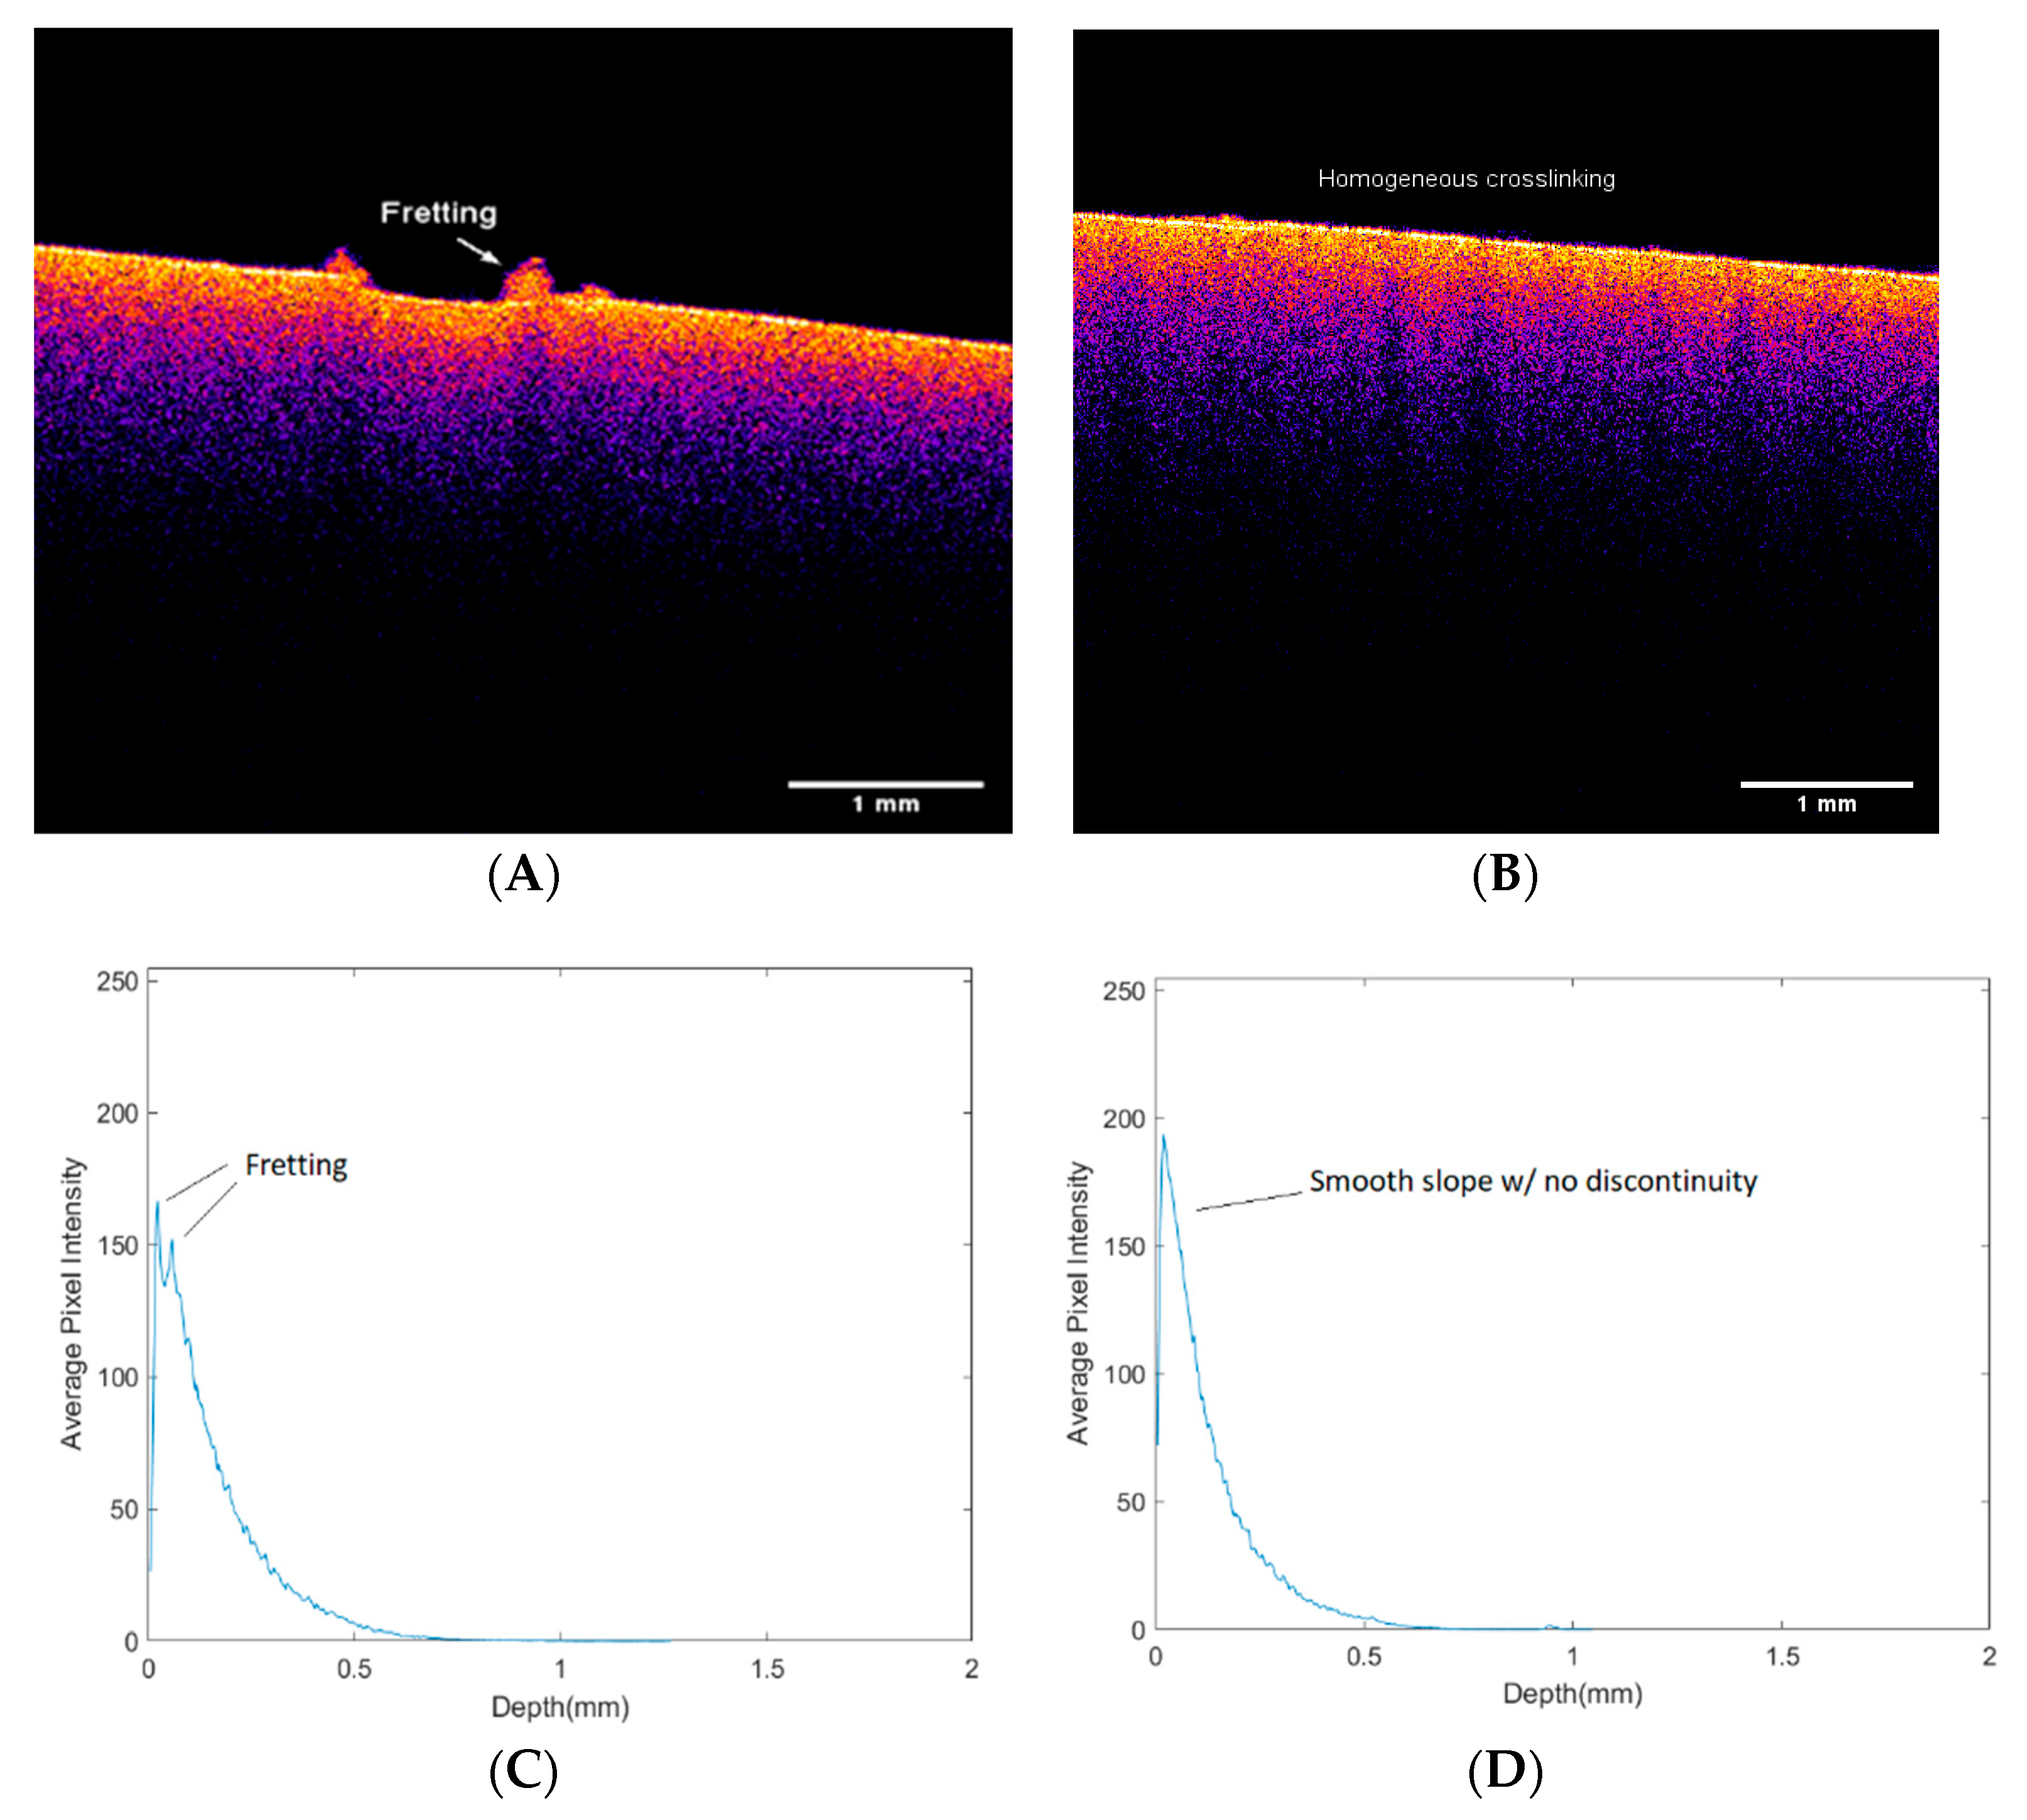
3.3. Sample Inhomogeneity Detection Using VOCT

Another problem that VOCT can address includes the ability to discern specimen damage that may go unnoticed upon visual inspection and be a potential site at which failure could occur during material end-use application. VOCT cross-sectional images and 3D surface scans of a sample specimen were obtained during tensile testing. Using color-coded images and a pixel intensity plotter code developed in MATLAB, sample images were captured in concurrence with acquisition of weighted displacement and modulus data. Figure 4 illustrates the application of this imaging technique to visualize the surface of materials during VOCT testing. This capability of VOCT has strong implications for use in the aerospace and medical implant industries as instances of fretting, as visualized in Figure 4. Any implant or material malfunctioning and eventual fatigue could be observed prior to material failure occurring.

3.4. Loss Modulus as a Percent of Elastic Modulus

The viscous component of the modulus measurements reported as a fraction of the elastic modulus captured using resonant frequency values is shown in Figure 5. The change in frequency at the half-height of the peak, or 3 decibels down from the maximum peak in the power spectrum, divided by the driving frequency was used to calculate the viscous component. This method is coined as the half-height bandwidth method. Figure 5 shows a plot of the loss modulus fraction versus frequency for the silicone specimens measured in vitro at various strains. As can be seen in Figure 5, at low frequency, the loss modulus fraction was 0.56 loss at 0% strain, 0.37 loss at 100% strain, and 0.20 loss at 200% strain. Under tensile loading, polymer chains align with the tensile direction as they are stretched. As a result, the loss in energy dissipating ability decreases as the chains align.
The tensile moduli of the silicone polymer samples tested in tension are shown in Figure 6. Note the similar values obtained using VOCT and tensile testing at 5 through to 14 days of curing.

4. Discussion

The ability of VOCT to nondestructively and no-invasively characterize synthetic polymers has strong implications for its use in identifying key fabrication parameters, such as elastic modulus, surface homogeneity, and energy dissipation ability. While more conventional methods for material characterization exist, such as uniaxial tensile and compressive testing, new characterization methods have been introduced in to address the destructive nature of these tests. These new methods include microindentation, digital image correlation, circular probe AFM, oscillatory shear deformation, micropipette aspiration, and mechanical wave speed measurement. However, these newer methods have their own limitations, the most important of which is not being able to characterize materials in situ.
In this study, we present data on silicone specimens using VOCT. VOCT can capture material modulus noninvasively, nondestructively, and in situ in a matter of minutes using sinusoidal acoustic sound waves at known frequencies. The frequency at which the displacement is maximized is termed the resonant frequency and is used to calculate the material modulus as described previously [15,16,17,18]. In this study, the silicone used was characterized by a resonant peak at about 80 ± 10 Hz. Our results suggest that (1) 7 days is the optimal cure time for modulus comparability to conventional tensile testing results and (2) VOCT can capture results comparable to conventional testing while not destroying the material, suggesting its usefulness for in vivo and in situ measurements and in quality control environments during end-use application and fabrication.
The other aspect of material characterization that can be extracted from VOCT-generated weighted displacement data is the material’s elastic modulus. Using the calibration equations developed as described previously, the dependence of cure time on modulus can be compared between specimens (Figure 2). This affords one the ability to study the processing of polymeric materials at zero strain without the need to destroy the sample. Ultimately, VOCT can be used to evaluate small changes to sample processing without the need to waste materials and time or to only evaluate final products.
To further emphasize the capabilities of VOCT, we also performed conventional tensile testing using an incremental strain methodology. In comparison, the VOCT captured comparable moduli values (see Figure 1 and Figure 2) to the tensile test. One of the perceived benefits of conventional tensile testing is the ability to construct a stress–strain curve from which key material characteristics can be extracted. However, VOCT was also capable of capturing this relationship when the tested samples were subjected to known stress or strain states (see Figure 3). The loss modulus as a percentage of the elastic modulus was captured using VOCT as well. In turn, the propensity of the silicone specimens for energy dissipation was captured. The implication of VOCT as a nondestructive characterization modality is that is can be used for in vivo soft tissue research, which is important for wound healing, implant failure mitigation, surface inhomogeneity detection, and in situ quality control of end-use applications of synthetic polymers. Of important consideration is the ability of VOCT to characterize the fatigue of rubber samples in end-use applications as an indicator of oxidative changes that may lead to sample failure. The ability to predict the life of parts in service without having to replace them is a major advantage, especially in critical applications that may lead to significant cost savings, particularly in the aircraft and automotive industries.
Previously published studies on the viscoelasticity of rubber samples suggest that changes in tissue moduli associated with in-service aging can be assessed using VOCT [19]. These changes include decreases in average material moduli and possibly decreases in the energy dissipating ability that may be associated with oxidative aging. Predicting these changes early in material fatigue processes may eliminate undesired failure of important commercial materials.
Future studies will focus on using the mechanovibrational spectra of different polymeric materials to determine if it is possible to identify the polymeric constituents of unknown materials based on their mechanovibrational spectra. Beyond this, it is possible that VOCT may be a rapid method to measure glass transition and melting temperatures to further characterize the physicochemical behavior of polymeric and composite material components in situ.

5. Conclusions

In this study, filled cured silicone specimen had a resonant peak at about 80 ± 10 Hz at optimum curing time. Our results suggest that (1) the moduli measured at 7 days using conventional tensile testing and VOCT are similar; (2) VOCT can capture results comparable to conventional testing while not destroying the material, suggesting its usefulness for in vivo and in situ measurements as well as early quality control environments during end-use application and fabrication; and (3) it is possible to monitor sample uniformity and points of potential stress concentration using VOCT. This affords one the ability to study the processing of polymeric materials at zero strain without the need to destroy the sample. Ultimately, VOCT can be used to evaluate small changes to sample processing without the need to waste materials or to only evaluate final products.
Changes in tissue and material moduli associated with in-service aging can be assessed using VOCT. These changes may be associated with premature aging. Predicting these the role of oxidative changes in material fatigue processes may eliminate undesired failure of important commercial materials.
It is possible that VOCT may be a quick method to measure other properties to characterize the physiochemical behavior of polymeric and composite material components in situ.

Author Contributions

Conceptualization, F.H.S. and M.G.-M.; methodology, M.G.-M. and A.M.; formal analysis, M.G.-M. and F.H.S.; investigation, M.G.-M. and A.M.; data curation, M.G.-M.; writing—original draft preparation, M.G.-M. and F.H.S.; writing—review and editing, M.G.-M., A.M., and F.H.S.; All authors have read and agreed to the published version of the manuscript.

Funding

This research received no external funding.

Data Availability Statement

Data are available at optovibronex.com.

Acknowledgments

The authors would like to thank Tanmay Deshmukh for assistance in setting up the studies.

Conflicts of Interest

The authors declare no conflict of interest.

References

  1. Silver, F.H.; Shah, R.G.; Silver, L.L. The Use of Vibrational Optical Coherence Tomography in Matching Host Tissue and Implant Mechanical Properties. Biomater. Med. Appl. 2019, 2. [Google Scholar] [CrossRef]
  2. Silver, F.H.; Deshmukh, T.; Benedetto, D.; Kelkar, N. Mechano-vibrational spectroscopy of skin: Are changes in collagen and vascular tissue components early signs of basal cell carcinoma formation? Ski. Res. Technol. 2020, 27, 227–233. [Google Scholar] [CrossRef] [PubMed]
  3. Dunn, M.D.; Silver, F.H. Viscoelastic Behavior of Human Connective Tissues: Relative Contribution of Viscous and Elastic Components. Connect. Tissue Res. 1983, 12, 59–70. [Google Scholar] [CrossRef] [PubMed]
  4. Sotomayor-Del-Moral, J.A.; Pascual-Francisco, J.B.; Susarrey-Huerta, O.; Resendiz-Calderon, C.D.; Gallardo-Hernández, E.A.; Farfan-Cabrera, L.I. Moral of viscoelastic poisson’s ratio of engineering elastomers via DIC-based creep testing. Polymer 2022, 14, 1837. [Google Scholar] [CrossRef] [PubMed]
  5. Tirella, A.; Mattei, G.; Ahluwalia, A. Strain rate viscoelastic analysis of soft and highly hydrated biomaterials. J. Biomed. Mater. Res. Part A 2014, 102, 3352–3360. [Google Scholar] [CrossRef] [PubMed] [Green Version]
  6. Zhu, F.; Yasin, S.; Hussain, M. Dynamic oscillatory shear testing is used to investigate polymeric viscoelastic behavior. Viscoelastic Rheological Behaviors of Polypropylene and LMPP Blends. Polymers 2021, 13, 3485. [Google Scholar] [CrossRef] [PubMed]
  7. Yamashita, J.; Li, X.; Furman, B.; Rawis, H.R.; Wang, X.; Agrawal, C.M. Collagen and bone viscoelasticity: A dynamic mechanical analysis. J. Biomed. Mater. Res. 2002, 63, 31–36. [Google Scholar] [CrossRef] [PubMed]
  8. Chan, R.W. Nonlinear viscoelastic characterization of human vocal fold tissues under large-amplitude oscillatory shear (LAOS). J. Rheol. 2018, 62, 695–712. [Google Scholar] [CrossRef] [PubMed] [Green Version]
  9. Desrochers, J.M.W.; Amrein, M.W.; Matyas, J.R.; Desrochers, J. Viscoelasticity of the articular cartilage surface in early osteoarthritis. Osteoarthr. Cartil. 2012, 20, 413–421. [Google Scholar] [CrossRef] [PubMed] [Green Version]
  10. Griffin, D.J.; Vicari, J.; Buckley, M.R.; Silverberg, J.L.; Cohen, I.; Bonassar, L.J. Effects of Enzymatic Treatments on the Depth-Dependent Viscoelastic Shear Properties of Articular Cartilage. J. Orthop. Res. 2014, 32, 1652–1657. [Google Scholar] [CrossRef] [PubMed]
  11. Han, H.; Frank, E.; Greene, J.; Lee, H.-Y.; Grodzinsky, A.; Ortiz, L. Time-Dependent Nanomechanics of Cartilage. Biophys. J. 2011, 100, 1846–1854. [Google Scholar] [CrossRef] [PubMed] [Green Version]
  12. Hong, X.; Ramkumar, A.; Kemerer, T.S.; Deng, C.X.; Stegemann, J.P. Multimode ultrasound viscoelastography for three-dimensional interrogation of microscale mechanical properties in heterogeneous biomaterials. J. Biomater. 2018, 178, 11–22. [Google Scholar] [CrossRef] [PubMed]
  13. Miri, A.K.; Heris, H.K.; Mongeau, L.; Fa Miri, F.J. Nanoscale Viscoelasticity of Extracellular Matrix Proteins in Soft Tissues: A Multiscale Approach. J. Mech. Behav. Biomed. Mater. 2014, 30, 196–204. [Google Scholar] [CrossRef] [PubMed] [Green Version]
  14. Norberg, C.; Filippone, G.; Andreopoulos, F.; Best, T.M.; Baraga, M.; Alicia RJackson, A.R.; Travascio, F. Viscoelastic and equilibrium shear properties of human meniscus: Relationship with tissue structure and composition. J. Biomech. 2021, 120, 110343. [Google Scholar] [CrossRef] [PubMed]
  15. Shah, R.G.; Devore, D.; Pierce, M.C.; Silver, F.H. Vibrational analysis of implants and tissues: Calibration and spectroscopy of multi-component materials. J. Biomed. Mater. Res.—Part A 2017, 105, 1666–1671. [Google Scholar] [CrossRef]
  16. Silver, F.H.; Kelkar, N.; Deshmukh, T.; Ritter, N.; Ryan, N.; Nadiminiti, H. Characterization of the biomechanical properties of skin using vibrational optical coherence tomography: Do changes in the biomechanical properties of skin stroma reflect structural changes in the extracellular matrix of cancerous lesions? Biomolecules 2021, 11, 1712. [Google Scholar] [CrossRef] [PubMed]
  17. Silver, F.H.; Kelkar, N.; Desmukh, T.; Horvath, I.; Shah, R.G. Mechano-Vibrational Spectroscopy of Tissues and Materials Using Vibrational Optical Coherence Tomography: A New Non-Invasive and Non-Destructive Technique. Recent Prog. Mater. 2020, 2, 010. [Google Scholar] [CrossRef]
  18. Shabana, A.A. Theory of Vibration, 3rd ed.; Springer: Berlin/Heidelberg, Germany, 2019; pp. 338–342. [Google Scholar]
  19. Silver, F.H.; Shah, R.G.; Benedetto, D.; Dular, A.; Kirn, T. Virtual Biopsy and Physical Characterization of Tissues, Biofilms, Implants, and Viscoelastic Liquids Using Vibrational Optical Coherence Tomography. World J. Mech. 2019, 9, 1–16. [Google Scholar] [CrossRef]
Figure 1. Typical normalized weighted displacement versus frequency (in Hz) plots for silicone sealant specimens at 0% strain determined in vitro using VOCT. Note the presence of extra peaks relative to the resonant frequency peak (80 ± 10 Hz) in the specimens cured for 3 and 14 days and the lack thereof in the specimens cured for 5 and 7 days. The weighted displacement of each sample was normalized by dividing by the displacement of the speaker in the absence of the sample as well as by the largest peak in the spectrum.
Photonics 09 00925 g001
Figure 2. Bar graph of modulus versus cure time at various percent strains calculated using the resonant frequency peak in Figure 1 and Equation (1). Note the bars labeled 0%, 120%, and 200% denote the moduli calculated using VOCT at that those strains, while the tensile bar denotes the modulus calculated by the stress–strain curve of the tensile test. The standard deviation for each specimen condition is indicated except for the specimens cured for 7 days at 0% and 200% strain because their standard deviations were zero. Note the modulus obtained by traditional destructive uniaxial tensile testing (tensile) is similar to the modulus obtained by VOCT, especially for the specimens cured for 5 and 7 days (see Figure 2 and Figure 3). VOCT-calculated modulus for specimens cured for 7 days is the closest to the tensile testing at 0%, 120%, and 200% strain.
Photonics 09 00925 g002
Figure 3. Tensile and VOCT stress–strain curves for silicone specimens cured for 7 days. VOCT stress–strain data was back-calculated using the modulus obtained using the resonant frequency and incremental strain values taken during tensile testing of the specimens cured for 7 days. Note the high fidelity to tensile test data at strains higher than 100%. As the force gauge used during tensile testing had an accuracy of ±0.1 N, some variations in the force measurements and subsequent stress calculation may in part account for the large standard deviations present in the tensile test curve at low strains.
Photonics 09 00925 g003
Figure 4. Color-coded OCT images of silicone rubber specimens and pixel intensity versus depth plots. Note the specimen with surface fretting (A), which is not discernible with visual inspection of the specimen and the unfretted surface (B). There is a noticeable dip in the pixel intensity at exactly the depth that denotes the surface of the material, which directly correlates to the fretting (C) on the material surface. A specimen with homogeneous crosslinking on the surface and in the visible depth of the OCT image (D) is shown to have a smooth slope with no jumps in pixel intensity.
Photonics 09 00925 g004
Figure 5. Plot of loss modulus as a fraction of the elastic modulus versus frequency for silicone polymer specimens cured for 7 days at various strain states. Note that the loss modulus is maximized at low frequencies, and the noticeable dip in loss modulus occurs at the resonant frequency of about 80–90 Hz. Note that increasing the specimen strain decreases the maximum loss modulus, showing that the viscous nature of the silicone polymer decreases substantially at high strain.
Photonics 09 00925 g005
Figure 6. Moduli and their standard deviation according to days cured based on VOCT measurements for silicone specimens at 0% strain (control condition) and tensile testing. Note that the VOCT-calculated modulus for specimens cured for 7 days has a standard deviation of 0.
Photonics 09 00925 g006
Publisher’s Note: MDPI stays neutral with regard to jurisdictional claims in published maps and institutional affiliations.

