Article

Noise Reduction of OCT Images Based on the External Patch Prior Guided Internal Clustering and Morphological Analysis

1
School of Medical Technology, Beijing Institute of Technology, Beijing 100081, China
2
Department of BME, School of Medicine, Tsinghua University, Beijing 100084, China
3
School of Life Science, Beijing Institute of Technology, Beijing 100081, China
*
Author to whom correspondence should be addressed.
Photonics 2022, 9(8), 543; https://doi.org/10.3390/photonics9080543
Submission received: 2 June 2022 / Revised: 20 July 2022 / Accepted: 31 July 2022 / Published: 3 August 2022
(This article belongs to the Special Issue Recent Advances in Optical Coherence Tomography)

Abstract

:
Optical coherence tomography (OCT) is widely used in biomedical imaging. However, noise severely affects diagnosing and identifying diseased tissues on OCT images. Here, a noise reduction method based on the external patch prior guided internal clustering and morphological analysis (E2PGICMA) is developed to remove the noise of OCT images. The external patch prior guided internal clustering algorithm is used to reduce speckle noise. The morphological analysis algorithm is employed to the background for contrast enhancement. OCT images of in vivo normal skin tissues were analyzed to remove noise using the proposed method. The estimated standard deviations of the noise were chosen as different values for evaluating the quantitative metrics. The visual quality improvement includes more textures and fine detail preservation. The denoising effects of different methods were compared. Then, quantitative and qualitative evaluations of this proposed method were conducted. The results demonstrated that the SNR, PSNR, and XCOR were higher than those of the other noise-reduction methods, reaching 15.05 dB, 27.48 dB, and 0.9959, respectively. Furthermore, the presented method’s noise reduction ratio (NRR) reached 0.8999. This proposed method can efficiently remove the background and speckle noise. Improving the proposed noise reduction method would outperform existing state-of-the-art OCT despeckling methods.

1. Introduction

Optical coherence tomography (OCT) [1] is widely used in biomedicine and the clinic, especially in dermatology [2], ophthalmology [3], and cardiology [4]. Noise seriously affects the quality of OCT images for clinical examination. Due to taking advantage of low-coherence interferometry, OCT images are always corrupted by speckle noise. The noise suppression of OCT images is still a hot topic, especially in intraoperative OCT imaging [5,6]. Hence, reducing speckle and background noise in OCT images is very important to enhance image quality and further improve clinical diagnosis and analysis accuracy.
Two categories of methods were used to reduce noise, including hardware-based and image-processing-based methods. Hardware-based methods include optical chopper [7], angular compounding [8,9], spatial compounding [10,11], and frequency compounding [12], aiming to produce uncorrelated speckle patterns that can be suppressed by the averaging method. These approaches require specially designed acquisition systems and cannot be directly applied to commercial OCT scanners. Currently, many image processing and preprocessing methods have been developed to remove noise, such as wavelet domain compounding [13], A-scan reconstruction [14], the edge-sensitive cGAN-based deep learning method [15], BM3D filtering [16], SBSDI [17], adaptive weighted bilateral filtering [18], and the shearlet-based total variation algorithm [19]. Some noise still existed in the OCT images. Thus, this noise makes the original OCT images unclear and unsharp. In contrast, the self-similarity prior-based nonlocal means method (NLM and PNLM) [20,21] and adaptive basis-based sparse representation methods [17,22,23] can obtain a better speckle noise reduction effect. However, these methods vectorized a local image patch, which destroys the fine structures of the objects. Recently, deep learning methods [15,24,25,26,27,28,29] have been very useful for image processing, also used to remove speckle noise. These methods require no complicated prior information of the OCT image speckle. However, deep learning-based methods need a large number of OCT images to train, and it is very time consuming. Similarly, an external patch prior to internal clustering [30] for noise has been proposed in natural images. This method is useful for noise reduction. Regarding the speckle noise of medical OCT images, this method would be a good solution for effectively denoising speckles.
Recently, we developed a fixed-pattern noise reduction method based on the Hough transform [31]. The proposed method achieves high-efficiency noise reduction for fixed-pattern noise resulting from high-intensity reflection originating from biological tissue surfaces. Similarly, the background severely affects the postprocessing of OCT images to identify diseased lesions. A detection algorithm of the lumen boundary has been developed for delineating the border in intravascular OCT images [32,33]. It can be used to segment the boundary of the intravascular OCT images explicitly and reduce the background. This method can be used in endoscopic OCT imaging of the gastrointestinal tract [34]. Furthermore, reducing the background is important to improving the quality of B-scan OCT images and effective three-dimensional (3-D) visualization. However, there is no excellent solution for noise reduction to provide good preservation of useful information and fine structural characteristics of middle- or low-resolution OCT images.
In this work, we proposed a noise reduction method based on the external patch prior guided internal clustering and morphological analysis (E2PGICMA) to remove the background and speckle noise of OCT images. The preprocessing of OCT images provided the basis of the noise removal method. The external patch prior guided internal clustering method was used to despeckle the original OCT images. The standard deviation of the estimated noise was added to test these OCT images. The morphological analysis-based noise reduction method was used to reduce the background. The upper boundary of biological tissues was searched through the method of gray threshold comparison. Furthermore, the global signal-to-noise ratio (SNR), the peak signal-to-noise ratio (PSNR), the correlation (XCOR), the average equivalent number of looks (ENL), the average contrast-to-noise ratio (CNR), the edge preservation index (EPI), and the noise reduction ratio (NRR) were computed to quantitatively evaluate the proposed method. Qualitative validation experiments were conducted by viewing the enlarged regions and A-scan lines of the denoised OCT images.

2. Materials and Methods

Noise reduction of OCT images is important, especially background and speckle noise reduction. Image patch space is not a ball-like Euclidean space. Using the Mahalanobis distance to characterize the patch covariance matrix could be a better choice for patch similarity measurement, as described in [30]. The external patch prior guided internal clustering and morphological analysis (E2PGICMA)-based noise removal method was proposed. Some in vivo experiments were conducted to acquire OCT images of normal skin tissues. We computed the quantitative noise removal parameters and visualized the results of denoised OCT images through two-dimensional visualization and denoised A-scan lines.

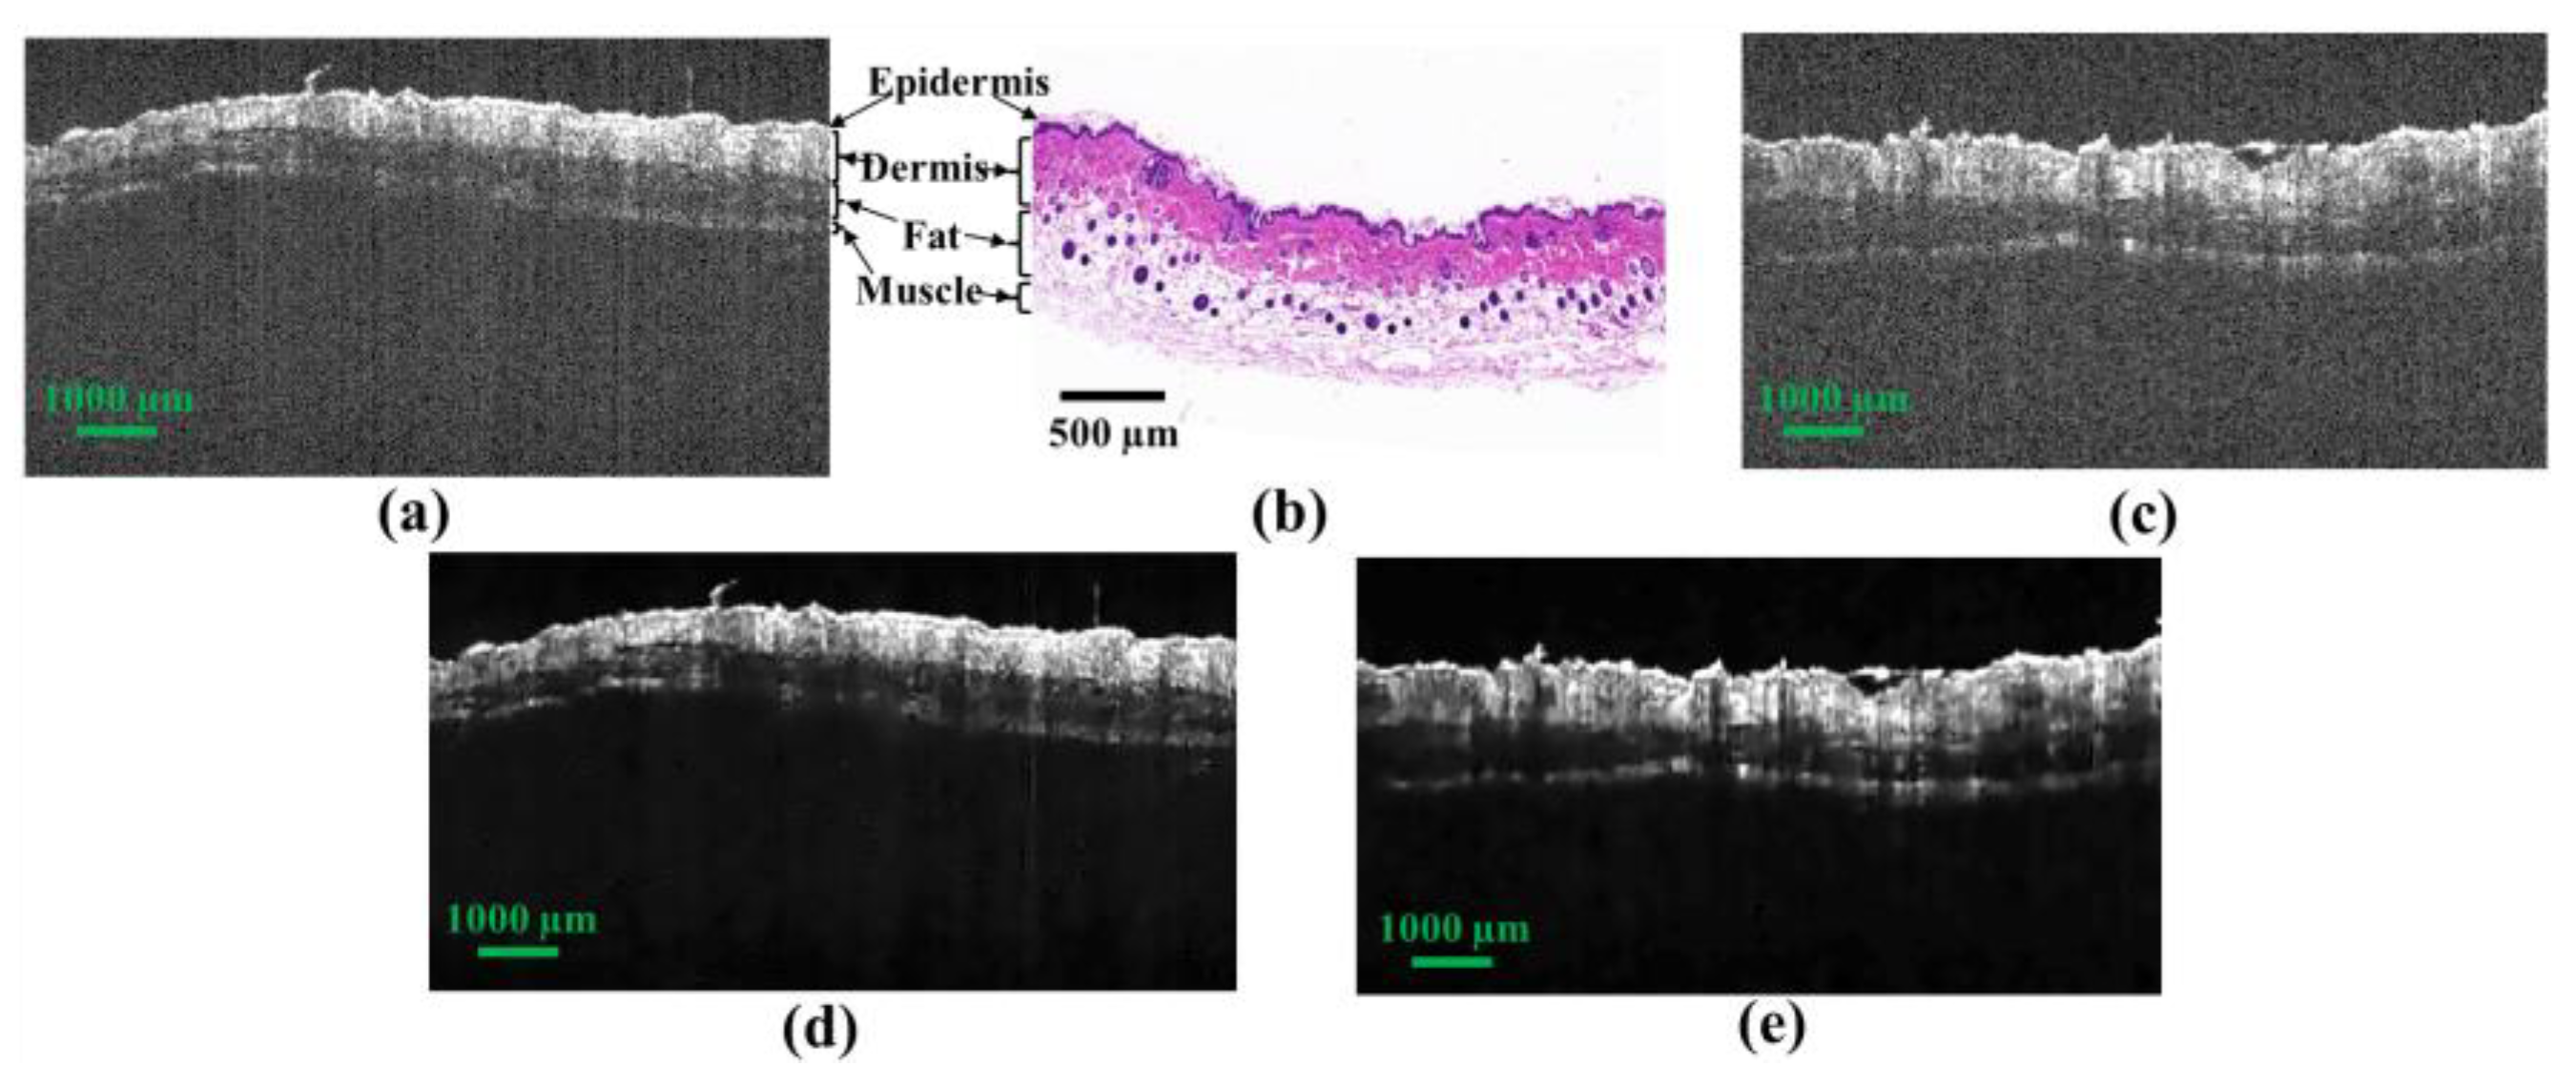
2.1. Biological Tissue Preparation and OCT Imaging

In vivo nude mouse skin was prepared and acquired. The mice were anesthetized by an intraperitoneal injection of 1% sodium pentobarbital solution. The solution was injected into the mice at a dose of 0.1 mm/10 g. After the mice were placed under deep anesthesia, a home-built OCT was used for imaging. The OCT module had a scanning scale sufficient to scan the burnt spots with a field of view (FOV) of approximately 10 mm × 10 mm. Its specifications have been described as in ref. [35]. The OCT system had a horizontal resolution of approximately 22 µm and an axial resolution of approximately 12 µm. The imaging speed of this OCT system was approximately 60 frames per second. The same location was scanned to acquire the B-scan OCT images, two locations were scanned, and at least 120 B-scan OCT images were saved at each location. Five B-scan OCT images at each location were randomly chosen and averaged as ground truth. These images of each location can be averaged as ground truth and tested to evaluate the effect of noise reduction. This study used one mouse to acquire OCT images of normal skin tissues. The Beijing Institute of Radiation Medicine Experiment Animal Center-Approved Animal Protocols approved this study. All animal experiments were performed in accordance with the guidelines in IACUC-DWZX-2019-502.

2.2. Acquisition and Preprocessing of OCT Images

Experiments were conducted using OCT to scan the normal skin tissue of three mice in vivo. One of these mice was sacrificed to acquire the histology of normal skin tissues. OCT images contained some noise and useful information on biological tissue. Figure 1a,c shows the original OCT images of normal mouse skin, and Figure 1b shows the corresponding histology. The layered structure is clear and obvious including epidermis, dermis, fat, and muscle layers. Preprocessing and background reduction was conducted. We further utilized the HTFPNR method proposed previously in [31] to reduce the fixed mode noise of these OCT images. Then, the proposed method was conducted to reduce the noise. Figure 1d,e shows the denoised OCT images with this E2PGICMA method for removing the background and speckle noise.

2.3. Noise Reduction Algorithm Based on E2PGICMA

The E2PGICMA algorithm was conducted to remove the speckle and background noise of OCT images. The method is developed based on the external patch prior guided internal similarity clustering algorithm [30]. The procedure is as Algorithm 1. The quadratic optimization problem can be solved in closed form (Equation (1)),
x ¯ l + 1 = ( λ I + k R ¯ k T R ¯ k ) 1 ( λ y + k R ¯ k T Z k l ) .
where λ is a positive constant, l is the alternating times, Rk is a matrix which extracts the k-th patch from x, Z k l is the low-rank matrixes, and y is a noisy OCT image.
After obtaining an improved estimate of the unknown image xl+1, the noise standard deviation σ can be updated by utilizing the feedback of the filtered noise. The updated σ is then used to improve the estimate xl+2. Such a process is iterated until convergence. The total procedure of the proposed algorithm was as follows:
First, a reasonable scaling factor γ was chosen to control the re-estimation of noise variance.
Second, the optimization process was conducted by updating the standard deviation (σ) to improve the unknown image x.
Finally, the despeckled OCT images were output for further processing and were used to remove the background.
The despeckled OCT image was histogram-equalized. The gray threshold for the binarization of a whole OCT image was chosen automatically by the Otsu algorithm. This method was implemented through function ‘graythresh’ and ‘im2bw’ in MATLAB. It can acquire the threshold for minimizing the in-class variance of the threshold black and white pixels. The global threshold can be used in conjunction with imbinarize to convert grayscale images into binary images. Then, a 5 × 5 mask was applied to implement the median filtering of an OCT image. The region-filling operation was conducted to fill the hole in the binarized OCT image. This procedure is shown in Figure 2a. The upper surface was searched and saved by comparison with the gray threshold. The gray value of the binarized OCT image ranges from 0 to 255. Here, we chose the 70 as the gray threshold. Then, the upper surface was smoothed through the median filtering method. The pixels located above the upper surface were set as zero. The useful information depth was approximately 1.5 mm; hence, the 150-pixel-depth OCT image below the upper boundary was acquired and flattened.
Algorithm 1: Proposed algorithm for denoising of OCT images
1. Input: noisy image y, noise standard deviation σ, learned GMM model parameter Θ’ and K.
2. Initialization:
 (1) Choose a reasonable scaling factor γ for controlling the re-estimation of noise variance;
 (2) Initialize x0 = y; σ0 = σ.
3. Optimization and Compute xl via Equation (1);
4. Update σl, such that (σl)2 = γ(σ2 y x 2 2 ).
5. Beginning the background reduction
 (1) Input the speckle-reduced OCT image,
 (2) Image binarization with Ostu algorithm,
 (3) Region filling (Mask: 5 × 5) and finding the upper boundary of OCT image,
 (4) Reset the gray level above the upper boundary of the OCT image to zero.
6. Output: denoised image x.
The noise reduction procedure was as follows: the involved parameters λ (positive constant) and γ (reasonable scaling factor) in the proposed algorithm were set to 0.18 and 0.67, respectively. According to experimental experience [36], the patch size was set to 7 × 7, 8 × 8, 9 × 9 and 10 × 10 for σ ≤ 20, 20 < σ ≤ 40, 40 < σ ≤ 60 and σ > 60, respectively.

2.4. Validation for the Noise Reduction of OCT Images

For qualitative evaluation, the filtered images, and the view of textures in enlarged regions are provided in visual B-scan OCT images, making the comparison more comprehensive and directed. Visual A-scan lines of original, ground truth and denoised OCT images were provided, making the comparison of these methods more comprehensive and purposeful. The execution time was also recorded and compared. Expert observers manually reviewed all denoised single-frame B-scan images.
For quantitative evaluation of the performance of noise reduction, five other metrics were used to quantify the image quality, including the global signal-to-noise ratio (SNR), the peak signal-to-noise ratio (PSNR), the cross-correlation (XCOR), the equivalent number of looks (ENL), and the average contrast-to-noise ratio (CNR). Equations (2) and (3) show that the SNR and PSNR act as indicators of speckle reduction, and higher values indicate better quality. Equation (4) shows that XCOR depicts the similarity between the despeckled image I ¯ and the reference image R ; a larger value implies that the recovered image is more like the reference image. The ENL measures the smoothness of the filtering results in the homogeneous regions (Equation (5)); higher values indicate better speckle reduction. CNR is a measurement of the contrast between the foreground objects and the noisy background regions (Equation (6)). As an indicator of improving contrast and preserving structures, a higher CNR value means that the image features are more separated from the OCT image background. Since there are no ideal ‘noiseless’ OCT images available, we use the averaged B-scan images as a noiseless approximation (ground truth). These metrics are, respectively defined as:
S N R = 10 log 10 ( max ( I 2 ) / σ n 2 ) ,
P S N R = 10 log 10 ( M A X 2 1 N j = 1 N ( I j I j ¯ ) 2 ) ,
X C O R = j = 1 N I j I j ¯ [ j = 1 N I j 2 ] [ j = 1 N I j ¯ 2 ] ,
E N L = 1 H ( h = 1 R μ h 2 / σ n 2 ) ,
C N R = 1 R ( r = 1 R ( μ r μ n ) / σ r 2 + σ n 2 ) ) ,
where I ¯ is the recovered image concerning its ground truth image I. N is the total number of pixels, and MAX is the maximum intensity of the images. μn and σn are the mean value and variance of the background regions in the linear magnitude image, μh and σh are the mean and variance of the hth homogenous regions of interest (ROI), and μr and σr are the mean and variance of the rth ROI in the homogenous and nonhomogenous regions, respectively.
Furthermore, the structure similarity (SSIM) [37] index was designed by modeling any image distortion as a combination of three factors, namely, the loss of correlation s(I, I ¯ ), the luminance distortion l(I, I ¯ ), and the contrast distortion c(I, I ¯ ). The metric (Equation (7)) measures the similarity between a reference image and a denoised image.
S S I M ( I , I ¯ ) = l ( I , I ¯ ) c ( I , I ¯ ) s ( I , I ¯ ) ,
where,
l ( I , I ¯ ) = 2 u I u I ¯ + c 1 u I 2 + u I ¯ 2 + c 1 , c ( I , I ¯ ) = 2 σ I σ I ¯ + c 2 σ I 2 + σ I ¯ 2 + c 2 , s ( I , I ¯ ) = 2 σ I I ¯ + c 3 σ I σ I ¯ + c 3 ,
Edge Preservation index (EPI) (Equation (9)) shows the degree of edge blurring inside the ROI based on the methods discussed in [38]. The closer the EPI is to 1, the better the edge preservation.
E P I = 1 E e = 1 1 i , j R O I e ( 2 I I ¯ ) ( 2 I 0 I 0 ¯ ) i , j R O I e ( 2 I I ¯ ) 2 i , j R O I e ( 2 I 0 I 0 ¯ ) 2 ,
where, 2I0 and 2I represent the Laplacian operator (2) performed on the noisy image (I0) and the filtered image (I) in the eth nonhomogenous ROI, respectively. I0, I, 2I0, and 2I are the means of I0, I, 2I0, and 2I over 3 × 3 neighborhoods, respectively.
Moreover, we calculated the noise-reduction ratio (NRR) (Equation (10)) to compute the noise reduction index to evaluate the noise removal effect of the presented method. The NRR is defined as in Equation (10):
NRR = 10 log 10 ( I n o i s e _ f i l t e r e d 2 ) 10 log 10 ( I o r i g i n a l _ i m a g e 2 ) × 100 % ,
where I n o i s e _ f i l t e r e d and I o r i g i n a l _ i m a g e are the intensities of the removed noise and the original image, respectively. This indicator indicates that higher values indicate a better effect of speckle and background reduction.
In vivo normal skin tissues were imaged using an SS-OCT system. Then, 200 B-scan OCT images were denoised, analyzed with the proposed denoised method, and used to validate the performance of NRR and the visual effect of noise reduction. Furthermore, these OCT images were visualized through ray-tracing rendering and the 3-D visualization method. We qualitatively evaluated the effect of noise reduction by viewing the inner structural characteristics of OCT images. This method was processed on a laptop with an Intel (Santa Clara, CA, USA) Core i5-7500 CPU (3.40 GHz).

3. Experimental Results

After preprocessing, noise removal and validation of the proposed method were conducted and implemented. Visualization of OCT images presented the effect of noise reduction with the proposed method. This method was run with the software MATLAB 2020 (Natick, MA, USA).

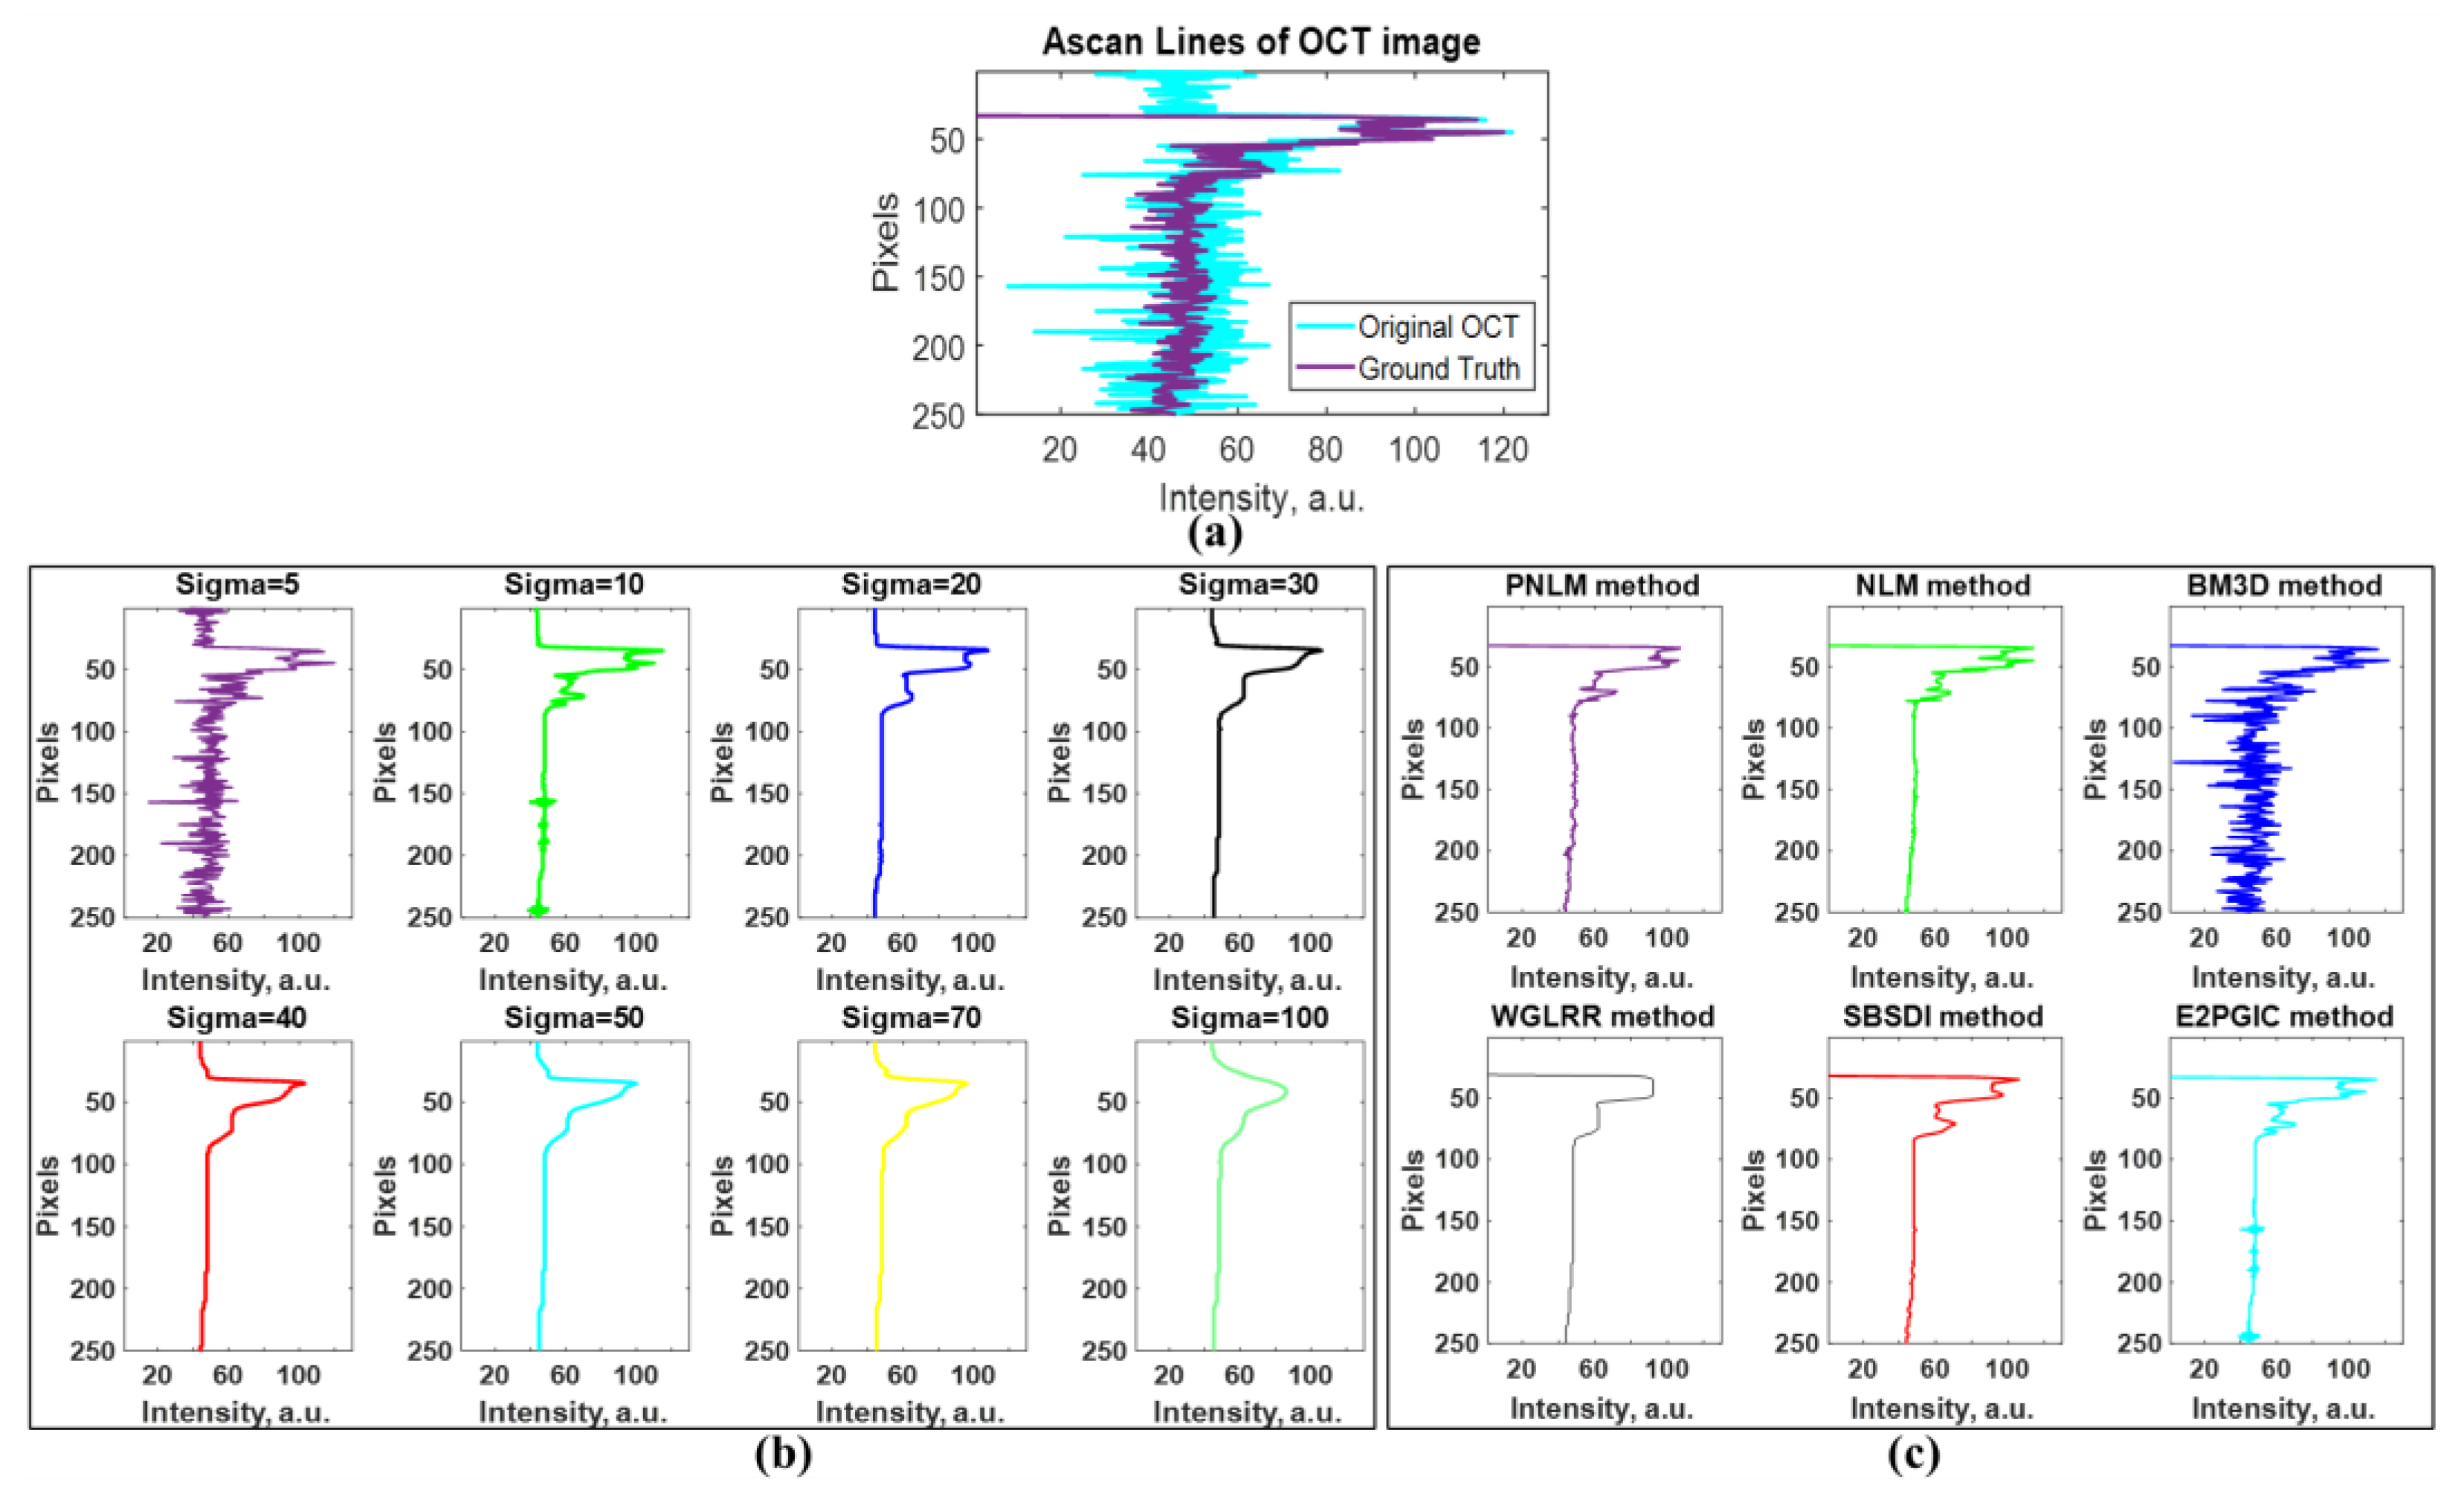
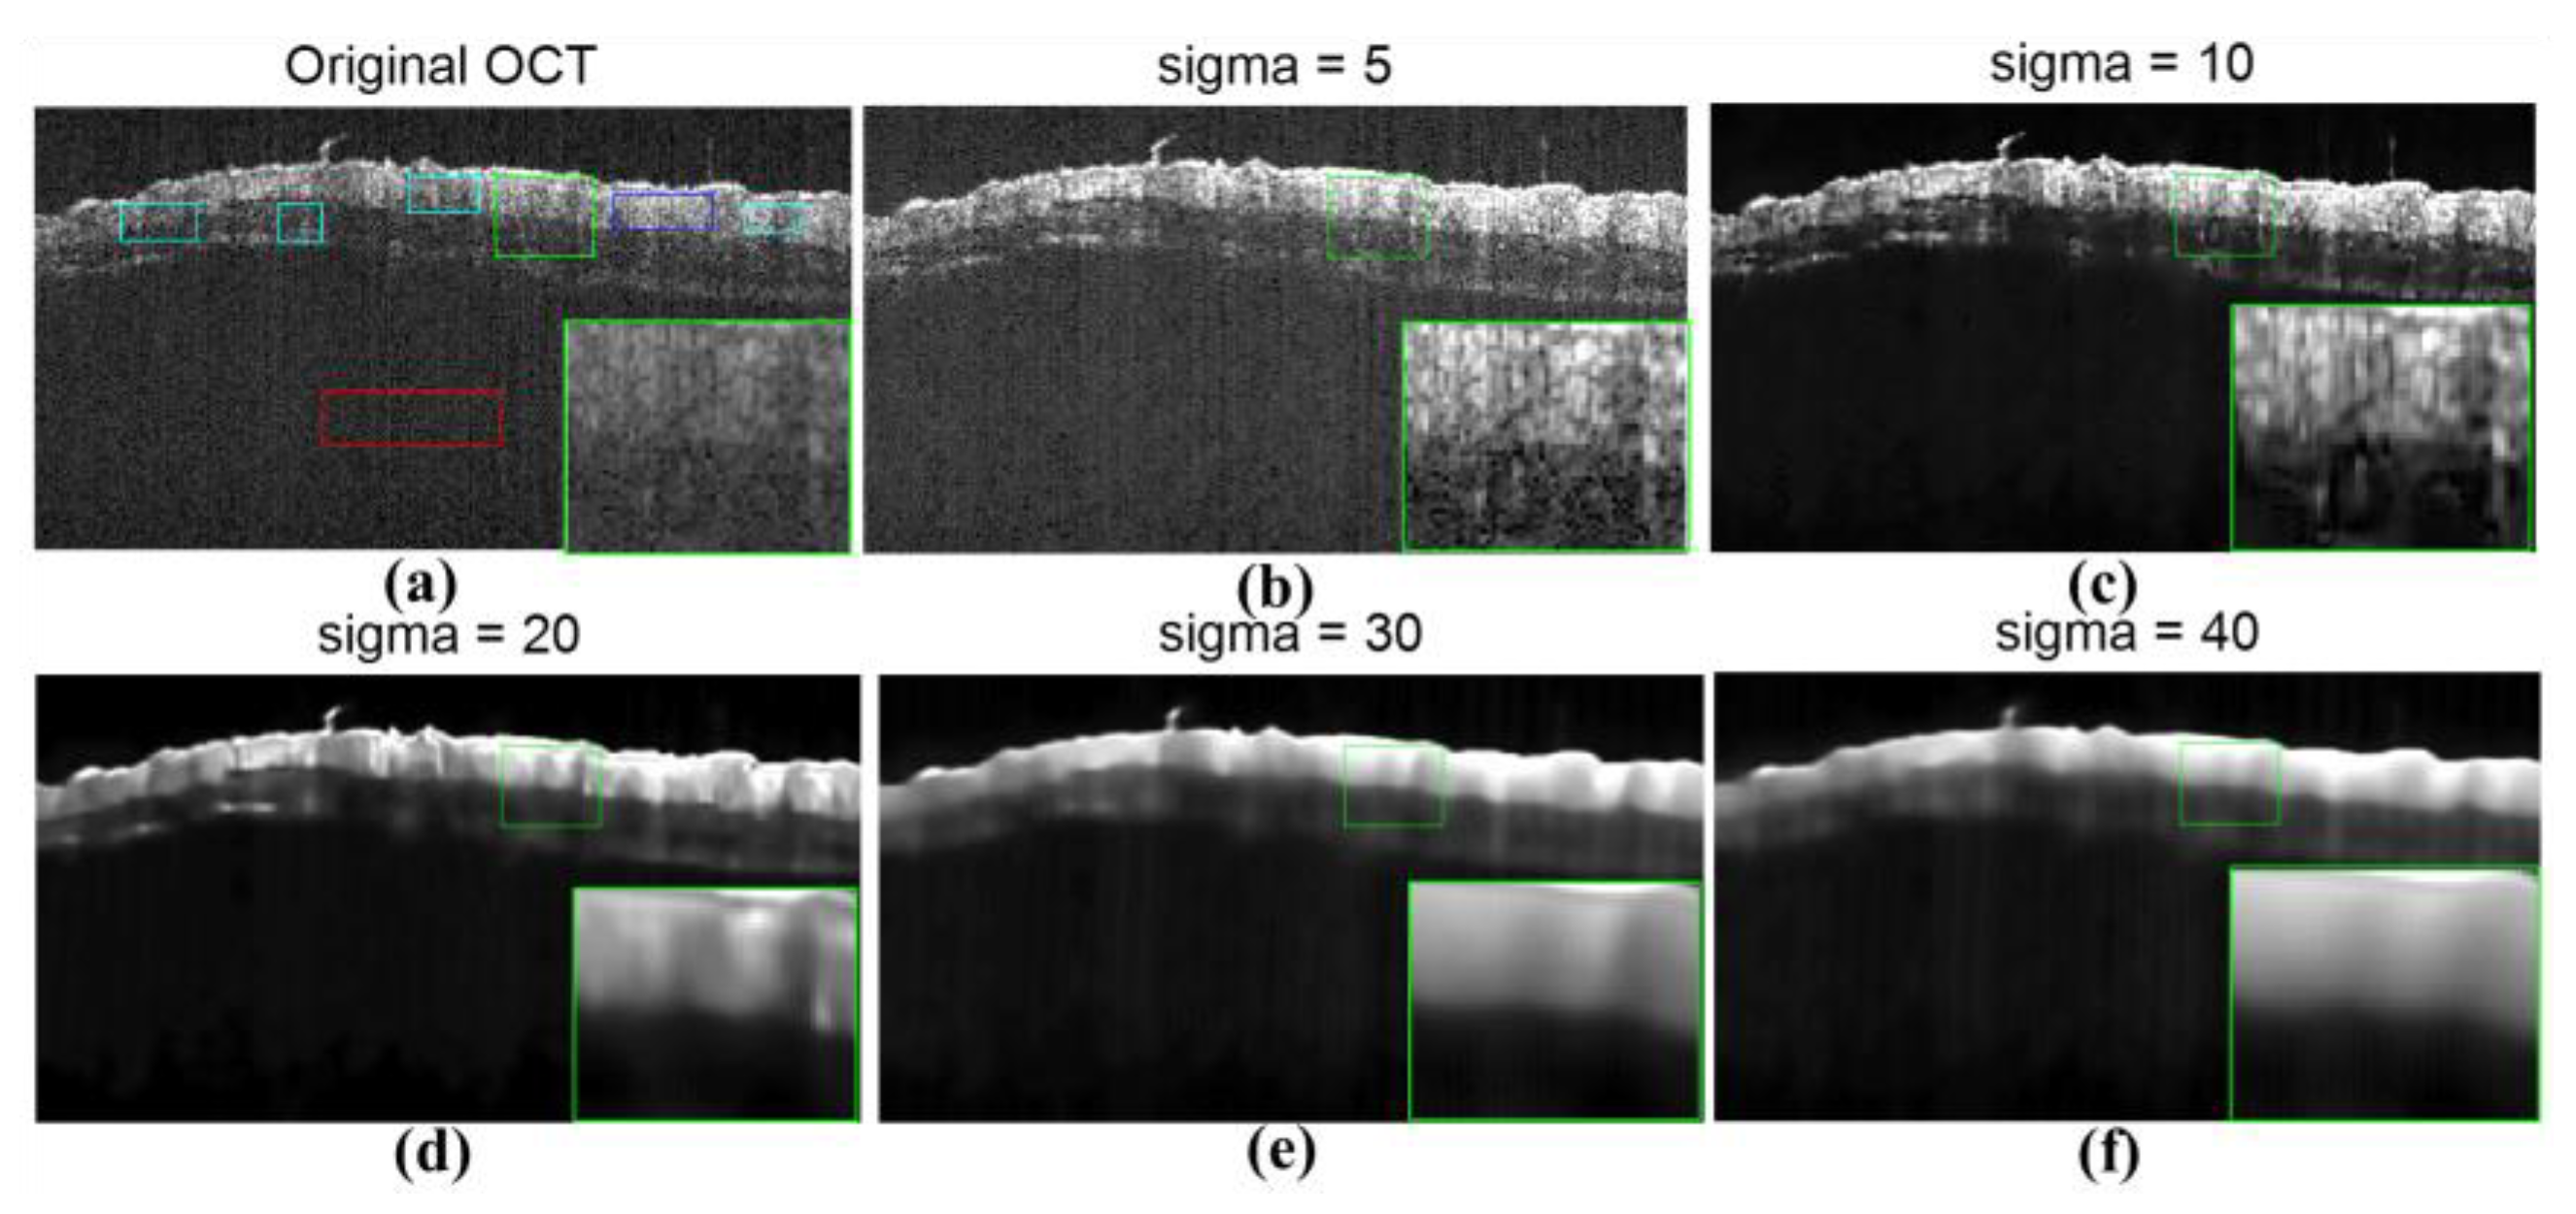
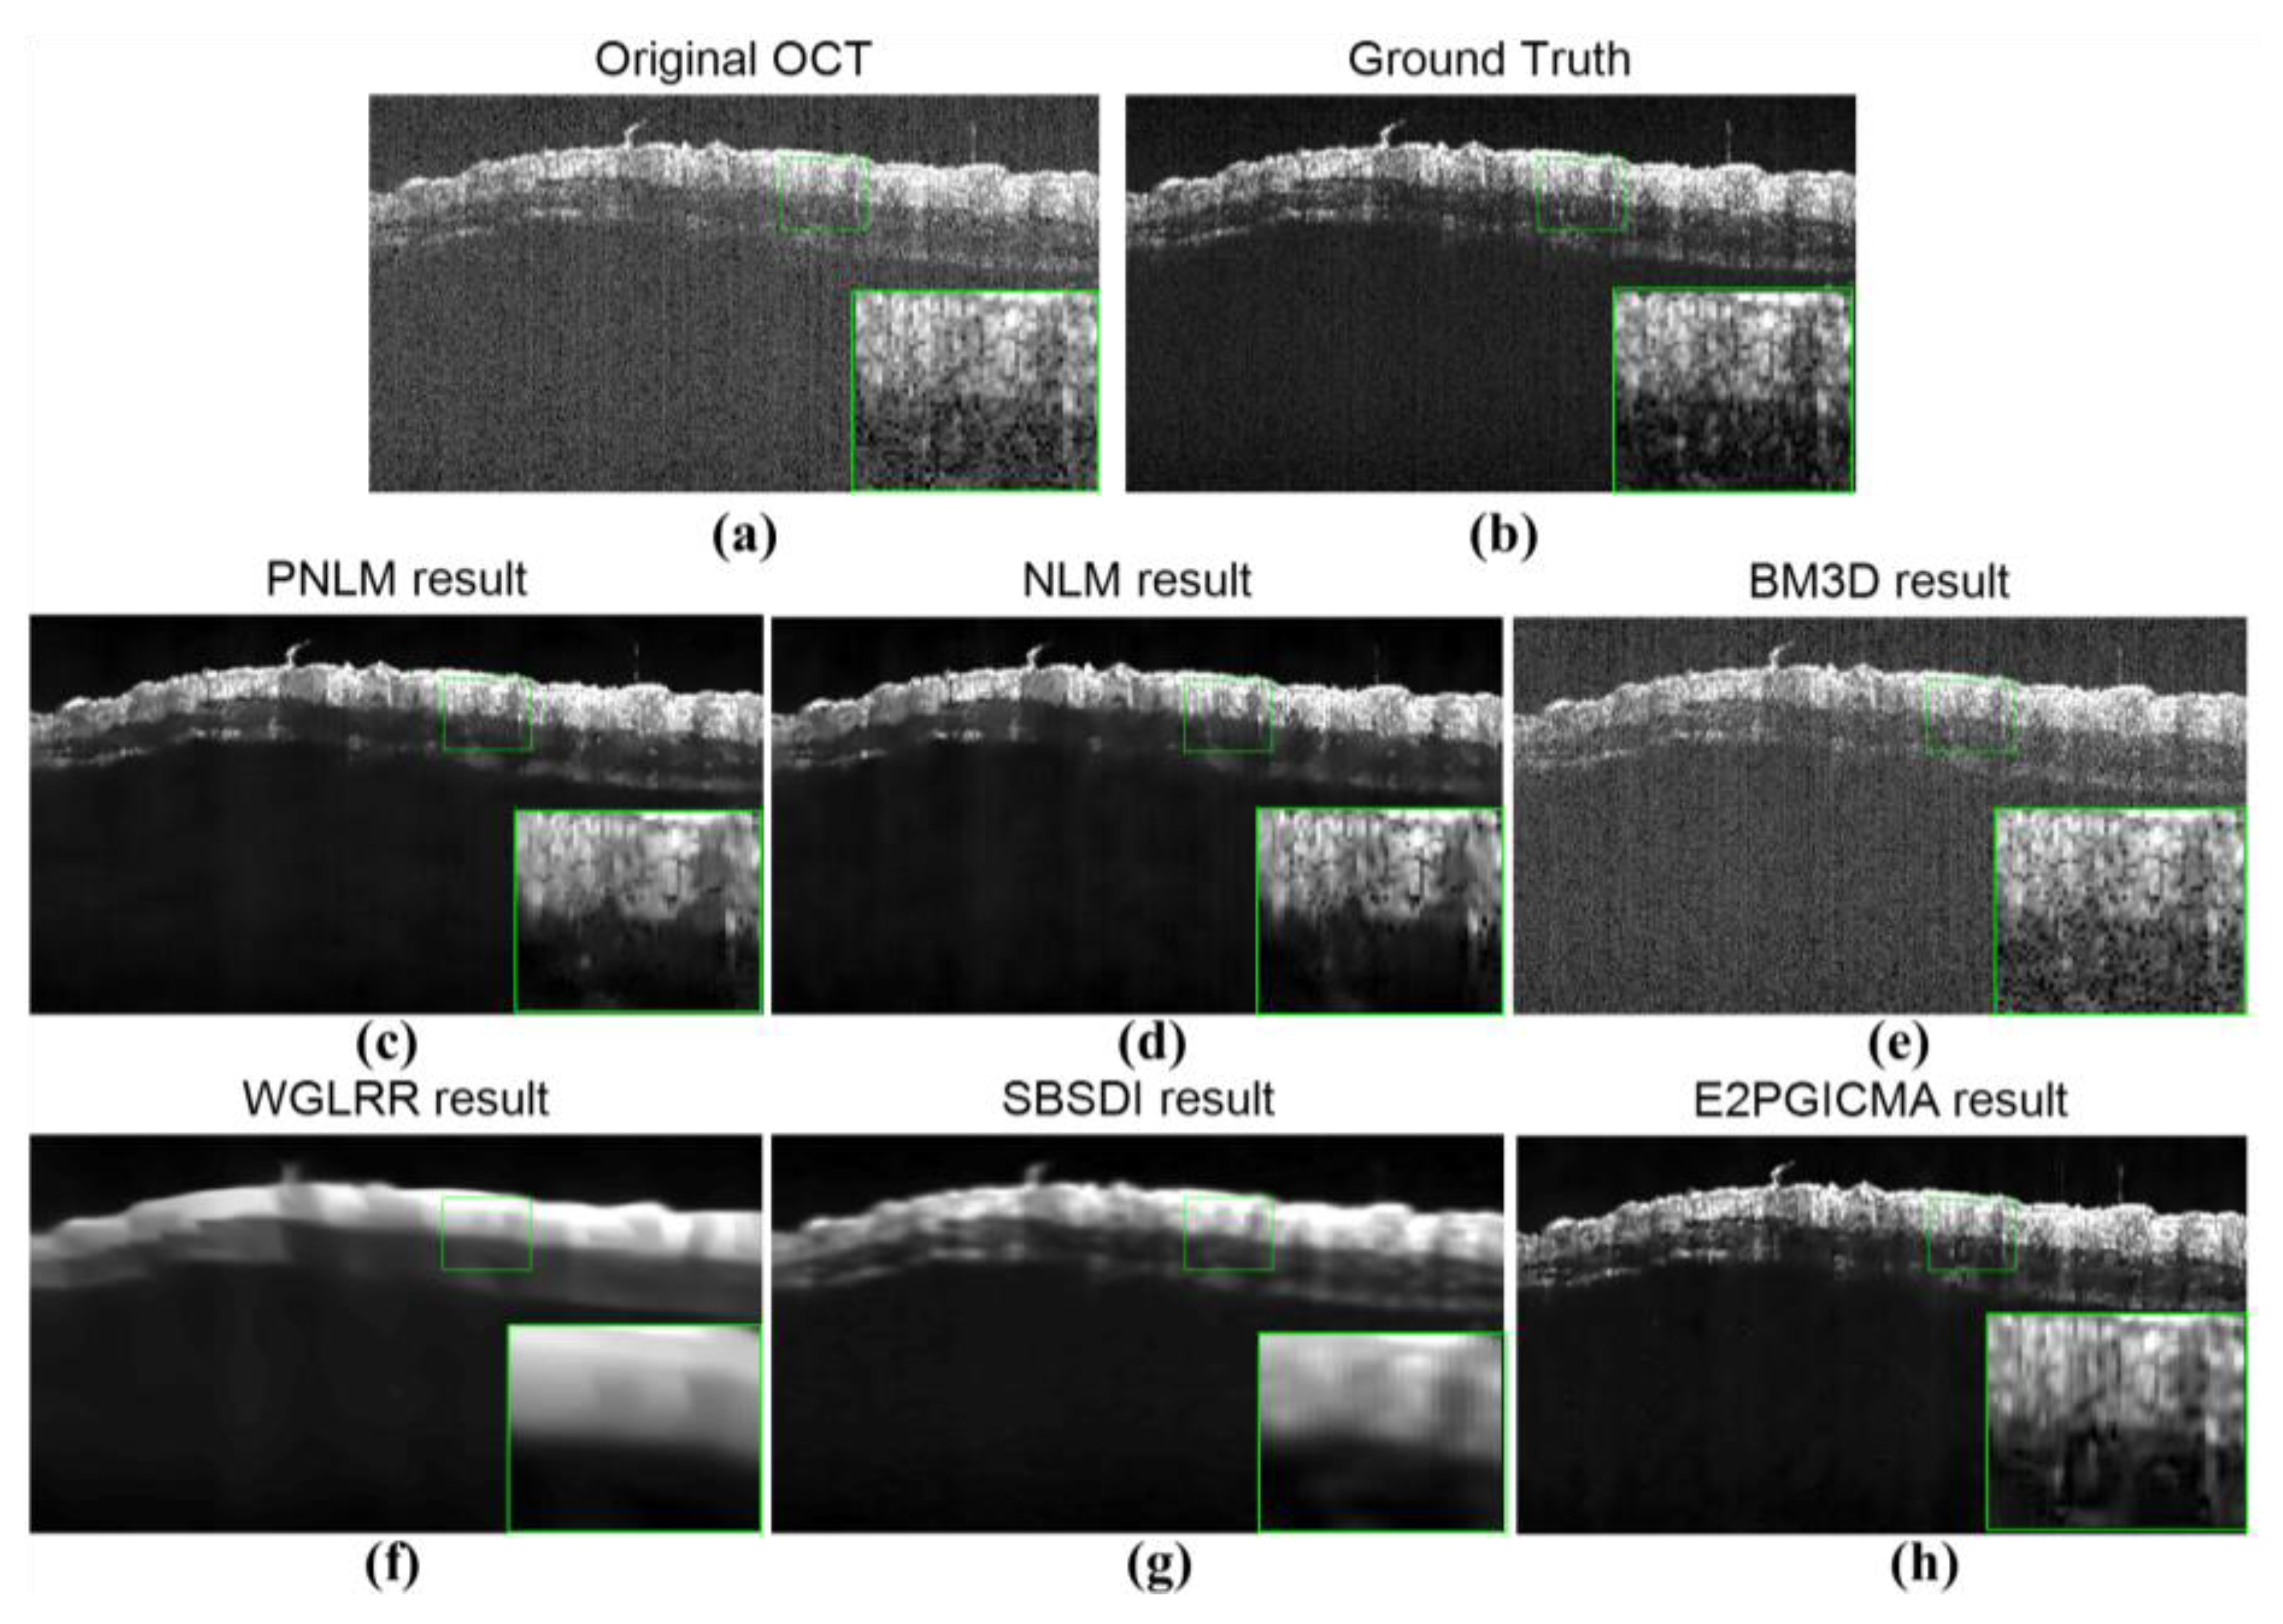
3.1. Results of Speckle Noise Reduction with the E2PGICMA-Based Method

Speckle noise reduction was implemented through the proposed method and validated with directed visual display and visualization. A-scan lines of the original OCT image, the ground truth, and the denoised OCT images were provided directly and evaluated visually.
The A-scan lines of the original OCT images and ground truth are shown in Figure 3a. The results show that the noise can be effectively suppressed in ground truth OCT images. Figure 3b shows the A-scan lines of the denoised OCT images with different estimations of the noisy standard deviation (σ = 5, 10, 20, 30, 40, 50, 70, and 100). The results demonstrated that, as σ increases, the A-scan lines become smoother; when σ = 10, the A-scan line can preserve the fine detail. Figure 3c shows the A-scan lines of the denoised OCT images with the different noise reduction methods. The results demonstrated that the SBSDI and E2PGICMA methods had a better noise reduction effect and superior detail preservation than the other methods.
Figure 4 shows the effect of speckle noise removal with different estimates of the noisy standard deviation (σ). Figure 4a shows the original OCT image of normal tissues. The red box represents the background ROI, the cyan boxes represent different foreground ROIs, the green box represents the area used to enlarge for direct viewing and evaluating, and the blue box represents the ROIs used to compute the CNR for evaluating the contrast of OCT images. Figure 4b–f shows the denoised OCT images and enlarged ROIs with the proposed method combined with different noise standard deviations (σ = 5, 10, 20, 30, 40, 50, 70, 100). As the noise standard deviation increased, the denoised OCT images became smoother and blurred. When the noise standard deviation σ = 10, the noise was effectively reduced, the fine structural details of OCT images were preserved, and a good visual effect was reached. Therefore, the estimated standard deviation (σ) is set as 10 through comparison with other noise reduction methods in the following research.
Figure 5 shows the effects of speckle noise reduction with different methods. Figure 5a shows the original OCT image. Five OCT images of normal skin tissues at the same location were randomly chosen and averaged as the ground truth (Figure 5b). Figure 5c–h shows the denoised OCT images with the PNLM, NLM, WGLRR [39], BM3D, SBSDI, and E2PGICMA methods. We could see that the results of the PNLM, NLM, WGLRR, SBSDI, and E2PGICMA had a better contrast than the BM3D method. The contrast and detail conservation of E2PGICMA method are better than that of other methods. Furthermore, the result of E2PGICMA method is similar to the ground truth (Figure 5b), which has fine structural details, and a good visual effect was also reached. However, the BM3D method has little effect in the reduction of speckle noise. Comprehensively, the E2PGICMA method is more efficient than the others. This method can preserve more textures and fine details than the other competing methods.

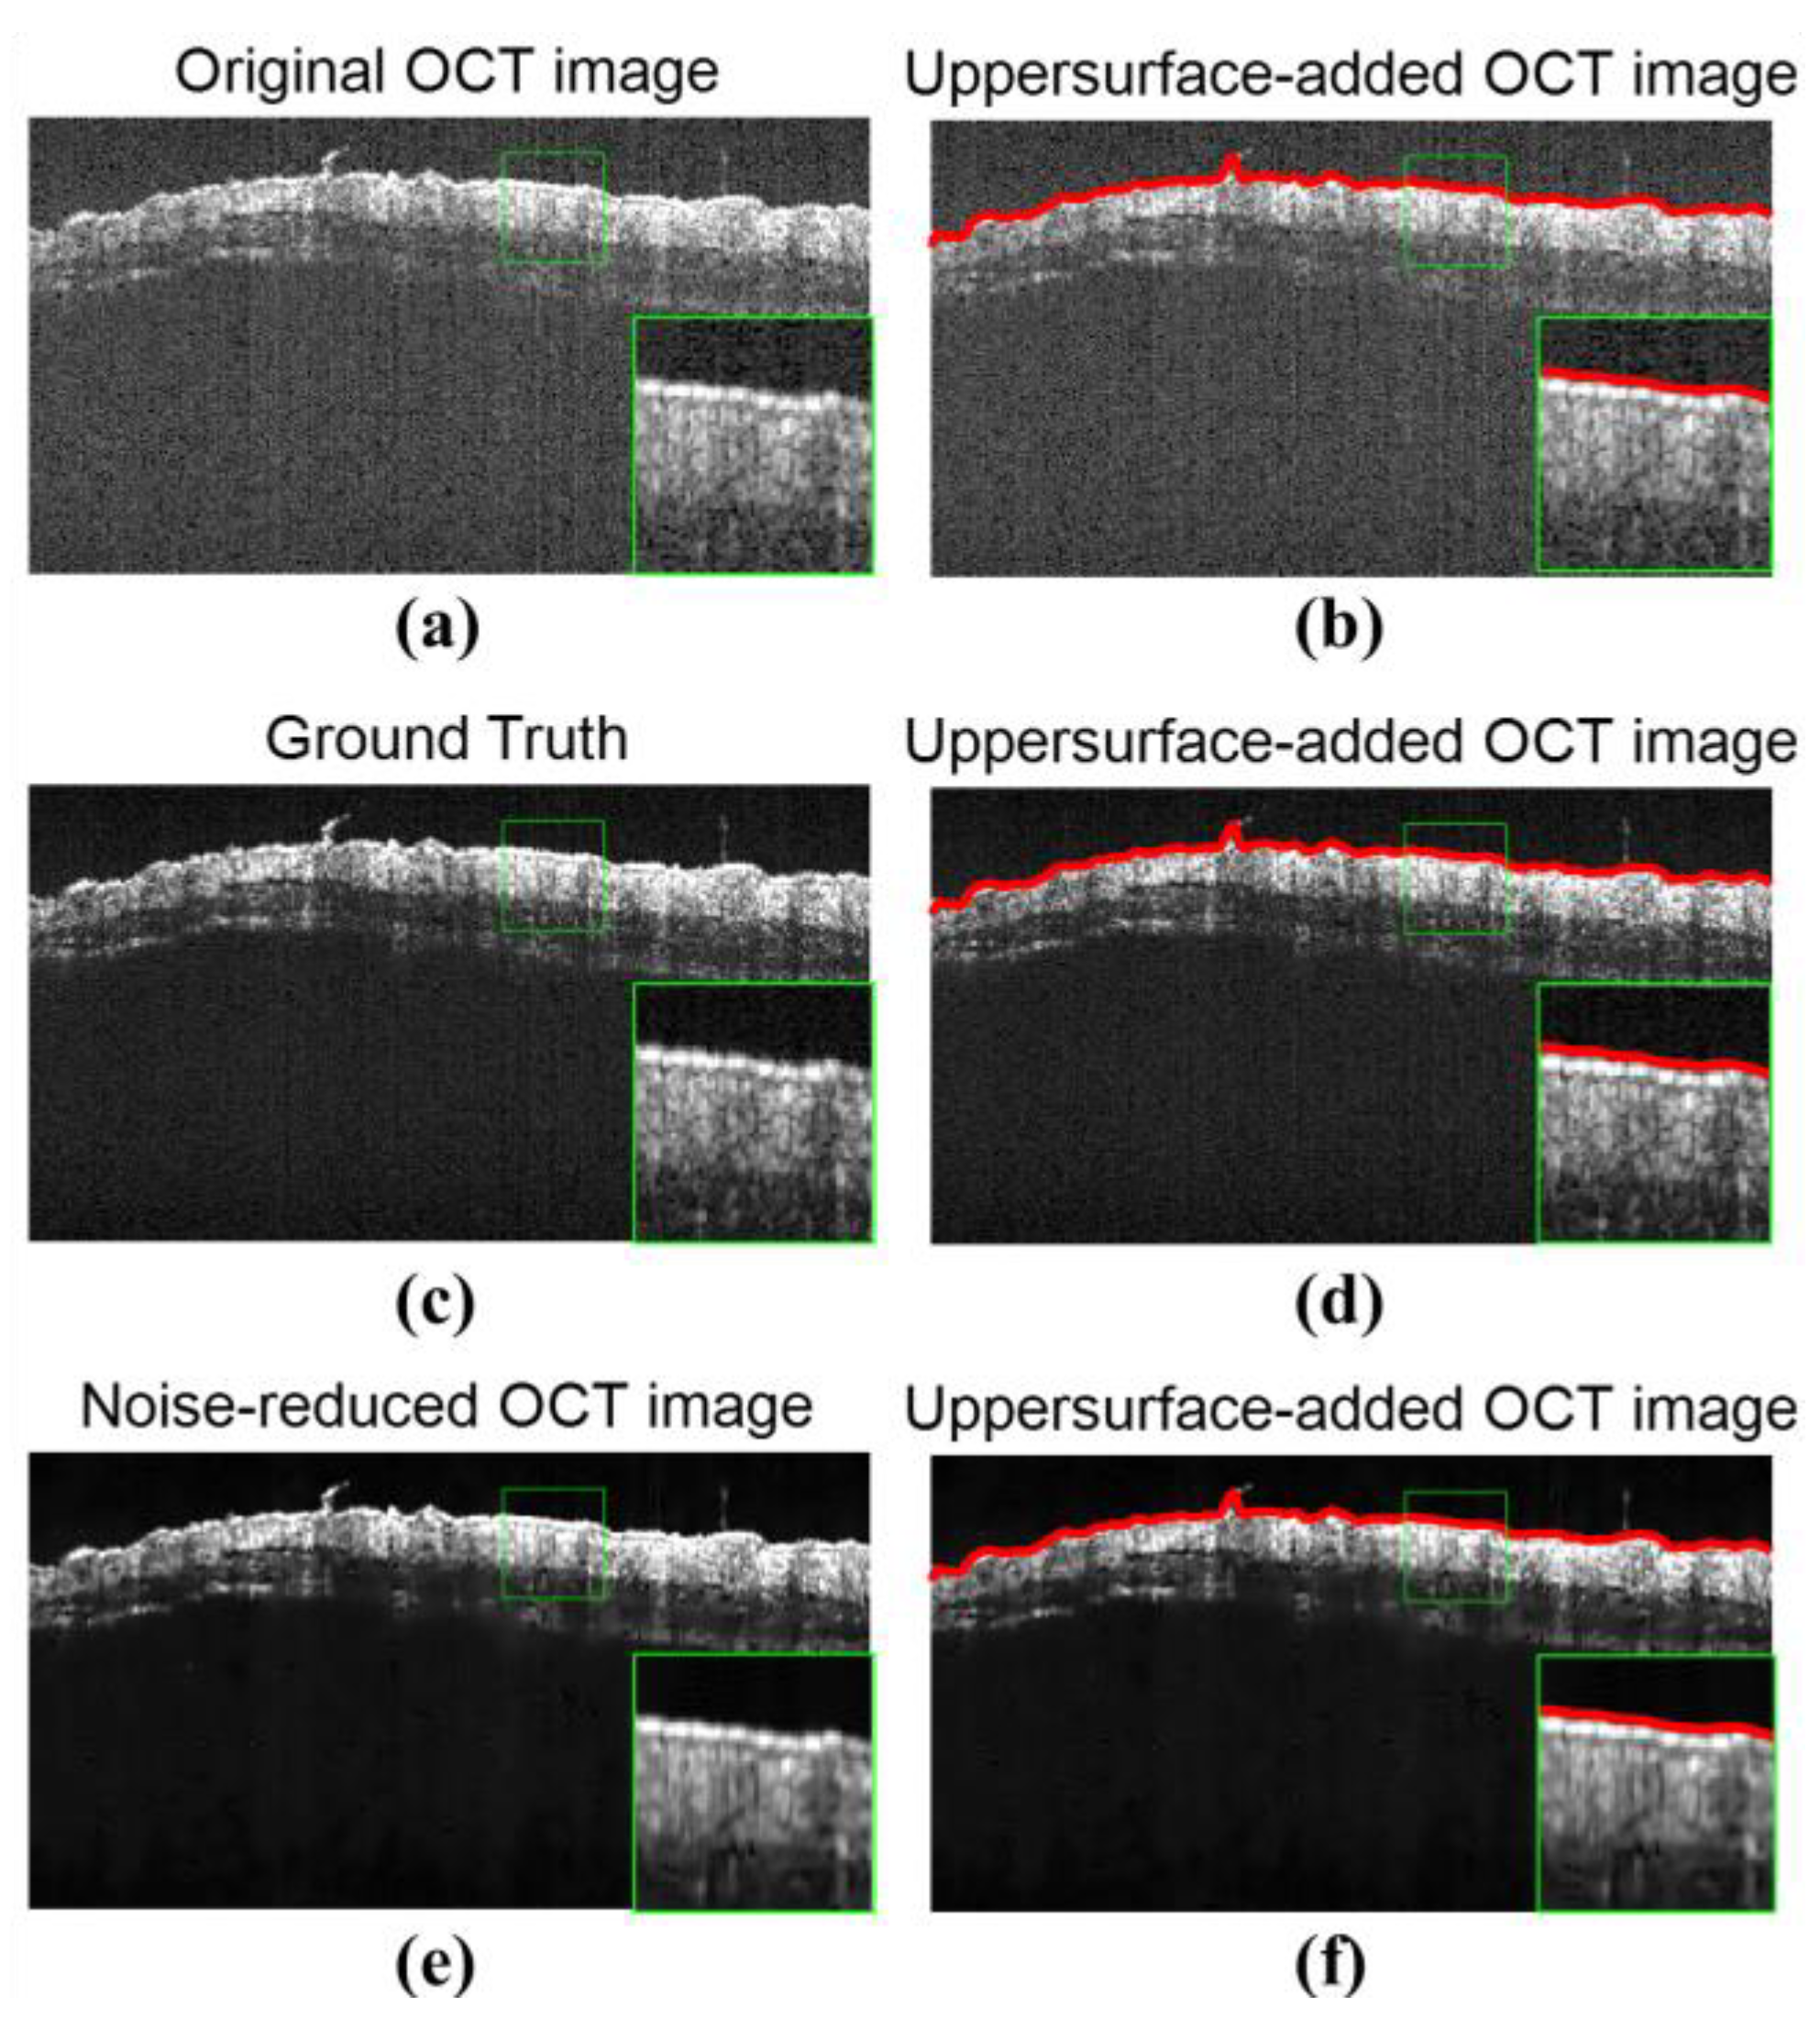
3.2. Results of Background Reduction with the Region Filling Algorithm

After speckle noise reduction, the background reduction was useful to enhance the contrast of OCT images and remove the noise above the upper boundary of OCT images. The useful information about the original OCT images presented the features of biological tissues. Hence, we removed the background through morphological analysis.
Figure 6 shows the background reduction results of the original OCT image, the ground truth, and the denoised OCT image. Figure 6a,c,e show the original OCT image, the ground truth, and the denoised OCT image, respectively. Figure 6b,d,f show the upper boundary of the original OCT images, the ground truth, and the denoised OCT image, respectively. Figure 6e shows the OCT images without speckle noise reduced by the E2PGICMA method.

3.3. Quantitative Validation of Noise Reduction

The validation of the proposed method included some quantitative parameters, including SNR, PSNR, CNR, SIMM, EPI, and ENL. The OCT images of normal mouse skin and OCT images of different noise standard deviations (σ) were used to compute these quantitative parameters. The quantitative parameters of the proposed method of different standard deviations (σ = 5, 10, 20, 30, 40, 50, 70, 100) were computed in an orderly manner. Table 1 lists the quantitative parameters. SNR and PSNR reached their maximum when σ = 10; and when σ continued to increase, SNR and PSNR decreased. The results also demonstrated that, when σ increased, the SIMM decreased. However, the CNR gradually increased with increasing standard deviation (σ) until these OCT images became blurred and unclear. Comparing with the reduction results of original OCT images, the reduction result is hardly dependent on the ground truth, and almost completely relied on the level of noise standard deviation (σ).
We quantitatively compared the proposed noise reduction method with other methods using SNR, PSNR, XCOR, CNR, SIMM, EPI, and ENL. The OCT images of normal mouse skins were utilized to compute these quantitative parameters. Table 2 lists the quantitative metrics with the different reduction methods. The results demonstrated that the SNR, PSNR, and XCOR of the E2PGICMA-based method were higher than those of the other methods. These values reached 15.05 dB, 27.48 dB, and 0.9959, respectively. The CNR of this proposed method was 6.63. It was larger than that of the BM3D and SBSDI methods and was lower than that of the PNLM, NLM, and WGLRR methods. The SSIM of this proposed method reached 249.40, which was only lower than that of the BM3D method (SSIM = 254.04). The EPI was 0.31, which was lower than that of the BM3D method (EPI = 0.49) and higher than other methods. However, the ENL of this method was lower than that of the NLM-based and WGLRR-based methods and higher than that of the BM3D-based method. Comprehensively, this proposed method had good performance of speckle noise reduction on OCT images.
We also acquired the computation times of these noise reduction methods. All the methods were run on the same laptop, implemented in MATLAB for B-scan OCT images, with a size of 250 × 460 pixels from the SS-OCT dataset. Table 3 presents the time cost of the proposed method with different noise standard deviations (σ). As the noise standard deviation increased, the time cost gradually became longer, ranging from 35.74 s to 553.90 s. Table 4 shows the computation time of the five denoising methods. The results demonstrated that the computation time of the E2PGICMA method was 41.27 s, which was larger than that of other methods. The shortest computation time was 3.04 s for the PNLM method. However, we found that these methods were difficult for real-time processing of these OCT images. Therefore, these methods would be a useful postprocessing solution of OCT images for noise suppression and removal.
Figure 6 shows the NRRs of the proposed method and the 3-D visualization of 200 B-scan OCT images before and after noise reduction. Figure 6a shows the range of the NRR, and Table 5 lists the NRRs of the proposed method and other methods. The results demonstrated that the NRRs were more than 88% and that the mean NRR of 200 B-scan OCT images was 91.14%. The background was effectively reduced, and the contrast of these OCT images was comprehensively enhanced. The NRR of one B-scan OCT image reached 89.99%, larger than that of BM3D, PNLM, WGLLR and SBSDI and lower than that of NLM. Figure 6b,c shows the 3-D OCT image in C-scan orientation and the top view, and the cardiac cycle of mouse can be viewed on the surface of 3-D image. Figure 6d,e shows the 3-D visualizations of 200 B-scan OCT images in the B-scan orientation before and after noise reduction. Speckle noise was suppressed effectively from the derma and muscle layers, and the deliberate structures were preserved finely.

4. Discussion

Noise in OCT images results in an incorrect recognition and interpretation of morphological characteristics such as layered structures (derma, fat, and muscle layers) [40]. To suppress noise while preserving and enhancing edges and preserving the geometric properties of the main structures, we developed an E2PGICMA-based noise reduction method to remove background and speckle noise. The noise of in vivo normal skin OCT images was divided into two components. E2PGIC was employed to reduce speckle noise, and morphological analysis was used to remove background noise. The qualitative evaluation was conducted by viewing the denoised OCT images and enlarged ROIs. Quantitative evaluation was also conducted by computing the proposed method’s SNR, PSNR, XCOR, CNR, SIMM, ENL, EPI, and NRR. The results demonstrated that the SNR, PSNR and XCOR were higher than those of the other methods (Table 2). This proposed method can effectively reduce the speckle and backgrounds of these normal skin OCT images.
Using the proposed method, we can provide the external patch prior guided internal clustering method for speckle noise reduction. For these normal skin OCT images, we found that, when the estimated standard deviation σ was chosen as 10, SNR and PSNR reached higher results (20.99 and 34.27 dB, respectively) than the other conventional methods, such as NLM and BM3D. As Figs. 4 and 5 shown, the denoised OCT images blur and become unclear, that is, this method let these OCT images inevitably distort. Textures of OCT images are easily deformed and smoothed because they are indistinguishable from noise. We think that, as the noise standard deviation (σ) increases, the distinction between image texture and noise becomes less and less. Speckle is distributed in OCT images as much as possible. Hence, these OCT images become blur after reduction with the increasing noise standard deviation.
Noise reduction enhanced the OCT image quality [41] and visualization effect (Figure 6). The noise removal ratio of the proposed E2PGICMA method reached more than 0.8999, which also demonstrated that this proposed method could effectively reduce the speckle and background. The quantitative and qualitative evaluations demonstrated that our proposed method provides good performance in the removal of the background. Furthermore, background reduction has not been widely researched compared with speckle noise reduction [42], and we further provided a pilot method to reduce the background (Figure 6). The NRRs of the OCT image under respiration motion were lower than those of the resting state. We found that the NRRs changed circularly with respiration motion. Such a method would help improve the quality of OCT images to effectively evaluate the detailed structural variations [43] of biological tissues.
The limitation of the proposed E2PGICMA method is the long computation time compared with other methods, which usually reaches more than 40 s under the current image size (250 × 460 pixels) and the estimated standard deviation of speckle noise (σ = 10). This algorithm could be improved by decreasing the time cost. This method was derived from ref. [30], combining with the morphological analysis, hence, the high algorithm complexity would influence the computation cost. A possible improvement would be using a graphic processing unit to accelerate parallel computation and add more OCT images to evaluate the statistically significant difference. Furthermore, this method would be employed for real-time OCT image processing [44] during intraoperative imaging and diagnosis, including different pathological OCT images, to enhance the generalization capability of this proposed method.

5. Conclusions

In summary, we propose an external patch prior guided internal clustering and morphological analysis (E2PGICMA)-based method for noise reduction of mouse skin OCT images. In vivo experiments are conducted to acquire OCT images, and the proposed method is used to remove the OCT images’ noise. The quantitative and qualitative evaluation metrics demonstrated that this method could effectively remove speckle and background to preserve the fine structure and improve the image quality. It can be widely employed in OCT imaging for biological tissues. This proposed method outperforms other popular OCT despeckling methods and has high SNR and fine detail preservation. It has the potential to increase the accuracy of available segmentation methods, especially for automatic identification of abnormalities in 3-D OCT datasets.

Author Contributions

Conceptualization, Y.F. and Y.L; methodology, Y.F.; software, Y.F. and Y.L.; validation, Y.L. and T.G.; data curation, Y.L.; writing—original draft preparation, Y.F. and Y.L.; writing—review and editing, Y.F. and Y.L.; visualization, T.G.; supervision, Y.F.; project administration, Y.F.; funding acquisition, Y.F. and X.T. All authors have read and agreed to the published version of the manuscript.

Funding

This research was funded by the National Natural Science Foundation of China (NSFC), grant number 82172112, and 81901907; and the Beijing Institute of Technology Research Fund Program for Young Scholars, the Fundamental Research Funds for the Central Universities, grant number LY LY2022-22, and 2021CX11018.

Institutional Review Board Statement

Not applicable.

Informed Consent Statement

Not applicable.

Data Availability Statement

Data underlying the results presented in this paper are not publicly available but may be obtained from the authors upon reasonable request.

Acknowledgments

The authors thank Yufang Cui and Qiong Ma (Beijing Institute of Radiation Medicine, Beijing, China) for helping to analyze the histology of normal mouse skin specimens.

Conflicts of Interest

The authors declare no conflict of interest.

References

  1. Huang, D.; Swanson, E.A.; Lin, C.P.; Schuman, J.S.; Stinson, W.G.; Chang, W.; Hee, M.R.; Flotte, T.; Gregory, K.; Fujimoto, G. Optical coherence tomography. Science 1991, 254, 1178–1181. [Google Scholar] [CrossRef] [PubMed] [Green Version]
  2. Chou, H.Y.; Huang, S.L.; Tjiu, J.W.; Chen, H.H. Dermal epidermal junction detection for full-field optical coherence tomography data of human skin by deep learning. Comput. Med. Imaging Graph. 2021, 87, 101833. [Google Scholar] [CrossRef] [PubMed]
  3. Sleman, A.A.; Soliman, A.; Elsharkawy, M.; Giridharan, G.; Ghazal, M.; Sandhu, H.; Schaal, S.; Keynton, R.; Elmaghraby, A.; El-Baz, A. A novel 3D segmentation approach for extracting retinal layers from optical coherence tomography images. Med. Phys. 2021, 48, 1584–1595. [Google Scholar] [CrossRef]
  4. Wu, X.; Zhang, Y.; Zhang, P.; Hui, H.; Jing, J.; Tian, F.; Jiang, J.; Yang, X.; Chen, Y.; Tian, J. Structure attention co-training neural network for neovascularization segmentation in intravascular optical coherence tomography. Med. Phys. 2022, 46, 1723–1738. [Google Scholar] [CrossRef] [PubMed]
  5. Carrasco-Zevallos, O.M.; Viehland, C.; Keller, B.; Draelos, M.; Kuo, A.N.; Toth, C.A.; Izatt, J.A. Review of intraoperative optical coherence tomography: Technology and applications [Invited]. Biomed. Opt. Express 2017, 8, 1607–1637. [Google Scholar] [CrossRef] [PubMed] [Green Version]
  6. Schmitt, J.M.; Xiang, S.H.; Yung, K.M. Speckle in optical coherence tomography. J. Biomed. Opt. 1999, 4, 95–105. [Google Scholar] [CrossRef]
  7. Li, R.; Yin, H.; Hong, J.; Wang, C.; He, B.; Chen, Z.; Li, Q.; Xue, P.; Zhang, X. Speckle reducing OCT using optical chopper. Opt. Express 2020, 28, 4021–4031. [Google Scholar] [CrossRef]
  8. Iftimia, N.; Bouma, B.E.; Tearney, G.J. Speckle reduction in optical coherence tomography by “path length encoded” angular compounding. J. Biomed. Opt. 2003, 8, 260–263. [Google Scholar] [CrossRef] [PubMed]
  9. Desjardins, A.E.; Vakoc, B.J.; Oh, W.Y.; Motaghiannezam, S.M.; Tearney, G.J.; Bouma, B.E. Angle-resolved optical coherence tomography with sequential angular selectivity for speckle reduction. Opt. Express 2007, 15, 6200. [Google Scholar] [CrossRef] [Green Version]
  10. Kennedy, B.F.; Hillman, T.R.; Curatolo, A.; Sampson, D.D. Speckle reduction in optical coherence tomography by strain compounding. Opt. Lett. 2010, 35, 2445. [Google Scholar] [CrossRef]
  11. Alonso-Caneiro, D.; Read, S.A.; Collins, M.J. Speckle reduction in optical coherence tomography imaging by affine-motion image registration. J. Biomed. Opt. 2011, 16, 116027. [Google Scholar] [CrossRef] [PubMed] [Green Version]
  12. Pircher, M.; Gotzinger, E.; Leitgeb, R.A.; Fercher, A.F.; Hitzenberger, C.K. Speckle reduction in optical coherence tomography by frequency compounding. J. Biomed. Opt. 2003, 8, 565–569. [Google Scholar] [CrossRef]
  13. Xu, J.; Ou, H.; Sun, C.; Chui, P.C.; Yang, V.X.D.; Lam, E.Y.; Wong, K.K.Y. Wavelet domain compounding for speckle reduction in optical coherence tomography. J. Biomed. Opt. 2013, 18, 096002. [Google Scholar] [CrossRef] [Green Version]
  14. Cheng, J.; Tao, D.; Quan, Y.; Wong, D.W.K.; Cheung, G.C.M.; Akiba, M.; Liu, J. Speckle reduction in 3D optical coherence tomography of retina by A-scan reconstruction. IEEE Trans. Med. Imaging 2016, 35, 2270–2279. [Google Scholar] [CrossRef] [PubMed]
  15. Ma, Y.; Chen, X.; Zhu, W.; Cheng, X.; Xiang, D.; Shi, F. Speckle noise reduction in optical coherence tomography images based on edge-sensitive cGAN. Biomed. Opt. Express 2018, 9, 5129–5146. [Google Scholar] [CrossRef] [PubMed]
  16. Chong, B.; Zhu, Y.K. Speckle reduction in optical coherence tomography images of human finger skin by wavelet modified BM3D filter. Opt. Commun. 2013, 291, 461–469. [Google Scholar] [CrossRef]
  17. Fang, L.; Li, S.; McNabb, R.P.; Nie, Q.; Kuo, A.N.; Toth, C.A.; Izatt, J.A.; Farsiu, S. Fast acquisition and reconstruction of optical coherence tomography images via sparse representation. IEEE Trans. Med. Imaging 2013, 32, 2034–2049. [Google Scholar] [CrossRef] [PubMed] [Green Version]
  18. Anantrasirichai, N.; Nicholson, L.; Morgan, J.E.; Erchova, I.; Mortlock, K.; North, R.V.; Albon, J.; Achim, A. Adaptive-weighted bilateral filtering and other pre-processing techniques for optical coherence tomography. Comput. Med. Imaging Graph. 2014, 38, 526–539. [Google Scholar] [CrossRef] [PubMed] [Green Version]
  19. Xu, M.; Tang, C.; Chen, M.; Qiu, Y.; Lei, Z. Texture preservation and speckle reduction in optical coherence tomography using the shearlet-based total variation algorithm. Opt. Lasers Eng. 2019, 122, 265–283. [Google Scholar] [CrossRef]
  20. Aum, J.; Kim, J.H.; Jeong, J. Effective speckle noise suppression in optical coherence tomography images using non-local means denoising filter with double Gaussian anisotropic kernels. Appl. Opt. 2015, 54, D43–D50. [Google Scholar] [CrossRef]
  21. Yu, H.; Gao, J.; Li, A. Probability-based non-local means filter for speckle noise suppression in optical coherence tomography images. Opt. Lett. 2016, 41, 994–997. [Google Scholar] [CrossRef] [PubMed]
  22. Fang, L.; Li, S.; Nie, Q.; Izatt, J.A.; Toth, C.A.; Farsiu, S. Sparsity based denoising of spectral domain optical coherence tomography images. Biomed. Opt. Express 2012, 3, 927–942. [Google Scholar] [CrossRef] [PubMed] [Green Version]
  23. Kafieh, R.; Rabbani, H.; Selesnick, I. Three-dimensional data-driven multi scale atomic representation of optical coherence tomography. IEEE Trans. Med. Imaging 2015, 34, 1042–1062. [Google Scholar] [CrossRef] [PubMed]
  24. Shi, F.; Cai, N.; Gu, Y.; Hu, D.; Ma, Y.; Chen, Y.; Chen, X. DeSpecNet: A CNN-based method for speckle reduction in retinal optical coherence tomography images. Phys. Med. Biol. 2019, 64, 175010. [Google Scholar] [CrossRef]
  25. Qiu, B.; Huang, Z.; Liu, X.; Meng, X.; You, Y.; Liu, G.; Yang, K.; Maier, A.; Ren, Q.; Lu, Y. Noise reduction in optical coherence tomography images using a deep neural network with perceptually-sensitive loss function. Biomed. Opt. Express 2020, 11, 817–830. [Google Scholar] [CrossRef]
  26. Wang, M.; Zhu, W.; Yu, K.; Chen, Z.; Shi, F.; Zhou, Y.; Ma, Y.; Peng, Y.; Bao, D.; Feng, S.; et al. Semi-supervised capsule cGAN for speckle noise reduction in retinal OCT images. IEEE Trans. Med. Imaging 2021, 40, 1168–1183. [Google Scholar] [CrossRef]
  27. Xu, M.; Tang, C.; Hao, F.; Chen, M.; Lei, Z. Texture preservation and speckle reduction in poor optical coherence tomography using the convolutional neural network. Med. Image Anal. 2020, 64, 101727. [Google Scholar] [CrossRef] [PubMed]
  28. Lee, M.; Bang, H.; Lee, E.; Won, Y.; Kim, K.; Park, S.; Yoo, H.; Lee, S. Lateral image reconstruction of optical coherence tomography using one-dimensional deep deconvolution network. Lasers Surg. Med. 2022, 54, 895–906. [Google Scholar] [CrossRef]
  29. Zhang, Y.; Liu, T.; Singh, M.; Çetintaş, E.; Luo, Y.; Rivenson, Y.; Larin, K.V.; Ozcan, A. Neural network-based image reconstruction in swept-source optical coherence tomography using undersampled spectral data. Light Sci. Appl. 2021, 10, 155. [Google Scholar] [CrossRef]
  30. Chen, F.; Zhang, L.; Yu, H. External patch prior guided internal clustering for image denoising. In Proceedings of the IEEE International Conference on Computer Vision (ICCV), Santiago, Chile, 7–13 December 2015; pp. 603–611. [Google Scholar]
  31. Fan, Y.W.; Ma, L.F.; Jiang, W.P.; Luo, S.T.; Zhang, X.R.; Liao, H.E. Optimized optical coherence tomography imaging with Hough transform-based fixed-pattern noise reduction. IEEE Access 2018, 6, 32087–32096. [Google Scholar] [CrossRef]
  32. Cheimariotis, G.; Chatzizisis, Y.S.; Koutkias, V.G.; Toutouzas, K.; Giannopoulos, A.; Riga, M.; Chouvarda, I.; Antoniadis, A.P.; Doulaverakis, C.; Tsamboulatidis, I.; et al. Automatic detection of lumen border in intravascular OCT images. Comput. Methods Programs Biomed. 2017, 151, 21–32. [Google Scholar] [CrossRef] [PubMed]
  33. Roy, A.G.; Conjeti, S.; Carlier, S.G.; Dutta, P.K.; Kastrati, A.; Laine, A.F.; Navab, N.; Katouzian, A.; Sheet, D. Lumen segmentation in intravascular optical coherence tomography using backscattering tracked and initialized random walks. IEEE J. Biomed. Health Inform. 2016, 20, 606–614. [Google Scholar]
  34. Fan, Y.; Luo, S.; Huo, L.; Liu, Y.; Li, X.; Xie, H.; Kang, H. An imaging analysis and reconstruction method for multiple-micro-electro-mechanical system mirrors-based off-centre scanning optical coherence tomography probe. Laser Phys. Lett. 2020, 17, 075601. [Google Scholar] [CrossRef]
  35. Fan, Y.; Ma, Q.; Li, M.; Luan, D.; Kang, H. Quantitative investigation of laser ablation based on real-time temperature variations and OCT images for laser treatment applications. Lasers Surg. Med. 2022, 54, 459–473. [Google Scholar] [CrossRef] [PubMed]
  36. Zoran, D.; Weiss, Y. From learning models of natural image patches to whole image restoration. In Proceedings of the 2011 International Conference on Computer Vision (ICCV), Barcelona, Spain, 6–13 November 2011. [Google Scholar]
  37. Wang, Z.; Bovik, A.C.; Sheikh, H.R.; Simoncelli, E.P. Image quality assessment: From error visibility to structural similarity. IEEE Trans. Image Process. 2004, 13, 600–612. [Google Scholar] [CrossRef] [Green Version]
  38. Pizurica, A.; Jovanov, L.; Huysmans, B.; Zlokolica, V.; De Keyser, P.; Dhaenens, F.; Philips, W. Multiresolution denoising for optical coherence tomography: A review and evaluation. Curr. Med. Imaging Rev. 2008, 4, 270–284. [Google Scholar] [CrossRef]
  39. Tang, C.; Cao, L.; Chen, J.; Zheng, X. Speckle noise reduction for optical coherence tomography images via non-local weighted group low-rank representation. Laser Phys. Lett. 2017, 14, 5. [Google Scholar] [CrossRef]
  40. Ghosh, B.; Mandal, M.; Mitra, P.; Chatterjee, J. Attenuation corrected-optical coherence tomography for quantitative assessment of skin wound healing and scar morphology. J. Biophotonics. 2021, 14, e202000357. [Google Scholar] [CrossRef]
  41. Kande, N.A.; Dakhane, R.; Dukkipati, A.; Yalavarthy, P.K. SiameseGAN: A generative model for denoising of spectral domain optical coherence tomography images. IEEE Trans. Med. Imaging 2021, 40, 180–192. [Google Scholar] [CrossRef]
  42. Chen, Z.; Zeng, Z.; Shen, H.; Zheng, X.; Dai, P.; Ouyang, P. DN-GAN: Denoising generative adversarial networks for speckle noise reduction in optical coherence tomography images. Biomed. Signal Process. Control 2020, 55, 101632. [Google Scholar] [CrossRef]
  43. Fan, Y.W.; Ma, Q.; Xin, S.H.; Peng, R.Y.; Kang, H.X. Quantitative and qualitative evaluation of supercontinuum laser-induced cutaneous thermal injuries and their repair with OCT images. Lasers Surg. Med. 2021, 53, 252–262. [Google Scholar] [CrossRef]
  44. Boppart, S.A.; Brown, J.Q.; Farah, C.S.; Kho, E.; Marcu, L.; Saunders, C.M.; Sterenborg, H.J.C.M. Label-free optical imaging technologies for rapid translation and use during intraoperative surgical and tumor margin assessment. J. Biomed. Opt. 2017, 23, 021104. [Google Scholar] [CrossRef] [PubMed] [Green Version]
Figure 1. OCT image and corresponding histology of normal mouse skin tissue. (a,c) The original OCT image of the normal skin tissue (Scale bar: 1000 µm). (b) Histological sections of mouse skin tissues (Scale bar: 500 µm). (d,e) The noise-reduced OCT images with the proposed method corresponding to (a,c) (Scale bar: 1000 µm).
Photonics 09 00543 g001
Figure 2. Background reduction using morphological analysis. (a) The procedure of background reduction. (b) The procedure of finding the upper boundary during background reduction.
Photonics 09 00543 g002
Figure 3. The A-scan lines of original, ground truth, and denoised OCT images. (a) The A-scan lines of the original OCT image and ground truth. (b) The A-scan lines of the denoised OCT images with different estimations of the noisy standard deviation (σ = 5, 10, 20, 30, 40, 50, 70, and 100). (c) The different noise reduction methods used the A-scan lines of the denoised OCT images.
Photonics 09 00543 g003
Figure 4. Noise reduction with different estimations of the noisy standard deviation (σ). (a) The original OCT image of the normal skin tissue in vivo. (bf) Denoised OCT images with different estimations of the noisy standard deviation (σ = 5, 10, 20, 30, and 40).
Photonics 09 00543 g004
Figure 5. Speckle noise reduction with the different methods. (a) The original OCT image of normal mouse skin in vivo. (b) The ground truth is made with the averaged value of five OCT images with OCT scanning at the same location. (ch) The OCT images and enlarged ROIs with these different noise-reduction methods corresponding to the PNLM, NLM, BM3D, WGLRR, SBSDI and E2PGICMA methods.
Photonics 09 00543 g005
Figure 6. The background reduction. (a,c) Original OCT image and the ground truth, (b,d) the upper surface boundary in the original OCT image and the ground truth, (e) OCT image with speckle noise reduction with E2PGICMA (σ = 20), (f) upper surface boundary of speckle-reduced OCT image.
Photonics 09 00543 g006
Table 1. Quantitative evaluations of the proposed method with the different noise standard deviations (σ).
σSNRPSNRCNRSSIMEPIENL
Original (σ = 5)17.9331.213.65257.361.5227.59
517.9331.213.66257.391.5327.60
Original (σ = 10)20.9934.276.65249.380.3037.84
1020.9934.276.63249.400.3137.87
Original (σ = 20)17.9331.213.66257.361.5327.60
2018.9032.1810.96223.870.1172.04
Original (σ = 30)18.0531.3313.91211.140.0993.61
3018.0531.3313.88210.950.0992.99
Original (σ = 40)17.6930.9715.14203.810.0897.84
4017.6930.9715.13203.770.0997.79
Original (σ = 50)17.4130.6915.73197.800.08106.17
5017.4130.6915.75197.750.08105.89
Original (σ = 70)17.0330.3116.87189.250.07127.29
7017.0430.3317.07189.240.07131.24
Original (σ = 100)16.4229.7017.81168.300.06168.28
10016.4329.7118.04168.560.07166.04
Table 2. Quantitative evaluations of the different noise reduction methods.
MethodsSNRPSNRXCORCNRSSIMEPIENL
Original20.9934.270.99586.65249.380.3037.84
BM3D15.8518.990.98672.32254.040.4923.42
PNLM20.6933.970.99538.27243.870.2445.50
NLM20.7734.050.99526.96248.440.2634.98
WGLRR17.3730.650.992415.31200.180.0583.82
SBSDI17.2230.400.99164.17207.000.0814.06
Proposed method (σ = 10)20.9934.270.99596.63249.400.3137.87
Table 3. The computation time of the proposed method with different noise standard deviations (σ).
σ5102030405070100
Times cost (s)35.7441.2778.04216.11255.74288.10354.83553.90
Table 4. Quantitative evaluations of the different noise reduction methods.
MethodBM3DPNLMWGLRRNLMSBSDIE2PGICMA (σ = 10)
Times cost (s)3.613.0429.9238.2212.9441.27
Table 5. The NRRs of the proposed E2PGICMA method.
MethodsBM3DPNLMNLMWGLLRSBSDIThis Method (σ = 10)
NRR [%]89.1288.9490.2388.8088.8889.99
Publisher’s Note: MDPI stays neutral with regard to jurisdictional claims in published maps and institutional affiliations.

