Article

Combination of GIS and Multivariate Analysis to Assess the Soil Heavy Metal Contamination in Some Arid Zones

by
Radwa A. El Behairy
1,
Ahmed A. El Baroudy
1,
Mahmoud M. Ibrahim
1,
Elsayed Said Mohamed
2,3,
Nazih Y. Rebouh
3 and
Mohamed S. Shokr
1,*
1
Soil and Water Department, Faculty of Agriculture, Tanta University, Tanta 31527, Egypt
2
National Authority for Remote Sensing and Space Sciences, Cairo 1564, Egypt
3
Department of Environmental Management, Peoples’ Friendship University of Russia (RUDN University), 6 Miklukho-Maklaya Street, 117198 Moscow, Russia
*
Author to whom correspondence should be addressed.
Agronomy 2022, 12(11), 2871; https://doi.org/10.3390/agronomy12112871
Submission received: 18 October 2022 / Revised: 11 November 2022 / Accepted: 14 November 2022 / Published: 16 November 2022
(This article belongs to the Special Issue Remediation of Heavy Metal/Organic Pollutant Contaminated Farmland)

Abstract

:
Recent decades have witnessed a danger to food security as well as to human health because of pollutants’ negative impact on crop quality. An accurate estimate of the heavy metal concentrations in Egypt’s north Nile Delta is required to lower the high concentration levels of heavy metal in the soil as a means to develop a remediation strategy that stabilizes heavy metals in contaminated soil. Using a geo-accumulation index (I-geo), contamination factor (CF), Improved Nemerow’s Pollution Index (Pn), and Potential Ecological Risk Index (PERI), supported by GIS; principal component analysis (PCA), and cluster analysis, six heavy metals (As, Co, Cu, Ni, V, and Zn) were analyzed from 15 soil profile layers (61 soil samples) to determine the extent of the soil contamination in the area studied. The findings demonstrate the widespread I-geo contamination of As, Co, Cu, Ni, V, and Zn in different layers. The ranges for the I-geo values were from −8.2 to 5.3; 4.11 to 1.8; 6.4 to 1.9; −9.7 to 2.8; −6.3 to 2.9; and from −12.5 to 2.4 for As, Co, Cu, Ni, V, and Zn, respectively. I-geo categorization therefore ranged from uncontaminated to strongly/extremely contaminated. The CF values varied from 0.01 to 60.6; 0.09 to 5.17; 0.02 to 10.51; 0 to 10.51; 0.02 to 7.12; and 0 to 7.68 for As, Co, Cu, Ni, V, and Zn, respectively. In decreasing sequence, the CFs are arranged as follows: CF (As), CF (Ni), CF (Zn), CF (V), CF (Cu), and CF (Co). Most of the research region (71.9%) consisted of a class of moderately to heavily polluted areas. Additionally, a large portion of the study region (49.17%) has a very high risk of contamination, as per the results of the PERI index. The use of a correlation matrix, cluster analysis, and principal component analysis(PCA) to evaluate the variability in the soil’s chemical content revealed the impact from anthropogenic activities on the heavy metal concentration levels in the study area’s soil. The current findings reflect the poor quality of management in the research region, which led to the increase in the concentration of heavy metals in the soil. Decision-makers could use the outcomes from the spatial distribution maps for contaminants and their levels as a basis for creating heavy metal mitigation strategies.

1. Introduction

Concern about the effects of heavy metal soil pollution has grown globally for both human health and food security due to the expansion of urbanization, industrialization, and population growth [1]. A high concentration of heavy metals causes a decrease in crop yields, degradation in the environment, and damage in soil [2]. Heavy metal enrichment in the food chain has a negative impact on human health [3]. The Nile Delta’s soil quality is continuously declining because of many reasons, such as the increase in the number of factories and their emissions, urban expansion, the rising volume of traffic, and the use of wastewater and garbage deposits [4]. The Nile Delta is one of the world’s most densely populated areas and has long been noted for its agricultural activities [5]. This area relies on wastewater for irrigation processes; the Nile water is mixed with agricultural and industrial drainage wastewater from the El Gharbia main drain (Kitchenr), Egypt [6]. Across the regional scales, the distribution of heavy metal soil pollution is unequal [7]. The spatial dispersion of various contributing elements typically varies. Some of the contributors, such as sewage irrigation, pesticide addition, traffic, mining, or industrial emissions, etc., are more likely to be observed locally or at close ranges, whereas others, such as the weathering of parent materials, are more likely to be observed at a further distance [8,9,10,11]. Intensive farming methods need the application of a large quantity of fertilizers regularly in order to supply enough nitrogen (N), phosphorous (P), and potassium (K) for crop growth. When fertilizers are applied continuously, the compounds used to supply these elements may contain trace levels of trace elements, which could dramatically raise the soil’s mineral content [6,12]. Heavy metals in a particular area are redistributed because of human activity [2]. Analyzing the distribution pattern of heavy metal contamination can allow for a preliminary assessment and screening of the different types of pollution sources [13]. Multivariate statistical analysis is mostly used to analyze pollution sources by first determining the internal laws of the data and then identifying the main pollution factors. Additionally, when combined with GIS technology, the spatial interpolation of soil heavy metal content can be used to interpret the two-dimensional and three-dimensional distribution of heavy metals, enabling a more precise depiction of the research findings [2,14]. For thoroughly analyzing pollution patterns, the function of the weighted distance (IDW) is helpful [15,16]. The index method, quotient method, fuzzy comprehensive evaluation, geo-accumulation index, potential ecological risk index, and pollution load index are being used to estimate soil ecological risk [17]. Principal component analysis (PCA) has also been utilized to recognize several soil pollution sources, including industrial and agricultural activity, as well as the percentage of heavy metals responsible for soil contamination [18,19]. The PCA has also had the benefit of handling enormous amounts of data without being constrained to a particular number [20]. The current study aims to examine soil contamination with some selected heavy metals in the Northwest of the Nile Delta, Egypt, through mapping the spatial distribution of heavy metals in the study area, defining contamination levels using multivariate statistical (PCA and cluster analysis), and calculating the degree of contamination in the study area by using some indices. The objectives of this investigation are:
1-
Assessing the studied soil properties [pH, soil salinity (EC), %clay, soil organic matter content (%SOM)] and total concentrations of As, Co, Cu, Ni, V, and Zn for soil profiles in order to improve the understanding of the environmental impacts in that region and their causes.
2-
Utilizing contamination indices such as the geo-accumulation index (I-geo), contamination factor (CF), Improved Nemerow’s Pollution Index (Pn), and Potential Ecological Risk Index (PERI) to evaluate the risk of contamination for six heavy metals in different layers of soil profiles.
3-
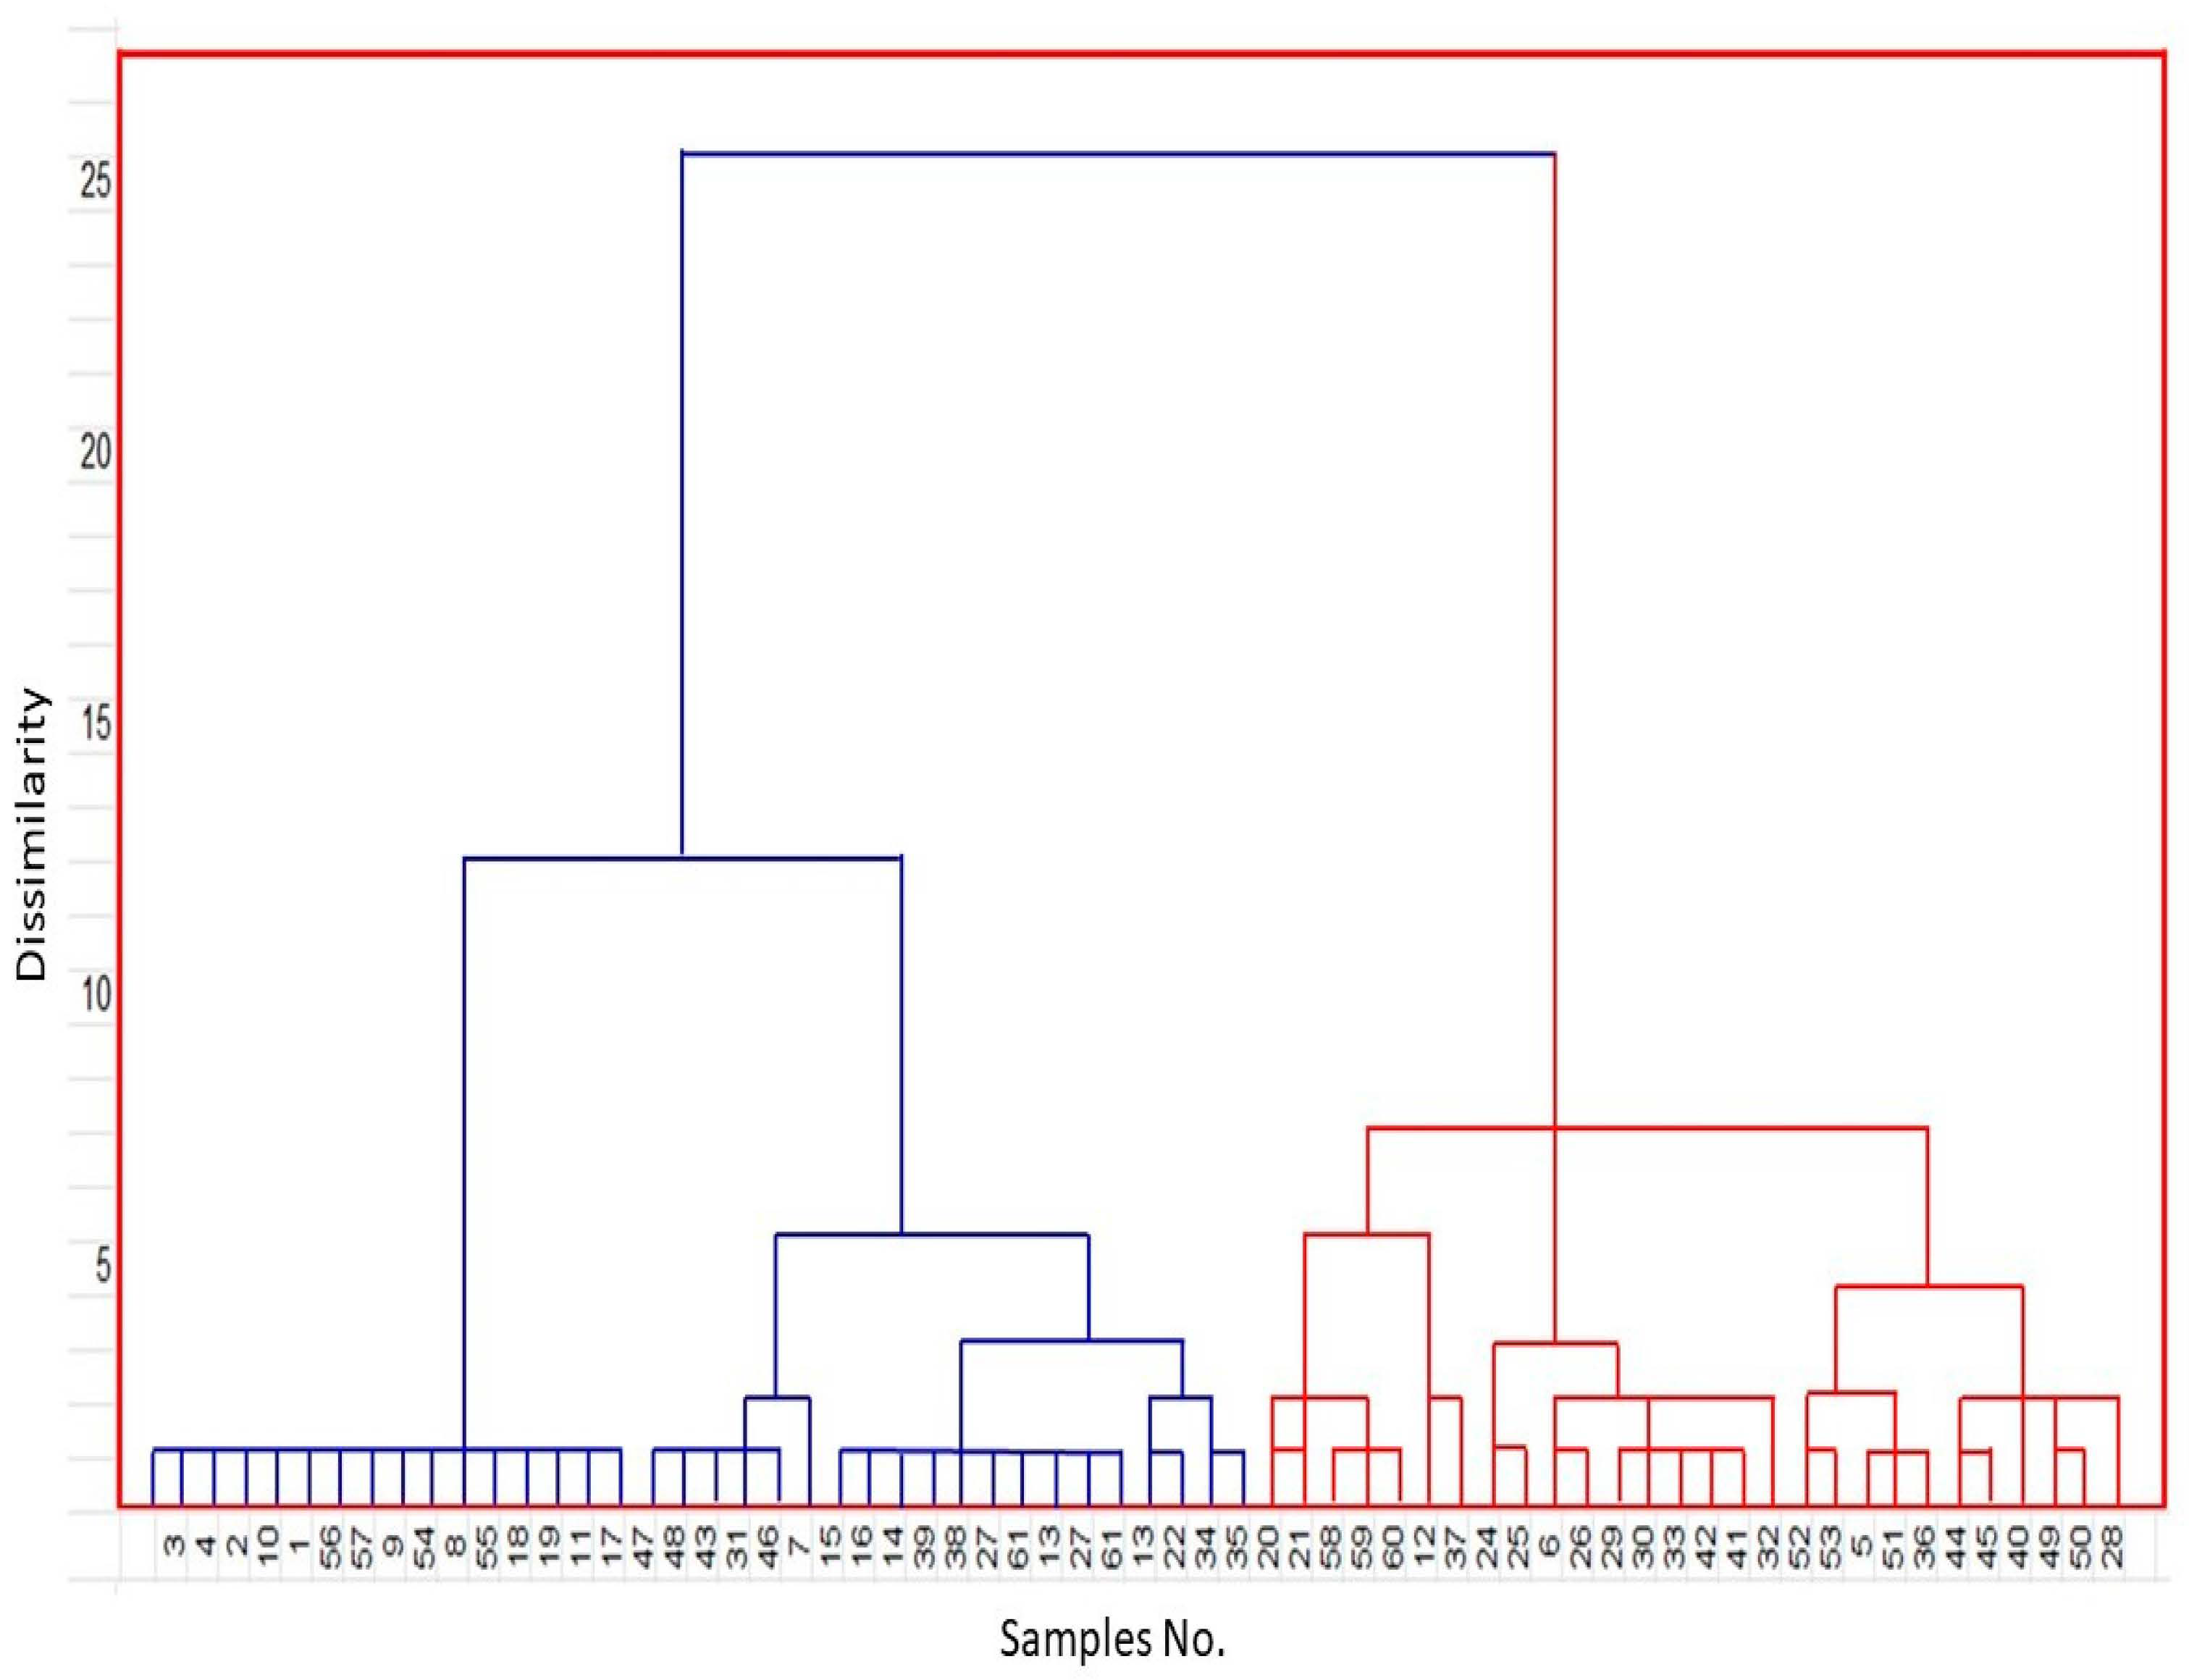
Using PCA and cluster analysis to uncover relationships among variables to improve estimations for the variables under study and determine the sources of heavy metals within the study area.

2. Materials and Methods

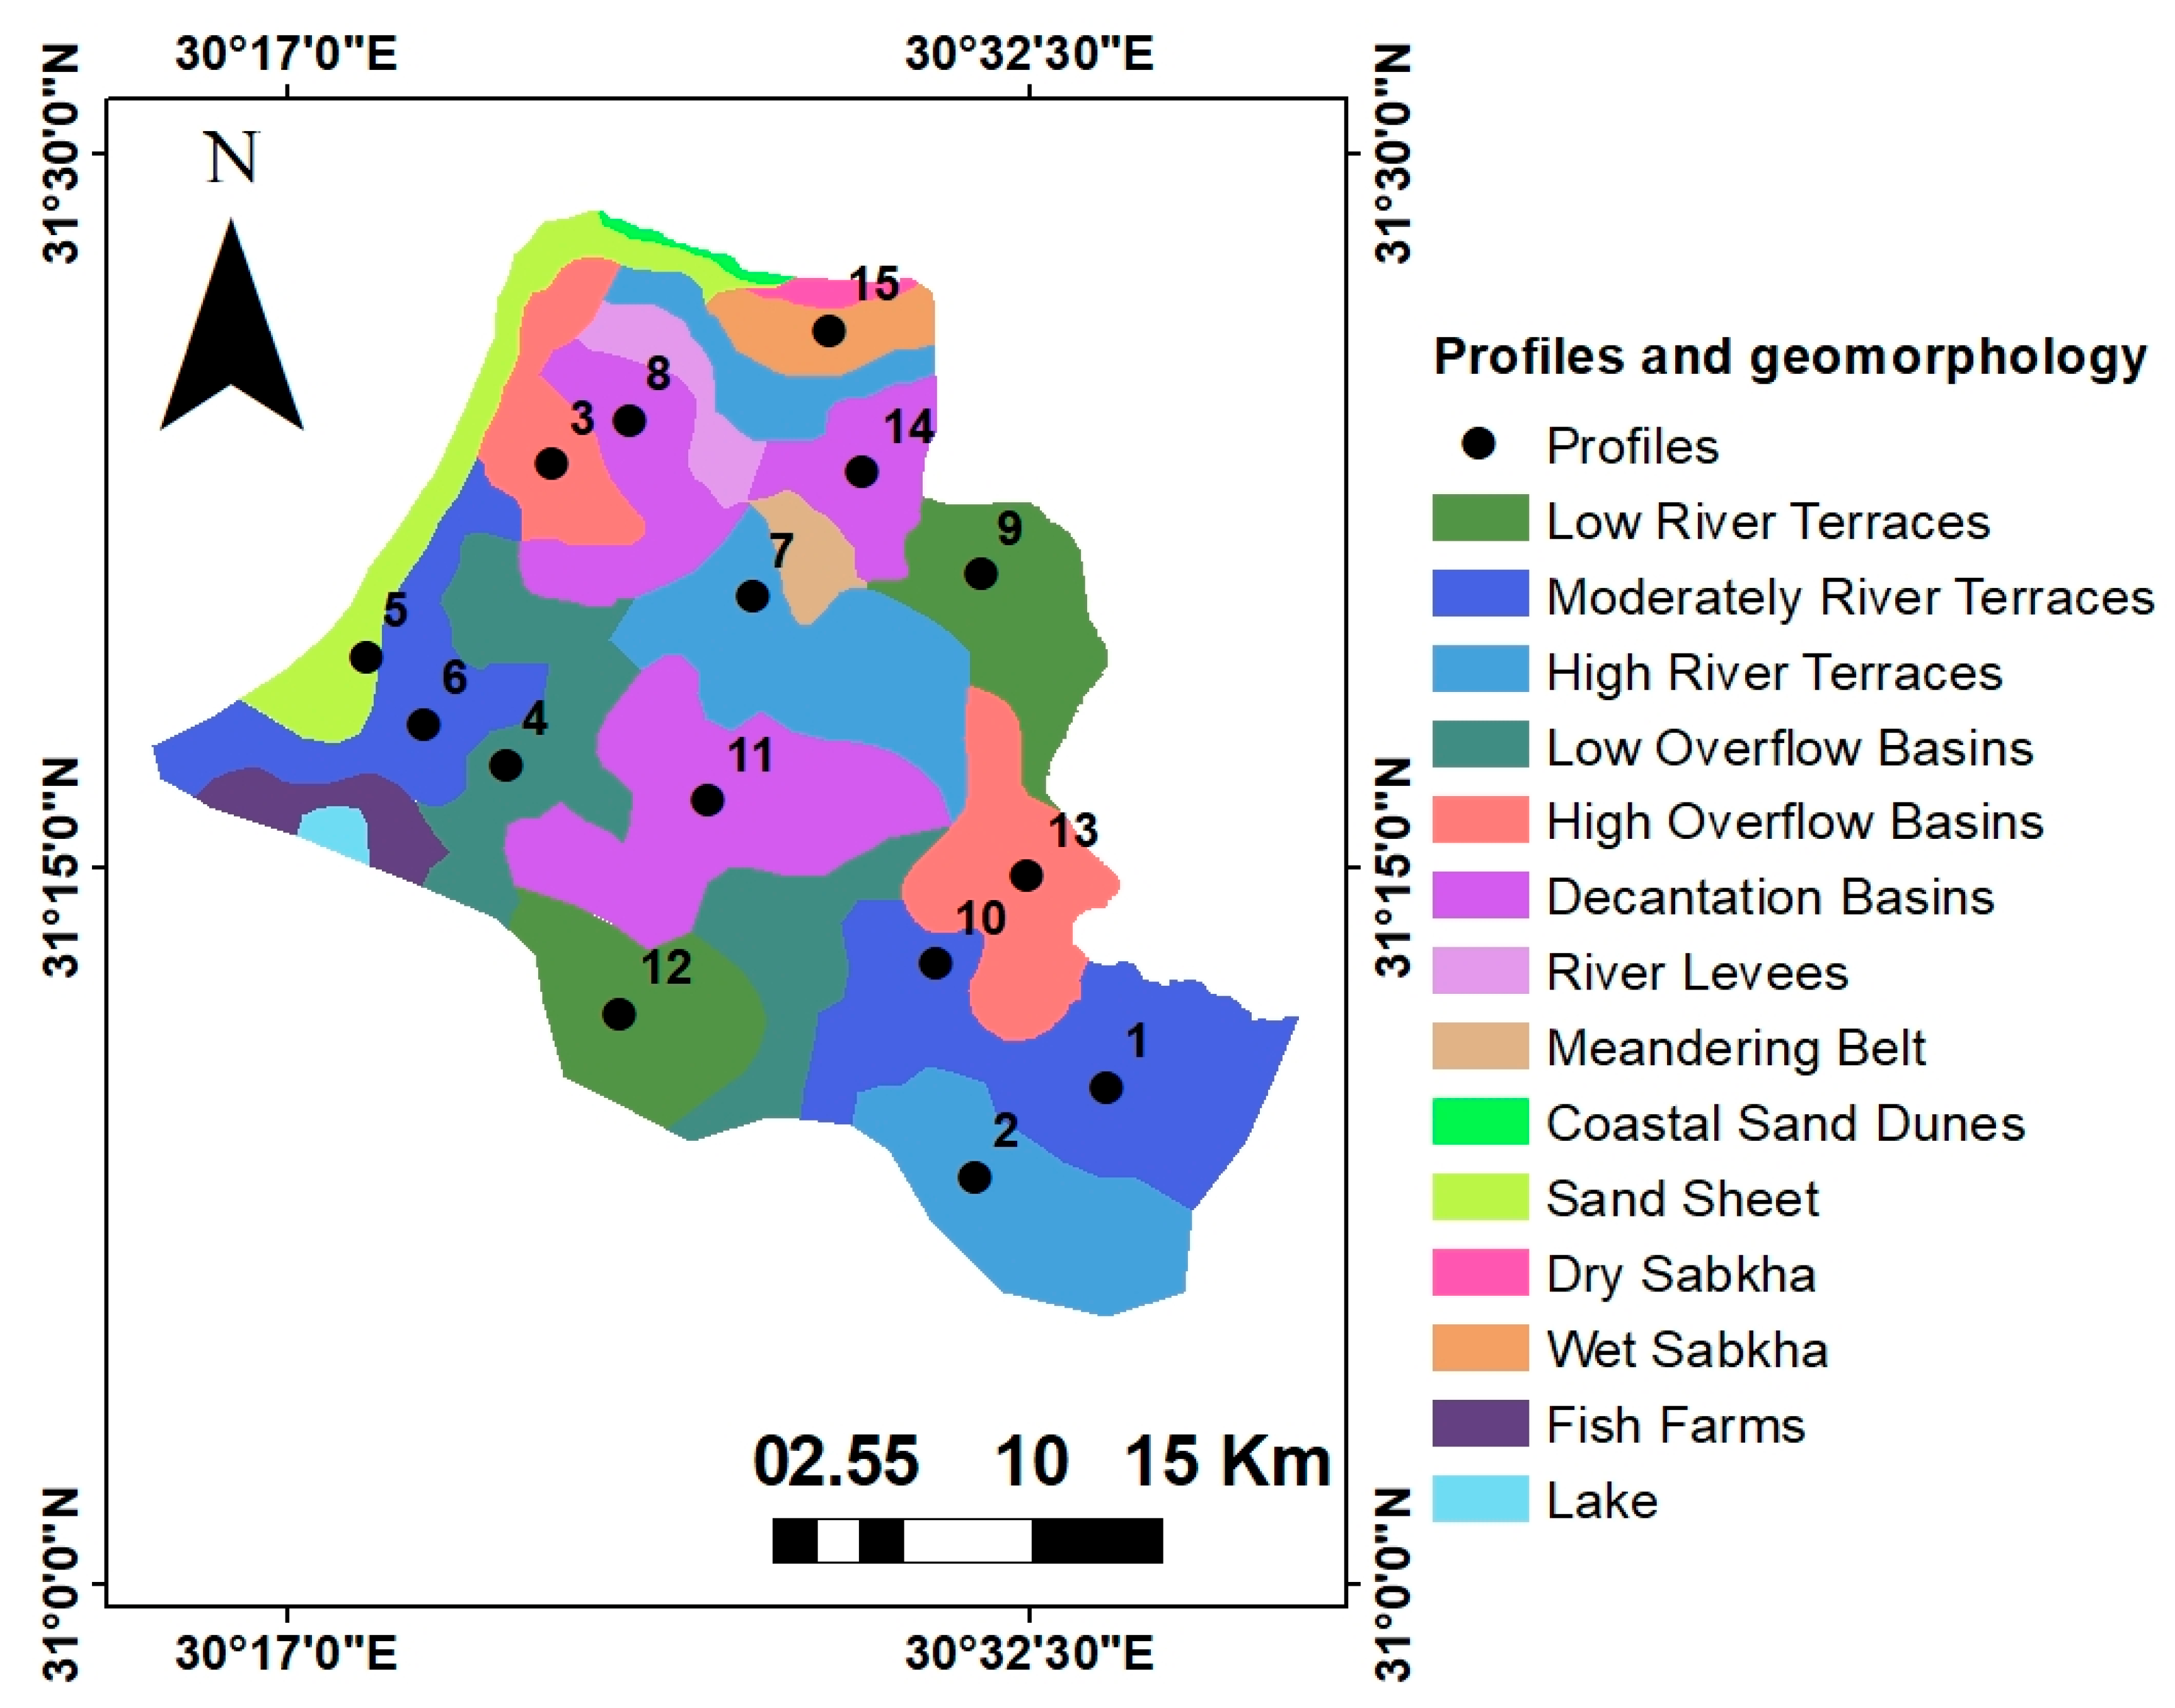
2.1. The Research Region

The research region we chose is located in Egypt’s northwest Nile Delta. The total area is estimated to be about 797.00 km2, and it is located between the longitudes 30°15′0″–30°40′0″ E and latitudes 31°7′15″–31°30′45″ N, as shown in Figure 1. Based on the average meteorological data for a period of 50 years, from 1960 to 2011, the region is classified as having a Mediterranean climate [21]. During the dry season in August, a comparatively high average maximum temperature of 30° C is typically reported. In January, the average low temperature is 13° C. From November through February, precipitation is often mild and hazy, with a mean annual rainfall of approximately 17.23 mm/year. The highest evaporation rates are noted in June and September, due to relatively high temperatures, while the lowest rates are observed in January and December due to low temperatures. Nearly 2 million farmers receive water from the Nile River through a network of 40,000 km of canals for crop irrigation, and a similar network of drainage canals is also present in the same area [22,23]. When combined with irrigation canals, these drainage canals amount to approximately 18,000 km, or almost 58,000 km in total [22]. The most popular type of irrigation involves surface irrigation where water is pumped from irrigation canals and drained into furrows and basins [24]. Rice, wheat, maize, and alfalfa are the most widely grown field crops in the study region. Citrus (orange), guava, and mango are the most widely grown tree fruits in orchards [25] These soils could be classified as Typic Torrifluvents, Typic Torripsamments, Typic Haplosalids, Vertic Natrargids, and Vertic Torrifluvents [25].

2.2. Analysis of Collected Samples

Soil samples were taken from 15 representative profiles, as shown in Figure 2. The soil profiles were chosen based on geomorphologic units in the study to reflect various agricultural activities. According to FAO [26] and the USDA [27], morphological descriptions and classifications of soil profiles were performed. The three principal landscape elements in the research area were the flood plain, lacustrine plain, and marine plain. Prior to the building of the high dam, the flood plain (713 km2) was produced by Nile deposits. This landscape is made up of a variety of landforms, including meandering belts, river terraces, overflow basins, decantation basins, and river levees. Lacustrine deposits from the Holocene epoch developed the lacustrine plain, which covers 40 km2. Fish farms, wet and dry sabkha, and coastal sand dunes are all present in this landscape. The study area’s northern zone (marine plain) covers approximately 40 km2 and has sand sheet landforms. A distance of 4 km2 of the total area is covered by lake [25,28]. One composite sample was taken from each layer of the soil profiles to ensure adequate representation. Soil samples were taken from various layers made by morphological changes. Soil profiles were dug up to the water table, or a depth of 150 cm. Consequently, the soil profiles vary in depth from 80 to 150 cm. The Faculty of Agriculture, Tanta University’s ISO/IEC 17025 (2017)-compliant and accredited soil, water, and plant laboratory, analyzed the soil chemical parameters (61 soil samples). Before analysis, collected soil samples were air-dried, crushed to pass through a 2 mm sieve, and stored in plastic bags at around 4 °C. The pH meter was used to measure the pH of the soil in a suspension of 1:2.5 soil to water [29], and soil electrical conductivity (EC) was measured in soil paste extract [30]. According to the Walkley and Black method, soil organic carbon (OC) was measured using the dichromate oxidation method [31]. The soil samples were mechanically examined using sodium hexametaphosphate as a dispersant in accordance with the international technique [32]. An amount of 7 mL of concentrated nitric acid and 3 mL of hydrofluoric acid was used to digest soil samples [33]. The inductively coupled plasma mass spectrometry (model prodigy plus) was used to measure the concentrations of As, Co, Cu, Ni, V, and Zn.

2.3. Contamination Indices

2.3.1. Geo-Accumulation Index (I-Geo)

The I-geo conveys contamination by comparing the measured levels of trace elements with the background values. The following equation was used in the Geo-Accumulation Index formula
I g e o = l o g 2 C n 1.5 B n
where:
Cn = the heavy metal concentration as measured in the soil samples, and Bn = the geochemical background concentration as observed in the average upper crust, after Wedepohl [34]. Because soil is a component of the Earth’s crust and has a chemical composition that is related to that of the crust, the focus is on the relationship between the concentration achieved and the concentration of elements in the crust in this case [35].
Equation (1)’s constant 1.5 was added to reduce the impact from any background value variations that might be caused by rocky sediment variations [36]. According to MULLER [37], there are seven different levels of I g e o : I g e o ≤ 0 (uncontaminated), 0 < I g e o < 1 (uncontaminated/moderately contaminated), 1 < I g e o < 2 (moderately contaminated), 2 < I g e o < 3(moderately/strongly contaminated), 3 < I g e o < 4 (strongly contaminated), ( 4 < I g e o < 5 strongly/extremely contaminated), and I g e o > 5 (extremely contaminated).

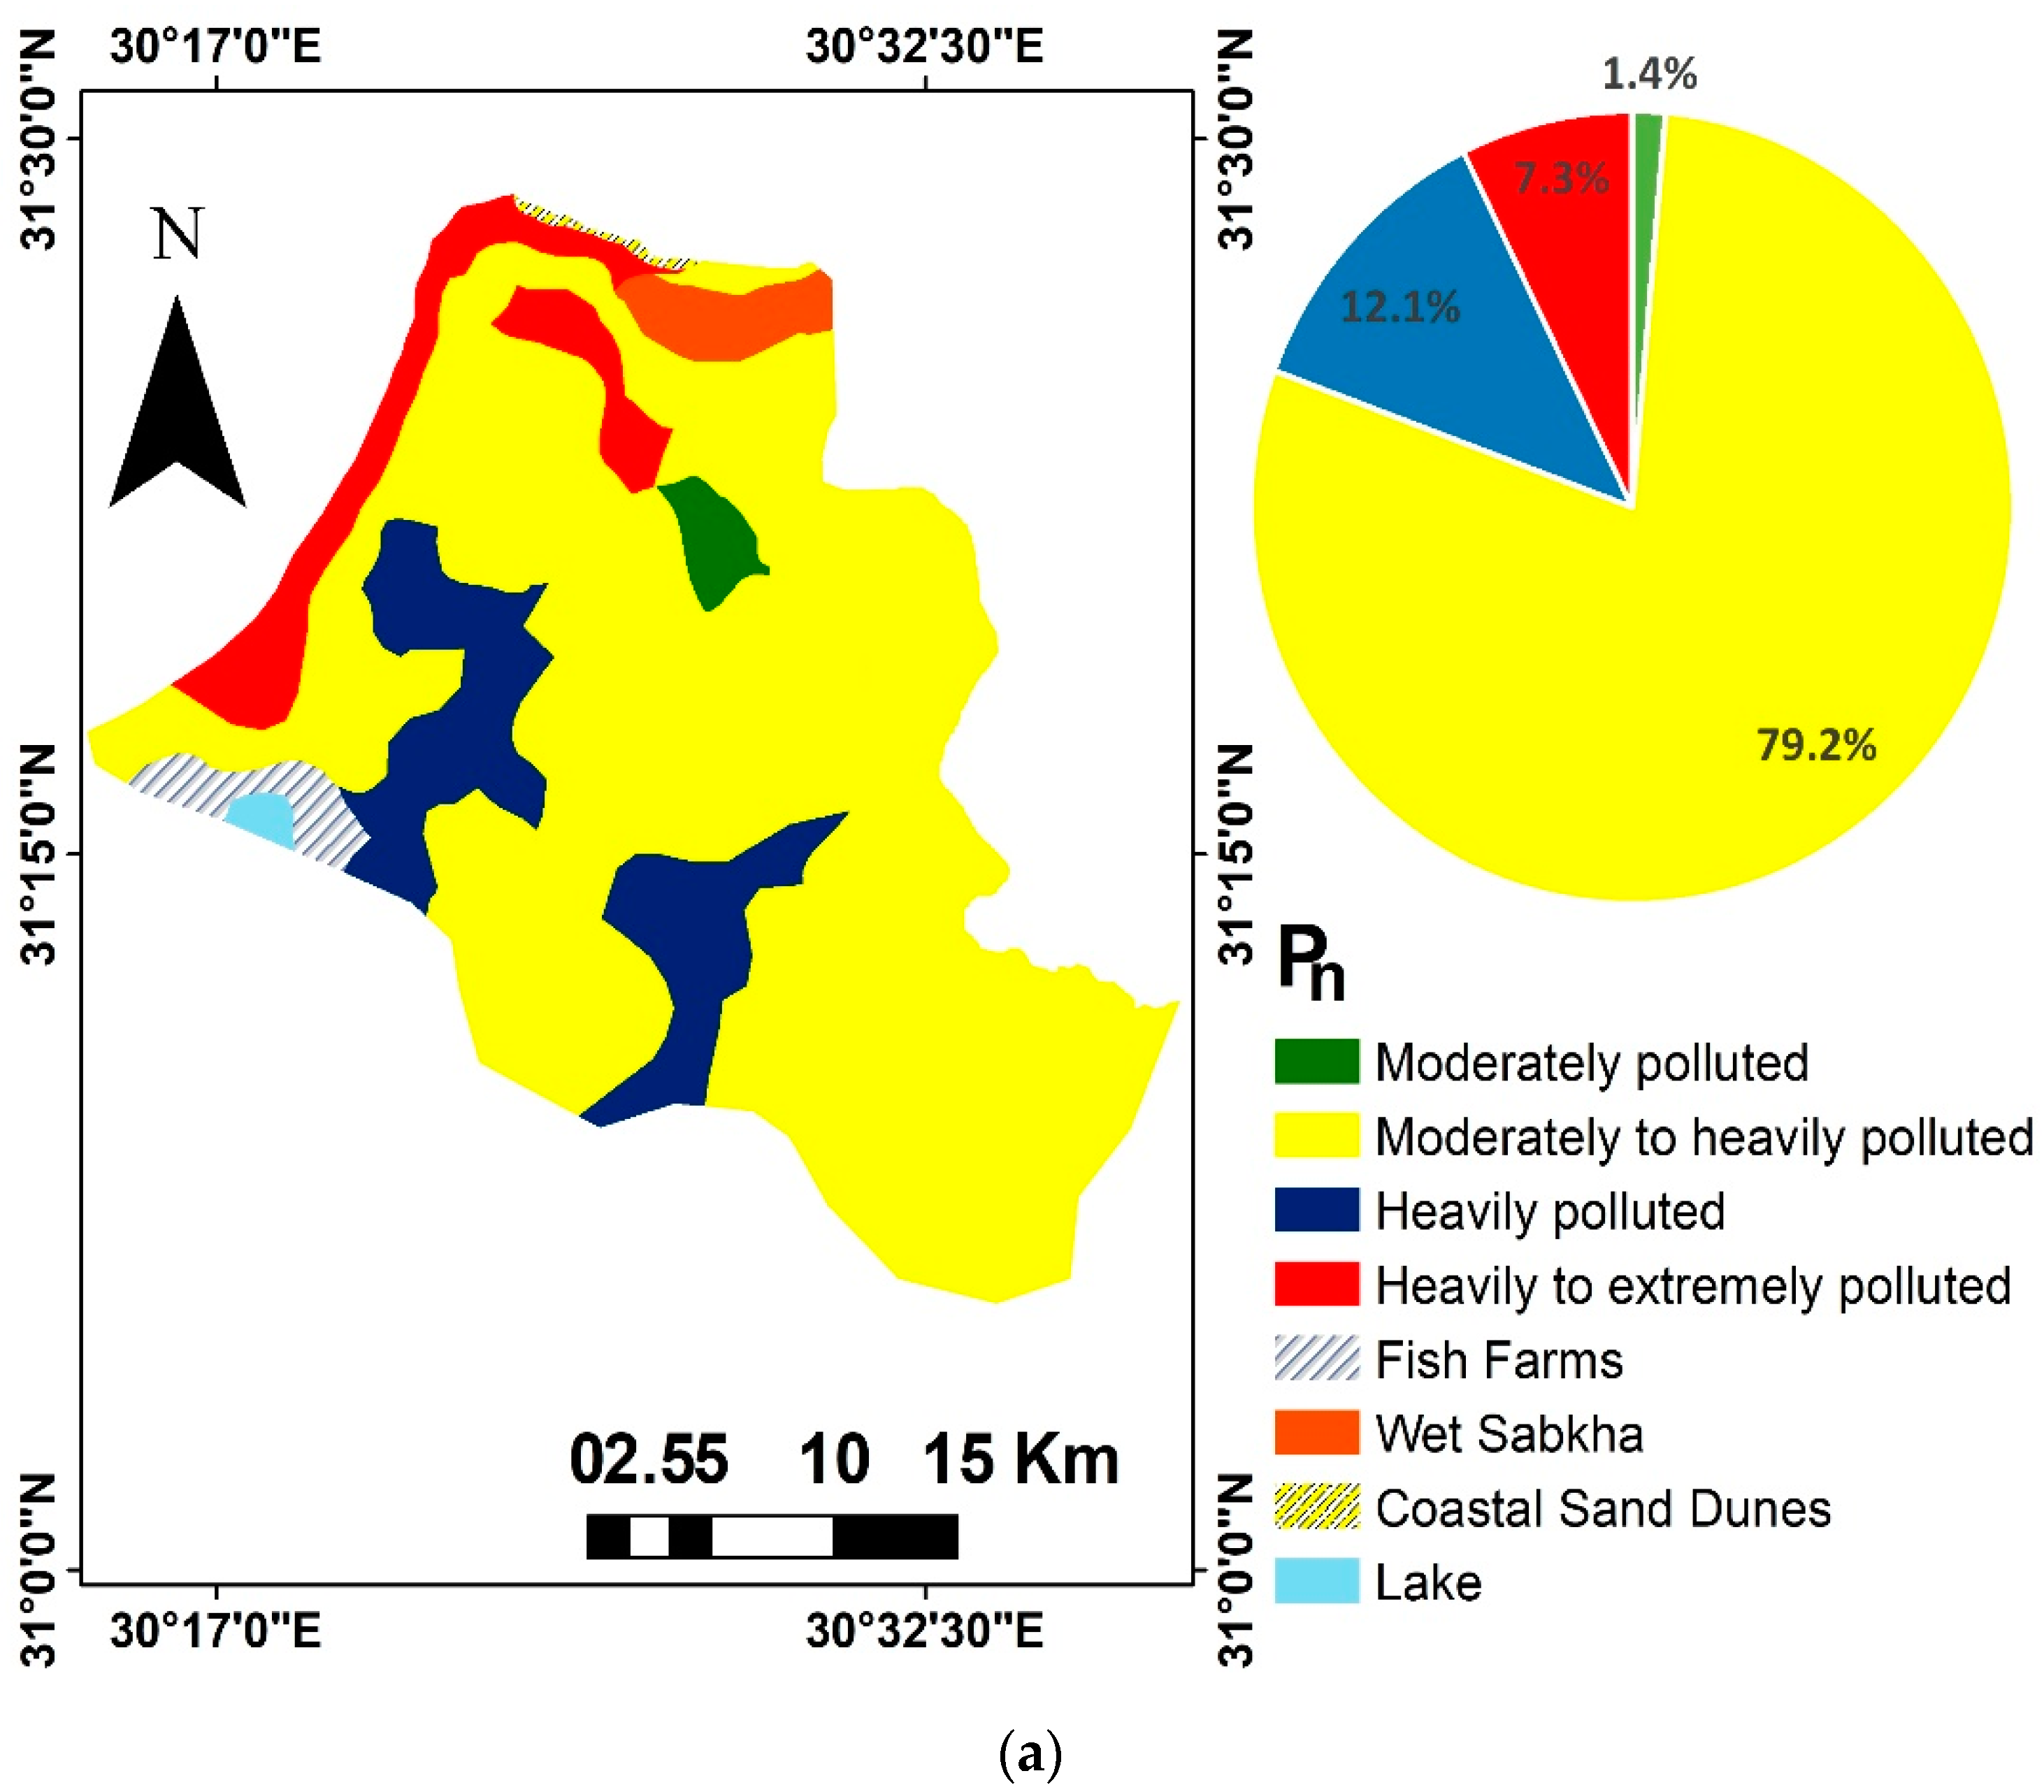
2.3.2. Improved Nemerow’s Pollution Index (Pn)

The implementation of the Nemerow Pollution Index made it possible to evaluate the soil ecosystem’s quality comprehensively. For each sampling site, the modified formula presented by [36] was determined using equation (2).
P n = I g e o m a x 2 + I g e o a v e 2 2
where:
Igeomax = the maximum Igeo value, and Igeoave = the mathematical average value of I-geo.
Based on the value for P n , there are seven classes of pollution [35,36]: 0 ˂ P n ≤ 0.5 (unpolluted), 0.5 ˂ P n ≤ 1 (unpolluted to moderately polluted), 1 ˂ P n ≤2 (moderately polluted), 2 ˂ P n ≤ 3 (moderately to heavily polluted), 3 ˂ P n ≤ 4 (heavily polluted), 4 ˂ P n ≤ 5 (heavily to extremely polluted) and P n > 5 (extremely polluted).

2.3.3. Contamination Factor (CF)

By dividing each measured heavy metal’s total concentration by the background value, the contamination factor ( C F ) of each metal in the study was calculated. The following equation was used to calculate C F [38]
C F = C m C b
where:
  • C m = measured heavy metal’s total concentration
  • C b = The background value of each metal.
According to Hakanson [39], there are four different levels of CF: C F ≤ 1 (low contamination), 1 < C F ≤ 3 (moderate contamination), 3 < CF ≤ 6 considerable contamination), and C F ≥ 6 (high contamination).

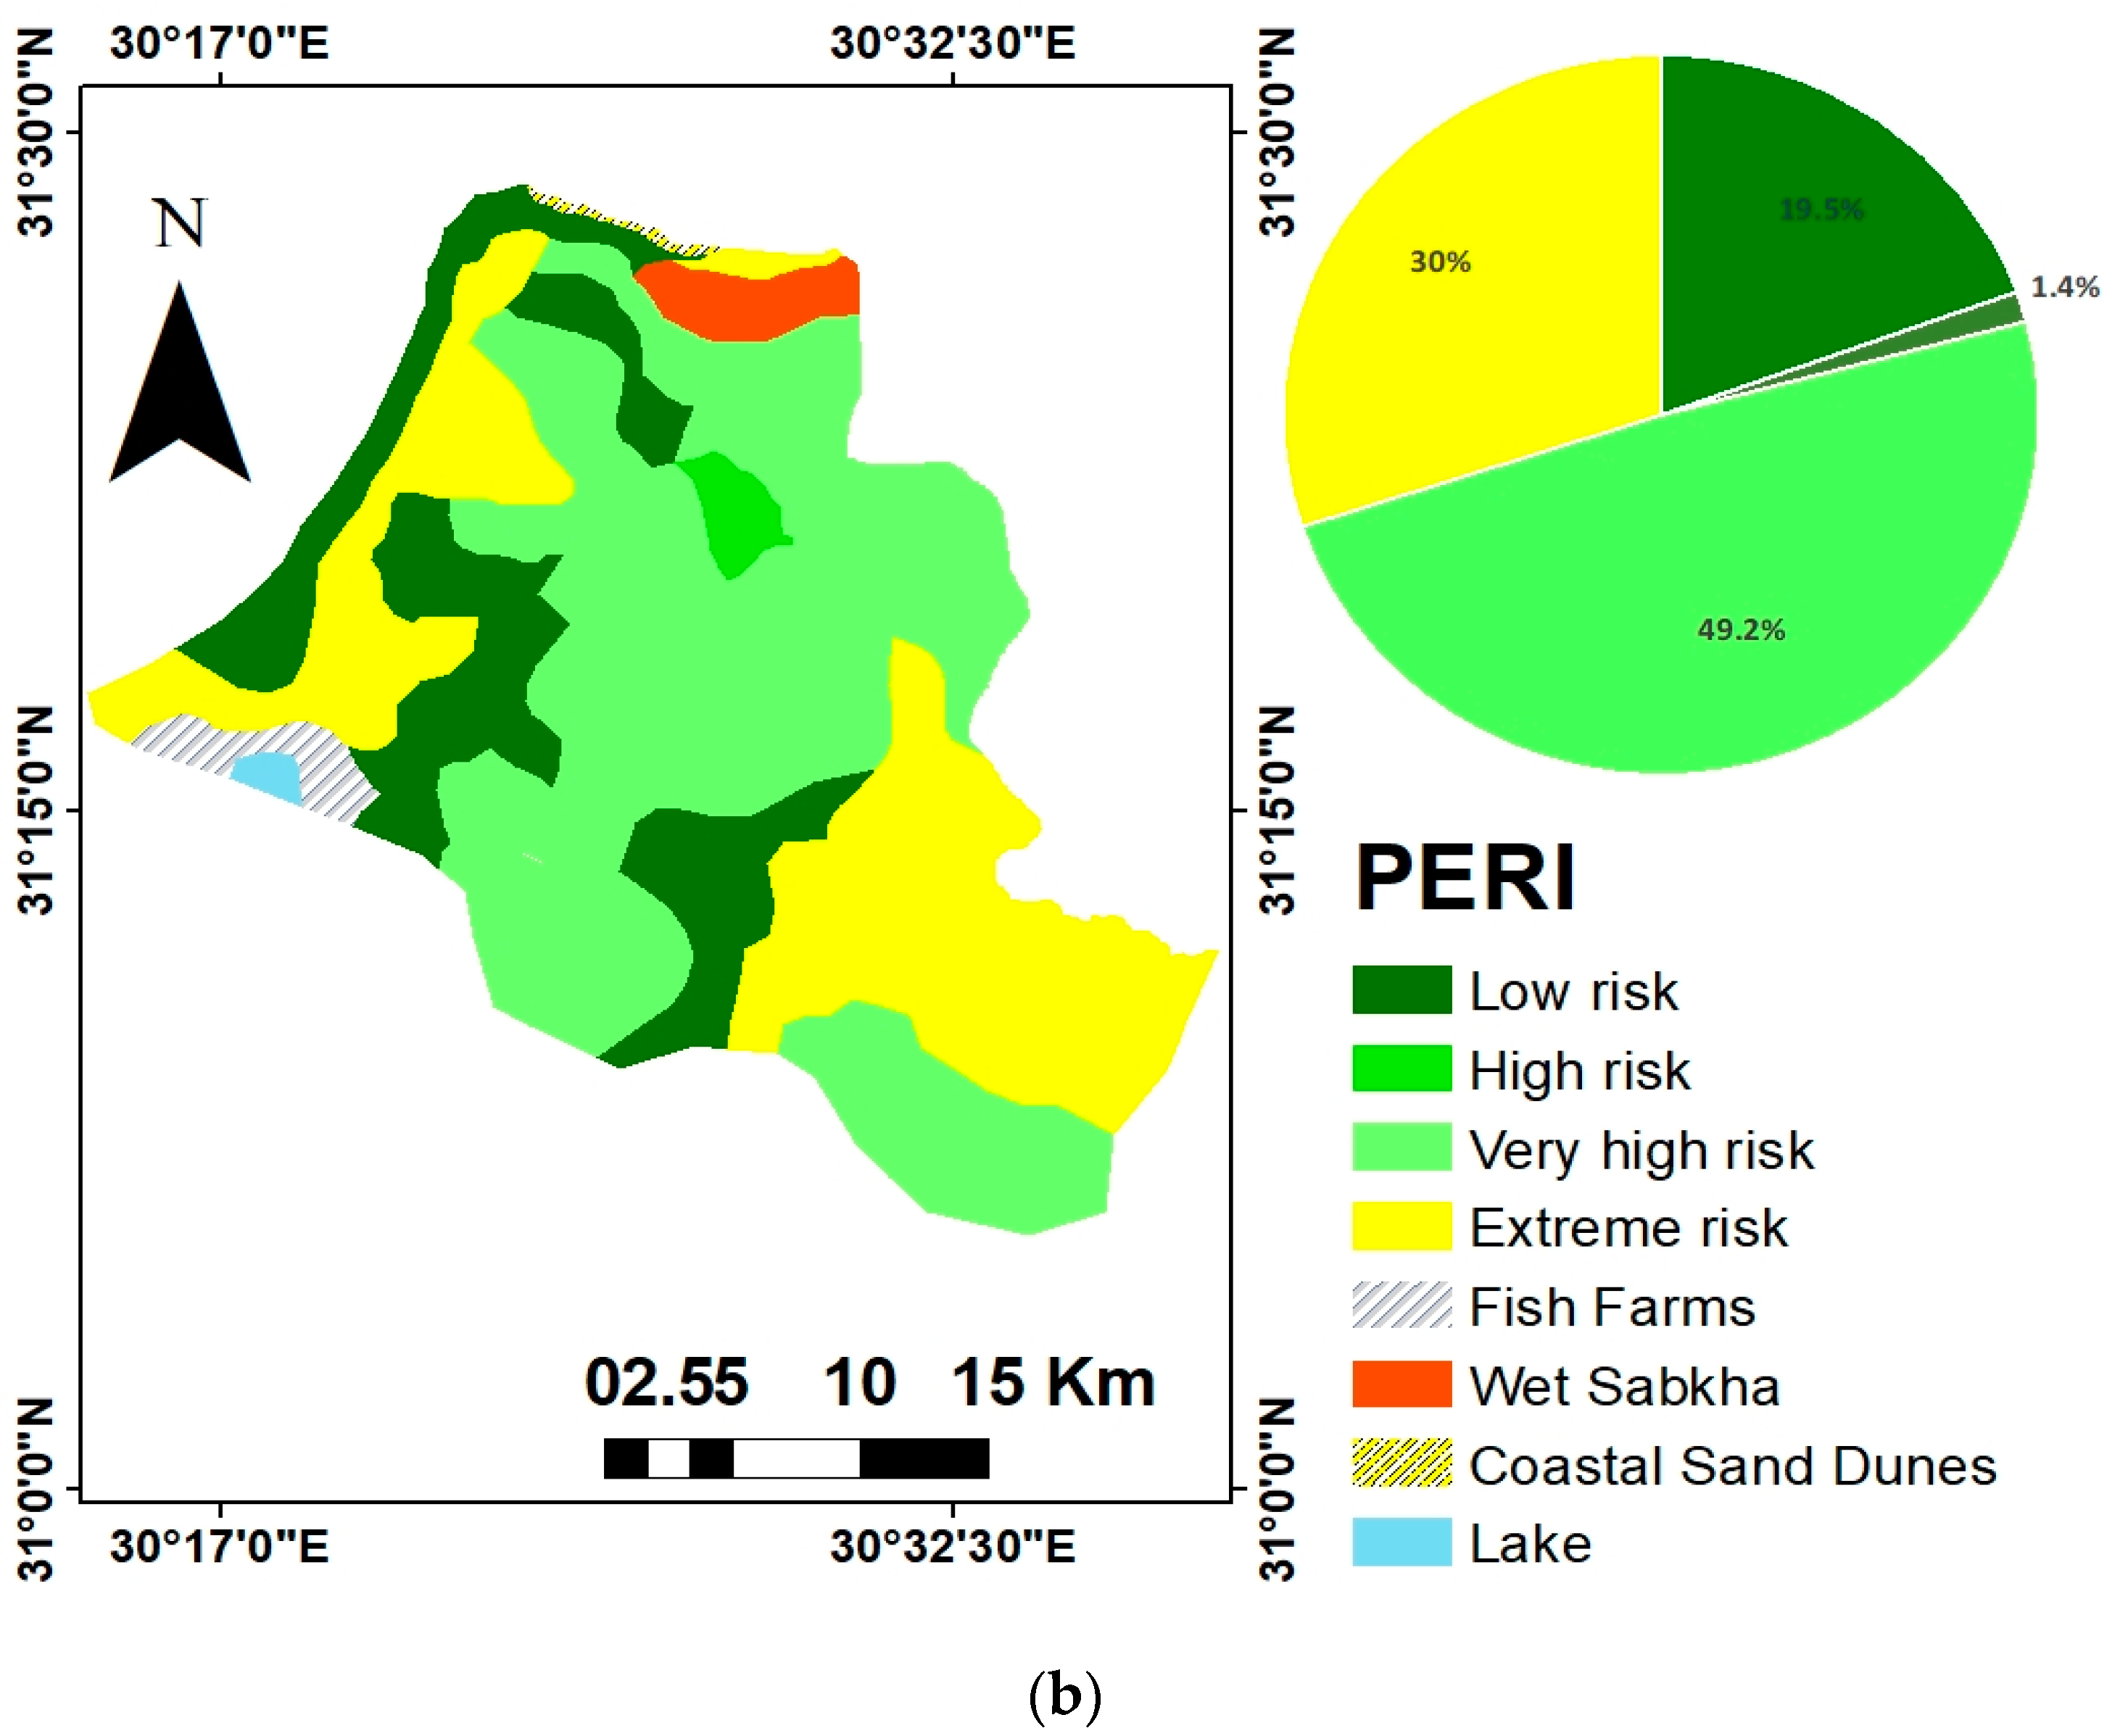
2.3.4. Potential Ecological Risk Index (PERI)

The potential ecological risk index (PERI) in the present investigation was computed as the sum of all six heavy metals in order to objectively analyze the possible risks from soil contamination by heavy metals, with the aid of Equations (4) and (5), adopted by [39],
P E R = i n E r i
E r i = T r i C f i
where:
  • E r i = potential ecological risk,
  • T r i = the toxic response factor for heavy metal, and
  • C f i = the contamination factor, as mentioned above.
The toxic response factors for As, Co, Cu, Ni, V, and Zn are10, 5, 5, 5, 2, and 1, respectively [36,39,40]. The evaluated criteria for PERI are classified [36]: P E R ≤ 50 (low risk), 50 ˂ P E R ≤ 100 (moderate risk), 100 ˂ P E R ≤ 150 (high risk), 150 ˂ P E R ≤ 200 (very high risk), and P E R > 200 (extreme risk).

2.4. Statistical Analysis

The minimum, maximum, arithmetic mean, and standard deviation for the investigated soil characteristics and heavy metals were computed using SPSS version 25. The linear correlations between the soil variables were verified by using the Pearson correlation coefficient. For the entire data set, the Kaiser–Meyer–Olkin (KMO) method was used to determine whether the samples were adequate. KMO values greater than 0.6 indicated that the data were suitable for PCA [41]. To eliminate multi-collinearity between the original variables, PCA was employed to reduce the dataset into principal component (PC) variables. Additionally, the Bartlett test was used to verify data fitness, and the results showed that p < 0.05, further confirming the data fitness for PCA [42].

2.5. Utilizing IDW to Map Soil Properties and Heavy Metal Concentrations

Interpolation maps of selected soil characteristics and heavy metal concentrations were created using the IDW tool found in the ArcGIS10.7 software. This method calculates the grid note by considering nearby sites within a user-defined search radius. Because it is simple to operate, IDW is frequently employed in soil studies [28,43,44,45,46,47]. Going away from the measurement site, its local impact diminishes, as shown by the equation below.
z p = I = 1 n z i d i i = 1 n 1 d i
In this research, agricultural and industrial drainage directly impact the elements present in soil at a certain concentration, which fluctuates depending on the distance from the source; thus, it is preferable to choose this IDW technique [6].

3. Results and Discussion

3.1. Some Soil Properties and Heavy Metal Concentrations of the Investigated Area

In Table 1, a detailed statistical analysis of the concentrations of heavy metals (HMs) (As, CO, Cu, Ni, V, and Zn) is presented. The concentration of total arsenic ranged between 0.01 and 121.20 mg kg−1 with an average value of 25.52 ± 25.97 mg kg−1. Arsenic in the soil is typically thought to have a geological origin and is more prevalent in clayey soils. However, because more anthropogenic sources than natural ones emit arsenic into the environment, there is a significant amount of anthropogenic arsenic pollution [48]. The range of cobalt concentration fluctuated between 1.05 and 59.94 mg kg−1 and it had an average value of 17.39 ± 13.33 mg kg−1. Cobalt has a crucial role in the growth of leguminous plants when it occurs at low concentrations. It also has many benefits for human health because it is a part of Vitamin B12. Nevertheless, in excess it can have negative consequences, such as limiting plants’ nitrogen metabolism and photosynthesis, and it also may have serious effects on the human lungs and heart [49]. The average copper mg kg−1 is 37.80 ± 24.90. Cu accumulation in soils is due mainly to human activity, such as mining or industrial activity. Copper-containing compounds are frequently used in agriculture, particularly in insecticides used in vineyards and orchards [50]. This could be the reason for the increased Cu contents detected in soil samples from Mediterranean regions where these land uses are widespread [51]. The total Nickel content we found was 0.03–195.43 mg kg−1, with a mean value of 70.29 ± 54.60 mg kg−1. Like the majority of other heavy metals, Nickel in the soil can have either a natural or a human-made origin, although soil contamination may also be caused by industrial activities [52]. Vanadium concentration varied from 1.01 to 377.50 mg kg−1 with an average value of 170.95 ± 123.84 mg kg−1; the role of V metal in soil toxicity to the environment is debatable [53]. It is an essential nutrient for many organisms, including humans, in trace amounts [16]. The average value of the total zinc concentrations is 149.27 ± 144.02 mg kg−1. Zinc is a necessary metal for both plants and humans, but too much of it can be hazardous [54]. Thus, it is essential to manage the proper amount in agricultural soils. It may have immediate, harmful effects and, among other things, result in digestive and immune system issues. Additionally, excessive levels of zinc may decrease the absorption of copper, leading to signs of copper insufficiency [53]. All of the selected heavy metal concentrations are higher than the levels that are proposed by [34], whereas As, V, and Cu concentrations on average are greater than the values recommended by [55]. The pH contents fluctuated between 7.79 and 8.90; pH is a very important property, as the availability of soil nutrients to plant roots, the biological activity in various soil settings, and the activity of enzymes are all impacted by the soil pH [56]. The research area’s EC values have a wide range, from 0.55 to 23.20 dS m−1 with an average of 5.55 ± 5.75 dS m−1. The high salinity of the water table and the influence that lake and seawater may have contributed to the high levels of EC in some locations of the study area. Most of the soil in the northern Delta is classified as having high soil salinity; therefore, this fits the region’s typical trend [57,58]. The data we obtained indicated that the soil organic carbon ranged from 0.06 to 12.30 (5.26 ± 3.61 mg kg−1).

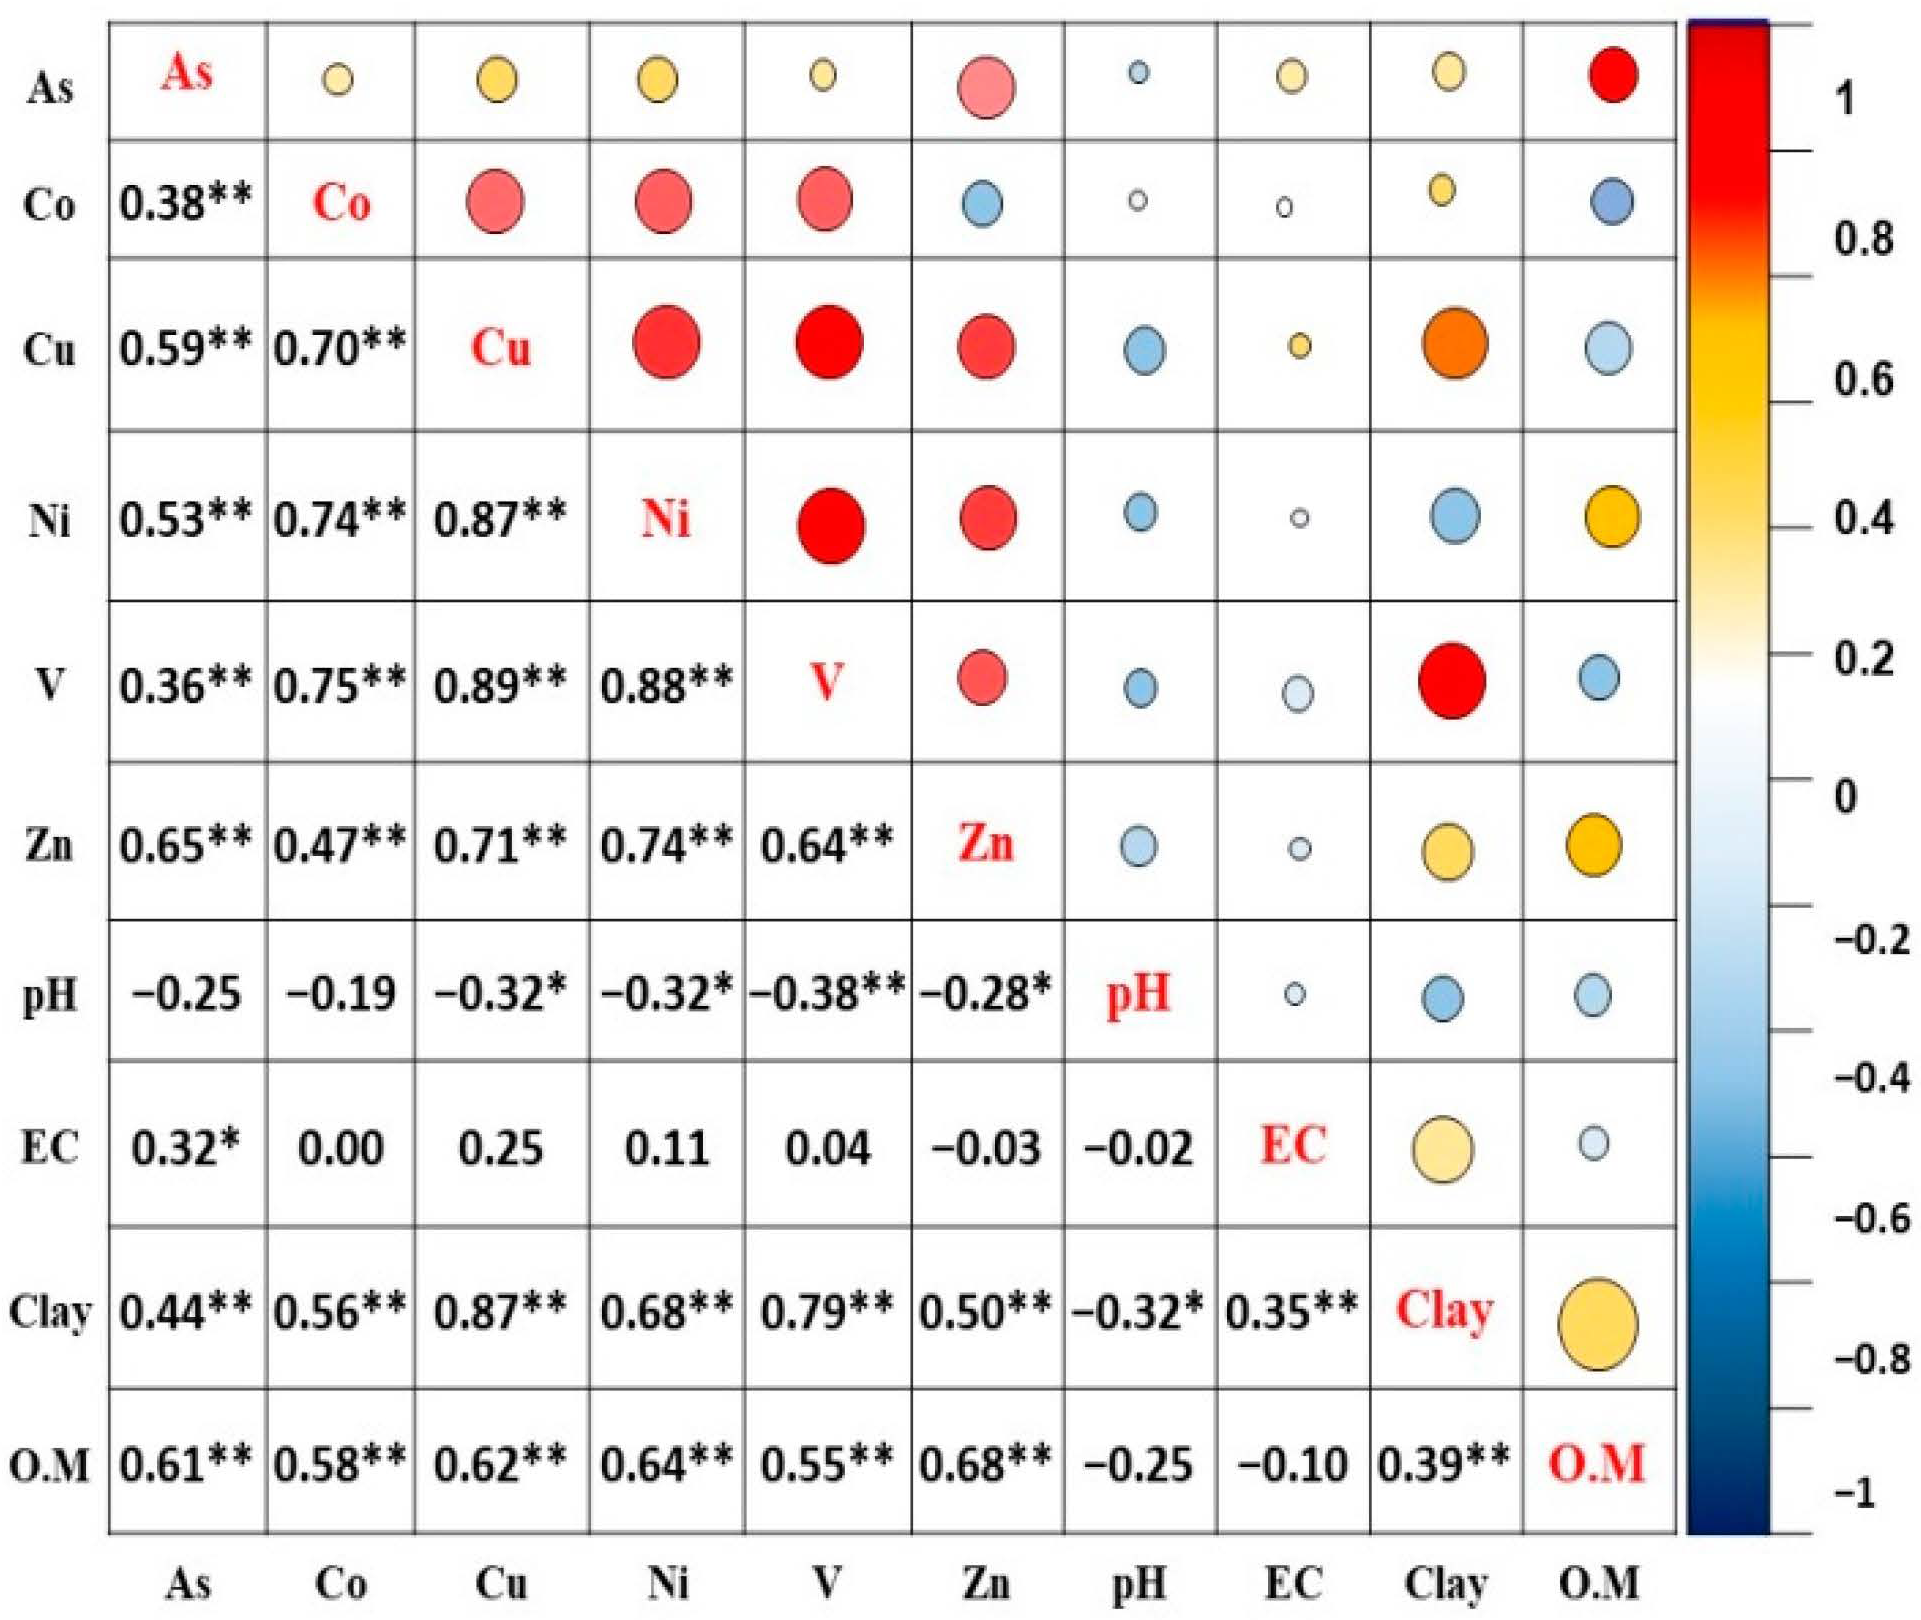
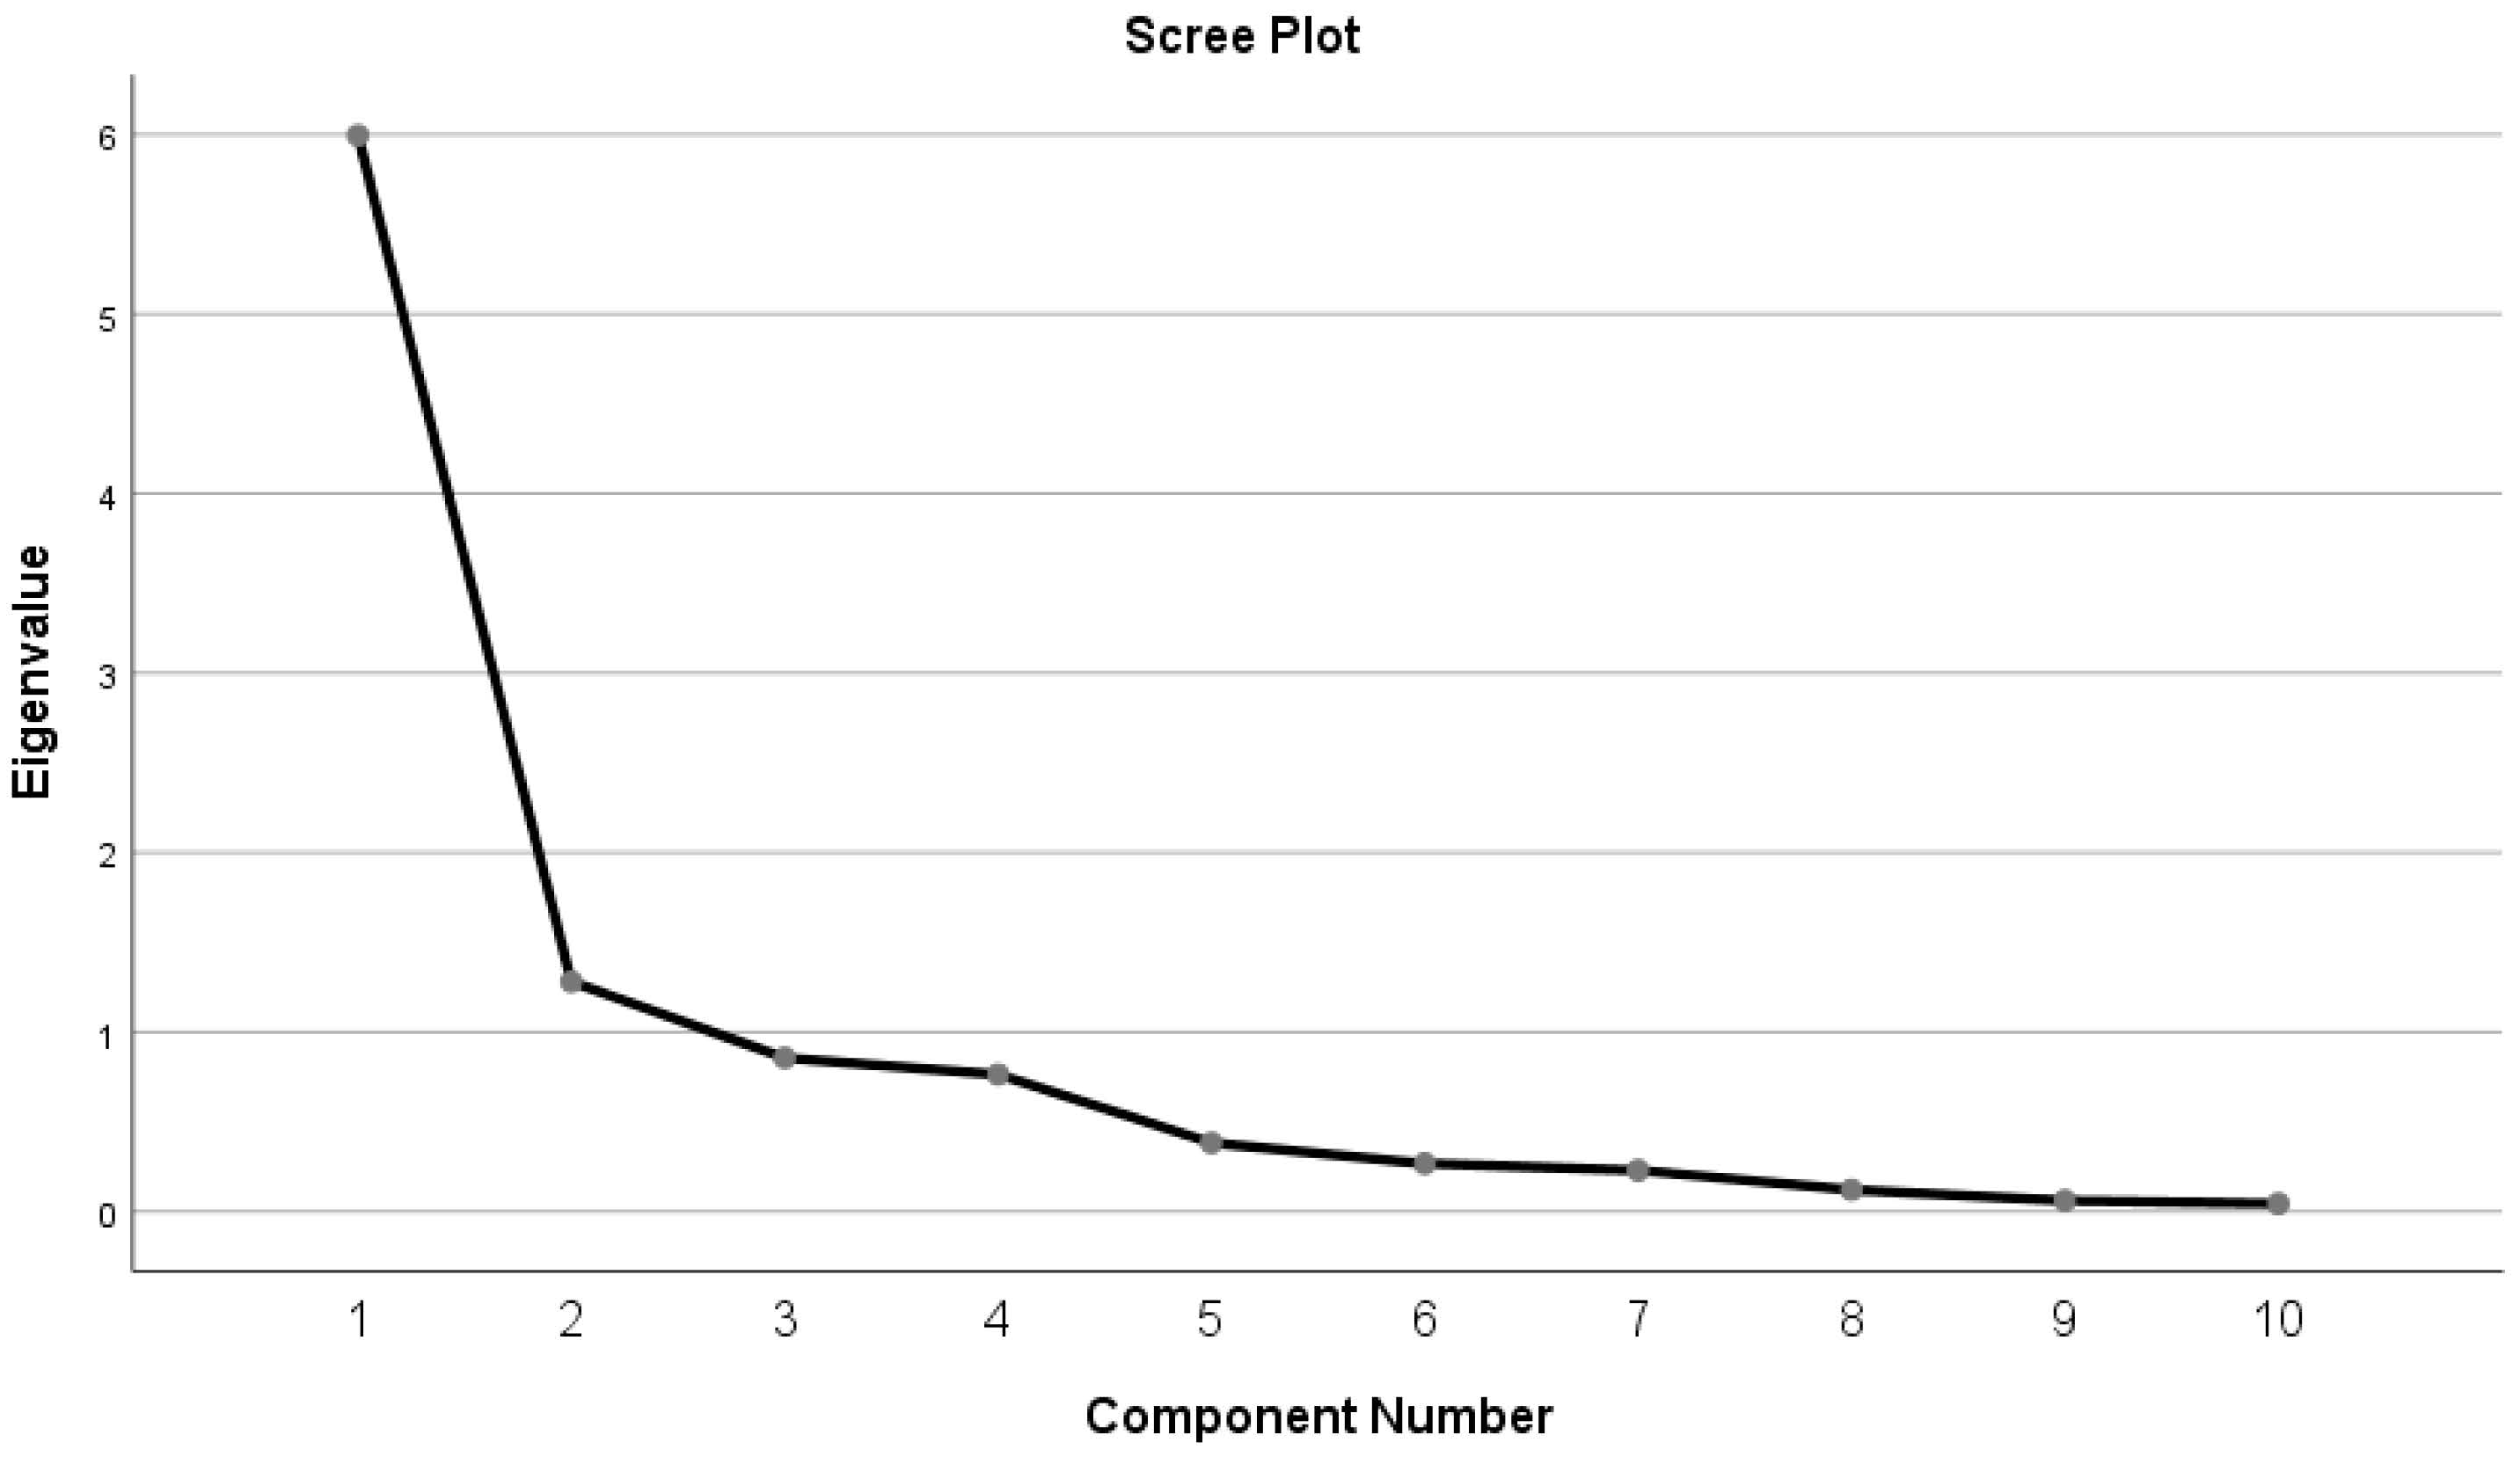
3.2. Principal Component and Cluster Analysis

According to the correlation matrix (person) of the studied variables found in Figure 3, the correlation between As, Co, Cu, Ni, V, and Zn is considerable. Regardless of the correlation significance, the soil pH was adversely associated with each variable [59]. The association between selected soil properties and selected heavy metals was found to be great. Strong positive relationships between organic matter and heavy metals were found; these results are consistent with [60]. The clay content and heavy metal concentrations have a strong correlation that is similar to that of [61].
The variables from the original data were extracted by using PCA, which groups them into factors (principal components) [42,62]. In other investigations [63,64], PCA has been used to evaluate soil contamination with selected heavy metals. Before using PCA analysis, the variables were standardized by means of Z-scores through SPSS software version 25. The Kaiser–Meyer–Olkin (KMO) test was employed to assess the sufficiency of the sampling for all variables [65]. Given that the KMO value was >0.6 [59], the soil sample was considered acceptable at a KMO value of 0.85 (Table 2). Based on 61 observations and 10 variables, a PCA was produced. The Scree plot displays the eigenvalue of various major components or variables (Figure 4). According to the data shown in (Table 3), only two of the variables with a cumulative variability of 72.76% had eigenvalues greater than 1, and the remaining components were discarded based on a Kaiser test [66]. The eigenvalue and variability for PC1 were 5.99 and 59.95, respectively, according to the PCA analysis, whereas PC2 had the highest eigenvalue and variability (12.81 and 72.76%). In this study, the data were divided into two groups using agglomerative hierarchical clustering (AHC clusters). PCA was used to help in detecting pollution source locations by taking the correlation matrix’s eigenvalues. A strong correlation between the metals could indicate a common source, such as the industrial activity in the research region or the use of agricultural pesticides and fertilizers. The dendrogram in Figure 5 demonstrates how the two clusters were different from one another; each cluster had unique traits. With differing ranges, averages, and standard deviations (St. Dev) for all variables, the first cluster had 35 observations and the second had 26 observations. These two clusters were taken from the PCA. The collected results revealed considerable changes in As-Co-Cu-Ni-V-Zn-Clay-OM between the two clusters, and all the heavy metals had a negative correlation with the soil pH.

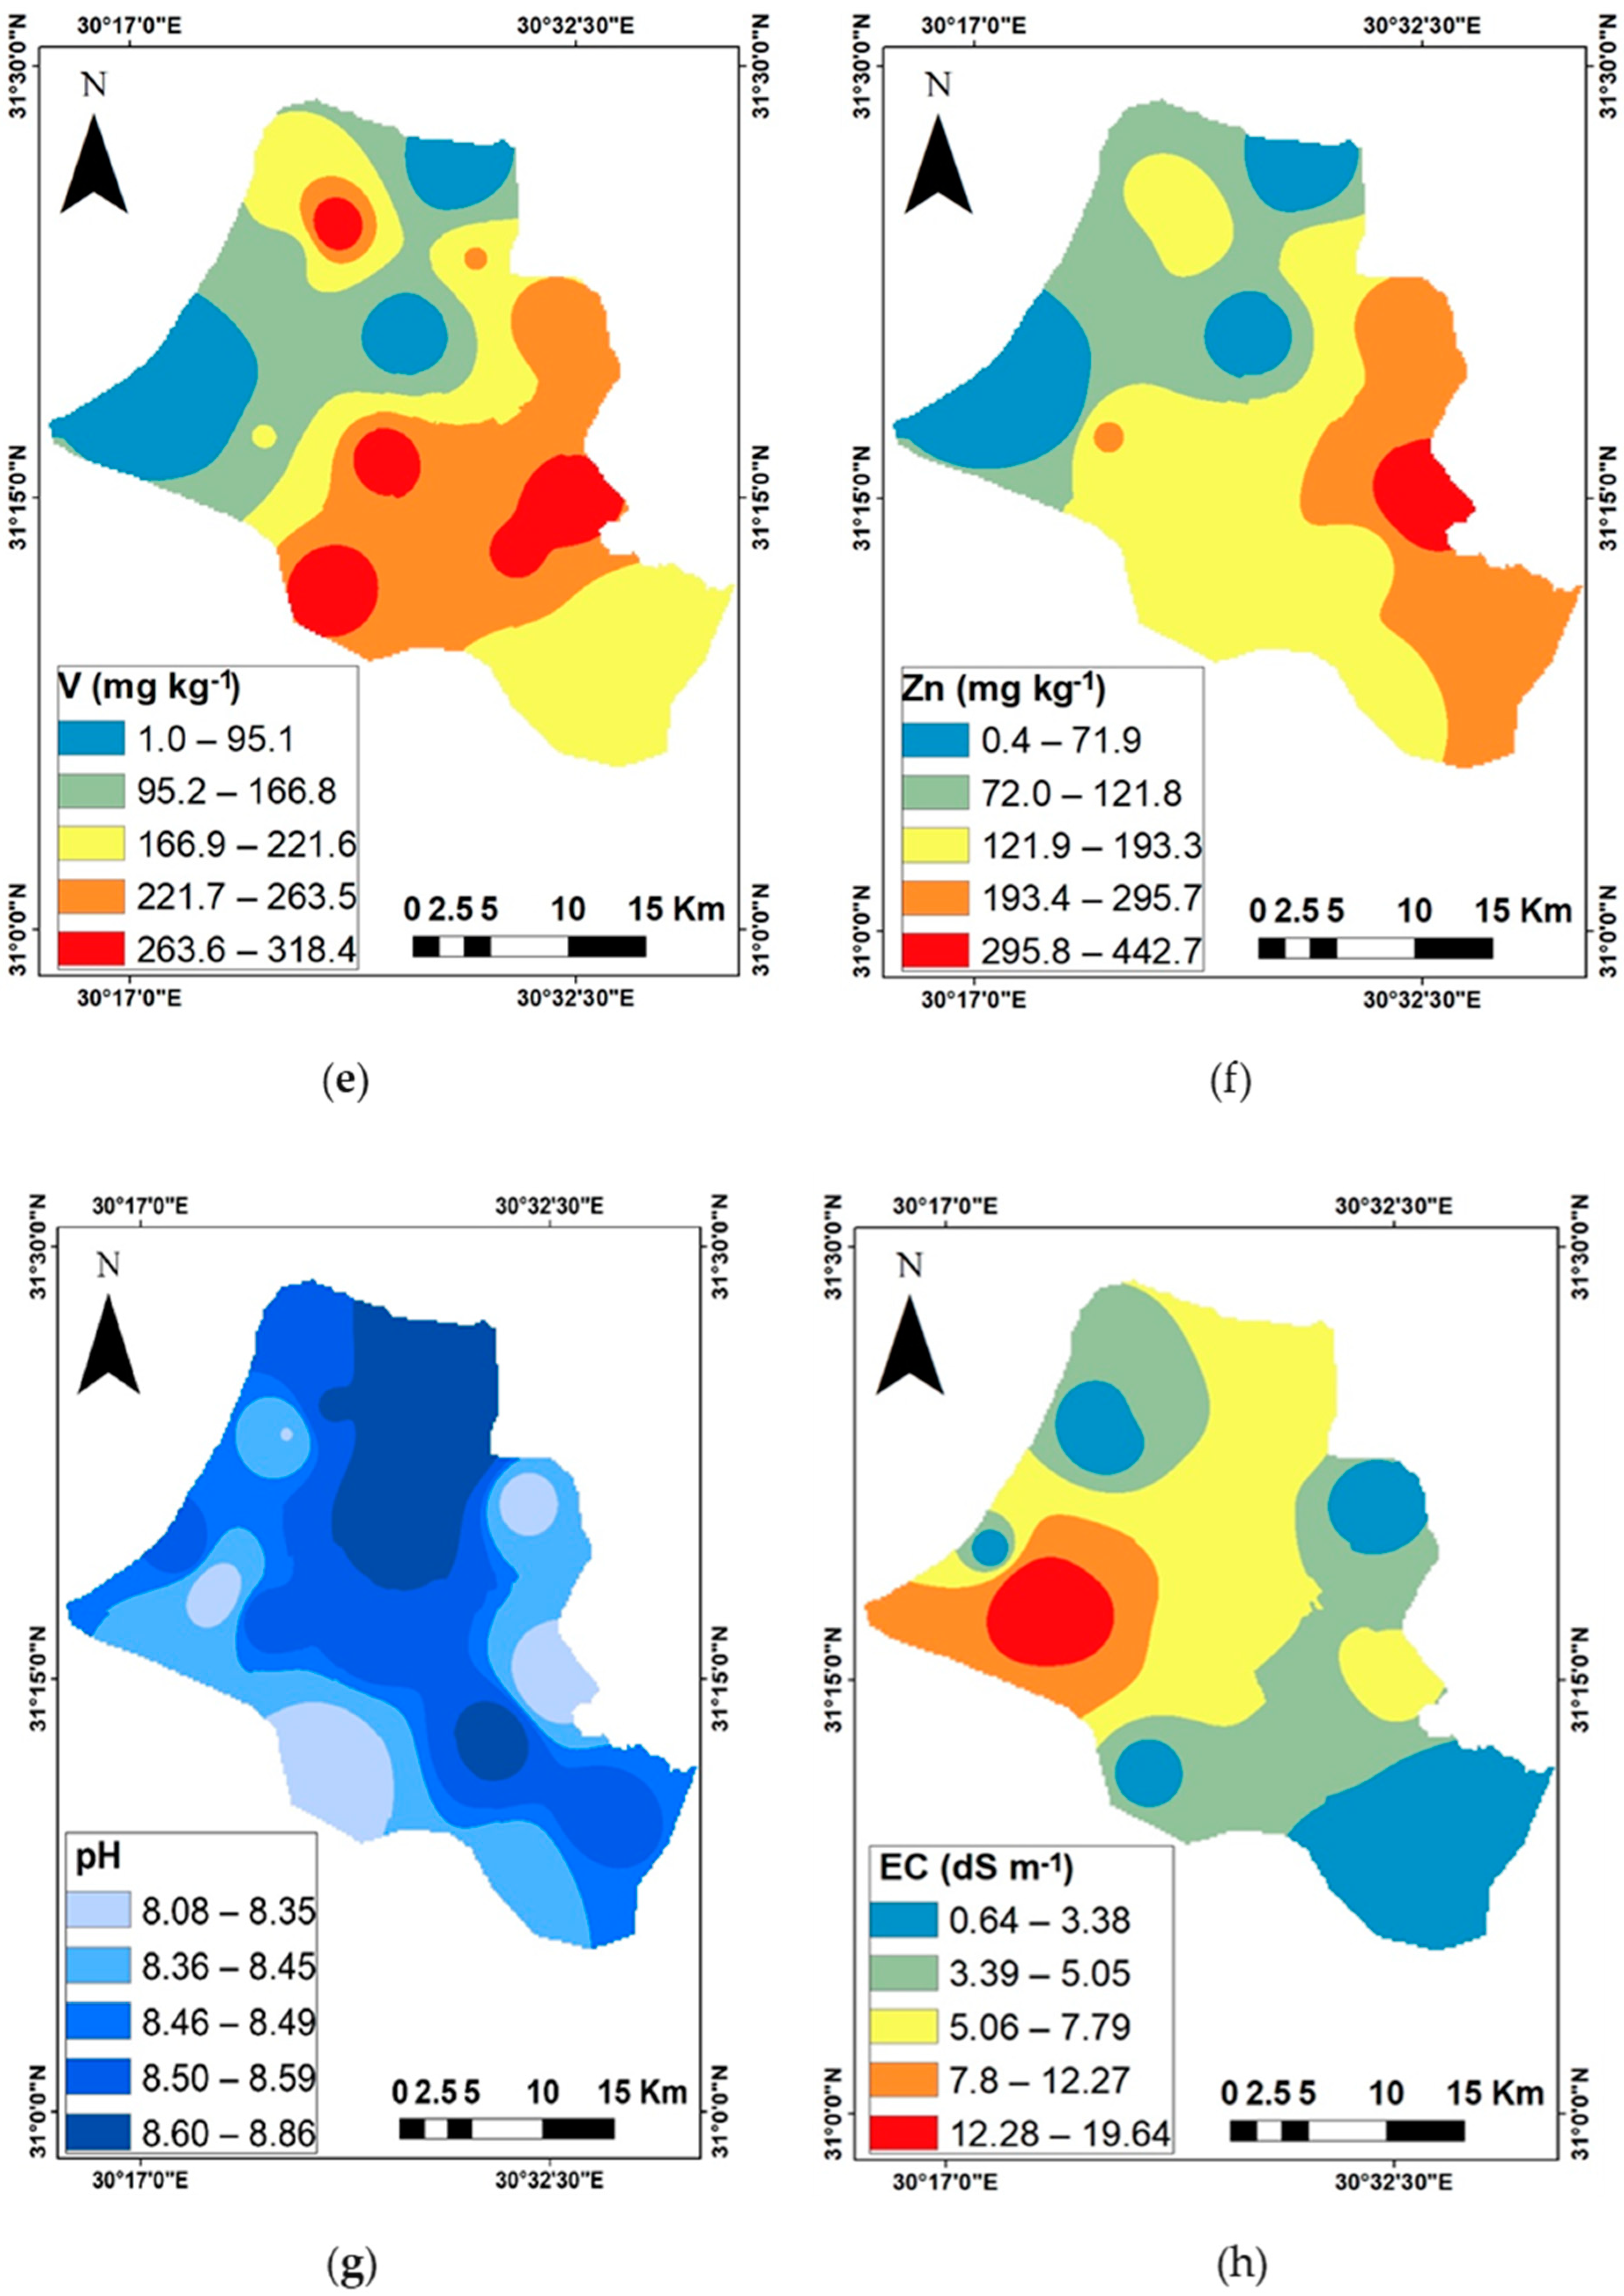
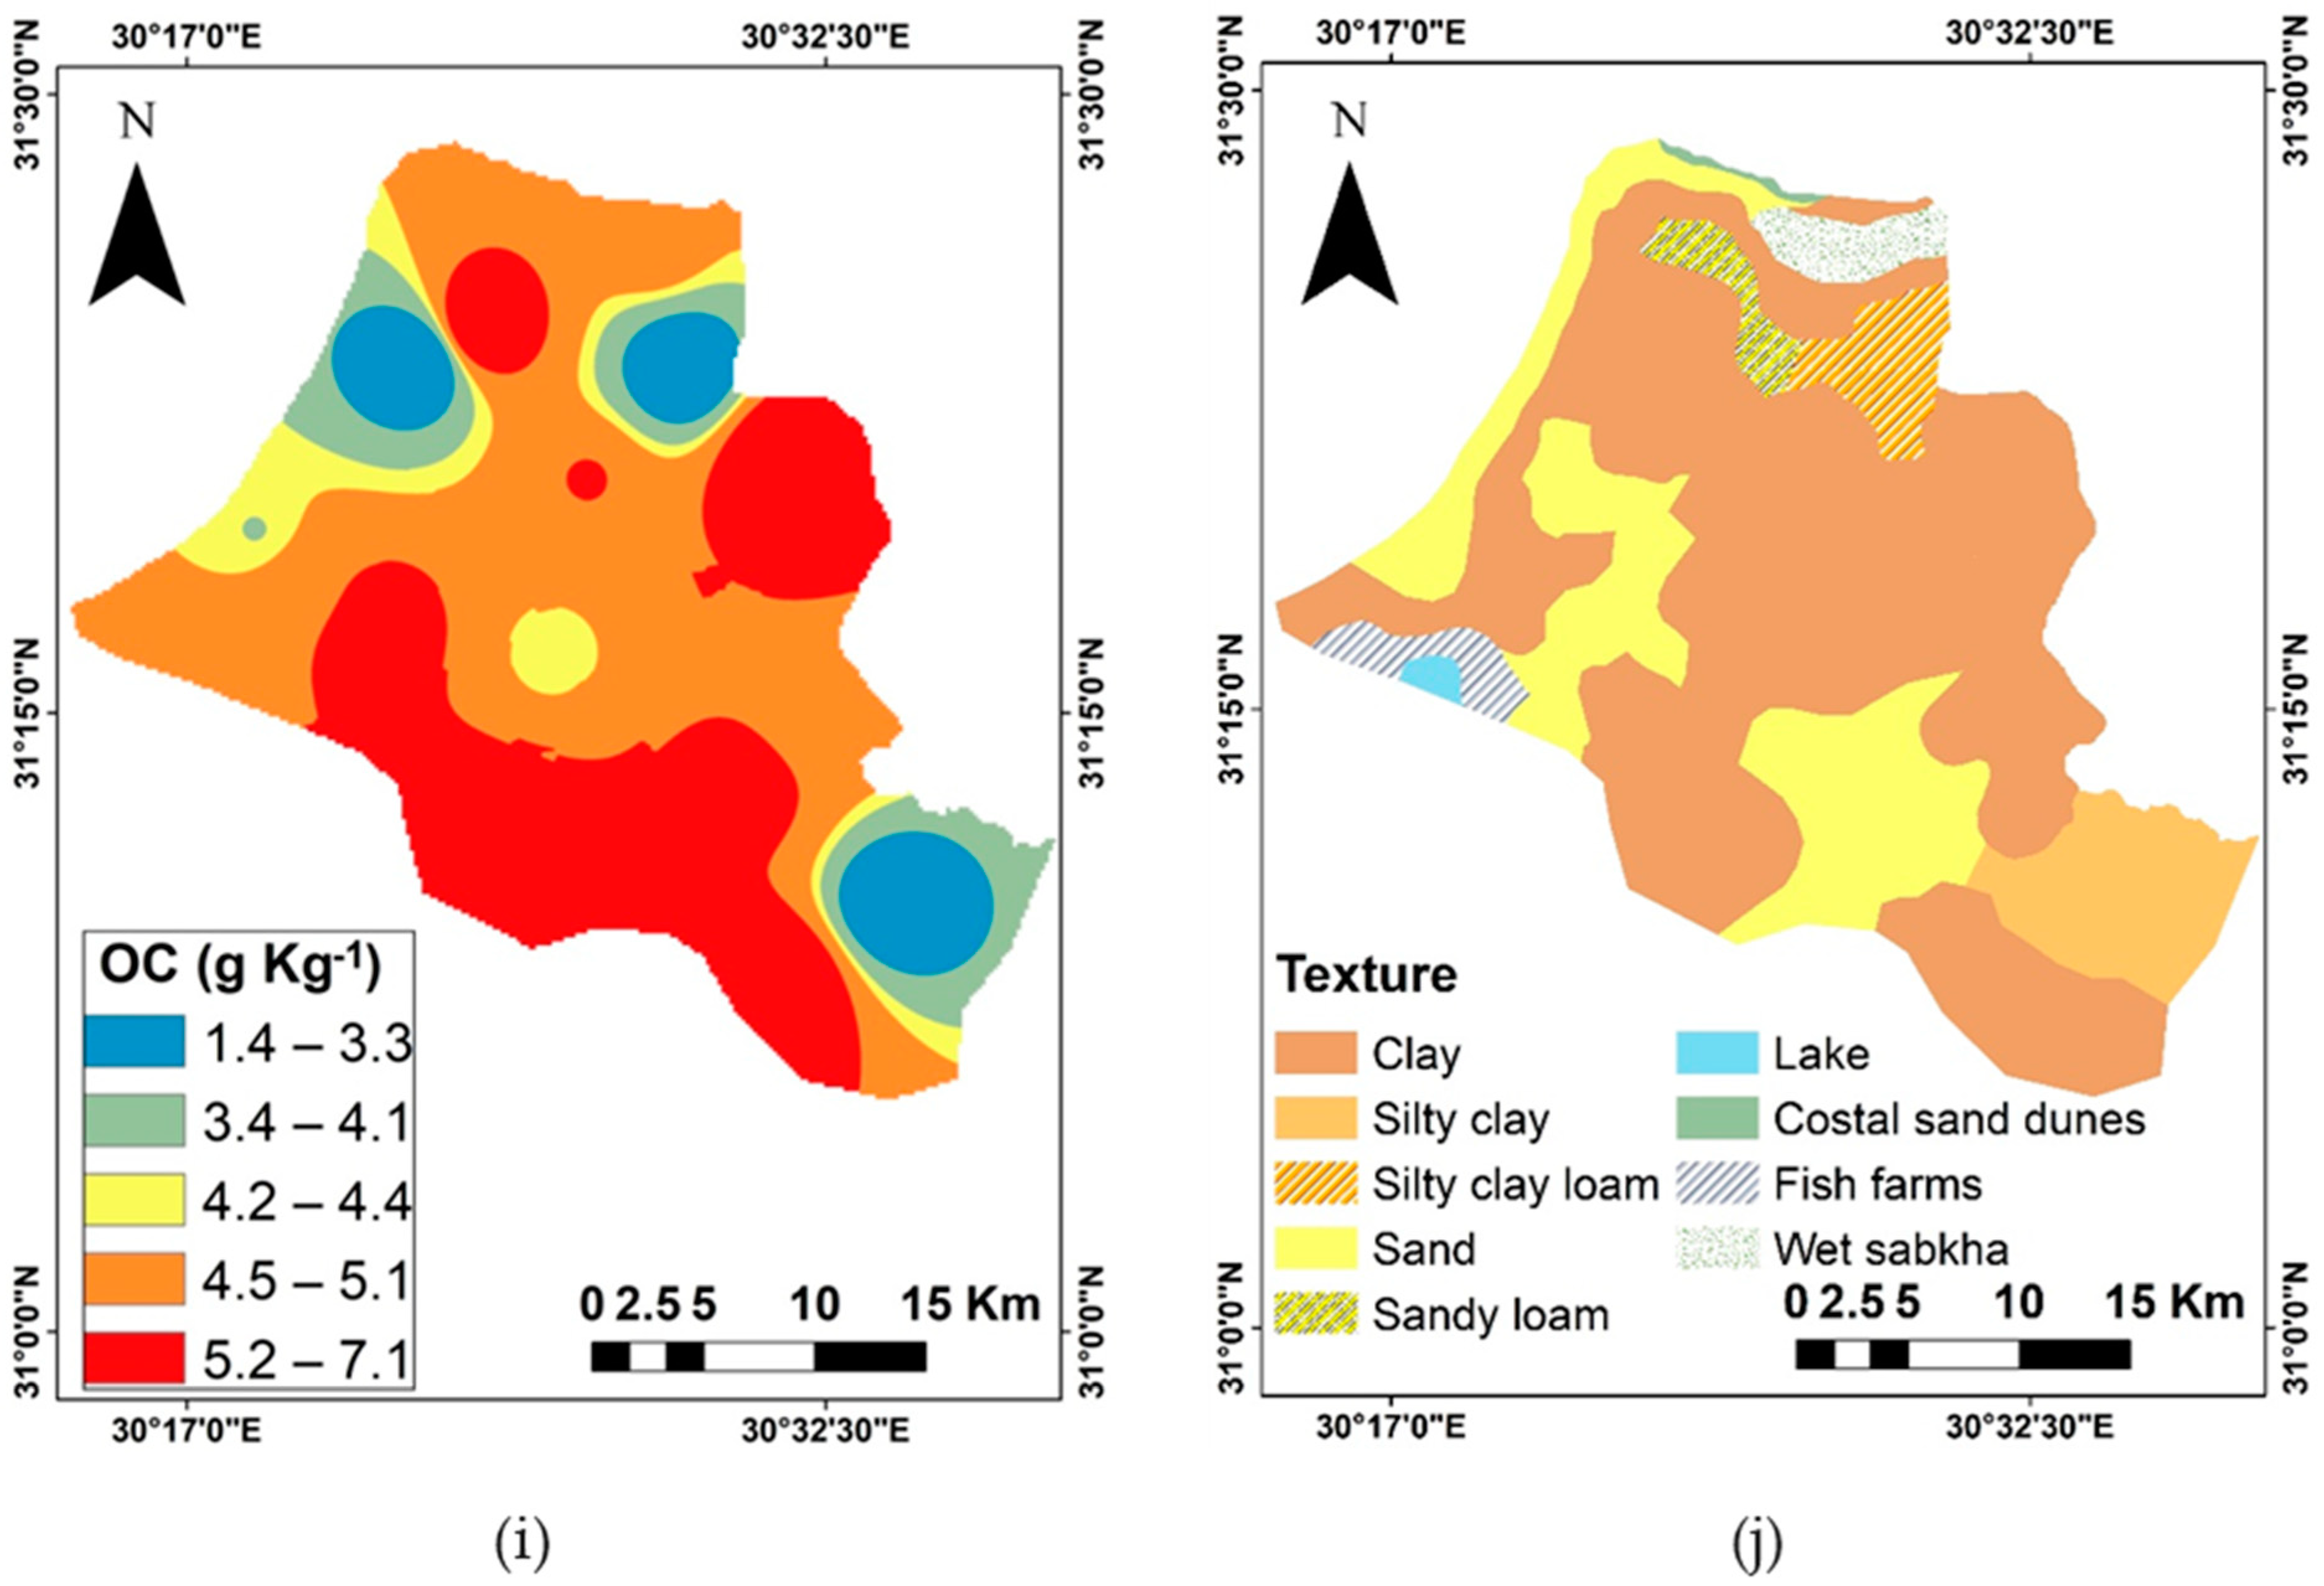
3.3. The Spatial Distribution of the Mean Soil Properties and Heavy Metal Weight

As shown in Figure 6, the southeast region of the research area shows an increase in the spatial trends for (As) mean weight (Figure 6a). On the other hand, modest amounts of it were present in the northwest of the research region. The east portions of the research area (Figure 6b) had significantly higher concentrations of (Co), which may be related to local human activity and agricultural management techniques in terms of fertilizer application [67,68]. According to the interpolation map in Figure 6d,e, the sites in the south, east, and center of the study area had the highest values for Ni, whereas the spatial distribution of (V) was irregular since the highest values were dispersed throughout the north and west of the study region. The main sources of soil (Ni) pollution are the companies involved in metal plating, burning fossil fuels, mining Nickel, and electroplating. This is in addition to the anthropogenic sources, such as sewage sludge and other wastes that are used as soil conditioners, phosphate-based agricultural fertilizers, atmospheric deposition, and inorganic fertilizers [69,70,71,72,73,74]. The spatial patterns demonstrated that (Cu) and (Zn) concentrations rose from the north to the southwest (Figure 6c,f). While the red color in the EC map expresses its greatest levels, which are located in the places adjacent to Idko Lake, the highest values for pH were identified in locations in the northeast and southeast of the study area (Figure 6g,h). These outputs are consistent with each other [28]. West of the study area was where SOC levels were the highest (Figure 6i). The study area has numerous textural classes such as sandy, silty clay, silty clay loam, sandy loam, and clay (Figure 6j).

3.4. Contamination Hazards Indices

The findings demonstrate that the I-geo values of six heavy metals ranged from highly contaminated to non-polluted. The results demonstrate significant differences in the levels of As, Co, Cu, Ni, V, and Zn in the various soil layers, as seen in Table S1. I-geo (As) ranged between −8.2 and 5.3, I-geo (Co) ranged between −4.1 and 1.8, I-geo (Cu) ranged between −6.4 and 1.9, I-geo (Ni) ranged between −9.7 and 2.8, I-geo (V) ranged between−6.3 and 2.9, and I-geo (Zn) ranged between−12.5 and 2.4. Therefore, I-geo classification varied from uncontaminated to strongly and extremely contaminated. I-geo (AS) displayed strongly to extremely contaminated properties in some surface samples, which suggests that several surface and sub-surface samples had a strong level of contamination. For As, Co, Cu, Ni, V, and Zn, the CF values ranged from 0.01 to 60.6, 0.09 to 5.17, 0.02 to 10.51, 0 to 10.51, 0.02 to 7.12, and 0 to 7.68, respectively. As a result, the classification of CF in the study area ranges from low contamination to very high contamination. CF values are arranged in descending order as follows: CF (As) > CF (Ni) > CF(Zn) > CF(V) > CF(Cu) and CF (Co), Table S2. Various soil contamination indices were used by many other researchers, including Pn and PERI [75,76]. According to the Pn index classification, the study areas were moderately polluted, moderately to heavily polluted, heavily polluted, and heavily to extremely polluted, as shown in Table 4 and Figure 7a. The largest part of the study area was determined to be a moderately to heavily polluted class (79.19%). However, the moderately polluted class only occupied roughly 1.36% of the entire study; 12.14% of the research region was heavily polluted and 7.31% of the study area was classified as heavily to extremely polluted. According to the PERI values, 19.45% of the study area was in a low risk class, which means that 1.36% of the research area was in a high risk class. The majority of the study area was under a very high risk of contamination c (49.17%), and approximately 30.02% of the study area was extremely contaminated, as shown in Table 5 and Figure 7b. This area is one of Egypt’s most populated, fertile, and agriculturally developed areas; therefore, it can maintain a sizable population [6]. It is also under significant stress because it is close to the sea and has a large volume of domestic drainage in the Nile Delta. In the absence of official planning, residential neighborhoods and industrial zones frequently overlap. As a result, contaminants are released into the area’s soil, water, and air from a variety of anthropogenic activities, such as industrial operations, transportation networks, residential domestic waste, sewage sludge effluents from within or near urban areas, and the use of fertilizer, pesticides, and insecticides in farmlands [4]. As such, numerous techniques have been created to clean up heavy metal-contaminated soil. Physical, biological, and chemical cleanup labels are used to classify these frequently used techniques. In situ chemical amendment of soil is a remediation method that stabilizes the heavy metals in polluted soil and is cost-effective when compared to other remediation strategies [77]. Inorganic supplements are used in this method to lessen the mobility and bioavailability of heavy metals through adsorption, precipitation, ion exchange, and complication [78]. suggested the use of tourmaline (a borosilicate mineral with a very complex chemical composition) is suggested to clean up historically heavy metals. Contaminated alkaline soils have a good chance of success [79]. In addition, with increasing quantities of tourmaline application to the soil, concentrations of water-soluble Ca and Mg in the soil significantly rose. Moreover, tourmaline decreased the metal mobility in polluted soil without an increase in the soil pH.

4. Conclusions

Soil contamination by heavy metals in the northern Nile Delta, Egypt is regarded as one of the major obstacles to sustainable development and food security, and its assessment is emphasized in the current study. The results revealed that I-geo (As) varied from −8.2 to 5.3, I-geo (Co) from −4.11 to 1.8, I-geo (Cu) from −6.4 to 1.9, I-geo (Ni) from −9.7 to 2.8, I-geo (V) from −6.3 to 2.9, and I-geo (Zn) from −12.5 to 2.4. Some surface samples showed I-geo (AS) displays that ranged from strong to extremely strong, but they also seemed to indicate that some surface and sub-surface samples had a high amount of contamination. CFs are ordered in decreasing order as follows: CF (As), CF (Ni), CF (Zn), CF (V), CF (Cu), and CF (Co). A class of moderately to heavily polluted areas made up the majority (71.9%) of the research region according to the Pn classification. Additionally, according to the PERI index results, most of the study region (49.17%) had a very high risk of contamination. The influence of anthropogenic activities on the heavy metal concentration in the soils of the study area was revealed by the use of a correlation matrix, cluster analysis, and principal component analysis to assess the variability in the soil’s chemical content. The present study indicates there are harmful consequences from human activity, such as the overuse of mineral fertilizers and pesticides, on the soils investigated in the study area. The study concludes by advising the implementation of agricultural management rules to decrease human activities that create environmental pollution. Future research will also concentrate on how to adapt and minimize the consequences of soil contamination.

Supplementary Materials

The following supporting information can be downloaded at: https://www.mdpi.com/article/10.3390/agronomy12112871/s1, Table S1: Geo-Accumulation Index (Igeo) and associated contamination levels of study area; Table S2: Contamination factor (CF) and associated contamination levels of study area.

Author Contributions

Conceptualization, R.A.E.B. and M.S.S.; methodology, R.A.E.B. and M.S.S.; software, R.A.E.B. and M.S.S.; validation, R.A.E.B. and M.S.S.; formal analysis, R.A.E.B. and M.S.S.; investigation, R.A.E.B. and M.S.S.; resources, R.A.E.B. and M.S.S.; data curation, R.A.E.B. and M.S.S.; writing—original draft preparation, R.A.E.B., M.M.I. and M.S.S.; writing—review and editing, R.A.E.B., A.A.E.B., N.Y.R., M.M.I., E.S.M. and M.S.S.; visualization, R.A.E.B. and M.S.S.; supervision, A.A.E.B., N.Y.R., M.M.I. and E.S.M.; project administration, A.A.E.B., N.Y.R., M.M.I. and E.S.M.; funding acquisition, N.Y.R. All authors have read and agreed to the published version of the manuscript.

Funding

This research received no external funding.

Data Availability Statement

Not applicable.

Acknowledgments

This paper was supported by the RUDN University Strategic Academic Leadership Program.

Conflicts of Interest

The authors declare no conflict of interest.

References

  1. Li, C.; Sun, G.; Wu, Z.; Zhong, H.; Wang, R.; Liu, X.; Guo, Z.; Cheng, J. Soil physiochemical properties and landscape patterns control trace metal contamination at the urban-rural interface in southern China. Environ. Pollut. 2019, 250, 537–545. [Google Scholar] [CrossRef] [PubMed]
  2. Ma, T.; Zhang, Y.; Hu, Q.; Han, M.; Li, X.; Zhang, Y.; Li, Z.; Shi, R. Accumulation Characteristics and Pollution Evaluation of Soil Heavy Metals in Different Land Use Types: Study on the Whole Region of Tianjin. Int. J. Environ. Res. Public Health 2022, 19, 10013. [Google Scholar] [CrossRef] [PubMed]
  3. Jan, F.A.; Ishaq, M.; Khan, S.; Ihsanullah, I.; Ahmad, I.; Shakirullah, M. A comparative study of human health risks via consumption of food crops grown on wastewater irrigated soil (Peshawar) and relatively clean water irrigated soil (lower Dir). J. Hazard. Mater. 2010, 179, 612–621. [Google Scholar] [CrossRef] [PubMed]
  4. Abu Khatita, A.M. Assessment of Soil and Sediment Contamination in the Middle Nile Delta area (Egypt)-Geo-Environmental Study Using Combined Sedimentological, Geophysical and Geochemical Methods; Alexander-Universität Erlangen Nürnberg zur Erlangung: Erlangen, Germany, 2011. [Google Scholar]
  5. Khater, A.; Kitamura, Y.; Shimizu, K.; El Hassan, W.A.; Fujimaki, H. Quantitative analysis of reusing agricultural water to compensate for water supply deficiencies in the Nile Delta irrigation network. Paddy Water Environ. 2015, 13, 367–378. [Google Scholar] [CrossRef]
  6. Abowaly, M.E.; Belal, A.-A.A.; Abd Elkhalek, E.E.; Elsayed, S.; Abou Samra, R.M.; Alshammari, A.S.; Moghanm, F.S.; Shaltout, K.H.; Alamri, S.A.M.; Eid, E.M. Assessment of Soil Pollution Levels in North Nile Delta, by Integrating Contamination Indices, GIS, and Multivariate Modeling. Sustainability 2021, 13, 8027. [Google Scholar] [CrossRef]
  7. Li, C.; Jiang, X.; Jiang, H.; Sha, Q.; Li, X.; Jia, G.; Cheng, J.; Zheng, J. Environmental Controls to Soil Heavy Metal Pollution Vary at Multiple Scales in a Highly Urbanizing Region in Southern China. Sensors 2022, 22, 4496. [Google Scholar] [CrossRef]
  8. Li, C.; Li, F.; Wu, Z.; Cheng, J. Effects of landscape heterogeneity on the elevated trace metal concentrations in agricultural soils at multiple scales in the Pearl River Delta, South China. Environ. Pollut. 2015, 206, 264–274. [Google Scholar] [CrossRef]
  9. Benamghar, A.; Jaime Gomez-Hernandez, J. Factorial kriging of a geochemical dataset for heavy-metal spatial-variability characterization. Environ. Earth Sci. 2014, 71, 3161–3170. [Google Scholar] [CrossRef]
  10. Cheng, Q.; Guo, Y.; Wang, W.; Hao, S. Spatial variation of soil quality and pollution assessment of heavy metals in cultivated soils of Henan Province, China. Chem. Spec. Bioavail. 2014, 26, 184–190. [Google Scholar] [CrossRef]
  11. Weissmannova, D.H.; Pavlovsky, J.; Chovanec, P. Heavy metal Contaminations of Urban soils in Ostrava, Czech Republic: Assessment of Metal Pollution and using Principal Component Analysis. Int. J. Environ. Res. 2015, 9, 683–696. [Google Scholar]
  12. Raven, P.H.; Berg, L.R.; Johnson, G.B. Environment, 2nd ed.; Saunders College Publishing: New York, NY, USA, 1998. [Google Scholar]
  13. Ahmed, F.; Fakhruddin, A.N.M.; Imam, M.D.T.; Khan, N.; Abdullah, A.T.M.; Khan, T.A.; Rahman, M.M.; Uddin, M.N. Assessment of roadside surface water quality of Savar, Dhaka, Bangladesh using GIS and multivariate statistical techniques. Appl. Water Sci. 2017, 7, 3511–3525. [Google Scholar] [CrossRef]
  14. Xie, Y.; Chen, T.-B.; Lei, M.; Yang, J.; Guo, Q.-J.; Song, B.; Zhou, X.-Y. Spatial distribution of soil heavy metal pollution estimated by different interpolation methods: Accuracy and uncertainty analysis. Chemosphere 2011, 82, 468–476. [Google Scholar] [CrossRef]
  15. Zheng, C. Using multivariate analyses and GIS to identify pollutants and their spatial patterns in urban soils in Galway, Ireland. Environ. Pollut. 2006, 142, 501–511. [Google Scholar] [CrossRef]
  16. Shokr, M.S.; El Baroudy, A.A.; Fullen, M.A.; El-Beshbeshy, T.R.; Ali, R.R.; Elhalim, A.; Guerra, A.J.T.; Jorge, M.C.O. Spatial distribution of heavy metals in the middle Nile delta of Egypt. Int. Soil Water Conserv. 2016, 4, 293–303. [Google Scholar] [CrossRef]
  17. Ma, Z. Hazard of heavy metal pollution in farmland soil and its ecological risk assessment method. IOP Conf. Ser. Earth Environ. Sci. 2021, 781, 32052. [Google Scholar] [CrossRef]
  18. Yang, Y.; Christakos, G.; Guo, M.; Xiao, L.; Huang, W. Space-time quantitative source apportionment of soil heavy metal con- centration increments. Environ. Pollut. 2017, 223, 560–566. [Google Scholar] [CrossRef]
  19. Yang, Y.; Yang, X.; He, M.; Christakos, G. Beyond mere pollution source identification: Determination of land covers emitting soil heavy metals by combining PCA/APCS, GeoDetector and GIS analysis. CATENA 2020, 185, 104297. [Google Scholar] [CrossRef]
  20. Abdel-Fattah, M.K.; Abd-Elmabod, S.K.; Aldosari, A.A.; Elrys, A.S.; Mohamed, E.S. Multivariate Analysis for Assessing Irrigation Water Quality: A Case Study of the Bahr Mouise Canal, Eastern Nile Delta. Water 2020, 12, 2537. [Google Scholar] [CrossRef]
  21. Climatological Normal for Egypt. The Normal for Beheira Governorate from 1960–2011; Ministry of Civil Aviation, Meteorological Authority: Cairo, Egypt, 2011.
  22. Shaltout, K.H.; Galal, T.M.; El-Komi, T.M. Evaluation of the nutrient status of some hydrophytes in the water courses of Nile Delta, Egypt. J. Bot. 2009, 36, 77–87. [Google Scholar] [CrossRef]
  23. Molle, F.; Gaafar, I.; El-Agha, D.E.; Rap, E. The Nile delta’s water and salt balances and implications for management. Agric. Water Manag. 2018, 197, 110–121. [Google Scholar] [CrossRef]
  24. El Behairy, R.A.; El Baroudy, A.A.; Ibrahim, M.M.; Kheir, A.M.S.; Shokr, M.S. Modelling and assessment of irrigation water quality index using GIS in semi-arid region for sustainable agriculture. Water Air Soil Pollut. 2021, 232, 352. [Google Scholar] [CrossRef]
  25. El Behairy, R.A. Using New Techniques for Studying Land Resources in Some Areas of North West Nile Delta, Egypt. Master’s Thesis, Faculty of Agriculture, Tanta University, Cairo, Egypt, 2021. [Google Scholar]
  26. Food and Agriculture Organization of the United Nations. Guidelines for Soil Profile Description, 3rd ed.; Food and Agriculture Organization of the United Nations: Rome, Italy, 2006. [Google Scholar]
  27. Soil Survey Staff. Keys to Soil Taxonomy, USDA-NRCS, 11th ed.; U.S. Government Print Office: Washington, DC, USA, 2014.
  28. El Behairy, R.A.; El Baroudy, A.A.; Ibrahim, M.M.; Mohamed, E.S.; Kucher, D.E.; Shokr, M.S. Assessment of Soil Capability and Crop Suitability Using Integrated Multivariate and GIS Approaches toward Agricultural Sustainability. Land 2022, 11, 1027. [Google Scholar] [CrossRef]
  29. Thomas, G.W. Soil pH and Soil Acidity. In Methods of Soil Analysis Part 3, Chemical Methods; Sparks, D.L., Ed.; Soil Science Society of America Book Series, No. 5; Soil Science Society of America, American Society of Agronomy: Madison, WI, USA, 1996; pp. 475–490. [Google Scholar]
  30. Rhoades, J.D. Salinity: Electrical Conductivity and Total Dissolved Solids. In Methods of Soil Analysis Part 3, Chemical Methods; Sparks, D.L., Ed.; Soil Science Society of America Book Series, No. 5; Soil Science Society of America, American Society of Agronomy: Madison, WI, USA, 1996; pp. 417–435. [Google Scholar]
  31. Schumacher, B. Methods for the Determination of Total Organic Carbon (TOC). In Soils and Sediments; Ecological Risk Assessment Support Center Office of Research and Development: Washington, DC, USA, 2002. [Google Scholar]
  32. Rowell, D.L. Soil Science Methods & Applications; Library of Congress Cataloging Publication Data: New York, NY, USA, 1995. [Google Scholar]
  33. Page, A.L.; Keeney, D. Methods of Soil Analysis; American Society of Agronomy: Madison, WI, USA, 1982. [Google Scholar]
  34. Wedepohl, K.H. The composition of the continental crust. Geochim. Cosmochim. Acta 1995, 59, 1217–1239. [Google Scholar] [CrossRef]
  35. Rahman, S.; Khanam, D.; Adyel, T.; Islam, M.S.; Mohammad Ahsan, A.; Akbor, M.A. Assessment of heavy metal contamination of agricultural soil around Dhaka Export Processing Zone (DEPZ), Bangladesh: Implication of seasonal variation and indices. Appl. Sci. 2012, 2, 584–601. [Google Scholar] [CrossRef]
  36. Guan, Y.; Shao, C.; Ju, M. Heavy metal contamination assessment and partition for industrial and mining gathering areas. Int. J. Environ. Res. Public Health 2014, 11, 7286–7303. [Google Scholar] [CrossRef] [PubMed]
  37. Muller, G. Index of Geoaccumulation in Sediments of the Rhine River. J. Geol. 1979, 2, 108–118. [Google Scholar]
  38. Harikumar, P.S.; Jisha, T.S. Distribution pattern of trace metal pollutants in the sediments of an urban wetlands in the southwest coast of India. Int. J. Eng. 2010, 2, 840–850. [Google Scholar]
  39. Håkanson, L. An ecological risk index for aquatic pollution control. A sedimentological approach. Water Res. 1980, 14, 975–1001. [Google Scholar] [CrossRef]
  40. Chai, L.; Li, H.; Yang, Z.; Min, X.; Liao, Q.; Liu, Y.; Men, S.; Yan, Y.; Xu, J. Heavy metals and metalloids in the surface sediments of the Xiangjiang River, Hunan, China: Distribution, contamination, and ecological risk assessment. Environ. Sci. Pollut. Res. 2017, 24, 874–885. [Google Scholar] [CrossRef]
  41. Barrett, K.; Morgan, G. SPSS for Intermediate Statistics; Use and Interpretation; Lawrence Erlbaum Associates Publishers: Mahwah, NJ, USA; London, UK, 2005. [Google Scholar]
  42. Jolliffe, I.T.; Cadima, J. Principal component analysis: A review and recent developments. Philos. Trans. A Math. Phys. Eng. Sci. 2016, 374, 20150202. [Google Scholar] [CrossRef]
  43. Imperato, M.; Adamo, P.; Naimo, D.; Arienzo, M.; Stanzione, D.; Violante, P. Spatial distribution of heavy metals in urban soils of Naples city (Italy). Environ. Pollut. 2003, 124, 247–256. [Google Scholar] [CrossRef]
  44. McGrath, D.; Zhang, C.; Carton, O.T. Geostatistical analyses and hazard assessment on soil lead in Silvermines area, Ireland. Environ. Pollut. 2004, 127, 239–248. [Google Scholar] [CrossRef]
  45. Lee, C.S.L.; Li, X.; Shi, W.; Cheung, S.C.N.; Thornton, I. Metal contamination in urban, suburban, and country park soils of Hong Kong: A study based on GIS and multivariate statistics. Sci. Total Environ. 2006, 356, 45–61. [Google Scholar] [CrossRef]
  46. Franzen, D.W.; Peck, T.R. Field soil sampling density for variable rate fertilization. J. Prod. Agric. 1995, 8, 568–574. [Google Scholar] [CrossRef]
  47. Weisz, R.; Fleischer, S.; Smilowitz, Z. Map generation in high value horticultural integrated pest management: Appropriate interpolation methods for site-specific pest management of Colorado potato beetle (Coleoptera: Chrysomelidae). J. Econ. Entomol. 1995, 88, 1650–1657. [Google Scholar] [CrossRef]
  48. ATSDR (United States Agency for Toxic Substances and Disease Registry). Toxicological Profile for Arsenic; US Department of Health and Human Services, Public Health Service, Agency for Toxic Substances and Disease Registry: Washington, DC, USA, 2000; p. 428.
  49. ATSDR (United States Agency for Toxic Substances and Disease Registry). Toxicological Profile for Cobalt; U.S. Department of Health and Human Services: Washington, DC, USA, 2004; p. 486.
  50. Fishel, F.M. Pesticide Toxicity Profile: Copper-based Pesticides; University of Florida: Gainesville, FL, USA, 2014; p. 5. [Google Scholar]
  51. Tóth, G.; Hermann, T.; Da Silva, M.R.; Montanarella, L. Heavy metals in agricultural soils of the European Union with implications for food safety. Environ. Int. 2016, 88, 299–309. [Google Scholar] [CrossRef]
  52. Cempel, M.; Nikel, G. Nickel: A review of its sources and environmental toxicology. Pol. J. Environ. Stud. 2006, 15, 375–382. [Google Scholar]
  53. Yang, J.; Wang, M.; Jia, Y.; Gou, M.; Zeyer, J. Toxicity of vanadium in soil on soybean at different growth stages. Environ. Pollut. 2017, 231, 48–58. [Google Scholar] [CrossRef]
  54. Swartjes, F.A. Introduction to contaminated site management. In Dealing with Contaminated Sites; Swatrjes, F., Ed.; Springer Science+Business Media B.V.: Berlin/Heidelberg, Germany, 2011. [Google Scholar]
  55. Department of Environmental Affairs (DEA). National Environmental Management, Waste Act, 2008; National Norms and Standards for the Remediation of Contaminated Land and Soil Quality in the Republic of South Africa. Government Gazette, No. 36447; DEA: Pretoria, South Africa, 2013.
  56. Ostovari, Y.; Ghorbani-Dashtaki, S.; Bahrami, H.; Abbasi, M.; Dematte, A.; Arthur, E.; Panagos, P. Towards prediction of soil erodibility, SOM and CaCO3 using laboratory Vis-NIR spectra: A case study in a semi-arid region of Iran. Geoderma 2018, 314, 102–112. [Google Scholar] [CrossRef]
  57. Hammam, A.A.; Mohamed, E.S. Mapping soil salinity in the East Nile Delta using several methodological approaches of salinity assessment. Egypt. J. Remote Sens. Space Sci. 2020, 23, 125–131. [Google Scholar]
  58. Hendawy, E.; Belal, A.A.; Mohamed, E.S.; Elfadaly, A.; Murgante, B.; Aldosari, A.A.; Lasaponara, R. The Prediction and Assessment of the Impacts of Soil Sealing on Agricultural Land in the North Nile Delta (Egypt) Using Satellite Data and GIS Modeling. Sustainability 2019, 11, 4662. [Google Scholar] [CrossRef]
  59. Hammam, A.A.; Mohamed, W.S.; Sayed, S.E.-E.; Kucher, D.E.; Mohamed, E.S. Assessment of Soil Contamination Using GIS and Multi-Variate Analysis: A Case Study in El-Minia Governorate, Egypt. Agronomy 2022, 12, 1197. [Google Scholar] [CrossRef]
  60. Yang, X.; Xiong, B.; Yang, M. Relationships among Heavy Metals and Organic Matter in Sediment Cores from Lake Nanhu, an Urban Lake in Wuhan, China. J. Freshw. Ecol. 2010, 25, 243–249. [Google Scholar] [CrossRef]
  61. Ali, A.R.; Talabani, M.J.A. Heavy Metals Distribution and Their Correlation with Clay Size Fraction in Stream Sediments of the Lesser Zab River at Northeastern Iraq. J. Geosci. Environ. Prot. 2018, 6, 89–106. [Google Scholar] [CrossRef]
  62. Abdi, H.; Williams, L.J. Principal component analysis. WIREs Comput. Stat. 2010, 2, 433–459. [Google Scholar] [CrossRef]
  63. Wei, Z.; Wang, D.; Zhou, H.; Qi, Z. Assessment of Soil Heavy Metal Pollution with Principal Component Analysis and Geoaccumulation Index. Procedia Environ. Sci. 2011, 10, 1946–1952. [Google Scholar] [CrossRef]
  64. Gergen, I.; Harmanescu, M. Application of principal component analysis in the pollution assessment with heavy metals of vegetable food chain in the old mining areas. Chem. Central J. 2012, 6, 156. [Google Scholar] [CrossRef]
  65. Peres-Neto, P.R.; Jackson, D.A.; Somers, K.M. How many principal components? Stopping rules for determining the number of non-trivial axes revisited. Comput. Stat. Data Anal. 2005, 49, 974–997. [Google Scholar] [CrossRef]
  66. Kaiser, H.F. The Application of Electronic Computers to Factor Analysis. Educ. Psychol. Meas. 1960, 20, 141–151. [Google Scholar] [CrossRef]
  67. Shelbaya, M.M.A.; El-Azeim, M.M.A.; Menesi, A.M.; El-Mageed, M.M.A. Heavy Metals and Microbial Activity in Alluvial Soils Affected by Different Land-Uses. J. Soil Sci. Agric. Eng. 2021, 12, 165–177. [Google Scholar] [CrossRef]
  68. El-Azeim, M.A.; Mohamed, W.; Hammam, A. Soil Physiochemical Properties in Relation to Heavy Metals Status of Agricultural Soils in El-Minia Governorate, Egypt. J. Soil Sci. Agric. Eng. 2016, 7, 423–431. [Google Scholar] [CrossRef]
  69. Wuana, R.A.; Okieimen, F.E. Heavy Metals in Contaminated Soils: A Review of Sources, Chemistry, Risks and Best Available Strategies for Remediation. Int. Sch. Res. Not. 2011, 2011, 402647. [Google Scholar] [CrossRef]
  70. Mcgrath, S.P. Nickel in Heavy Metals in Soils, 2nd ed.; Alloway, B.J., Ed.; Blackie Academic & Professional: London, UK, 1995; 371p. [Google Scholar]
  71. Parth, V.; Murthy, N.N.; Saxena, P.R. Assessment of heavy metal contamination in soil around hazardous waste disposal sites in Hyderabad City (India): Natural and anthropogenic implications. J. Environ. Res. Manag. 2011, 2, 27–34. [Google Scholar]
  72. Senesi, G.S.; Baldassarre, G.; Senesi, N.; Radina, B. Trace element input into soils by anthropogenic activities and implications for human health. Chemosphere 1999, 39, 343–377. [Google Scholar] [CrossRef]
  73. Luo, L.; Ma, Y.B.; Zhang, S.Z.; Wei, D.P.; Zhu, Y.G. An inventory of heavy metal inputs to agricultural soils in China. J. Environ. Manag. 2009, 90, 2524–2530. [Google Scholar] [CrossRef]
  74. Nicholson, F.A.; Smith, S.R.; Alloway, B.J.; Carlton-Smith, C.; Chambers, B.J. An inventory of heavy metals inputs to agricultural soils in England and Wales. Sci. Total Environ. 2003, 311, 205–219. [Google Scholar] [CrossRef]
  75. Li, R.; Yuan, Y.; Li, C.; Sun, W.; Yang, M.; Wang, X. Environmental Health and Ecological Risk Assessment of Soil Heavy Metal Pollution in the Coastal Cities of Estuarine Bay—A Case Study of Hangzhou Bay, China. Toxics 2020, 8, 75. [Google Scholar] [CrossRef]
  76. Wieczorek, J.; Baran, A. Pollution indices and biotests as useful tools for the evaluation of the degree of soil contamination by trace elements. J Soils Sediments 2022, 22, 559–576. [Google Scholar] [CrossRef]
  77. Zhang, M.K.; Pu, J.C. Mineral materials as feasible amendments to stabilize heavy metals in polluted urban soils. J. Environ. Sci. (China) 2011, 23, 607–615. [Google Scholar] [CrossRef]
  78. Udeigwe, T.K.; Eze, P.N.; Teboh, J.M.; Stietiya, M.H. Application, chemistry, and environmental implications of contaminant-immobilization amendments on agricultural soil and water quality. Environ. Int. 2011, 37, 258–267. [Google Scholar] [CrossRef]
  79. Wang, B.; Wang, C.; Li, J.; Sun, H.; Xu, Z. Remediation of Alkaline Soil with Heavy Metal Contamination Using Tourmaline as a Novel Amendment. J. Environ. Chem. Eng. 2014, 2, 1281–1286. [Google Scholar] [CrossRef]
Figure 1. Location of the investigated area.
Agronomy 12 02871 g001
Figure 2. Profiles locations within the study area.
Agronomy 12 02871 g002
Figure 3. Pearson Correlation matrix chart of the studied variables. Note: * p < 0.05; ** p < 0.01.
Agronomy 12 02871 g003
Figure 4. Scree plot and eigenvalue of studied variables.
Agronomy 12 02871 g004
Figure 5. Dendrogram for the grouping clusters.
Agronomy 12 02871 g005
Figure 6. Mean weight spatial distribution of the studied soil properties and total concentrations of heavy metals (a) As (mg Kg−1), (b) Co (mg Kg−1), (c) Cu (mg Kg−1), (d) Ni (mg Kg−1), (e) V (mg Kg−1), (f) Zn (mg Kg−1), (g) soil reaction (pH), (h) electric conductivity (EC: dS m−1), (i) organic carbon (OC) (g Kg−1), and (j) Soil texture.
Agronomy 12 02871 g006aAgronomy 12 02871 g006bAgronomy 12 02871 g006c
Figure 7. The contamination hazard indices maps of the study area (a) Improved Nemerow’s Pollution Index (Pn), and (b) Potential Ecological Risk Index (PERI).
Agronomy 12 02871 g007aAgronomy 12 02871 g007b
Table 1. Statistical analysis of selected heavy metals and soil properties (n = 61).
Statistical ParameterspHECClayOCAsCoCuNiVZn
1:2.5dS m−1%mg kg−1mg kg−1
Min.7.970.551.380.060.011.050.250.031.010.01
Max.8.9023.2083.5912.30121.2059.9480.80195.43377.50399.27
Mean8.475.5545.435.2625.5217.3937.8070.29170.95149.27
St. Dev.0.285.7527.023.6125.9713.3324.9854.60123.84144.02
Skewness−0.061.76−0.710.441.520.61−0.610.17−0.180.37
Kurtosis−1.172.52−1.07−1.192.870.26−1.09−0.90−1.27−1.41
Background values (Wedepohl, 1995) [34].211.614.318.65352
Recommended concentration based on the Department of Environmental Affairs (DEA, 2013) [55].5.83001691150240
Note: n = number of samples; Min = Minimum; Max = Maximum; St. Dev = Standard deviation. The mean values were highlighted to compare with recommended values by [34,55].
Table 2. Kaiser–Meyer–Olkin (KMO) and Bartlett’s sphericity test.
KMO and Bartlett’s Test
Kaiser–Meyer–Olkin Measure of Sampling Adequacy0.851
Bartlet’s Test of SphericityChi-Square (Approx. value)496.844
Degree of freedom (DF)45
p-value0.0001
Table 3. Principal component analysis (PCA) analysis summary.
PCs ParametersPC1PC2
Eigenvalue5.991.28
Variability (%)59.9512.81
Cumulative (%)59.9572.76
Component Matrix
IndicatorPC1PC2
As0.710.28
Co0.79−0.19
Cu0.960.11
Ni0.93−0.09
V0.93−0.12
Zn0.84−0.20
pH−0.44−0.03
EC0.180.95
Clay0.830.32
O.M0.78−0.30
Factor 1: As-Co-Cu-Ni-V-Zn-Clay-OM, Factor 2: pH-EC, Values in bold relate for each variable to the factor for which the squared cosine is the highest.
Table 4. Areas and contamination classes of Pn index.
Pollution LevelAreas of Pn Index
(Km2)(%)
Moderately polluted10.321.36
Moderately to heavily polluted600.479.19
Heavily polluted92.0112.14
Heavily to extremely polluted55.437.31
Table 5. Areas and contamination classes for the PER index.
Contamination ClassesAreas of PER Index
(Km2)(%)
Low risk147.4419.45
High risk10.321.36
Very high risk372.7949.17
Extreme risk227.6130.02
Publisher’s Note: MDPI stays neutral with regard to jurisdictional claims in published maps and institutional affiliations.

