The standard management of isolated orbital wall fractures, also referred to as blowout fractures (BOFs), have been extensively debated over the years.[
1] BOF can result in both functional and cosmetic symptoms. Potential functional symptoms include hypoesthesia of the infraorbital nerve,[
2] diplopia,[
3] and ocular motility disorders.[
4] Extraocular muscle or periorbital tissue entrapment,[
4,
5] threatening the eye or the vision, is an absolute surgical indication. The potential late cosmetic deformities include superior sulcus deformity, hypoglobus, and enophthalmus.[
6,
7] Surgeons predict the potential risk for functional and/or late cosmetic symptoms based on clinical and CT scan findings, knowing that not all BOFs require surgical treatment.[
8] The cut-off points between surgical and nonsurgical treatment have been recommended at > 1.5 mL volume of herniation,[
9] an orbital floor fracture > 1.0 cm,[
2,
10] or > 50% fractured orbital floor.[
11] Despite recommendations on management,[
12,
13] there are considerable differences between surgeons, specialties, and countries in opinions regarding the surgical versus nonsurgical management of BOF.[
14]
The aim of this study was to (1) evaluate which patients with BOF, who are not operated on, develop functional and cosmetic problems, (2) evaluate which CT scan findings can be used to predict late visible deformity in patients with BOF who are not operated on; and (3) provide an algorithm based on available evidence to predict which patients with BOF benefit from surgical versus nonsurgical treatment.
The Ethics Committee of the Karolinska Institute (EPN) Stockholm, Sweden, approved the study protocols and informed consent was obtained from each individual included in the study. The studies were conducted in adherence to the Declaration of Helsinki.
Materials and Methods
This was a prospective clinical studyof patients with BOFat the Department of ENT and Head and Neck Surgery at Karolinska University Hospital in Stockholm, Sweden. Patients with facial trauma who presented with a CT scan verifying an isolated unilateral inferior, inferomedial, or medial orbital wall fracture were included between the years 2011 and 2016. Patients with injuries threatening the eye such as extraocular muscle entrapment were treated according to current guidelines and not included in this study.
After clinical examination and evaluation of the CT scans, patients who were assessed not to benefit from surgical intervention according to current guidelines at the Karolinska University Hospital were asked to participate in the study. The guideline at Karolinska University hospital for BOF is surgical treatment if a herniation > 1.5 mL due to risk for late enophthalmus and the decision is taken by a consultant.
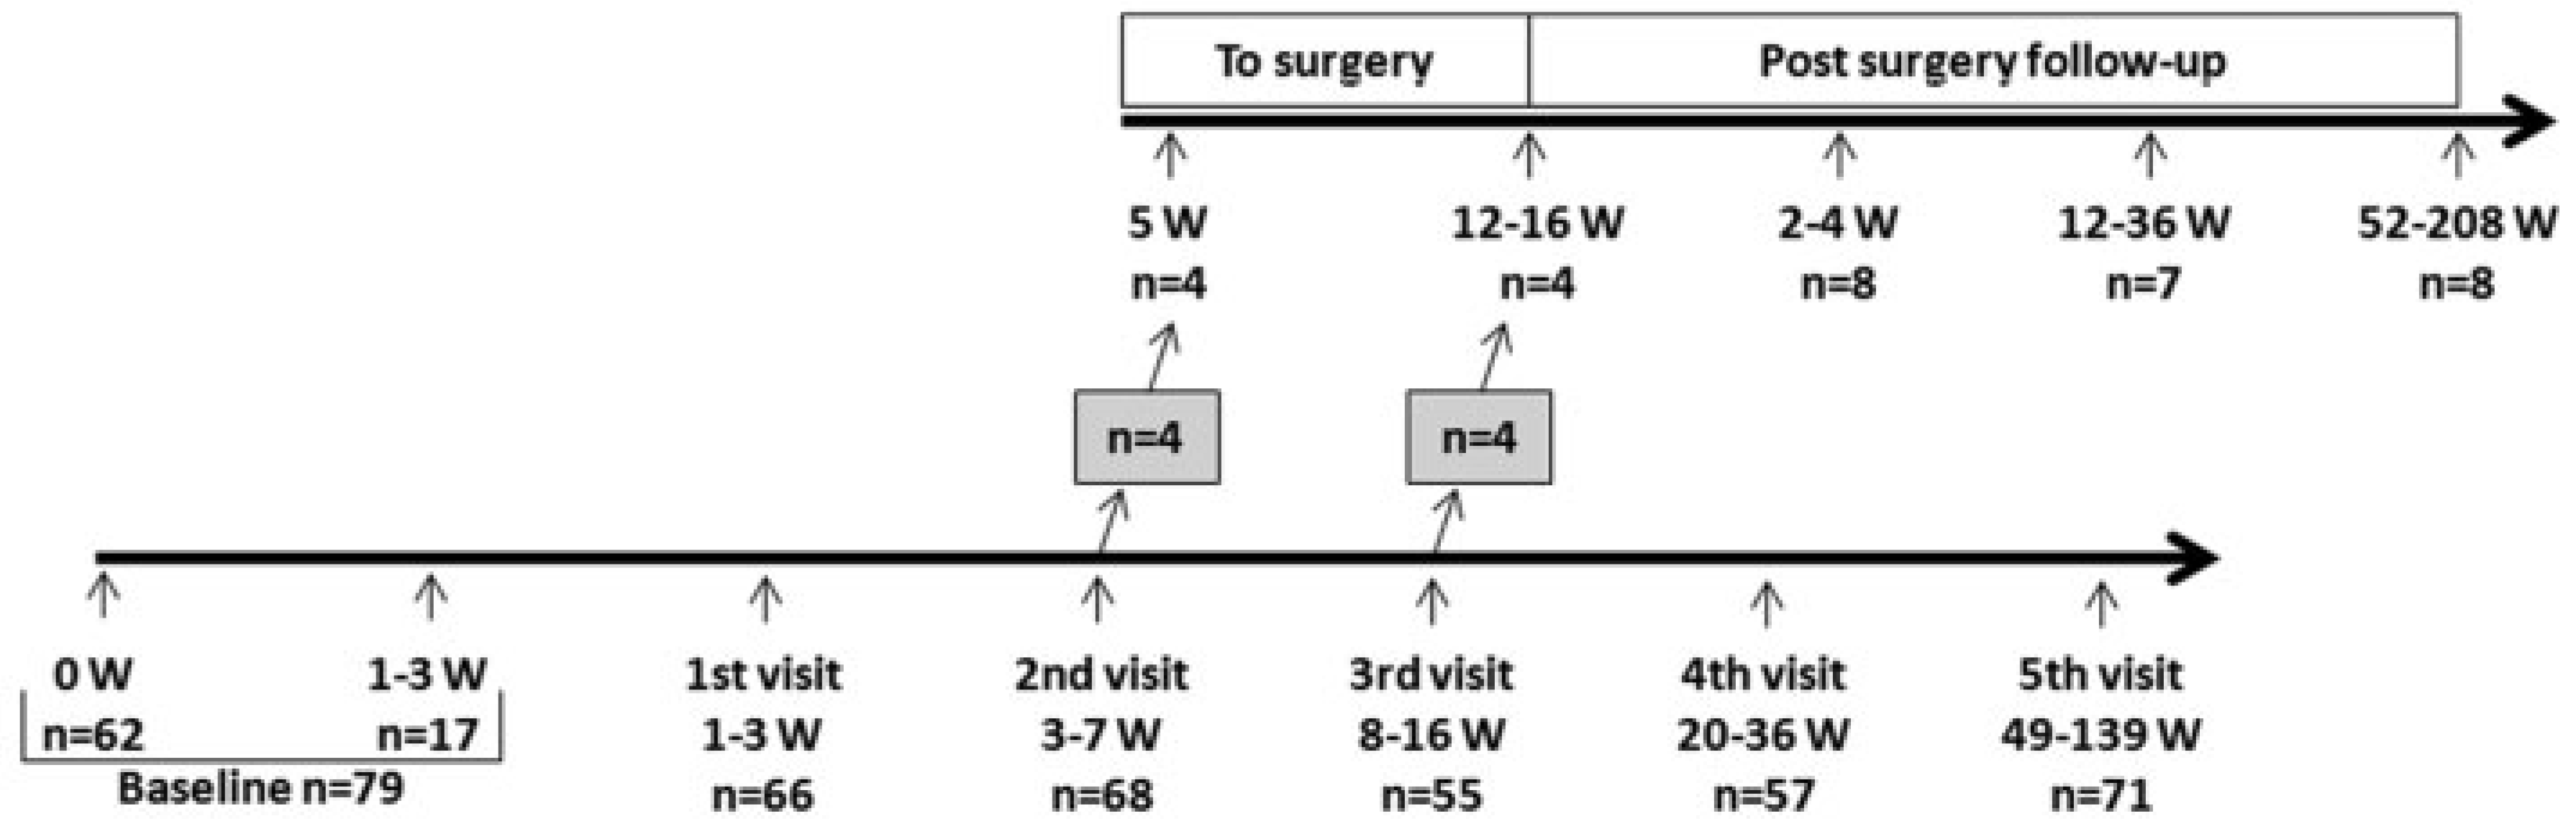
A total of 101 patients were included. Twenty-two of these patients did not complete the study. Seventy-nine patients were followed up for a minimum of 1 year with up to six clinical examinations (weeks 0, 2, 4, 12, 24, and 52 or more postinjury). The median time from injury to inclusion was 3 days (0–21), due to which most patients were referred from the emergency department. If a patient, during follow-up, developed symptoms in need of surgical correction—that is, persisting diplopia or visible deformity such as hypoglobus, superior sulcus deformity, or enophthalmus—surgery was offered. If surgery was performed, patients were followed up for at least 1 year after surgery (see
Figure 1).
At each visit, patients completed a self-report questionnaire and a clinical examination was performed by a physician for functional symptoms such as ocular motility, hypoesthesia of the infraorbital nerve, diplopia, as well as cosmetic deformities such as enophthalmus, hypoglobus, and superior sulcus deformity. Patients were asked if they felt satisfied with the treatment they received at each visit. The patients’ questionnaire and the physicians’ protocol were study specific and have not been validated.
Patients were categorized into three fracture types depending on which orbital walls were fractured:
Inferior wall fracture (fracture medial to the infraorbital nerve and lateral to the inferomedial buttress).
Inferomedial wall fracture (fracture in both inferior and medial walls).
Medial wall fracture (fracture medial to the inferomedial buttress).
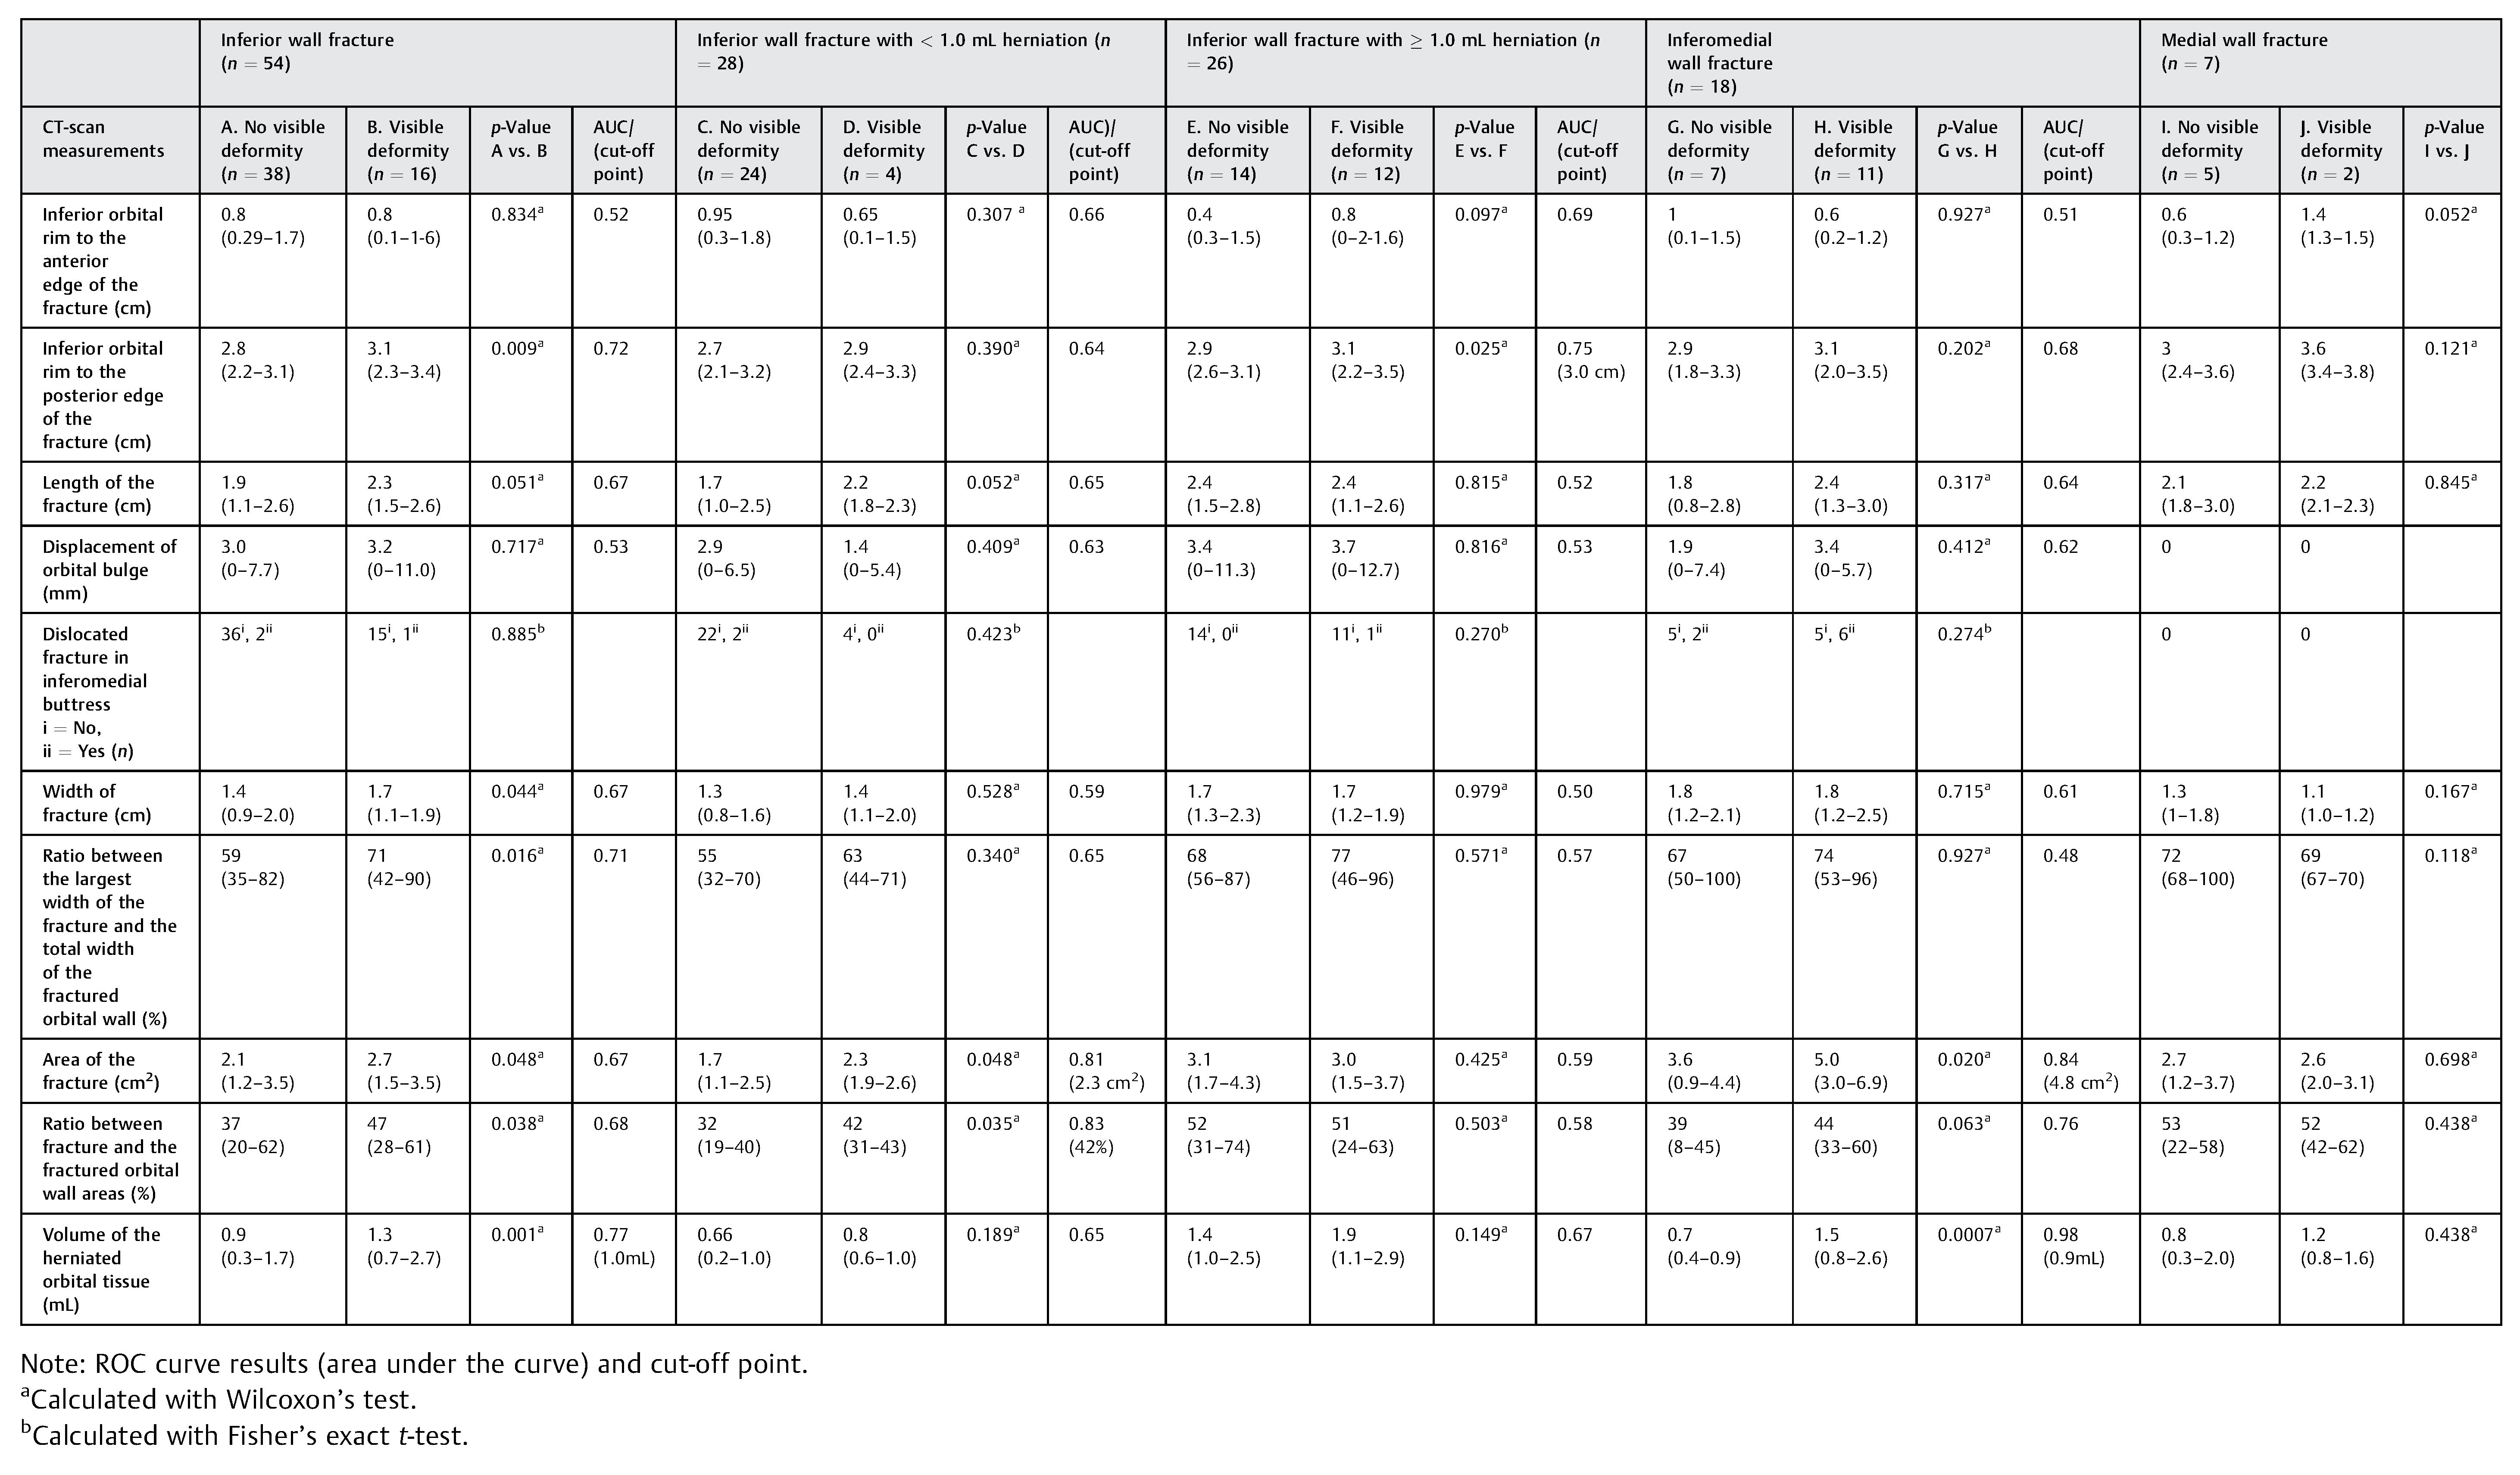
CT scan measurements (below) of patients with visible deformity were compared with patients with no visible deformity within each group and a receiver operating characteristics (ROC) curve were used to determine the cut-off level for visible deformity in each fracture type (see
Table 1).
The CTscans were performedwith ≤ 2-mm slices, except in four patients with 3-mm slices, who were referred from another hospital. All CT scans of patients who completed the study were analyzed for several measurements (see
Table 1). They were transferred to a workstation (GE Healthcare Advantage Workstation version 4), where the images were evaluated in axial, coronal, and sagittal planes in an osseous windowlevel setting according to a previous study.[
15]
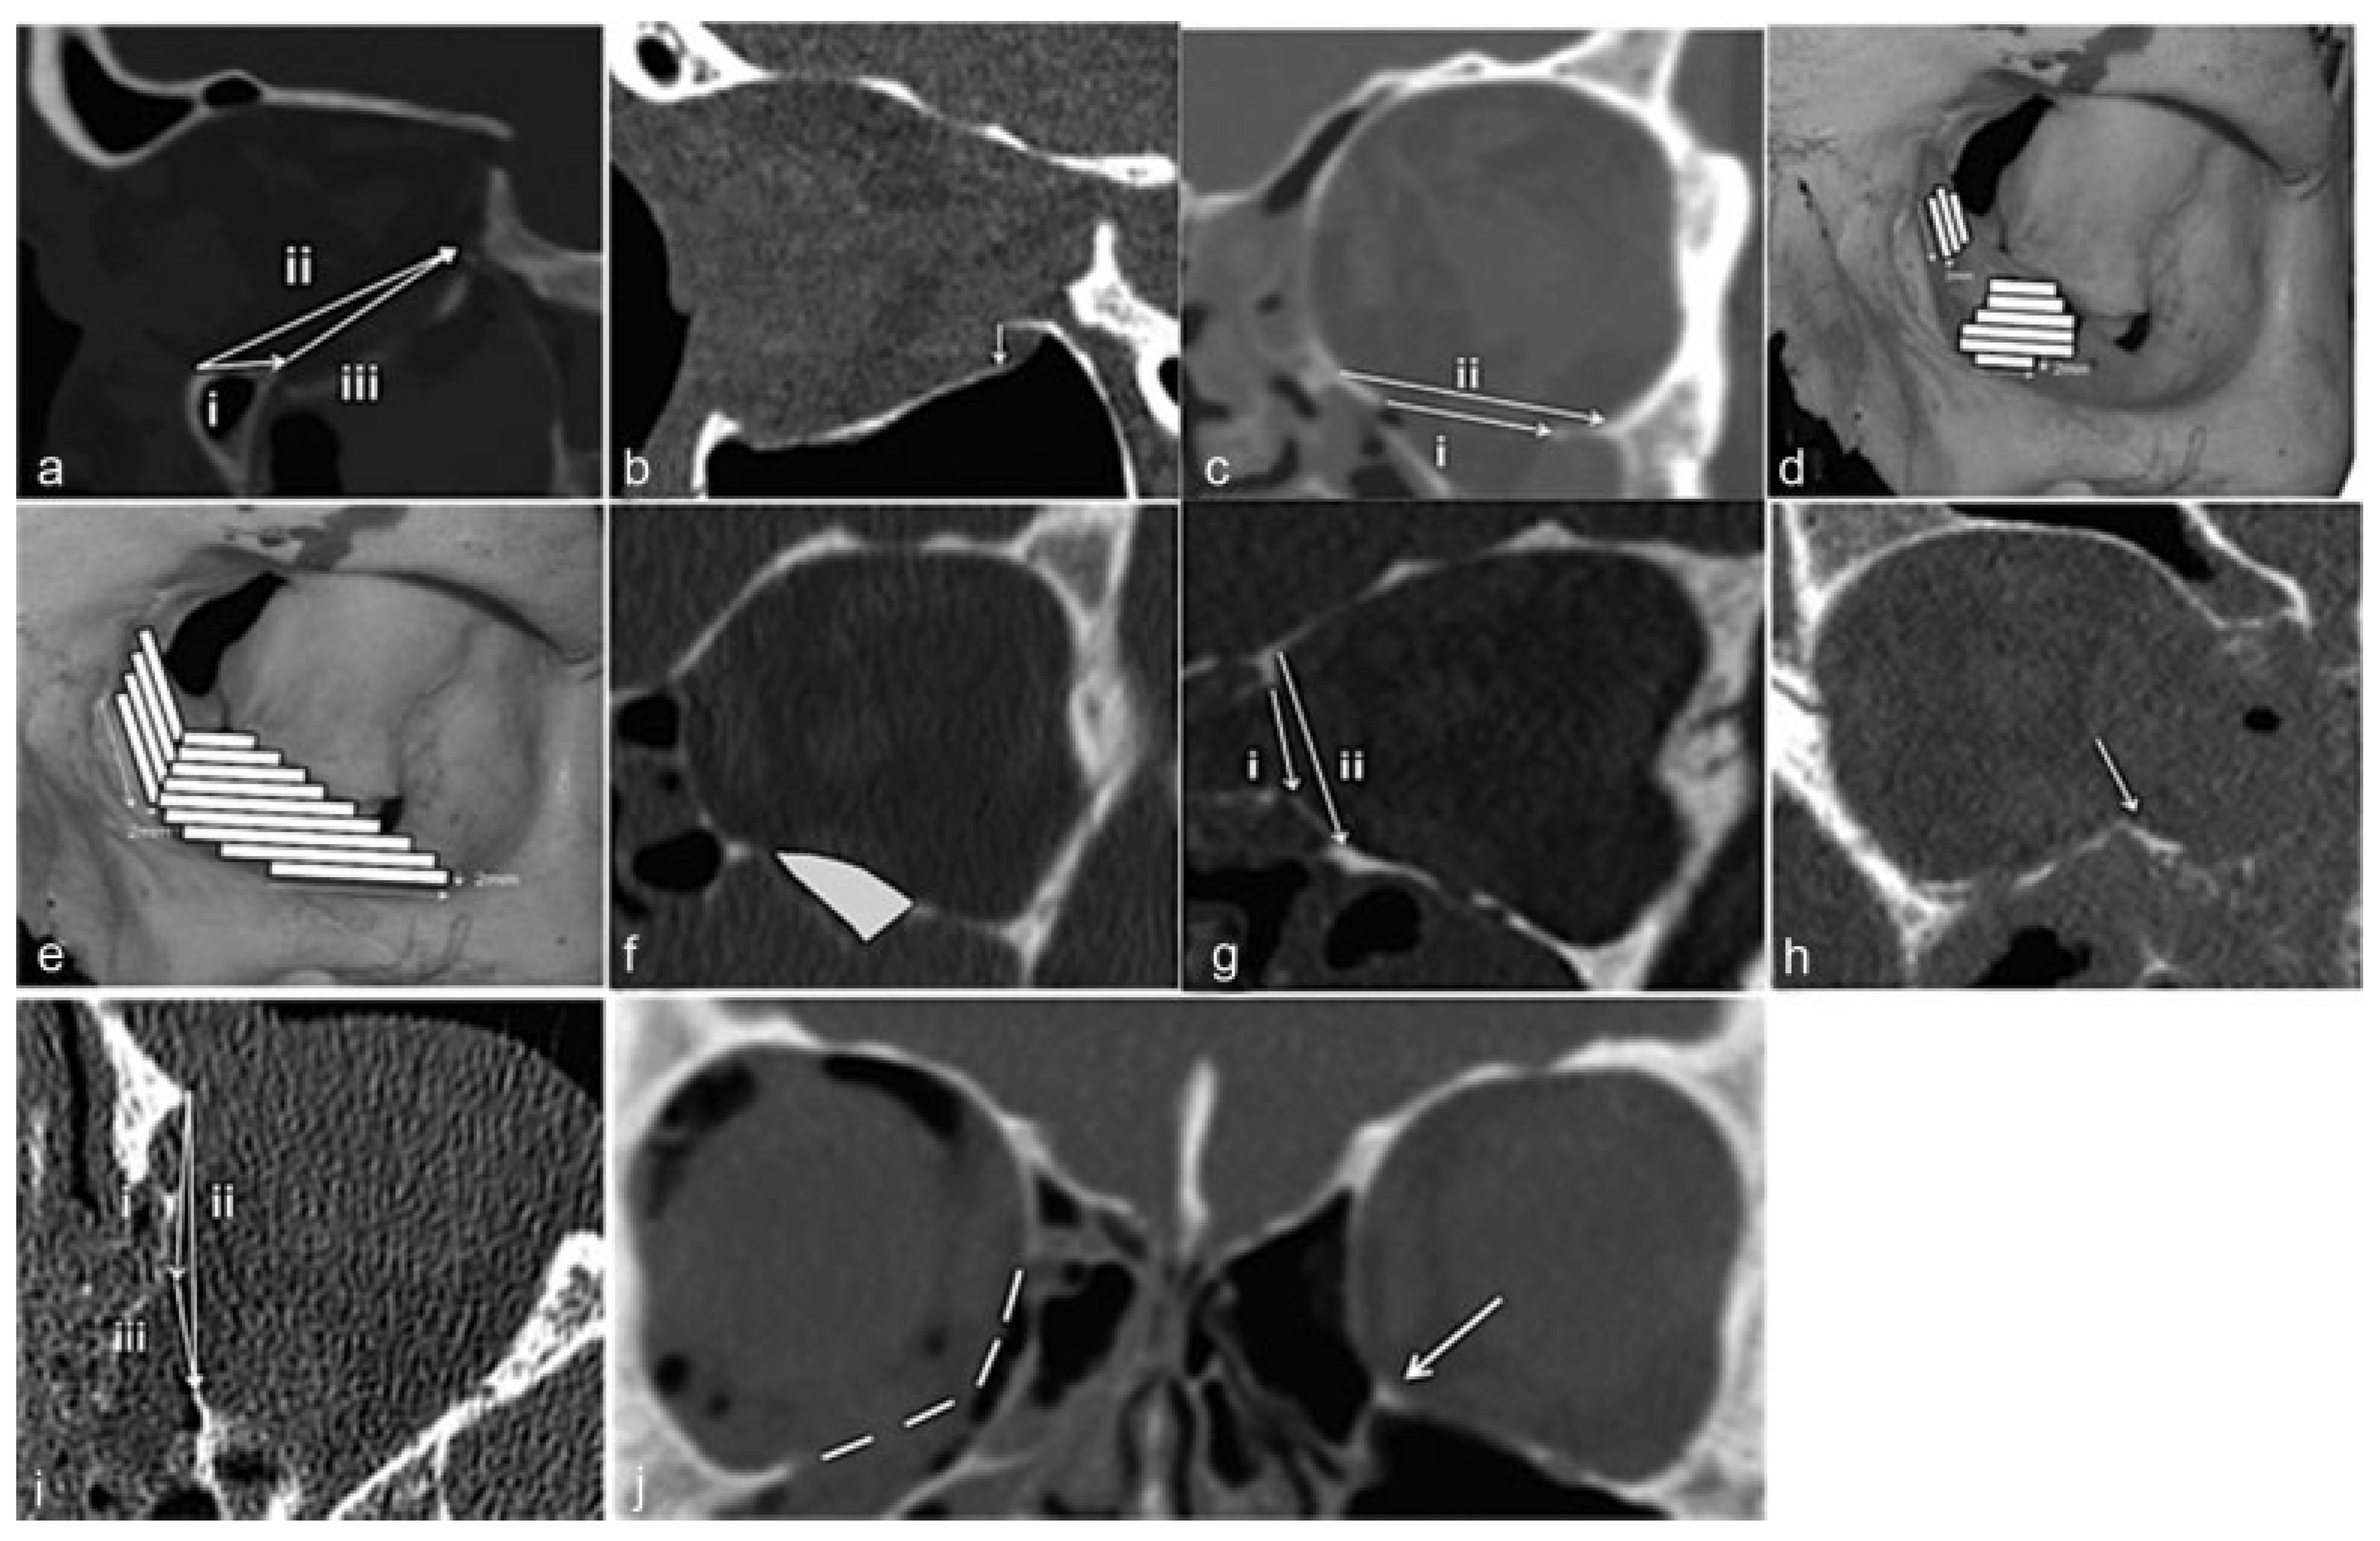
Measurements were made as per the following:
Sagittal plane where the fracture was considered largest in the inferior wall.
The distance from the inferior orbital rim to the anterior edge of the fracture (
Figure 2a, i), on the same slice.
The distance from the inferior orbital rim to the posterior edge of the fracture (
Figure 2a, ii), on the same slice.
The longest anteroposterior length of the fracture (
Figure 2a, iii).
The largest degree of displacement of orbital bulge in mm (
Figure 2b).
Coronal plane:
Area and Volume Measurements
All measurements were performed by a second person and not by the main author, using the GE Healthcare Advantage Workstation version 4 (GE Healthcare, Milwaukee, WI).
Area
We performed a quantitative computational method for calculating the area of the fractures and the walls.[
16,
17] Stacks of 2-mm slices were made in the coronal plane. The width of the inferior or medial orbital wall in each 2-mm-slice was measured. This resulted in trapezoidal strips with a known area (see
Figure 2e). The areas of the strips were multiplied to calculate the entire area of the wall. In the four cases where CT scan was performed with 3-mm slices, the same procedure was followed, but instead made with 3-mm stacks. The area measured was based on the following landmarks: the medial border of the floor by the inferomedial buttress (
Figure 2j), the lateral border of the floor anteriorly at the point of the highest angle of the zygomatic bone and posteriorly by themedialedge of the inferior orbital fissure. The anterior border of the orbital floor was defined as the first slice that showed a measurable distance of the maxillary sinus. In the medial wall, the starting point was the posterior lacrimal ridge and ending at the anterior sphenoidal wall. The craniocaudal distance was measured between the inferomedial buttress and the ethmoidofrontal suture. Where the inferomedial buttress was displaced the measurement was estimated after comparison with the unfractured contralateral orbit (
Figure 2j).
Volume
The CT scans used were axial raw thin slices in a soft-tissue window setting (HU 600/1,000) to distinguish blood from orbital fat and muscle tissue. The superior or lateral border (in medial fractures) was estimated. The contralateral orbit was used as a reference. Starting with the coronal plane, the first slice that showed the fracture was chosen. The following steps were taken: “VR tools”; “Segment”; and “Quick paint” with brush size of 2 mm. The herniated content was marked green in one slice and then scrolled two to three steps posteriorly to mark the content again. This was repeated until all the content was marked in this plane. Then the same procedure was performed in the sagittal plane to fill in the gaps between the coronal slices. In the medial fractures, the coronal and axial planes were used instead. The marked area was applied and the “Display tools” were used. The “Threshold” was set between —300 and 200 to exclude bone and air. To measure volume, the “Globe” function was used.
Statistical Analyses
All variables are expressed as median (10th and 90th percentiles) or percentage, as appropriate. Statistical significance was set at the level of p < 0.05. Comparisons between two groups were assessed with the nonparametric Wilcoxon’s test for continuous variables and Fischer’s exact test or chi-square test for nominal variables. Differences between three or more groups were analyzed with Kruskal–Wallis test followed by Dunn’s test. Receiver operating characteristics (ROC)-derived area under the curve (AUC) values was used as cut-offs for statistical analyses followed by multinomial logistic regression analysis. All statistical analyses were performed using statistical software SAS version 9.4 (SAS Campus Drive, Cary, NC).
Results
Clinical Characteristics
Seventy-nine patients completed the study. None of the patients had ocular motility limitation at any time. Ten percent (n = 8) of the patients choose to be treated surgically due to the development of a visible deformity (enophthalmus ≥ 2 mm and/or superior sulcus deformity and/or hypoglobus). The surgical procedure included elevation of the herniated orbital tissue and insertion of a titanium reinforced porous polyethylene sheets, covering the entire defect.
The decision for surgery was taken when the deformity was notified: at the visit 3 to 7 weeks postinjury in four patients and at 8 to 16 weeks postinjury in the remaining four patients, see
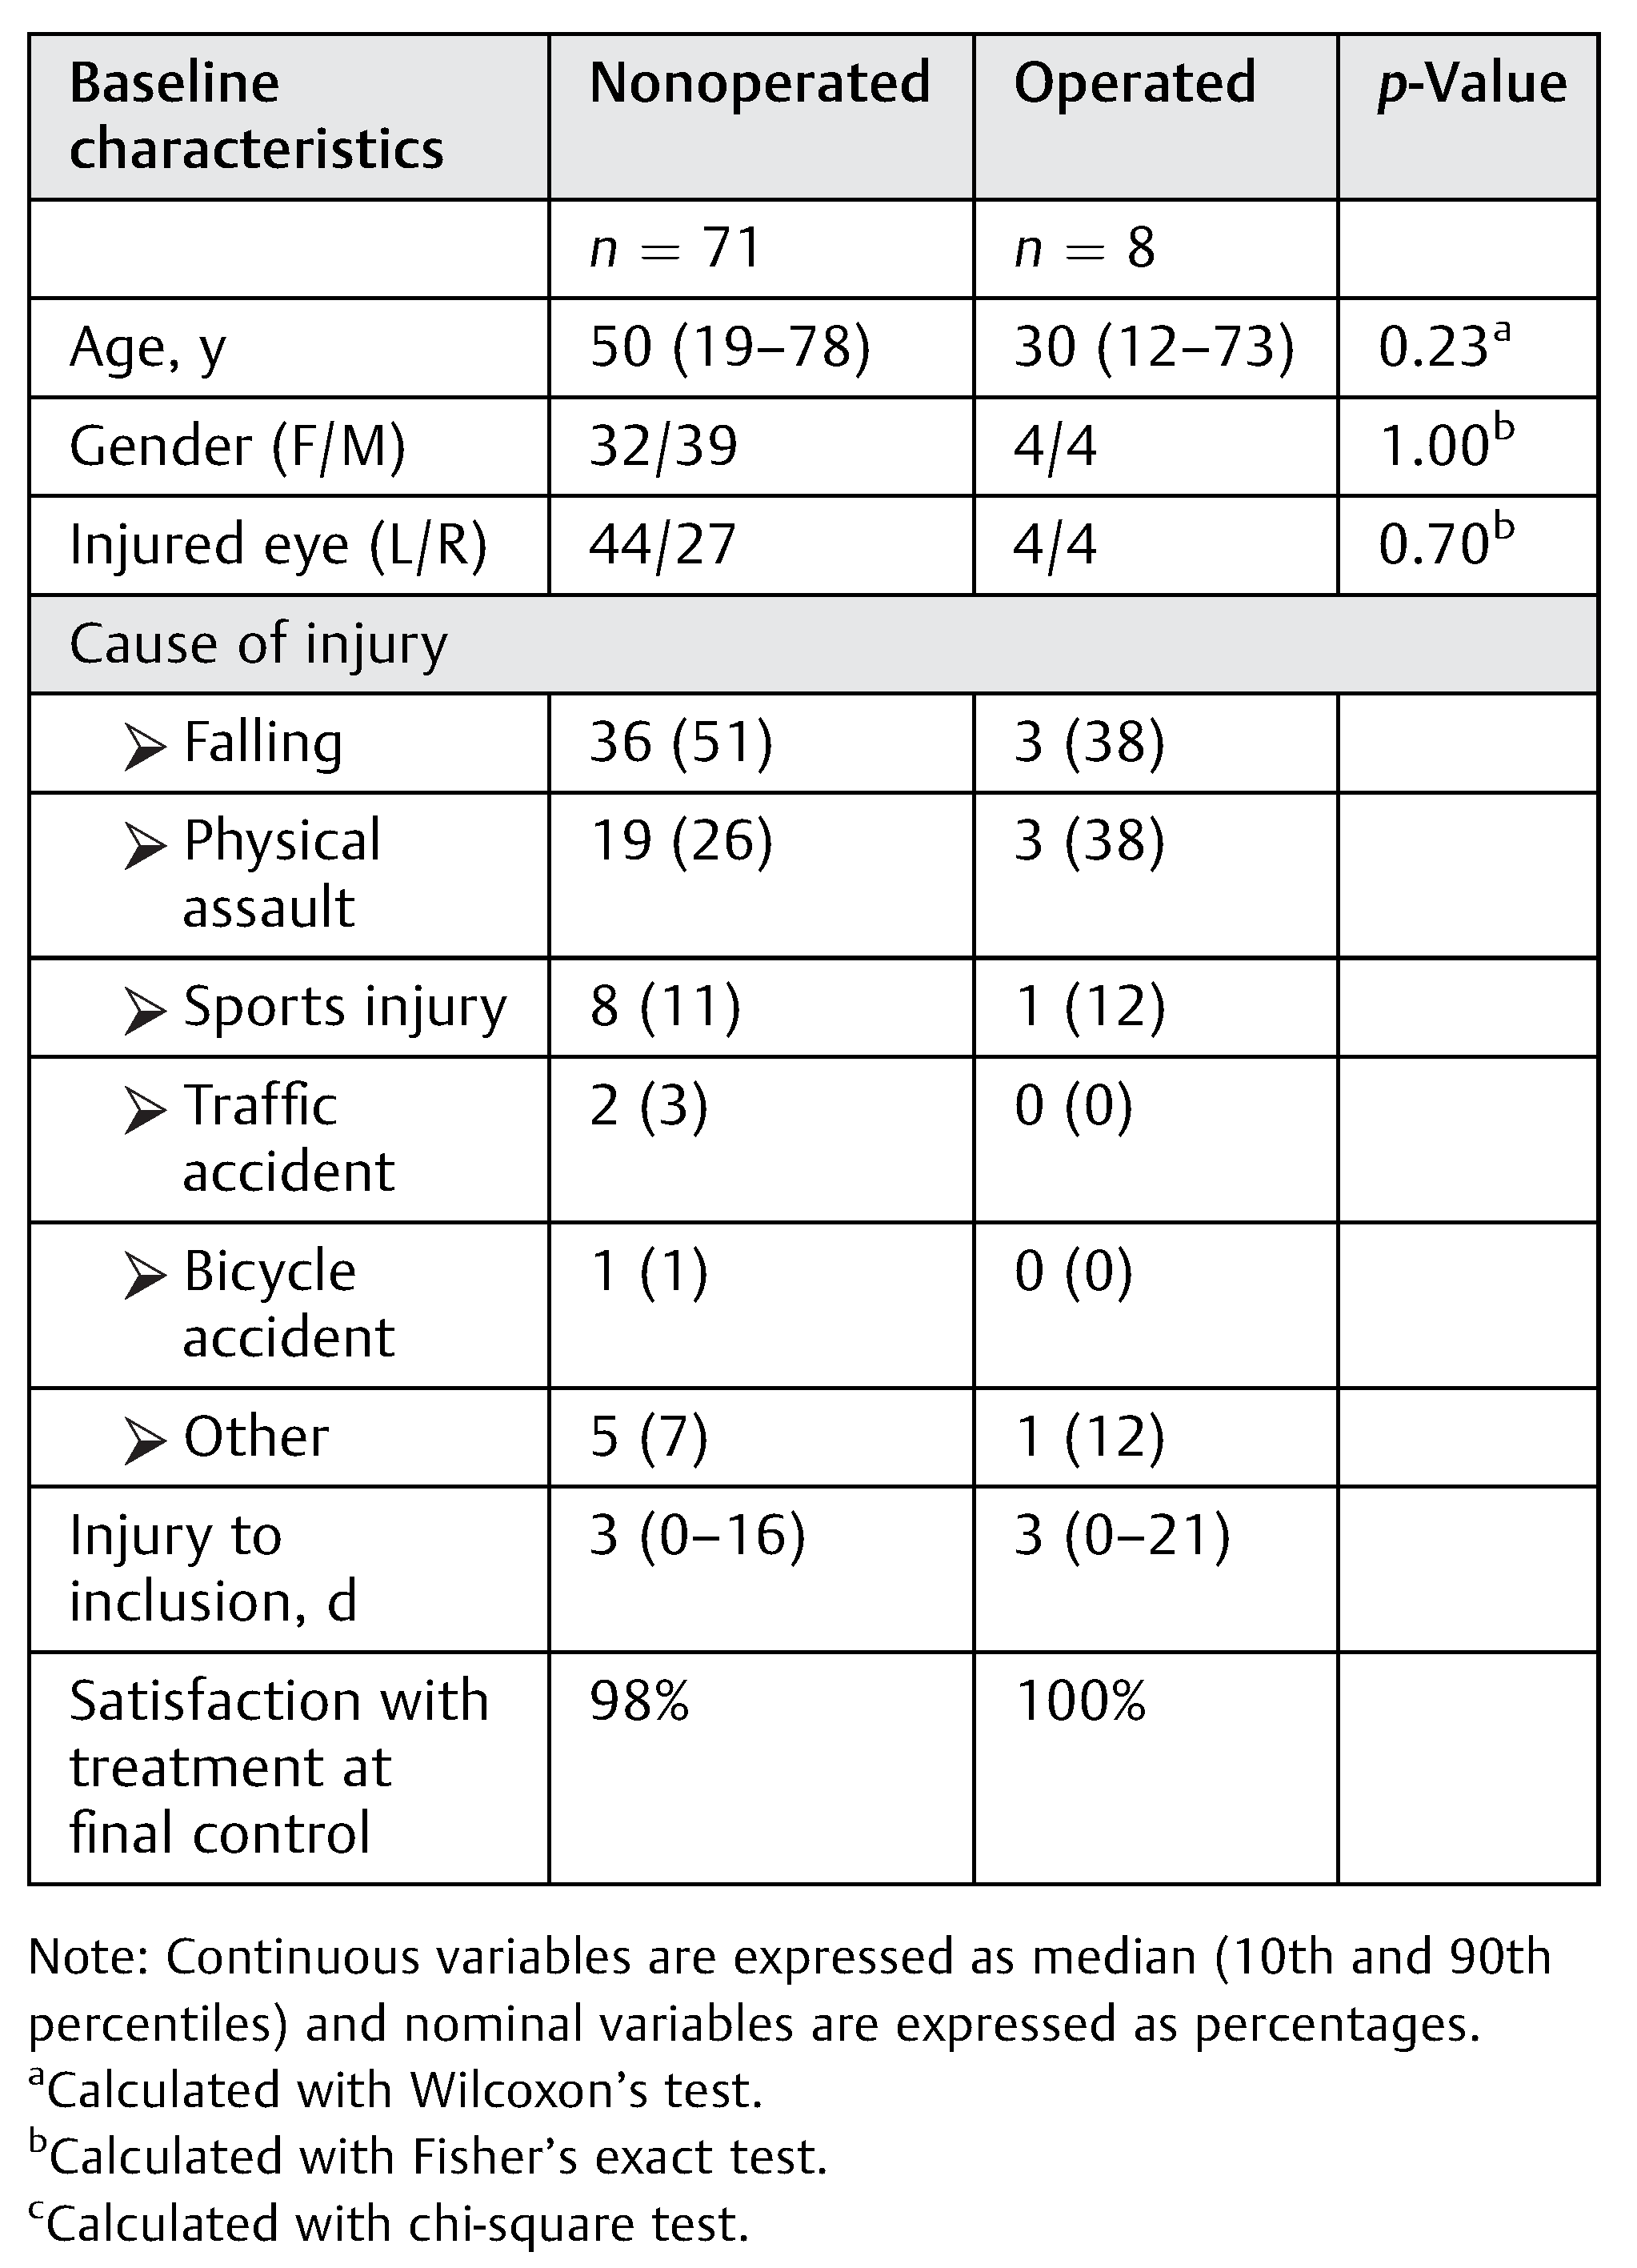
Figure 1. The baseline clinical characteristics are shown for patients who were operated on versus nonoperated (see
Table 2). There was no significant difference between the patients in the nonoperated and the operated groups in baseline characteristics including gender, injured side, age, cause of injury, and time to inclusion. However, the median age of the patients with BOF was 50 years (19–78) in the nonoperated group and 30 years (12–73) in the operated group, but there was no significant difference (
p = 0.23). The most common cause of injury was falling followed by physical assault. Ninety-eight percent (
n = 71) of the nonoperated and 100% (
n = 8) of the operated patients were satisfied at the final control with the treatment that they received.
Hypoesthesia
Nonoperated Group
We found that there was a significant improvement in hypoesthesia from baseline according to both the physicians’ findings (p = 0.001) and the patients’ self-reports (p = 0.002). In the physicians’ findings, 51% (n = 36) of the patients had hypoesthesia at inclusion and 18% (n = 13) still had hypoesthesia at final control. Forty-nine percent (n = 35) of the patients noted hypoesthesia themselves at inclusion and 23% (n = 16) had hypoesthesia at final control.
Operated Group
Fifty percent (n = 4) of patients experienced hypoesthesia according to the physicians’ findings at inclusion and at final control there was no improvement. According to the patients’ self-reports, 63% (n = 5) experienced hypoesthesia at inclusion while 50% (n = 4) experienced hypoesthesia at the final control (weeks: 52–208). There was no statistical significant improvement within the group at the final control compared with baseline, according to the physicians’ findings as well as the patients’ self-reports.
Diplopia
Nonoperated Group
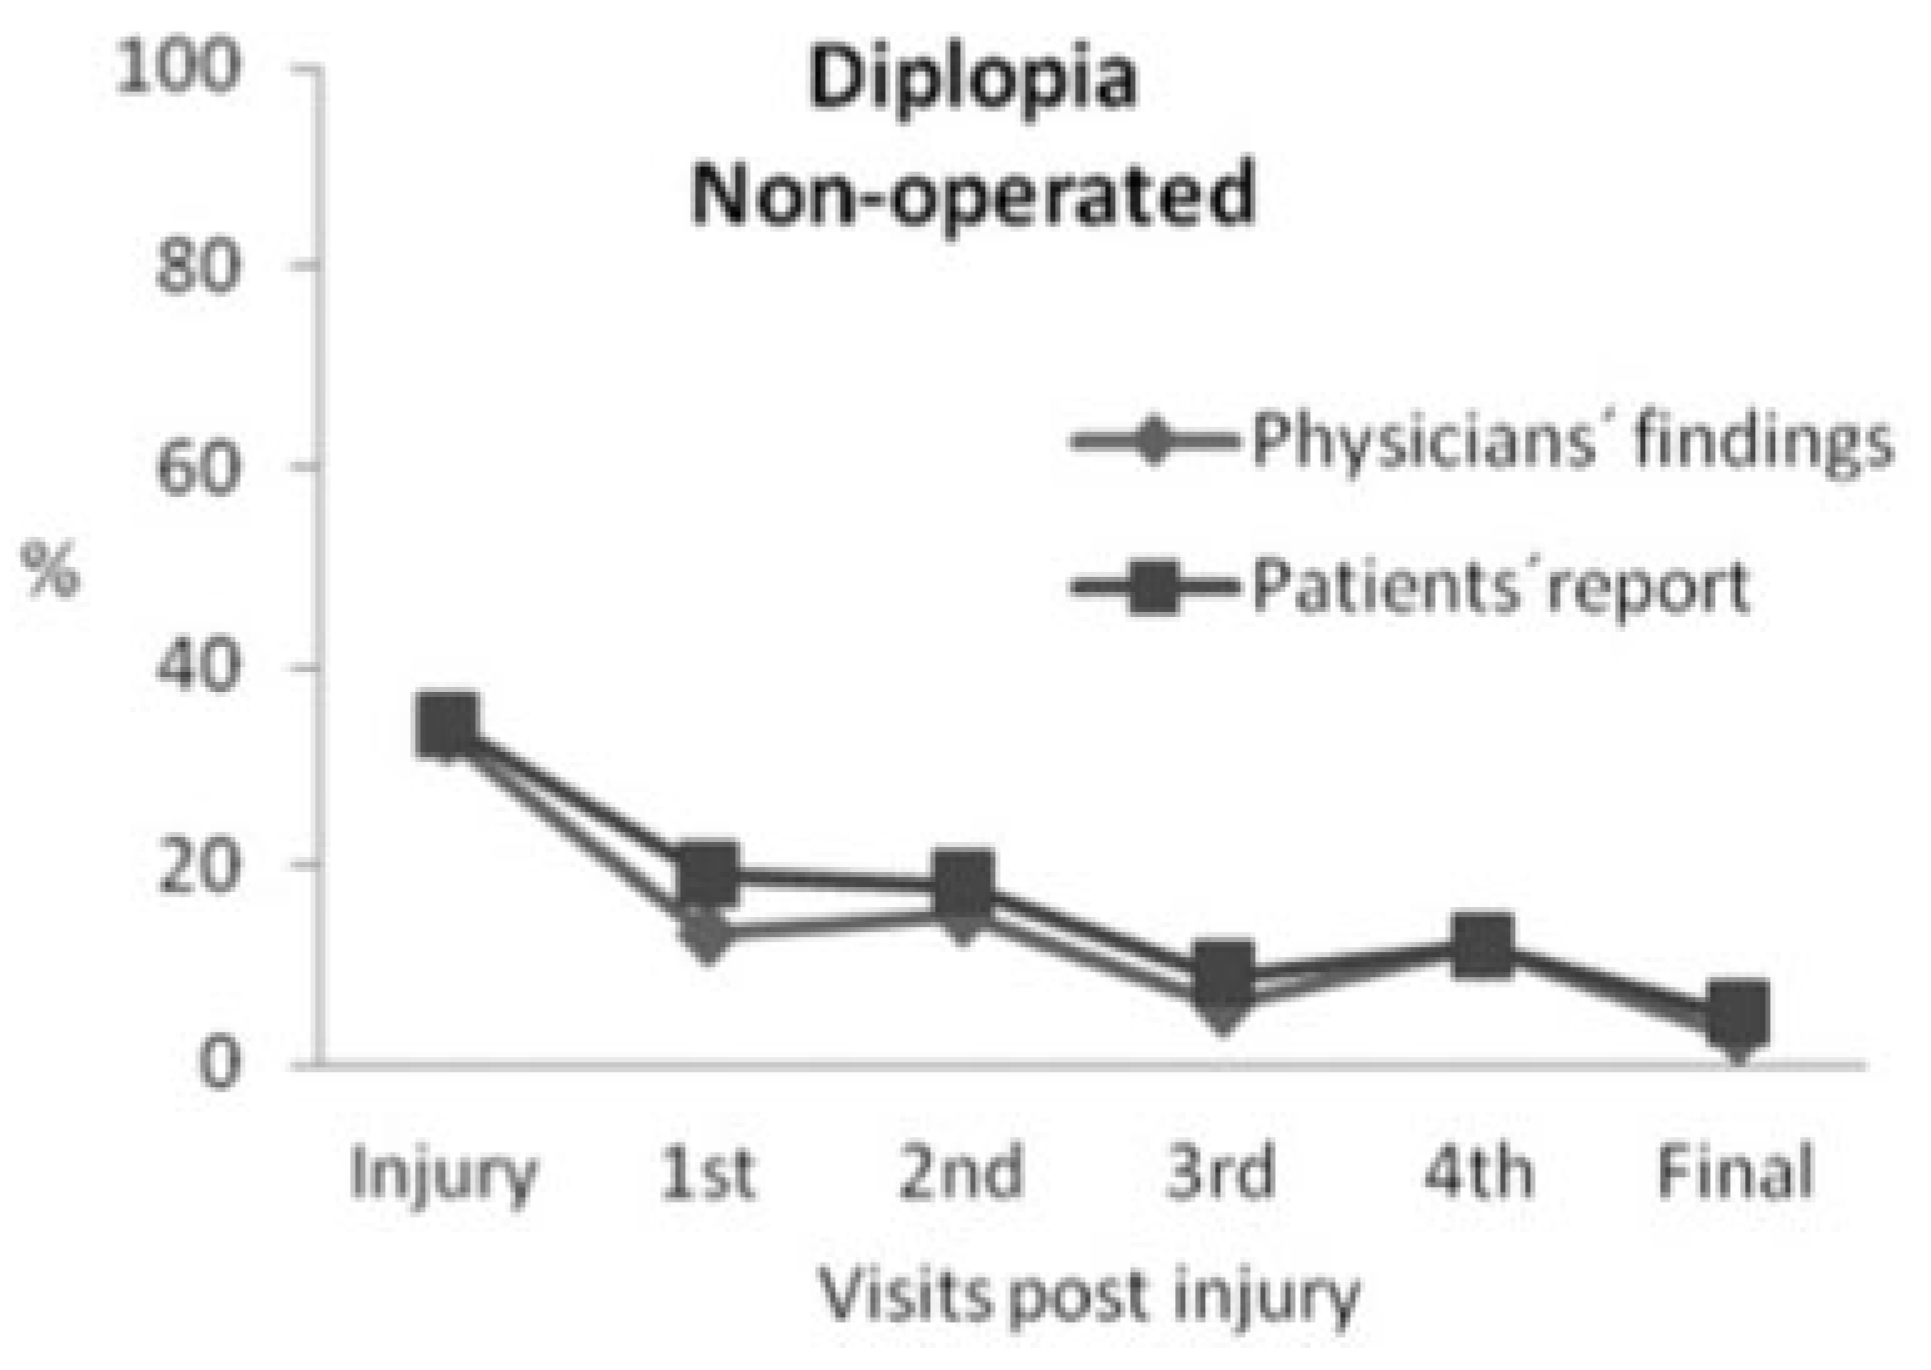
There was a significant improvement, according to the physicians’ findings (
p = 0.0001) as well as the patients’ self-reports (
p = 0.0002), in the number of patients experiencing diplopia at inclusion compared with final control. According to the physicians’ findings, 33% (
n = 23) of the patients experienced diplopia at inclusion, but only 3% (
n = 2) had diplopia at final control. One patient had diplopia in up gaze (41-year-old, inferomedial fracture with 0.5 mL herniation) and the other patient in down gaze (35-year-old, inferior fracture with 0.9 mL herniation and 1.2 cm
2 fracture area) and none of them had ocular motility limitation or a visible deformity at any visit. These two patients found their diplopia not disturbing to the degree that they wanted to proceed to surgery (
Figure 3).
According to the patients’ self-report, 34% (
n = 24) experienced diplopia at inclusion and this remained in 7% (
n = 5) at final control. Patients experienced diplopia in slightly higher frequency than the physicians’ findings. As demonstrated in
Figure 3, the number of patients with diplopia was higher at the fourth visit compared with third and fifth visits. This can be explained by several patients with diplopia at the fourth visit, did not come to the third visit. However, the number of patients with diplopia had decreased at the fifth visit, which includes all the patients in the presented visits.
Operated Group
There was no statistically significant improvement, according to the physicians’ findings (p = 0.07) as well as the patients’ self-reports (p = 0.21), in the number of patients experiencing diplopia at inclusion compared with the final control. In the physicians’ findings, 50% (n = 4) of the patients experienced diplopia at inclusion and none experienced diplopia at final control. In the patients’ self-report, 38% (n = 3) of the patients experienced diplopia at inclusion, while 13% (n = 1) of the patients experienced diplopia at the final control.
Enophthalmus
Twelve patients with 2 mm enophthalmus and six patients with ≥ 3 mm enophthalmus developed visible superior sulcus deformity and/or hypoglobus. Four patients in each group chose to undergo surgical correction. Seven patients with 2 mm enophthalmus did not develop visible deformity.
Nonoperated Group
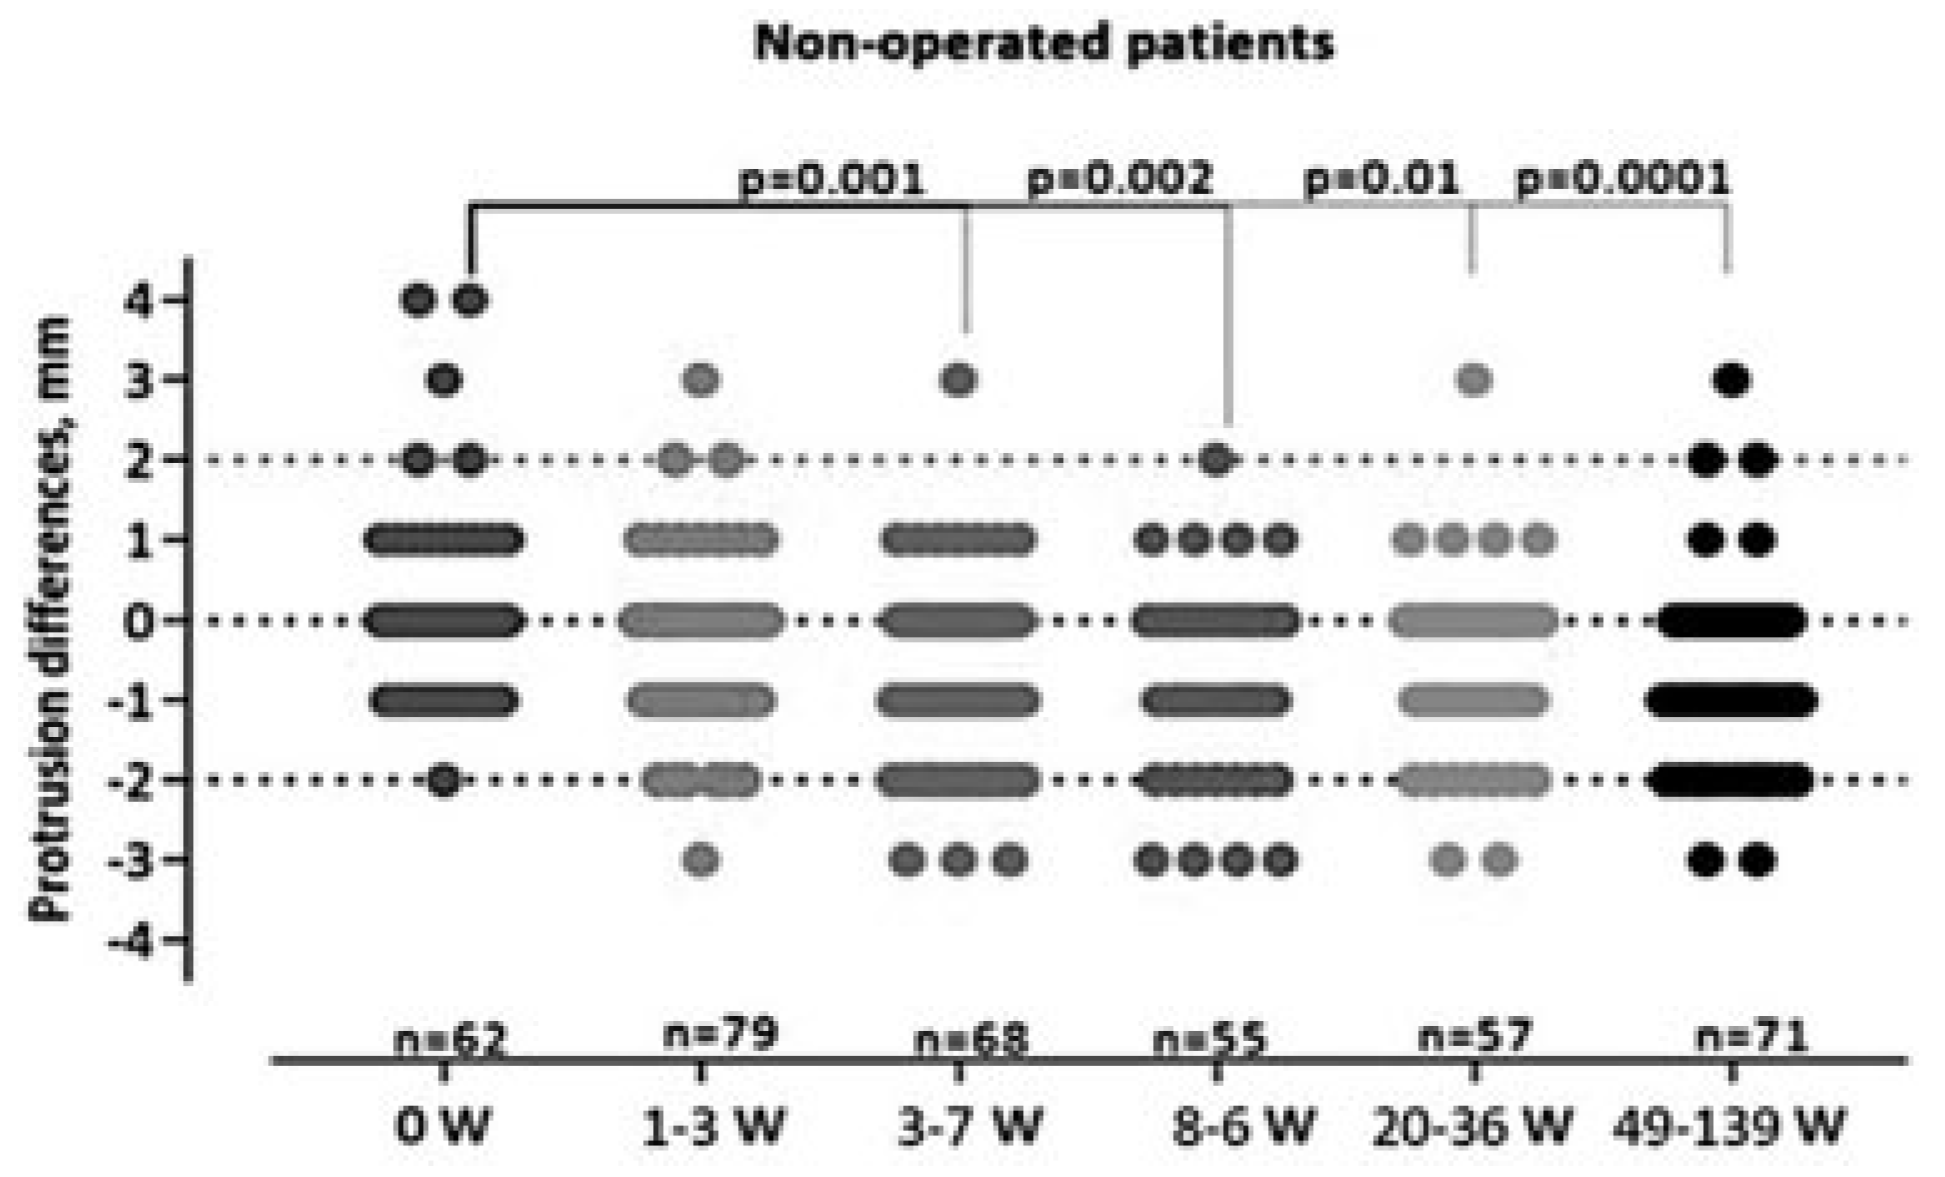
We found a statistically significant (
p < 0.001) difference in the position of the eye on exophthalmometry during the study period (
Figure 4). At the initial examination, the patients presented with exophthalmus or enophthalmus of the injured eye resulting in a median of 0 mm (range: +4 to – 2). The degree of enophthalmus increased during the study period and the patients were left with a median of 1 mm (range: +3 to –3) enophthalmus at the final control.
Operated Group
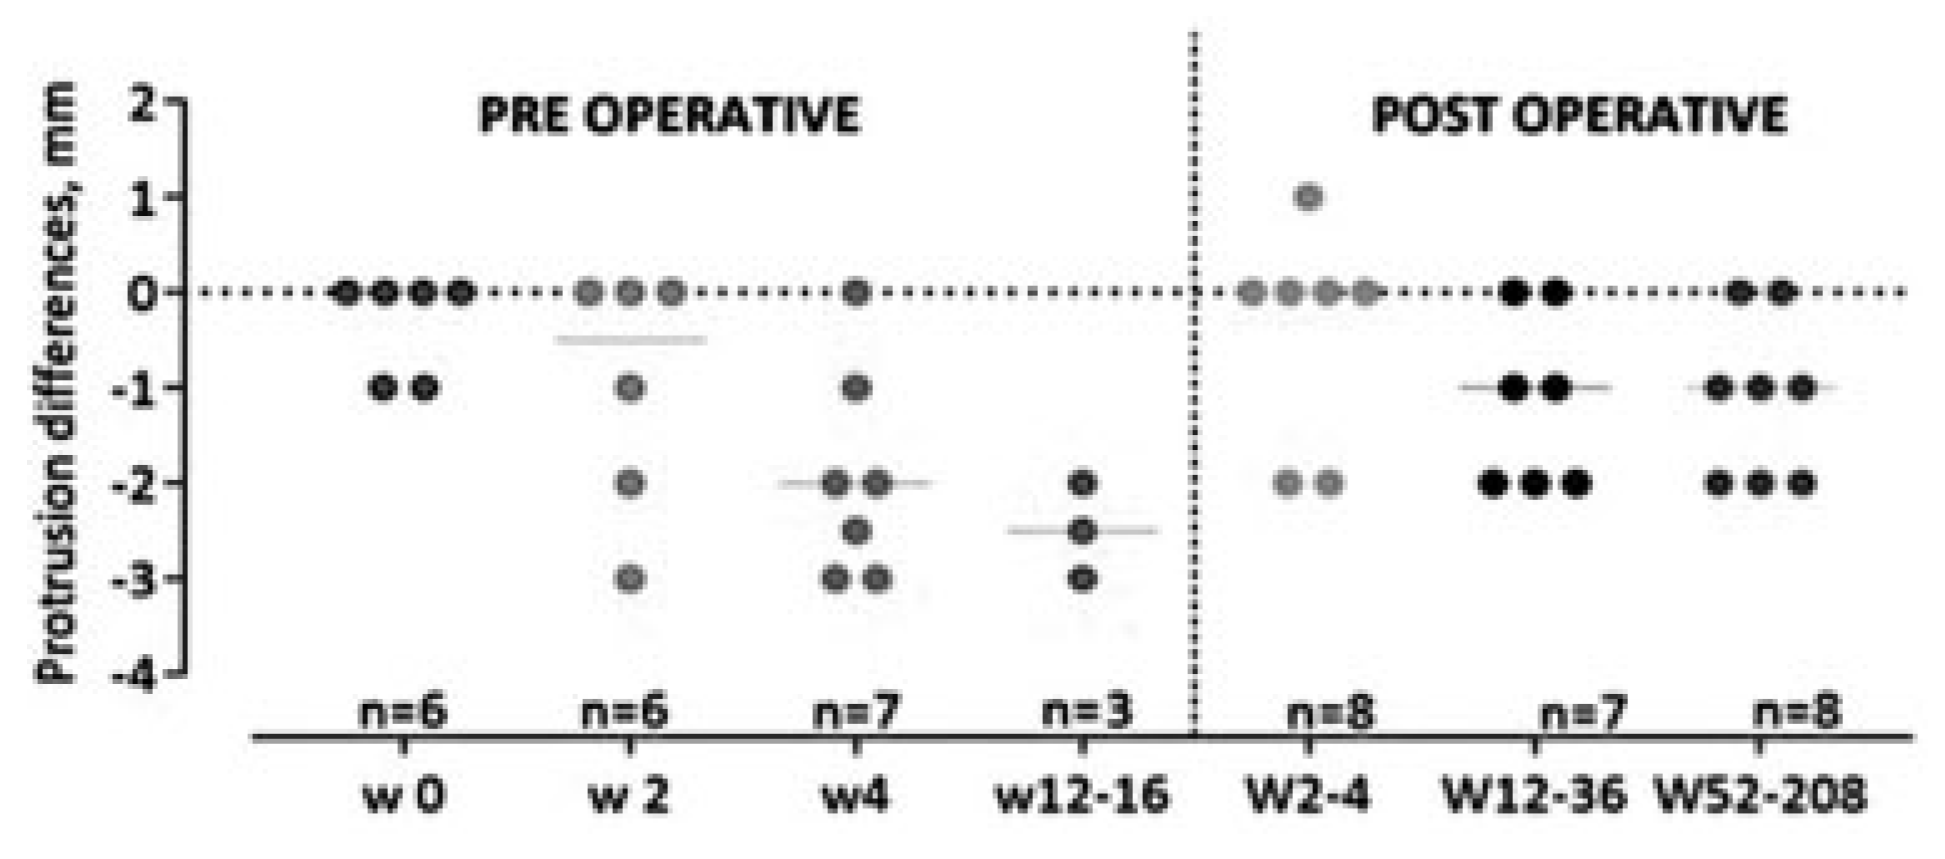
Ten percent (
n = 8) of the patients received an operation due to a visible deformity with enophthalmus ≥ 2 mm and/or superior sulcus deformity and/or hypoglobus. The median time from the date of injury to surgery was 71 days (31– 112). The median degree of enophthalmus among these eight operated patients was preoperatively 2.6 mm and postoperatively at final control 1.0 mm (
Figure 5), the same as for the patients who were not operated on. However, there was no statistically significant difference in the degree of enophthalmus at inclusion compared with the final control neither regarding physician’s findings nor patients self-report.
CT Scan Measurements
Depending on which orbital walls were fractured, patients were categorized as one of three fracture types: inferior wall, inferomedial wall, and medial wall. Sixty-eight percent (
n = 54) of the patients had inferior wall fracture, 23% (
n = 18) had inferomedial wall fracture, and 9% (
n = 7) had a medial wall fracture. The results from CT-scan measurements were analyzed and compared between the patients with visible and no visible deformity within each fracture type (see
Table 1).
Inferior Wall Fracture
There were significant differences when comparing patients with visible and no visible deformity in the distance from the inferior orbital rim to the posterior edge of the fracture (
p = 0.009), width of the fracture (
p = 0.04), ratio between the largest width of the fracture and the total width of the fractured orbital wall (
p = 0.01), the total area of the fracture (
p = 0.048), the ratio between fracture and the fractured orbital wall areas (
p = 0.038), and the volume of the herniated orbital tissue (
p = 0.001). We used an ROC curve to determine the cutoff level for visible deformity in patients with inferior wall fracture. ROC curve results are presented in
Table 1. The highest ROC curve was for volume of herniated orbital tissue and the AUC was 0.77, giving a cut-off level at 1.0 mL. We subdivided the patients into two groups, those with < 1 mL herniation and those with ≥ 1 mL herniation. The CTscan measurements were analyzed and compared within each group.
Inferior Wall Fracture with <1.0 mL Herniation
There were significant differences when comparing patients with visible (
n = 4) and no visible deformities (
n = 24) in the total area of the fracture (
p = 0.048) and the ratio between fracture and the fractured orbital wall areas (
p = 0.035). An ROC curve for all the measurements predicting the visible deformity (
n = 4) was performed (see
Table 1). We found that AUC was 0.83 for the ratio between fracture and the fractured orbital wall areas giving a cut-off level at 42%. We also found that the AUC was 0.81 for the total area of the fracture giving a cut-off level at 2.3 cm
2.
In patients with inferior wall fracture and a herniation < 1.0 mL, a visible deformity was found when the ratio between the fracture and the fractured orbital wall areas was ≥ 42%, or the total area of the fracture was ≥ 2.3 cm2.
Inferior Wall Fracture with ≥ 1.0 mL Herniation
There was a significant difference when comparing patients with visible (
n = 12) and no visible (
n = 14) deformities in the distance from the inferior orbital rim to the posterior edge of the fracture (
p = 0.025). An ROC curve for the distance predicting the visible deformity (
n = 12) was performed. We found that the AUC was 0.75 and the fracture distance from the inferior orbital rim to the posterior edge of the fracture had a cut-off level at 3.0 cm (see
Table 1).
In patients with inferior wall fracture and a herniation ≥ 1.0 mL, a visible deformity was found when the fracture distance from the inferior orbital rim to the posterior edge of the fracture was ≥ 3.0 cm.
Nonoperated Group
Visible deformity was found by the physicians in 30% (n = 21) of the patients, but only 13% (n = 9) of the patients reported visible deformity at the final control.
Operated Group
All the operated patients (n = 8) had a preoperatively visible deformity according to both the physicians’ and the patients’ reports. Postoperatively at final control, physicians and patients reported visible deformity in four cases. But there were congruent opinions only in two cases between the physicians’ and patients’ reports.
Discussion
This was, to our knowledge, the first prospective study of nonsurgically treated BOF with 1-year follow-up. In this study, we found certain CT scan characteristics with statistically significant cut-off points, for inferior and inferomedial wall fractures, which can be used in the management of BOFs when predicting the potential risk for late cosmetic deformities. Furthermore, we found that diplopia, not due to muscle entrapment, are benign and to a large extent will resolve within 1 year. However, hypoesthesia of the infraorbital nerve is likely to remain.
We found that in inferior orbital wall fractures, when predicting risk for late deformity, the first cut-off point was 1.0 mL herniation. In patients with inferior orbital wall fractures and < 1.0 mL herniation, the next cut-off point was found to be if the ratio between fracture and orbital wall areas was ≥ 42%, or a fracture area of ≥ 2.3 cm2. The ratio between fracture and orbital wall areas was found to be more accurate (AUC = 0.83), but this calculation is time consuming and challenging in daily clinical application. The area of the fracture, although slightly less accurate (AUC = 0.81)” would be more practical in clinical use.
In patients with herniation ≥ 1.0 mL, the distance from the inferior orbital rim to the posterior edge of the fracture with an AUC 0.83 was found to be the next cut-off point. Visible deformity was found when this distance was ≥ 3.0 cm.
In inferomedial wall fractures, we found that ≥ 0.9 mL of herniation would predict late visible deformity. The area under the AUC was 0.98 for this level (0.9 mL), making it highly sensitive and specific.
We found significant differences in the other CT scan measurements such as the width of the fracture, the ratio between thelargest width of thefracture and thetotalwidth of the fractured orbital wall when comparing patients with and without visible deformity. However, we found that they had a low AUC rate making them less accurate predictors or usable cut-off points when predicting late visible deformity. Furthermore, we did not find any statistically significant difference in the distance from the inferior orbital rim to the anterior border of the fracture, length of the fracture, displacement of orbital bulge, or dislocated fracture in medial buttress when comparing patients with or without visible deformity.
Earlier studies have considered a herniation <1.0 mL to be a low risk for late cosmetic deformity.[
9,
18] In this material, 14% (
n = 4) of patients with inferior wall and 22% (
n = 4) of patients with inferomedial wall fractures with <1.0 mL herniation developed visible deformity. Furthermore, 46% (
n = 12) of patients with inferior wall and 39% (
n = 7) of patients with inferomedial wall fractures with ≥ 1.0 mL herniation developed visible deformity. However, 21% (
n = 15) of patients with a herniation of > 1.0 mL did not develop a visible deformity.
In medial wall fractures, we did not find any statistically significant difference in any CT scan measurements to predict late visible deformity. We believe that this was due to the low number of patients in this group (n = 7).
According to the physicians’ findings, diplopia improved in all patients except two. Patients generally reported diplopia in a slightly higher extent than that of the physicians. Persistent diplopia with no ocular motility limitation has been suggested as a surgical indication in BOF.[
4] A persisting diplopia may also be due to nerve injury,[
19] which may not be addressed with a surgical intervention. In this study, we found that diplopia to a large extent resolves over time. This indicates that diplopia in BOF, without ocular motility limitation, may be due to edema. We do not agree that the severity of diplopia increases with number of fractured orbital walls or with the extent of enophthalmus and that it would advocate surgical intervention within 2 weeks.[
20,
21] Our recommendation is nonsurgical treatment as long as the diplopia improves.
Although hypoesthesia of the infraorbital nerve improved significantly at the final control, 23% of the nonoperated patients still experienced loss of sensation. However, in the operated group, 50% of the patients had hypoesthesia at the final control postoperatively, which indicates that surgery may increase the risk of developing hypoesthesia. It has been reported that hypoesthesia of the infraorbital nerve may continue to improve even after 1 year following injury/surgery.[
22] Earlier studies of facial fractures withinfraorbitalnerve damage have shown persistent hypoesthesia in 22 to 50% after surgery.[
23] Although other authors have hypothesized that hypoesthesia may be an indication for repair of BOF,[
2] we found that hypoesthesia of the infraorbital nerve significantly improved over time and that surgery may increase the risk for persisting hypoesthesia. Therefore, our recommendation is that hypoesthesia is not an indication for surgery. Studies on hypoesthesiawithlong follow-up are an areaof future research.
Of the 79 patients in our study, 71 patients were not operated on. In the nonoperated group, 30% developed a visible deformity. However, 98% of these patients were satisfied and no one wanted to have surgical correction. In the operated group (n = 8), all patients choose to proceed with surgery because of late visible deformity. All these patients were also satisfied with the treatment they had received. The surgical result from a late correction, when performed immediately on detection by the patient or the surgeon at 1 or 3 months postinjury, had successful result. Due to the small size of the operated group, we recognize the difficulty in drawing conclusions from these data.
It is mentioned in the literature that the orbital bulge is the crucial anatomical structure in forward projection of the eye and that even a small fracture may lead to enophthalmus[
24] and persistent diplopia.[
25] Fracture in the inferomedial buttress has also been reported to lead to orbital deformity.[
26] In this study, we did not find any statistical difference in the degree of the displacement of the orbital bulge or the dislocated fracture in the inferomedial buttress when comparing patients with late visible versus nonvisible deformity.
The statement that enophthalmus will lead to diplopia[
27] could not be supported by our data. On the contrary, none of the patients with late enophthalmus had diplopia and none of the patients with diplopia had enophthalmus.
In our earlier study, we found considerable differences in the management of the BOF,[
14] despite the published dividing lines between surgical and nonsurgical management such as > 1.5 mL volume of herniation into the maxillary sinus,[
9] an orbital floor fracture > 1.0 cm,[
2,
10] or > 50% fractured orbital floor.[
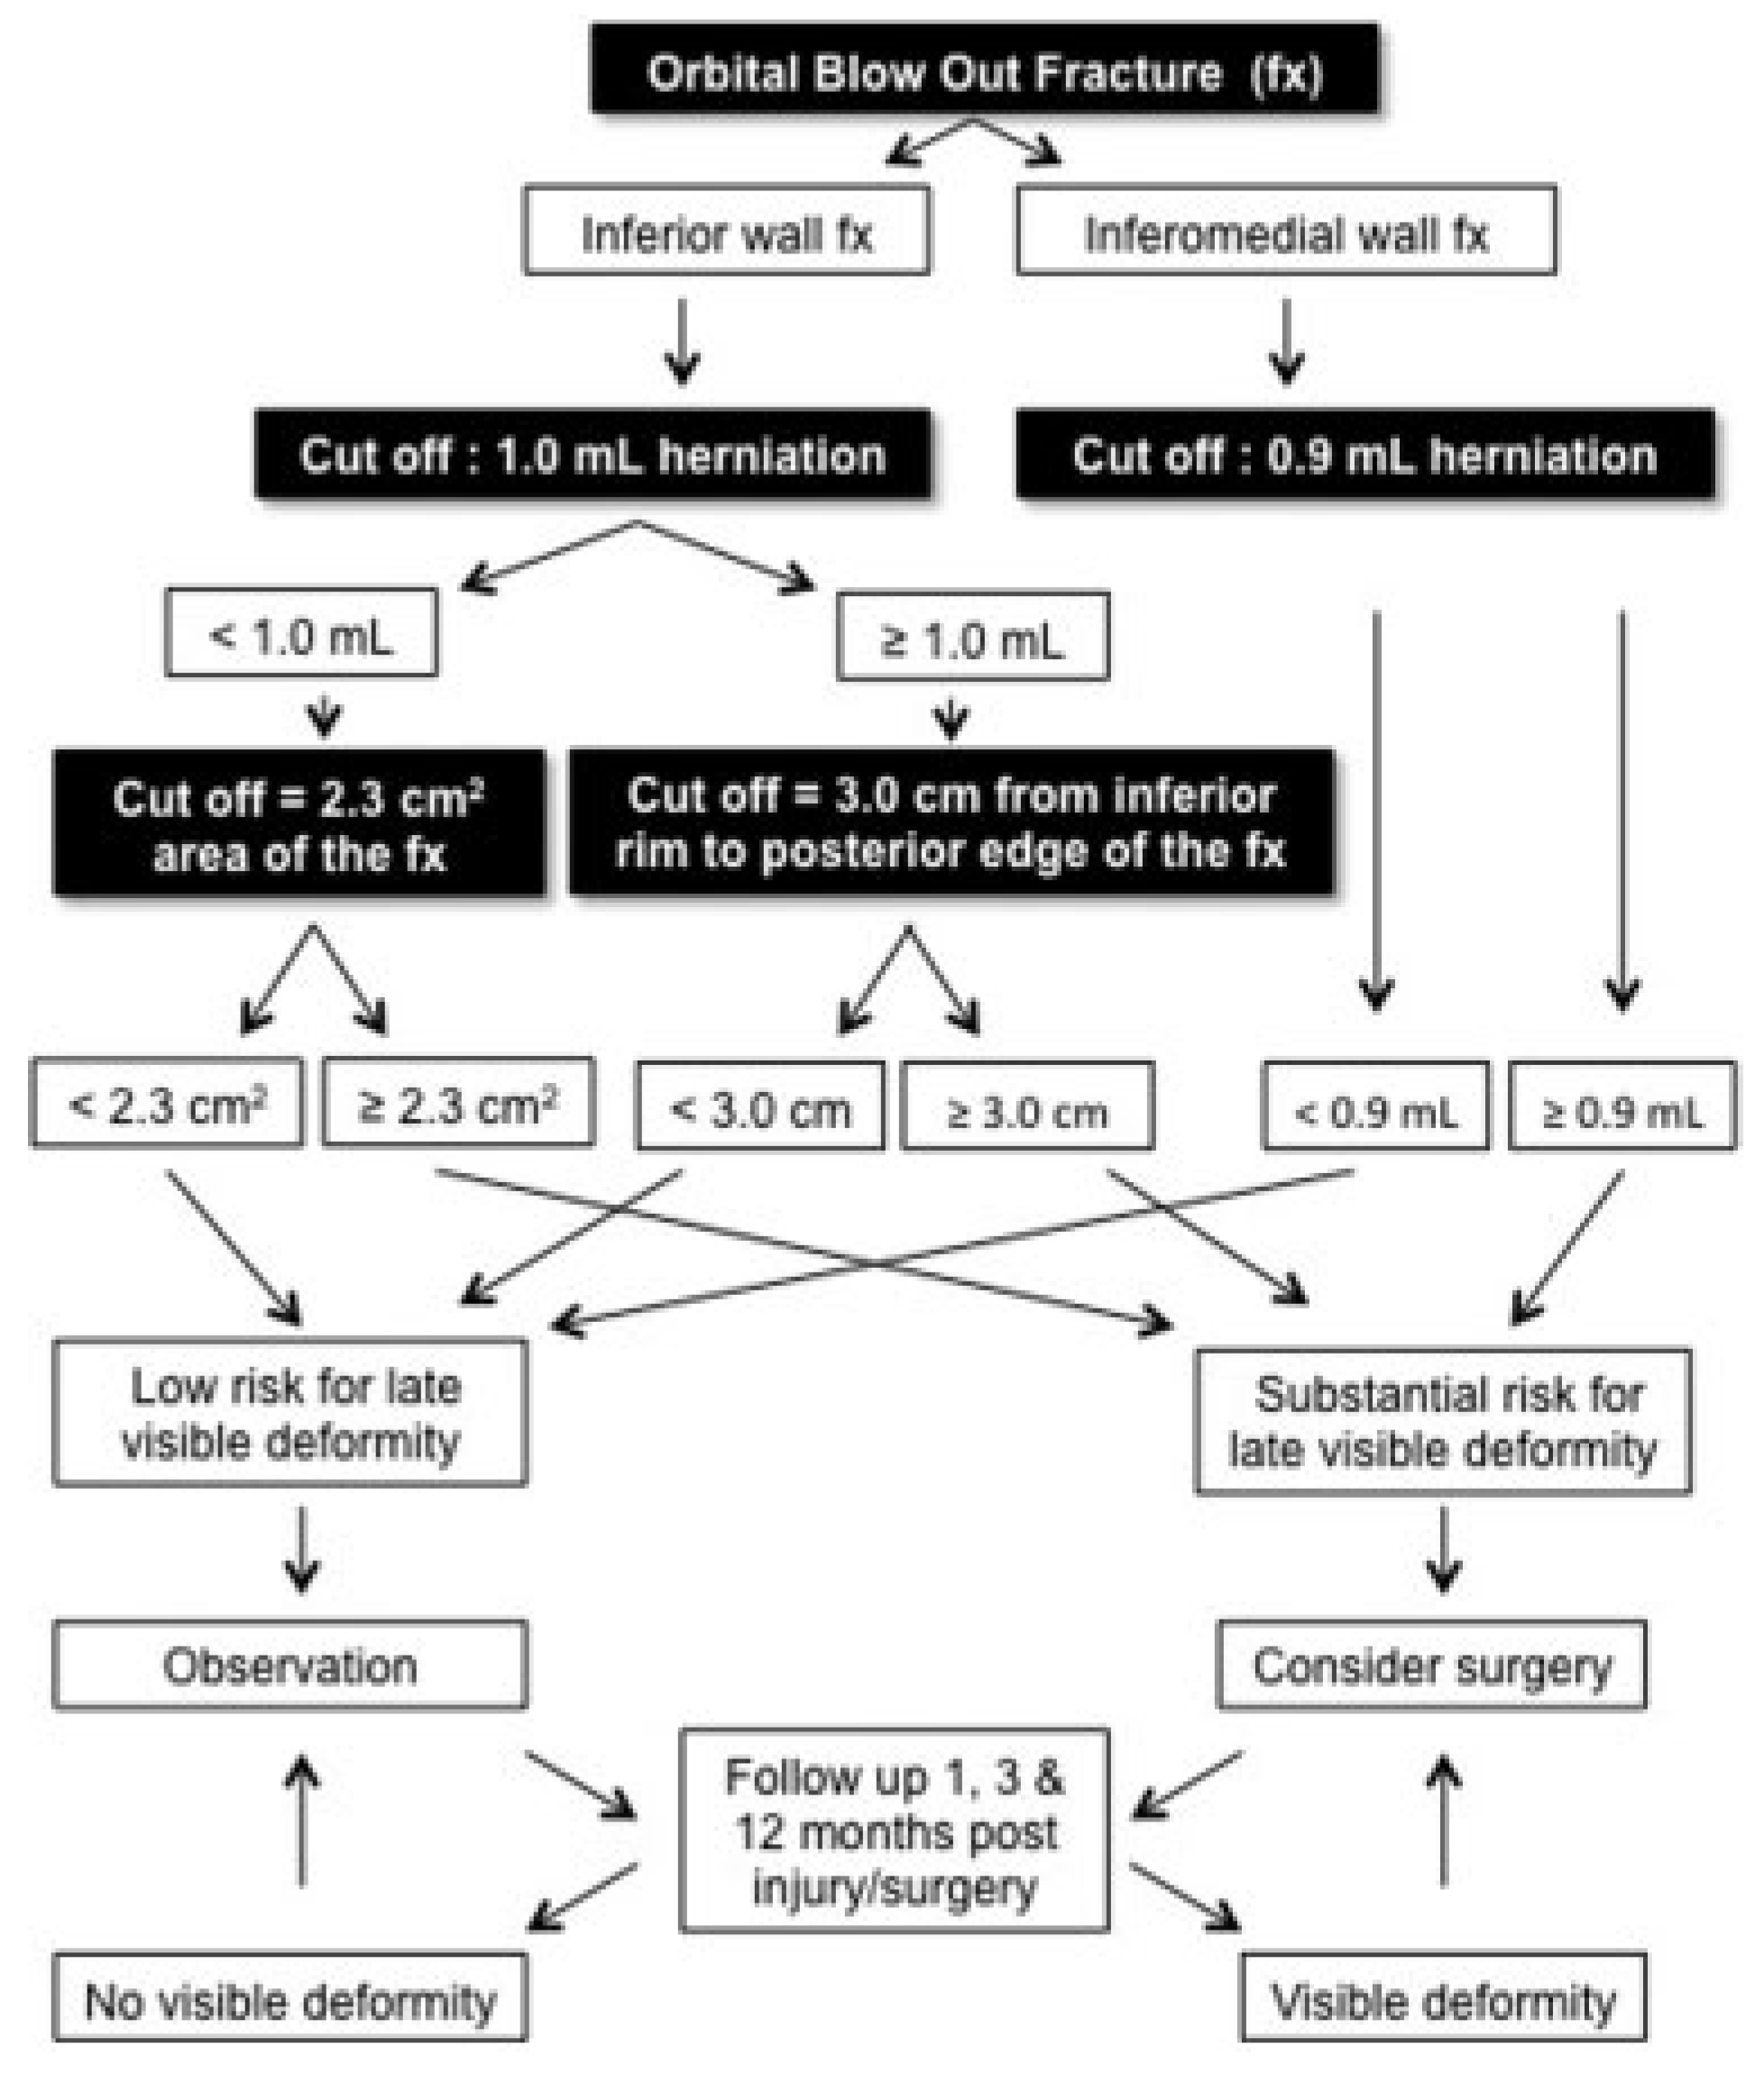
11] In the current prospective study, we suggest an algorithm (see
Figure 7) with different cut-off points predicting the risk for late visible deformity.
The presented algorithm in this study has the ability to predict development of late visible deformity (
superior sulcus deformity and/or hypoglobus and/or ≥
3 mm enophthalmus) at the very early stage in 83% of patients (see the interpretation of data in
Figure 8). In the remaining 17%, 8.5% would be over predicted (falsely predicted) and 8.5% underpredicted. If the patients would be followed up 1, 3, and 12 months postinjury/ surgery, as recommended in the algorithm, the initially underpredicted patients would be identified at follow-up and receive treatment. This increases the correctly prediction rate to 91.5%. The overpredicted (falsely predicted) patients may be operated on, although they would not develop late visible deformity. If in patients with < 1.0 mL herniation, the ratio between fracture and the fractured orbital wall areas would be applied, the accuracy of the initial correct prediction would increase from 83 to 86% and furthermore leaving only 5% of patients overpredicted using this algorithm. Further studies are needed to minimize the risk for overprediction. The presented algorithm may be used as a guide whendiscussing treatmentoptions with patient with BOF fractures with no ocular motility restriction. Furthermore, when decision making aroundsurgical treatment due to aesthetic deformities, patient’s involvement is crucial since the patient’s experience of visible deformity is individual and this may differ from the surgeons’ opinion.
Based on the data in this study, we recommend that patients with the criteria below need to be informed that they have a substantial risk for late visible deformity, which could be prevented by surgical intervention.
Inferior BOF with < 1.0 mL herniation and a ratio between fracture and orbital wall areas ≥ 42%, or a fracture area of ≥ 2.3 cm2.
Inferior BOF with ≥ 1.0 mL herniation and a ≥ 3.0 cm distance from the inferior orbital rim to the posterior edge of the fracture.
Inferomedial wall fractures with ≥ 0.9 mL of herniation.
Strengths and Limitations of this Study
One strength of this study is that, as far as we know, this is the first prospective study on BOF with 79 patients followed up for over 1 year. Additionally, all the clinical examinations and the measurements on the CT scans were performed by one observer making the results predictable between patients.
A weakness of this study is that nonvalidated instruments were used for physician’s and patient’s questionnaires. Hertel’s exophthalmometry has limitations and incorrect measurements can occur. Another limitation is that 22% of the included patients dropped out. This was expected as it is likely that patients with no symptoms chose not to complete the study. This was a single-center study with 79 participants and therefore a multicenter study that would include more patients would have great advantages.
Conclusion
In this article, the first large prospective long-term follow-up, we found that in addition to the herniated orbital volume other CT scan characteristics of BOF fractures are important predictors of late visible deformities. Using our data, we present an algorithm for the prediction of late visible deformity with 83% prediction accuracy. Diplopia in BOF, without ocular motility limitation, may be due to edema and observation is recommended as long as it improves.

