Monostotic fibrous dysplasia is a benign skeletal disorder that can affect the tibia.[
1-
5] Lichtenstein first used the term “fibrous dysplasia” in a description of four cases in 1938.[
2] Normal medullary bone is replaced with abnormal fibrous tissue containing small abnormal trabeculae. This growth or developmental disorder is not familial, is not associated with endocrine disease, and has no sex predilection.[
6] The characteristics of fibrous dysplasia evident in imaging studies obtained by computed tomography, radiography, and scintigraphy have been well described.[
1,
3-
5] On magnetic resonance imaging (MRI) studies, fibrous dysplasia has been described as demonstrating low-to-intermediate signal intensity on T1-weighted images and a variable signal intensity on T2-weighted images.[
3,
7]
The reported outcome of surgical treatment of fibrous dysplasia is variable, with a high rate of failure.[
3,
8] Surgical intervention is indicated when there is a progressive and unstable deformity, pain, or fracture nonunion, or when a small focus of fibrous tissue undergoes malignant transformation.[
1,
2] Fractures occurring in the benign fibrous tissue seldom displace. Healing generally is not delayed, and signs of nonunion are not common.[
2,
8] The conservative treatment of this disorder consists of serial radiographic evaluation to monitor its progression every 6 to 12 months, bracing, and local wound care if necessary.
Pathologic Findings
The pathology of monostotic fibrous dysplasia has been thoroughly described in the literature.[
1-
5] On gross examination, the bone cortex is either thinned or expanded, with the possibility of the thickened, hypertrophied neighboring cortex seen without the complete cortical bone penetration of the tumor.[
2] The inner bone cortex surface may be ridged in appearance. Monostotic fibrous dysplasia replaces cancellous bone while expanding the medullary cavity, where the lesion generally arises. The lesion is localized to the metaphyseal-diaphyseal border, rarely involving the epiphysis.[
1,
5,
8] It has been reported that 40% to 57% of monostotic fibrous dysplasia lesions affect long tubular bones, and the reported rate of transformation to malignancy is 0.5% in the monostotic version of the disease.[
5,
7,
9]
The microscopic findings of monostotic fibrous dysplasia demonstrate a tissue that is metabolically active. The abnormal tissue is well vascularized, with large sinusoidal vessels near the junction between the lesion and normal bone. Occasionally, small water-filled cysts may be seen.[
2] The firm and gritty benign connective tissue is composed primarily of randomly distributed elongated stellate fibroblasts that enclose abundant-to-scant islands of random, immature woven bone.[
2,
5] The trabeculae composing the immature woven bone are less than 1 mm in size and resemble the letters “c” and “o.”[
2]
Imaging Findings
On plain films, monostotic fibrous dysplasia may be difficult to distinguish from a bone cyst, a cartilaginous tumor, a nonossifying fibroma, an aneurysmal bone cyst, or even metastasis. In cases of monostotic fibrous dysplasia, there is an obvious medullary expansion of bone with neighboring cortical bone thickening. Usually, a layer of reactive cortical bone, a few millimeters in thickness, is seen on top of normal cortical bone.[
6] There is a sharp division between the benign fibrous tissue and normal cortical and medullary bone. However, a loss of the apparent corticomedullary junction may be seen as well.
Pratt et al,[
10] in a report of two cases, described a dense sclerotic area that they explained as sequestrum formation in noninfected bone. Devitalized, sequestered, noninfected bone is not a consistent finding with monostotic fibrous dysplasia. Lucent areas correspond to either fibrous tissue or poorly calcified trabeculae. The ground-glass appearance reflects the diffuse mineralized fibrous tissue process that consists of a superimposition of myriad, thinly calcified trabeculae on the benign fibrous tissue.[
2,
6] A thin, narrow rim of bone may be visualized as a scalloped pattern within the expansile lesion that results from new bone formation. Because of the expansile and deforming nature of monostotic fibrous dysplasia, tibial bowing may be seen. Scintigram findings of monostotic fibrous dysplasia include extreme, intense uptake at the affected bone. The increased uptake is secondary to diffuse microscopic ossification.[
3,
6,
8]
Computed tomography can delineate accurately the extent of bone involvement in cases of monostotic fibrous dysplasia. Computed tomography may supply added diagnostic value with the presence of abnormally high attenuation values in the abnormal tissue. The high attenuation values usually are in the range of 70 HU to 130 HU but can be as high as 400 HU in monostotic fibrous dysplasia tissue.[
8] The amount of deviation of the Hounsfield unit depends on the amount of dysplastic bony trabeculae calcified within the benign fibrous tissue.
Monostotic fibrous dysplasia exhibits a fairly consistent signal intensity on T1-weighted magnetic resonance images and a variable signal intensity on intermediate and T2-weighted images.[
3,
4,
10,
11] The T1-weighted image usually demonstrates a homogeneous low signal intensity approximating skeletal muscle. The T2-weighted image usually demonstrates increased signal intensity with separations of low signal intensity. The T2-weighted image can also demonstrate central intermediate signal intensity surrounded by an increased signal intensity rim. The fibrous tissue and calcified deposits have a low signal intensity on T1- and T2-weighted images. Hyaline cartilage, collagen matrix, and necrotic tissue have a low-to-intermediate signal intensity on T1-weighted images and a higher signal intensity on T2-weighted images. Short tau inversion recovery (STIR) pulse sequences provide the best demonstration of fluid collection that would identify the small water-filled cysts and well-vascularized sinusoidal vessels. A contrast-enhanced study would be beneficial in demonstrating the vascularity of this type of lesion.
Norris et al[
11] reviewed the MRI appearance of 13 cases of fibrous dysplasia. Their study revealed that there was a very sharp border between normal bone and benign fibrous tissue with a homogeneous intermediate signal intensity on T1-weighted images. Their study also demonstrated the variability of fibrous dysplasia on T2-weighted images: six patients (46%) had a high signal intensity, four patients (31%) showed a persistent intermediate signal intensity, and three patients (23%) showed a mixed intermediate and high signal intensity. Ten patients (77%) demonstrated a heterogeneous signal intensity and three patients (23%) showed a homogeneous signal intensity. Monostotic fibrous dysplasia does not have a consistent appearance on T1- and T2-weighted images. The MRI finding of low-to-intermediate signal intensity on T1- and T2-weighted images is most reliable in the diagnosis of fibrous dysplasia. Because of the heterogeneous mixture of the benign fibrous tissue, a variable MRI appearance is encountered.
Case Report
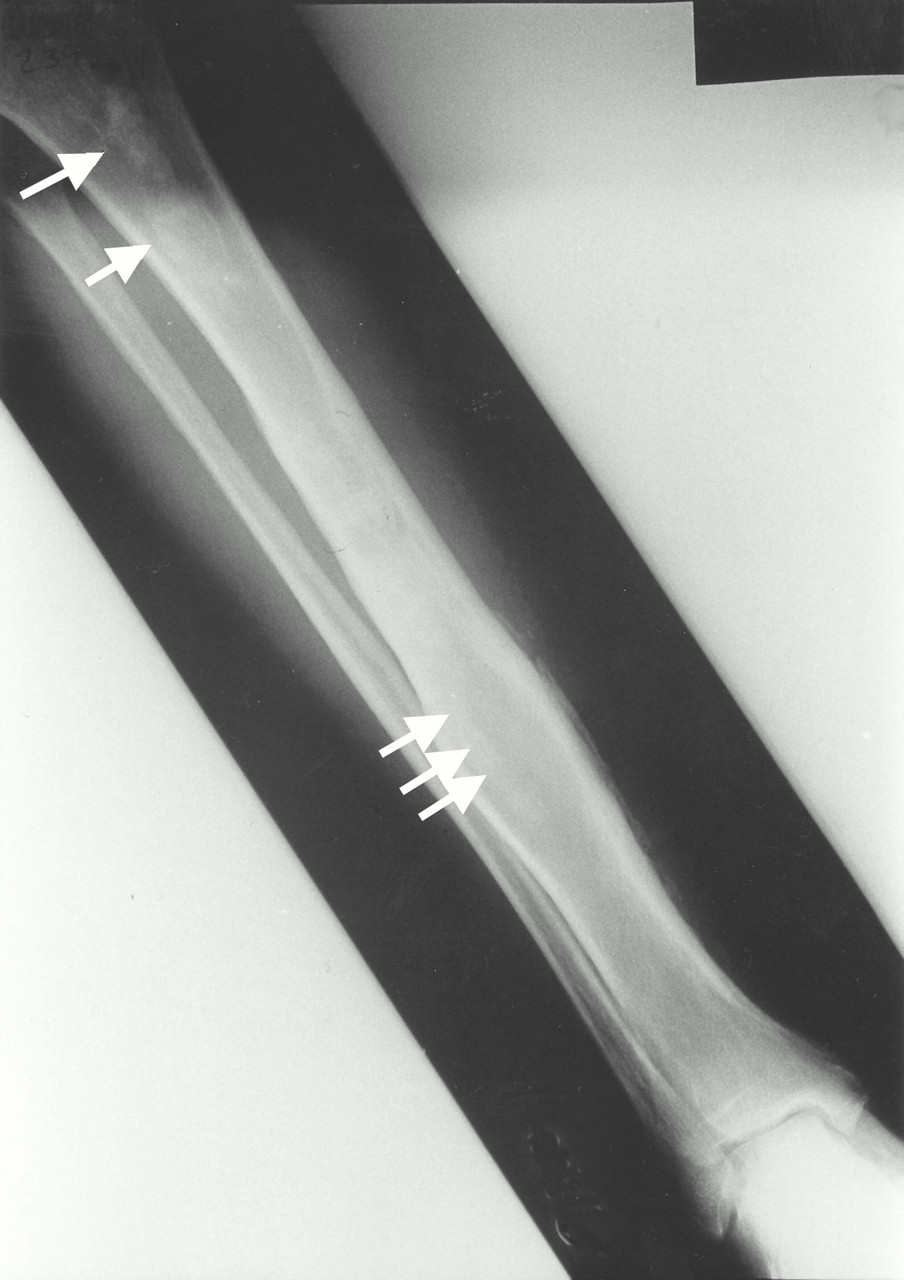
A 75-year-old man presented to the podiatry clinic at the James A. Haley Veterans Hospital in Tampa, Florida, with a 14-year history of a deep-draining pretibial ulcer of the right lower leg. The patient’s medical history was significant for controlled hypertension and lower-extremity chronic venostasis insufficiency. His surgical history was significant for right leg vein stripping in 1960 and a right femur fracture in 1990. The patient related no history of right lower-extremity pain or discomfort. A radiograph taken at this initial visit demonstrated an expansile medullary bone lesion at the distal third of the right tibial diaphysis (
Fig. 1). The periosteal reaction of the distal third of the right tibia may be secondary to venostasis. The pretibial ulcer measured 1.5 × 1.5 cm and involved only the subcutaneous tissue. All laboratory values were normal, except for an alkaline phosphatase value of 133 U/L. The Gram’s stain, culture and sensitivity testing, mycology culture, and mycology smear of the pretibial ulcer were negative. One year prior to presentation to the podiatry clinic, the patient underwent outpatient surgery for the removal of a basal cell carcinoma from the left arm, right back, and right abdomen.
A 99mTc-MDP bone-imaging study of the right tibia was performed on a 1.5 T Picker Edge scanner (Picker International, Highland Heights, Ohio). The patient’s lower-extremity examination was performed with T1-weighted, T2-weighted, and proton density imaging. No contrast study or STIR sequences were performed. The T1-weighted image was performed with a repetition time of 600 to 787 msec and an echo time of 20 msec. The T2-weighted image was performed with a repetition time of 1800 msec and an echo time of 20 to 80 msec. Coronal and sagittal sections were 5 mm thick and axial sections were 8 mm thick.
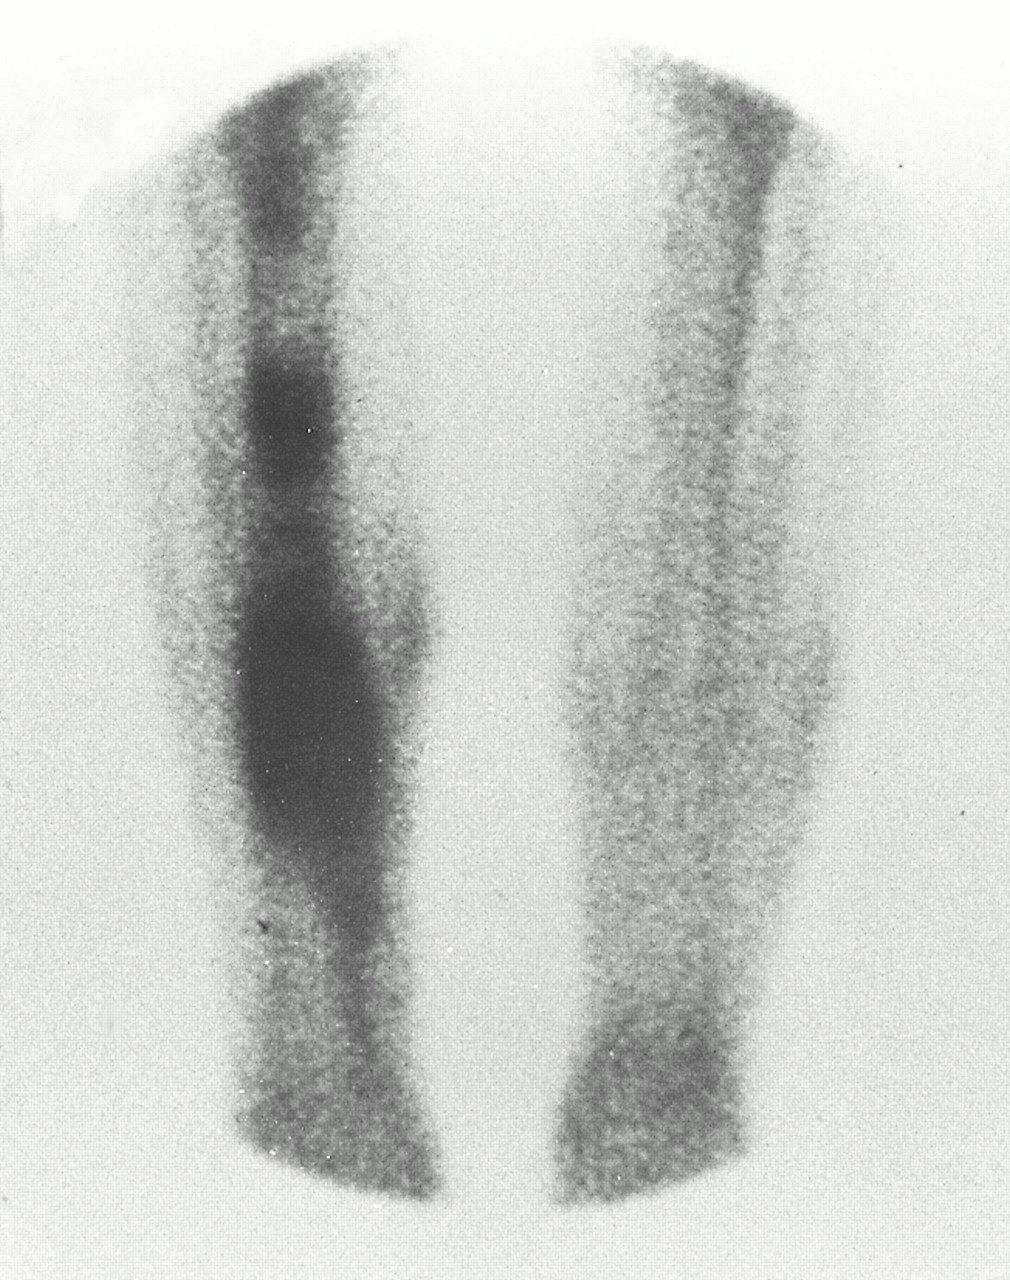
The interpretation indicated a large focal area of increased activity in the right tibia, which was thought to possibly represent a neoplastic or inflammatory process (
Fig. 2). Correlation with plain film radiographs demonstrated that one of the lesions could be identified as an area of bone infarction. The report further suggested that, because of the presence of multiple other bone lesions, this finding might be suggestive of a malignant process with metastatic bone disease. However, correlation of plain film radiographs with the clinical finding of no pain in the right lower leg led to the conclusion that the other lesions did not represent a malignant process.
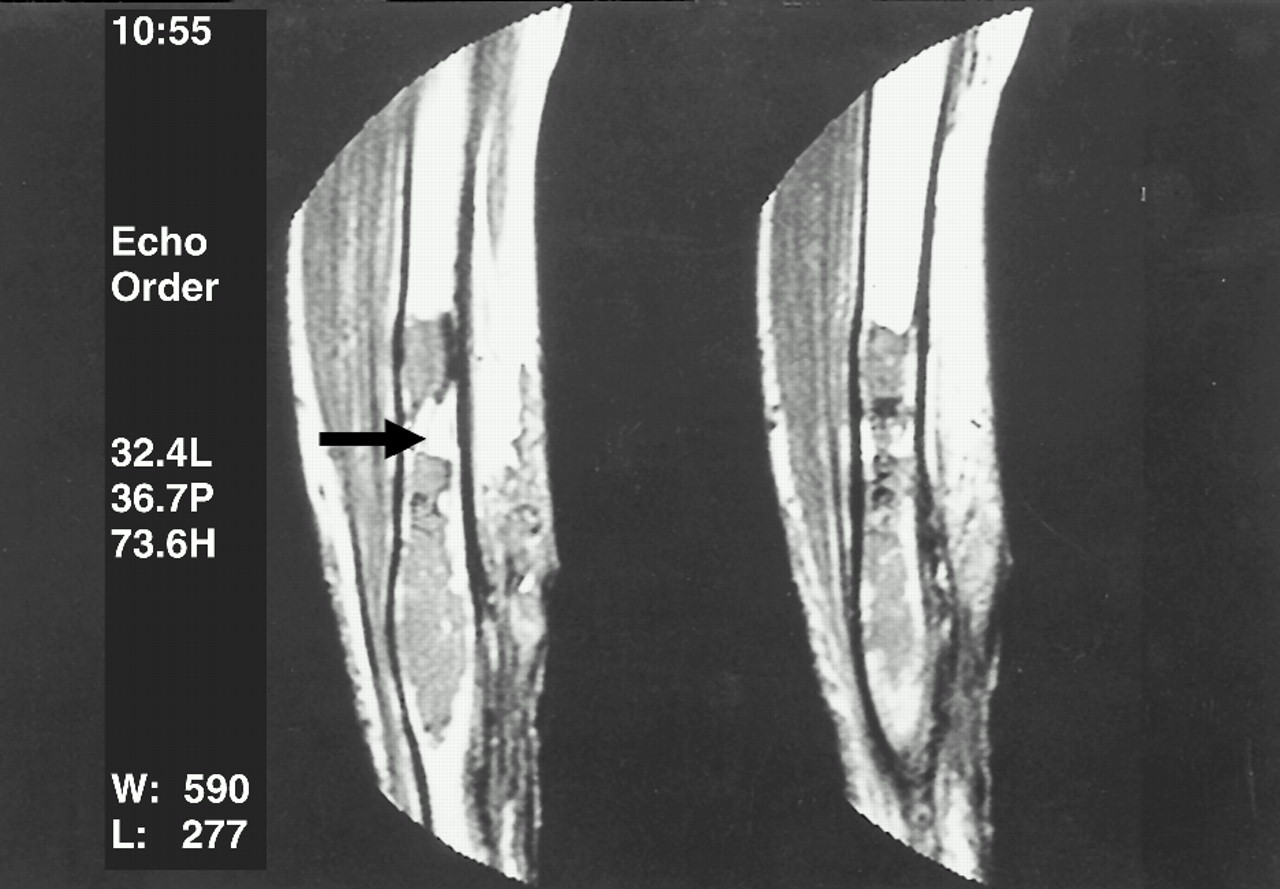
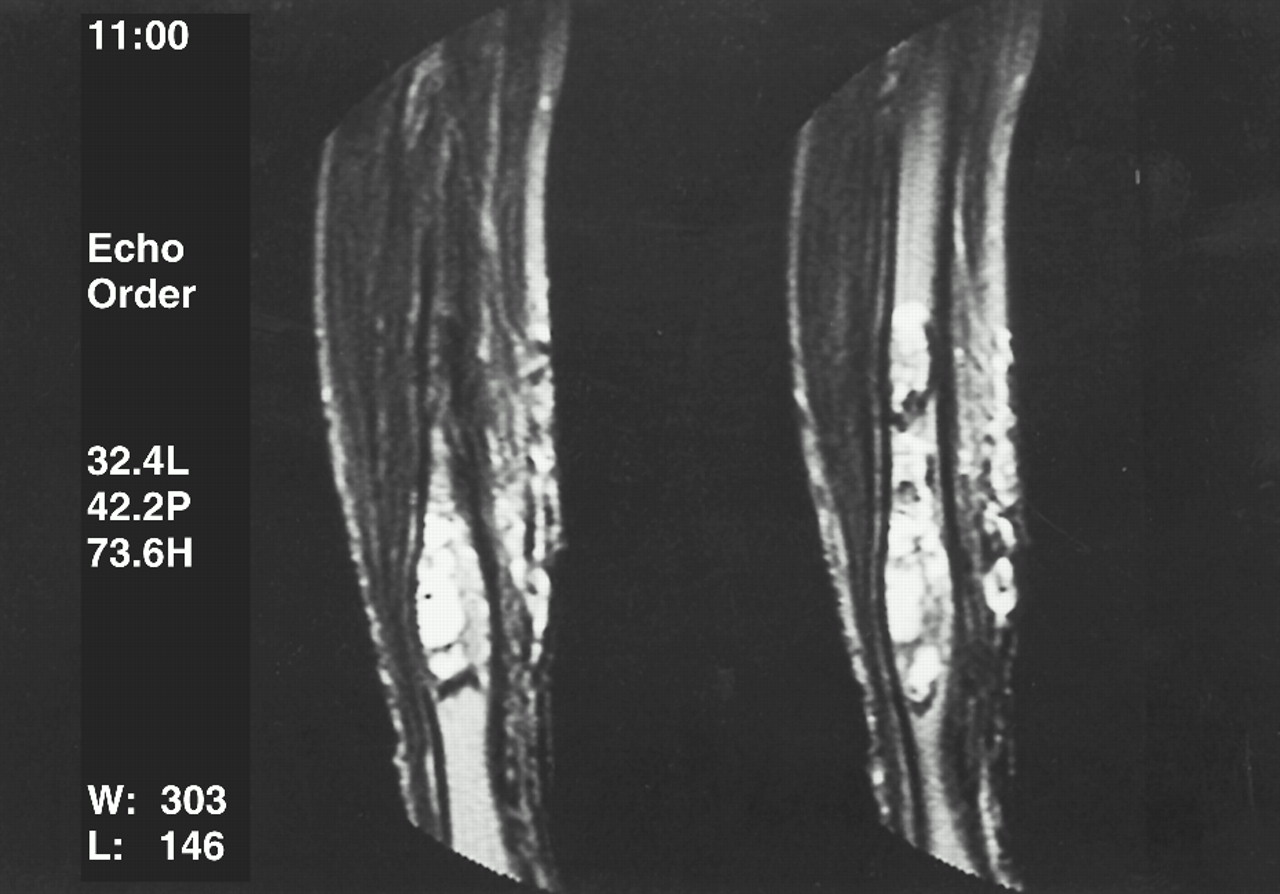
Magnetic resonance imaging of the right lower extremity was performed in the coronal (T1-weighted, T2-weighted, and proton density images) as well as the axial plane (T1-weighted images). The examination showed a large lesion in the tibial midshaft, measuring approximately 16 cm in length. Within this segment, the bone marrow was entirely replaced by pathologic tissue, which is of low signal intensity on T1-weighted images (
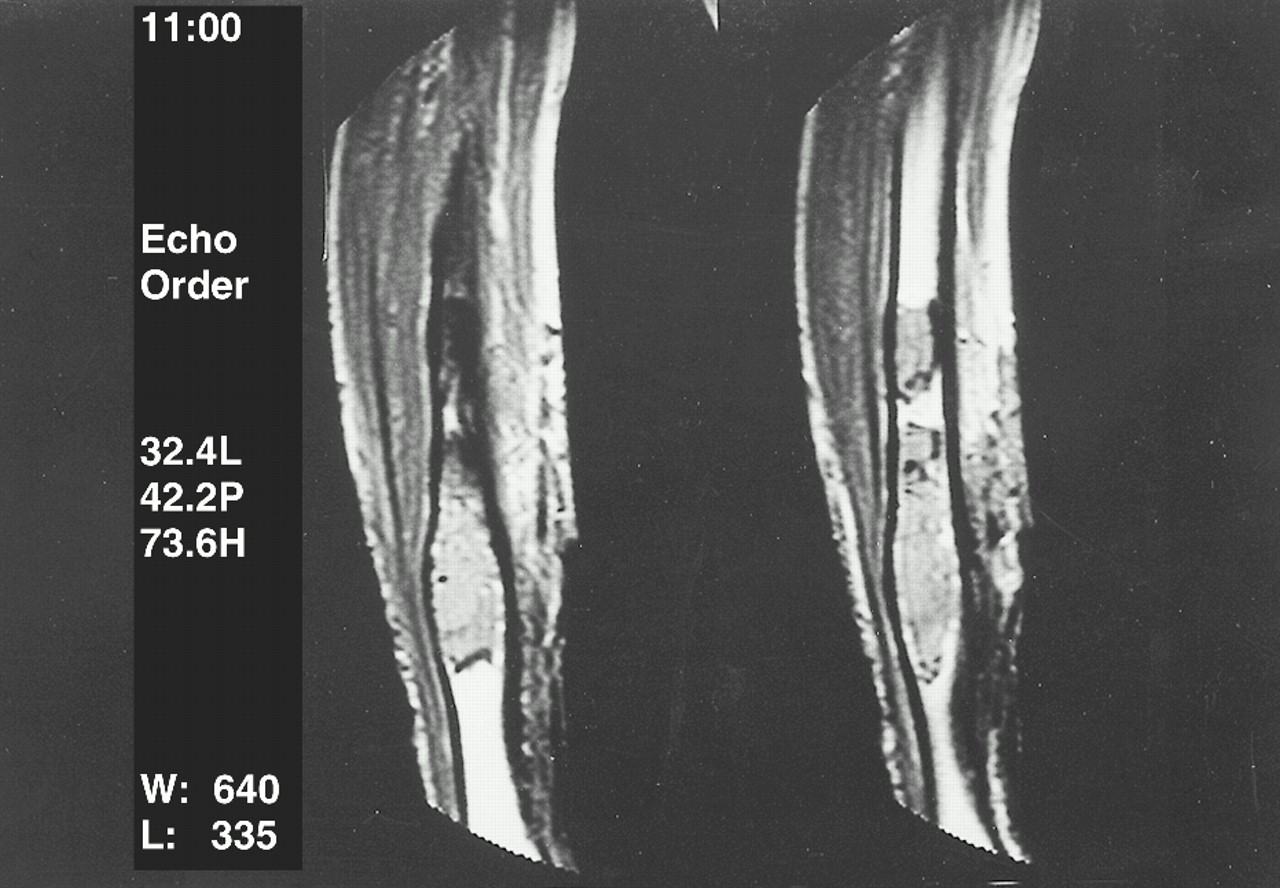
Fig. 3). The proton density image demonstrated low-to-intermediate signal intensity at the bone marrow (
Fig. 4). On the T2-weighted image, the pathologic tissue demonstrated a mixed low and high signal intensity (
Fig. 5). The lesion was very sharply demarcated at its borders with normal bone marrow signal above and below the lesion. There was a small island of normal bone marrow within the lesion itself and the surrounding soft tissue was normal in appearance. The radiologist suggested that this lesion might represent a malignant bone tumor, although this did not strongly correlate with the clinical examination or radiographic examination findings.
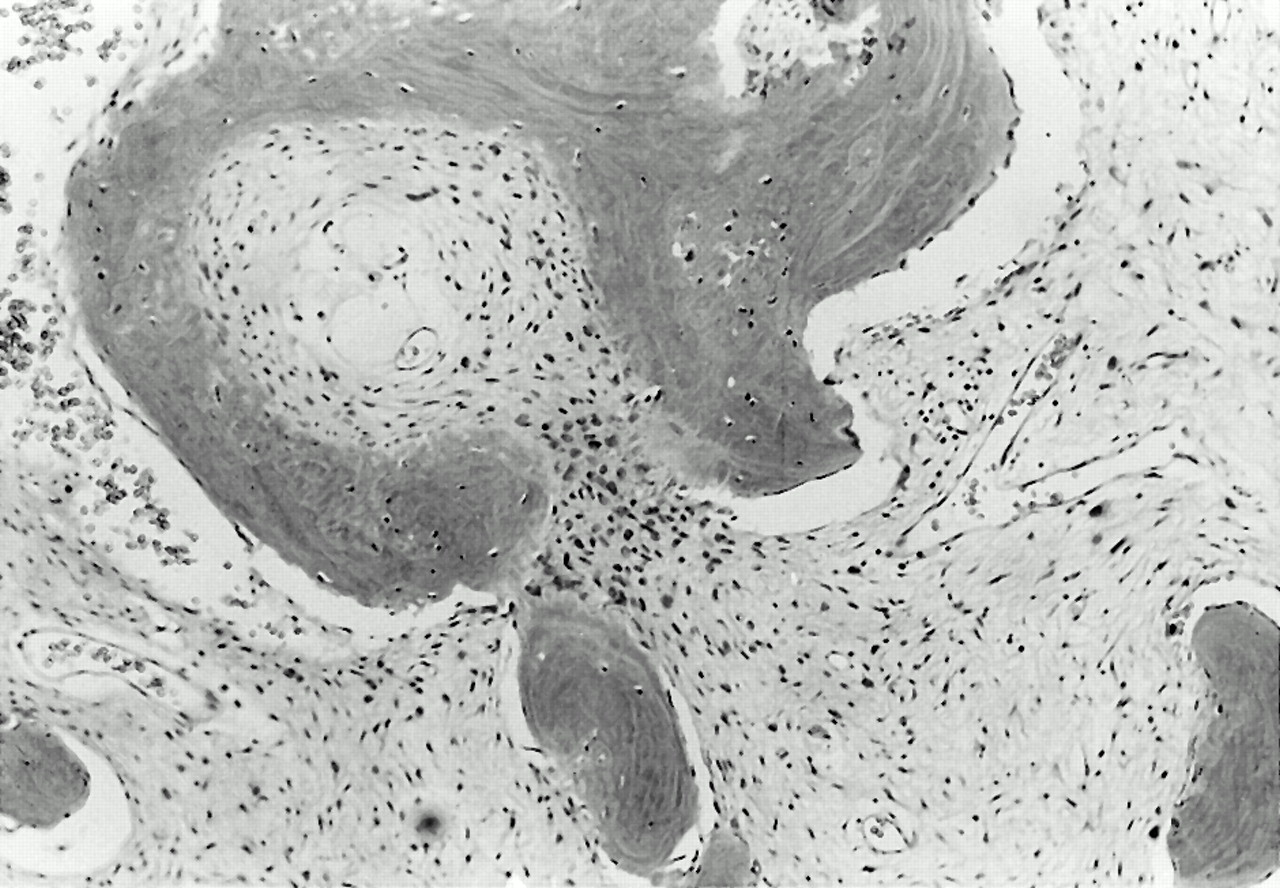
In light of the conflicting reports, a bone biopsy of the right tibia was performed. Three specimens of tibial bone were submitted for gross and microscopic analysis. The surgical pathology report for all three specimens of bone described features consistent with benign fibrous dysplasia (
Fig. 6). No evidence of malignancy was reported. Routine conservative wound care was continued and routine serial right lower-extremity radiographs were obtained every 6 months.
The last follow-up examination of the patient was conducted 3 years and 3 months after the initial presentation. He reported no pain or discomfort of the right lower extremity. Radiographs obtained at that time revealed no significant interval changes, a finding that is consistent with fibrous dysplasia of the right tibia. The pretibial ulcer of subcutaneous tissue only was still present and measured 1.2 × 1.2 cm. A punch biopsy of the ulcer was performed because of the chronicity and recent trophic hypergranulation changes of the ulcer. The surgical pathology report of the surrounding tissue described no evidence of malignancy.
Discussion
The MRI appearance of the monostotic fibrous dysplasia lesion in the case presented here is typical. The T1-weighted image was of a homogeneous low signal intensity. The proton density image and the T2-weighted image demonstrated an increasing heterogeneous signal intensity. Several distinct features of monostotic fibrous dysplasia were seen on the MRI. A very sharp demarcation between the lesion and normal bone, with no complete cortical bone violation, was seen at the tibial diaphysis. The features of no cortical bone violation, no obvious soft-tissue involvement, a homogeneous low signal intensity on the T1-weighted image, and the fine, well-demarcated border between the lesion and the normal bone are characteristic of a benign lesion.
In retrospective analysis of this case, MRI did demonstrate characteristics that, when correlated with the clinical, radiographic, and laboratory findings, should have indicated that this lesion was a no-touch lesion. The clinicians were misled by the interpretation of the bone scan and MRI scans. The bone biopsies could have been avoided had more attention been paid to the MRI scans compared with the other imaging modalities, laboratory studies, and the clinical examination. It should also be stressed that a STIR and contrast-enhanced examination of a potential bone tumor should be considered mandatory for a complete MRI evaluation.
The monostotic fibrous dysplasia was found not as a result of examination following the patient’s complaint of pain or as a result of a pathologic fracture, but incidentally during evaluation of a deep pretibial soft-tissue ulcer. This type of situation is not unusual. The uneventful progress of the patient, with no occurrence of pathologic fracture to date, is consistent with monostotic fibrous dysplasia.
Conclusion
Magnetic resonance imaging evaluation of monostotic fibrous dysplasia demonstrates specificity when combined with other imaging studies, laboratory findings, and clinical presentation. Incorporation of MRI in the overall evaluation for this disease process may aid in avoiding unnecessary invasive procedures.
Figure 1.
Anteroposterior radiograph of the right lower extremity at initial presentation. Note the area of loss of the trabecular pattern and the periosteal reaction, which is most likely due to the venostasis and not the expansile medullary lesion. Also note the ill-defined borders in the proximal two-thirds of the tibia, most likely representing bone infarcts.
Figure 1.
Anteroposterior radiograph of the right lower extremity at initial presentation. Note the area of loss of the trabecular pattern and the periosteal reaction, which is most likely due to the venostasis and not the expansile medullary lesion. Also note the ill-defined borders in the proximal two-thirds of the tibia, most likely representing bone infarcts.
Figure 2.
A 24-hour delayed 99mTc-MDP scintigram of the right tibia and fibula. Note the area of increased focal uptake of the right tibia. Also note that the homogeneous focal uptake is located at the distal third of the diaphysis at the expanded medullary bone.
Figure 2.
A 24-hour delayed 99mTc-MDP scintigram of the right tibia and fibula. Note the area of increased focal uptake of the right tibia. Also note that the homogeneous focal uptake is located at the distal third of the diaphysis at the expanded medullary bone.
Figure 3.
A T1-weighted image (repetition time, 600; echo time, 20) of the right tibia. Note the low signal intensity of the lesion, compared with the marrow signal, that replaces the bone marrow. The arrow indicates a small area of normal bone within the lesion itself.
Figure 3.
A T1-weighted image (repetition time, 600; echo time, 20) of the right tibia. Note the low signal intensity of the lesion, compared with the marrow signal, that replaces the bone marrow. The arrow indicates a small area of normal bone within the lesion itself.
Figure 4.
Proton density image (repetition time, 1800; echo time, 20) of the right tibia. Note the intermediate signal intensity of the lesion compared with the marrow signal.
Figure 4.
Proton density image (repetition time, 1800; echo time, 20) of the right tibia. Note the intermediate signal intensity of the lesion compared with the marrow signal.
Figure 5.
A T2-weighted image (repetition time, 1800; echo time, 80) of the right tibia. Note the mixed low and high signal intensity of the lesion compared with the marrow signal. The sharp demarcation between normal medullary bone and the lesion is evident both superior and inferior to the lesion.
Figure 5.
A T2-weighted image (repetition time, 1800; echo time, 80) of the right tibia. Note the mixed low and high signal intensity of the lesion compared with the marrow signal. The sharp demarcation between normal medullary bone and the lesion is evident both superior and inferior to the lesion.
Figure 6.
Histologic presentation of monostotic fibrous dysplasia with proliferative fibroblasts forming a dense collagenous matrix. Areas of metaplastic bone resemble the Chinese character configuration and look like the letters “c” and “o” (H&E ×100).
Figure 6.
Histologic presentation of monostotic fibrous dysplasia with proliferative fibroblasts forming a dense collagenous matrix. Areas of metaplastic bone resemble the Chinese character configuration and look like the letters “c” and “o” (H&E ×100).