Lower-extremity amputation is common among individuals with diabetes mellitus, especially those with peripheral neuropathy. It has been estimated that approximately 40,000 amputations are performed yearly on patients with diabetes in the United States.[
1] The high prevalence of diabetes among most American Indian tribes has been reported previously.[
2-
6] The Pima Indians of the Gila River Indian Community in Arizona have the world’s highest reported prevalence of type 2 diabetes mellitus.[
7] As a consequence, Pima Indians with diabetes have a higher rate of lower-extremity amputation than has been reported for other diabetic populations.[
8]
In individuals with type 2 diabetes, lower-extremity amputation is frequently the result of an injury to the skin on the plantar surface of the foot. Delbridge et al[
9] have reported that plantar ulcerations develop in the insensitive, neuropathic foot of the diabetic patient as a result of an interaction between mechanical factors and abnormal connective-tissue properties. The primary mechanical factor that can lead to plantar ulceration of the foot, in conjunction with sensory impairment, is repetitive mechanical stress. Repetitive mechanical stress leads to tissue trauma in areas of high plantar pressure during walking.[
9] The mechanical stresses to the tissues include both vertical and shear forces applied to the plantar surface of the foot during walking as well as other activities of daily living. Plantar ulceration has been linked in several retrospective studies to those areas with elevated plantar pressures.[
10-
13] Stokes et al[
10] and Ctercteko et al[
11] measured the load distribution acting on the plantar surface of the foot in 22 and 21 diabetic patients, respectively. The results of both of these studies demonstrated that the areas of heavy load corresponded to the site of previous plantar ulcerations. Masson et al[
13] conducted a retrospective study of 38 patients with diabetes and a previous history of plantar ulceration. They reported that the peak forefoot pressure for these subjects was 1.08 mPa. Veves et al[
14] conducted one of the first prospective studies and concluded that high plantar pressure in patients with diabetes was strongly predictive of subsequent plantar ulceration, especially in the presence of neuropathy. They reported peak foot pressures to be 1.2 mPa for the neuropathic diabetic group (n = 86) but only 0.88 mPa for the control group (n = 28). While the previously cited studies would appear to justify the measurement of plantar pressures as an important component of the evaluation of the patient with diabetes, none of the studies provide the reader with actual pressure values for specific plantar regions of the foot. Furthermore, while pressure measurement would appear to be a useful evaluation tool, specific values for plantar pressure above which ulceration could occur remain undefined. Duckworth et al[
15] defined the pressure “threshold of normality” as 981 kPa, whereas Boulton et al[
12] used a value of 1.07 mPa. In their investigation, Veves et al[
14] considered peak pressure values greater than 1.2 mPa to be abnormal. Veves et al also reported, however, that only 15 of 43 (35%) of the patients with abnormally high pressure values actually developed plantar ulcers in their prospective study. Cavanagh and Ulbrecht[
16] have noted that plantar ulceration can occur at sites with pressure values just over 500 kPa. In a more recent investigation, Armstrong et al[
17] concluded that there was no optimal pressure threshold for screening diabetic patients at risk for ulceration, even though they attempted to establish such a value at 700 kPa. Thus the actual pressure value that defines a “danger threshold” for the development of ulceration remains undefined.
Few investigations to date have provided regional peak pressure values for the plantar surface of the foot obtained from a diabetic population. Cavanagh and Ulbrecht[
18] presented regional pressure values collected from a sample of 27 symptom-free middle-aged and elderly men for ten plantar regions using a first-step data-collection protocol. They reported that the highest peak pressure occurred under the central forefoot (533 kPa), followed by the region under the hallux (511 kPa).
In addition to mechanical stress and peripheral neuropathy, changes in connective-tissue mobility have been implicated as a primary factor in the development of neuropathic ulcerations in the diabetic patient. Delbridge et al[
9] noted that changes in the protein of the skin and subcutaneous tissues of the soles of patients with diabetes probably contribute to the development of plantar ulcers. Protein changes tend to cause skin layers to become more rigid, making tissue breakdown more likely in response to mechanical shear stresses. Furthermore, changes in connective-tissue mobility have also been shown to affect joint range of motion. Studies by Fernando et al[
19] and Mueller et al[
20] have shown that patients with diabetes tend to have decreased lower-extremity joint motion. The lower-extremity joints that have been specifically identified include the ankle and metatarsophalangeal joints. Birke et al[
21] reported that neuropathic diabetic patients with ulceration of the plantar surface of the hallux had significantly reduced first metatarsophalangeal joint range of motion in comparison with neuropathic feet with ulcerations in other regions of the foot as well as non-neuropathic control subjects.
While the previous investigations have substantiated the role of increased plantar pressure and limited ankle and foot joint mobility in the development of plantar ulceration in diabetic patients with peripheral neuropathy, interpretation of the results is limited by both the size and the homogeneity of the study subjects. Frykberg et al[
22] evaluated the risk of ulceration associated with high foot pressures and peripheral neuropathy in a diabetic population with diverse ethnic backgrounds. The diabetic patients who participated in their study included white (n = 121), black (n = 36), and Hispanic (n = 94) individuals. The results indicated that plantar pressures and limited lower-extremity joint mobility could vary among diabetic patients with peripheral neuropathy from different ethnic backgrounds. Unfortunately, previous studies evaluating the parameters of plantar pressure and limited ankle and foot joint mobility in diabetic patients with peripheral neuropathy have not included American Indians in their subject pool. This generates several important questions for clinicians involved in the evaluation and management of this unique group of individuals. Is the range of pressure values for various regions on the plantar surface of the foot for American Indians similar to the values previously reported for white diabetic patients? Is foot and ankle joint mobility significantly decreased in diabetic American Indians in comparison with nondiabetic American Indians? Are peak plantar pressure values for American Indian diabetic patients similar to the values reported for diabetic patients from other ethnic backgrounds? To date, no study has been conducted to address these important questions regarding American Indian diabetic patients. Answers to the above questions would appear to be especially important for high-risk American Indian tribes, such as the Pima Indians, who have high rates of type 2 diabetes and lower-extremity amputation. The current study was undertaken in an attempt to answer these important questions.
The purpose of this descriptive study, therefore, was to determine the magnitude and duration of plantar pressures acting on the feet of American Indians with diabetes. A second purpose was to determine whether American Indians with diabetes had decreased ankle and first metatarsophalangeal joint range of motion in comparison with American Indians without diabetes.
Materials and Methods
Subjects
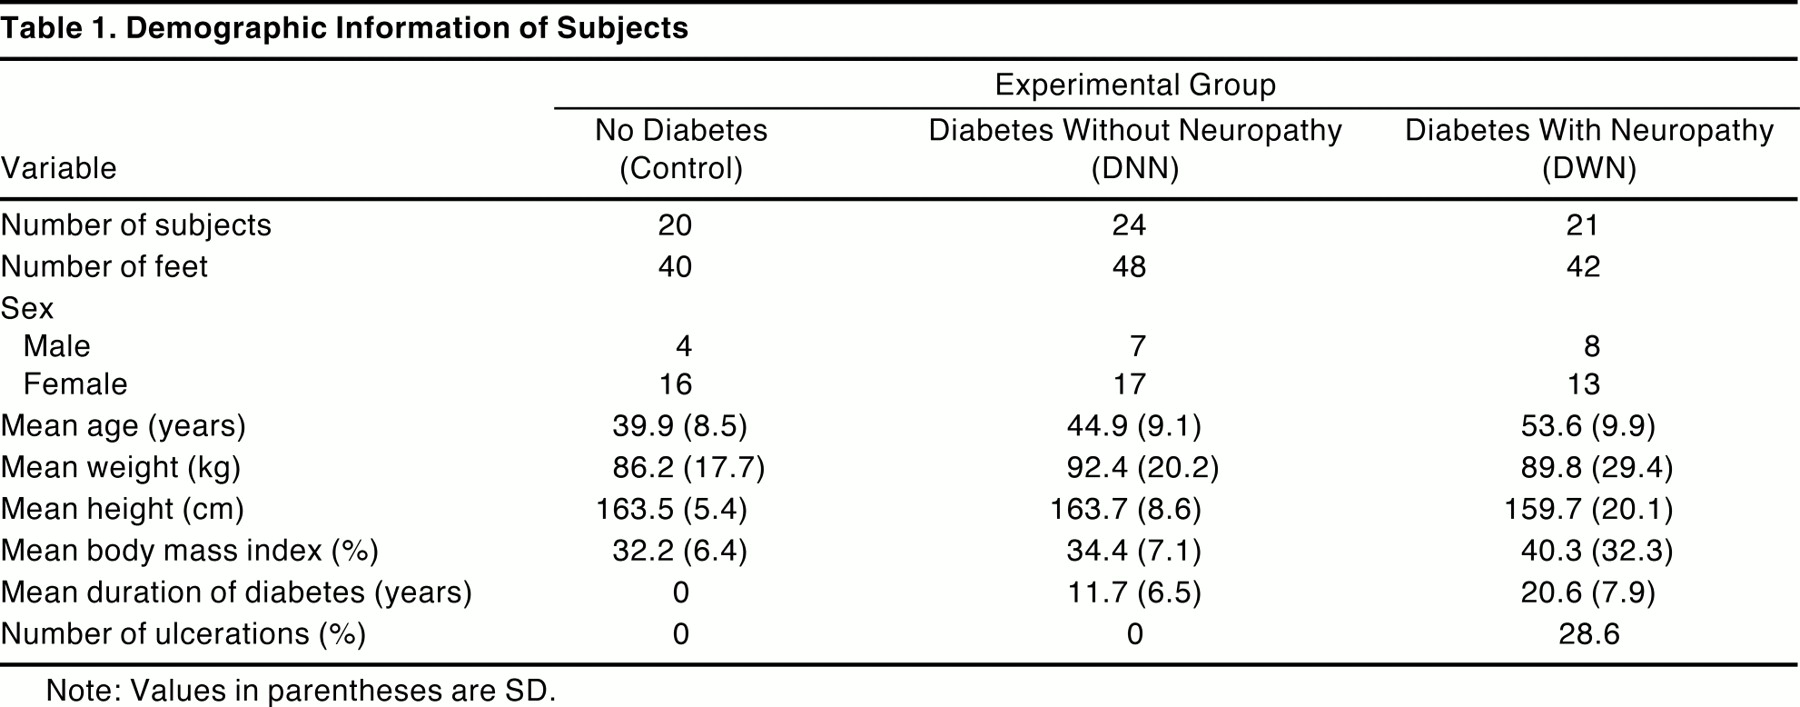
Forty-five American Indians (15 men, 30 women) with a history of diabetes mellitus were recruited to serve as subjects. The subjects were members of either the Pima or the Papago Indian tribe and were living in the Gila River Indian Community in Arizona at the time of data collection. Patients with a history of previous amputation or active foot ulcers or who were unable to walk independently for any reason were excluded from the study. All subjects had a previous diagnosis of diabetes that was based on a medical history of elevated serum glucose levels. The subjects were divided into two groups: a diabetes without neuropathy (DNN) group and a diabetes with neuropathy (DWN) group. Assignment to the DWN group was based on the following clinical examination criteria: 1) inability to sense a Semmes-Weinstein 5.07 monofilament on the plantar surface of the foot and 2) reduced or absent ankle reflexes. On the basis of the above criteria, 21 patients (8 men, 13 women) were assigned to the DWN group and 24 patients (7 men, 17 women) were assigned to the DNN group. A third group consisting of 20 Pima Indians (4 men, 16 women) without a history of diabetes was also recruited to serve as a control for the possible influences of age or body weight.
Table 1 presents demographic information for the three groups of subjects as well as information on duration of diabetes, body mass index, and plantar ulceration history. Both the Gila River Indian Community Tribal Council Health Board and the Northern Arizona University Institutional Review Board approved the testing protocol. All study participants provided informed written consent prior to participation.
Table 1.
Demographic Information of Subjects
Table 1.
Demographic Information of Subjects
Instrumentation
An EMED-SF floor-mounted capacitance transducer matrix platform (Novel Electronics, Inc, St Paul, Minnesota) with an active sensor area of 23 × 44 cm was positioned at the midpoint of a 4.2-m portable walkway for pressure-data collection. The EMED-SF platform has a matrix of 1,944 force transducers with a density of two sensors per square centimeter and a sampling rate of 70 Hz. The EMED-SF platform was calibrated by means of air pressure applied linearly at multiple levels through a rubber bladder that completely covered the entire active transducer surface. The accuracy of the capacitance sensor used in the EMED-SF platform is ± 5%, with hysteresis less than 3%. The maximum pressure that can be recorded with the EMED-SF platform system is 1.27 mPa.
Procedures
After informed consent was obtained from all of the subjects, each subject’s height and weight were measured and recorded. Subjects were then asked to lie on their stomach with their feet hanging off the edge of the table, so that ankle dorsiflexion and first metatarsophalangeal joint extension range of motion could be measured. The methods previously described by McPoil and Brocato[
23] were used to measure the ankle dorsiflexion and first metatarsophalangeal joint extension. All measurements were taken by the same investigator (W.Y.) to control for measurement variability and were performed twice. To prevent measurement bias, another investigator recorded all measurements. Once the range-of-motion measurements were completed, pressure data were collected on each subject by means of the two-step method.[
24] The two-step method, which has previously been shown to provide pressure data similar to those of the midgait method, was used to minimize the number of barefoot steps required by the subjects in the DWN group and thus reduce the risk of damage to the plantar aspect of their feet. Each subject was positioned 115 cm from the front edge of the EMED-SF platform and asked to perform three practice trials. At the end of the three practice trials, the subject was repositioned in relation to the front edge of the platform to ensure proper foot contact with the platform on the second step. Pressure data were collected for five consecutive steps for both the left and the right foot (a total of ten steps). The selection of five trials for the collection of pressure data was based on the previous work of McPoil et al.[
25] A trial was repeated if the investigators observed an atypical foot placement on the sensor platform or if the subject appeared to target the platform. Because previous research has indicated that plantar callosities can act as a foreign body and cause elevated plantar pressure values, all subjects were screened for callus lesions by a podiatric physician prior to the pressure-data collection.[
26] If callus lesions were observed, the callosities were trimmed by the podiatric physician prior to data collection.
Data Analysis
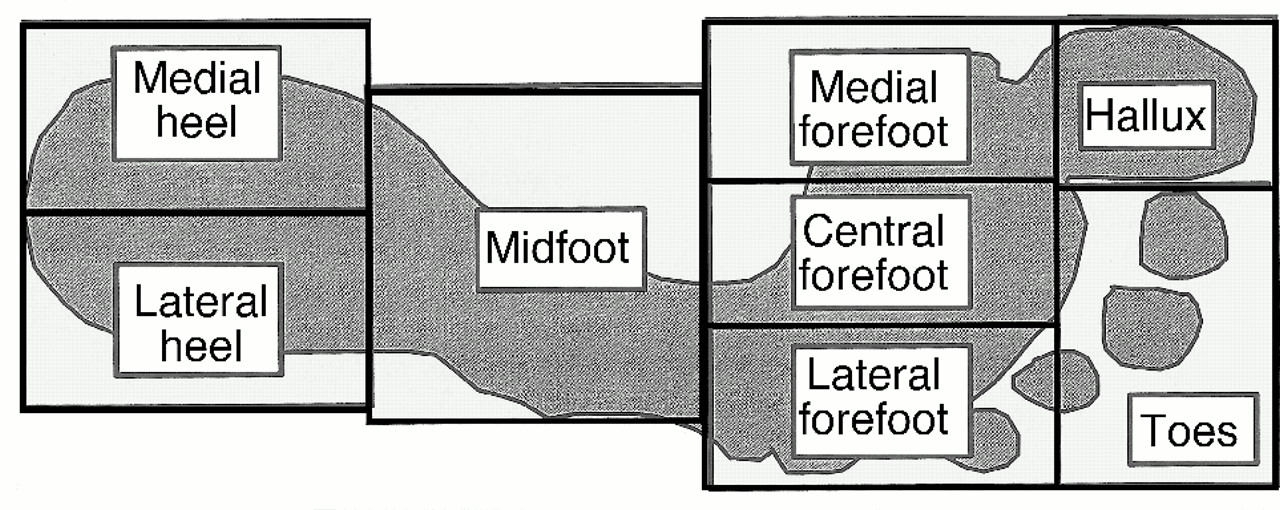
The EMED NovelWin software program (Novel Electronics, Inc) was used to divide the foot into the following eight regions: medial heel, lateral heel, midfoot, medial forefoot, central forefoot, lateral forefoot, hallux, and toes. These regions were consistently defined for all subjects as a percentage of the total length and width of the subject’s footprint as illustrated in
Figure 1. The heel was from 0% to 30% and the midfoot was from 30% to 60% of foot length. The forefoot was from 60% to 85%, with the hallux/toes from 85% to 100% of foot length. The heel region width was divided in half to create the medial and lateral heel regions. The forefoot region width was divided into equal thirds to create the three forefoot regions. The hallux/toe region width was also divided into two parts, with the hallux region being the medial 40% and the toe region the lateral 60%. Once the eight regions for each step were defined, peak pressure (in kilopascals) and the pressure-time integral (in kilopascal-seconds) were calculated for each region. A mean for the left and right foot (five trials for each foot) was calculated for each variable and used for further statistical analysis. The stance-phase duration for each of the five trials for each subject’s left and right feet was also calculated for further analysis. The peak pressure and pressure-time integral variables were not normalized in relationship to the subject’s body, since previous research involving a diabetic population has shown that elevated body weight does not appear to result in increased plantar pressures.[
27]
Figure 1.
The masks used to define the eight plantar regions of the foot.
Figure 1.
The masks used to define the eight plantar regions of the foot.
Statistical Analysis
In addition to descriptive statistics, type (2,1) intraclass correlation coefficients were calculated to determine the consistency of the stance-phase duration for the five trials conducted for the left and right feet of each subject. Type (2,1) intraclass correlation coefficients were also calculated to determine the reliability of the repeated range-of-motion measurements of ankle dorsiflexion and first metatarsophalangeal joint extension. The level of reliability for the intraclass correlation coefficients was classified by means of the characterizations reported by Landis and Koch.[
28] These characterizations were as follows: slight, if the coefficient ranged from 0 to 0.20; fair, if the coefficient ranged from 0.21 to 0.40; moderate, if the coefficient ranged from 0.41 to 0.60; substantial, if the coefficient ranged from 0.61 to 0.80; and almost perfect, if the coefficient ranged from 0.81 to 1.00.
A one-way analysis of variance (ANOVA) was used to evaluate differences among the three subject groups in maximum peak pressure, pressure-time integral, ankle dorsiflexion, and first metatarsophalangeal joint extension. A Tukey’s post-hoc comparison was used to determine differences among the three conditions tested. An α level of .05 was used for all tests of statistical significance.
Results
The means and standard deviations for stance-phase duration, ankle dorsiflexion, and first metatarsophalangeal joint extension for each group are listed in
Table 2. The intraclass correlation coefficients for stance-phase duration were 0.873 for control, 0.931 for DNN, and 0.747 for DWN. The intraclass correlation coefficients for intratester reliability for the ankle dorsiflexion and first metatarsophalangeal joint extension range-of-motion measurements ranged from 0.969 to 0.981 for all three groups.
Table 2.
Mean (SD) Stance-Phase Duration and Range of Motion
Table 2.
Mean (SD) Stance-Phase Duration and Range of Motion
The means and standard deviations for peak plantar pressure are listed in
Table 3. The region of the highest peak pressure for all three groups was the central forefoot, followed by the hallux. The DWN group had the highest recorded mean value of 616 kPa in the central forefoot, followed by the control (533 kPa) and the DNN (518 kPa) groups, respectively.
Table 3.
Mean (SD) Maximum Peak Pressure (in Kilopascals)
Table 3.
Mean (SD) Maximum Peak Pressure (in Kilopascals)
The means and standard deviations for pressure-time integral are listed in
Table 4. In all three groups, the region of highest pressure-time integral was the central forefoot. The rank order of the remaining regions, however, was different for each of the three groups studied. The three regions with the highest pressure-time integrals for the DWN group were the central, lateral, and medial forefoot.
Table 4.
Mean (SD) Pressure-Time Integral (in Kilopascal-Seconds)
Table 4.
Mean (SD) Pressure-Time Integral (in Kilopascal-Seconds)
The results of the one-way ANOVA were significant (P < .05) for maximum peak pressure, ankle dorsiflexion, and first metatarsophalangeal joint extension. The results of post-hoc analysis indicated that the medial forefoot region maximum peak pressure for the control group was significantly different from those for the DNN and DWN groups, with no differences found between the DNN and DWN groups. In addition, the central forefoot region maximum peak pressure for the DWN group was significantly different from those for the DNN and control groups, with no differences found between the DNN and control groups. The results of post-hoc analysis indicated that the ankle dorsiflexion range of motion for the control group was significantly different from those for the DNN and DWN groups, with no differences found between the DNN and DWN groups. The results of post-hoc analysis indicated that the first metatarsophalangeal joint extension range of motion for the DWN group was significantly different from those for the control and DNN groups. No significant differences, however, were found between the control and DNN groups.
Discussion
The first step in interpreting the results of this study was to determine whether the duration of the stance phase was consistent among the five trials collected for the left and right feet of each subject. The consistency of the stance-phase duration is an important issue, as previous studies have noted that changes in the walking speed or cadence between trials can influence the duration of the stance phase, which in turn can affect force and pressure values.[
25,
29] The characterizations of the stance-phase–duration intraclass correlation coefficient values would be classified as “almost perfect” for the control and DNN groups and “substantial” for the DWN group, according to the criteria established by Landis and Koch.[
28] On the basis of the intraclass correlation coefficient values obtained, the authors concluded that the stance-phase durations were consistent and that further analyses of the force and pressure data could be performed.
The primary purpose of this study was to determine the magnitude and duration of plantar pressures acting on the feet of American Indians with diabetes. Maximum peak pressure was used to provide an indication of the magnitude of plantar pressures in the three subject groups. The maximum peak pressure was located in the central forefoot region for all three groups, with the DWN group having the greatest value of 616 kPa. The maximum pressure values for the control and DNN groups were 533 and 518, respectively. The next highest region of maximum peak pressure for all three groups was the hallux region, after which the order of regions with the maximum highest pressure was quite variable among the three groups. The maximum pressure values in this study are quite similar to those reported by Frykberg et al[
22] in their investigation, which examined a more diverse diabetic population. Their study reported maximum plantar pressure values for the following diabetic patient groups: 657 kPa for whites, 559 kPa for blacks, and 431 kPa for Hispanics. The maximum peak pressures recorded for American Indian diabetic patients in the current study are much lower than the 1.0- to 1.2-mPa values previously reported by Masson et al,[
13] Veves et al,[
14] and Duckworth et al.[
15] One reason for the discrepancy in the values for maximum plantar pressures between these previous studies and the current investigation was the use of different technologies to collect the pressure data. In light of the fact that 28.6% of the DWN group had a previous plantar ulceration, the observation by Cavanagh and Ulbrecht16 that plantar ulceration can occur at sites with pressure values just over 500 kPa appears justified.
The pressure-time integral was used to assess the duration of plantar pressures acting on the bottom of the feet. The plantar region with the highest pressure-time integrals for all three groups was again the central forefoot region. This indicates not only that the central forefoot region had the highest maximum pressure values but also that those pressures acted over that region for the longest period of time while the foot was in contact with the ground. The central forefoot region was the only region of agreement with regard to rank order among the three groups studied. It is of interest to note that the four regions that exhibited the highest pressure-time integrals for all three groups were the hallux and the lateral, central, and medial forefoot regions. Thus the duration of the plantar pressures under the three forefoot and hallux regions were the greatest of all of the plantar regions evaluated.
A second purpose of the study was to determine whether American Indians with diabetes exhibited decreased ankle and first metatarsophalangeal joint extension in comparison with nondiabetic American Indians. The fact that the intraclass correlation coefficient values for intratester reliability for the ankle dorsiflexion and first metatarsophalangeal joint extension range-of-motion measurements ranged from 0.969 to 0.981 for all three groups permitted further analysis of the data.
For ankle dorsiflexion range of motion, the control group was significantly different from the DNN and DWN groups. While no significant difference was found between the mean values for the DNN and DWN groups, the DWN group had greater range of motion than the DNN group. The mean ankle dorsiflexion range-of-motion values in the current study were higher for all groups than those previously reported by Mueller et al.[
20] The control and diabetic subjects in the Mueller et al study had an older mean age than those in the current investigation; however, the duration since diagnosis with diabetes mellitus was quite similar. Although Mueller et al do not provide the ethnic background of the subjects used in their study, it appears that collagen-tissue changes associated with diabetes did not cause the same degree of reduction in ankle range of motion for American Indian diabetic patients evaluated in the current study.
The first metatarsophalangeal joint extension range of motion was significantly less for the DWN group than for the control and DNN groups. The mean first metatarsophalangeal joint extension range-of-motion values for the control (54.5°) and the DNN (54.3°) groups in the present study are quite similar to the values previously reported by Birke et al[
21] for normal subjects (57.7°) and for diabetic patients with no history of great toe ulceration (60.7°). In the present study, no significant differences were found between the control and DNN groups for first metatarsophalangeal joint extension range-of-motion values. For both ankle dorsiflexion and first metatarsophalangeal joint extension, the greatest decrease in range-of-motion values occurred with the DWN group, which also had the longest duration since diagnosis of diabetes mellitus (20.6 years). These findings are in agreement with previously published studies that have reported decreased range of motion as a result of a reduction in collagen-tissue mobility associated with diabetes mellitus.[
17,
18]
A limiting factor in the interpretation of the results of the current investigation is the difference in the mean age among the three subject groups. While every effort was made to create age-matched subject groups, because of the high incidence of type 2 diabetes mellitus in the Pima and Papago tribes, control subjects 45 years of age or older were extremely difficult to locate. The majority of American Indians residing in the Gila River Indian Community who did not have a diagnosis of type 2 diabetes mellitus at the time of the study were younger than 40 years of age. The same scenario also occurred in the attempt to locate subjects for the DNN group. Even with the limitation of non-age-matched groups, the subjects evaluated in the current investigation are a realistic representation of the American Indian population residing in the Gila River Indian Community, whose inhabitants have one of the highest reported rates of type 2 diabetes mellitus in the world. That each subject was asked to walk over the pressure platform at his or her own preferred speed, rather than at a speed prescribed by the investigator, could also be viewed as a limitation of the study. Previous studies, however, have reported that asking subjects to walk at prescribed speeds can result in marked disturbances in their normal gait pattern.[
30,
31]
In spite of the above limitations, the results of this study provide valuable information about the pattern of plantar pressures as well as changes in joint range of motion for clinicians involved in the management of American Indians with diabetes. Although few studies have published regional pressure values, the regional peak pressure values reported in the current study are quite similar to the regional values previously described by Cavanagh and Ulbrecht[
18] for a group of nondiabetic subjects. This indicates that American Indians have plantar pressure patterns similar to those of non–American Indians. Furthermore, the findings of the current investigation suggest that American Indians with diabetes have reductions in ankle and foot joint range of motion similar to what has been previously reported for non–American Indian diabetic populations. Thus the increased risk of foot ulceration associated with decreased joint range of motion in the ankle and foot should also be considered in the management of the American Indian diabetic patient.
Conclusion
The results of this investigation show that American Indians with diabetes have a pattern of peak plantar pressures similar to what has been previously reported for non–American Indians with diabetes. In addition, diabetic American Indians demonstrate a pattern of reduced ankle and first metatarsophalangeal joint range of motion similar to what has been previously reported for non–American Indian diabetic patients.