Obesity is a common and preventable disease of clinical and public health importance [
1] that is strongly associated with planus (low-arched) foot posture, pronated dynamic foot function, and increased plantar pressures when walking [
2]. Considering that the prevalence of obesity is increasing worldwide, the incidence of musculoskeletal foot disorders is also likely to increase [
3]. High levels of body fat and increased loads on the major joints has the potential to lead to pain and discomfort, inefficient body mechanics, and further reductions in mobility [
4]. Specific aspects of walking in the obese group include walking at a slower walking speed, reduction in step length and step frequency, a longer duration of the stance phase, a shorter swing phase, a greater period of double support, and a greater magnitude and rate of rearfoot eversion. Obese individuals have significantly greater rearfoot motion (a greater total eversion range of motion, faster maximum eversion velocity, and greater forefoot abduction) [
5]. Overweight and obesity are associated with musculoskeletal structure changes, decreased mobility, modification of the gait pattern, and changes in the absolute and relative energy expenditures for a given activity [
6]. Although research has indicated that obesity is associated with reduced muscular strength, impaired postural control, and altered limb mechanics during walking and rising from a chair, it is unclear whether these effects are the consequence of a greater body mass, physical inactivity, altered limb anthropometry, or metabolic disturbances arising from adiposity [
7].
Recent research involving overweight and obese individuals has demonstrated that plantar pressure is moderately dependent on body mass [
7-
10]. The feet are more loaded in cases of an increased body mass index (BMI; calculated as the weight in kilograms divided by the square of the height in meters) and increasing plantar pressures [
8-
22]. Obesity changes the plantar pressure distribution (PPD). Studies have shown that obese individuals had higher plantar pressures, particularly under the longitudinal arch in the midfoot [
10,
11,
15-
19,
23,
24] and on the metatarsal heads and in the forefoot [
9,
20-
24] during standing and walking [
23]. There is evidence regarding the higher plantar pressures in other regions (the rearfoot and toe regions) [
10,
15]. In this study, we selected absolute and relative plantar pressure parameters (PPPs) to characterize PPD in more detail than has been reported in current studies. The aim of this study was to investigate the PPD during walking in women with different BMI levels.
Methods
Participants
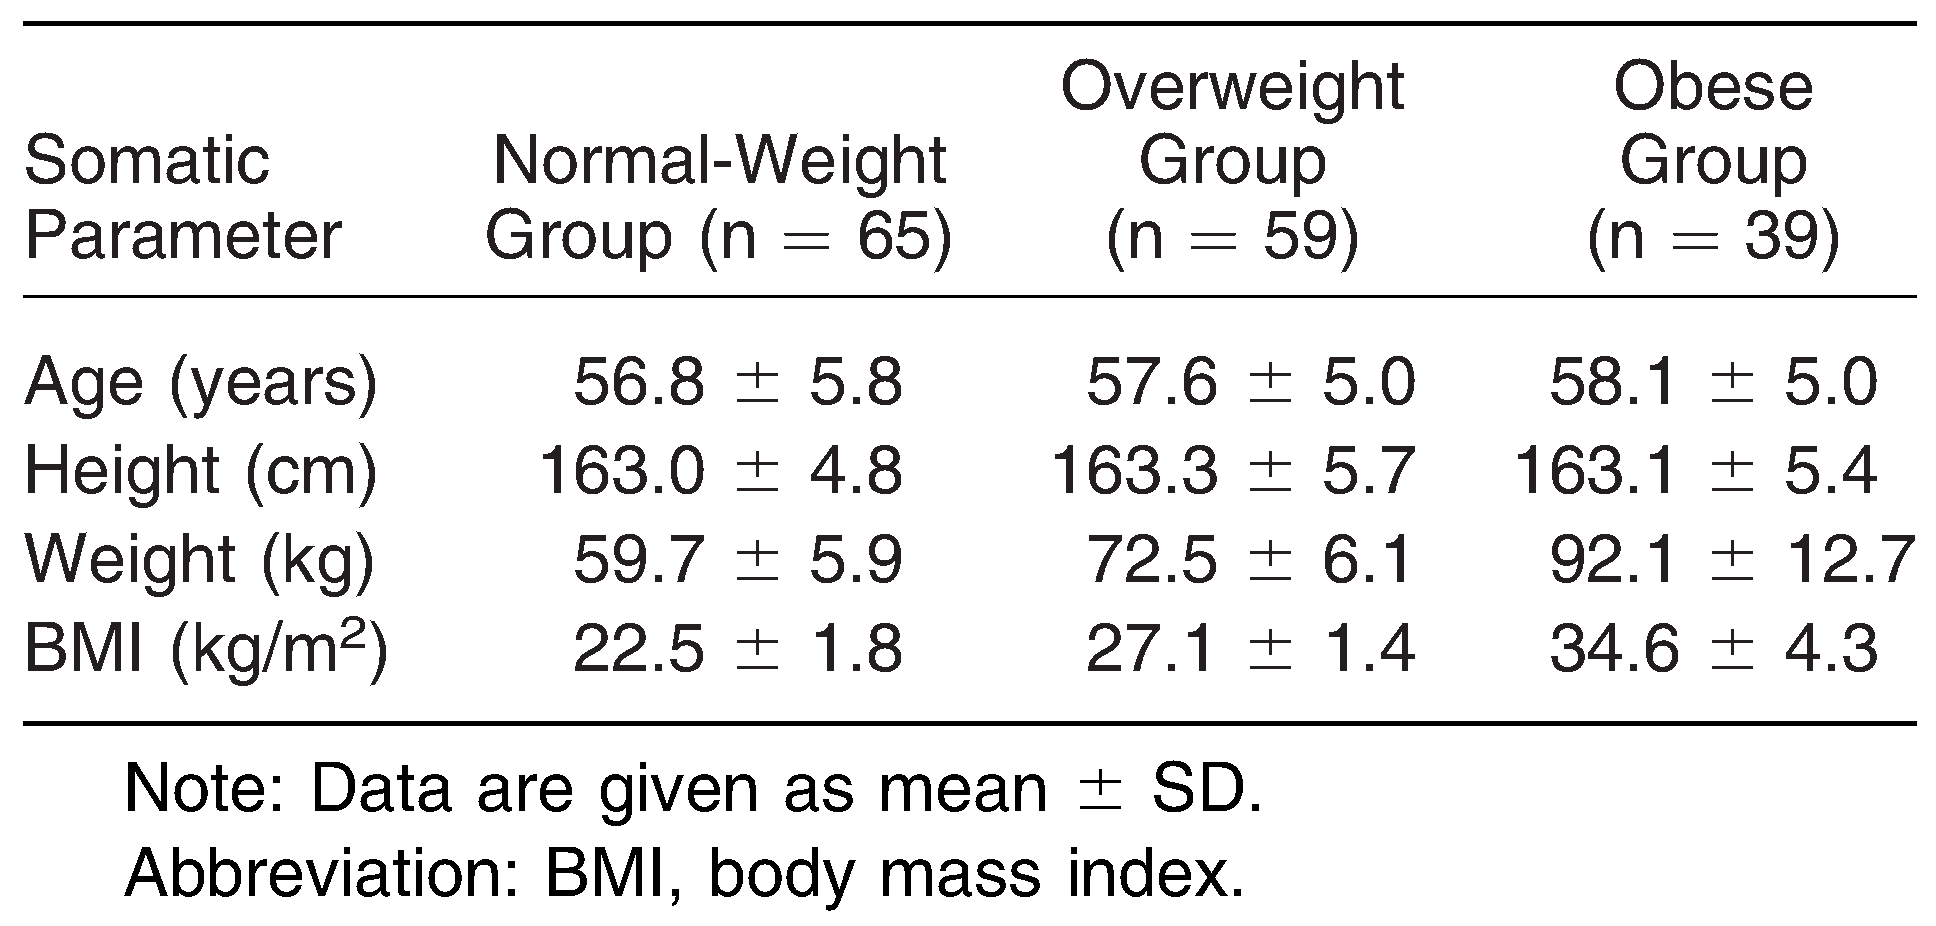
The study sample comprised 163 Czech women (mean ± SD: age, 57.4 ± 5.3 years; height, 163.1 ± 5.2 cm; mass, 72.0 ± 14.9 kg; and BMI, 27.0 ± 5.3). The criterion for participation was an age of 45 to 65 years (
Table 1). The 163 participants were informed regarding the purpose of this study and provided written informed consent before participation in the research process. This study was approved by the institutional ethics committee of the Faculty of Physical Culture, Palacký University Olomouc, Czech Republic.
Table 1.
Basic Anthropometric Parameters in the Various BMI Groups
Table 1.
Basic Anthropometric Parameters in the Various BMI Groups
Data Collection
The participants underwent basic anthropometric measurements of body mass and body height with a digital medical scale with a stadiometer (InBody BSM370; BioSpace, Seoul, South Korea). The BMI was calculated and classified in agreement with the following World Health Organization standards: normal weight (<24.9), overweight (<29.9), and obese (<34.9) [
12].
Gait Analysis
Plantar pressure was recorded with a 125-Hz frequency using a Footscan 2-m pressure measurement system (RSscan International, Olen, Belgium). Patients performed six trials of barefoot walking along an 8-m walkway at a self-selected speed. The first two trials were excluded from the analyses to enable the participants to become familiar with the experimental environment. The initiation and termination of gait were eliminated by using the middle gait cycles. The data from both feet were processed and corrected in Footscan 7.97 software. From the pressure data, the following parameters were derived: contact percentage (defined as a ratio of the contact duration of a specific foot region/stance phase duration × 100%); absolute pressure impulse; relative pressure impulse (pressure impulse of the specific area/total pressure impulse × 100%); and peak pressure in ten regions of the foot (first toe, second through fifth toes, first metatarsal, second metatarsal, third metatarsal, fourth metatarsal, fifth metatarsal, midfoot, medial heel, and lateral heel).
Statistical Analysis
The normality of the data distribution was verified by the Kolmogorov-Smirnov test. For the descriptive statistical analysis of the basic data features, we used the measures of central tendency (mean) and the variability (standard deviation). A parametric statistical comparative method for comparison of the BMI group's one-way analysis of variance and the Tukey post hoc test (honestly significant difference) were used. The Pearson correlation coefficient was used to determine an association between the BMI and the pressure parameters in each foot region. A statistical significance level of 0.1% was used for all of the statistical analyses. The statistical processing was performed in Statistica, version 12 (Statistica, Tulsa, Oklahoma).
Results
Absolute Peak Pressure
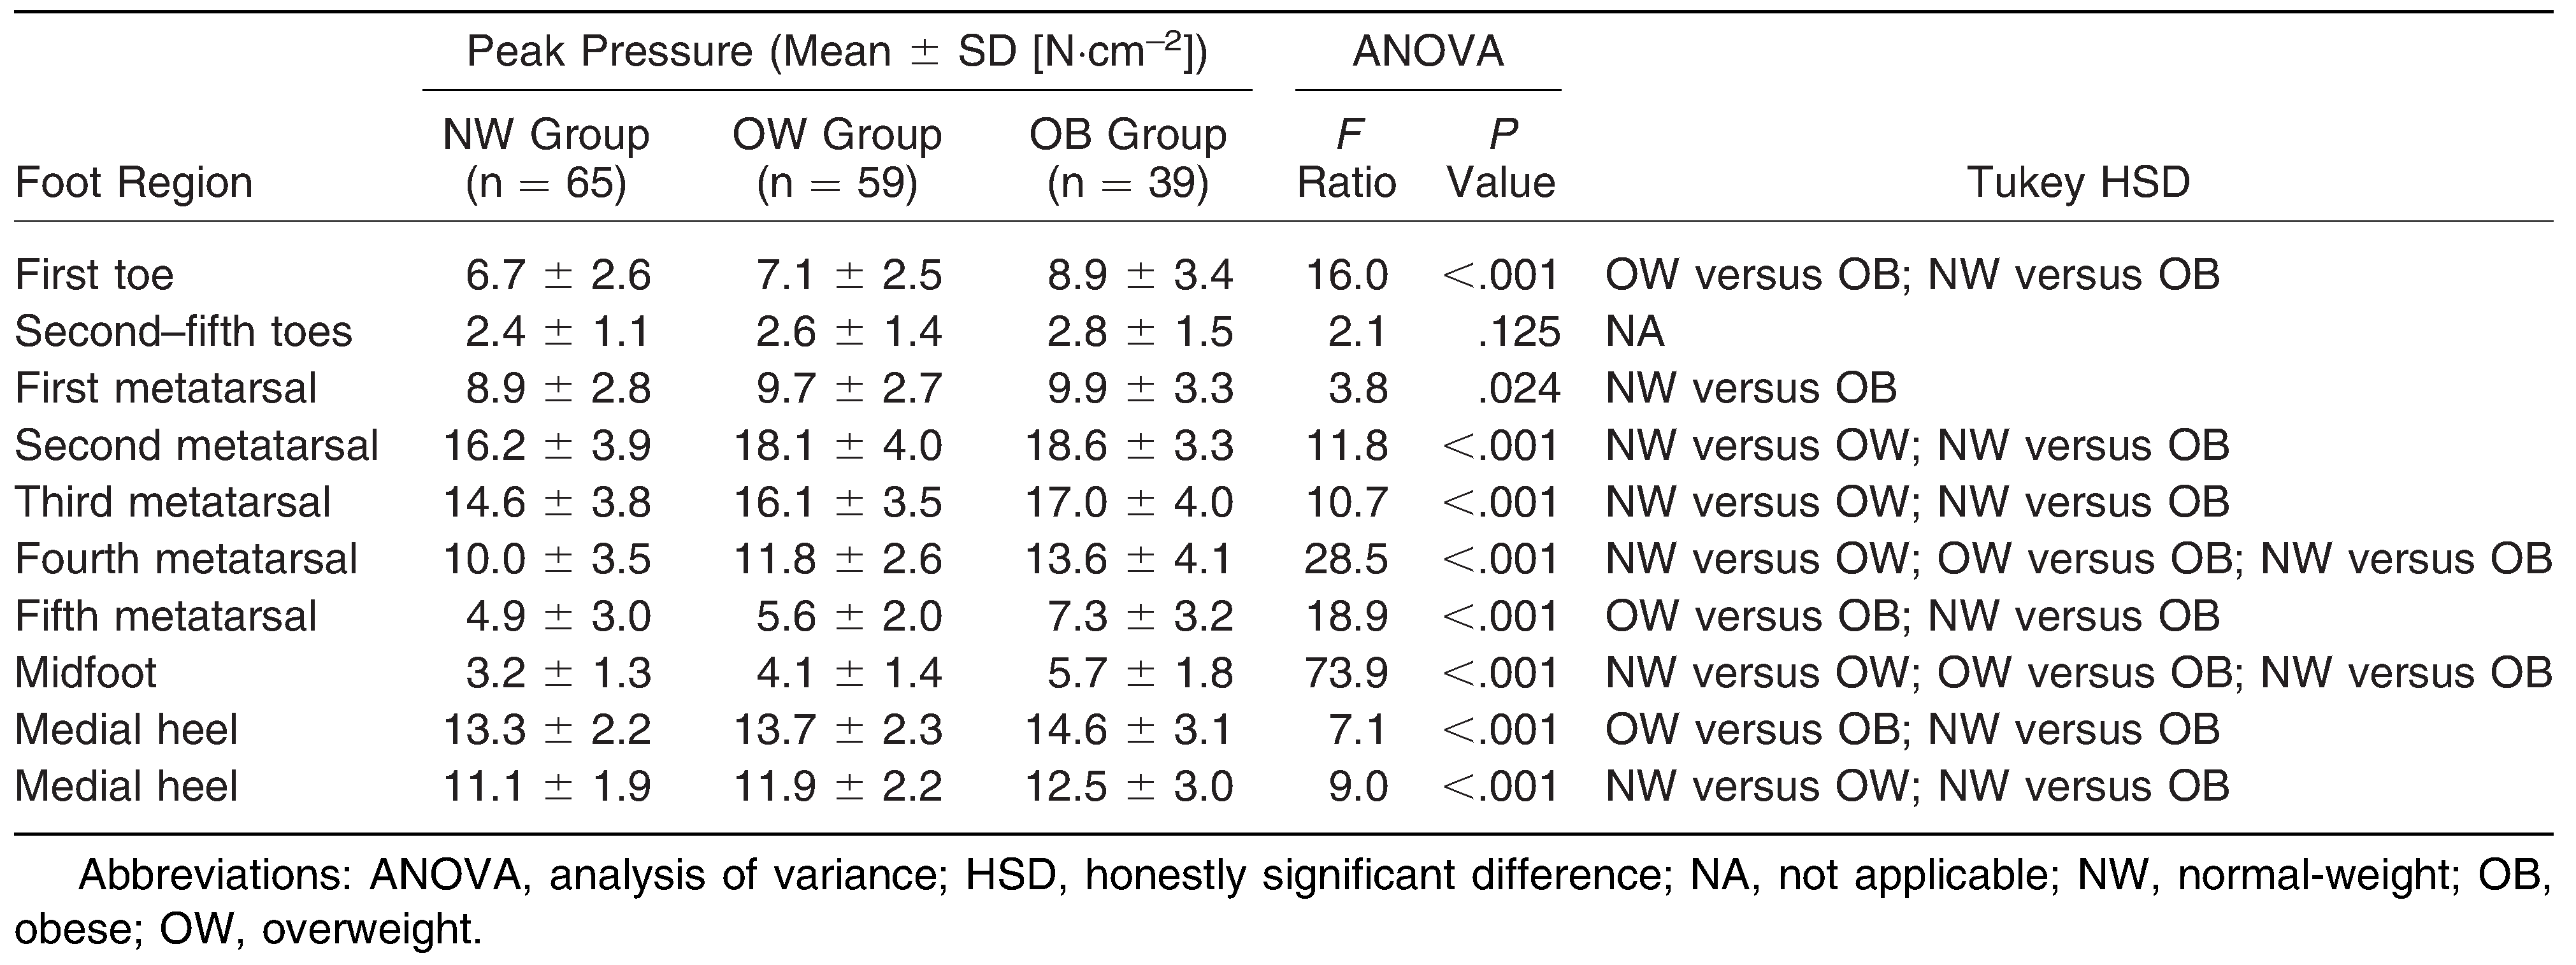
Significant between-group differences in the mean peak pressure values appeared in all of the foot regions except the second through fifth toes (
P < .05 for the first metatarsal;
P < .001 for the other areas) (
Table 2). The mean peak pressure values had a tendency to increase in all of the foot regions. Significant between-group differences (between all of the groups with each other) in peak pressure were observed in the fourth metatarsal and midfoot regions (
P < .001). Significant differences in the parameter between the normal-weight and overweight participants and between the overweight and obese participants were found in the second metatarsal, third metatarsal, and heel lateral regions (
P < .001). In comparisons between the normal-weight and obese participants and between the overweight and obese participants, significant differences were found in the first toe, fifth metatarsal, and medial heel regions (
P < .001) (
Table 2). The first metatarsal region showed a significant difference between the normal-weight and obese groups only.
Table 2.
Peak Pressure on the Foot in Various Body Mass Index Groups
Table 2.
Peak Pressure on the Foot in Various Body Mass Index Groups
Contact Percentage
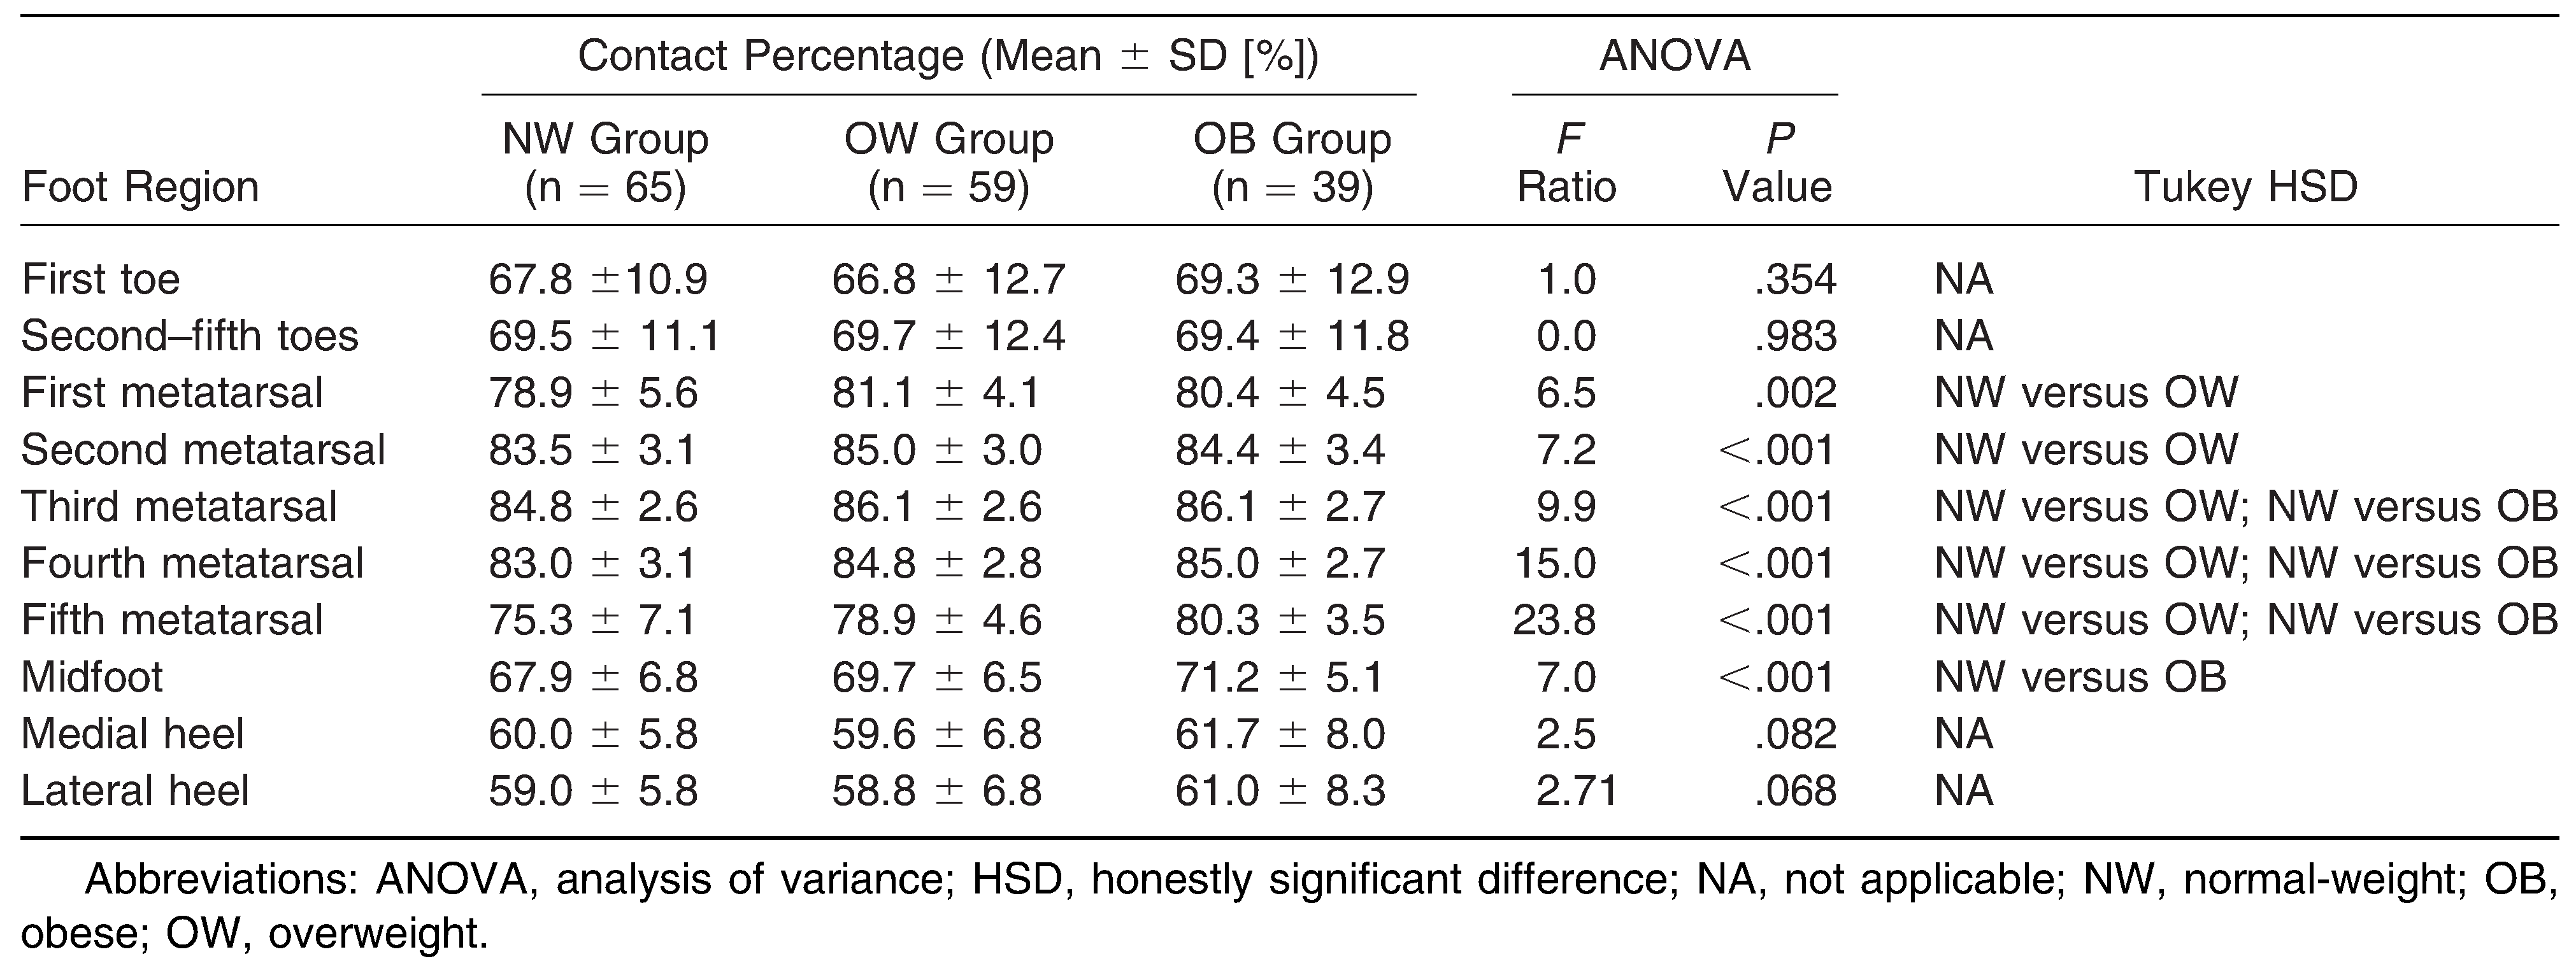
Significant between-group differences in the mean values of contact percentage were found in the second metatarsal, third metatarsal, fourth metatarsal, and fifth metatarsal regions (
P < .001) and in the first metatarsal and midfoot regions (
P < .01) (
Table 3). The mean values of the contact percentage differ the most considerably in the midfoot, fourth metatarsal, and fifth metatarsal regions, where impulses are increased with the BMI.
Table 3.
Contact Percentage on the Foot in Various Body Mass Index Groups
Table 3.
Contact Percentage on the Foot in Various Body Mass Index Groups
Absolute Pressure Impulse
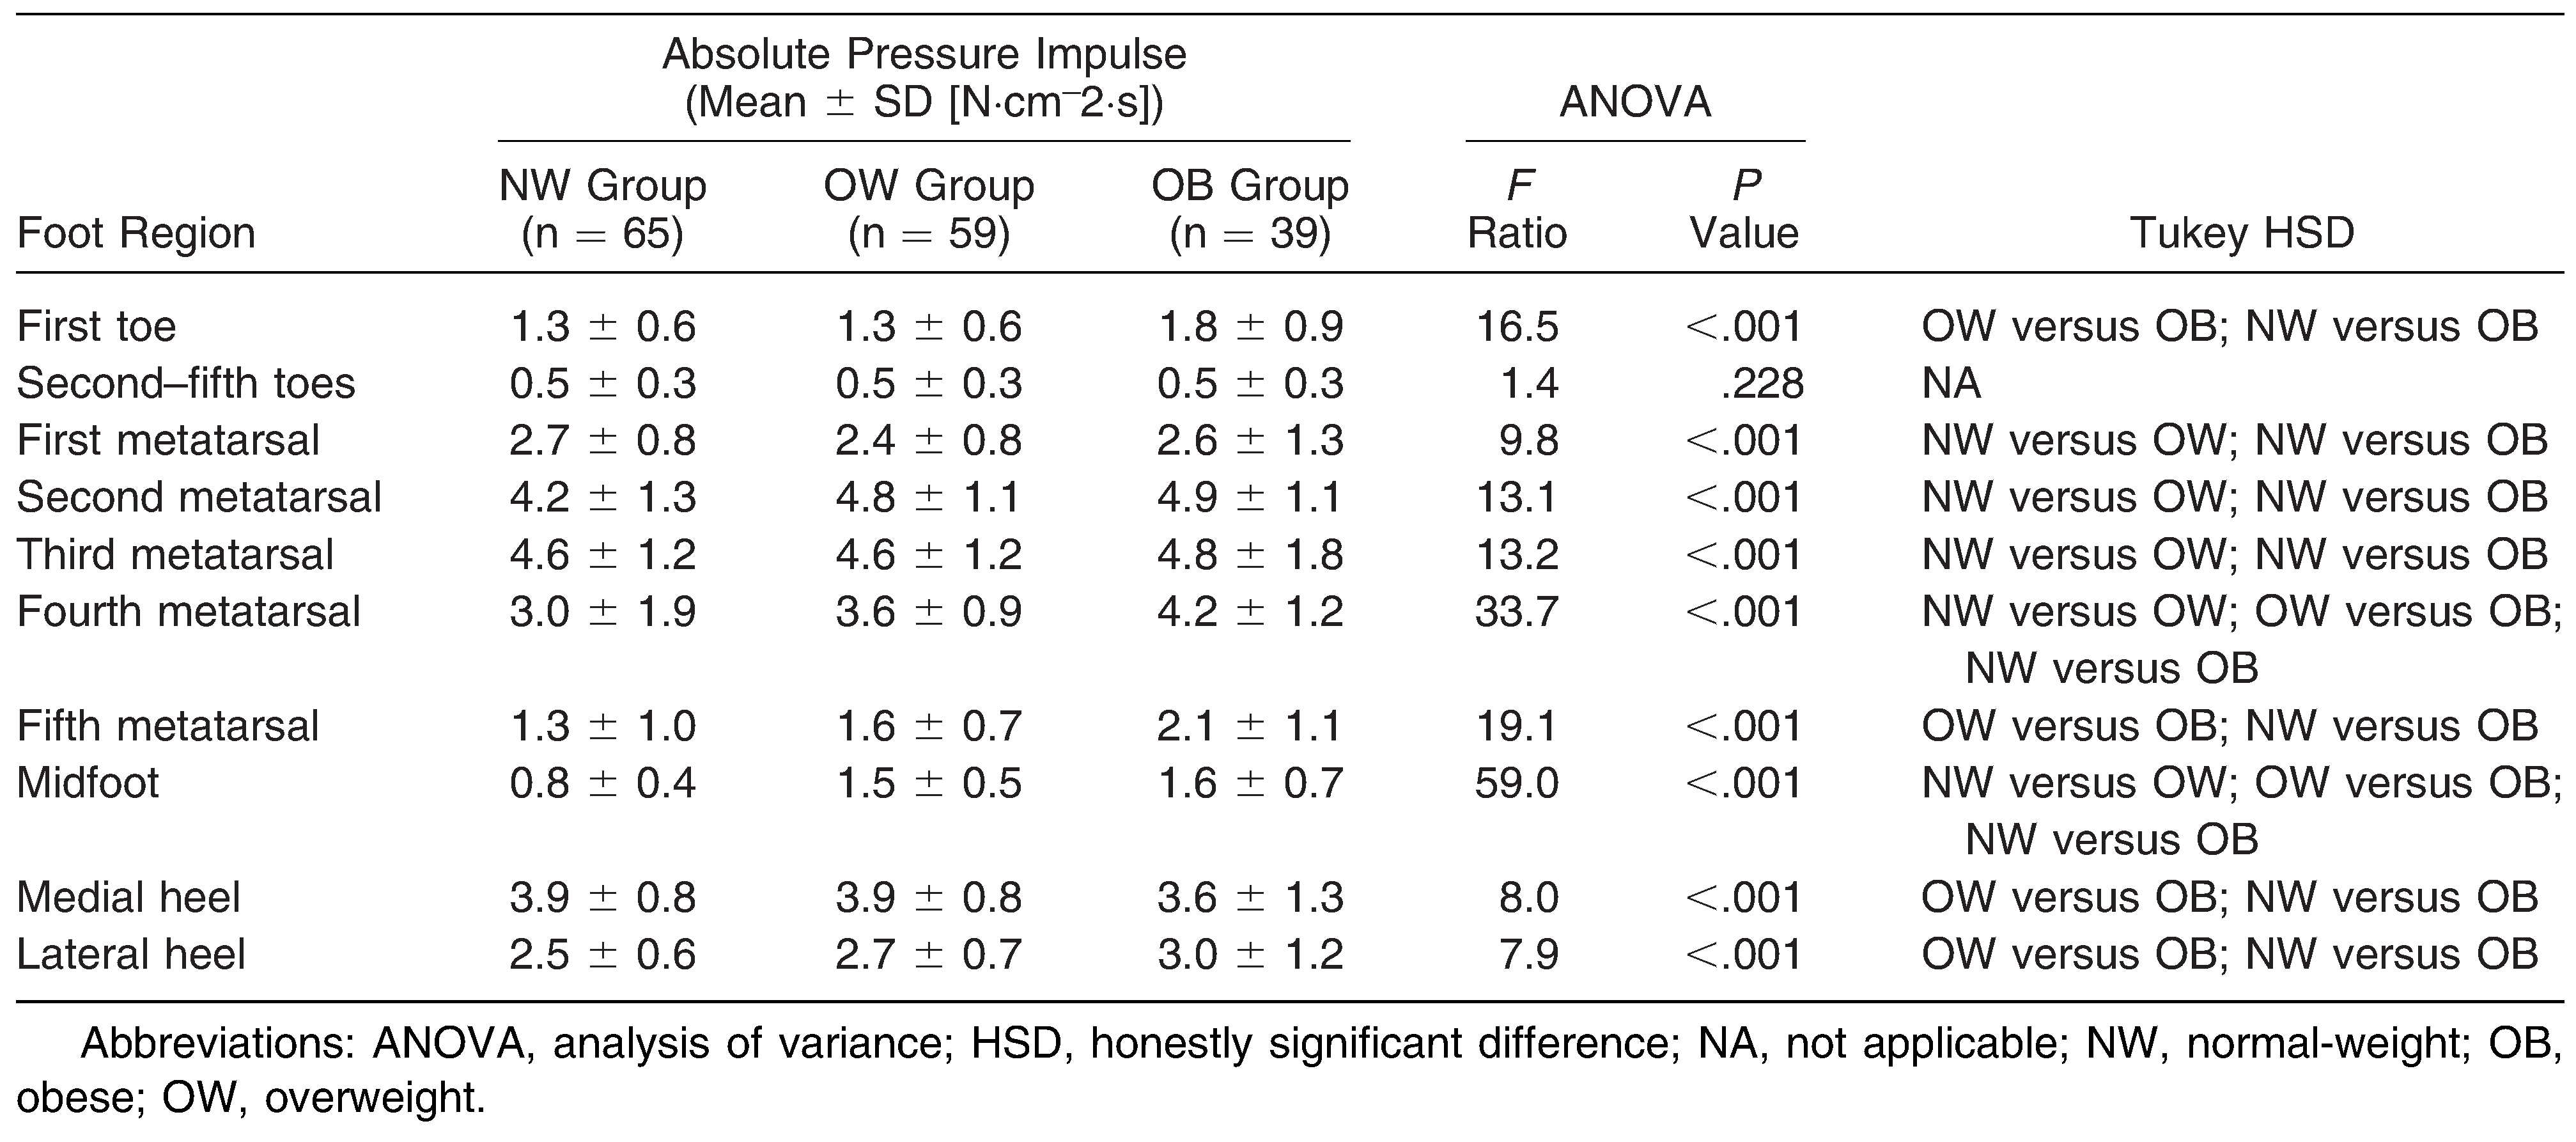
Significant between-group differences in the mean pressure impulse values were demonstrated in all of the foot regions except the second through fifth toes region (
P < .001) (
Table 4). Significant differences between all of the groups with each other were noted in the fourth metatarsal and midfoot regions (
P < .001). In all of the significant cases except the first metatarsal region, the impulses were higher for obese participants compared with normal-weight participants (
Table 4).
Table 4.
Absolute Pressure Impulse on the Foot in Various Body Mass Index Groups
Table 4.
Absolute Pressure Impulse on the Foot in Various Body Mass Index Groups
Relative Pressure Impulse
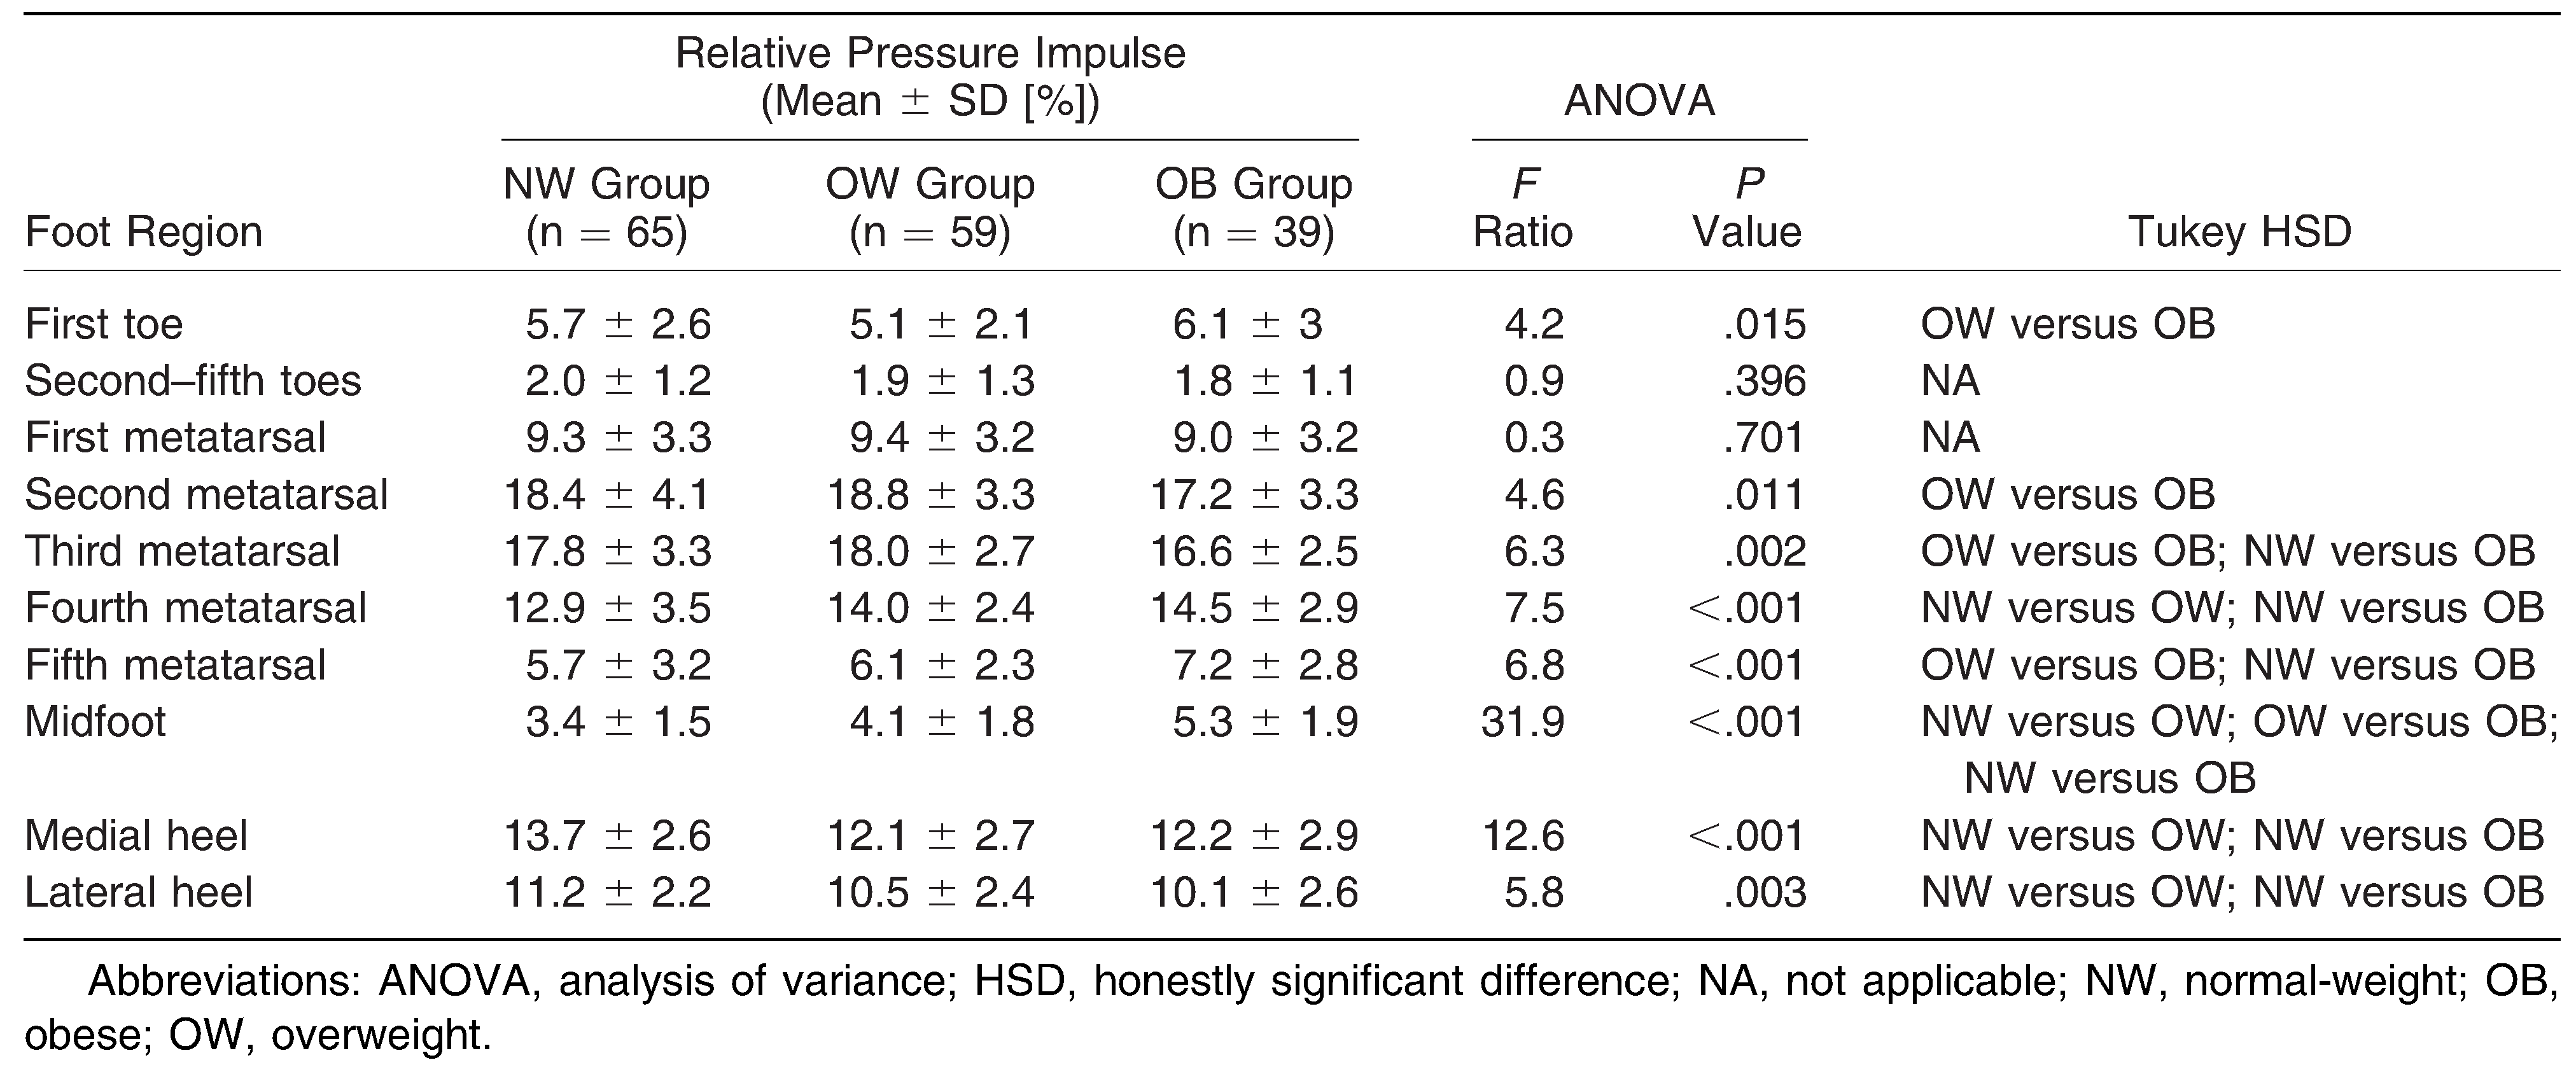
Statistically significant between-group differences in the mean relative impulse values were recorded in all regions except the second through fifth toes and first metatarsal regions (
Table 5). Values were significantly higher in obese participants compared with normal-weight participants for the first toe, fourth metatarsal, fifth metatarsal, and midfoot and significantly lower for the second metatarsal, third metatarsal, and heel regions.
Table 5.
Relative Pressure Impulse on the Foot in Body Mass Index Groups
Table 5.
Relative Pressure Impulse on the Foot in Body Mass Index Groups
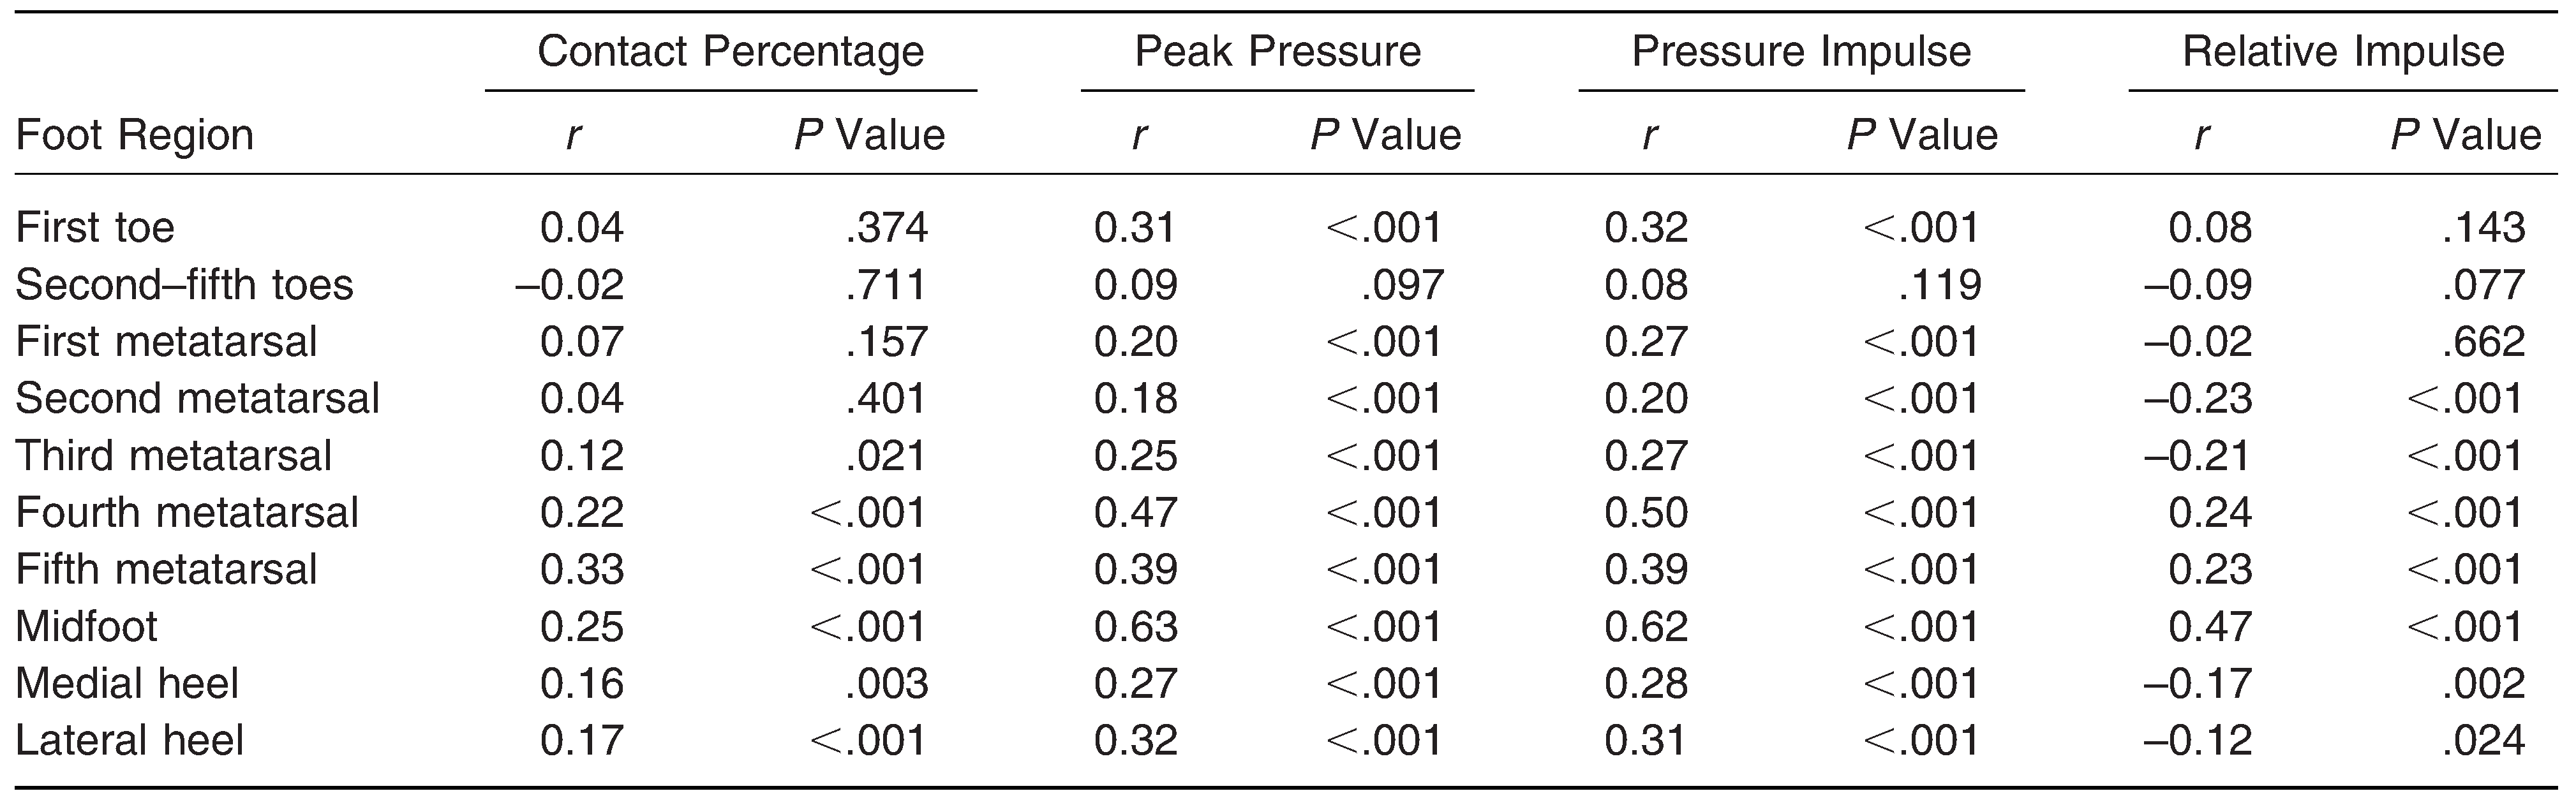
Comparison of groups of normal-weight, overweight, and obese individuals was completed by correlation analysis. Significant correlations were found for all of the variables (
Table 6). Most of the findings derived from the correlation analysis confirm the findings derived from the group comparison.
Table 6.
Correlations Between the Body Mass Index and the Plantar Pressure Parameters
Table 6.
Correlations Between the Body Mass Index and the Plantar Pressure Parameters
Discussion
This study was similar to other studies in that it showed that the BMI influences the peak pressure in two aspects. The first aspect is that increased body mass increases the peak pressure. In agreement with this finding are the results of authors who found that obesity is a significant predictor of larger peak pressures (
P < .01 to < .05) [
8]. Significant differences were found in the peak pressure between those with a normal BMI and overweight/obese participants (
P < .05) [
13]. The correlation coefficient between the two variables indicated that 13.8% of the variance in the mean peak pressure was accounted for by the body mass (
r = 0.37) [
25]. The second aspect of the BMI influence on the PPPs is the specific and varied distribution of the peak pressure in the foot regions.
Regarding absolute pressures, the present study showed excessive loading (peak pressure) on the whole foot except for the second through fifth toes region. The study by Birtane and Tuna [
11] found a significant difference in peak pressure between obese and normal-weight individuals for the midfoot only, but sample sizes were relatively small (25 obese and 25 normal-weight participants). Closer to the present results were findings from Hills et al [
9]. They found significantly higher pressure values in all of the foot areas except the first metatarsal in obese men and in all of the metatarsals and the midfoot in obese women compared with a normal-weight population. No difference on the heel could be explained by a relative decrease of peak pressure in the heel area of obese individuals, which is apparent from the present study.
Some studies used a different approach for determination of mass effect. Arnold et al [
10] examined peak pressure in young adults (mean ± SD age, 21.73 ± 3.36 years) with additional load (+0 kg, +10 kg, +15 kg). All of the foot regions displayed a mean increase in peak pressure with each load condition except the heel and second through fifth toes regions, which showed a mean decrease in peak pressure between the +10-kg and +15-kg load conditions. The second through fifth metatarsal and heel regions displayed a higher level of sensitivity to increases in body mass compared with the other plantar regions when the pressure was measured [
10]. No significant effect of BMI in the second through fifth toes region in the present study confirm this statement for this specific area. A similar approach was used in other studies [
9,
22]. When additional load was used, increased mass resulted in significant increases in the peak pressure on the metatarsal heads, the heel, and the midfoot for each incremental increase in weight (baseline versus 9.1 kg,
P < .05; and 9.1 kg versus 18.2 kg,
P < .05) [
22].
If a reduction in body weight is observed, the opposite effect can be expected. A study focused on the effect of weight loss (>5 kg) [
15] on the PPD in 41 obese individuals (mean ± SD age, 56.2 ± 4.7 years; mean ± SD BMI, 35.9 ± 4.2) after the 3-month intervention showed a significantly reduced peak pressure beneath the lateral arch and fourth metatarsal regions. A 6-month intervention showed a change in the peak pressure in the second metatarsal, third metatarsal, and medial arch regions that was significantly correlated with changes in weight.
The effect of body mass on peak pressures was also confirmed in the scientific literature by observations of correlations. Significant relationships between BMI and plantar pressures have been found especially for the midfoot [
11] but also for the metatarsals and the toes [
21]. In the present study, significant correlations were found for peak pressure and pressure impulse in all foot regions except the second through fifth toes. It confirms the results derived from comparison of normal-weight and obese individuals.
Other PPPs included in this study have not been sufficiently described in the scientific literature focused on the effect of obesity on plantar pressures. Contact duration in various areas can provide information about the time aspect of loading. The pressure impulse (sometimes called the time-pressure integral) expresses the total loading of the foot. Its value is influenced by both peak pressure and contact duration; however, a study by Keijsers et al [
26] showed that there is a high degree of linear dependence among peak pressure and pressure impulse. The present results support this statement because significant differences in pressure impulse were found at almost the same regions as for peak pressure. Other studies assess pressure impulse in the whole foot. Individuals with obesity had higher pressure impulse compared with normal-weight individuals (
P = .009) [
27]. Scientific studies in children showed higher absolute pressure impulse in obese children compared with normal-weight children in the midfoot and lateral metatarsal regions [
27-
29]. For other regions, the results are not uniform. Possible reasons for differences between previous studies and the present study may include division of the foot into various regions and different ages of the observed groups.
The relative pressure impulse shows loading in a selected foot region in relation to the whole foot. This approach has not yet been discussed in the scientific literature that focuses on the effect of obesity on plantar pressure, and the number of studies for discussion is limited. In the present study, in obese or overweight participants compared with normal-weight participants, relative pressure impulse was greater in the fourth and fifth metatarsal, toe, and midfoot regions and smaller in the heel and second and third metatarsals. Similarly, significant positive correlations between BMI and pressure impulse were found in the midfoot and fourth and fifth metatarsals, and significant negative correlations were found in the second and third metatarsals and heel. These findings suggest that the effect of increased body mass is manifested more in the midfoot and the lateral part of the forefoot and less in the medial part of the foot. This statement explains why some studies did not find any difference in total loading of the heel between obese and normal-weight individuals [
28,
29]. Another relative variable was contact percentage. A significantly longer contact duration was found in the toe, lateral forefoot, and midfoot in the present study in women with a higher BMI. These results are similar in that greater loading of the midfoot suggests the decrease in the foot arch because if the foot arch is decreased, loading of the heel ends later and loading of the forefoot begins earlier.
A limitation of this study could be working with the subjective divisions of the foot regions in the Footscan software; to minimize the errors, only two researchers worked with the software, and they were trained by the same person. Distortion of the obesity results might occur in the obesity evaluation by BMI, which does not reflect the ratio of the body components and the total body mass.
Conclusions
This study reports the influence of BMI on the response of PPPs in detail. The relationship between an increased BMI and PPPs depended on the various foot regions. The strongest findings were recorded in peak pressure. The present results showed that a higher BMI increases the peak pressure and the total load in the whole foot except for the second through fifth toes region. Increased load and longer contact of the heel, midfoot, and central and lateral forefoot regions suggest a decreased foot arch in the obese participants. Assessment of the relative loading showed excessive loading of the lateral forefoot and midfoot in the area of the longitudinal arch, probably because of the rearfoot eversion to the medial site.