There are several accepted arthrometric measurements used by podiatric physicians in evaluating pathologic conditions of the foot and ankle. The most common and significant views for chronic foot pathologic conditions include the anteroposterior, dorsoplantar, and lateral views. These measurements are further subdivided into rearfoot and forefoot comparisons. Moreover, determining the osseous alignment of the rearfoot with respect to the forefoot is the most helpful indicator in determining foot stability and function.
The purpose of this study was to establish the talar–second metatarsal (T2M) angle as a standard measurement on an anteroposterior radiograph to determine the osseous alignment between forefoot and hindfoot. We sought to justify use of the anteroposterior T2M angle over the anteroposterior T1M angle. These data will then be useful to the clinician in determining an abnormal relationship between the hindfoot and forefoot as well as aiding the clinician in restoring the pathologic osseous alignment to its normal osseous alignment.
Materials and Methods
This study was reviewed and approved by Quorum Review Institutional Review Board (Seattle, Washington). Seventy feet in 35 participants (12 men and 23 nonpregnant women) were included in this study. Ages ranged from 32 to 78 years in men and from 27 to 71 years in women. Each participant was asked to sign the institutional review board–approved consent form for participating in the study. The inclusion criteria were the following: 1) at least 18 years of age; 2) flexible foot; 3) absence of degenerative osteoarticular disease, neuromuscular disorder, and congenital foot deformities; 4) absence of fracture; 5) no history of osseous foot surgery (except for the surgeries of the digits or phalanges because these procedures do not affect the T2M angle; and, 6) a metatarsus adductus angle of 15° or less.[
3]
Physical and biomechanical examinations were performed to assess flexible foot type, including calcaneal inversion/eversion, calcaneal valgus on weightbearing, and external/internal rotation of the tibia with resultant pronation and supination of the foot, demonstrating the flexibility of the foot complex on weightbearing. After these examinations, anteroposterior radiographs were taken in the angle and base of gait, having the participants stand in the neutral calcaneal stance position (the calcaneus parallel to the lower leg and the subtalar joint in neutral) and then in the resting calcaneal stance position (relaxed weightbearing position).[
4]
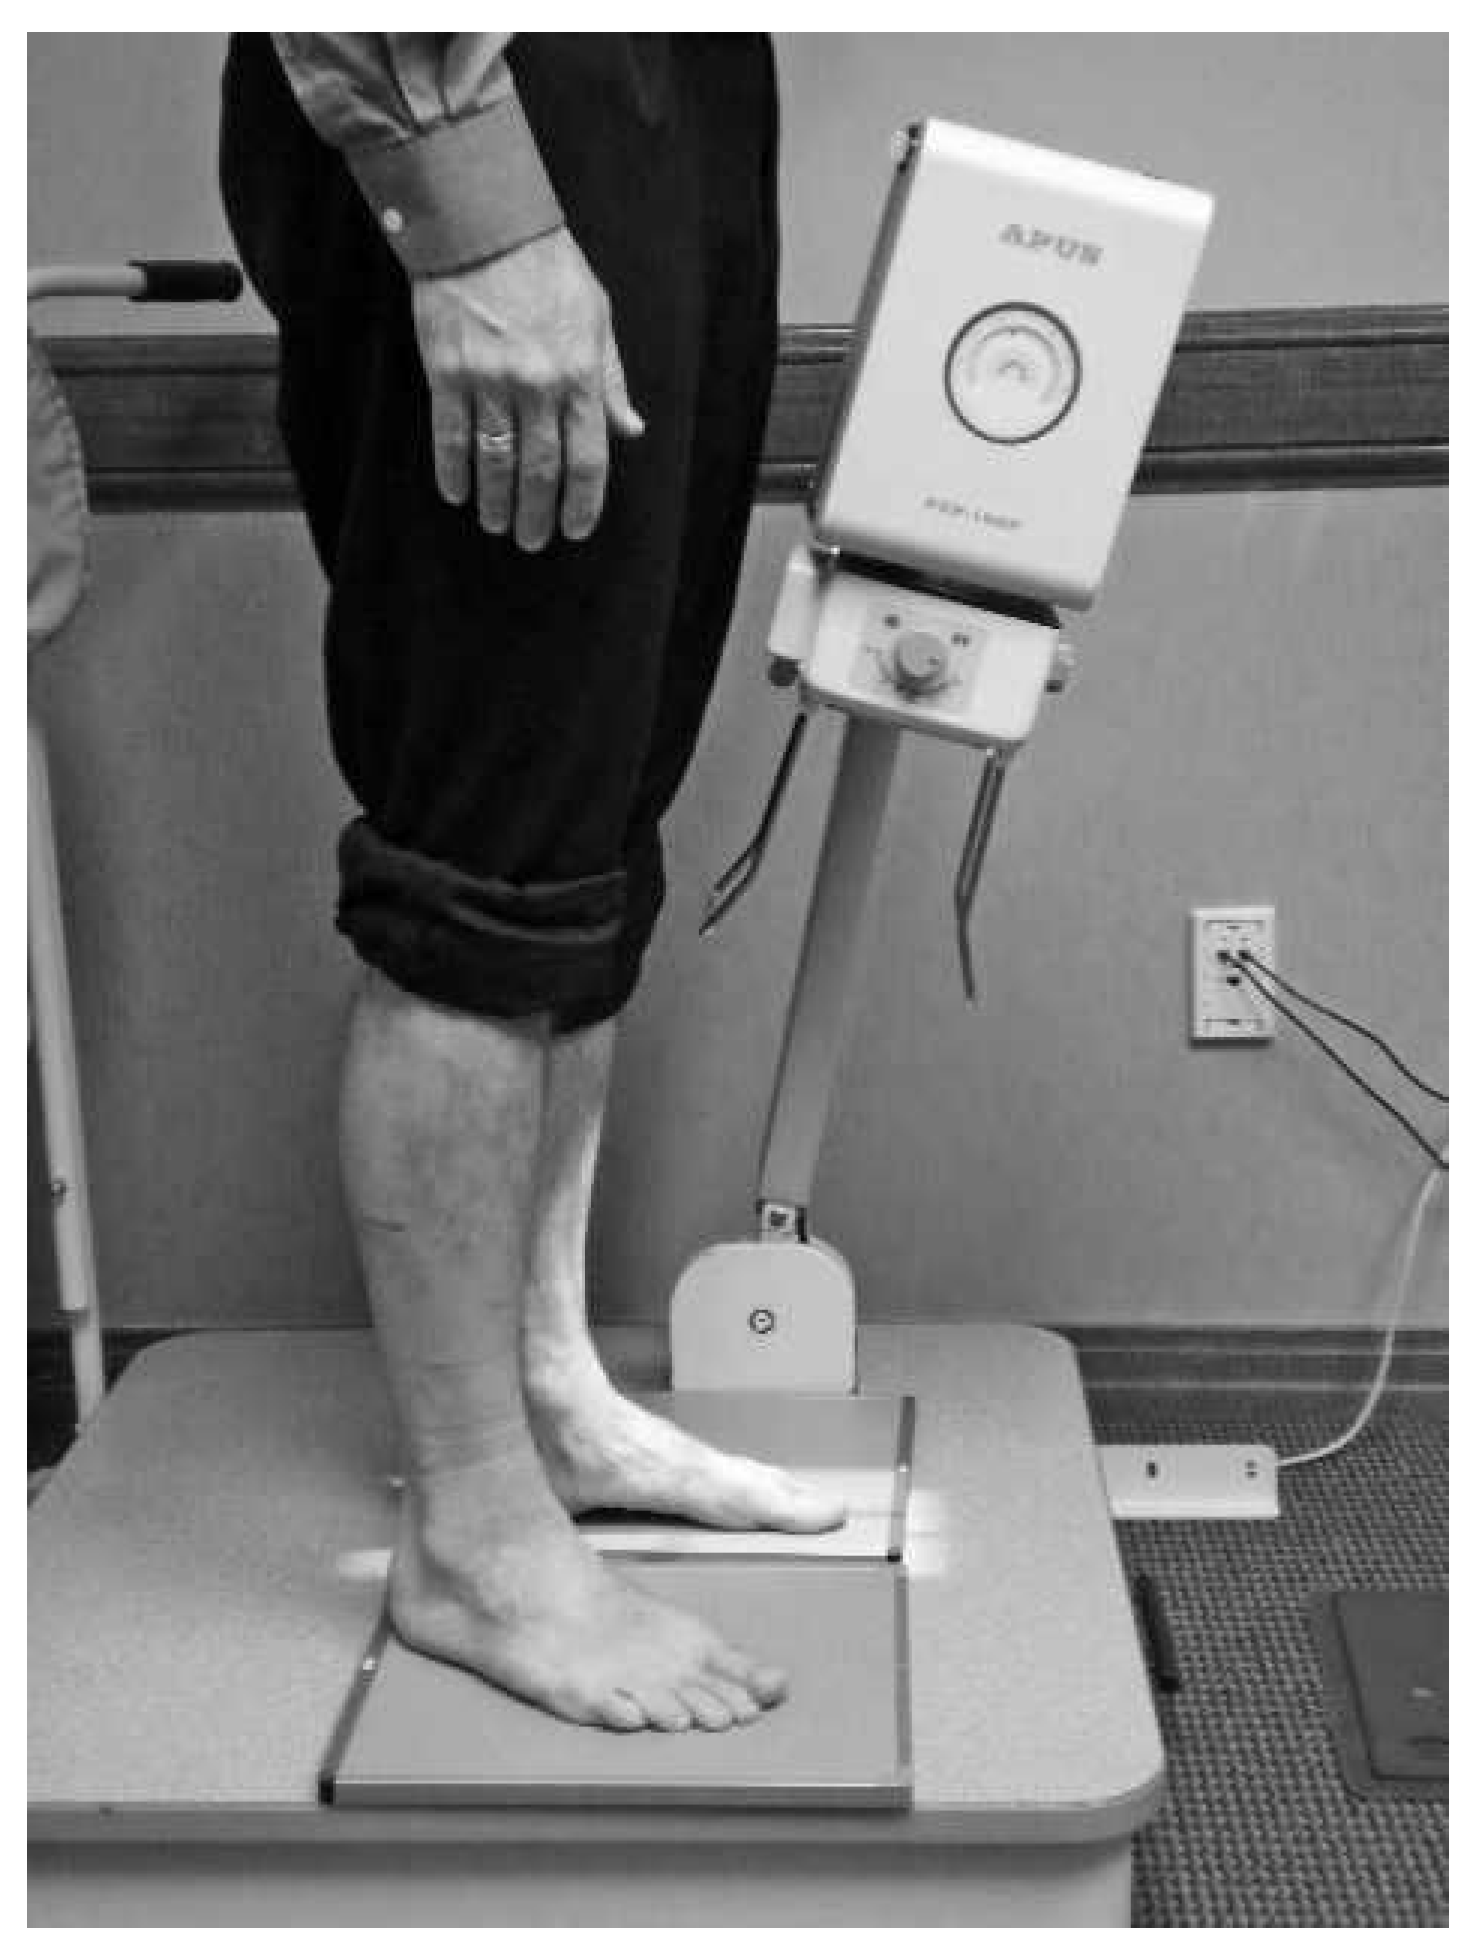
To take the radiographs in the anteroposterior view, the foot was positioned with the x-rays angled at 15° from vertical (
Fig. 1). Each radiograph was taken individually with the weightbearing foot while the contralateral limb was lifted off the surface and then placed on the ground again to allow the foot to adjust for intrinsic tibial torsion. Then the patient externally rotated the tibia while the examiner palpated the talonavicular joint for neutral positioning of the talar head in the navicular socket (the neutral calcaneal stance position). This was followed by radiographs taken in the resting calcaneal stance position.
Figure 1.
Positioning of the x-rays for anteroposterior radiographs of the foot in the neutral calcaneal stance position.
Figure 1.
Positioning of the x-rays for anteroposterior radiographs of the foot in the neutral calcaneal stance position.
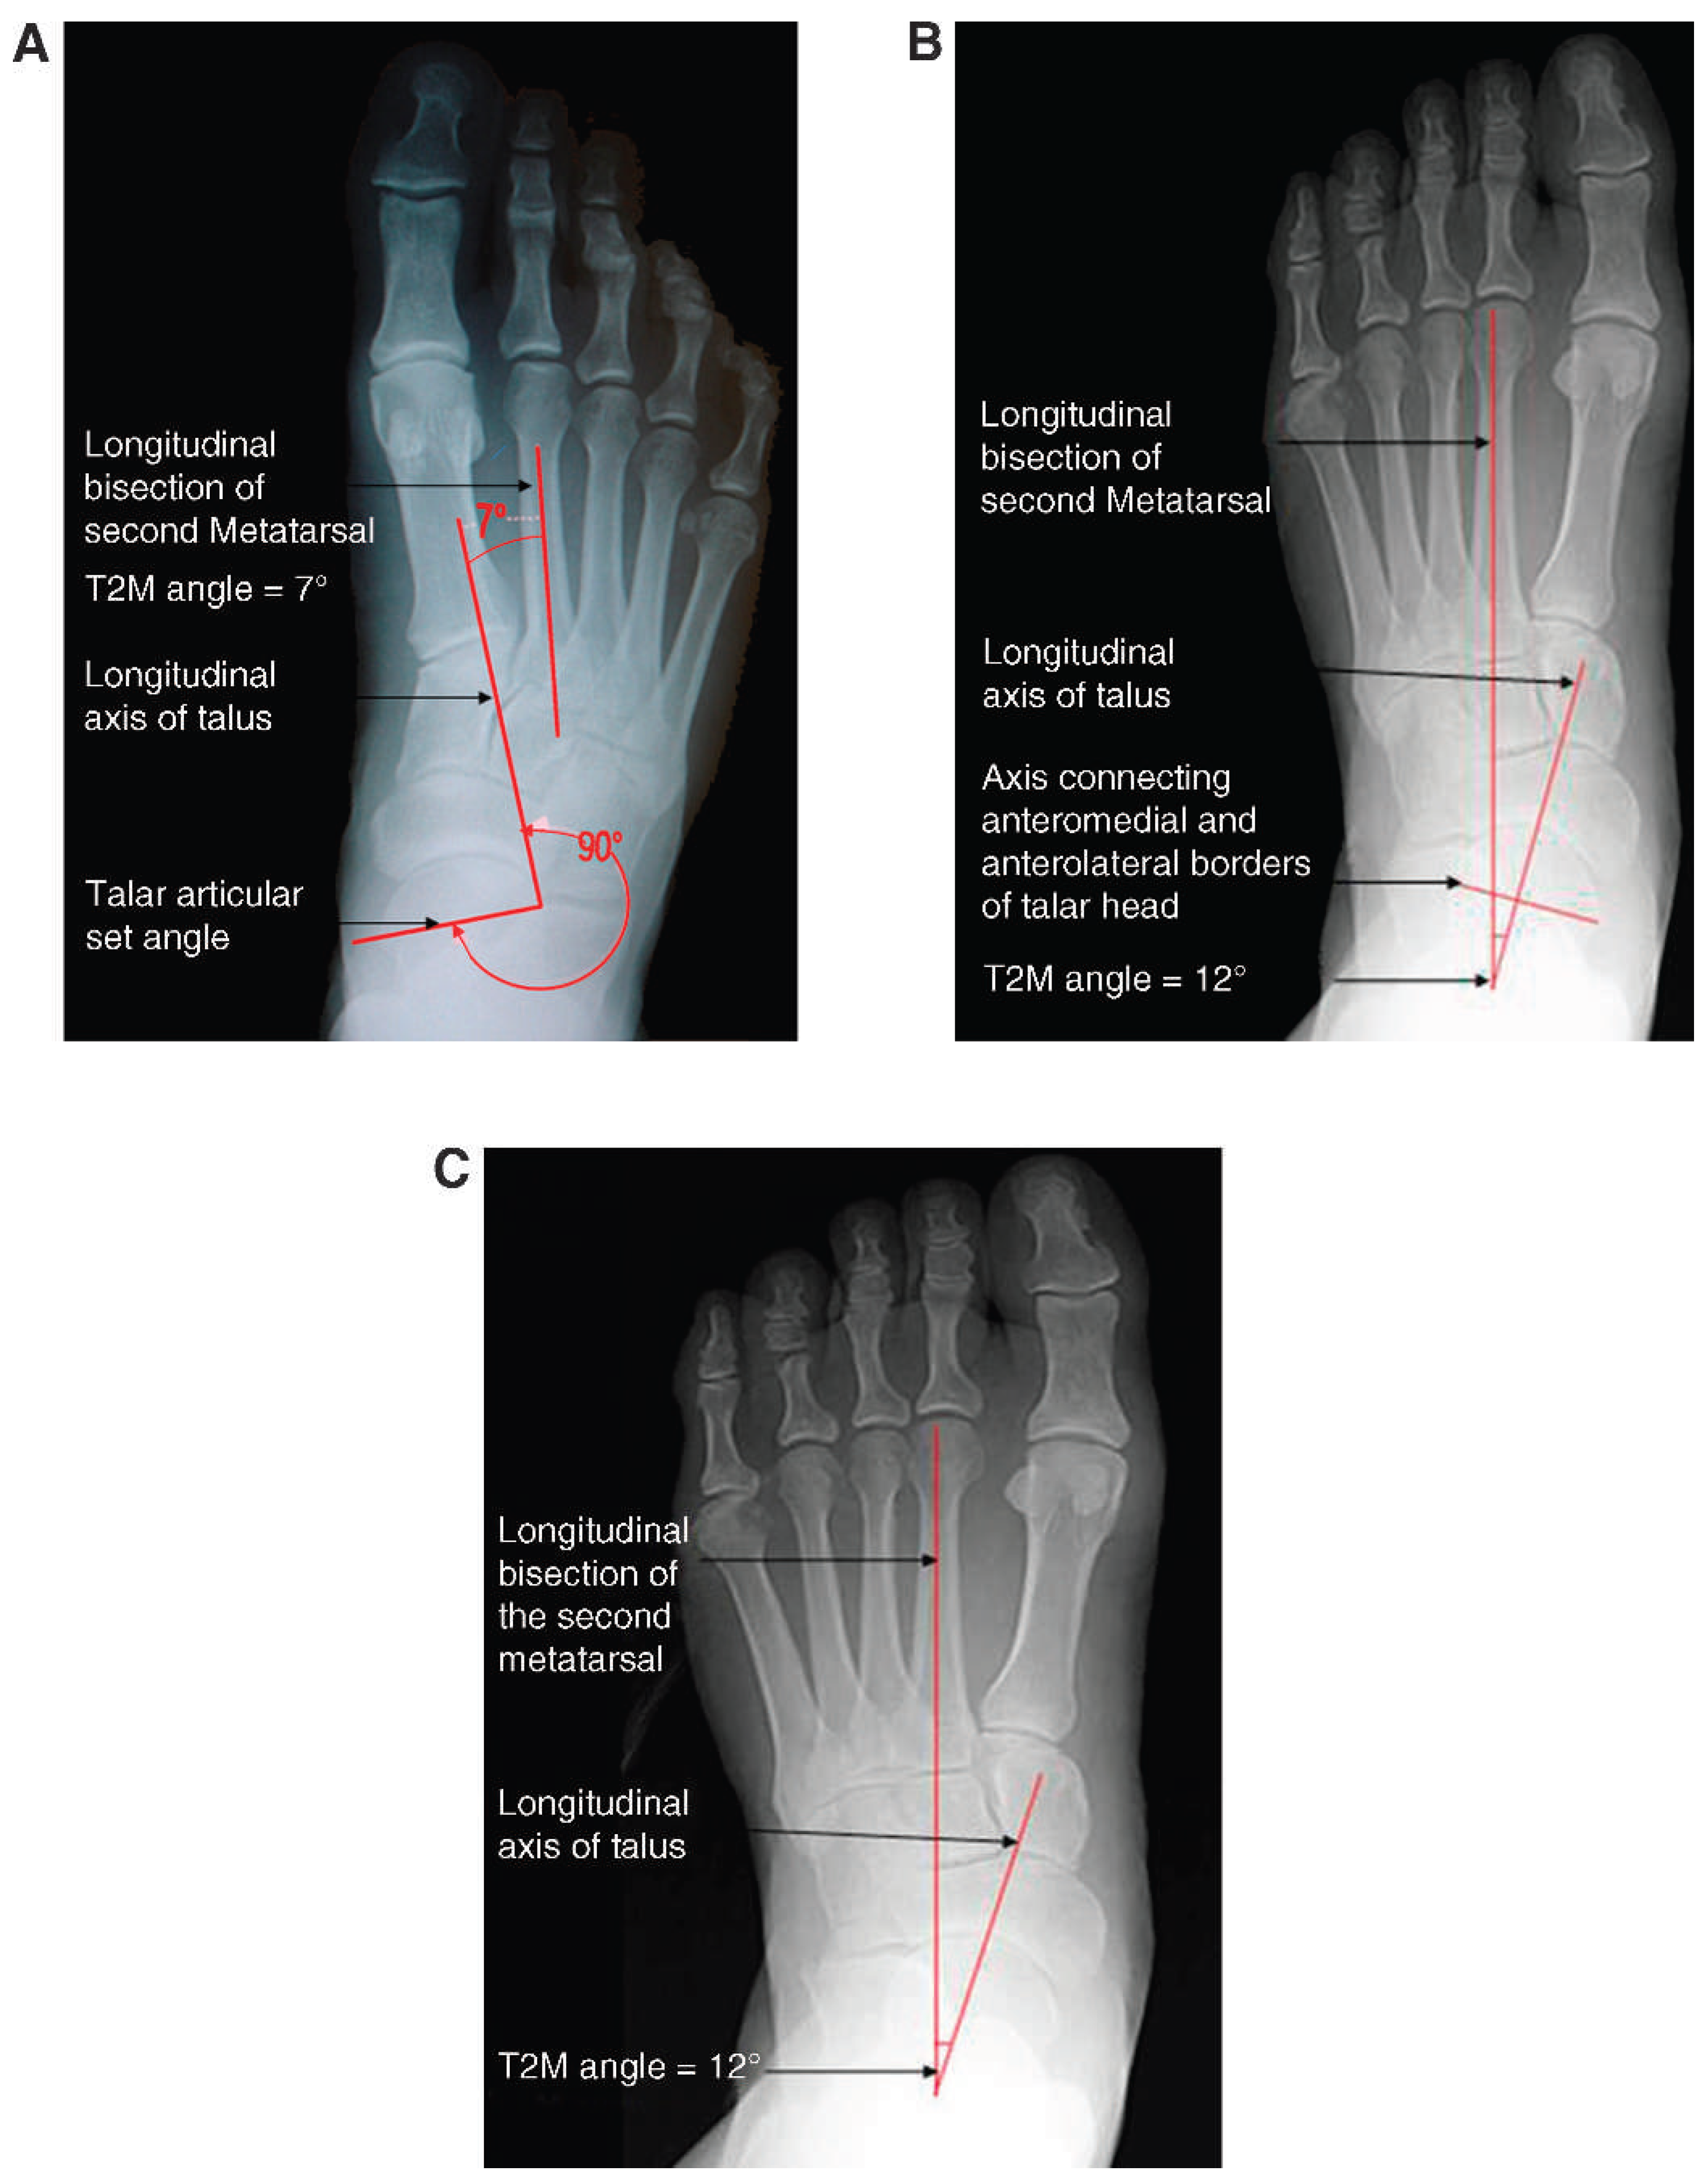
The radiographs were taken with an APUS podiatry x-ray machine (model PXP-15HF, (Poskom, Paju, Korea). The software used in this system was Onyx-RAD Orex QC (Viztek Inc, Garner, North Carolina). Three observers measured the T2M angles using three different methods. The first observer used Onyx-RAD Orex QC software and measured the angles using the longitudinal bisection of the second metatarsal and talar articular set angle (method 1) (
Fig. 2A). The talar articular set angle was created by the line joining the articulating borders of the talar head with the navicular and the perpendicular drawn to this line. The second observer used Surgimap Spine software and followed the method described by Thomas et al,[
5] ie, the angle was measured between the line perpendicular to a line connecting the anteromedial and anterolateral extremes of the talar head and the longitudinal bisection of the second metatarsal (method 2) (
Fig. 2B). The third observer also used Surgimap Spine software and considered the longitudinal bisection of the second metatarsal and the talus (method 3) (
Fig. 2C). The angle is considered positive if the axes diverge distally and negative if the axes converge distally.
Figure 2.
Talar–second metatarsal (T2M) angle measured in the neutral calcaneal stance position by using the longitudinal bisection of the second metatarsal and the talar articular set angle (A), the longitudinal bisection of the second metatarsal and the line perpendicular to a line connecting the anteromedial and anterolateral extremes of the talar head (B), and the longitudinal bisection of the second metatarsal and talus (C).
Figure 2.
Talar–second metatarsal (T2M) angle measured in the neutral calcaneal stance position by using the longitudinal bisection of the second metatarsal and the talar articular set angle (A), the longitudinal bisection of the second metatarsal and the line perpendicular to a line connecting the anteromedial and anterolateral extremes of the talar head (B), and the longitudinal bisection of the second metatarsal and talus (C).
Mean, standard deviation, median, and range of T2M values were calculated in the neutral and resting calcaneal stance positions. An unpaired
t test was used to compare the T2M angles in the neutral and resting calcaneal stance positions. Interrater reliability was evaluated by using the intraclass correlation coefficient (ICC) to estimate the correlation among the measurements obtained by the three observers using three slightly varying procedures.[
6,
7] In addition, Bland-Altman plots were used to analyze the agreement between the measurements made by the three observers.[
8]
Results
Table 1 presents the values for T2M angles in the neutral and resting calcaneal stance positions. The mean T2M angle in the neutral calcaneal stance position was 2.95° compared with 18.61° in the resting calcaneal stance position. Using SigmaStat 3.5, an unpaired
t test was performed for the T2M angles in the neutral and resting calcaneal stance positions, which resulted in significant differences between the angles (
P < .001).
Table 1.
Talar–Second Metatarsal Angle Measurements for 70 Feet (24 Male and 46 Female) in the NCSP and the RCSP.
Table 1.
Talar–Second Metatarsal Angle Measurements for 70 Feet (24 Male and 46 Female) in the NCSP and the RCSP.
The interrater reliability was evaluated with SPSS Statistics 17.0, by computing ICCs for the T2M angles measured by three observers in the neutral and resting calcaneal stance positions. The ICC values range from 0 to 1, where 0 indicates no agreement and 1 indicates complete agreement among the observers. The ICC values for the T2M angle were found to be 0.905 in the neutral calcaneal stance position and 0.937 in the resting calcaneal stance position. Both of the values indicate a very high correlation between the observers and excellent reliability among the measurements. One-way analysis of variance was performed to test the null hypothesis, which states that there were no statistically significant differences in T2M angular values measured by the three observers. It was found that there were no significant differences among the measurements made by the three observers in the neutral calcaneal stance position (P = .238) and the resting calcaneal stance position (P = .855); ie, the data can be accurately reproduced by different examiners.
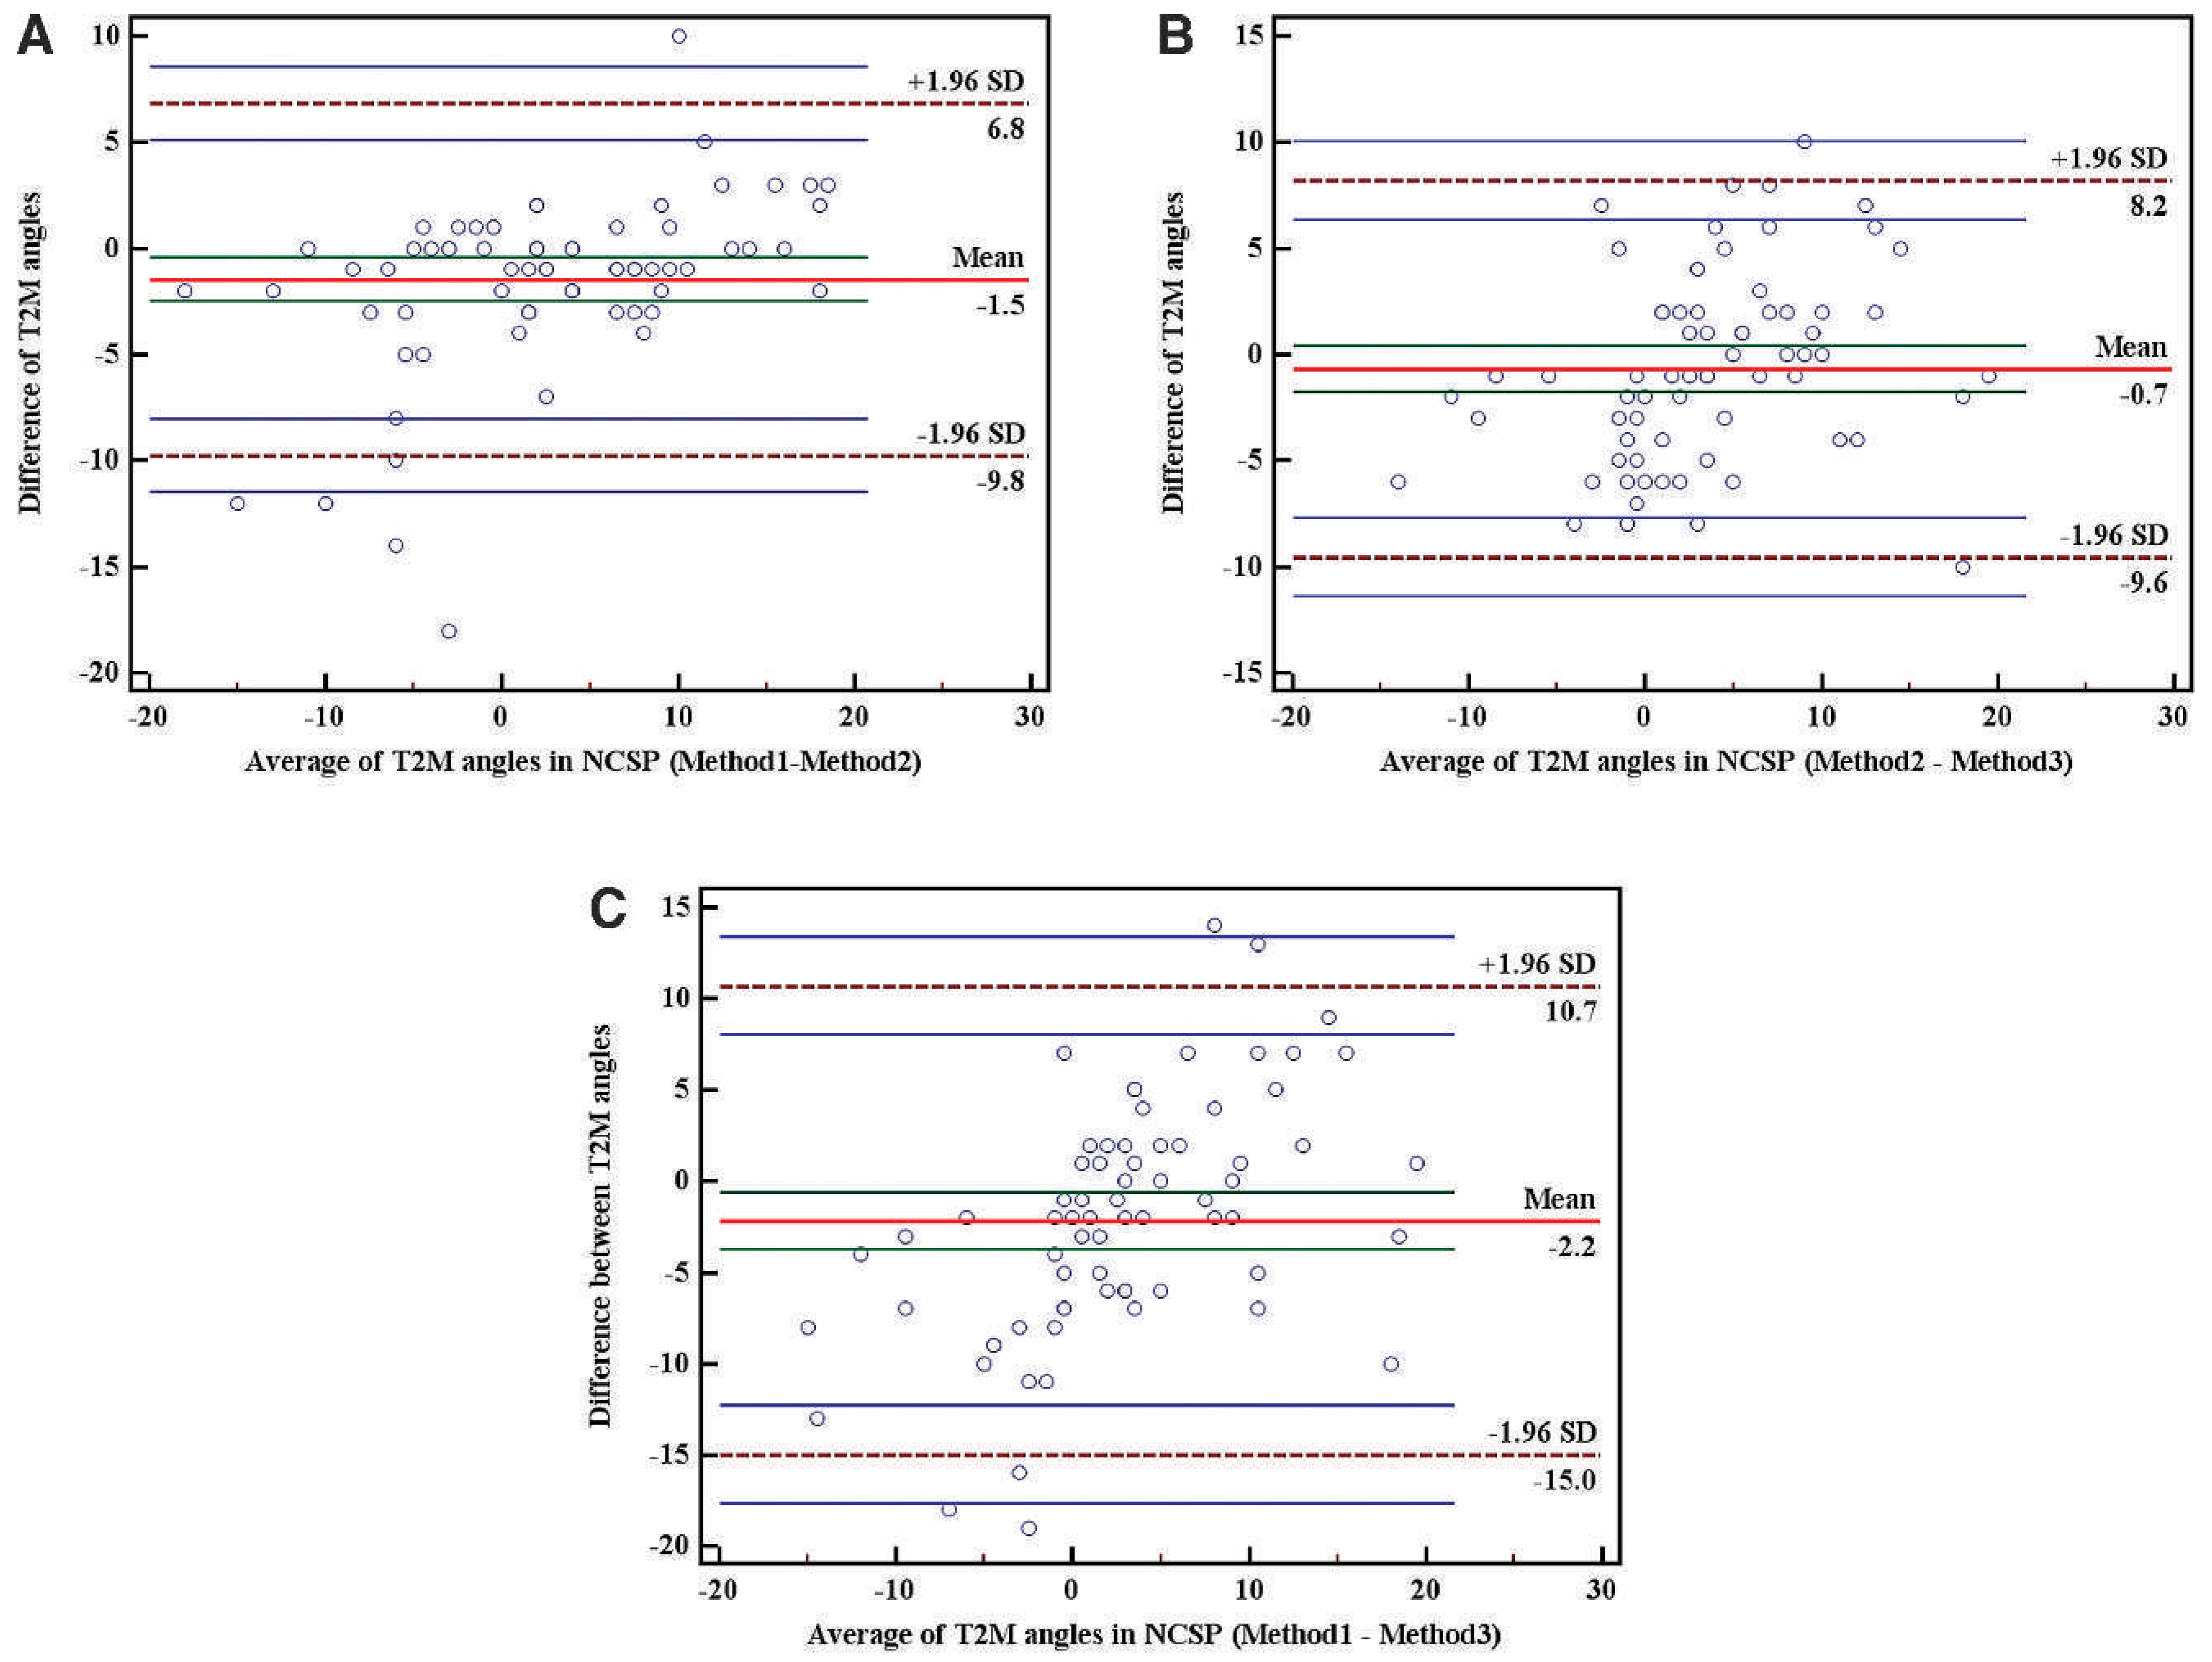
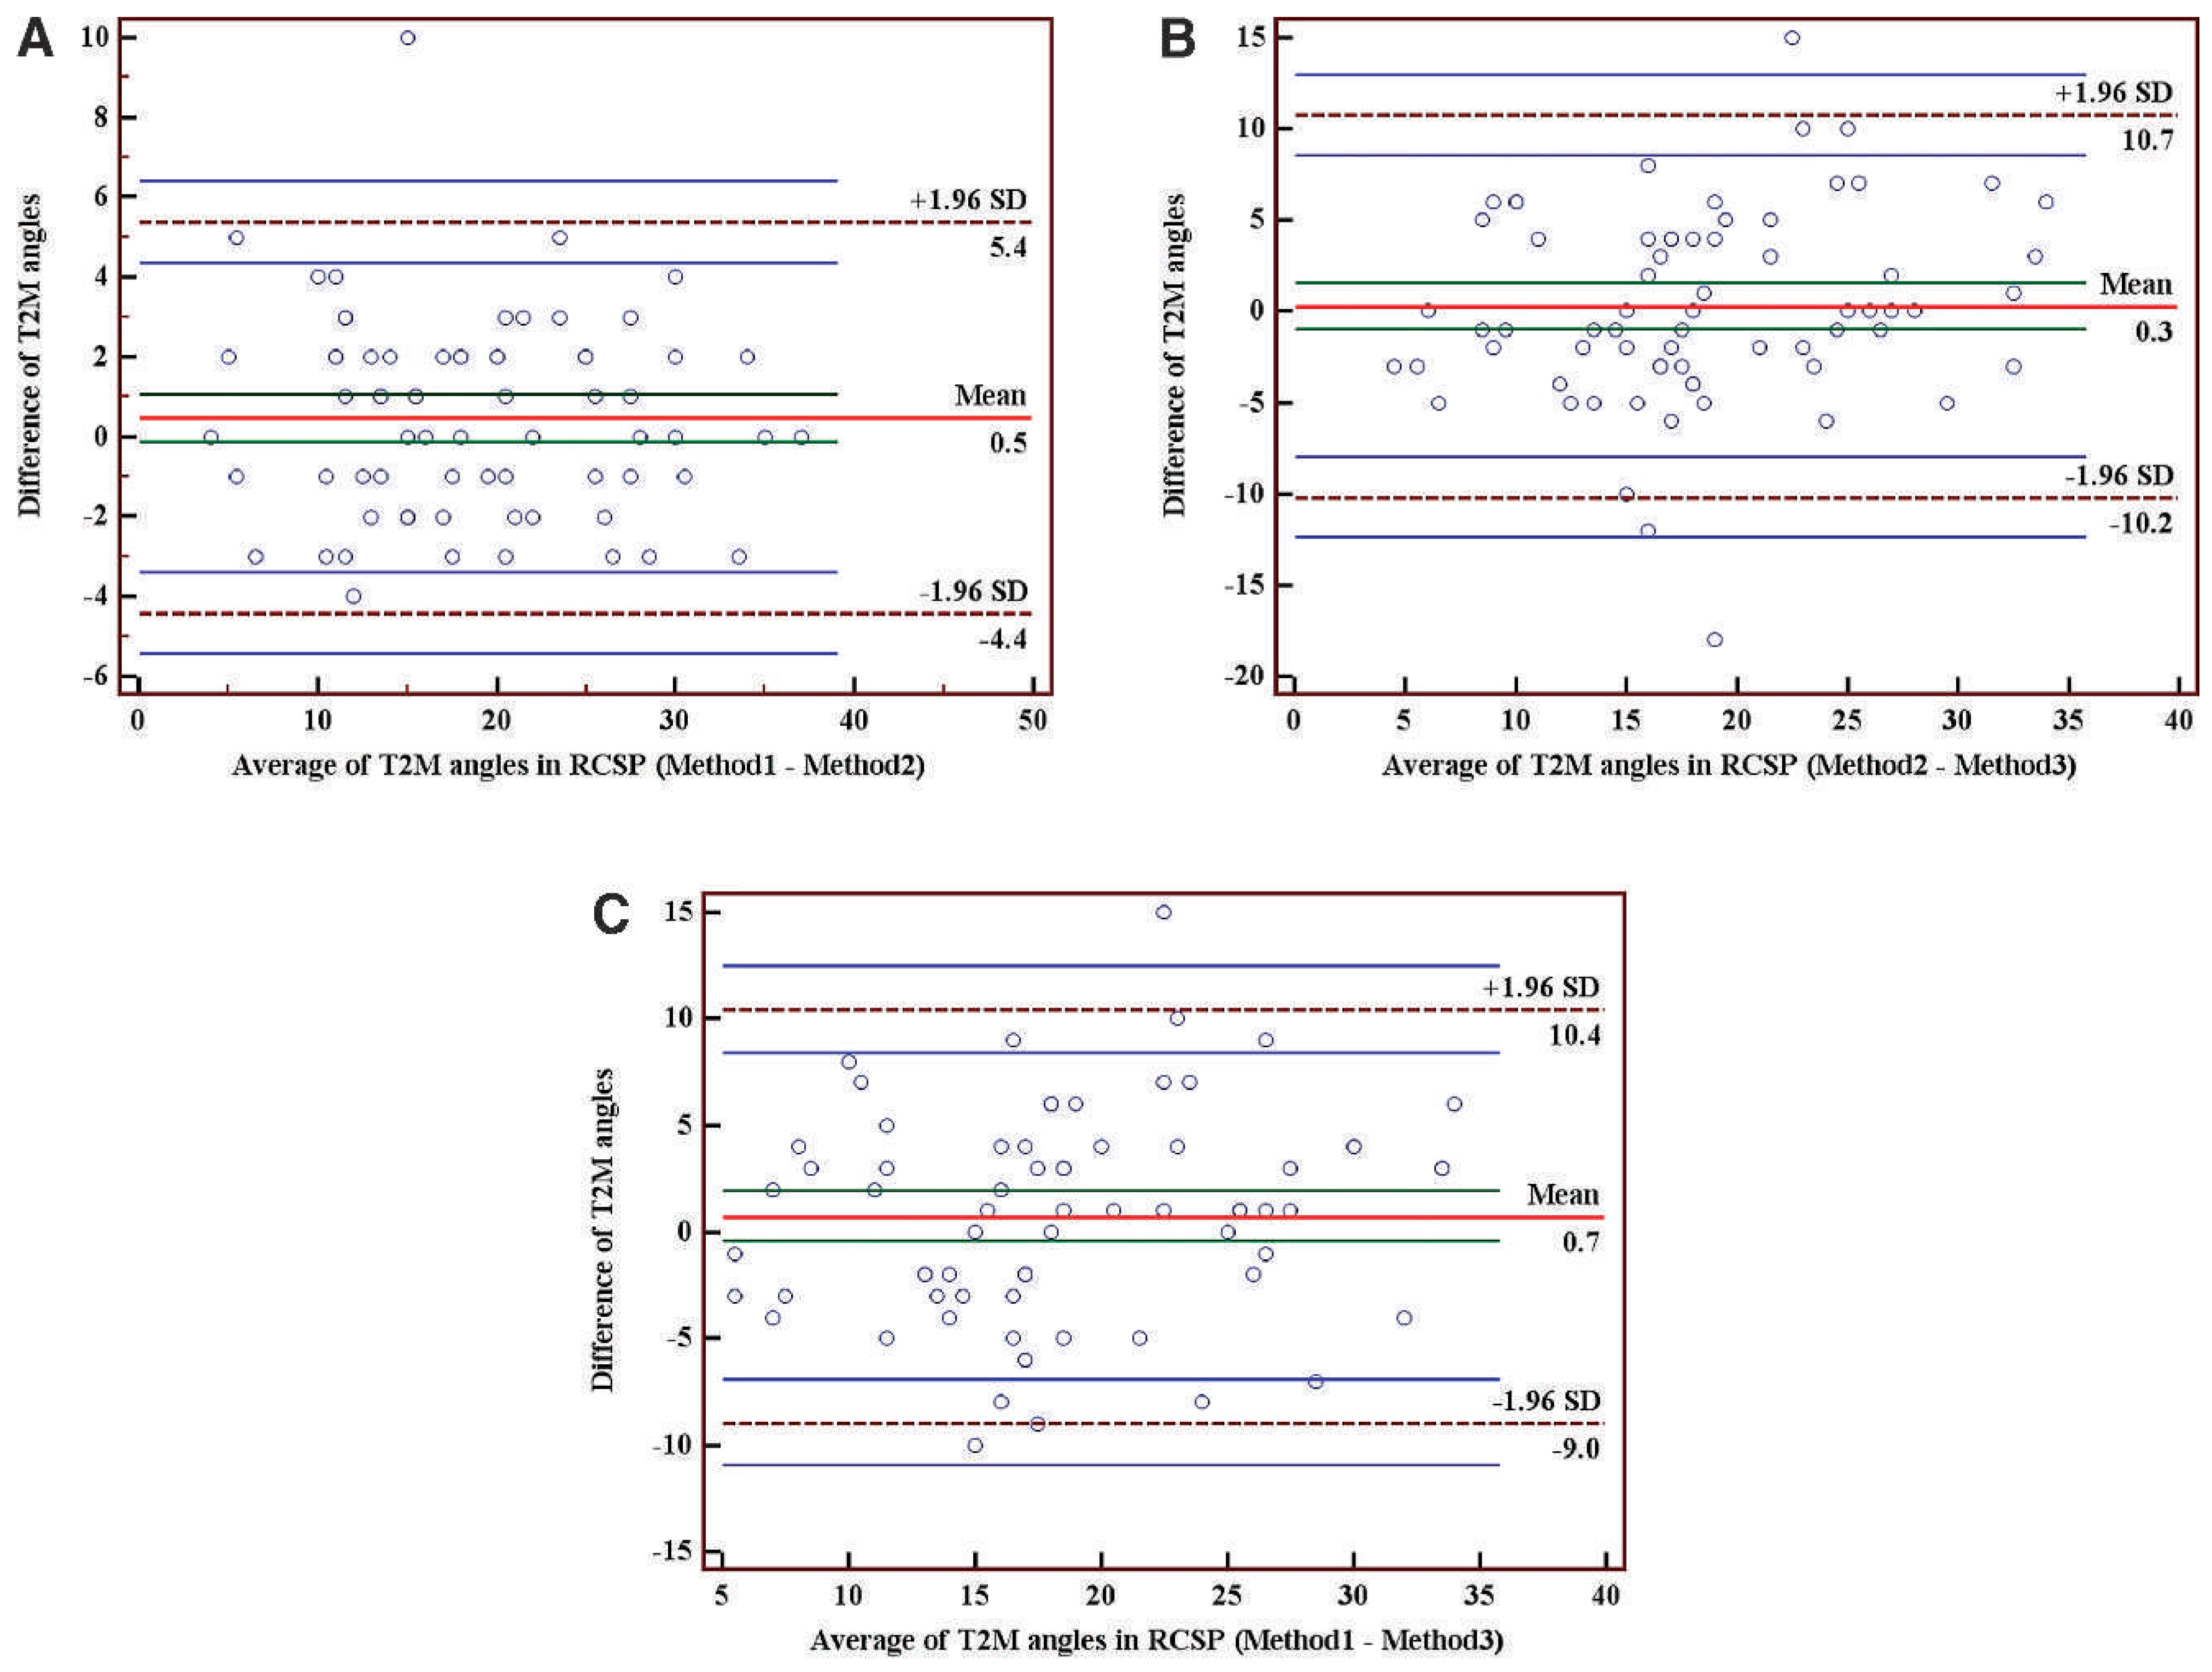
Bland-Altman plots were created with MedCalc 11.4.1.0 to analyze the agreement between the measurements made by the three observers. For the measurements made by two observers (considered at a time), this graph plots the mean values of the angles (x-axis) versus the difference of the corresponding angles (y-axis) for each of the 70 data sets. This allows us to investigate any possible relationship between the measurement error and the true value between the two methods. Because the true value is not known, the mean of the measured values gives the best estimate of the true value. The mean difference and the limits of agreement for the measured values were plotted, and the limits of agreement were represented by mean ± 1.96 SD. The 95% confidence intervals were computed for the mean difference and the limits of agreement.
Figures 3 and
4 show the Bland-Altman plots for the three different methods used by the three observers for measuring the T2M angle in the neutral and resting calcaneal stance positions, respectively, comparing two methods/measurements in a single plot.
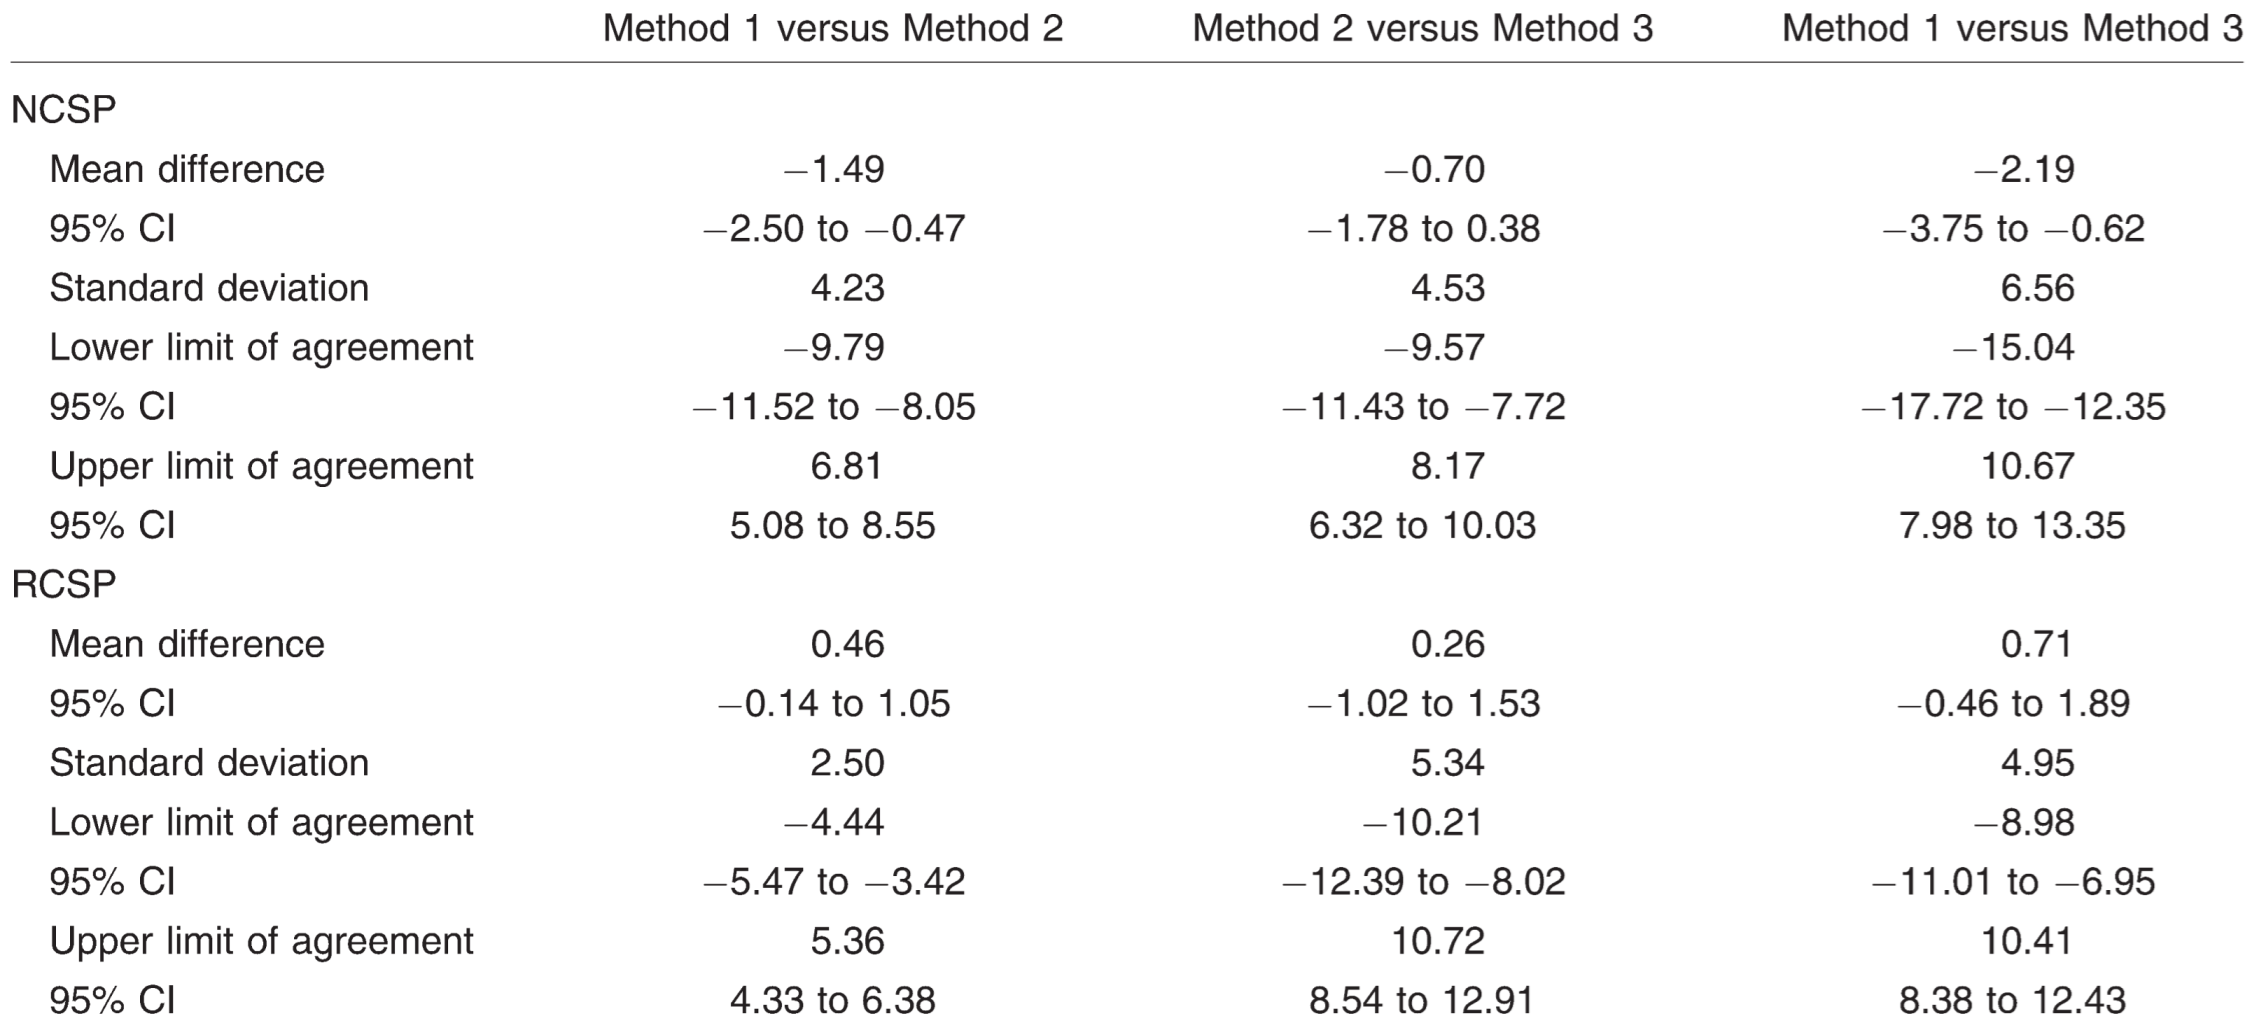
Table 2 shows the mean difference and limits of agreement with the corresponding 95% confidence intervals. All of the plots showed that the maximum number of points were present within the limits of agreement, which shows that there is good agreement between the angular measurements made by the three observers using three different approaches, thus eliminating the possibility of any underlying error in measurement technique and measured values.
Table 2.
Mean Difference, Standard Deviation, and Lower and Upper Limits of Agreement with the Corresponding 95% CIs for Each of the Two Methods Compared in the NCSP and the RCSP Using Bland-Altman Plots.
Table 2.
Mean Difference, Standard Deviation, and Lower and Upper Limits of Agreement with the Corresponding 95% CIs for Each of the Two Methods Compared in the NCSP and the RCSP Using Bland-Altman Plots.
Figure 3.
Bland-Altman plots showing the agreement between the talar–second metatarsal (T2M) angular measurements in the neutral calcaneal stance position (NCSP) measured by the first and second observers (A), the second and third observers (B), and the first and third observers (C), each using a different method of measurement. Note that in all the plots, the maximum number of points are present within the limits of agreement. Also, the 95% confidence intervals of mean difference and limits of agreement are represented.
Figure 3.
Bland-Altman plots showing the agreement between the talar–second metatarsal (T2M) angular measurements in the neutral calcaneal stance position (NCSP) measured by the first and second observers (A), the second and third observers (B), and the first and third observers (C), each using a different method of measurement. Note that in all the plots, the maximum number of points are present within the limits of agreement. Also, the 95% confidence intervals of mean difference and limits of agreement are represented.
Figure 4.
Bland-Altman plots showing the agreement between the talar–second metatarsal (T2M) angular measurements in resting calcaneal stance position (RCSP) measured by the first and second observers (A), the second and third observers (B), and the first and third observers (C), each using a different method of measurement. Note that in all the plots, the maximum number of points are present within the limits of agreement. Also, the 95% confidence intervals of mean difference and limits of agreement are represented.
Figure 4.
Bland-Altman plots showing the agreement between the talar–second metatarsal (T2M) angular measurements in resting calcaneal stance position (RCSP) measured by the first and second observers (A), the second and third observers (B), and the first and third observers (C), each using a different method of measurement. Note that in all the plots, the maximum number of points are present within the limits of agreement. Also, the 95% confidence intervals of mean difference and limits of agreement are represented.
In addition, T2M angles were measured for 40 feet (20 male and 20 female) (
Table 3), which were selected randomly from 70 feet (24 male and 46 female). SPSS Statistics 17.0 was used to compare the mean values of the T2M angle for 40 feet with those of 70 feet, using independent-samples
t test. The results showed that there were no significant differences between the mean values in the neutral calcaneal stance position (
P = .626) and the resting calcaneal stance position (
P =.885). This shows that 70 feet is a good sample to establish T2M angular value for the adult feet in a standardized population.
Table 3.
Talar–Second Metatarsal Angle Measurements for 40 Feet (20 Male and 20 Female) in the NCSP and the RCSP.
Table 3.
Talar–Second Metatarsal Angle Measurements for 40 Feet (20 Male and 20 Female) in the NCSP and the RCSP.
Discussion
The biomechanics of tarsal mechanism and transmissions within the tarsal “gearbox” in response to foot pronation and supination is of the most significant importance to foot and ankle specialists. The amount of motion occurring between the talus and the rest of the tarsal complex depends on the stability of the hindfoot structures. It has been shown that in a balanced stable foot, most motion of the talar-tarsal joints occurs in the talonavicular joint, followed by the talocalcaneal joint, and a minimal amount in the calcaneocuboid joint.[
9] The interdependence of tarsal joint motions in the closed kinematic chain of the tarsal mechanism is explained well in the literature.[
10–
14] The internal rotation of the tibia leads to a medial torsion force placed on the talus. Adding the vertical force from the weight of the body above combined with the forward moment leads to anterior and plantar forces on the talus. When the foot comes into contact with the weightbearing surface, it compensates in the opposite direction. The external rotation of the tibia causes the talus to deviate laterally and dorsiflex, followed by navicular inversion and slight dorsiflexion while the cuboid and calcaneus invert and the navicular inverts relative to the cuboid.[
15]
The talus is the link between the ankle and the foot. The talocalcaneal joint is responsible for converting horizontal plane motion of the leg into primarily frontal plane motion of the foot.[
16] From this, it follows that excessive abnormal subluxation or instability of the talus over the calcaneus and navicular will, in turn, affect the tarsal mechanism. This instability of the tarsal mechanism can cause hyperpronation, which leads to various foot pathologic abnormalities.[
16,
17] Realizing that many foot abnormalities have been attributed to instability or hypermobility of the hindfoot structures, it is important to evaluate the stability of these structures. The goal of any treatment measure is to reduce the strain on the supporting tissues and restore the normal alignment of the talus on the calcaneus. This clearly explains the significance of the talus in the biomechanics of the foot. Thus, the position of the talus with respect to the rest of the tarsal mechanism is of extreme importance.
Routine clinical examination of feet will vary from one clinician to another. So, it is important to establish a method that has the highest amount of reproducibility from one examiner to the next. Radiographic examination shows a high level of reproducibility and is commonly used to evaluate the osseous structures of the foot and ankle and as a template in determining normal versus abnormal alignment. It can aid in providing a means for treatment and surgical planning. Finally, it can serve as a valuable tool showing the effectiveness of the treatment provided.
Currently, the most widely accepted rearfoot to forefoot measurement is the T1M angle, which is attributed to Robert Meary.[
18] His method describes the degree of varus and cavus deformity from weightbearing anteroposterior and lateral radiographs. However, as cited by Mosca,[
19,
20] the anteroposterior T1M angle is not reliable, and it is meaningful only if there is a single angular deformity between the talus and the first metatarsal, ie, there is no coexisting deformity of the first ray and hindfoot, as in a valgus or a skewfoot. In a study conducted by Mosca,[
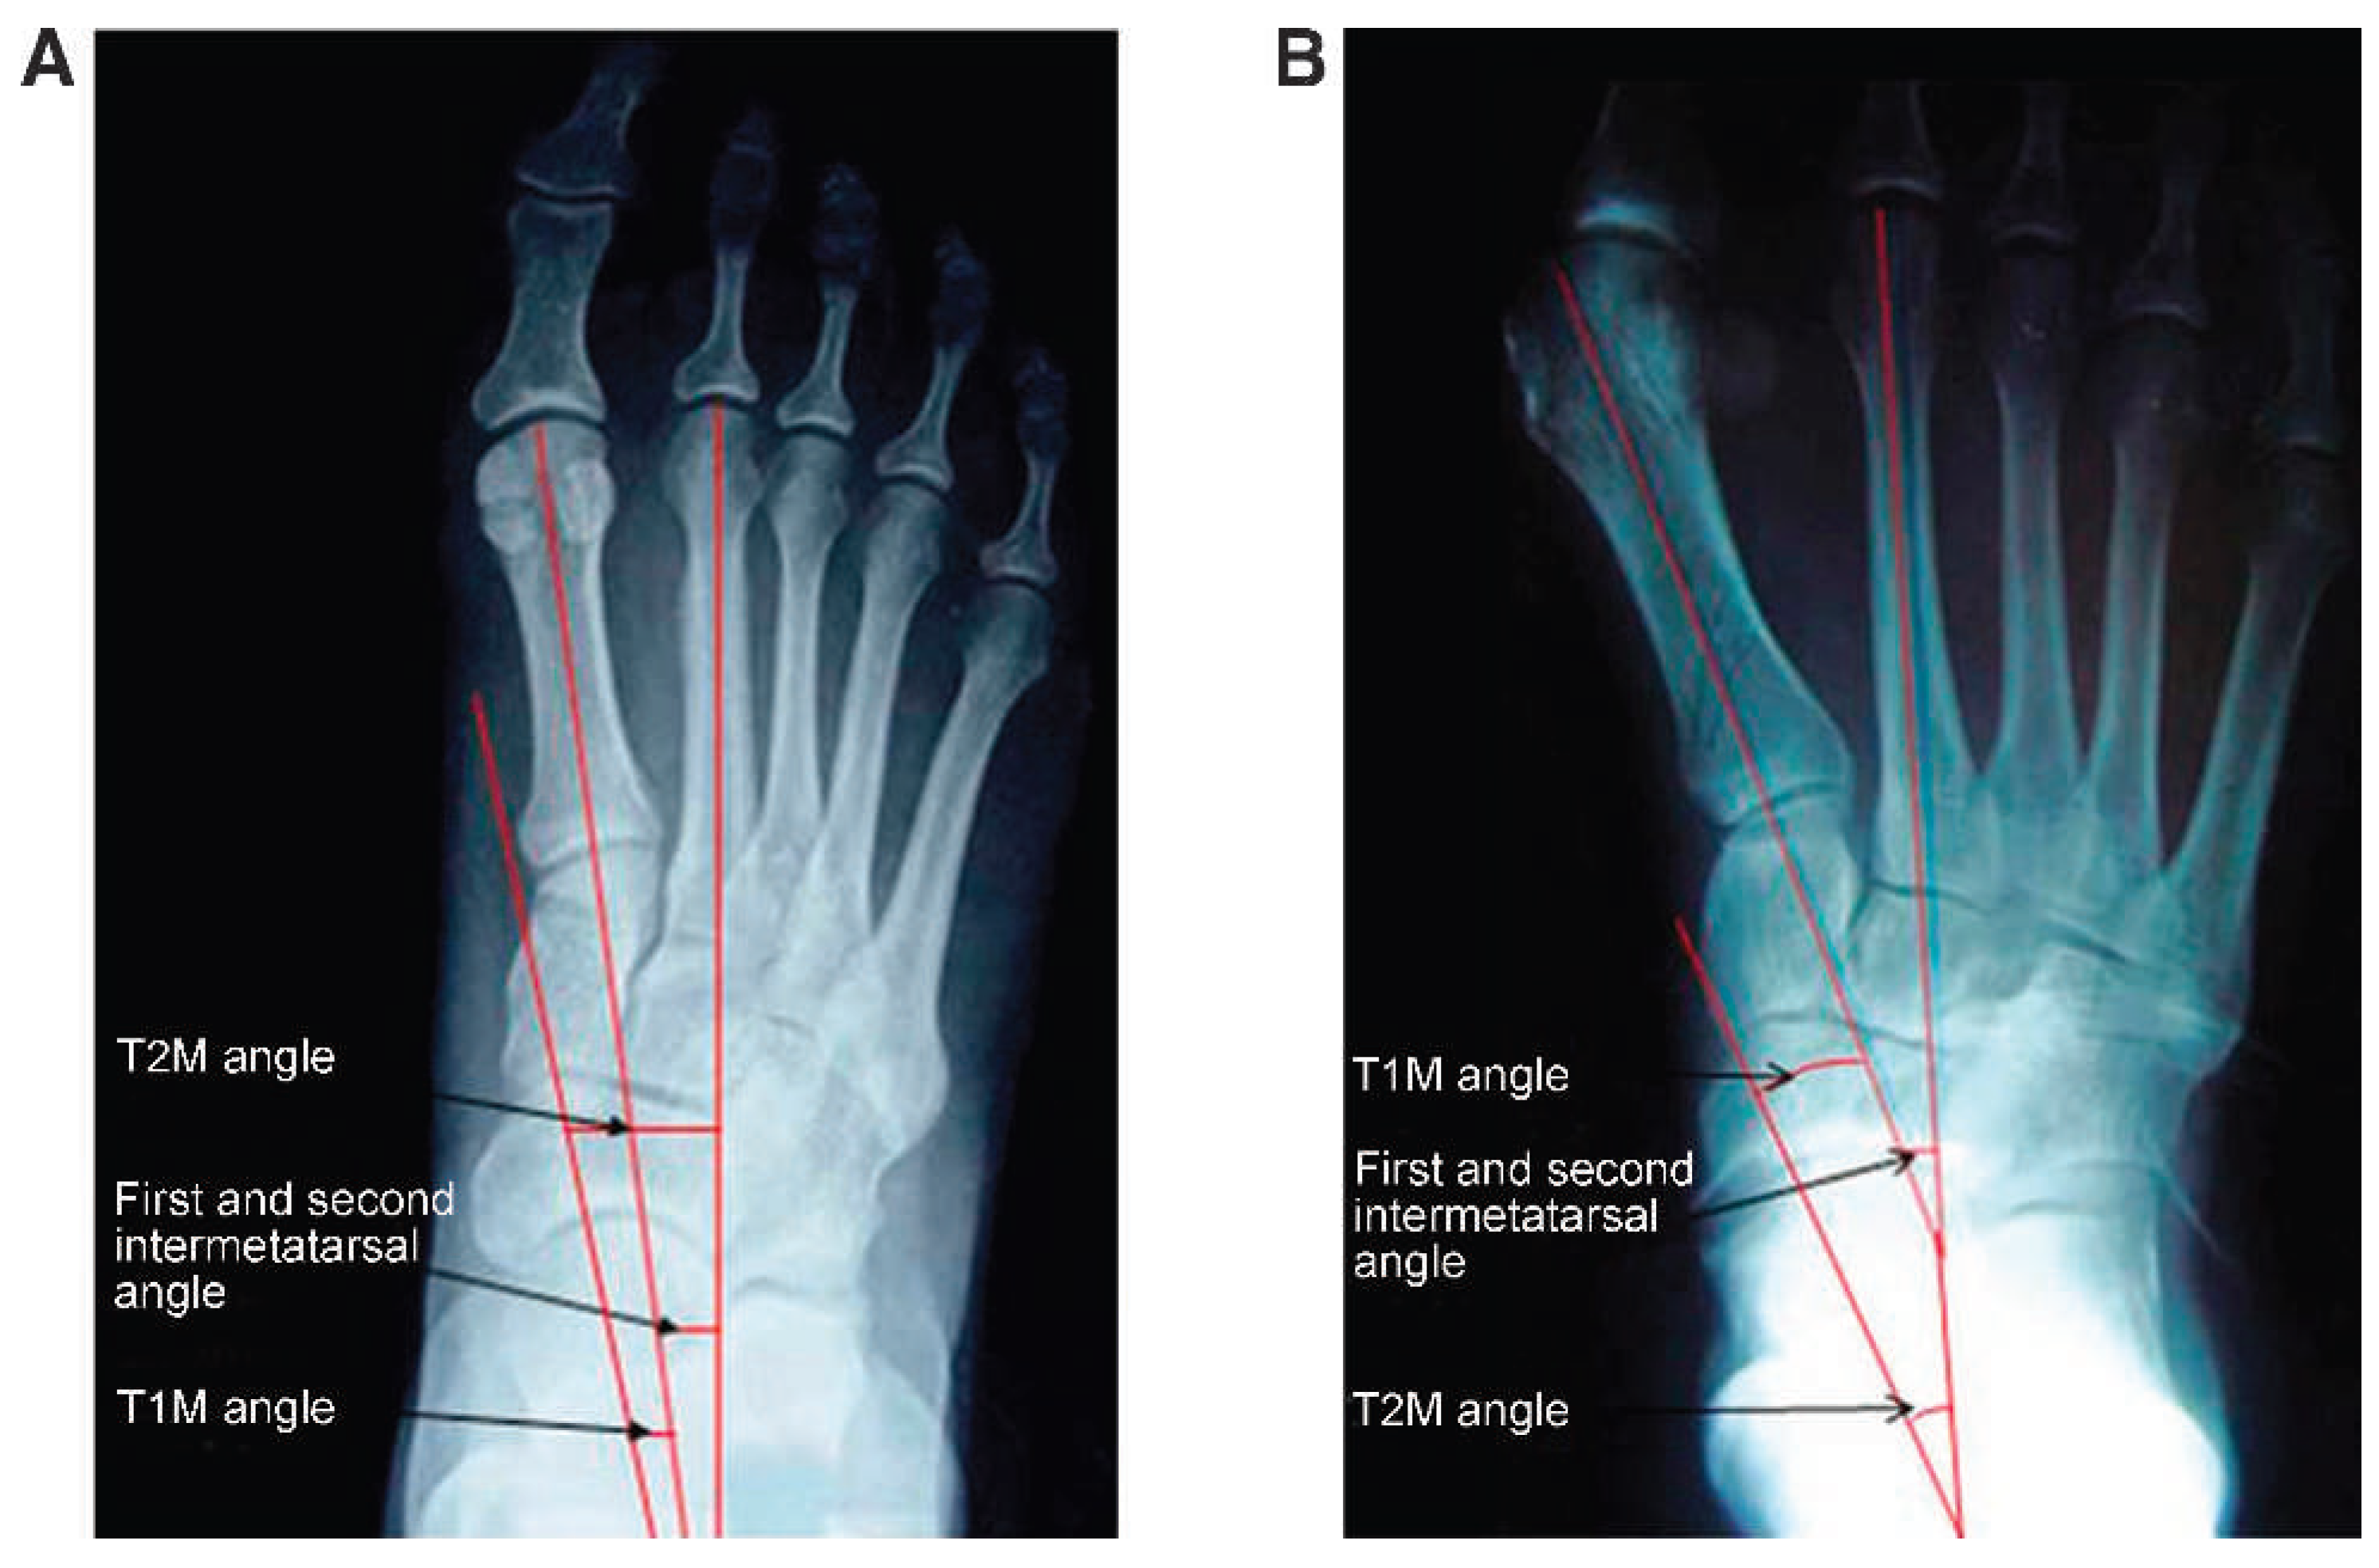
21] eight of ten patients had a normal anteroposterior T1M angle preoperatively even in the presence of severe deformity. When comparing the axes comprising an angle, it is imperative that one of the axes is “normal” to compare it with the other axis. Therefore, when measuring Meary’s angle on an anteroposterior view, one must consider an increased intermetatarsal angle between the first and second metatarsal bones (
Fig. 5). Also, in an excessively pronated foot, such as in flatfoot, because the talus adducts with the abducted first metatarsal, this angle is inherently inaccurate.[
20] For the previous reasons, Meary’s angle in an anteroposterior view should not be considered as a standard for radiographic evaluation to assess the relation between forefoot and rearfoot.
Figure 5.
A, A normal first and second intermetatarsal angle is shown; therefore, an accurate hindfoot to forefoot measure is established. B, With an increased first and second intermetatarsal angle, the abnormal medial displacement of the first metatarsal decreases the overall value of the talar–first metatarsal (T1M) angle, resulting in a “normal” measurement when there is a pathologic partial displacement of the talus on the calcaneus and navicular and a pathologic angle between the first and second metatarsals.
Figure 5.
A, A normal first and second intermetatarsal angle is shown; therefore, an accurate hindfoot to forefoot measure is established. B, With an increased first and second intermetatarsal angle, the abnormal medial displacement of the first metatarsal decreases the overall value of the talar–first metatarsal (T1M) angle, resulting in a “normal” measurement when there is a pathologic partial displacement of the talus on the calcaneus and navicular and a pathologic angle between the first and second metatarsals.
The second metatarsal bone is the most stable structure in the forefoot, even in cases of foot abnormalities (except for metatarsus adductus and in the case of trauma). Therefore, determining the T2M angle would give a more accurate radiographic measurement, and the deformity of the first metatarsal would not need to be considered. Thomas et al,[
5] Steel et al,[
22] and Fuson and Smith[
23] determined the values of radiographic measurements in standardized populations. Thomas et al[
5] reported a mean ± SD T2M angle as 16.2° ± 7.3°. Their radiographs were taken with study participants in the bipedal stance position. In the present study, the neutral calcaneal stance position was chosen, because it mimics a “normal foot” (subtalar joint in neutral position), to establish T2M angular value in a standardized population.
The clinical significance of the value of the anteroposterior T2M angle is to determine the stability or instability of the hindfoot proximally and the forefoot distally in the transverse plane. A balanced stable foot would have a low angular measurement, whereas an unbalanced unstable foot would have a higher-than-normal angle, indicating a medial transverse plane deformity of the hindfoot with respect to the forefoot. A higher-than-normal value would result from adduction of the talus and abduction of the forefoot. This finding indicates a medially deviated subtalar joint axis, with the end result being overpronation of the foot. A medially deviated hindfoot and laterally deviated forefoot would, therefore, lead to excessive repeated strain on the supporting soft tissues during the gait cycle, eventually leading to injury and pain. The most compromised weakest tissue would become symptomatic, indicating a pathologic event.
Thus, the degree of overpronation in the transverse plane is indicated by the medial subluxation of the talus, which causes an increase in the anteroposterior T2M angle. The T2M angle, therefore, is helpful to determine the degree of over-pronation in the transverse plane. Because this is a weightbearing radiographic measurement, it would provide a reproducible tool to quantify the degree of deformity. We showed in this paper that even with three examiners using three different methods to measure the T2M angle, there were no significant differences among the measurements. Therefore, based on the clinician’s convenience, any method can be chosen to measure the anteroposterior T2M angle and can be compared with the range of values reported in this study.
The anteroposterior T2M angle, along with the anteroposterior T1M angle, has a restricted use in the case of metatarsus adductus that could be combined with skewfoot because the second metatarsal and the talus are abnormally medially deviated. Still, the medial subluxation of the second metatarsal is less than that of the first metatarsal. In any case, one must consider any form of trauma or osseous malposition of the second metatarsal. Furthermore, the anteroposterior T2M angle accounts for only a transverse plane deformity and will not provide any data regarding a sagittal or frontal plane deformity. A lateral T1M angle will be superior to a lateral T2M angle because the second metatarsal bone is more difficult to outline versus the first metatarsal bone on a lateral radiograph.
Limitations of this study were as follows: 1) although the sample size was good enough to establish a range of values for the T2M angle in a standardized population, there were fewer men than women in the study; 2) the measured angles were rounded to the nearest integers by the software; 3) because only a medical history was obtained and no medical examination was performed, it is possible that unidentified systemic disease might have been existing; and 4) despite using digitized radiographs with the angles measured by using highly advanced software to possibly decrease the chance of measurement variations, human errors may still have produced slight variations.