The purpose of gait analysis is to delineate the underlying causes of changes in human locomotion by using biomechanical principles that will eventually lead to a better analysis of abnormal gait patterns and rehabilitation treatments [
1]. This function served by gait analysis is of considerable importance for specialized clinical areas such as podiatric medicine [
2]. Various methods have been used to measure the kinematics of the ankle-foot complex, which is of particular importance to podiatric medicine. These methods comprise in vivo and in vitro studies in which radiostereometric analysis [
3,
4,
5], magnetic resonance imaging [
6], and optical motion capture [
7,
8] have been used. In terms of in vitro studies, static cadaveric models [
9] and dynamic cadaver gait simulators [
10,
11,
12,
13] have been used to measure the kinematics of the foot-ankle complex. However, these methods were restricted in capturing true motion characteristics owing to their invasive or static nature or their inability to directly evaluate walking in vivo.
Recently, dynamic video fluoroscopy was shown to be an accurate and reproducible method for determining the kinematics of a joint in vivo during weightbearing activities [
14,
15,
16,
17,
18]. This method was limited to small sampling frequencies (30 Hz) and a restricted field of capturing motion with two-dimensional (2-D) motion analysis, which were inadequate to fully examine the foot-ankle complex kinematics during walking. Although Stagni et al [
17]. constructed three-dimensional (3-D) kinematics of the underlying bone motion of lower limbs from two fluoroscopic 2-D projections, a low 6-Hz sampling rate was used. Higher sampling frequencies and 3-D motion capture can be achieved with current optoelectronic skin-based motion capture systems, which can elucidate the mechanics underlying functional relationships among multiple segments of the foot [
7,
8,
12,
19,
20,
21,
22]. The use of such motion capture systems has been advantageous in acquiring the kinematics of abnormal motion of the foot-ankle complex for satisfying the growing need for evidence-based practice [
2,
23,
24]. These systems use a noninvasive method for capturing foot segments in 3-D motion using at least three trackable markers placed on specific anatomical landmarks for defining the multiple-segmented foot model. The accuracy of the measured foot motion is contingent on the skin markers, which are assumed to be rigidly attached to the underlying bony landmarks.
However, a frequent criticism of the skin-based motion capture system is the associated skin movement artifact. Skin movement artifact is the difference between the underlying bone motion (obtained with invasive intracortical bone pins/external fixators) and the overlying skin (obtained with noninvasive superficial skin-mounted markers). Greater variation in skin movement artifact was reported in vitro during, before, and after foot flat (the midstance period) when ten cadaveric feet were simulated in slow walking [
12]. Relatively large skin movement artifact was also reported during the first and third stance phases of gait, when the tibial and rearfoot kinematics were compared between a skin-mounted marker system and a bone-pin insertion system [
25]. However, other studies [
26,
27] report that no systematic skin movement artifact occurs with respect to underlying bone motion in the foot-ankle complex during the stance phase of gait. These inconsistencies in detecting skin movement artifact at the ankle-foot complex may be due to the indistinctly defined substance phases. Therefore, an investigation of the different substance periods (ie, early, middle, and late stance) of walking may provide more insight into the skin movement artifact of the foot-ankle complex.
In recent times, because of ease of use, a much more comfortable and noninvasive technique has been used to characterize soft-tissue movement during walking instead of intracortical bone pins/external fixators. This method involves the motion capture of skin-based markers translating and rotating in 3-D and calculating the intermarker displacement [
28]. In that study, soft-tissue movement was characterized with a skin-based motion capture system for the thigh and shank but not for the foot-ankle complex. The purpose of the present study was to characterize the soft-tissue movement of the foot-ankle complex by measuring intermarker distance changes between markers attached on the foot-ankle complex during level walking and quiet standing. Specifically, the effects of different stance periods and regions of the foot on the intermarker distance changes were investigated. The two hypotheses were as follows: 1) intermarker distances during the early, middle, and late periods of the stance phase of the gait cycle will be different, and 2) intermarker distances among the forefoot, mid-foot, and hindfoot regions during the stance phase of the gait cycle will be different. The significance of this study was to describe soft-tissue movement characteristics of the foot during walking that could impact soft-tissue artifact when skin-based marker systems are used, which assume that the foot-ankle complex is a rigid body.
Experimental Setup
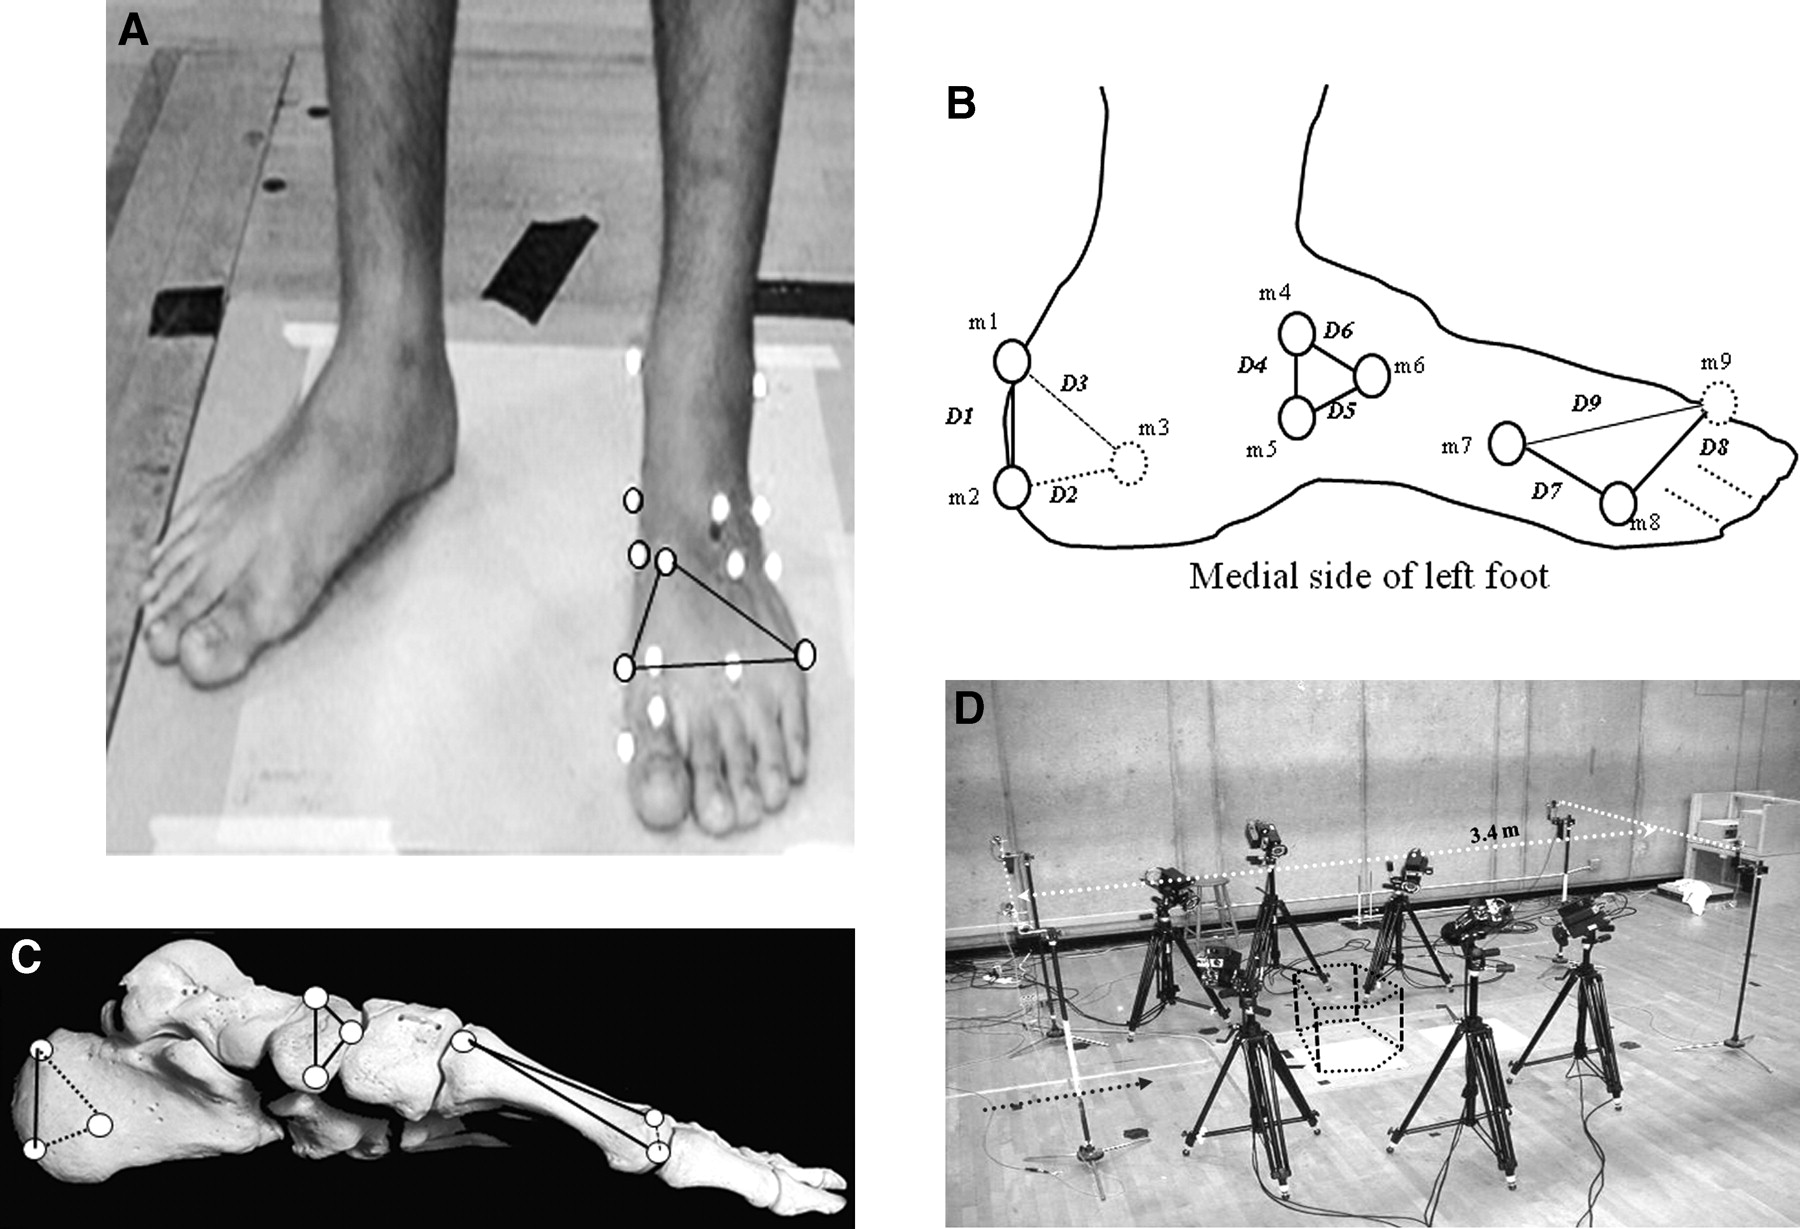
Nine spherical markers (7 mm in diameter) placed on each individual’s left foot were selected to define three functional regions of the foot-hindfoot (calcaneal region), midfoot (navicular region), and forefoot (first to fifth metatarsals) (
Figure 1A). Three markers were used to define each foot region. The hindfoot calcaneal region markers (m1, m2, and m3) were placed on the posterior proximal, distal, and lateral tubercle of the calcaneus, respectively. The midfoot navicular markers (m4, m5, and m6) were placed on the dorsal, plantar, and anterior sides of the navicular region, respectively. The forefoot markers (m7, m8, and m9) were placed on the first metatarsal base, head, and fifth metatarsal head, respectively. The selected markers of each region were used to define specific intermarker distances (
Figure 1B,C). Calcaneal hindfoot distances were as follows: D1, between the proximal (m1) and distal (m2) markers; D2, between the distal (m2) and lateral tubercle (m3) markers; and D3, between the proximal (m1) and lateral tubercle (m3) markers. Navicular midfoot distances included D4, between the dorsal (m4) and plantar (m5) markers; D5, between the plantar (m5) and anterior (m6) markers; and D6, between the dorsal (m4) and anterior (m6) markers. Forefoot distances were as follows: D7, between the first metatarsal base (m7) and head (m8) markers; D8, between the first metatarsal head (m8) and the fifth metatarsal head (m9) markers; and D9, between the first metatarsal base (m7) and the fifth metatarsal head (m9) markers.
Data Collection and Processing
To capture the foot markers, a six-camera motion analysis system (ExpertVision; Motion Analysis Corp, Santa Rosa, California) was used to sample data at 120 Hz. The size of the capture volume cube (
Figure 1D) covered the ankle-foot complex during the stance phase of walking. The average marker tracking error in 3-D measurement space (0.50 [L] ×0.33 [W] ×0.60 [H] m) was less than 0.2 mm after calibration. Each participant was asked to stand quietly within the motion capture volume with the feet aligned with the shoulders. There were two trials of double-limb quiet standing and five trials of walking at a self-selected pace. Participants walked a distance of 3.4 m demarcated by photocells (
Figure 1D). The photocells were used to measure the participant’s walking time between the photocells. Then, the walking velocity was calculated and compared among the walking trials of each participant so that trials that were faster or slower than 1.5 SD from the mean walking velocity of the same participant were excluded from data analysis.
The 3-D marker trajectory data were smoothed using a low-pass fourth-order Butterworth filter with a cutoff frequency set at 8 Hz. The current cutoff frequency was determined to be optimal by residual analysis [
29] of
x,
y, and
z coordinate data of the calcaneal markers from pilot data. The marker trajectories were analyzed for three discrete periods of the stance phase of walking: 1) an early stance period (P1, heel contact to first toe-down), 2) a midstance period (P2, both heel and first toe ground contact), and 3) a late stance period (P3, heel-off to first toe-off). The discrete events of heel contact and first toe ground contact and toe-off were determined by the zero velocity of the heel marker (m2) and the first metatarsal head marker (m8), respectively.
Data Analysis
The skin markers captured by the motion capture system provided 3-D coordinates that were used to calculate the intermarker distances (D1–D9) of each foot segment during static standing and the three discrete stance periods of walking. The intermarker distance between two designated markers was calculated based on the formula , where Δx, Δy, and Δz symbolize the x, y, and z coordinate differences between the two markers, respectively. The distances measured during static standing (static d) were used as baseline distances to normalize the corresponding dynamic distances measured during the walking trials (dynamic d). The percentage of relative change for each measured intermarker distance was calculated by dividing the difference between the static and dynamic distances by the static distance for each stance period (P1, P2, and P3) (Equation 1). A positive value of the relative intermarker distance change indicates a distance shortened during walking compared with the baseline distance during quiet standing. Conversely, a negative marker distance change shows a distance elongated during walking with respect to the baseline distance during quiet standing.

The absolute maximum distance changes in each intermarker distance of each foot region were also calculated by summing the mean and positive standard deviation of the relative changes in each measured distance across stance periods (P1, P2, and P3) of walking, then multiplied with the ensemble subject means of each distance measured during quiet standing.
A statistical software program (SPSS; SPSS Inc, Chicago, Illinois) was used to perform the statistical analysis. For each participant, the three calculated relative distance changes were averaged in each period of the stance phase of walking and in each foot region. A 3 (phase) × 3 (region) analysis of variance with repeated measures was used to identify significant relative changes for each foot region (hindfoot, midfoot, and forefoot) across three stance periods (P1, P2, and P3) of walking compared with quiet standing and significant changes for each stance period of walking across the three foot regions. A 3 (phase) × 9 (intermarker distances) repeated-measures analysis of variance was also used to identify significant changes in each intermarker distance across stance phases (P1, P2, and P3) of walking. To determine specific significant differences, post hoc analysis with Bonferroni adjustment was used. The statistical significance level was set at α = 0.05.
Effect of the Early, Middle, and Late Stance Phases on Intermarker Distance Changes During Walking
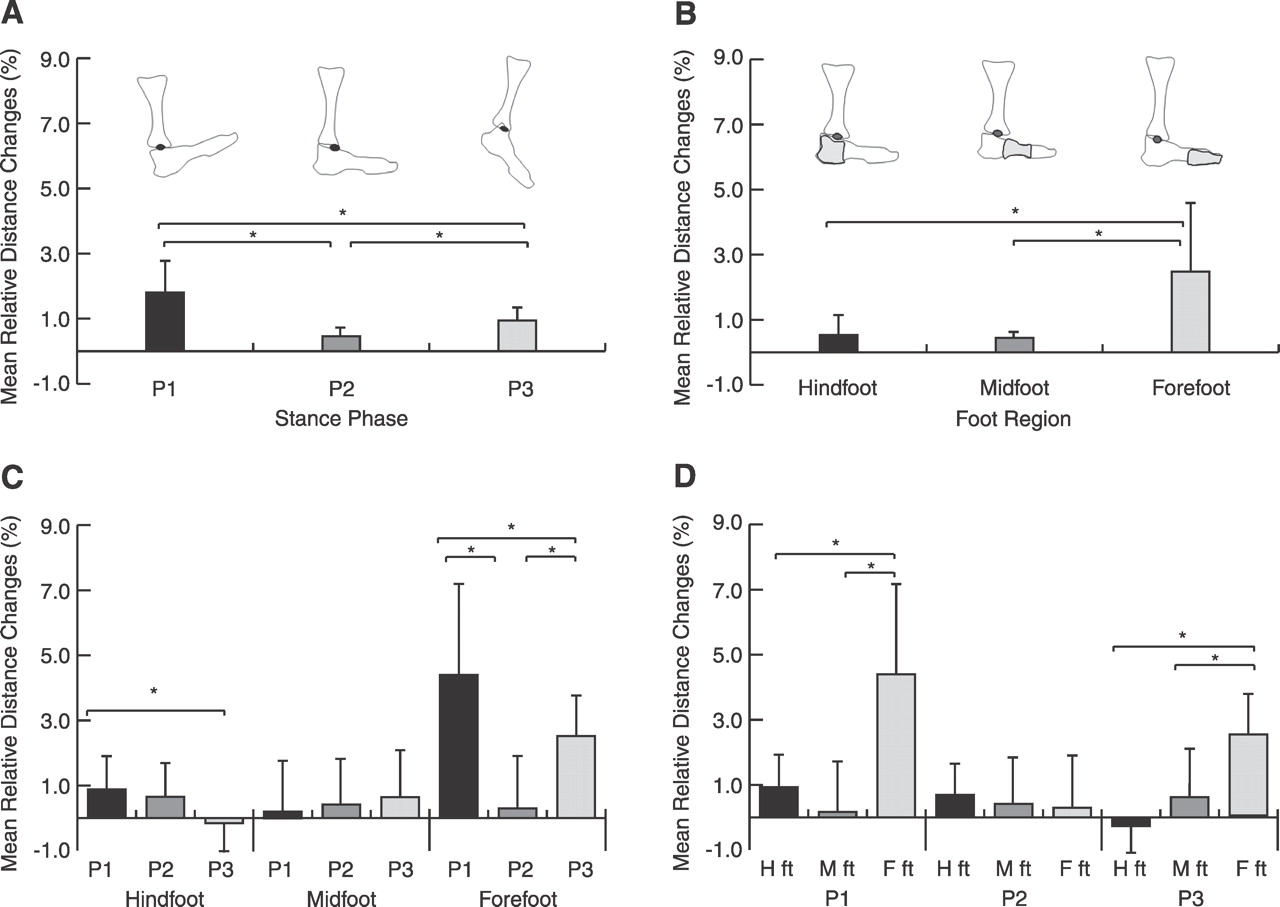
The post hoc result (
Figure 2A) shows that the positive intermarker distance changes during early stance (P1; mean, 1.85%) were significantly greater than those during midstance (P2; mean, 0.48%) and late stance (P3; mean, 1.01%). The positive greater distance changes at early stance (P1) indicate that the average intermarker distances across three foot regions were significantly shortened compared with those at midstance (P2) and late stance (P3). During late stance (P3), the positive distance changes were found to be significantly greater than those of midstance (P2). Among the phase comparisons, the intermarker distance changes were shown to be smallest during midstance (P2).
Figure 2C shows that at the hindfoot region, the intermarker distance changes during early stance (P1; mean, 0.96) were found to be significantly greater than those during late stance (P3; mean, −0.19). This result revealed that the hindfoot distances were significantly shortened during early stance and elongated during late stance. At the forefoot region, the significant increase in the positive intermarker distance changes was also found to be greater during early stance (P1; mean, 4.39) than during midstance (P2; mean, 0.32) and late stance (P3; mean, 2.56). This meant that the forefoot intermarker distances were significantly shortened during early stance compared with during midstance and late stance. During late stance (P3), a significantly greater forefoot intermarker distance change (mean, 2.56) was found compared with that of midstance (P2; mean, 0.32).
Figure 3 and
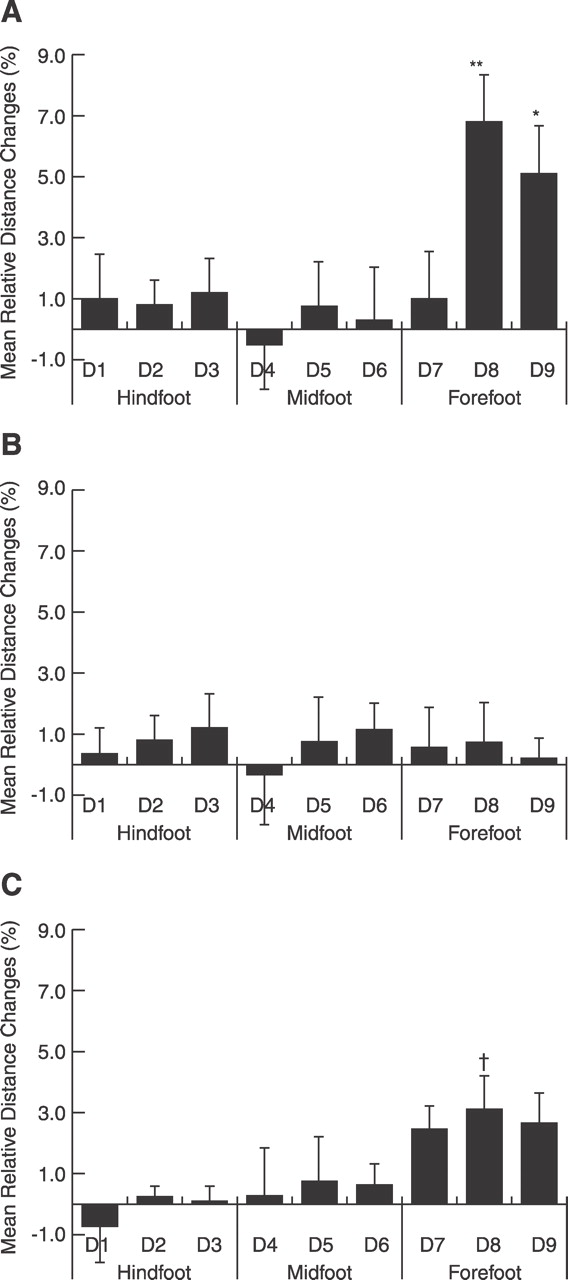
Table 1 show the relative changes for the nine intermarker distances in the three foot regions. During early stance (P1), significant positive intermarker distance changes were found for the forefoot D8 and D9 distances greater than those for the midfoot and hindfoot regions (
F8, 48 = 6.40) (
Figure 3A). The results indicate that the width of forefoot D8 (mean, 6.90) was significantly reduced during early stance compared with the distances of the hindfoot.
During midstance (P2), no significant change between intermarker distances in the three foot regions were found, and most magnitudes of the relative distance changes were less than 1% (
Figure 3B). The relative distance changes across the three foot regions during midstance were all positive (shortened) except D4, which was negative (elongated). During late stance (P3), significant positive changes were found only at the forefoot D8 (mean, 2.98%) compared with the negative hindfoot D1 (mean, −0.78%) (
Figure 3C). That is, during late stance, forefoot width (D8) was significantly reduced with respect to an elongated posterior calcaneal distance (D1).
Effect of the Early, Middle, and Late Stance Phases on Intermarker Distance Changes During Walking
The three discrete stance periods showed different magnitudes of soft-tissue movement characterized by shortening the intermarker distances in the foot regions during walking. The early stance period shows the greatest changes in intermarker distances among the three foot regions, followed by late stance and midstance. The shortening of intermarker distances during the early and late stance phases being more than that of midstance could be explained by a bimodal vertical ground reaction force and an anteroposterior ground reaction force exerted to the foot. Two prominent peaks in the vertical and anteroposterior directions are commonly seen in level walking right after hindfoot heel contact during early stance (a breaking phase) and before forefoot toe-off during late stance (a propulsion phase) [
30]. In in vivo studies [
10,
11,
13], the 3-D ground reaction force profile in walking was commonly simulated in vitro by exerting the ground reaction force in the vertical, anteroposterior, and mediolateral directions to the hindfoot heel, mid-foot, and forefoot toe during the early, middle, and late stances of gait, respectively.
Thus, during the early breaking stance of walking, the ground reaction forces were exerted on the hindfoot calcaneal region and resulted in shortening of the calcaneal distances (D1, D2, and D3). These imposing ground reaction forces in 3-D compressed the subcutaneous tissues of the hindfoot region and reduced the distances. The shortened D1 aligned with the posterior vertical aspect of the calcaneus reveals a vertical motion of the soft tissue, which reflects the skin movement artifact affecting the hindfoot markers [
12]. However, the intermarker distance D1 was lengthened during late stance before toe-off. During this late stance period, the forefoot pivoted the ground to push off the body while the hindfoot heel was off the ground, with no ground reaction forces directly exerted on the hindfoot region. The changes in the hindfoot D1 intermarker distance suggest the stretching of the underlying subcutaneous tissue (ie, plantar fascia) connected from the posterior heel across the bottom of the foot segments to the big toe via the windlass effect. The windlass effect occurred when the pivoted forefoot metatarsophalangeal (ie, big toe) was dorsiflexed during push-off, stretching the plantar fascia of the foot, shortening the foot length, and elevating the longitudinal foot arch [
31]. Meanwhile, the calf muscles contracted to raise the heel to pull the subcutaneous tissue on the posterior surface of the calcaneus opposite to the stretched plantar fascia while pushing off. Thus, during the early breaking and late push-off phases of the stance period, the changes in the intermarker distances in the hindfoot region showed the characteristic shortening and lengthening of the soft tissues, respectively.
During the early, middle, and late stance periods, the intermarker distances of the forefoot region were all shortened. During early stance, the shortening of D8 (forefoot width between the first and fifth metatarsal heads) and the shortening of D9 (forefoot diagonal distance between the first metatarsal base and the fifth metatarsal head) characterized the soft-tissue movement of the forefoot region. The shortened distances resulting from the soft-tissue deformation correspond well to the relative motion between the first and fifth metatarsals, as shown in the past [
12]. During the midstance period, the intermarker distance changes were least among the three foot regions. This can be explained by the lower magnitude of the vertical and anteroposterior ground reaction forces exerted during midstance than those exerted during the early and late stance periods.
Thus, soft-tissue movement indicated by the significant changes in the intermarker distances was shown during the early and late stance periods. These findings were similar to those of the 2009 study by Okita et al [
12] in which it was reported that the variations of the 3-D marker displacements of the multiple foot segments tended to increase before and after foot flat (the midstance period) as a result of skin movement artifact. However, other studies [
26,
27] have concluded that there were no systematic skin movement artifacts in the foot-ankle complex during the entire stance period of walking comparing the joint kinematics of the foot between a skin-based marker system and a bone pin insertion system. The inconsistencies between the two sets of studies could be due to the stance phase not being differentiated into the early, middle, and late periods. Therefore, discrete stance periods can provide more insight into skin movement artifacts at the foot-ankle complex.
Effect of the Forefoot, Midfoot, and Hindfoot Regions on Intermarker Distance Changes During Walking
The three foot segments showed different magnitudes of soft-tissue movement characterized by changes in the intermarker distances of the foot during walking. The greatest changes occurred at forefoot distances D8 and D9 during the early and late stance periods.
During early stance, a period after heel contact before toe touching the ground, the forefoot metatarsals were in dorsiflexion, with an elongation of the longitudinal arch of the foot [
32],
33,
34]. The dorsiflexed forefoot and the elongated foot arch may have compressed the subcutaneous tissue where the overlying metatarsal markers (m7, m8, and m9) were attached. Thus, a significant shortening of the diagonal forefoot distance D9 between the first metatarsal base and the fifth metatarsal head was evident in the forefoot, as was a shortened forefoot width D8 between the first and fifth metatarsal heads. Because the forefoot region is not a rigid body segment [
12], both forefoot distances D8 and D9 shortened during early stance before forefoot toe ground contact may reveal a dynamic change in the transverse foot arch, which consists of forefoot metatarsals, cuneiforms, and the cuboid [
35]. The reduced forefoot width and diagonal forefoot distance reveal the concavity of the transverse arch being vaulted ready for shock absorption before increasing body weight. This concaved metatarsal during the early and late stance phases is also reported in the study by Leardini et al [
21], in which the 2-D angles of the metatarsal segments projected to the transverse plane were reduced during the stance phase of walking.
Similarly, during late stance, heel-off before the toe leaving the ground, the forefoot was also dorsiflexed, and the longitudinal foot arch was shortened via the windlass effect [
32,
33,
34]. Therefore, the rigidity of the foot segments was increased for pushing off [
36]. The present findings of the shortened distances in forefoot distances D8 and D9 during late stance not only reveal the soft-tissue movement but also indicate the vaulted longitudinal and transverse foot arches during push-off. These vaulted foot arches corresponding to the reduced forefoot distances could also be a result of contraction of the peroneal longus foot muscle-tendon that crosses the sole of the foot obliquely from behind the lateral malleolus and insert into the base of the first metatarsophalangeal bone [
36]. The forefoot is not a rigid body segment [
12], and the findings of this study validate this statement. The intermarker distance changes at the forefoot not only characterize the soft-tissue movement but also reveal dynamic changes in the longitudinal and transverse arches of the foot during early stance (a breaking phase) and late stance (a propulsion phase).
At the hindfoot region, the lengthened hindfoot distance D1 during late stance suggests that a skin surface of the posterior vertical aspect of the hindfoot was stretched. When calf muscles contracted to raise the heel during late stance, the posterior skin of the hindfoot was stretched upward away from the calcaneal markers. Meanwhile, tension created from the plantar fascia of the foot due to the windlass effect pulled the posterior skin of the hindfoot downward while the forefoot pivoted the ground. Thus, the stretch was directionally opposed at the hindfoot region, resulting in lengthening of hindfoot distance D1 during push-off but no lengthening of D2 and D3, the lateral and oblique calcaneal distances.
At the midfoot, the markers attached to the navicular region on the medial side of the foot were not affected mostly by the stretching at the posterior and bottom of the foot. Leardini et al [
21] reported that the ranges of joint motion between the midfoot and metatarsals were small during the stance phase of walking. Therefore, the minimum stretching effect and small joint motion may result in the least changes in the intermarker distances at the midfoot region during the stance phases of walking.
Limitations and Future Studies
There were some limitations in this study. First, the quantification of the relative changes of the intermarker distances may reveal not only the true soft-tissue movement overlying each foot region but also the embedded actual underlying bone motion. The measurement of the underlying bone motion cannot be delineated in this study, but the measure of the relative changes in the intermarker distance of the same foot region provide insights into the non-rigidity of the segments of the foot-ankle complex. Second, the navicular bone was selected to represent the region of the midfoot as one rigid body. Compared with one rigid body of the midfoot, which consists of the navicular, cuboid, and first/second cuneiform [
21,
34], the current navicular midfoot may encompass different magnitudes of soft-tissue movement. Third, variations in the subcutaneous tissue property underlying the attached skin markers in each foot region could result in different dynamic skin stretching and pulling during walking, and the different foot mechanics of each participant could vary the stretching and compressing of soft-tissue movement of the foot.
In a future study, a quantification of skin artifact movement using bone pins compared with intermarker distance changes may be conducted to further differentiate soft-tissue movement with respect to the underlying bone motion when a skin-mounted motion capture system is used. Also, the changes in the intermarker distances of multiple rigid bodies used to represent the midfoot segment could be calculated for the soft-tissue movement in relation to the multiple bodies of the midfoot region. A quantification of subcutaneous tissue properties, such as tissue thickness and viscoelasticity at each foot region, may also provide further understanding of the use of skin-based markers in relation to the dynamic stretching and pulling of the foot skin while walking.
In summary, the multiple foot regions were studied for soft-tissue movement, which was characterized by the shortening and lengthening of the intermarker distances. The magnitudes of the intermarker distance changes were found to vary among defined regions of the foot-ankle complex and during different stance phases of walking. The early and late stance phases had the greatest effects on soft-tissue movement in the hindfoot and forefoot regions. The hindfoot and forefoot regions are not rigid, as shown by the changes in the intermarker distances, which reflect dynamic changes in the longitudinal and transverse foot arches during early and late stance. The noninvasive measure of intermarker distance changes could be a feasible and alternative method for assessing soft-tissue movement compared with the invasive measurements that are not accessible in most biomechanics motion gait.
Table 1.
Post hoc Comparisons of Ensemble Subject Relative Intermarker Distance Changes at the Region of the Hindfoot, the Midfoot, and the Forefoot During the Early, Middle, and Late Stance Periods of Level Walking Compared With Double-Limb Quiet Standinga.
Table 1.
Post hoc Comparisons of Ensemble Subject Relative Intermarker Distance Changes at the Region of the Hindfoot, the Midfoot, and the Forefoot During the Early, Middle, and Late Stance Periods of Level Walking Compared With Double-Limb Quiet Standinga.
Figure 1.
Experimental setup. A, Placement of skin-based markers on a participant’s left foot-ankle regions. B, Schematic of the nine markers and the nine intermarker distances (D1–D9 [see the “Experimental Setup” subsection for definitions]) in the hindfoot, midfoot, and forefoot regions during quiet standing. C, Marker placements in relation to the underlying bones. D, Six-camera motion analysis system (ExpertVision) is shown with the capture volume indicated by the dotted cube. The black arrow indicates the direction of walking. A 3.4-m walking area was demarcated using a pair of photocells (white arrows).
Figure 1.
Experimental setup. A, Placement of skin-based markers on a participant’s left foot-ankle regions. B, Schematic of the nine markers and the nine intermarker distances (D1–D9 [see the “Experimental Setup” subsection for definitions]) in the hindfoot, midfoot, and forefoot regions during quiet standing. C, Marker placements in relation to the underlying bones. D, Six-camera motion analysis system (ExpertVision) is shown with the capture volume indicated by the dotted cube. The black arrow indicates the direction of walking. A 3.4-m walking area was demarcated using a pair of photocells (white arrows).
Figure 2.
Ensemble subject relative intermarker distance changes with respect to quiet standing: comparisons among three stance phases, *indicates significant differences in P1 compared to P2 and P3, respectively and P2 compared to P3 (A) and among three foot regions *indicates significant differences in forefoot compared to hindfoot and midfoot, respectively (B). The post hoc analysis consisted of comparisons between phases at each foot region *indicates significant differences in P1 compared to P3 at hindfoot and in P1 compared to P2 and P3, respectively and P2 compared to P3 at forefoot (C) and between foot regions at each phase *indicates significant differences in forefoot compared to hindfoot and midfoot, respectively at P1 and P3 (D). Positive and negative values of the relative distance changes indicate shortened and elongated distances between two designated markers, respectively. F ft indicates forefoot; H ft, hindfoot; M ft, midfoot; P1, early stance; P2, midstance; and P3, late stance. Error bars represent SD.
Figure 2.
Ensemble subject relative intermarker distance changes with respect to quiet standing: comparisons among three stance phases, *indicates significant differences in P1 compared to P2 and P3, respectively and P2 compared to P3 (A) and among three foot regions *indicates significant differences in forefoot compared to hindfoot and midfoot, respectively (B). The post hoc analysis consisted of comparisons between phases at each foot region *indicates significant differences in P1 compared to P3 at hindfoot and in P1 compared to P2 and P3, respectively and P2 compared to P3 at forefoot (C) and between foot regions at each phase *indicates significant differences in forefoot compared to hindfoot and midfoot, respectively at P1 and P3 (D). Positive and negative values of the relative distance changes indicate shortened and elongated distances between two designated markers, respectively. F ft indicates forefoot; H ft, hindfoot; M ft, midfoot; P1, early stance; P2, midstance; and P3, late stance. Error bars represent SD.

Figure 3.
Ensemble subject relative intermarker distance changes with respect to quiet standing. The post hoc comparisons were at phase 1 (early stance) (A), phase 2 (midstance) (B), and phase 3 (late stance) (C). Positive and negative values of relative distance changes indicate shortened and elongated distances between two designated markers, respectively. *Significant differences in pairs: D9 compared with D1, D2, D4, D6, and D7. **Significant differences in pairs: D8 compared with D1 to D7. †Significant differences in pairs: D8 compared with D1. Error bars represent SD.
Figure 3.
Ensemble subject relative intermarker distance changes with respect to quiet standing. The post hoc comparisons were at phase 1 (early stance) (A), phase 2 (midstance) (B), and phase 3 (late stance) (C). Positive and negative values of relative distance changes indicate shortened and elongated distances between two designated markers, respectively. *Significant differences in pairs: D9 compared with D1, D2, D4, D6, and D7. **Significant differences in pairs: D8 compared with D1 to D7. †Significant differences in pairs: D8 compared with D1. Error bars represent SD.