5.1. Financial Determinants
Net profit (
β = 0.076,
p < 0.001) is nearly three times as large as revenue (
β = 0.029,
p < 0.001): profit quality matters more than scale, as signalling models predict (
Yasar et al., 2020;
Kanakriyah, 2020;
Theiri et al., 2023;
Boumlik et al., 2023). Profitability remained a key determinant of dividend policy across studies of the COVID-19 period; financially stronger companies were better able to sustain dividend payouts despite the disruption (
Tinungki et al., 2022). Companies with the potential to grow can increase dividends to emphasise that they will increase shareholder value in future (
Bossman et al., 2022).
Debt enters positively (
β = 0.020,
p = 0.003): leveraged NZX firms maintain dividends as a credibility signal rather than cutting back (
Yasar et al., 2020), a pattern reinforced by the imputation credit system where cash distributions carry an extra premium for domestic investors.
Cash flow (
β = −0.054,
p < 0.001) and shareholders’ equity (
β = −0.018,
p < 0.001) both enter negatively: heavy internal financing demands crowd out dividends, as pecking order theory predicts (
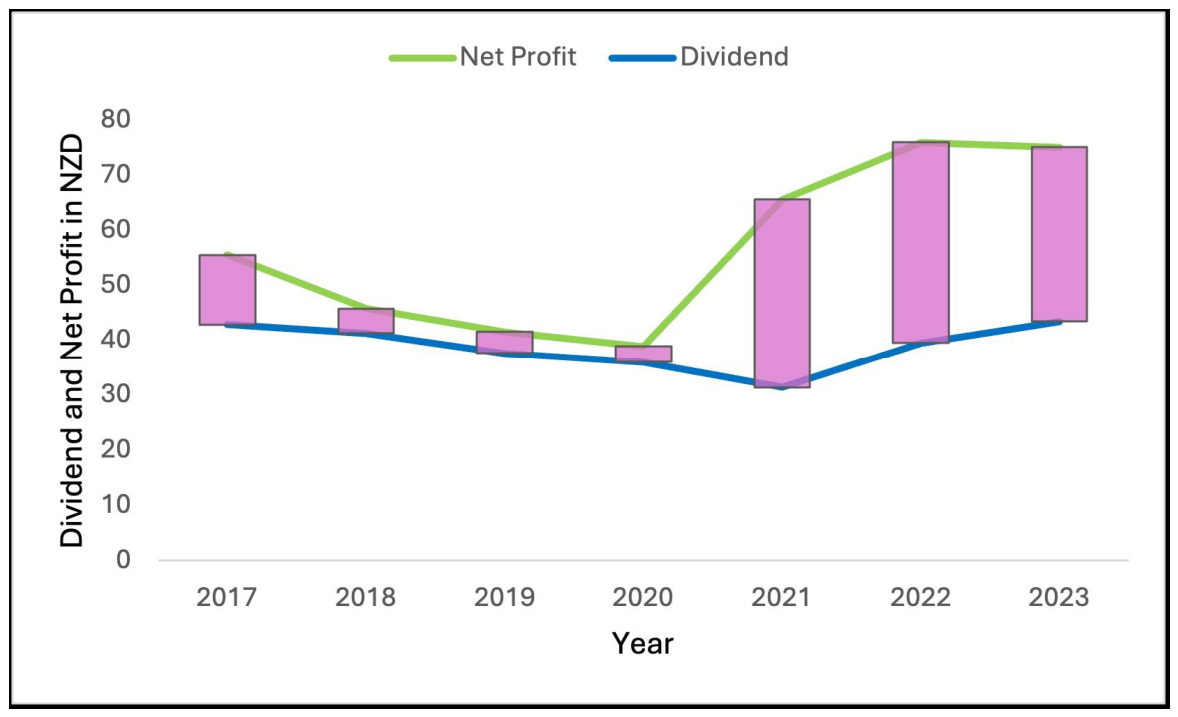
Berk & DeMarzo, 2017). The widening gap between net profit and dividends in the post-2021 period suggests that NZX-listed companies preserved profit for future uncertainties rather than paying dividends, which is consistent with pecking order theory (
Boumlik et al., 2023;
Theiri et al., 2023). Cash flow carries the largest absolute coefficient; short-run liquidity pressure binds tighter than any balance sheet item.
Market capitalisation (
p = 0.086) and firm age (
p = 0.464) add nothing once earnings are in the model, exactly as
Miller and Modigliani (
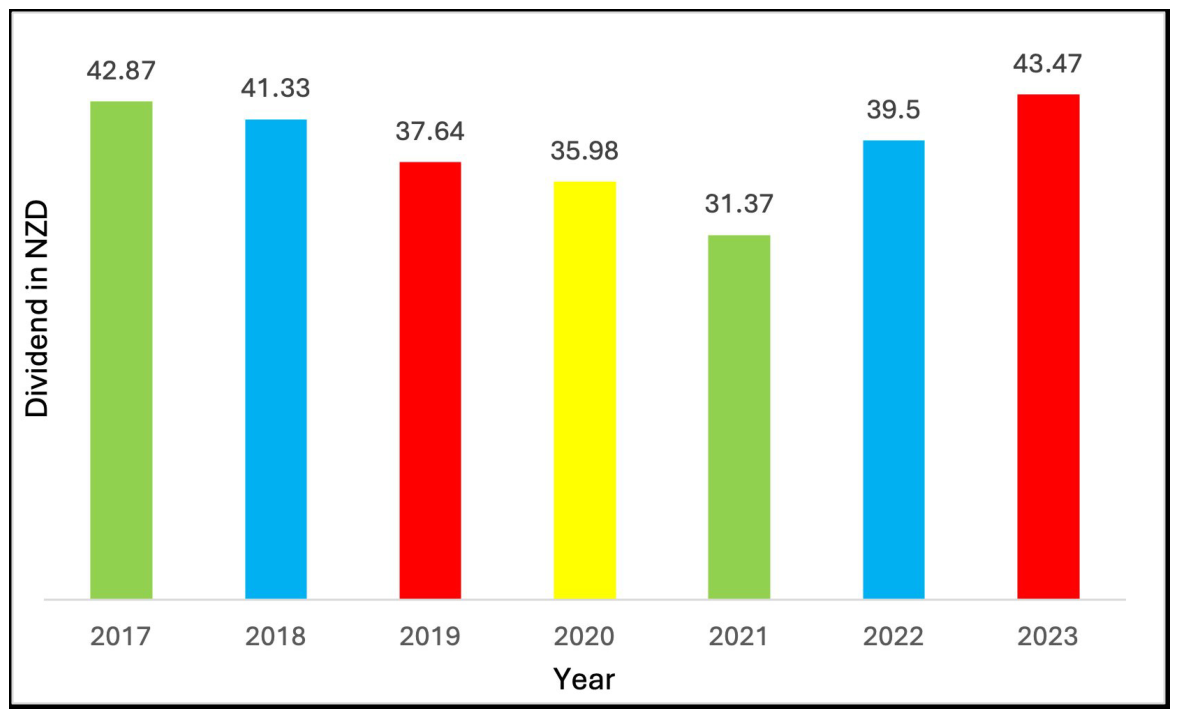
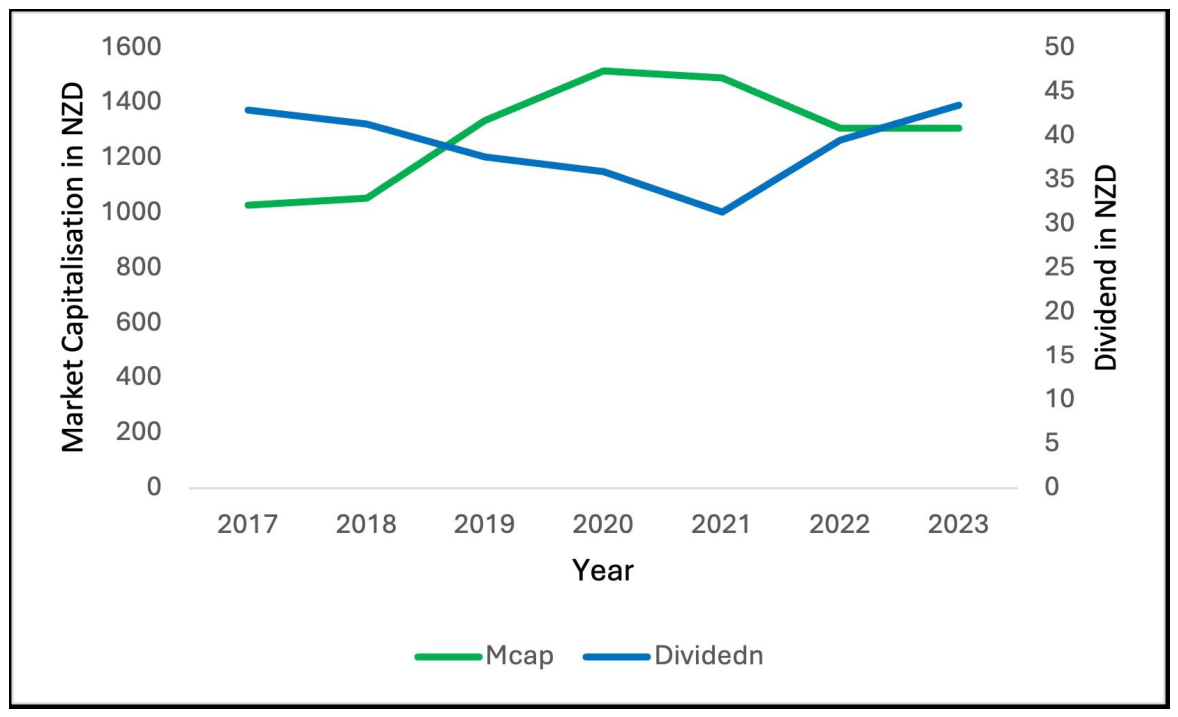
1961) predict. The divergence between market capitalisation and dividends over the panel period is instructive: market capitalisation reached its highest level in 2020, at precisely the point when dividends were lowest, suggesting that the dividend amount does not impact the market value of the share (
Kanakriyah, 2020;
AlGhazali & Yilmaz, 2023). Current assets and company age similarly exhibited no significant impact on dividend payouts (
Boumlik et al., 2023).
Taken together, the regression evidence supports H1: revenue and net profit enter positively at p < 0.001, cash flow and shareholders’ equity enter negatively at p < 0.001, and debt enters positively at p = 0.003. Every sign is consistent with the predictions of the signalling and pecking order frameworks, and the earnings-related variables carry the dominant coefficients. H1 is therefore fully supported by the panel regression.
5.2. Board Gender Diversity
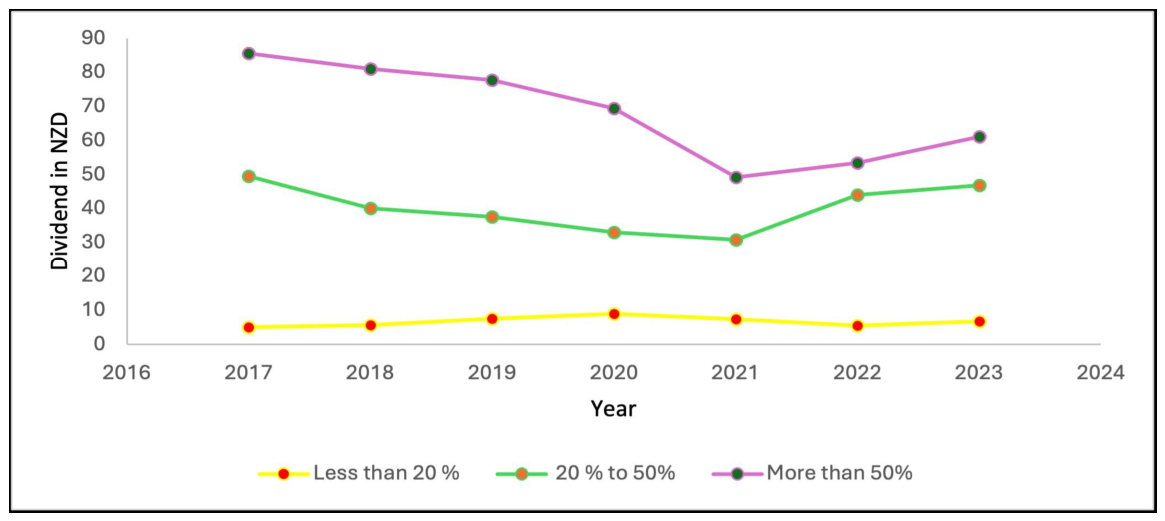
In 2017, NZX firms with majority-female boards paid 17 times more than those with under 20% female representation; by 2023 the ratio was 7:1, but the rank ordering never reversed. Seven years of uninterrupted consistency makes a single-year anomaly or sampling artefact unlikely as a full explanation, though the association remains correlational rather than causal.
Several alternative explanations for the seventeen-fold gap deserve explicit acknowledgement. First, firms with higher female board representation on the NZX may also be systematically larger, older, and more profitable than firms with lower representation, and those characteristics independently predict higher dividends (
Kanakriyah, 2020;
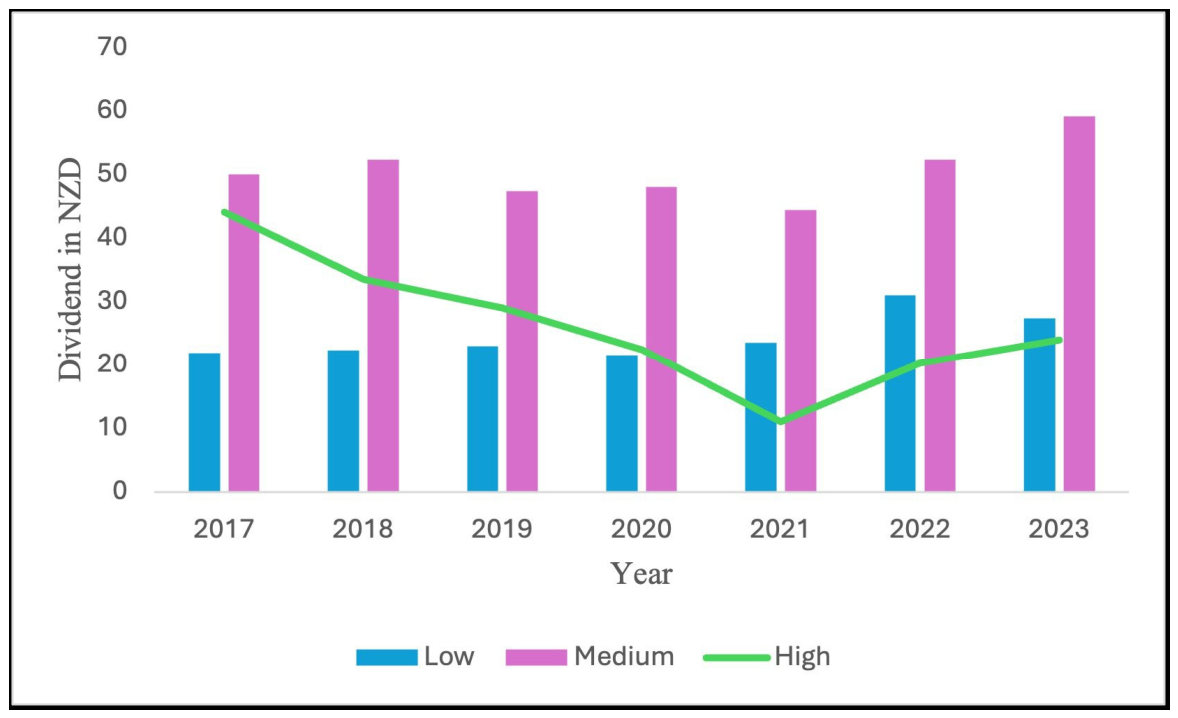
Neves et al., 2020). Second, board composition is correlated with industry: the healthcare, real estate, and finance sectors, which show both higher female representation and higher payout stability in our sample (
Table 3), draw revenue from captive domestic demand that supports steadier distributions regardless of governance (
Cejnek et al., 2021). Third, ownership structure may confound the observed association: closely held or founder-influenced firms may simultaneously appoint fewer female directors and retain more earnings (
Khan et al., 2022;
Kim et al., 2020). Because gender is examined through disaggregated descriptive comparison rather than as a regressor, we cannot separate the direct effect of board composition from these correlated firm-level characteristics. What the seven-year descriptive evidence establishes is that the association is robust and empirically consistent, not that gender diversity causes higher payout.
Section 4.4 controls for size, profitability, cash flow, and leverage in the panel regression but leaves the direct identification of gender and scope effects to future work with a longer panel or exogenous variation in board composition. NZX-listed companies with higher female representation on their boards are associated with higher dividend payouts throughout the panel, and the highest-diversity group recovered its 2017 level fastest following the mid-period trough (
Shaheen et al., 2023;
Duong et al., 2020).
The agency logic is the most direct read: diverse boards constrain speculative retention and push more cash toward shareholders (
Tarighi et al., 2023;
Low et al., 2015). Female representation on the board of directors is positively associated with higher dividend payouts (
Duong et al., 2020). Bird-in-hand reasoning adds a second channel: governance-minded boards may prefer certain distributions over uncertain reinvestment returns (
M. S. Ali, 2020). In New Zealand, where imputation credits amplify the value of cash dividends for domestic investors, both mechanisms reinforce each other.
Khan et al. (
2022)’s null result in Turkey tells us the effect is conditional: in that sample, most female directors represented controlling families and served family rather than broader shareholder interests, so the governance benefits of board diversity did not translate into observable payout behaviour (
Kim et al., 2020). Strong investor protections and governance-supportive regulation (
McDowell et al., 2020) are what make those agency benefits visible in payout data in markets like New Zealand. Studies in Vietnam and other emerging markets similarly revealed that female leadership and a diverse board can influence decisions that align with shareholder interests, such as higher dividend payouts (
Duong et al., 2020).
H2 is descriptively supported but not causally identified. The seventeen-fold payout gap between the most and least gender-diverse board categories held every year of the panel without reversal, and the highest-diversity group recovered fastest after the mid-period trough, both patterns consistent with the hypothesis. However, because gender was not entered as a regressor (it is largely time-invariant within firms and would be absorbed by the fixed effects), the association cannot be separated from correlated firm-level characteristics such as size, industry, and ownership structure. H2 is therefore supported as a robust empirical association, with causal identification left to future work.
5.3. Domestic vs. Multinational Firms
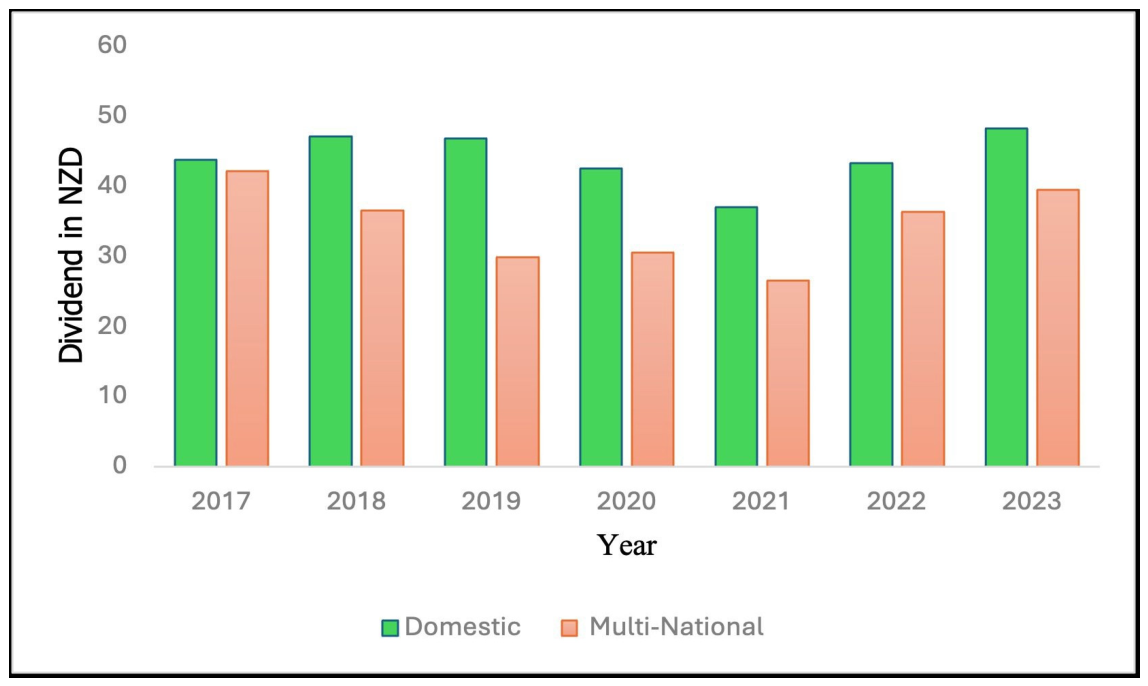
Domestic firms outpaid multinationals throughout. By 2023 the domestic group had cleared its 2017 baseline; multinationals had not. The gap peaked at NZD 16.9 m in 2019. Dividends of NZX-listed multinational companies were reduced more than those of domestic companies during the COVID-19 pandemic, and after the pandemic, dividends for domestic companies were greater than those of multinationals in the descriptive comparison, which is consistent with multinationals being more adversely affected (
Oliveira & Juca, 2021;
Guedhami et al., 2022).
As with the gender diversity result, the domestic premium is documented through descriptive comparison rather than a formal regression test that controls for confounders. Domestic NZX firms may differ systematically from multinationals in firm size, sector composition, and capital structure, and each of those characteristics independently affects dividend payout. Multinationals in our sample are also concentrated in industrials and IT—sectors that experienced sharper cash-flow volatility during 2020–2022—so the observed gap partly reflects a business-model effect rather than a pure geography effect (
Cejnek et al., 2021;
Cheema et al., 2023). The empirical pattern is therefore consistent with the pecking order explanation but does not identify operational scope as an independent causal driver of payout differences. The pecking order explains the direction: multinationals face foreign exchange exposure, multi-jurisdictional compliance costs, and supply-chain uncertainty that make precautionary cash retention rational (
Attig et al., 2021). Considering foreign markets’ political and fiscal uncertainty, multinational companies are more likely to minimise dividends during crises (
Oliveira & Juca, 2021). Purely domestic operators in New Zealand’s stable single-currency environment face none of those pressures (
Wellalage & Locke, 2013). Domestic companies focused on operational stability and received more favourable government support, which further reinforced the domestic dividend premium (
Guedhami et al., 2022).
Sector composition reinforces the gap: the healthcare, real estate, and finance sectors, where domestic operations dominate, also have the most captive revenue streams; industrials and IT, where multinationals concentrate, showed the sharpest volatility (
Cejnek et al., 2021;
Attig et al., 2021;
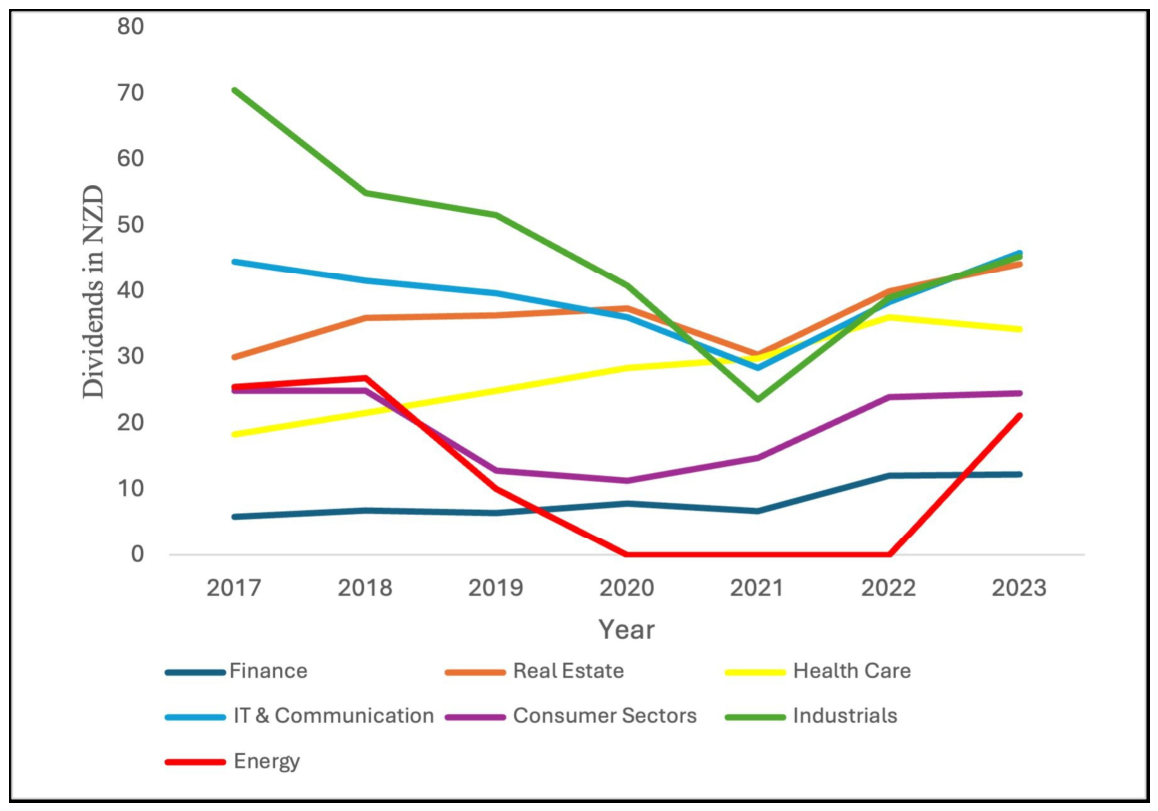
Cheema et al., 2023). The energy sector illustrates this most starkly, with dividends dropping to zero during 2020–2022 before a partial recovery (
Beer et al., 2023). Healthcare and real estate, by contrast, demonstrated strong and consistent dividend growth throughout the panel, reflecting the rising importance of healthcare during and after the COVID-19 pandemic and steady demand in the property sector (
Cejnek et al., 2021).
The COVID-19 pandemic had a statistically significant impact on dividend policies in NZX-listed companies. Companies in comparable markets reduced dividends significantly during the pandemic, prioritising liquidity over dividend distribution to preserve resources in uncertain times despite their capacity to pay (
Boumlik et al., 2023). Decreased sales, disruption in free cash flow due to government responses such as travel restrictions and lockdowns, and increased operational costs all contributed to reduced dividend capacity (
Theiri et al., 2023). Well-governed companies with more diverse boards were more capable of maintaining dividend policies during the disruption (
Tarighi et al., 2023), a finding that connects directly to the gender diversity result discussed above.
H3 is descriptively supported on both parts. Domestic firms outpaid multinationals in every year of the panel, and the gap widened under COVID-19 stress, reaching NZD 16.9 m in 2019 and remaining positive through 2023 despite the recovery. The descriptive pattern therefore supports both the level prediction and the stress-widening prediction of H3. As with H2, causal identification of operational scope as an independent driver requires a specification that separates geography from correlated sector and business-model effects and is left to future work.