5.1. Measurements
All questionnaire items came from established scales in the finance and innovation literature and were then adapted to fit the Jordanian banking sector. A bilingual expert translated the items from English into Arabic, and an independent translator back-translated them to check conceptual equivalence. The translators discussed and resolved any discrepancies.
For the Fintech Adoption Intensity Index and Green Finance Enhancement Index, the indicators measured in percentages, transaction volumes, API counts, portfolio size, and product counts were first converted to z-scores (mean = 0, SD = 1) and then summed. Standardization prevents differences in scale from allowing any one indicator to dominate the composite measure. The reported index ranges, 1.20–4.80, represent the resulting sums of the standardized values.
We distinguish formative from reflective constructs in the measurement model. Fintech Adoption Intensity and Green Finance Enhancement are treated as formative indices, meaning their indicators define the construct rather than result from it. Cronbach’s alpha is therefore not appropriate for these indices; instead, we report variance inflation factors (VIF) to evaluate multicollinearity among the indicators. Every VIF was below 3.0, suggesting that problematic multicollinearity was absent.
Absorptive capacity, regulatory push, and market demand are modeled as reflective constructs. Along with Cronbach’s alpha, we now report composite reliability (CR) and average variance extracted (AVE) for these measures. Each construct met the recommended thresholds (CR > 0.70, AVE > 0.50), confirming convergent validity. Discriminant validity was established through the Fornell–Larcker criterion, with the square roots of AVE exceeding the inter-construct correlations.
We revised the Organizational Capabilities (absorptive capacity) measure by removing ESG integration from the mediator, thereby eliminating its conceptual overlap with the dependent variable, green finance. The mediator now focuses solely on digital maturity, data analytics proficiency, and digital skills. It comprises five items covering digital infrastructure readiness, data analytics capability, digital skills availability, technological agility, and knowledge management processes. The revised scale has a Cronbach’s alpha of 0.86, CR = 0.89, and AVE = 0.62.
Before we tested the hypotheses, we assessed the reliability and validity of our measurement models. For reflective constructs,
Table 1 reveals that all variables demonstrate acceptable internal consistency (Cronbach’s alpha > 0.70, CR > 0.70, AVE > 0.50). For formative indices, VIF values were all below 3.0, confirming no problematic multicollinearity. Descriptive statistics for all key variables are presented in
Table 2.
Pearson correlation analyses were examined to test the preliminary relationships between the variables. The results are revealed in
Table 3.
The correlation matrix provides preliminary support for our hypotheses. The significant positive correlation between fintech domination and Green Finance Enhancement (r = 0.38, p < 0.01) confirms a preliminary association consistent with H1. Furthermore, both variables show significant positive correlations with Organizational Capabilities (r = 0.45 and r = 0.41, respectively, p < 0.01), supporting the premise that absorptive capacity is a key mechanism linking the two constructs.
Regulatory push exhibits significant correlations with both fintech domination (r = 0.29, p < 0.05) and Green Finance Enhancement (r = 0.35, p < 0.01), suggesting that a supportive policy environment is positively associated with both digital and sustainable finance outcomes. Notably, market demand shows no significant correlation with either fintech domination (r = 0.18, p > 0.05) or Green Finance Enhancement (r = 0.15, p > 0.05), providing early evidence that consumer demand may not yet be a strong driver of green finance adoption in the Jordanian context—a pattern that is further examined in our moderation analysis (H2b).
Table 4 reveals the results of hypothesis testing for H1 and H2 (a and b). H1: Fintech Adoption Intensity and Green Finance Enhancement. Model 1 confirms a statistically significant positive relationship (β = 0.249,
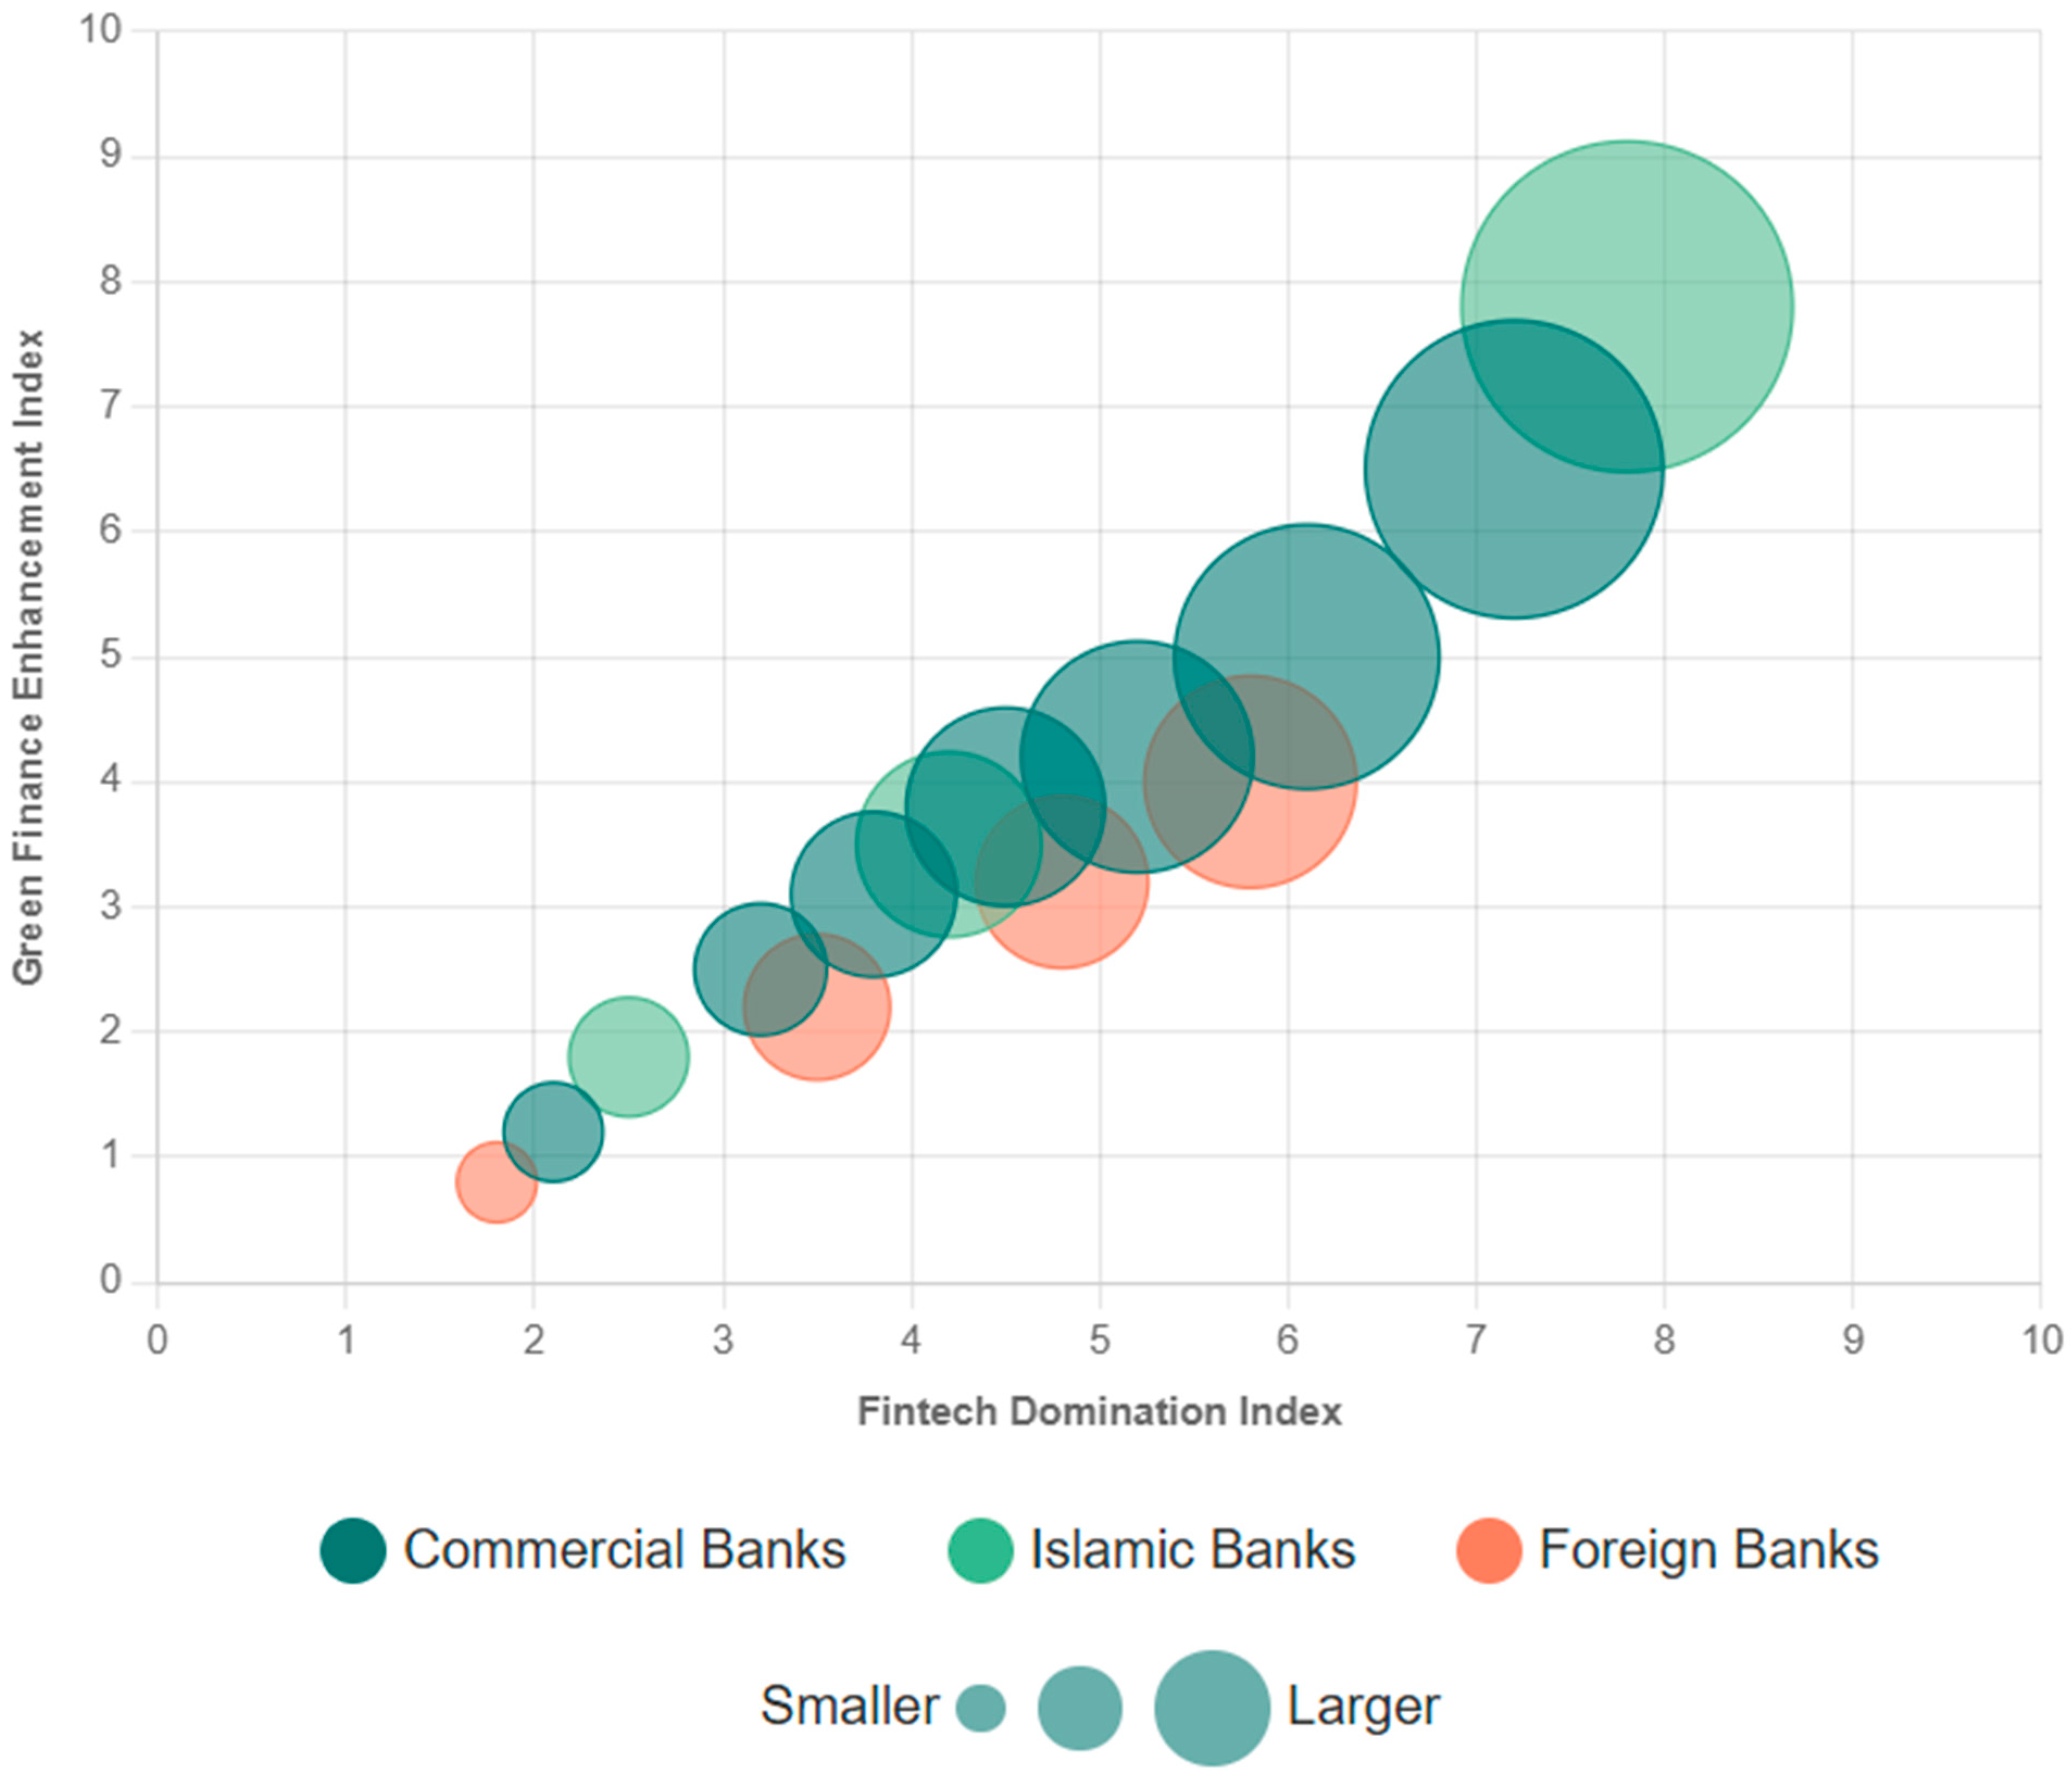
p < 0.05). This suggests that, on average, a one-unit increase in the fintech domination index is associated with a 0.249-unit increase in the Green Finance Index. This provides initial support for H1, indicating that Fintech development is positively associated with Green Finance Enhancement.
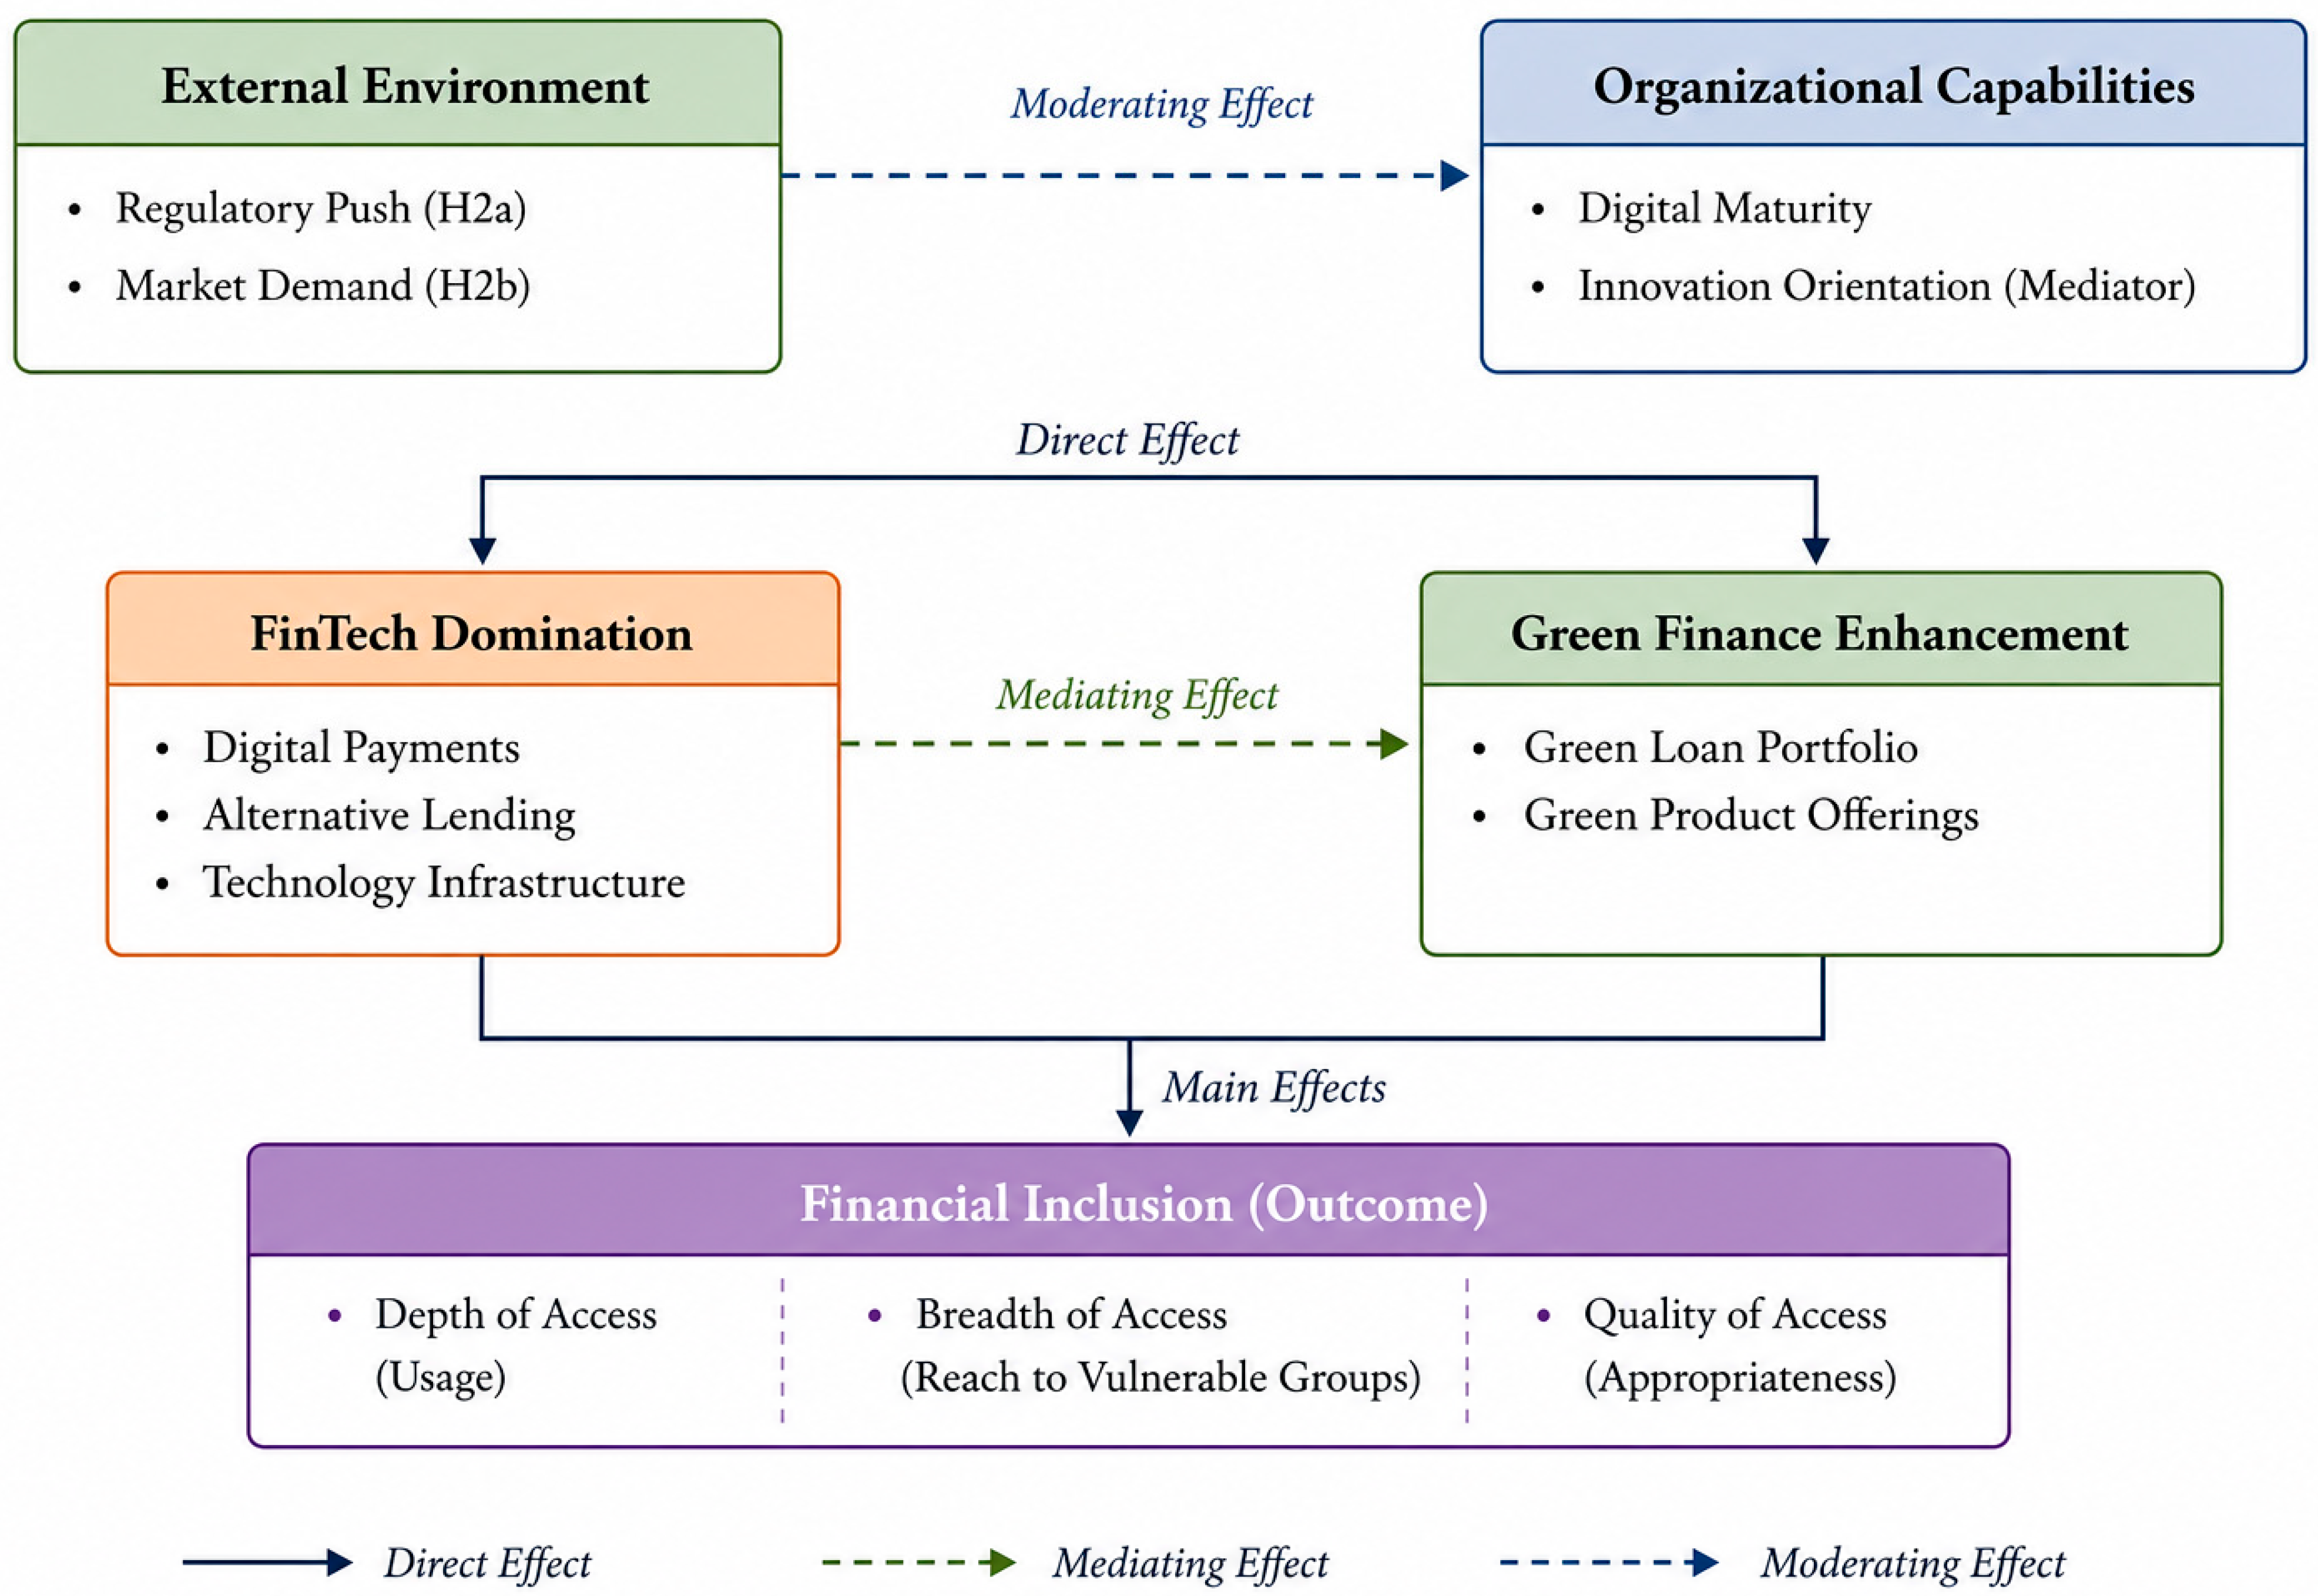
H2a. The Moderating Role of Regulation and Demand. The interaction terms in Model 1 were highly significant. The coefficient for the interaction term Fintech_Adoption × Regulatory_Push was positive and significant (β = 0.411, p < 0.01). This indicates that the positive effect of Fintech on green finance is stronger in banks where leadership perceives the regulatory environment (e.g., CBJ’s green taxonomy efforts and EIB technical assistance) as supportive and clear.
H2b. The Moderating Role of Market Demand: Conversely, the interaction term Fintech_Adoption × Market_Demand was not significant (β = 0.108, p > 0.1). This suggests that perceived customer demand for green products does not currently amplify the fintech–green finance link. Qualitative data help explain this: interviewees frequently noted that “demand is latent; customers won’t ask for a ‘green loan’ but they asked for a cheaper loan to install solar panels.”
H3. The Mediating Role of Organizational Capabilities. Given the small sample size (N = 21 banks), we employed bootstrapping with 5000 resamples (Preacher & Hayes, 2008) to test the indirect effect. The path analysis results, presented in Table 5, support the mediation hypothesis. The direct effect of Fintech Adoption Intensity on Green Finance (Path c’) became non-significant when the mediator (absorptive capacity) was introduced, while the paths from fintech to absorptive capacity (a) and from absorptive capacity to Green Finance (b) were both significant. The bootstrapped indirect effect was significant (β = 0.184, 95% CI [0.072, 0.311]). This implies that Fintech development builds a bank’s general digital and data analytics maturity, which in turn becomes a critical capability for designing, risk-assessing, and managing green finance products. This finding operationalizes the core mechanism of the digital–sustainability nexus: fintech builds a bank’s general absorptive capacity, which is the essential conduit through which it can then enhance its green finance offerings. The full mediation model produced a Cohen’s f2 effect size of 0.33, which indicates a large effect. Its predictive relevance was evaluated with the Stone–Geisser Q2 statistic; the resulting value was 0.31, confirming that the model was predictively relevant. A post hoc power analysis conducted in G*Power 3.1.9.7 found that, with N = 21, α = 0.05, and an observed R2 of 0.57, achieved power was 0.83—above the conventional 0.80 threshold.
These results reveal the core dynamics of the nexus. The positive relationship for H1 confirms that fintech acts as a catalyst, not a barrier. Critically, the strong moderation by regulatory push (H2a) shows this catalyst is supercharged by clear policy, while the insignificance of market demand (H2b) highlights a market failure where supply side stimulus is currently essential.
Bootstrapped CI: [0.072, 0.311] (does not include zero);
Mediation Type: Full mediation (c’ non-significant);
Variance Explained: R2 = 0.57 for full model.
Path analysis conducted using Structural Equation Modeling (SEM) with maximum likelihood estimation. Bootstrapping with 5000 samples was used for indirect effect confidence intervals.
Data Source: Survey of 21 Jordanian banks (N = 21) with measures of fintech domination, Organizational Capabilities, and Green Finance Enhancement.
Standardized coefficients are shown. Solid lines indicate significant paths (p < 0.05).
H4. The Synergistic Effect on Financial Inclusion. Model 3 at the household level tested the interaction effect between fintech usage and green product usage on financial inclusion. The dependent variable was measured as formal account ownership (binary, logistic regression) and number of financial products used (continuous, OLS regression). The interaction term between fintech usage and green product usage was positive and highly significant (β = 0.502, p < 0.01). This indicates a synergistic effect: the positive impact on financial inclusion is greater than the sum of its parts when individuals use both digital and green financial tools. This path analysis uncovers the mechanism behind H1. The significant indirect effect and full mediation demonstrate that fintech’s influence is not direct; it is channeled through building the bank’s absorptive capacity. This means investments in digital tools alone are insufficient; they must be paired with efforts to build the data and analytical skills needed to apply them to green finance. Table 6 reveals the regression reults of key models. To test the synergistic effect of fintech and green finance on financial inclusion at the household level (H4), we employed both logistic regression (for binary inclusion outcomes) and OLS regression (for continuous inclusion depth measures) reveals in
Table 7.
The logistic regression results confirm a significant positive interaction effect (Odds Ratio = 1.72, p < 0.01), indicating that the likelihood of being formally included in the financial system is significantly higher when an individual uses both digital and green financial products. The OLS regression results similarly reveal a synergistic effect (β = 0.50, p < 0.01), demonstrating that the combined usage of these products yields a disproportionately greater increase in the depth of financial inclusion. Together, these findings provide robust support for H4, which posits that the synergistic effect of high levels of both fintech and green finance leads to significantly higher levels of meaningful financial inclusion.
5.2. Robustness Checks
To assess the robustness of our findings, we conducted several additional analyses.
We first re-estimated the models using alternative operationalizations of the key constructs. When digital transaction volume replaced IT budget allocation as the measure of Fintech Adoption Intensity, it showed a significant positive relationship with Green Finance Enhancement (β = 0.298, p < 0.05). The results remained consistent when Green Finance Enhancement was measured by the number of green products offered rather than loan portfolio size (β = 0.367, p < 0.01). The findings, then, did not depend on a single measurement approach.
Second, we checked the mediation analysis through bootstrap estimation based on 5000 replications. Absorptive capacity showed a significant indirect effect (β = 0.187, 95% CI: 0.061–0.321), supporting its mediating role (H3).
We also assessed common method bias with Harman’s single-factor test. The single factor explained 23.4% of the total variance, which is below the 50% threshold and suggests that common method bias is unlikely to pose a serious threat to the validity of our findings. To address the concern further, we used procedural remedies such as anonymity, counterbalancing the order of questions, and providing clear instructions.
We acknowledge that our cross-sectional design has limitations. Although the findings remain consistent across multiple specifications, establishing causality will require future studies using quasi-experimental designs or natural experiments.





 OC
OC