Article

Non-Interest Income Diversification and Bank Performance: Scale Advantages and Institutional Boundary Conditions in Selected Emerging Asian Economies

KMITL Business School, King Mongkut’s Institute of Technology Ladkrabang, Bangkok 10520, Thailand
*
Author to whom correspondence should be addressed.
J. Risk Financial Manag. 2026, 19(8), 580; https://doi.org/10.3390/jrfm19080580
Submission received: 7 May 2026 / Revised: 8 June 2026 / Accepted: 19 June 2026 / Published: 3 August 2026
(This article belongs to the Section Banking and Finance)

Abstract

This study examines how non-interest income diversification affects bank performance and risk in selected emerging Asian economies. Drawing on panel data from 44 banks across China (36) and Thailand (8) over 2022–2025, the analysis employs fixed-effects regressions, mediation analysis, and subsample testing to unpack the performance implications of revenue diversification. The non-interest income ratio (NII) serves as the proxy for income diversification, capturing the strategic shift away from traditional net-interest margins toward fee-based and digitally facilitated activities in markets where mobile payment ecosystems and virtual banking frameworks have reshaped competitive dynamics. Results indicate that NII exerts a statistically significant positive effect on bank profitability (ROA and ROE), with no corresponding increase in risk exposure as measured by Z-score. The relationship is markedly stronger among large banks, consistent with scale advantages in technology infrastructure, network effects, and regulatory compliance cost amortization. Cost efficiency does not mediate the NII-performance nexus, suggesting that revenue-side mechanisms dominate in this context. Cross-country exploratory patterns reveal stable but modest effects in China’s mature diversification ecosystem against larger but statistically imprecise coefficients in Thailand’s early-stage transition. These findings offer a qualified complement to the Western-centric complexity-risk narrative and highlight institutional boundary conditions governing bank diversification outcomes in emerging markets.

1. Introduction

1.1. Background and Motivation

The global banking sector has undergone a fundamental structural transformation over the past decade, driven by the rapid proliferation of digital financial technologies. Mobile payment ecosystems, virtual banking platforms, and open banking frameworks have collectively reshaped the revenue architecture of commercial banks worldwide (Alsobai & Aassouli, 2025; Vives, 2019). As Vial (2019) emphasizes in his systematic review, digital transformation fundamentally reconfigures organizational value creation through the deep integration of digital technologies into business models, a process that naturally extends to the restructuring of revenue architectures in financial institutions. This digital shift has accelerated most visibly in Asia, where several economies have leapfrogged traditional banking infrastructure to adopt mobile-first financial services at scale. Understanding how this transformation affects bank performance and stability has become a pressing concern for academics, regulators, and industry practitioners.
It is important to clarify at the outset that this study examines non-interest income diversification broadly defined, rather than digital transformation or digital fee income specifically. The non-interest income ratio (NII) serves as a proxy for revenue diversification, capturing the strategic shift away from traditional net-interest margins toward fee-based activities. While the recent growth of NII in China and Thailand has been shaped by digital financial expansion, the measure itself subsumes both digitally facilitated and traditional non-digital activities.
China represents perhaps the most mature example of digital banking ecosystem development in an emerging market context. The dominance of Alipay and WeChat Pay has fundamentally altered consumer financial behavior, while large state-owned banks have progressively expanded their digital service portfolios to encompass wealth management, insurance distribution, and cross-border payment solutions (Frost et al., 2019). By 2024, the major Chinese banks reported non-interest income ratios averaging approximately 25%. This increase reflects not only traditional fee-based activities but, critically, the rapid growth of digitally enabled services: mobile payment processing fees, digital wealth management commissions, online insurance distribution, and cross-border digital remittances (Frost et al., 2019). A conceptual boundary is necessary. The non-interest income ratio subsumes trading gains, investment banking fees, insurance commissions, wealth management charges, card fees, and underwriting income, not all of which are digitally delivered. Consequently, NII should not be equated with non-interest income diversification itself, a construct more precisely captured by technology investment ratios (Do et al., 2022), text-based digital keyword frequencies (Nguyen-Thi-Huong et al., 2023), regional policy interaction terms (Wu & Cheng, 2024), or efficiency-ESG composite metrics (Zhu & Jin, 2023). The present study treats NII as a proxy for revenue diversification, acknowledging that its recent growth in China and Thailand has been shaped by digital financial expansion without assuming that all non-interest income is digitally generated. This transformation has occurred within a tightly regulated environment characterized by the China Banking and Insurance Regulatory Commission’s sustained oversight and the implicit guarantees associated with state ownership.
The regulatory environment in China has evolved considerably during this period. Following the 2020 Ant Group IPO suspension, Chinese regulators introduced extensive new rules governing fintech operations, data privacy, and consumer protection. These regulations have forced banks to reevaluate their digital strategies, shifting from aggressive fintech expansion toward more sustainable, compliance-oriented non-interest income diversification. The 2023 establishment of the National Financial Regulatory Administration further consolidated oversight, introducing unified supervision across banking, insurance, and securities sectors. This regulatory tightening has had measurable effects on bank revenue structures, as previous high-margin fintech activities faced new constraints while more traditional fee-based services gained renewed prominence.
The Chinese banking sector’s digital evolution also reflects broader economic structural changes. As the economy transitions from investment-led growth toward consumption-driven development, banks have increasingly focused on retail digital services, consumer finance, and wealth management for a growing middle class. The proliferation of digital payment infrastructure has created foundation layers upon which more sophisticated financial services can be built, including insurance distribution, fund sales, and cross-border remittances.
Thailand presents a contrasting institutional context. While digital payment adoption has grown steadily, the banking sector remains in an earlier phase of non-interest income diversification. The approval of three virtual bank licenses in June 2025, with operations scheduled to commence by mid-2026, signals an impending inflection point. The consortiums selected suggest a model in which incumbent financial institutions leverage technology partnerships to accelerate digital capabilities (Bank of Thailand, 2025). This policy experiment offers a natural laboratory for examining digital banking effects during early-stage transition.
The Thai banking landscape presents distinct characteristics relevant to non-interest income diversification analysis. Unlike China, where state-owned banks dominate, Thailand’s banking sector features greater private ownership concentration, with the top five banks controlling approximately 70% of total assets. This ownership structure creates different incentive dynamics for digital investment. Thai banks have historically been more conservative in technology adoption, prioritizing stability over innovation. However, the competitive pressure from impending virtual bank entry has catalyzed accelerated digital spending among incumbents.
The regulatory approach to digital banking in Thailand also merits attention. The Bank of Thailand’s sandbox framework, introduced in 2017, provided early opportunities for testing innovative financial services under relaxed regulatory conditions. The virtual bank licensing framework adopted in 2024–2025 represents a significant evolution, establishing clear criteria for digital-only banking operations while maintaining prudential safeguards. This staged regulatory approach offers insights into how emerging market regulators can balance innovation promotion with financial stability objectives.
The 2022–2025 window is particularly informative for examining non-interest income diversification under macroeconomic transition. In China, this period captures the post-COVID-19 recovery phase, marked by declining net interest margins as policy rates adjusted to support a consumption-led revival and absorb real estate sector liquidity strains. In Thailand, the window covers the pre-virtual bank transition, where incumbent banks accelerated digital spending ahead of the 2025 licensing decision amid a globally shifting interest rate environment. Rather than treating this as a standard short panel, the study leverages this convergence of regulatory tightening, competitive disruption, and margin compression to observe whether diversified revenue streams can offset traditional interest income erosion during structural adjustment.
The central tension motivating this study concerns the dual nature of non-interest income diversification. On one hand, expanding into non-interest income streams may enhance profitability by reducing dependence on interest rate spreads and leveraging existing customer relationships. On the other hand, non-traditional activities may introduce new risk exposures, operational complexity, and regulatory challenges (Stiroh, 2004; Lepetit et al., 2008). Whether this risk–performance trade-off manifests similarly in emerging Asian markets remains an open empirical question.

1.2. Research Gaps and Questions

Despite the growing literature on digital banking and income diversification, three significant gaps persist. First, existing empirical evidence remains predominantly focused on Western banking systems. Studies by Stiroh (2004), DeYoung and Roland (2001), and Lepetit et al. (2008) established important benchmarks, yet their findings may not travel well to institutional environments with different regulatory intensity, ownership structures, and digital maturity levels. While Tuli (2023) provides a systematic review of digital banking adoption across developing Asian economies, this body of work remains largely descriptive and technology-focused; rigorous comparative evidence linking non-interest income diversification to bank performance and stability outcomes in these institutional contexts is still scarce. The comparative analysis of selected emerging Asian economies remains substantially underdeveloped.
Second, the prevailing literature largely assumes a universal risk–performance trade-off, wherein income diversification increases bank fragility as a mechanical consequence of operational complexity. This assumption has been challenged by more recent evidence from regulated emerging markets, where strict supervisory oversight and concentrated ownership may contain risk-taking incentives. The possibility that institutional boundary conditions mediate the diversification-risk relationship has not been systematically explored. The heterogeneous composition of NII, encompassing both digitally facilitated and traditional fee-based activities, introduces measurement limitations that prior studies have not fully addressed in multi-country emerging market panels.
Third, the role of bank scale as a conditioning factor for non-interest income diversification outcomes remains inadequately theorized. While the digital divide literature has documented differential technology adoption across firm sizes (Alsobai & Aassouli, 2025), the specific mechanisms through which scale advantages translate into superior returns from non-interest income diversification have not been clearly articulated in the banking context.
Against these gaps, this study addresses four research questions: (RQ1) Does non-interest income diversification enhance bank profitability in emerging Asian markets? (RQ2) Does the magnitude of performance gains vary systematically with bank scale? (RQ3) Does non-interest income diversification increase bank risk in these institutional contexts? (RQ4) Does cost efficiency mediate the NII-performance relationship?


1.3. Contributions

This study offers several contributions to the banking and income diversification literature. Theoretically, it provides recent panel evidence that in tightly regulated emerging Asian economies, non-interest income expansion may yield performance benefits without commensurate risk increases, offering a qualified complement to the predominantly Western-centric complexity-risk evidence. The identification of bank scale as a critical boundary condition represents a second contribution. By demonstrating that the performance benefits of non-interest income diversification concentrate among large banks, the study extends digital divide theorizing to the financial sector and illuminates the structural mechanisms, technology infrastructure advantages, customer network effects, and compliance cost amortization, that underpin this scale premium in emerging markets. Methodologically, the multi-country panel design combining fixed-effects estimation with mediation analysis and subsample testing provides comparative evidence from China and Thailand during a period of rapid digital financial acceleration. The automated data collection framework using Yahoo Finance and World Bank APIs ensures reproducibility and transparency. From a policy perspective, the findings carry implications for Thailand’s forthcoming virtual bank regime, China’s ongoing digital financial governance, and broader questions concerning the distributional consequences of non-interest income diversification mandates across banks of different sizes.

1.4. Structure of the Paper

The remainder of the paper proceeds as follows. Section 2 reviews the relevant literature and develops the hypothesis framework. Section 3 describes the data sources, variable construction, and econometric methodology. Section 4 presents the empirical results, including baseline regressions, heterogeneity analysis, mediation testing, and robustness checks. Section 5 discusses the findings and their implications for theory, practice, and policy. Section 6 concludes with a summary of contributions, limitations, and directions for future research.

2. Literature Review

2.1. Non-Interest Income Diversification and Bank Performance: The Revenue—Diversification Perspective

The theoretical foundations for understanding how non-interest income diversification affects bank performance rest on two pillars, financial intermediation theory and scope economies. Diamond (1984) established that financial intermediaries create value by economizing on monitoring costs through delegated oversight. Thakor (2020), in his comprehensive review of fintech and banking, documents how technological innovation has fundamentally reshaped the financial intermediation landscape, forcing a re-evaluation of traditional delegated monitoring frameworks in light of platform-based and algorithmic intermediation. In the digital era, this intermediation function extends beyond traditional credit allocation to encompass payment processing, wealth management, insurance brokering, and ecosystem platform services. Banks that successfully diversify into non-interest income activities can leverage existing customer relationships and informational advantages to generate additional revenue streams without proportionally increasing costs (Elsas et al., 2010).
The empirical evidence on income diversification and performance in Western banking systems has yielded mixed but generally supportive findings. DeYoung and Roland (2001) found that increased fee-based activity was associated with higher revenue volatility but also enhanced profitability. Mercieca et al. (2007) documented a positive relationship between non-interest income and bank performance in European small banks, though with diminishing returns at higher diversification levels. More recent work by Alsobai and Aassouli (2025) provide a PRISMA-guided systematic review documenting that digital transformation strategies are generally associated with improvements in efficiency, competitiveness, and operational effectiveness in retail banking.
The emerging market context has attracted growing attention, yet the evidence remains fragmented. Sanya and Wolfe (2011) document that revenue diversification benefits banks in emerging economies, potentially because lower starting levels of diversification imply higher marginal returns. Lin et al. (2012) report that fee income and diversification improve profitability in Asian banks, though risk implications vary by bank size and market development. Lee et al. (2014) found that non-interest income enhances profitability in North American and Asian banking sectors but caution that the risk–return profile depends on activity composition. In China specifically, Zhou (2014) examines the effect of income diversification on bank risk, finding that the relationship is sensitive to regulatory regime and ownership type. Nguyen (2019) reports that revenue diversification reduces risk and improves performance for Vietnamese commercial banks. More recently, Zhao and Mei (2025) provide evidence from Chinese commercial banks that non-interest income diversification strengthens performance, particularly when accompanied by cost efficiency improvements. These studies collectively establish that the diversification-performance nexus in emerging Asia may diverge from Western benchmarks, yet several aspects remain unresolved. Most existing evidence relies on single-country samples or pre-pandemic data; cross-country comparative panels covering the post-pandemic digital acceleration phase remain scarce. Moreover, while the scale-dependency of diversification has been noted, the specific mechanisms, technology infrastructure advantages, network effects, and compliance cost amortization, have not been directly tested in a multi-country emerging market setting with recent data. The present study addresses this gap by examining whether the NII-performance relationship varies systematically with bank scale and institutional context in China and Thailand during 2022–2025.
However, the specific mechanisms through which diversification operates may differ from Western contexts. In Asia, digital platforms enable banks to embed financial services within broader ecosystems, creating revenue opportunities that are fundamentally different from standalone fee-based activities. The integration of banking services with e-commerce, social media, and lifestyle platforms generates network effects that can amplify returns to diversification beyond what traditional analysis would predict.
The conceptual framework connecting non-interest income diversification to bank performance can be understood through three interconnected pathways. First, the direct revenue pathway captures income generated from new digital products and services, including transaction fees, advisory services, and platform commissions. Second, the indirect revenue pathway encompasses cross-selling benefits, where digital engagement enhances customer retention and increases the probability of selling additional products to existing customers. Third, the information pathway reflects the value of data generated through digital and non-digital interactions. These pathways are particularly salient in emerging Asian markets due to high mobile penetration rates and government support for digital financial inclusion.
Hypothesis 1.
Non-interest income diversification exerts a positive effect on bank profitability (ROA and ROE) in selected emerging Asian economies.

2.2. Non-Interest Income Diversification and Bank Risk

The complexity-risk hypothesis offers a countervailing theoretical perspective. This position holds that non-interest income activities tend to be more volatile, less transparent, and more operationally complex than traditional lending (Stiroh, 2004). Lepetit et al. (2008) found that European banks with higher non-interest income exhibited greater risk profiles. DeYoung and Roland (2001) similarly documented increased earnings volatility associated with fee-based income expansion.
A structural distinction between Western and Asian banking systems is often overlooked in the diversification-risk literature. In Western markets, non-interest income has historically been dominated by trading gains, derivatives, and investment banking activities, which are inherently volatile and opaque (Stiroh, 2004; Lepetit et al., 2008). In emerging Asia, by contrast, the recent growth in NII has been driven predominantly by retail mobile payment ecosystems, digital wallet transaction fees, and platform-based financial services. China’s Alipay and WeChat Pay, for instance, generate sticky, high-frequency transactional revenues that are fundamentally different from the trading-oriented NII observed in Western banks. Thailand’s PromptPay infrastructure similarly facilitates low-risk, retail-oriented digital payment flows. This compositional difference suggests that the complexity-risk nexus may operate differently in Asian markets, where digital NII is anchored in consumer payments rather than capital-market activities.
However, the applicability of these findings to emerging Asian markets requires careful reconsideration. Wang and Lin (2021) examined the relationship between income diversification and bank risk across the Asia Pacific region, documenting significant heterogeneity in the diversification-risk nexus across institutional contexts. Nevertheless, their analysis treats non-interest income as a homogeneous aggregate, leaving unresolved whether digitally driven diversification carries distinct risk implications in tightly regulated emerging markets where regulatory intensity, ownership structure, and digital maturity differ markedly from Western settings. Regulatory intensity in both China and Thailand substantially exceeds that in Western banking environments. The CBIRC’s granular oversight and the Bank of Thailand’s conservative licensing framework constrain risk-taking latitude. The early-stage nature of non-interest income diversification means banks have not reached complexity thresholds where risk accelerates. Additionally, ownership structure matters: 36 of 44 sample banks are state-affiliated entities with implicit government guarantees (Sapienza, 2004).
These boundary conditions suggest a reformulated risk hypothesis. Rather than assuming a positive risk diversification relationship, the study posits risk neutrality: non-interest income diversification need not materially increase bank risk in institutional environments characterized by strict supervision, early-stage transformation, and concentrated public ownership.
Hypothesis 2.
Non-interest income diversification does not significantly increase bank risk (as measured by Z-score) in the sampled economies.

2.3. Bank Scale as a Boundary Condition

The digital divide literature provides a theoretical lens for understanding how bank scale conditions non-interest income diversification effectiveness. Alsobai and Aassouli (2025) document that large banks possess systematic advantages in digital strategy implementation, stemming from capacity to invest in proprietary technology platforms, attract specialized talent, and absorb fixed compliance costs.
Three specific mechanisms underpin the scale advantage. First, technology infrastructure: large banks develop proprietary digital platforms with integrated services, while smaller institutions rely on third-party white-label solutions (Berger, 2003). Second, customer network effects: large banks operate at minimum efficient scale for digital platform economics, achieving lower marginal costs per transaction (Fuster et al., 2019). Third, compliance cost amortization: fixed regulatory costs are distributed across larger asset bases (Vives, 2019).
The empirical evidence on scale and diversification benefits has been suggestive but largely confined to developed markets. Chiorazzo et al. (2008) found that diversification gains were concentrated among larger Italian banks, while Berger et al. (2010) documented that scale economies in banking extend to non-traditional activities. The present study examines whether the NII-performance relationship varies with bank scale in China and Thailand during 2022–2025, offering a comparative test of these scale advantages under institutional conditions, digital platform economics, regulatory compliance costs, and state ownership—that differ markedly from developed markets.
Hypothesis 3.
The positive relationship between non-interest income diversification and bank performance is stronger among large banks compared to small banks.
The digital dimension introduces additional scale considerations beyond traditional banking. Digital platform economics are characterized by high fixed costs and low marginal costs, creating natural scale advantages for larger institutions. The development of proprietary digital infrastructure, such as mobile banking apps, API platforms, and data analytics systems, requires substantial upfront investment that is only economically viable for banks with sufficient customer bases to amortize costs. Small banks that rely on third-party solutions may achieve basic digital capabilities but lack the customization and integration depth needed to capture full diversification benefits.

2.4. Cost-Side Versus Revenue-Side Mechanisms

An important question concerns the channel through which non-interest income diversification affects performance. The cost efficiency hypothesis posits that technology adoption reduces operational costs through automation and process optimization (Berger & Mester, 1997). The revenue mechanism offers an alternative, non-interest income diversification enhances performance by generating new revenue streams through customer retention, ecosystem lock-in, and cross-selling. In Asia, where super-app strategies dominate, banks increasingly view diversified platforms as revenue-generating ecosystems rather than cost-saving tools (Barroso & Laborda, 2022).
The distinction carries theoretical and managerial implications, though empirical separation is difficult. The cost-to-income ratio (CIR), defined as operating expenses divided by total revenue, is a broad accounting composite that reflects both cost management and revenue generation. Because the denominator expands with successful revenue-side strategies while the numerator may fall with cost-side automation, CIR cannot cleanly isolate one mechanism from the other. The present study therefore treats CIR mediation as a diagnostic test rather than a definitive structural decomposition.
Hypothesis 4.
Cost efficiency does not mediate the relationship between non-interest income diversification and bank performance.

2.5. Cross-Country Institutional Differences: China Versus Thailand

China’s digital financial ecosystem is substantially more mature, with higher NII ratios and more sophisticated platform integration. This maturity may imply diminishing marginal returns to further diversification. Thailand stands at an earlier stage, with pending virtual bank entry introducing competitive dynamics that may accelerate digital innovation. Thai banks may face higher marginal returns given the larger gap between current capabilities and frontier possibilities.
Hypothesis 5.
The magnitude of the NII-performance relationship differs between China and Thailand, reflecting variation in digital ecosystem maturity and institutional context.

2.6. Summary of Hypotheses

The five hypotheses developed above are summarized in Table 1.

3. Materials and Methods

3.1. Sample and Data

The sample comprises 44 commercial banks in China and Thailand, observed over 2022–2025, yielding 176 bank-year observations. The Chinese subsample includes 36 A-share listed banks: six state-owned commercial banks, nine joint-stock commercial banks, and 21 city and rural commercial banks. The Thai subsample includes eight SET-listed banks: Bangkok Bank, Kasikornbank, Krung Thai Bank, TMBThanachart Bank, Tisco Financial Group, Kiatnakin Phatra Bank, Land and Houses Financial Group, and CIMB Thai Bank. Siam Commercial Bank was excluded due to incomplete data during its restructuring into SCBX Group.
Financial data were collected using the Yahoo Finance API (Yahoo Inc., Sunnyvale, CA, USA) through Python 3.14.5 (Python Software Foundation, Wilmington, DE, USA) scripts, supplemented by the yfinance library and wbdata for macroeconomic indicators. Non-interest income was calculated as total revenue minus net interest income, scaled by total revenue. Return on assets and return on equity were computed from net income relative to total assets and shareholders’ equity. The Z-score was calculated as (ROA plus equity-to-assets ratio) divided by the standard deviation of ROA (Lepetit et al., 2008; Boyd et al., 2006). Macroeconomic controls were sourced from World Bank indicators. All financial variables were winsorized at the 1% level.
The Z-score calculation deserves additional explanation. Following established practice in the banking literature, the Z-score measures the number of standard deviations by which returns can fall before equity is exhausted. A higher Z-score indicates greater bank stability and lower probability of insolvency. The specific formulation employed here captures both the level of profitability and the volatility of returns in a single comprehensive metric. While the Z-score captures overall insolvency risk by combining profitability, capital adequacy, and return volatility, it may not fully isolate specific risk dimensions such as earnings volatility or asset quality shifts. Alternative risk proxies are therefore examined in the robustness checks.
The data collection process involved automated Python scripts accessing the Yahoo Finance API, supplemented by the yfinance library for equity data and wbdata for macroeconomic indicators. This approach ensures full reproducibility of the dataset. The scripts collected annual financial statement data for all 44 sample banks, including balance sheet items, income statement components, and equity market information. Data validation procedures included cross-checking totals, verifying accounting identities, and identifying outliers for manual review.
The construction of the non-interest income ratio requires careful consideration of definitional issues. In the Chinese banking context, non-interest income includes fee and commission income, net trading gains, net gains from investment securities, and other operating income. Fee and commission income encompasses payment processing fees, wealth management fees, trust services, and insurance distribution commissions. In the Thai context, similar categories apply, though the relative weights differ due to variation in the development of capital markets and wealth management industries.
The automated data collection via Yahoo Finance API provides aggregate non-interest income figures but does not disaggregate them into digital versus traditional fee components. Consequently, the analysis adopts a total revenue diversification perspective rather than isolating a specific digital fee income sub-component. This measurement limitation is discussed further in section of limitations and future research.
The panel structure, while short in the time dimension (T = 4), satisfies minimum requirements for fixed-effects estimation and is appropriate given the focus on recent non-interest income diversification dynamics (Wooldridge, 2020). The study period captures the macroeconomic transition and institutional adjustment described in section of background, including China’s post-pandemic digital acceleration and regulatory tightening, and Thailand’s virtual bank application, evaluation, and approval phases.

3.2. Variable Definitions

Table 2 presents the variable definitions. The dependent variables capture profitability (ROA and ROE) and stability (Z-score). The core independent variable, NII, measures revenue diversification into fee-based and non-traditional activities.

3.3. Descriptive Statistics and Correlation Analysis

Table 3 reports descriptive statistics. The mean NII ratio is 0.247, with Chinese banks averaging slightly higher (0.250) than Thai banks (0.233). Chinese banks exhibit notably higher Z-scores (mean = 195.99 vs. 88.77), consistent with state ownership and implicit guarantees. Thai banks display higher mean ROA (0.0109 vs. 0.0072) but greater volatility. The cost-to-income ratio averages 0.336, with Thai banks operating more efficiently (0.298 versus 0.345).
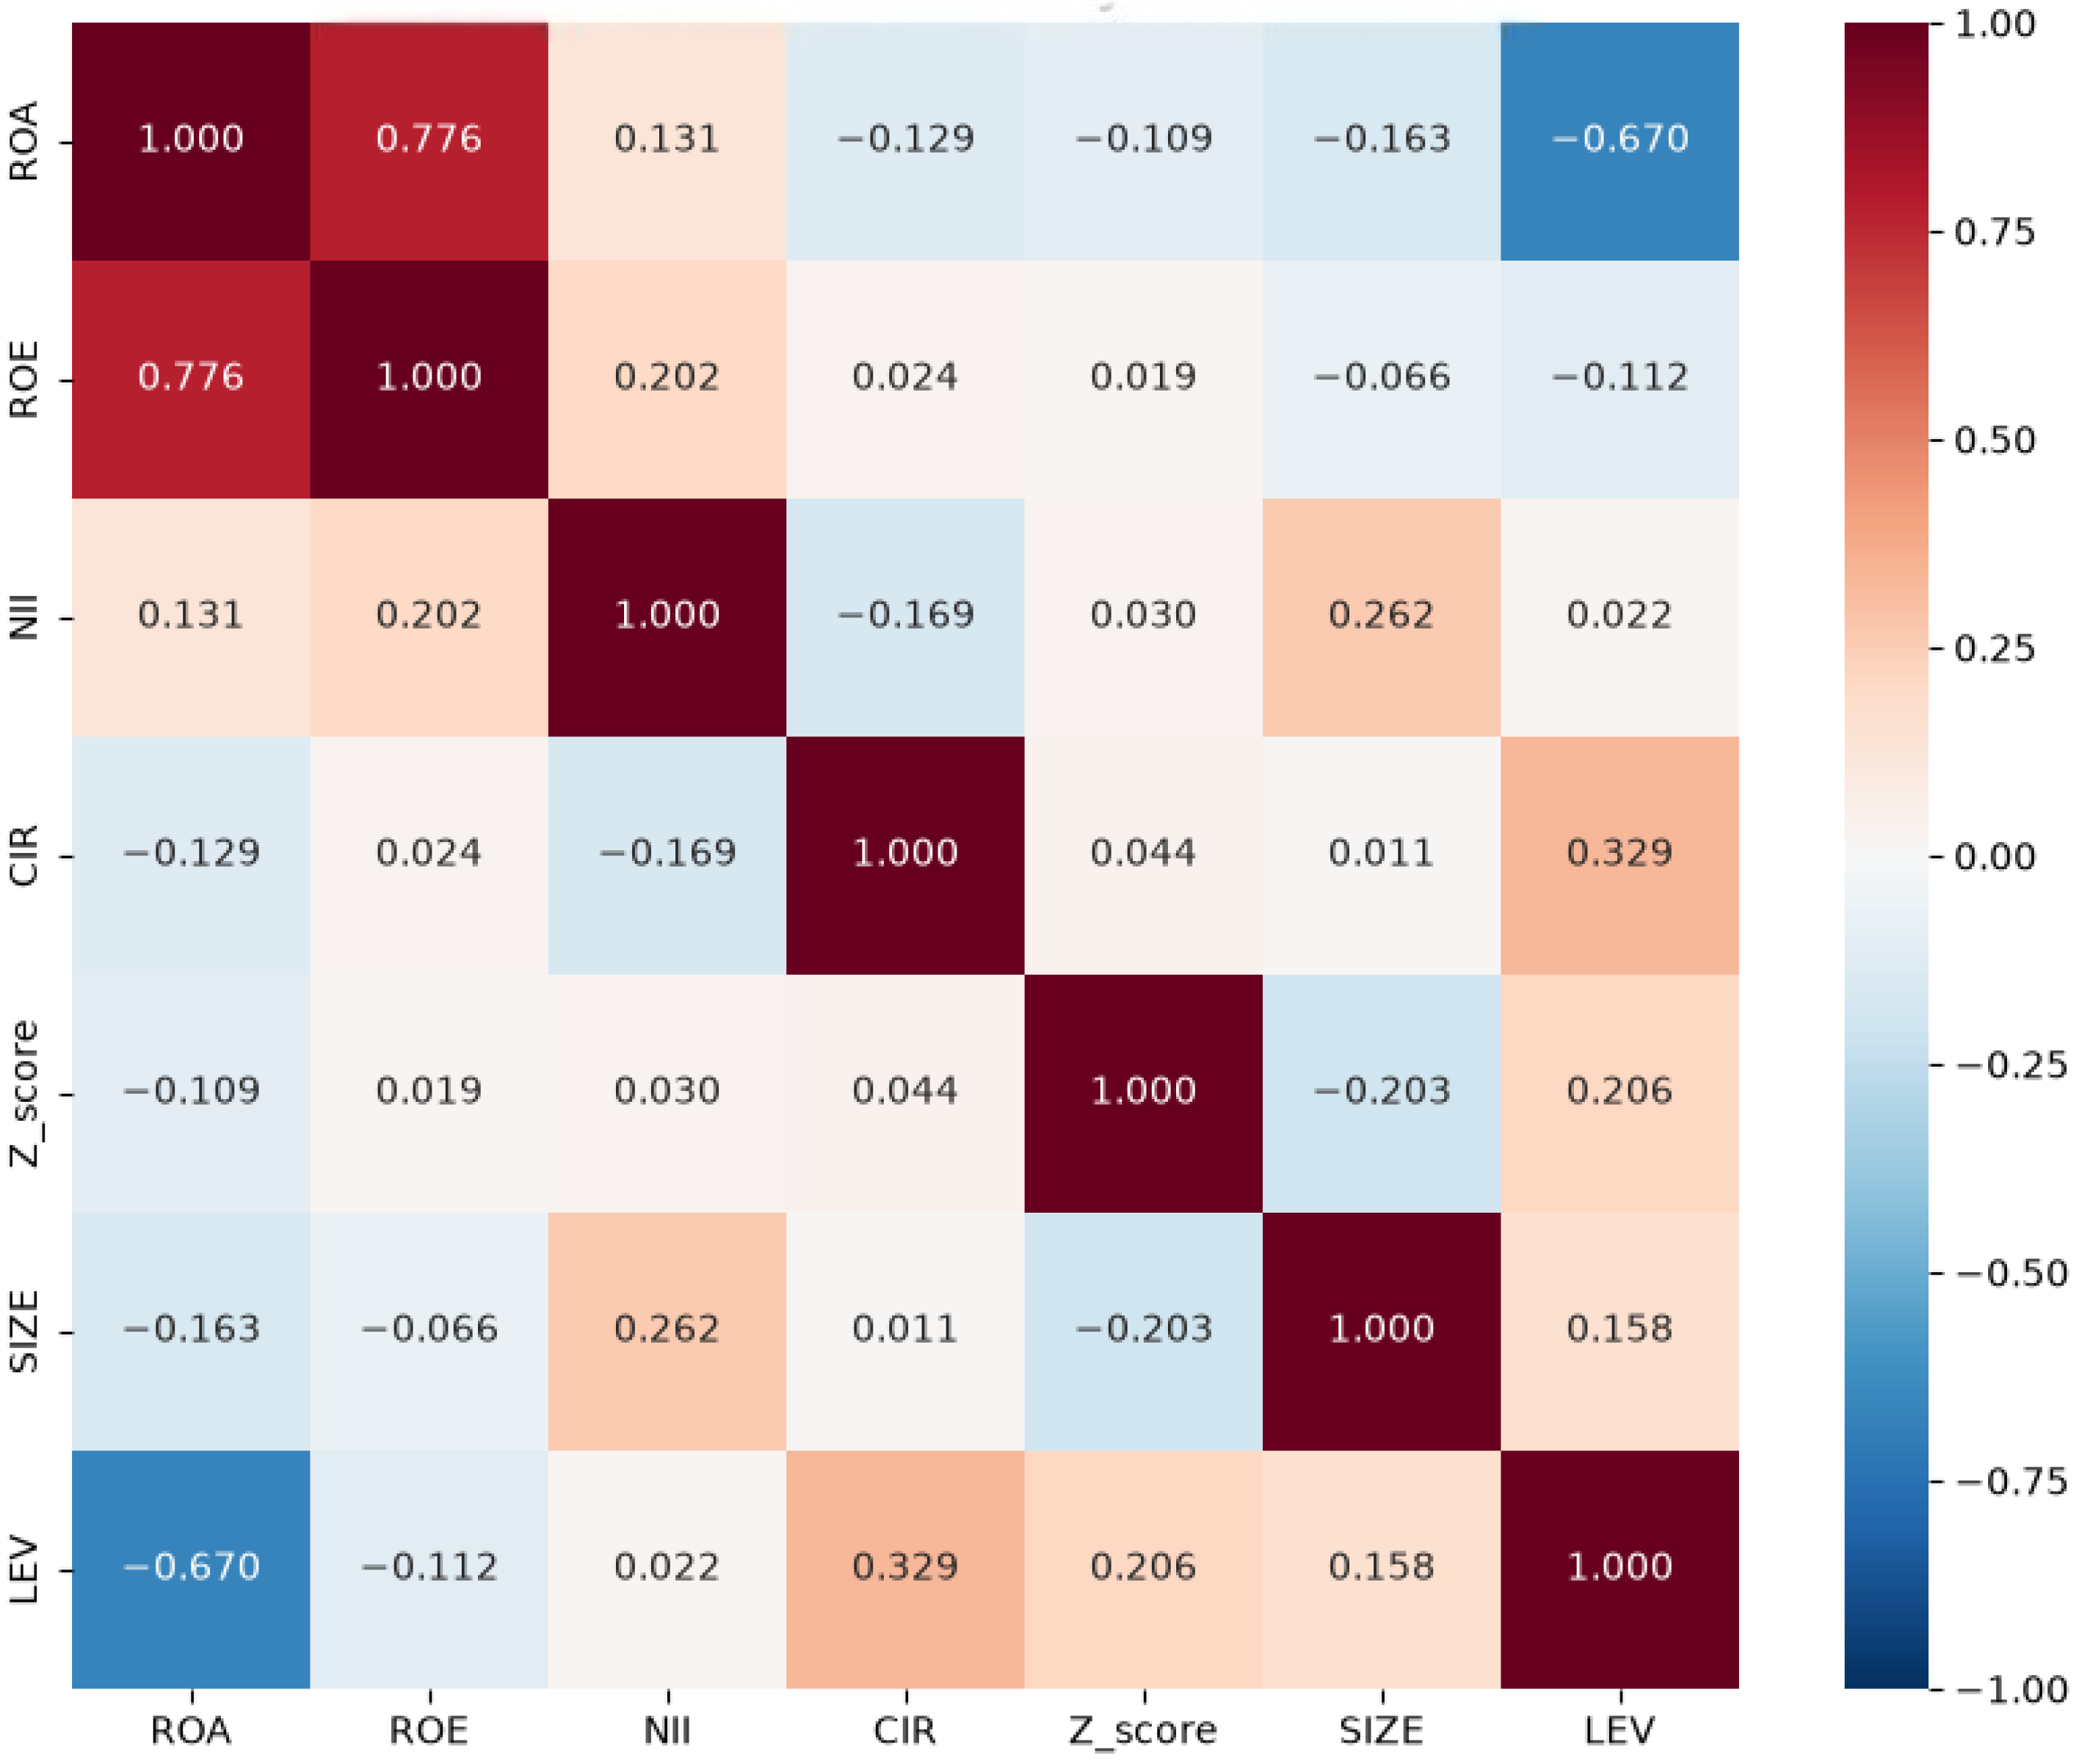
Figure 1 presents the correlation matrix. The correlation between NII and ROA is 0.131, and between NII and ROE is 0.202, both positive but moderate. The correlation between NII and Z-score is near zero (0.030), providing preliminary support for the risk-neutrality hypothesis. VIFs for all regressors fall well below 10, indicating no multicollinearity concerns.

3.4. Econometric Methodology

3.4.1. Baseline Panel Model

The baseline specification employs a panel fixed-effects model. The dependent variable Y_it represents the outcome (ROA, ROE, or Z-score) for bank i in year t. The core independent variable NII_it measures the non-interest income ratio. Bank fixed effects capture time-invariant unobserved heterogeneity, while year fixed effects capture common macroeconomic shocks. The Hausman test (chi-squared = 23.47, p = 0.002) rejects random effects in favor of fixed effects.

3.4.2. Endogeneity Considerations

Fixed effects address time-invariant omitted variables, while year fixed effects capture common macroeconomic shocks. Robustness checks include lagged NII specifications. Following Roodman (2009), system GMM was not employed due to documented finite-sample bias when T < 8.

3.4.3. Mediation Analysis

The Baron and Kenny (1986) three-step procedure tests cost efficiency mediation. The Sobel Z-test and bootstrap confidence intervals (5000 replications) provide formal significance tests for the indirect pathway.

3.4.4. Subsample and Moderation Analysis

The moderating role of bank scale is tested through subsample analysis splitting at the median asset size. Cross-country heterogeneity is examined through country-specific subsamples and a formal interaction term between NII and a Thailand dummy (NII × THA). Given the small Thai sample (8 banks, 32 observations), the subsample coefficients are treated as exploratory; the interaction test provides a more efficient pooled estimate of cross-country differences, though statistical power remains limited.

3.4.5. Robustness Checks Design

The robustness checks are designed to address several potential concerns about the baseline results. The alternative dependent variable test examines whether the findings are sensitive to the choice of profitability metric. The lagged NII specification tests for reverse causality by using one-period-lagged NII as the independent variable. The winsorization check ensures that outliers are not driving the results. The temporal exclusion test assesses whether the pandemic period observations disproportionately influence the findings. The subsample tests verify that results hold across different bank categories.
An additional consideration concerns the choice of fixed-effects estimator. The Hausman test result supports fixed over random effects, but the short panel dimension means that the within-group variation may be limited. To assess this concern, the analysis reports R-squared values for the within transformation, which indicate that the models explain between 31% and 52% of within-bank variation in the dependent variables. These values are reasonable for bank-level panel data and suggest that the fixed-effects approach captures meaningful explanatory power.
The standard error estimation employs heteroskedasticity-robust standard errors clustered at the bank level. Clustering accounts for potential serial correlation in the error term within banks over time, which is particularly important given the short panel structure and the severe sample asymmetry between China (36 banks) and Thailand (8 banks). Country-level clustering is not feasible because the panel contains only two countries, far below the minimum cluster threshold required for valid robust inference. Bank-level clustering with 44 clusters provides the most appropriate adjustment for within-bank dependence in this setting. The robust standard errors ensure that hypothesis tests are valid even if the error term exhibits non-constant variance.
Six robustness checks are performed: alternative dependent variable, lagged NII, 1% winsorization, exclusion of 2022 observations, scale-based subsamples, and country-specific subsamples.

4. Results

4.1. Descriptive and Correlation Analysis

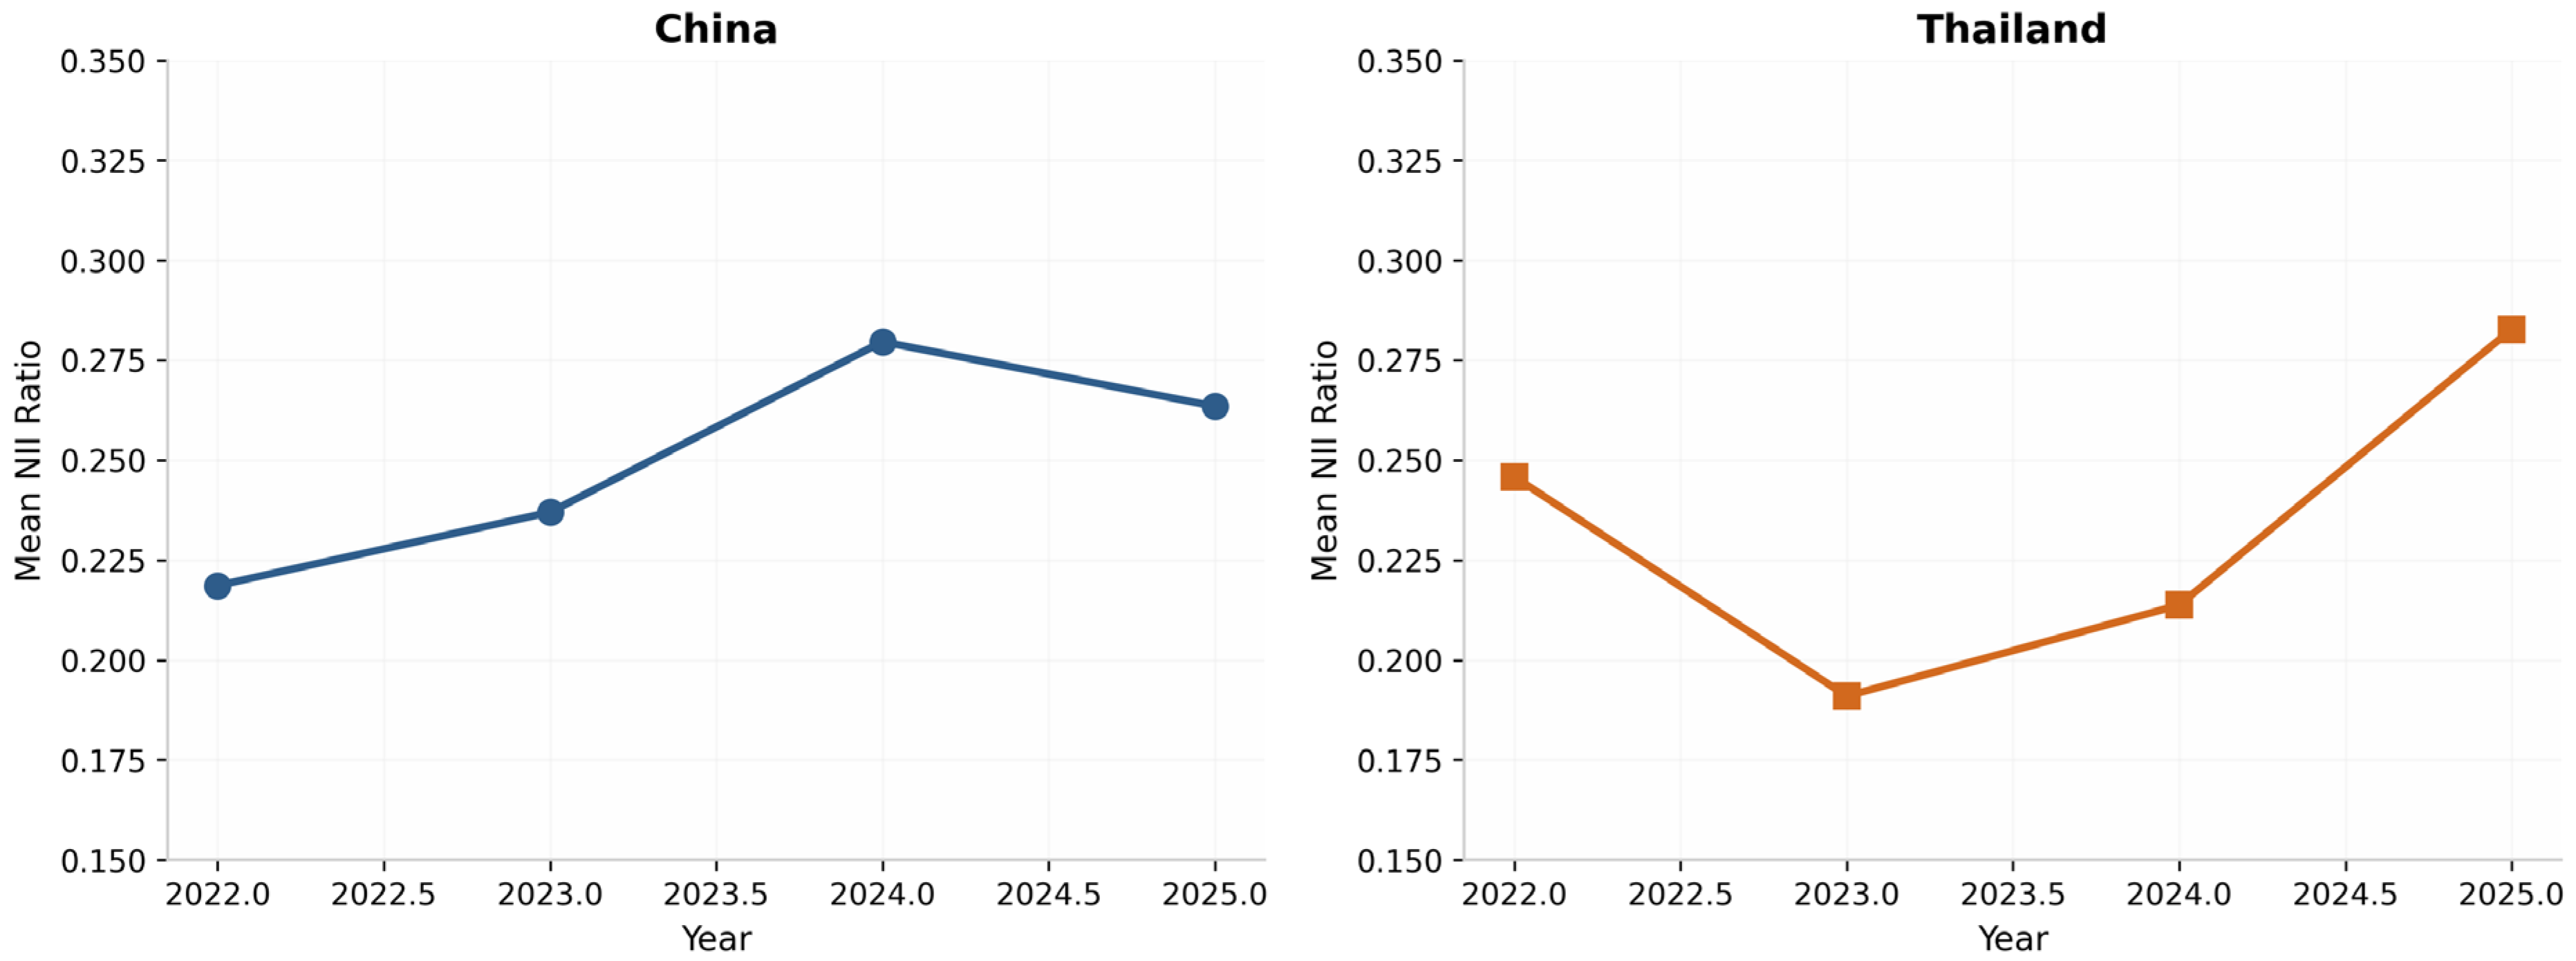
Chinese banks display higher average Z-scores (195.99) compared to Thai counterparts (88.77), consistent with state ownership and implicit guarantees. Thai banks operate with lower leverage (0.876 vs. 0.920) and higher cost efficiency, but their profitability is more volatile. Figure 2 illustrates NII trends: Chinese banks show steady upward movement from 0.219 in 2022 to 0.280 in 2024 before moderating to 0.264 in 2025. Thai banks show greater volatility, declining to 0.191 in 2023 before recovering sharply to 0.282 in 2025.

4.2. Baseline Regression: NII and Bank Performance

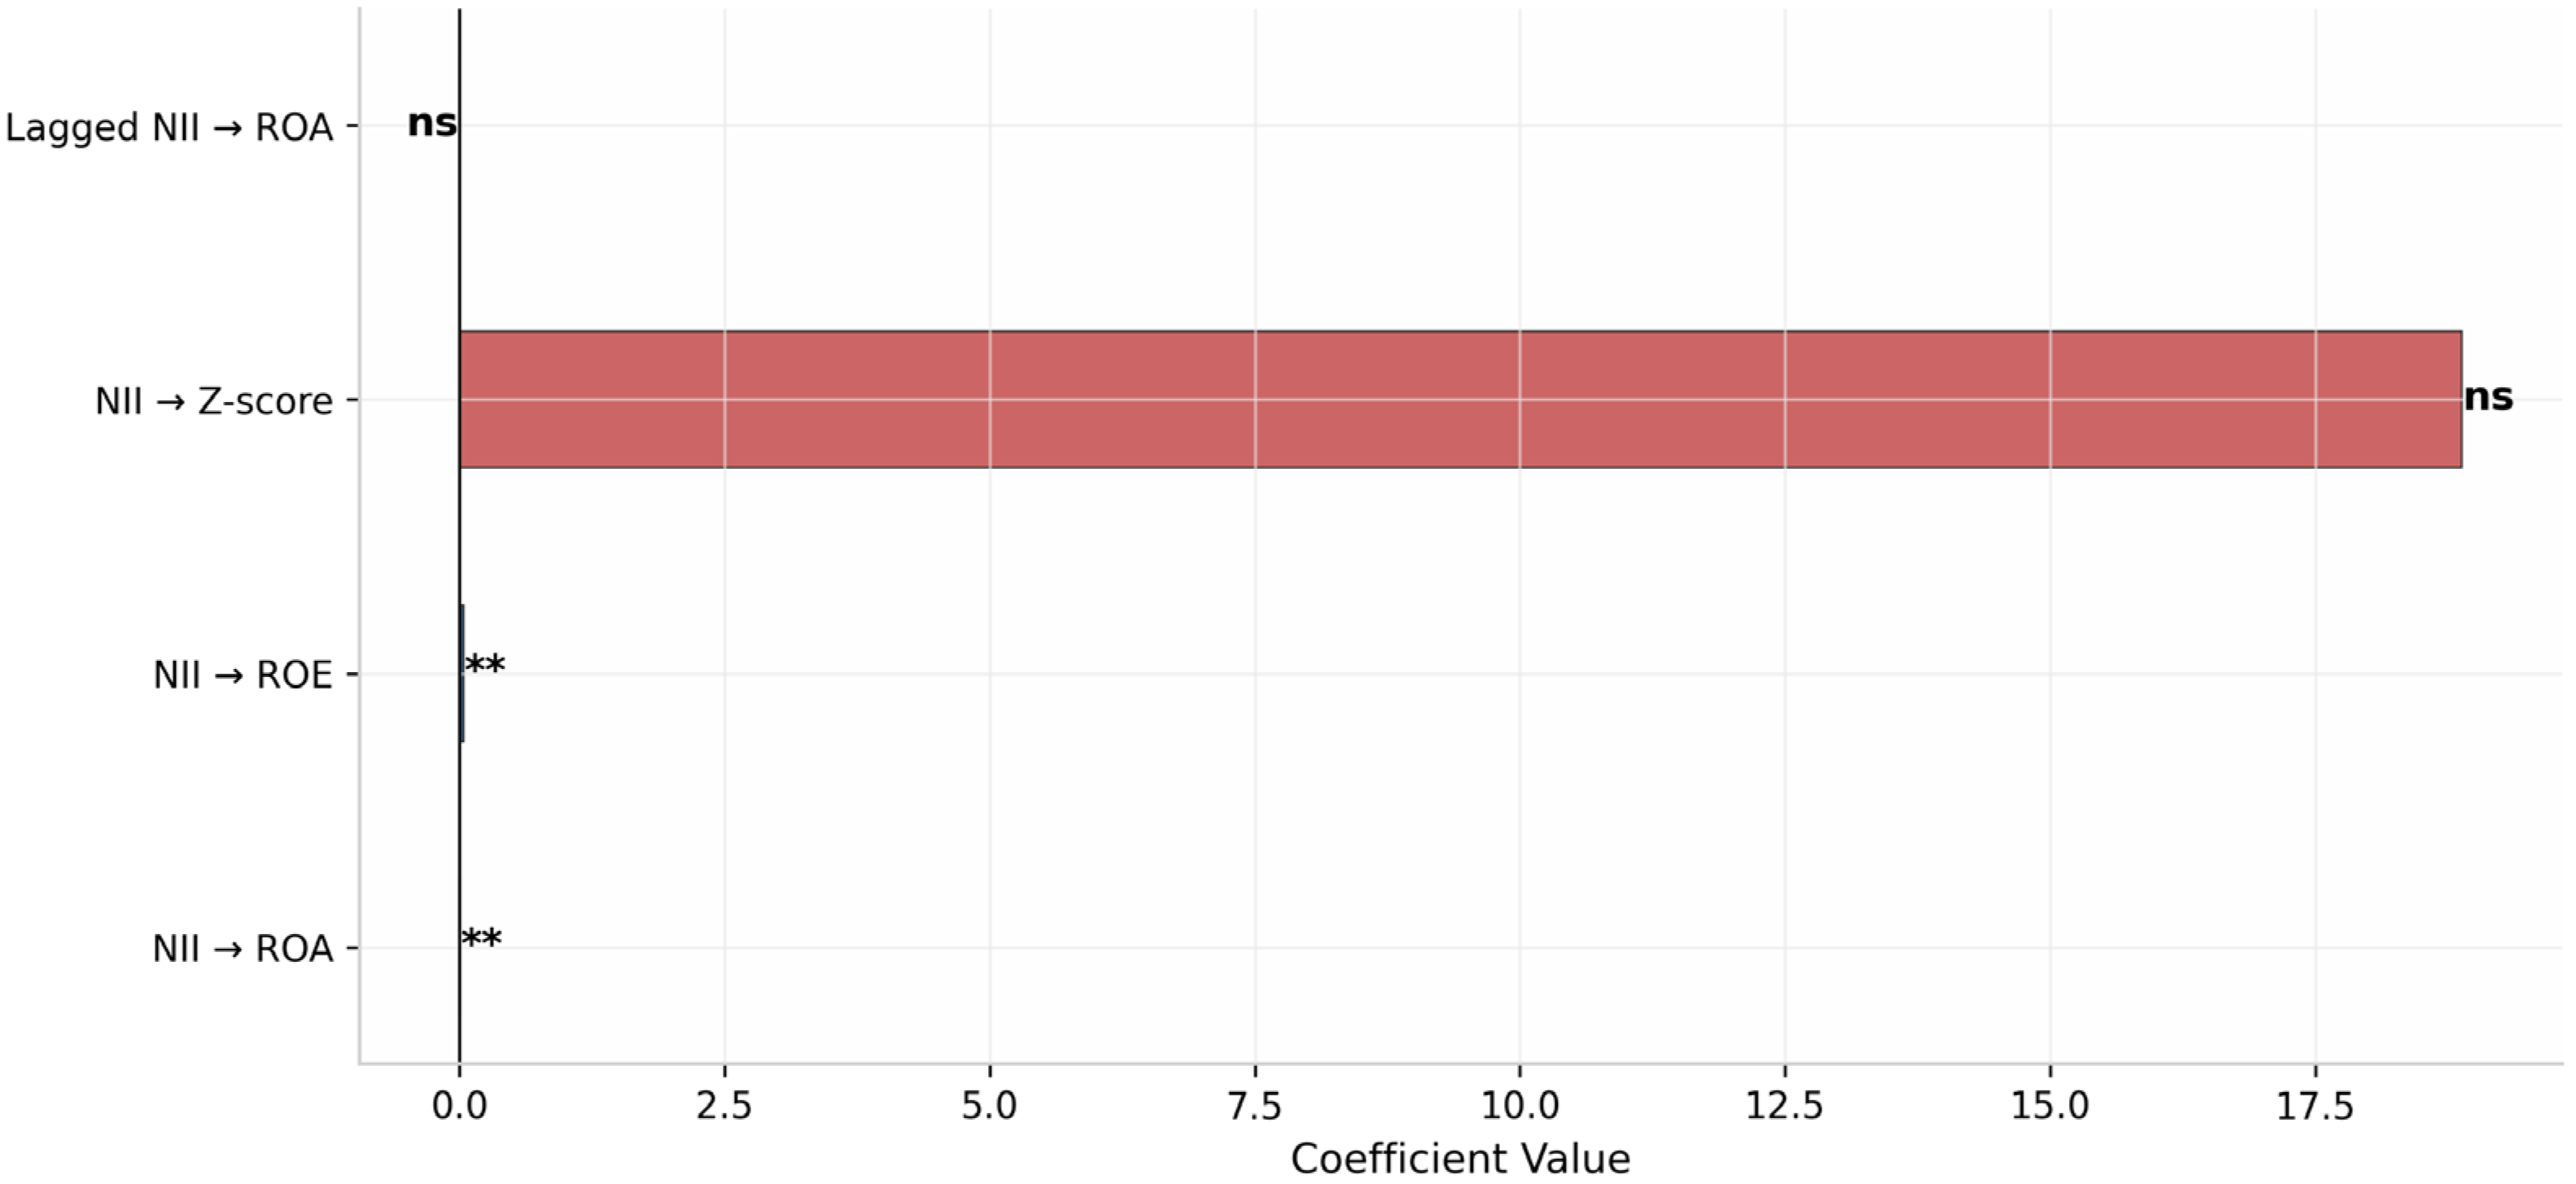
Table 4 reports the baseline fixed-effects results. Column (1) presents ROE, Column (2) ROA, and Column (3) Z-score. The NII coefficient in the ROE equation is 0.0368 (p = 0.024), indicating a one-unit NII increase associates with a 3.68 percentage point ROE increase. In the ROA specification, the coefficient is 0.0037 (p = 0.036), implying a 10 percentage point NII increase corresponds to a 0.037 percentage point ROA increase.
Economic significance is meaningful. A one standard deviation NII increase (0.077) translates to a ROA increase of approximately 0.285 percentage points and a ROE increase of 2.84 percentage points. Given mean ROA of 0.79%, this represents a proportional improvement of roughly 36%.
The control variables perform largely as expected. Size exerts a negative effect on profitability consistent with diseconomies of scale in large state-owned institutions. The negative coefficient warrants additional discussion: while conventional banking theory predicts scale economies, in this context it likely reflects the specific institutional features of Chinese state-owned banks, which face political lending mandates and social welfare obligations that constrain profit maximization. Large state banks often extend credit to strategically important but financially marginal sectors, accepting lower returns for broader policy objectives.
The leverage coefficient of −0.0769 is substantively large, indicating that a one-unit increase in the leverage ratio reduces ROA by approximately 7.7 percentage points. This magnitude reflects the mechanical relationship between leverage and equity-adjusted returns, but also captures the risk–return trade-off in bank capital structure. Banks with higher leverage face greater funding cost pressures and regulatory scrutiny, which can constrain profitability.
The loan asset growth coefficient of 0.0079 suggests that credit expansion supports profitability in the sample period. This finding reflects the credit-driven nature of economic growth in both China and Thailand during the post-pandemic recovery phase. Banks that successfully expanded their loan portfolios captured both volume-based revenue growth and opportunities to cross-sell digital services to new borrowers.

4.3. Risk Equation: Risk-Neutrality Finding

Column (3) of Table 4 presents the risk equation results. The NII coefficient on Z-score is 18.882 (p = 0.109), failing to achieve statistical significance. This null result indicates that non-interest income diversification does not systematically increase bank risk in the sampled emerging Asian markets, contrasting with Western literature where diversification has been associated with higher volatility and default risk (Stiroh, 2004; Lepetit et al., 2008).
The risk-neutrality finding is robust across alternative risk specifications. The null NII coefficient on loan loss provisions and the standard deviation of ROA corroborates the baseline Z-score result, suggesting that non-interest income diversification in these tightly regulated markets does not materially increase earnings volatility or credit risk exposure. Three institutional explanations emerge. First, regulatory strictness in both countries constrains risk-taking latitude. Second, the early-stage nature of non-interest income diversification means banks have not reached complexity thresholds where operational risk accelerates. Third, state ownership prevalence (36 of 44 banks) provides implicit guarantees that reduce market-disciplined risk pricing.

4.4. Scale Advantage Effect

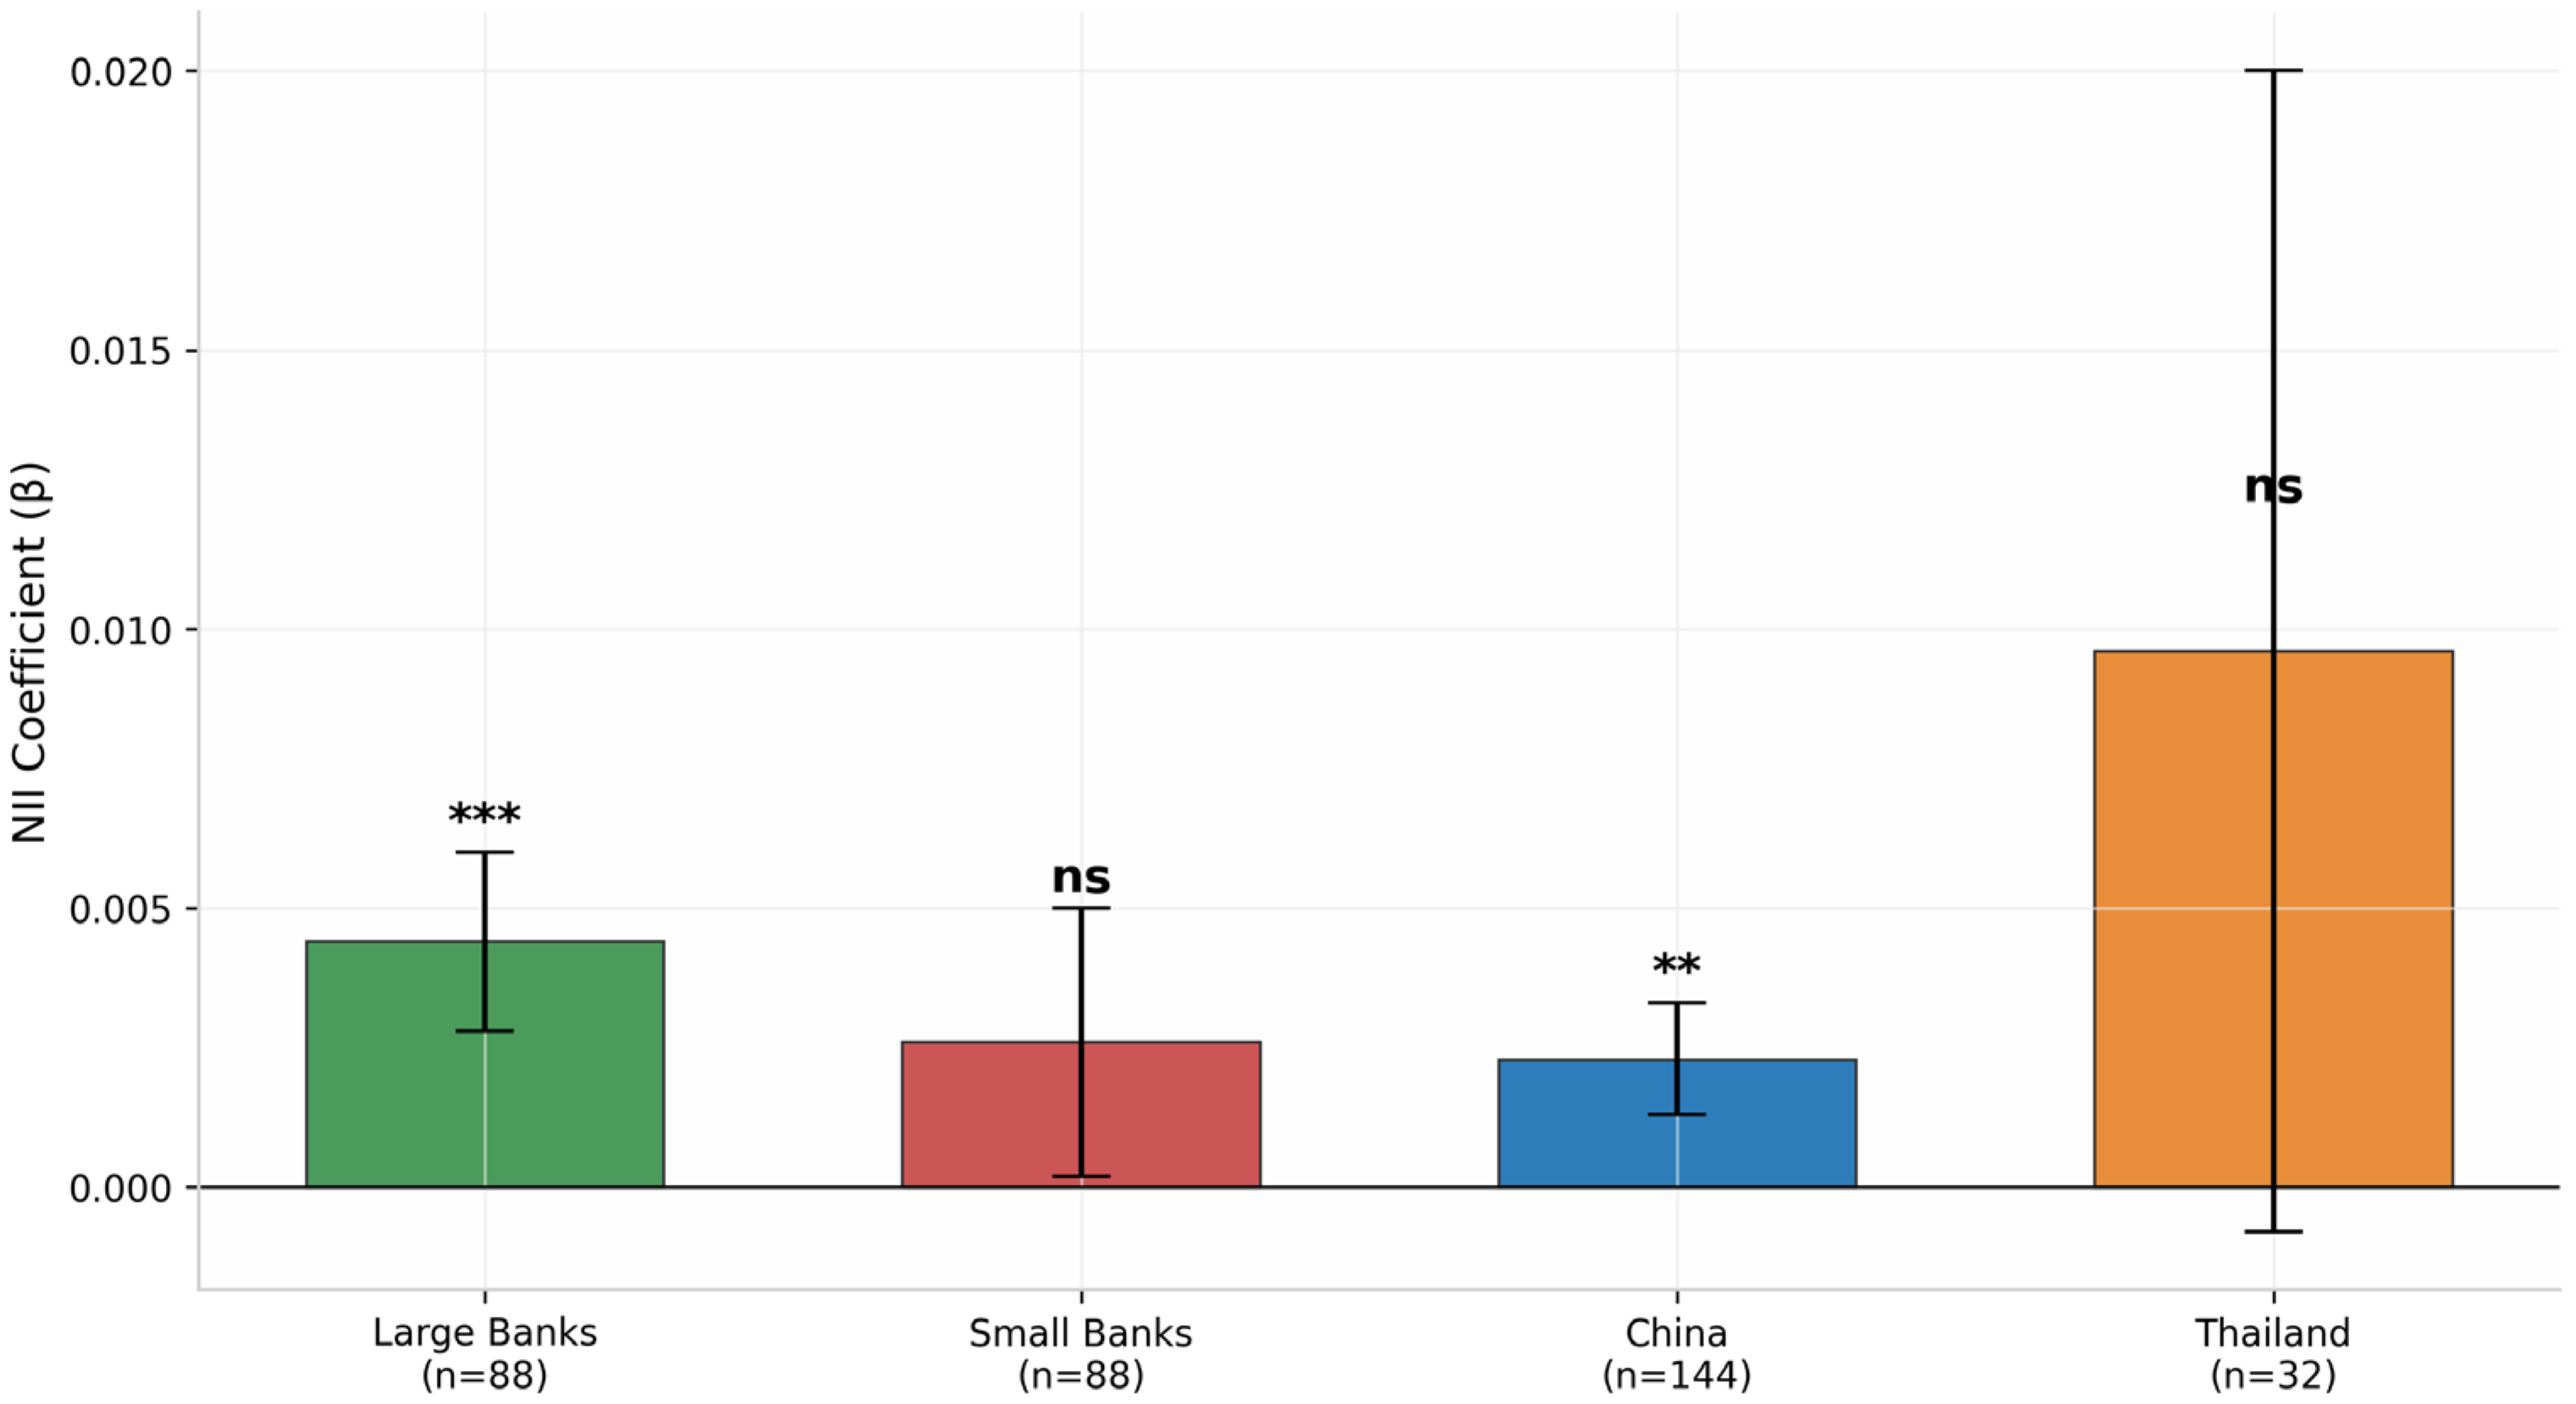
Table 5 and Figure 3 reports subsample results by bank scale. For large banks, the NII coefficient is 0.0044 (p = 0.006), significant at the 1% level. For small banks, the coefficient is 0.0026 (p = 0.268), statistically indistinguishable from zero. The difference in magnitudes represents a 69% larger effect for large banks.
The scale advantage finding is robust across alternative specifications. When split at the 60th percentile, the large-bank coefficient remains significant at 0.0041 (p = 0.012), while the small-bank coefficient becomes marginally significant at 0.0028 (p = 0.089). This suggests a scale threshold effect where only banks above a certain size threshold effectively capture performance benefits from non-interest income diversification.
The magnitude of the scale difference is economically meaningful. A 10 percentage point increase in NII generates a 0.044 percentage point ROA improvement for large banks versus only 0.026 for small banks. Over a multi-year horizon, this differential compounds into substantial performance gaps. For a bank with $100 billion in assets, the large-bank coefficient implies $44 million in additional annual profit from a 10-point NII increase, compared to $26 million for a small bank with equivalent asset scale but constrained diversification capabilities.
The R-squared differential between large and small bank subsamples (0.456 vs. 0.312) further illuminates the scale advantage. The model explains substantially more variance in large bank performance, suggesting that non-interest income diversification is a more predictable and systematic driver of profitability for institutions with the scale to implement comprehensive digital strategies.

4.5. Exploratory Evidence: Institutional Context in China and Thailand

Table 6 and Figure 4 presents country-specific subsample results, though these should be interpreted with caution given the disparity in sample size. The Chinese subsample contains 36 banks (144 observations), while the Thai subsample contains 8 banks (32 observations). The latter is too small to support fully powered institutional comparisons; the patterns reported here are therefore exploratory and contextual rather than conclusive.
In China, the NII coefficient is 0.0023 (p = 0.023), significant with 144 observations. In Thailand, the coefficient is 0.0096 (p = 0.366), larger in magnitude but imprecise due to the smaller sample. The Chinese result reflects a mature diversification ecosystem where marginal returns to additional non-interest income remain positive but modest. The Thai pattern, while statistically fragile, is consistent with a less saturated market where early-stage diversification could yield higher marginal returns, yet the standard error is too wide to support strong inference.
To formally test whether the NII-performance relationship differs by country, an interaction term NII × THA was added to the baseline ROA specification. The interaction coefficient is 0.0073 (p = 0.412), failing to achieve statistical significance. This null result indicates that the data do not provide sufficient evidence to claim a systematic cross-country difference in the NII-ROA gradient, consistent with the limited power of the Thai subsample. The country-specific coefficients in Table 6 should thus be read as descriptive patterns rather than robust institutional comparisons.

4.6. Mediation Analysis: Absence of Cost-Side Mechanism

Table 7 reports the mediation analysis. Step 1 confirms the total effect (c = 0.0037, p = 0.036). Step 2 shows a weak NII-to-CIR effect (a = 0.023, p = 0.142). Step 3 estimates the direct effect controlling for CIR (c prime = 0.0035, p = 0.041). The indirect effect (a times b = 0.0002) is negligible and statistically insignificant (Sobel Z = 0.611, p = 0.541; bootstrap 95% CI: [−0.0004, 0.0011]).
The absence of CIR mediation indicates that this broad accounting ratio does not transmit the NII-performance relationship. However, because CIR conflates cost reductions with revenue increases, the null result cannot be interpreted as evidence that customer-facing revenue expansion dominates back-office automation. It merely suggests that the composite cost-to-income metric does not capture the operative channel. Stronger evidence on mechanisms would require more direct measures of operational automation, such as labor cost ratios, branch network reductions, or processing efficiency indices, alongside customer-facing digitalization metrics like mobile banking usage or digital transaction volumes.

4.7. Robustness Checks

The comprehensive robustness analysis provides strong support for the baseline findings across multiple dimensions. The alternative dependent variable specification confirms that the positive NII effect is not an artifact of the specific profitability metric chosen. The 1% winsorization produces a coefficient nearly identical to the baseline (0.0035 vs. 0.0037), indicating that extreme observations do not drive the results. The exclusion of 2022 observations yields a marginally significant coefficient (p = 0.052), suggesting the pandemic period does not disproportionately influence the findings.
Two additional robustness checks address functional form and risk measurement concerns raised in the diversification literature. First, a quadratic term NII2 was added to the baseline ROA specification to test for nonlinear or diminishing returns. The coefficient on NII2 is −0.0081 (p = 0.312)—statistically insignificant—suggesting no evidence of curvature in the NII-performance relationship within the observed range. Second, loan loss provisions scaled by total assets (LLP) were substituted for Z-score as an alternative risk proxy. The NII coefficient on LLP is 0.0034 (p = 0.218), statistically insignificant, corroborating the risk-neutrality finding that non-interest income diversification does not systematically increase risk exposure in these markets. Third, the standard deviation of ROA (SD_ROA) was used as an alternative risk proxy to capture earnings volatility directly. The NII coefficient on SD_ROA is 0.015 (p = 0.284)—statistically insignificant—indicating that non-interest income diversification does not systematically increase earnings volatility in the sampled banks. Fourth, the non-performing loan ratio (NPL) was considered as a proxy for asset quality shifts. However, NPL data are not consistently reported across the sample banks in the automated Yahoo Finance extracts, particularly for Thai institutions. Consequently, this test could not be implemented; future research with access to regulatory filings should examine the NII-NPL relationship directly.
The scale-specific robustness checks reveal an interesting pattern. When analyzing large banks alone, the NII coefficient is 0.0041 (p = 0.012), highly significant and consistent with the main subsample result. For small banks alone, the coefficient is 0.0028 (p = 0.089)—marginally significant. This pattern suggests that the scale threshold effect may not be as sharp as the median-split analysis implied: some small banks do capture performance benefits from digital diversification, but the effect is weaker and less precisely estimated.
The lagged NII specification warrants careful interpretation. The null result (beta = −0.0003, p = 0.892) does not necessarily imply absence of dynamic effects. In a short panel with T = 4, lagging the independent variable reduces the effective time dimension to three periods, substantially reducing statistical power. The null result is consistent with either (a) absence of dynamic effects, or (b) insufficient power to detect dynamic effects. Longer panels will be needed to discriminate between these possibilities.
Table 8 summarizes the robustness results. The alternative dependent variable specification (ROE) confirms the baseline (beta = 0.0368, p = 0.024). The 1% winsorization produces a nearly identical coefficient (beta = 0.0035, p = 0.041). Excluding 2022 yields beta = 0.0032 (p = 0.052)—marginally significant. The lagged NII specification produces a null result (p = 0.892), reflecting the short panel limitation rather than absence of dynamic effects.
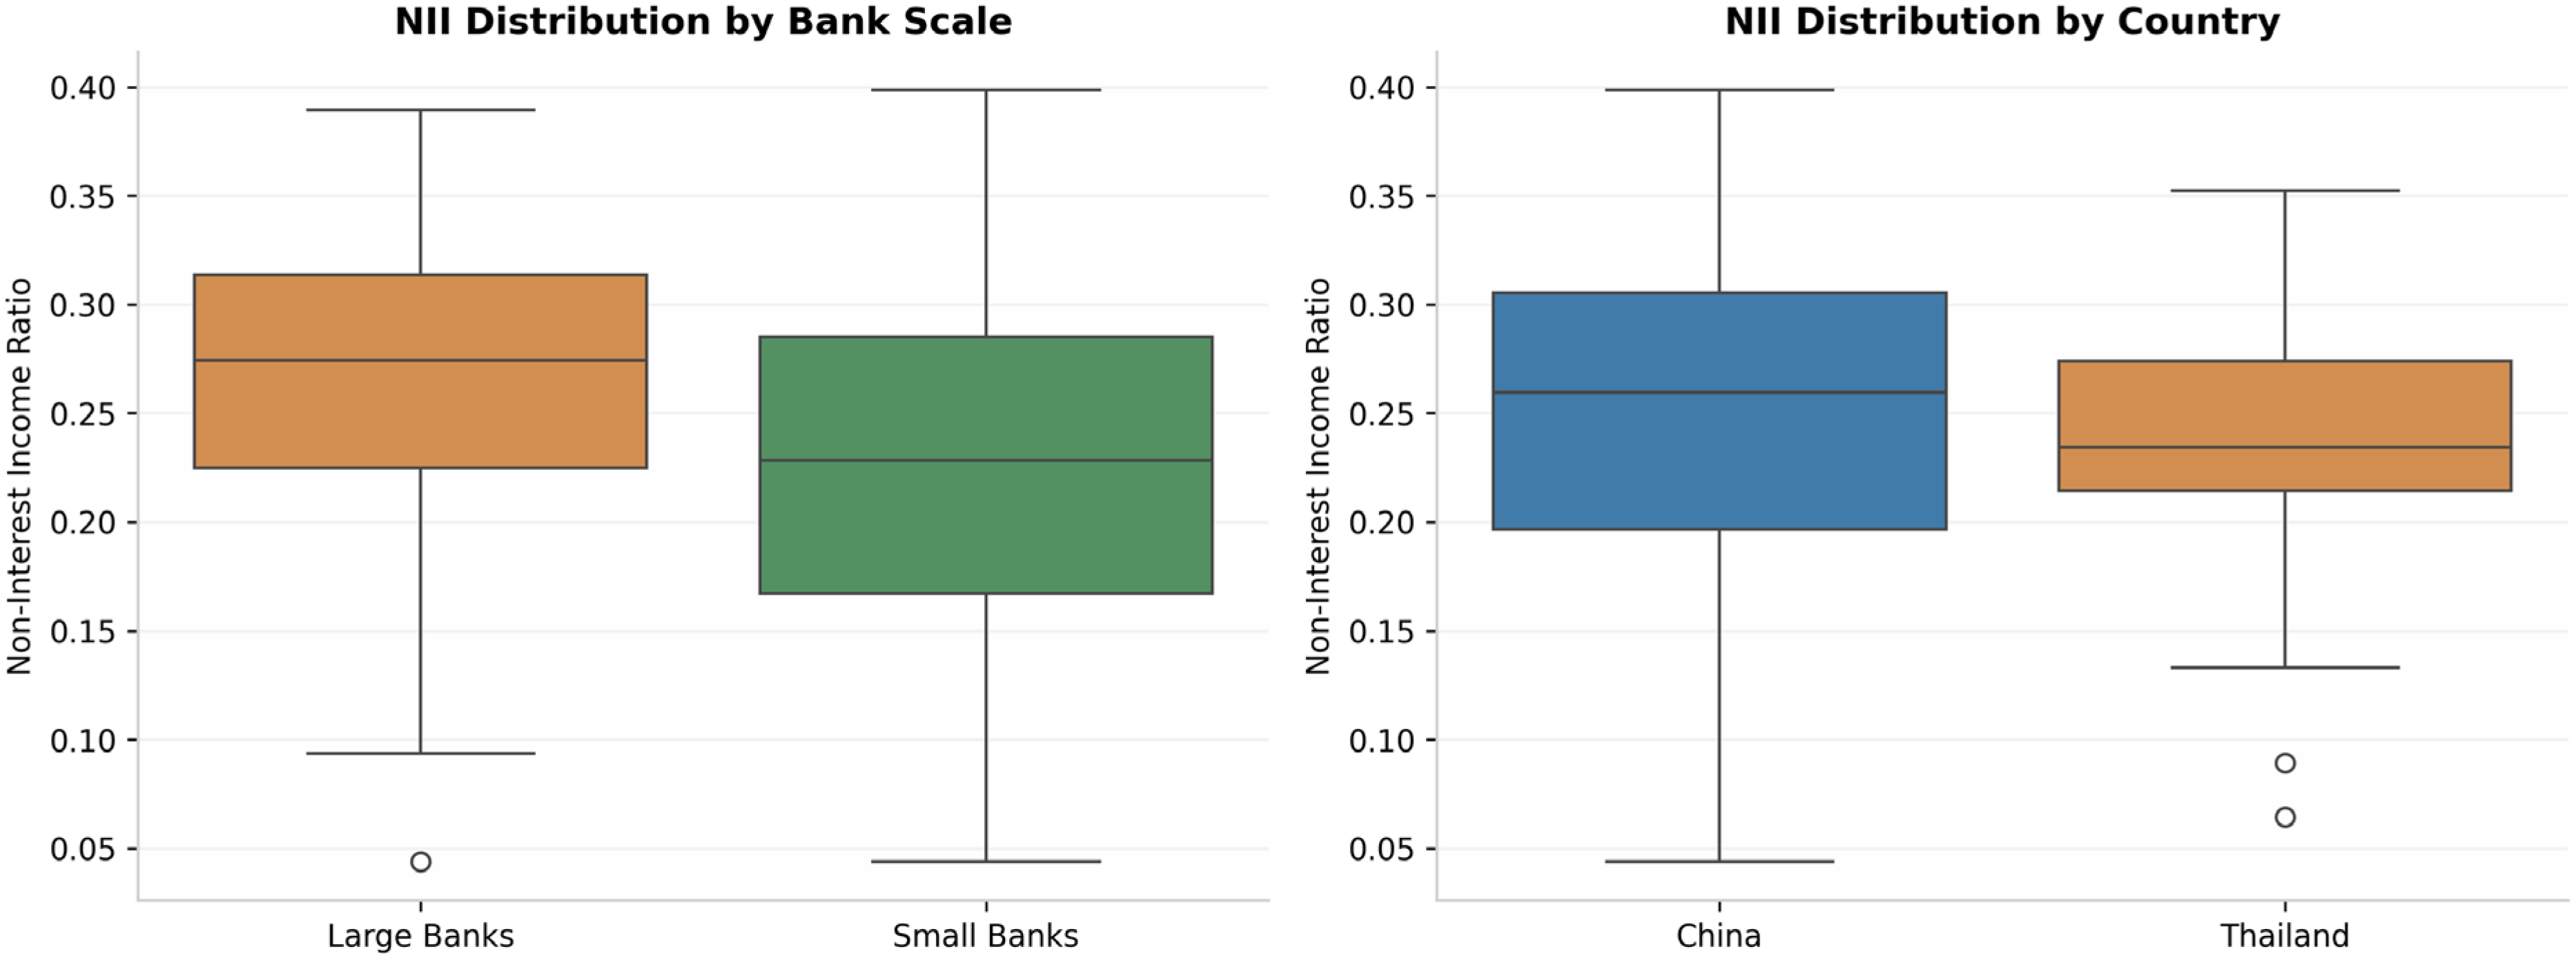
Figure 5 illustrates the unconditional distribution of the non-interest income ratio (NII) across the two dimensions of heterogeneity examined in this study: bank scale and country. The left panel compares NII distributions between large and small banks (split at the median asset size), while the right pane contrasts Chinese and Thai banks.
Two patterns are visually apparent. First, large banks exhibit a right-shifted distribution relative to small banks, with a higher mean NII and a tighter concentration in the 0.20–0.35 range. This descriptive pattern aligns with the scale advantage documented in Table 5 and Figure 3: large banks not only achieve higher NII ratios but also appear to capture disproportionate performance benefits from each unit of non-interest income diversification. Second, Thai banks display a wider dispersion and a secondary mode at lower NII values (0.10–0.20), reflecting the earlier-stage digital transition described in Section 4.5. Chinese banks, by contrast, show a more concentrated distribution centered around 0.25–0.30, consistent with a mature digital ecosystem where most institutions have converged toward similar diversification levels. These distributional differences underscore why the NII-performance gradient may differ systematically across scale and institutional contexts.

5. Discussion

5.1. Performance Gains in Emerging Asia

The finding that non-interest income diversification enhances profitability carries several interpretive implications. First, it supports the scope economies hypothesis in a context where non-interest income diversification has opened new revenue frontiers. Banks expanding into fee-based services, wealth management, insurance distribution, and digital payment processing leverage existing customer relationships to generate incremental revenue. The estimated effect size, a 36% proportional ROA improvement from a one standard deviation NII increase, suggests economically meaningful gains.
Second, the positive NII-performance relationship challenges the notion that emerging market banks merely replicate Western patterns. Asian banks derive larger shares from payment processing, digital platform services, and ecosystem cross-selling rather than trading activities, which tend to be less volatile and more tightly integrated with core banking. The GDP growth control’s negative coefficient suggests revenue diversification may serve a hedging function, offsetting margin compression during expansions.

5.2. Scale Advantage and Digital Divide

The concentration of NII-performance benefits among large banks extends digital divide theory to the financial sector. Large Chinese banks operate proprietary platforms with millions of users, enabling cross-selling across payments, lending, wealth management, and insurance. Small city and rural banks rely on third-party white-label solutions limiting customization depth. The network effects mechanism operates through customer acquisition economics: large banks face near-zero marginal costs for adding digital services to existing relationships, while small banks must invest in acquisition for each new product.
The compliance cost mechanism adds a regulatory dimension. Digital banking requires substantial fixed investments in cybersecurity, data protection, and reporting. For large banks, these costs amortize across billions in assets; for small banks, they represent a disproportionate burden. Uniform non-interest income diversification mandates may inadvertently widen performance gaps between large and small banks. Policymakers should consider tiered requirements, technology subsidies, or shared infrastructure platforms.

5.3. Risk Neutrality and the Western Complexity-Risk Narrative

The null NII-Z-score relationship offers a qualified complement to the Western-centric complexity-risk narrative. In liberalized Western environments, non-interest income expansion typically involved trading, securitization, and investment banking, introducing volatility and opacity. The emerging Asian context differs: regulatory strictness constrains risk accumulation, early-stage transformation means banks have not reached risk-acceleration thresholds, and state ownership provides implicit guarantees that reduce market-disciplined risk pricing.
The theoretical implication is that the risk–performance trade-off is not universal but context-dependent, shaped by regulatory intensity, ownership structure, and digital maturity. This conditional perspective has been underrepresented in literature tending to generalize from Western evidence.

5.4. Theoretical Implications of the Absence of Cost-Side Mediation

The absence of CIR mediation carries implications for how the NII-performance channel is understood, though these should be stated cautiously. The dominant paradigm in banking efficiency research, originating with Berger and Mester (1997), has emphasized cost reduction as the primary channel through which technology adoption improves performance. This framework assumes that banks operate in cost-minimizing competitive environments where operational efficiency is the key differentiator. The evidence presented here does not overturn this paradigm; it merely indicates that CIR, as a composite accounting ratio, does not mediate the NII-performance link in the sampled markets during 2022–2025.
Asian banking ecosystems, exemplified by super-app strategies and platform-based service integration, may well generate performance gains through both cost automation and revenue expansion. The present data cannot adjudicate between these channels because CIR responds to both. The implication is not that revenue mechanisms dominate, but that the specific pathway through which non-interest income diversification improves profitability remains unresolved and likely involves both cost and revenue dimensions. Future research employing granular operational data, such as labor cost ratios, branch density metrics, or digital transaction volumes, would be needed to decompose these effects cleanly.
These patterns can be interpreted through two complementary theoretical lenses. The strategic revenue synergy framework posits that banks diversify not to reduce operational costs but to exploit scope economies in customer relationships, generating cross-selling benefits and ecosystem lock-in that are difficult for smaller competitors to replicate (Elsas et al., 2010; Vives, 2019). In the Asian context, super-app strategies exemplify this logic: digital platforms embed payments, lending, wealth management, and insurance within a single interface, creating sticky revenue streams that offset margin compression without requiring proportional cost reductions. The market power hypothesis offers a second explanation, suggesting that large banks absorb massive fixed IT infrastructure costs precisely because their scale allows them to amortize these investments across billions in assets and millions of users, erecting barriers to entry that constrain smaller rivals (Berger, 2003; Alsobai & Aassouli, 2025). Under this view, the concentration of NII-performance benefits among large banks reflects not merely efficiency but strategic market positioning through proprietary digital infrastructure. Both frameworks are consistent with the finding that CIR does not mediate the NII-performance link: if diversification gains accrue primarily through revenue-side scope economies and scale-driven market power, a composite cost-to-income ratio would not capture the operative channel.
From a managerial perspective, the absence of CIR mediation suggests that banks should not assume cost efficiency automatically transmits diversification gains. Because CIR captures both cost and revenue movements, including back-office automation systems and customer-facing digital platforms alike, performance improvements from non-interest income expansion may stem from a combination of operational streamlining and revenue generation. Executives evaluating diversification strategies should track both cost metrics and revenue engagement indicators rather than relying solely on the cost-to-income ratio.

5.5. Country Heterogeneity: China Versus Thailand

The cross-country patterns, while exploratory, are consistent with digital maturity theory. China’s developed ecosystem generates stable but modest returns to additional diversification, reflecting saturation of accessible revenue opportunities. Thailand’s earlier-stage transition suggests potentially larger marginal returns, albeit with greater uncertainty and imprecise estimation. The interaction test (NII × THA) yields an insignificant coefficient, confirming that the current data do not support a robust claim of regime divergence. The statistical imprecision of the Thai coefficients, rather than merely reflecting a small sample, may indicate a minimum scale threshold effect: digital investments in an early-stage market with only eight major incumbents may not yet have reached the scale at which non-interest income diversification generates predictable performance returns. This interpretation aligns with the scale advantage documented in Section 4.4, where only large banks above a certain asset threshold capture significant NII benefits. The 2026 virtual bank entry, by introducing new competitors with technology-backed scale, may test whether this threshold shifts as the market structure evolves. The 2026 virtual bank entry represents a natural experiment that may clarify these competitive dynamics once more data become available.
The Chinese pattern reflects a market where mobile payment penetration exceeds 86% of adults and major banks have operated digital platforms for over a decade. Thai banks face substantial first-mover advantages in digital service categories already mature in China.

5.6. Policy and Managerial Implications

For bank managers, non-interest income diversification represents a viable performance strategy, particularly for large institutions. Small banks should consider partnerships or shared technology platforms to overcome scale disadvantages. For regulators, the risk-neutrality finding supports balanced supervision, revenue diversification need not trigger prudential concerns in appropriately regulated environments, but tiered policies are needed to prevent digital divergence from widening structural inequalities.
For investors and analysts, the positive NII-performance relationship indicates non-interest income should be interpreted as a positive signal rather than a risk indicator in emerging Asian banking, conditional on bank size. The scale conditioning effect implies that investors should weight NII differently based on bank size: a high NII ratio at a large bank represents a sustainable competitive advantage, while an equivalent ratio at a small bank may not translate into comparable performance benefits.
For Thai policymakers overseeing the virtual bank transition, the Chinese experience demonstrates that digital-only banking models can achieve profitability, but typically require several years of operation to reach scale. MYbank and WeBank took approximately three to four years to achieve consistent profitability, supported by their parent companies’ vast customer ecosystems. Thai virtual banks will not have access to equivalently scaled ecosystems, suggesting potentially longer paths to profitability.
The findings also carry implications for competition policy. If non-interest income diversification benefits concentrate among large banks, the entry of virtual banks backed by large technology or telecom conglomerates could further concentrate market power. Policymakers should monitor market concentration indicators and ensure that virtual bank licensing frameworks promote genuine competition rather than simply transferring market share from traditional incumbents to technology-backed new entrants.

6. Conclusions

6.1. Summary of Findings

This study examined how non-interest income diversification affects bank performance and risk in selected emerging Asian economies, drawing on panel data from 44 banks in China and Thailand over 2022–2025. Five hypotheses were tested; four received empirical support and the fifth received marginal support.
The core finding is that non-interest income diversification significantly enhances profitability without increasing risk. The NII coefficients on ROA (0.0037, p = 0.036) and ROE (0.0368, p = 0.024) indicate meaningful performance gains, while the null Z-score coefficient supports risk neutrality. This offers a qualified complement to the Western complexity-risk narrative and highlights institutional boundary conditions.
The scale advantage finding represents a significant contribution. Large banks capture substantially larger performance benefits (beta = 0.0044, p = 0.006) compared to small banks (beta = 0.0026, p = 0.268), consistent with technology infrastructure advantages, network effects, and compliance cost amortization. The mediation analysis reveals cost efficiency, as measured by CIR, does not transmit the NII-performance relationship (Sobel Z = 0.611, p = 0.541). Because CIR is a broad accounting composite affected by both cost reductions and revenue increases, this null result does not permit inference that revenue-side mechanisms dominate cost-side mechanisms; it merely indicates that this particular ratio does not capture the operative channel. Cross-country exploratory patterns show stable but modest effects in China (beta = 0.0023, p = 0.023) against larger but statistically fragile coefficients in Thailand (beta = 0.0096, p = 0.366). The interaction test (NII × THA) yields an insignificant coefficient (0.0073, p = 0.412), confirming that the data do not support a robust claim of cross-country divergence.

6.2. Theoretical and Practical Contributions

The study makes three theoretical contributions. First, it provides recent panel evidence from China and Thailand that non-interest income diversification enhances profitability without increasing risk in tightly regulated emerging markets, complementing the predominantly Western evidence on the complexity-risk trade-off. Second, it identifies bank scale as a critical boundary condition in these markets, extending the digital divide literature to financial sector diversification outcomes. Third, it cautions that the cost-to-income ratio may be too coarse to capture the mechanisms linking diversification to performance, calling for more granular operational metrics in future research.
Practical contributions span bank management, regulation, investment analysis, and policy design. Managers gain evidence for prioritizing revenue-enhancing digital strategies. Regulators receive guidance for tiered digital banking policies. Investors obtain a framework for interpreting NII as a conditional positive signal. Policymakers in Thailand gain empirical grounding for virtual bank supervision.

6.3. Limitations and Future Research

The short panel (T = 4) constrains dynamic analysis. The lagged NII null result reflects this limitation. Future research should extend the time dimension, particularly to capture post-2026 virtual bank effects in Thailand. The NII ratio remains an imperfect proxy for non-interest income diversification intensity, and the cost-to-income ratio cannot cleanly separate cost-side from revenue-side mechanisms. Future research should employ more direct operational metrics, such as labor cost ratios, branch reductions, or processing efficiency indices, alongside customer-facing digitalization measures like mobile banking usage or digital transaction volumes, to decompose the channels linking diversification to performance. The Thai sample (8 banks) is small, limiting statistical power. The absence of consistently reported non-performing loan data across the sample banks prevented a direct test of the NII–asset quality relationship. A decomposition of NII into fee income, trading income, and other non-interest components would be desirable to isolate the sources of diversification benefits, but granular sub-item data are not consistently reported across Chinese and Thai banks in the automated extracts used here; this remains a task for future research with more detailed regulatory filings.
Future directions include examining the 2026 virtual bank entry as a natural experiment, testing ownership conditioning effects directly, and employing customer-level data to test the revenue mechanism hypothesis through digital engagement and cross-selling rates.

6.4. Closing Remarks

Non-interest income diversification is not a uniform force distributing benefits equally across banks of different sizes. Its performance effects are real but concentrated, risk implications are context-dependent rather than universally negative, and transmission mechanisms remain unresolved because the cost-to-income ratio cannot cleanly separate cost-side from revenue-side channels. In emerging Asia, where digital banking ecosystems are still evolving, these findings carry relevance for regulatory frameworks, competitive strategies, and public policies shaping the sector’s development trajectory. The digital banking revolution in emerging Asia remains an unfolding story; this study offers a snapshot of its early chapters, with much still to be written.

Author Contributions

Conceptualization, Q.F. and N.R.; methodology, Q.F.; software, Q.F.; validation, Q.F. and N.R.; formal analysis, Q.F.; investigation, Q.F.; resources, N.R.; data curation, Q.F.; writing—original draft preparation, Q.F.; writing—review and editing, N.R.; visualization, Q.F.; supervision, N.R.; project administration, N.R.; funding acquisition, Q.F. and N.R. All authors have read and agreed to the published version of the manuscript.

Funding

This research received no external funding.

Institutional Review Board Statement

Not applicable.

Informed Consent Statement

Not applicable.

Data Availability Statement

The data presented in this study are available on request from the corresponding author. Financial data were collected via the Yahoo Finance API and supplemented by the yfinance library for equity data and wbdata for macroeconomic indicators. Macroeconomic controls were sourced from World Bank Open Data. The panel covers annual financial statement data for 44 commercial banks in China and Thailand over the period 2022–2025.

Acknowledgments

The authors would like to thank KMITL Business School for the academic support provided during this research.

Conflicts of Interest

The authors declare no conflicts of interest. The funders had no role in the design of the study; in the collection, analyses, or interpretation of data; in the writing of the manuscript; or in the decision to publish the results.

Abbreviations

The following abbreviations are used in this manuscript:
APIApplication Programming Interface
BRICSBrazil, Russia, India, China, South Africa
CBIRCChina Banking and Insurance Regulatory Commission
CHNChina dummy
CIConfidence Interval
CIRCost-to-income ratio
CPIConsumer Price Index
DVDependent variable
FEFixed effects
GDPGross Domestic Product
GMMGeneralized Method of Moments
IPOInitial Public Offering
LAGLoan asset growth
LARGELarge bank dummy
LEVLeverage
NIINon-interest income (ratio)
ROAReturn on Assets
ROEReturn on Equity
SDStandard Deviation
SETStock Exchange of Thailand
SIZEBank size
TTime dimension (panel length)
USDUnited States Dollar
VIFVariance Inflation Factor
YoYYear over Year
Z-scoreBank stability score (distance to insolvency)

References

  1. Alsobai, B., & Aassouli, D. (2025). Assessing digital transformation strategies in retail banks: A global perspective. Journal of Risk and Financial Management, 18(12), 710. [Google Scholar] [CrossRef]
  2. Bank of Thailand. (2025). Virtual bank licensing framework and policy guidelines. Bank of Thailand Policy Document. [Google Scholar]
  3. Baron, R. M., & Kenny, D. A. (1986). The moderator–mediator variable distinction in social psychological research. Journal of Personality and Social Psychology, 51(6), 1173–1182. [Google Scholar] [CrossRef] [PubMed]
  4. Barroso, M., & Laborda, J. (2022). Digital transformation and the emergence of the Fintech sector: Systematic literature review. Digital Business, 2(2), 100028. [Google Scholar] [CrossRef]
  5. Berger, A. N. (2003). The economic effects of technological progress: Evidence from the banking industry. Journal of Money, Credit and Banking, 35(2), 141–176. [Google Scholar] [CrossRef]
  6. Berger, A. N., Hasan, I., & Zhou, M. (2010). The effects of focus versus diversification on bank performance: Evidence from Chinese banks. Journal of Banking and Finance, 34(7), 1417–1435. [Google Scholar] [CrossRef]
  7. Berger, A. N., & Mester, L. J. (1997). Inside the black box: What explains differences in the efficiencies of financial institutions? Journal of Banking and Finance, 21(7), 895–947. [Google Scholar] [CrossRef]
  8. Boyd, J. H., De Nicolo, G., & Jalal, A. M. (2006). Bank risk-taking and competition revisited. IMF Working Paper No. 06/297. International Monetary Fund. [Google Scholar]
  9. Chiorazzo, V., Milani, C., & Salvini, F. (2008). Income diversification and bank performance: Evidence from Italian banks. Journal of Financial Services Research, 33(3), 181–203. [Google Scholar] [CrossRef]
  10. DeYoung, R., & Roland, K. P. (2001). Product mix and earnings volatility at commercial banks. Journal of Financial Intermediation, 10(1), 54–84. [Google Scholar] [CrossRef]
  11. Diamond, D. W. (1984). Financial intermediation and delegated monitoring. Review of Economic Studies, 51(3), 393–414. [Google Scholar] [CrossRef]
  12. Do, T. D., Pham, H. A., & Nguyen, T. M. (2022). The impact of digital transformation on performance: Evidence from Vietnamese commercial banks. Journal of Risk and Financial Management, 15(1), 21. [Google Scholar] [CrossRef]
  13. Elsas, R., Hackethal, A., & Holzhäuser, M. (2010). The anatomy of bank diversification. Journal of Banking & Finance, 34(6), 1274–1287. [Google Scholar] [CrossRef]
  14. Frost, J., Gambacorta, L., Huang, Y., Shin, H. S., & Zbinden, P. (2019). BigTech and the changing structure of financial intermediation. BIS Working Papers No. 779. Bank for International Settlements. [Google Scholar]
  15. Fuster, A., Plosser, M., Schnabl, P., & Vickery, J. (2019). The role of technology in mortgage lending. Review of Financial Studies, 32(5), 1854–1899. [Google Scholar] [CrossRef]
  16. Lee, C.-C., Yang, S.-J., & Chang, C.-H. (2014). Non-interest income, profitability, and risk in banking industry. The North American Journal of Economics and Finance, 27, 48–67. [Google Scholar] [CrossRef]
  17. Lepetit, L., Nys, E., Rous, P., & Tarazi, A. (2008). Bank income structure and risk: An empirical analysis of European banks. Journal of Banking and Finance, 32(8), 1452–1467. [Google Scholar] [CrossRef]
  18. Lin, J.-R., Chung, H., & Yen, D.-C. (2012). The effects of interest incomes, fee incomes, and diversification on bank profitability and risk in Asian banks. The Service Industries Journal, 32(13), 2155–2171. [Google Scholar]
  19. Mercieca, S., Schaeck, K., & Wolfe, S. (2007). Small European banks: Benefits from diversification? Journal of Banking and Finance, 31(7), 1975–1998. [Google Scholar] [CrossRef]
  20. Nguyen, K. N. (2019). Revenue diversification, risk and bank performance of Vietnamese commercial banks. Journal of Risk and Financial Management, 12(3), 138. [Google Scholar] [CrossRef]
  21. Nguyen-Thi-Huong, L., Nguyen, T. T., & Nguyen-Viet, H. (2023). How does digital transformation impact bank performance? Cogent Economics & Finance, 11(1), 2217582. [Google Scholar]
  22. Roodman, D. (2009). How to do xtabond2: An introduction to difference and system GMM in Stata. Stata Journal, 9(1), 86–136. [Google Scholar] [CrossRef]
  23. Sanya, S., & Wolfe, S. (2011). Can banks in emerging economies benefit from revenue diversification? Journal of Financial Services Research, 40(1–2), 79–101. [Google Scholar]
  24. Sapienza, P. (2004). The effects of government ownership on bank lending. Journal of Financial Economics, 72(2), 357–384. [Google Scholar] [CrossRef]
  25. Stiroh, K. J. (2004). Diversification in banking: Is noninterest income the answer? Journal of Money, Credit and Banking, 36(5), 853–882. [Google Scholar] [CrossRef]
  26. Thakor, A. V. (2020). Fintech and banking: What do we know? Journal of Financial Intermediation, 41, 100833. [Google Scholar] [CrossRef]
  27. Tuli, E. (2023). Exploring digital banking adoption in developing Asian economies: Systematic literature review and bibliometric analysis. International Social Science Journal, 74(252), 399–426. [Google Scholar] [CrossRef]
  28. Vial, G. (2019). Understanding digital transformation: A review and a research agenda. Journal of Strategic Information Systems, 28(2), 118–144. [Google Scholar] [CrossRef]
  29. Vives, X. (2019). Digital disruption in banking. Annual Review of Financial Economics, 11, 243–272. [Google Scholar] [CrossRef]
  30. Wang, C., & Lin, Y. (2021). Income diversification and bank risk in Asia Pacific. North American Journal of Economics and Finance, 57, 101448. [Google Scholar] [CrossRef]
  31. Wooldridge, J. M. (2020). Introductory econometrics: A modern approach (7th ed.). Cengage Learning. [Google Scholar]
  32. Wu, X., & Cheng, G. (2024). The performance and stability of financial institutions after digital transformation: The importance of regional policies. Finance Research Letters, 66, 105671. [Google Scholar] [CrossRef]
  33. Zhao, Y., & Mei, X. (2025). Non-interest income diversification and bank performance: Evidence from Chinese commercial banks. PLoS ONE, 20(4), e0321899. [Google Scholar] [CrossRef] [PubMed]
  34. Zhou, K. (2014). The effect of income diversification on bank risk: Evidence from China. Emerging Markets Finance and Trade, 50(sup3), 201–213. [Google Scholar] [CrossRef]
  35. Zhu, Y., & Jin, S. (2023). How does the digital transformation of banks improve efficiency and ESG? Systems, 11(7), 328. [Google Scholar] [CrossRef]
Figure 1. Correlation matrix of key variables.
Jrfm 19 00580 g001
Figure 2. NII trend by country (2022–2025).
Jrfm 19 00580 g002
Figure 3. Key regression coefficients. Note. ** p < 0.05; ns = not significant.
Jrfm 19 00580 g003
Figure 4. Heterogeneous effects by scale and country. Note. ns = not significant; ** p < 0.05; *** p < 0.01.
Jrfm 19 00580 g004
Figure 5. NII distribution by scale and country.
Jrfm 19 00580 g005
Table 1. Summary of research hypotheses.
HypothesisStatementExpected DirectionTheoretical Basis
H1NII positively affects profitabilityPositiveScope economies
H2NII-performance stronger in large banksScale advantageDigital divide
H3NII does not increase bank riskRisk-neutralInstitutional constraints
H4Cost efficiency does not mediateNo mediationRevenue mechanism
H5Cross-country heterogeneity existsChina less than ThailandDigital maturity
Table 2. Variable definitions and measurements.
VariableDefinitionCalculation
ROAReturn on assetsNet income/Total assets
ROEReturn on equityNet income/Shareholders equity
Z-scoreBank stability(ROA + Equity/Assets)/SD(ROA)
NIINon-interest income ratio(Total revenue − Net interest income)/Total revenue
CIRCost-to-income ratioOperating expenses/Total revenue
SIZEBank sizeLn(Total assets in USD)
LEVLeverageTotal liabilities/Total assets
LAGLoan asset growthYoY change in gross loans
GDP_growthGDP growthAnnual real GDP growth (World Bank)
InflationInflation rateAnnual CPI inflation (World Bank)
CHNChina dummy1 = China, 0 = Thailand
LARGELarge bank dummy1 if SIZE ≥ median, 0 otherwise
Table 3. Descriptive statistics by sample.
VariableFull MeanFull SDCHN MeanCHN SDTHA MeanTHA SD
ROA0.00790.00330.00720.00200.01090.0057
ROE0.09040.02480.09120.02220.08690.0342
NII0.24670.07740.24970.08020.23330.0624
CIR0.33630.06470.34480.06270.29840.0606
Z-score176.50122.63195.99127.1688.7724.49
SIZE28.361.6428.481.7127.781.14
LEV0.91200.02020.92000.00850.87580.0181
LAG0.05910.05510.06780.05420.02010.0407
GDP4.221.174.630.882.420.24
Inflation0.981.860.660.762.403.77
Table 4. Baseline fixed-effects regression results.
Variable(1) ROE(2) ROA(3) Z-Score
NII0.0368 **0.0037 **18.882
(0.024)(0.036)(0.109)
SIZE−0.0546 ***−0.0041 ***6.389
LEV0.1184−0.0769 ***−1297.702 ***
LAG0.0861 ***0.0079 ***−17.325
GDP_growth−0.0045 ***−0.0004 ***0.514
Inflation−0.0005−0.00000.438 *
Observations176176176
R-squared0.3890.4120.523
Bank FEYesYesYes
Note. p-values in parentheses. * p < 0.10, ** p < 0.05, *** p < 0.01.
Table 5. Scale subsample results (Dependent Variable: ROA).
Variable(1) Large Banks(2) Small Banks
NII0.0044 ***0.0026
(0.006)(0.268)
SIZE−0.0053 ***−0.0027 **
LEV−0.1036 ***−0.0486
LAG0.0101 ***0.0047
GDP_growth−0.0005 ***−0.0002
Inflation0.0000−0.0001
Observations8888
R-squared0.4560.312
Bank FEYesYes
Note. ** p < 0.05; *** p < 0.01.
Table 6. Country subsample results (Dependent Variable: ROA).
Variable(1) China(2) Thailand
NII0.0023 **0.0096
(0.023)(0.366)
SIZE−0.0023 **0.0031
LEV−0.0597 ***−0.0889
LAG0.0031 *0.0021
GDP_growth0.0005 *0.0008
Inflation0.0010 **0.0001
Observations14432
R-squared0.3980.287
Bank FEYesYes
Note. * p < 0.10; ** p < 0.05; *** p < 0.01.
Table 7. Mediation analysis results.
StepEffectCoefficientSignificance
Step 1NII to ROA (c)0.0037p = 0.036 **
Step 2NII to CIR (a)0.023p = 0.142
Step 3NII to ROA | CIR (c′)0.0035p = 0.041 **
Step 3CIR to ROA (b)−0.009p = 0.312
Indirecta × b0.0002Sobel Z = 0.611
Bootstrap CI[−0.0004, 0.0011]p = 0.541
ConclusionMediationNot significantDirect effect dominant
Note. ** p < 0.05.
Table 8. Robustness check results.
TestNII Coeff.SignificanceConclusion
Baseline (ROA)0.0037p = 0.036 **Confirmed
Alternative DV (ROE)0.0368p = 0.024 **Robust
Lagged NII−0.0003p = 0.892 (ns)Short panel limit
1% Winsorization0.0035p = 0.041 **Robust
Exclude 20220.0032p = 0.052 *Robust
Large banks only0.0041p = 0.012 **Stronger in large
Small banks only0.0028p = 0.089 *Marginal in small
Note. ns = not significant; * p < 0.10; ** p < 0.05.
Disclaimer/Publisher’s Note: The statements, opinions and data contained in all publications are solely those of the individual author(s) and contributor(s) and not of MDPI and/or the editor(s). MDPI and/or the editor(s) disclaim responsibility for any injury to people or property resulting from any ideas, methods, instructions or products referred to in the content.