


Abstract
This study examines whether environmental, social, and governance (ESG) performance enhances firm value in China’s A-share market, how this relationship operates, and under what conditions it becomes stronger. Drawing on stakeholder theory, the natural resource-based view, and the dynamic capabilities perspective, this study develops a moderated mediation framework in which green innovation mediates the ESG–firm value relationship and digital transformation strengthen the ESG–green innovation link. Using panel data for 4423 Chinese A-share listed firms comprising 27,254 firm-year observations from 2009 to 2023, the hypotheses are tested using two-way fixed-effects models, mediation and moderated mediation analyses, robustness tests, and instrumental-variable estimation. The results show that overall ESG performance is positively associated with firm value, although its dimensions exhibit heterogeneous effects: environmental performance is negatively associated with firm value, whereas social and governance performance show positive associations. Green innovation partially mediates the ESG–firm value relationship, indicating that ESG creates greater economic value when sustainability commitments are translated into substantive green innovation. Digital transformation further strengthens the indirect effect of ESG performance on firm value through green innovation. Heterogeneity analyses reveal that the value relevance of ESG varies across firm size, ownership type, and industry pollution intensity. The findings suggest that ESG does not create firm value automatically; rather, its economic value depends on firms’ ability to transform sustainability commitments into innovation, with digital transformation enhancing this process. By identifying both the mechanism and the boundary condition of ESG value creation, this study provides new evidence on how and under what conditions ESG contributes to firm value in an emerging market.
1. Introduction
Driven by China’s “dual-carbon” goals and the rapid expansion of the digital economy, listed firms have increasingly accelerated their transition toward sustainable development. Accordingly, environmental, social, and governance (ESG) performance has evolved beyond a disclosure requirement and is increasingly regarded as an important strategic consideration. Rather than serving only as a reporting practice, ESG performance is now widely recognized as a strategic driver of corporate competitiveness, risk management, and market valuation (Khan et al., 2016). At the same time, policy initiatives such as the “Digital China” strategy and the “14th Five-Year Plan for Digital Economy Development” have encouraged firms to adopt digital technologies. These technologies can improve information processing, resource coordination, environmental monitoring, and innovation efficiency, thereby changing how firms implement sustainability strategies (El-Kassar & Singh, 2019; Y. Ying & Jin, 2023).
China provides a distinctive institutional context for investigating whether ESG performance creates firm value. As the world’s largest emerging economy, China’s sustainability transition is shaped by a combination of government intervention, regulatory guidance, and state-led development strategies (Marquis & Qian, 2014). Within this institutional environment, ESG engagement serves not only as a response to stakeholder expectations but also as an important means of meeting regulatory requirements, strengthening organizational legitimacy, and improving firms’ access to external resources provided by regulators, investors, and financial institutions (Suchman, 1995). Recent regulatory changes further reinforce this trend. In 2024, the Shanghai, Shenzhen, and Beijing stock exchanges issued sustainability reporting guidelines, marking an important step toward more standardized sustainability disclosure among listed firms. This policy shift highlights the need to understand whether ESG performance can generate economic benefits. A key question therefore remains: Can ESG performance be transformed into market-recognized firm value in China’s A-share market?
Whether ESG performance improves firm value remains an unresolved issue in the existing literature. ESG engagement often requires long-term investment in environmental management, social responsibility, governance improvement, and disclosure systems (Eccles et al., 2014). These activities may improve corporate reputation, reduce information asymmetry, and lower perceived risk. Yet, they may also increase compliance costs and consume financial resources that could otherwise be used for short-term operations. Existing studies have therefore reported mixed findings. One stream of research suggests that ESG performance enhances firm value by strengthening stakeholder trust, improving transparency, and reducing risk (Behl et al., 2022; Dhaliwal et al., 2012; Velte, 2017). Another stream argues that ESG engagement may impose cost burdens and weaken financial outcomes, especially when sustainability activities are only symbolic or weakly connected to firms’ core business operations (Buallay, 2019; Duque-Grisales & Aguilera-Caracuel, 2021). Meta-analytic evidence also suggests that the ESG–financial performance relationship is context-dependent (Atz et al., 2023; Friede et al., 2015). These inconsistent findings suggest that future research should focus not only on whether ESG creates firm value but also on the mechanisms through which value is generated and the conditions under which this relationship becomes stronger or weaker.
Green innovation represents a potential mechanism linking ESG performance with firm value. From the perspective of stakeholder theory, firms with stronger ESG performance are more likely to respond to regulatory pressure and stakeholder pressures for environmental responsibility (Berrone et al., 2013). Such pressures encourage firms to invest in green technologies, including clean production processes, pollution-control technologies, energy-saving systems, and renewable energy applications. From the resource-based view, green innovation can be regarded as a firm-specific strategic resource. It may improve resource efficiency, reduce environmental compliance risks, and support the attainment of sustainable competitive advantages. ESG performance may therefore create value not only through disclosure and reputation effects but also through substantive green technological outputs (J. Zhang & Liu, 2023; Zheng et al., 2023).
Digital transformation may further influence this mechanism by strengthening the relationship between ESG performance and green innovation. Digital technologies im-prove firms’ capacity to acquire, process, and integrate information, thereby facilitating more efficient resource allocation and organizational coordination. First, digital technologies, such as big data, cloud computing, and digital platforms, can help firms collect, analyze, and disclose environmental information more accurately, potentially reducing information asymmetry, improving transparency, and limiting greenwashing risks (Wang & Zhong, 2024; Zhuo et al., 2024). Second, digital technologies can improve resource orchestration. Green innovation is often risky, costly, and knowledge-intensive. Digital tools can support data-driven research and development, improve cross-departmental coordination, and accelerate the commercialization of green innovations (Jiang et al., 2025; Sirmon et al., 2011; Xu et al., 2024). Digital transformation may therefore enable firms to convert ESG commitments into more effective green innovation outputs.
Against this background, this study examines Chinese A-share listed firms from 2009 to 2023. ESG performance is measured using Huazheng ESG ratings, firm value is measured using Tobin’s Q, green innovation is measured using applications for green invention patents, and digital transformation is measured using a text-based digital transformation index. Using two-way fixed-effects regressions, mediation analysis, and moderated mediation analysis, this study examines whether ESG performance contributes to firm value through green innovation and whether digital transformation strengthens this mechanism. Heterogeneity analyses are further conducted to explore whether these relationships vary across different ownership structures and industry contexts.
This study makes three contributions. First, it adds to the ESG–firm value literature by showing that the value relevance of ESG performance is not limited to external legitimacy or disclosure signals. Rather, ESG performance is linked to firm value partly through green innovation, which reflects firms’ ability to transform sustainability engagement into technological outcomes. This study also extends the literature by considering digital transformation’s role as a condition that facilitates this transformation process. Firms with stronger digital capabilities are better positioned to convert ESG engagement into green innovation. Third, evidence from China’s A-share market provides new insights into how institutional characteristics shape the value implications of ESG across different firm types and industry contexts.
2. Literature Review and Hypothesis Development
2.1. ESG Performance and Firm Value
Environmental, social, and governance (ESG) performance reflects how effectively a firm manages its environmental responsibilities, social relationships, and governance practices. The relationship between ESG performance and firm value remains debated in sustainable finance. Recent studies suggest that the value effect of ESG performance depends on market conditions, disclosure quality, firm characteristics, and measurement approaches (Binh & Lee, 2024; Cheng et al., 2024; L. Wu et al., 2025). ESG activities may enhance firm value by building stakeholder trust, reducing risks, and strengthening legitimacy. Yet they may also weaken financial outcomes when they consume substantial resources but are not integrated into core business operations. This debate is especially relevant in emerging markets such as China, where sustainability regulation is developing rapidly and investors may interpret ESG signals differently.
Stakeholder theory provides the primary theoretical foundation for explaining why ESG performance may improve firm value. According to Freeman (1984), firms create long-term value by balancing the interests of multiple stakeholders, including investors, regulators, customers, employees, suppliers, and local communities. ESG engagement demonstrates a firm’s commitment to responsible business practices, which helps strengthen stakeholder trust, enhance organizational legitimacy, and reduce conflicts with external stakeholders (Behl et al., 2022; Yu & Luu, 2021). These benefits can increase investor confidence, improve access to external resources, and support higher market valuations. Prior studies have similarly found that stronger ESG performance is associated with improved transparency, lower perceived risk, and better financial outcomes (Engelhardt et al., 2021; Velte, 2017; Wedajo et al., 2024).
However, the economic benefits of ESG engagement are not universally supported. ESG implementation often requires continuous investment in environmental protection, employee welfare, governance improvement, and sustainability disclosure, all of which may increase operating costs and reduce short-term profitability (Buallay, 2019; Buallay et al., 2020). In addition, managers may use symbolic ESG activities to improve their personal reputation or protect career interests, especially when sustainability goals are weakly connected to business strategy (Aluchna et al., 2022; Gjergji et al., 2021). In such cases, ESG engagement may generate limited economic returns and increase governance and monitoring costs (Binh & Lee, 2024; Ma & Ma, 2025).
These competing views suggest that ESG performance should be examined from a contingency perspective. ESG performance is more likely to be valued by the market when firms have greater disclosure transparency and operate in institutional environments that support sustainable behavior (Aouadi & Marsat, 2018; Velte, 2017; F. Zhang et al., 2020). In China’s A-share market, the “dual-carbon” targets and stricter sustainability disclosure requirements have changed ESG engagement from a voluntary branding activity into an important signal of compliance, risk management, and strategic alignment. In this context, the benefits of ESG performance may outweigh its short-term costs. Therefore, we propose the following hypothesis:
H1.
ESG performance is positively associated with firm value.
2.2. The Mediating Role of Green Innovation
ESG performance may enhance firm value through green innovation. Green innovation refers to the development or adoption of environmentally friendly technologies, products, and production processes that reduce environmental impacts while supporting long-term competitiveness. Firms with stronger ESG performance face greater expectations from regulators, investors, and other stakeholders, encouraging them to move beyond symbolic disclosure and invest in green technologies, such as clean production, eco-design, energy-saving systems, and pollution-control innovation (Marquis & Qian, 2014).
The natural resource-based view (Hart, 1995) provides the primary theoretical foundation for this mechanism. It suggests that firms can create sustainable competitive advantages by developing environmentally oriented capabilities and resources. ESG commitment encourages firms to accumulate environmental knowledge and technological capabilities, which support green innovation and improve resource efficiency (Luo & Du, 2015). Rather than representing only a compliance cost, green innovation can facilitate product differentiation, reduce production costs, and strengthen firms’ long-term competitiveness (Bataineh et al., 2024; Porter & van der Linde, 1995).
This innovation channel is particularly important in China’s capital market. The “dual-carbon” policy has increased the strategic value of green technologies, making green innovation an important pathway through which ESG creates firm value. Firms with stronger green innovation are more likely to receive favorable market evaluations because investors expect them to face lower regulatory risk and benefit from emerging green industries. Recent studies also show that ESG performance promotes corporate green innovation in China (Y. Tan & Zhu, 2022; J. Zhang & Liu, 2023; Zheng et al., 2023). Green patent portfolios make sustainability efforts more visible and verifiable to external investors, helping to transmit ESG performance’s value effect to firm value (W. Tan et al., 2024).
Accordingly, ESG investment may not generate immediate financial benefits but can gradually improve firm value by stimulating green innovation. Therefore, we propose the following hypothesis:
H2.
Green innovation mediates the relationship between ESG performance and firm value.
2.3. The Moderating Role of Digital Transformation
Digital transformation may affect how efficiently ESG commitment is converted into green innovation. It reflects the integration of digital technologies into business operations, information systems, and managerial processes. From the dynamic capabilities perspective, digital transformation enables firms to identify environmental changes, integrate sustainability-related knowledge, and reconfigure organizational resources more efficiently. In this study, digital transformation is viewed as an organizational capability that strengthens the relationship between ESG performance and green innovation.
Digital transformation may strengthen this relationship through two mechanisms: information transparency and resource orchestration. First, digital technologies, such as big data, the Internet of Things (IoT), and cloud computing, can support environmental monitoring, data collection, and information processing. These technologies can improve corporate information transparency and reduce information asymmetry, thereby strengthening external monitoring and facilitating support for ESG-related activities (Huang, 2025). Second, green innovation is complex, costly, and dependent on cross-departmental collaboration. Digital infrastructure can improve knowledge integration, optimize internal resource allocation, and help managers allocate R&D resources to green projects more efficiently (D. Li & Shu, 2025; Sun, 2024).
In China, corporate digital transformation is supported by national initiatives such as the “Digital China” strategy. Empirical evidence from Chinese A-share firms suggests that digital transformation can promote green innovation and improve ESG performance. This indicates that firms with stronger digital capabilities may be better positioned to respond to environmental requirements and translate sustainability strategies into innovation-oriented outcomes (H. Li et al., 2024; Y. Li et al., 2024). Although digital transformation requires investment in infrastructure, software, and organizational change, it can improve the efficiency of ESG implementation when firms pursue sustainability-oriented innovation. Therefore, we propose the following hypothesis:
H3.
Digital transformation positively moderates the relationship between ESG performance and green innovation.
2.4. The Moderated Mediation Effect
Combining the mediation and moderation arguments leads to a moderated mediation framework. If green innovation is the mechanism through which ESG performance enhances firm value, and if digital transformation strengthens the ESG–green innovation relationship, then the indirect effect of ESG performance on firm value through green innovation should vary across different levels of digital transformation (Hayes, 2015; Yang et al., 2024).
In this framework, digital transformation serves as a boundary condition. Firms with higher digital maturity usually have stronger information-processing abilities and better resource coordination systems. These abilities help them identify green market opportunities, improve R&D workflows, and align sustainability objectives with innovation activities (Yang et al., 2024).
By contrast, firms with lower digital maturity may face communication barriers, inefficient resource allocation, and information friction. These problems may weaken the conversion of ESG commitment into green innovation. Accordingly, the indirect effect of ESG performance on firm value through green innovation is expected to be stronger for firms with higher levels of digital transformation. Based on this reasoning, we propose the following hypothesis:
H4.
Digital transformation strengthens the indirect effect of ESG performance on firm value through green innovation.
Based on the above hypotheses, Figure 1 presents the overall theoretical framework of this study, including the direct effect, mediating mechanism, moderating effect, and moderated mediation effect.
Figure 1.
Theoretical framework.
3. Research Design
3.1. Sample Selection and Data Sources
This study uses Chinese A-share listed firms from 2009 to 2023 as a research sample. This sample was screened through several steps. Firms in the financial, insurance, and real estate industries were excluded because their accounting rules, financial structures, and regulatory environments differ substantially from those of other firms. ST and *ST firms, delisted firms, and firm-year observations in the IPO year were also excluded to reduce the influence of abnormal operating conditions and newly listed firms. Observations with missing key variables were removed. To mitigate the influence of extreme values, all continuous variables were winsorized at the 1% and 99% levels.
After these screening procedures, the final sample included 4423 firms and 27,254 firm-year observations. ESG performance data were obtained from the Huazheng ESG database. Financial and corporate governance data were collected from CSMAR and Wind. Green patent data were obtained from the China National Intellectual Property Administration and Wind. Stata 17.0 was used for data processing and empirical analysis.
3.2. Variable Selection and Definition
3.2.1. Dependent Variable
Firm value refers to the market’s assessment of a firm’s current assets and future growth prospects. In this study, it is measured by Tobin’s Q. Tobin’s Q is widely used in corporate finance research because it captures a firm’s market valuation relative to its asset base (Lindenberg & Ross, 1981; Perfect & Wiles, 1994). As a market-based measure, Tobin’s Q reflects investors’ expectations regarding a firm’s future profitability, growth opportunities, and risk exposure. It is suitable for this study because capital markets increasingly incorporate ESG performance and its potential contribution to long-term corporate growth into firm valuation (X. Li et al., 2024). Tobin’s Q is calculated using market value and balance-sheet data from CSMAR. Return on assets (ROA) is used as an alternative dependent variable in the robustness tests to examine whether the results remain consistent when firm performance is measured from an accounting-based perspective.
3.2.2. Independent Variable
ESG performance refers to a firm’s performance in managing environmental responsibilities, social relationships, and corporate governance practices. In this study, it is measured using the ESG ratings issued by Shanghai Huazheng Index Information Service Co., Ltd. The Huazheng ESG rating system evaluates listed firms across three dimensions: environmental performance, social responsibility, and corporate governance. It also considers industry-specific ESG risks and regulatory compliance.
The Huazheng ESG rating is suitable for the Chinese capital market because it reflects China’s institutional setting, covers a broad range of Chinese A-share listed firms, and provides a relatively long time-series ESG rating record (Gong et al., 2025). In this study, ESG performance is measured using the composite Huazheng ESG score, which evaluates listed firms across environmental, social, and governance dimensions. Higher scores indicate better corporate ESG performance. In additional analyses, the environmental, social, and governance sub-scores are used to examine whether the value effect differs across ESG dimensions.
3.2.3. Mediating Variable
The mediating variable is Green Innovation (GI), which reflects a firm’s substantive technological advancements in decarbonization, clean production, eco-efficiency, and the circular economy. Aligning with the established literature, this study utilizes the volume of corporate green invention patent applications (W. Tan et al., 2024; F. Zhang et al., 2020). Green invention patents are preferred over utility model patents because they better capture high-quality technological breakthroughs and long-term green innovation capacity.
Green patents are identified using the International Patent Classification (IPC) Green Inventory developed by the World Intellectual Property Organization (WIPO). This classification covers technologies related to energy conservation, pollution control, renewable energy, and other environmentally sound technologies. Because the raw patent counts are highly right-skewed, GI is measured as the natural logarithm of one plus the number of green invention patent applications.
3.2.4. Moderating Variable
Digital transformation refers to the integration of digital technologies into firms’ operations and management processes. The moderating variable is corporate digital transformation (DCG). This study adopts the Digital Transformation Index developed by F. Wu et al. (2021). This index is constructed through web crawling and natural-language processing of annual reports of Chinese A-share listed firms. It captures digitalization -related keywords across five dimensions: artificial intelligence, blockchain, cloud computing, big data, and digital application scenarios. A higher index score indicates a higher level of corporate digital transformation.
In line with the theoretical model, DCG is used to examine whether digital transformation strengthens the conversion of ESG performance into green innovation. Firms with higher levels of digital transformation may possess stronger information-processing capabilities and more advanced digital infrastructure. These capabilities may help firms improve resource coordination, reduce information asymmetry, and convert sustainability strategies into green innovation outputs more efficiently.
3.2.5. Control Variables
To reduce omitted-variable bias, this study control for firm-level financial, operational, and governance characteristics. Following prior studies, the control variables include firm size, growth, firm age, board independence, leverage, cash ratio, ownership concentration, and state ownership (Bhagat & Bolton, 2019; Drempetic et al., 2020). Firm fixed effects and year fixed effects are also included in the regression models. Firm fixed effects control for time-invariant firm characteristics, while year fixed effects control for common macroeconomic and policy shocks. Detailed definitions and measurement methods of all variables are reported in Table 1.
Table 1.
Variable Definitions.
3.3. Model Specification
3.3.1. Baseline Model Specification
To examine the effect of ESG performance on firm value, we constructed a two-way fixed-effects panel regression model. To mitigate potential reverse causality and better capture the temporal ordering among variables, ESG performance and control variables were lagged by one period. The baseline model is specified as follows:
Here, denotes the firm value of firm i in year t, measured via Tobin’s Q. represents the one-period-lagged ESG performance. is a vector of the lagged control variables, including firm size, firm age, leverage, cash ratio, firm growth, state ownership, ownership concentration, and board independence. and denote firm fixed effects and year fixed effects, respectively. Firm fixed effects control for time-invariant firm heterogeneity, while year fixed effects control for common macroeconomic and policy shocks. is the error term. Standard errors are clustered at the firm level. A positive and statistically significant provides evidence supporting Hypothesis 1.
3.3.2. Mediation Analysis
To examine whether green innovation mediates the relationship between ESG performance and firm value, this study estimated mediation models within a two-way fixed-effects framework. Following the mediation analysis approach employed by Baron and Kenny (1986) and Hayes (2015), this analysis first examines whether ESG performance affects green innovation and then tests whether green innovation is associated with firm value after controlling for ESG performance. The mediation models are specified as follows:
where represents the green innovation output of firm i in year t. The coefficient captures the effect of ESG performance on green innovation, while captures the association between green innovation and firm value after ESG performance and other firm characteristics are controlled for. The indirect effect is calculated as follows: . If both and are positive and statistically significant and the indirect effect is significant, then ESG performance enhances firm value through green innovation, thereby supporting Hypothesis 2. Bootstrap confidence intervals were used to assess the statistical significance of the indirect effect, while the Sobel test is reported as a supplementary check.
3.3.3. Moderated Mediation Models
To examine whether digital transformation strengthens the indirect effect of ESG performance on firm value through green innovation, we estimated a moderated mediation model. Green innovation is treated as the mediating variable, while digital transformation is introduced as a moderator in the relationship between ESG performance and green innovation. Before the interaction term was constructed, ESG performance and digital transformation were mean-centered to improve interpretation of the interaction effect.
The moderated mediation model focuses on the first-stage moderated path. Specifically, it tests whether the effect of ESG performance on green innovation varies with the level of digital transformation. The first-stage moderation model is specified as follows:
where denotes the one-period-lagged level of digital transformation. The interaction term captures whether digital transformation changes the effect of ESG performance on green innovation. A significantly positive indicates that digital transformation strengthens the positive relationship between ESG performance and green innovation, thereby supporting Hypothesis 3.
To estimate the conditional indirect effect, the following firm-value equation is further specified:
The conditional indirect effect of ESG performance on firm value through green innovation is calculated as follows:
where represents the effect of green innovation on firm value. Conditional indirect effects are estimated at low, medium, and high levels of digital transformation, defined as one standard deviation below the mean, the mean, and one standard deviation above the mean, respectively. Bootstrap standard errors and confidence intervals are used to evaluate the statistical significance of the moderated mediation effect. Hypothesis 4 is supported if the conditional indirect effect is stronger at higher levels of digital transformation and the index of moderated mediation, , is statistically significant.
4. Empirical Results
4.1. Descriptive Statistics and Correlation Analysis
Table 2 reports the descriptive statistics for the main variables. The ESG pillar scores show that governance performance is higher on average than social and environmental performance. The median value of green innovation is zero, suggesting that a substantial proportion of firm-year observations recorded no green invention patent applications during the sample period. Digital transformation exhibits considerable variation across firms. Among the control variables, state-owned enterprises account for 32.4% of the sample, while the average shareholding of the largest shareholder is 34.760%, indicating relatively concentrated ownership. Overall, the main variables display considerable variation across the sample.
Table 2.
Descriptive statistics.
Table 3 reports the Pearson correlation coefficients for the main variables. ESG performance is positively and significantly correlated with green innovation and digital transformation, with coefficients of 0.128 and 0.103, respectively. These results are consistent with the proposed mechanism wherein ESG performance may be related to green innovation and digital capability. The simple correlation between ESG performance and Tobin’s Q also positive and significant, with a coefficient of 0.038. This result provides preliminary evidence that firms with stronger ESG performance tend to have higher market valuation. However, this result should be interpreted with caution because bivariate correlations do not control for firm characteristics, unobserved firm heterogeneity, or year-specific shocks. Therefore, fixed-effects panel regressions are needed to further examine the relationship between ESG performance and firm value.
Table 3.
Correlation analysis.
To check for potential multicollinearity, variance inflation factor (VIF) was calculated. As shown in Table 4, the individual VIF values range from 1.01 to 2.33, with a mean VIF of 1.48. The highest VIF is for leverage, while the VIF of the core explanatory variable, ESG, is only 1.09. All VIF values are well below the commonly used threshold of 10, suggesting that severe multicollinearity is unlikely. These results indicate that multicollinearity is unlikely to affect the estimation of the subsequent regression models.
Table 4.
Collinearity analysis.
4.2. Baseline Regression Analysis
Table 5 reports the baseline regression results for the relationship between ESG performance and firm value. As shown in Column 1, the coefficient of the composite ESG score is positive and statistically significant. This result indicates that firms with better overall ESG performance tend to have a higher Tobin’s Q after firm fixed effects, year fixed effects, and firm-level characteristics are controlled for. Therefore, Hypothesis 1 is supported.
Table 5.
Baseline regression results.
Columns 2 to 4 further examine the environmental, social, and governance dimensions separately. The results provide a more nuanced picture of the ESG–firm value relationship. The environmental dimension has a negative and significant coefficient, suggesting that environmental performance may involve short-term cost pressure or longer investment cycles before its potential value is reflected in market valuation. Environmental activities, such as pollution control, clean production, and environmental compliance, often require substantial upfront investment, which may weaken short-term market valuation.
In contrast, the social and governance dimensions are positively and significantly associated with firm value, suggesting that social responsibility and governance quality may be more immediately recognized by investors. Stronger social performance can improve stakeholder relations, corporate reputation, and legitimacy, while better governance can reduce agency costs, improve information transparency, and strengthen investor protection. Among the three ESG dimensions, governance shows the largest positive coefficient, indicating that governance quality may play a particularly important role in China’s A-share market.
The control variables show generally consistent patterns across the four specifications. Firm size and leverage are negatively and significantly associated with Tobin’s Q, suggesting that larger asset bases and higher debt levels may be linked to lower market valuation ratios. Growth, ownership concentration, and board independence are positively related to firm value, while state ownership is negatively associated with Tobin’s Q. The R-squared values remain stable across the models, indicating that the explanatory power of the specifications is consistent.
4.3. Mediation Effect Analysis
Table 6 reports the mediation analysis results for green innovation. Column 1 shows that ESG performance is positively associated with Tobin’s Q, with a coefficient of 0.277that is statistically significant at the 5% level. This result confirms the baseline relationship between ESG performance and firm value.
Table 6.
Mediation analysis of green innovation.
Column 2 examines the effect of ESG performance on green innovation. The coefficient of ESG is 0.975 and statistically significant at the 1% level, indicating that firms with stronger ESG performance tend to generate more green innovation outputs. This finding suggests that ESG engagement may encourage firms to invest in green technological activities.
Column 3 includes both ESG performance and green innovation in the firm-value regression. The coefficient of green innovation is 0.072and statistically significant at the 1% level, indicating that green innovation is positively associated with firm value. Meanwhile, the coefficient of ESG decreases from 0.277 in Column 1 to 0.206in Column 3, and its significance level declines from 5% to 10%. This reduction suggests that green innovation partially mediates the relationship between ESG performance and firm value.
The results of the Sobel test further support the existence of an indirect effect, with a significant Z-value of 8.548. Taken together, these results support Hypothesis 2 and indicate that green innovation serves as an important channel through which ESG performance is linked to firm value.
4.4. Moderated Mediation Effect of Digital Transformation
Table 7 reports the moderated mediation results for digital transformation. Panel A presents the regression results, while Panel B reports the conditional indirect effects of ESG performance on firm value through green innovation at different levels of digital transformation.
Table 7.
Moderated mediation analysis of digital transformation.
Panel A shows that digital transformation strengthens the relationship between ESG performance and green innovation. In Column 4, the coefficient of the interaction term between ESG performance and digital transformation is 0.414 and statistically significant at the 1% level. This result indicates that firms with higher levels of digital transformation are more able to convert ESG performance into green innovation outputs. Therefore, Hypothesis 3 is supported. The coefficient of digital transformation is also positive and significant, suggesting that digital capability itself is associated with higher levels of green innovation. These findings are consistent with the argument that digital infrastructure can improve information processing, reduce coordination costs, and support the allocation of resources to green innovation activities.
Panel B further reports the conditional indirect effects of ESG performance on Tobin’s Q through green innovation. The indirect effect is positive and statistically significant at low, medium, and high levels of digital transformation. More importantly, the magnitude of the indirect effect increases from 0.024 at the low level of digital transformation to 0.061 at the medium level and 0.098 at the high level. This pattern suggests that digital transformation strengthens the value-creation mechanism through which ESG performance affects firm value via green innovation.
The index of moderated mediation is 0.073 and statistically significant at the 1% level. Its 95% confidence interval ranges from 0.042 to 0.105, excluding zero. This result provides further evidence that the indirect effect of ESG performance on firm value through green innovation becomes stronger when firms have higher levels of digital transformation. Therefore, Hypothesis 4 is supported.
4.5. Robustness Analysis
To examine the robustness of the baseline findings, two additional tests were conducted. First, return on assets (ROA) was used as an alternative dependent variable to test whether the results would remain consistent when firm performance was measured from an accounting-based perspective. Second, observations from 2020 to 2022 were excluded to reduce the potential influence of the COVID-19 period and related macroeconomic shocks. Table 8 reports the results based on the two-way fixed-effects specification.
Table 8.
Robustness tests.
Column (1) reports the results using ROA as the dependent variable for the full sample. The coefficient of ESG performance is 0.065 and statistically significant at the 1% level. This result indicates that ESG performance is positively associated with ROA, suggesting that the baseline finding is not solely driven by the use of Tobin’s Q as a market-based measure.
Column (2) reports the results after observations from 2020 to 2022 were excluded. The coefficient of ESG performance remains positive and statistically significant at the 1% level, with a value of 0.104. This result suggests that the positive relationship between ESG performance and firm value is not solely driven by abnormal conditions during the COVID-19 period. Overall, the robustness tests support the stability of the baseline conclusion across an alternative performance measure and a restricted sample period.
4.6. Endogeneity Tests
To alleviate potential endogeneity concerns, a two-stage least-squares (2SLS) instrumental variable approach was employed. Endogeneity may arise from reverse causality, as firms with higher market value may have more resources to invest in ESG activities. It may also arise from omitted time-varying firm characteristics that affect both ESG performance and firm value. Lagged ESG performance was used as an instrument for current ESG performance. Table 9 reports the 2SLS results.
Table 9.
Endogeneity test results.
Column (1) presents the first-stage regression results. The coefficient on lagged ESG is 0.597 and statistically significant at the 1% level, indicating a strong positive relationship between lagged ESG performance and current ESG performance. The first-stage F-statistic is 1598.272, which is well above the commonly used threshold of 10. This result suggests that the instrument satisfies the relevance condition and that weak-instrument concerns are unlikely.
Column (2) reports the second-stage results. The coefficient of the instrumented ESG variable is 0.0505 and statistically significant at the 5% level. This result indicates that ESG performance remains positively associated with Tobin’s Q after potential endogeneity is addressed using the instrumental variable approach. Overall, the 2SLS results provide further evidence that the positive effect of ESG performance on firm value is robust after accounting for potential endogeneity.
4.7. Heterogeneity Analysis
Although the baseline results show a positive average relationship between ESG performance and firm value, this effect may differ across firms with different characteristics. Differences in resource availability, ownership background, industry exposure, and regulatory pressure may influence both firms’ ability to implement ESG strategies and the extent to which capital markets value ESG performance. Larger firms may possess greater financial and organizational resources for ESG implementation, while ownership type may affect firms’ incentives and responses to sustainability policies. Similarly, firms operating in pollution-intensive industries face stronger environmental scrutiny and regulatory pressure. Therefore, we conducted heterogeneity analyses based on firm size, ownership type, and industry pollution intensity.
4.7.1. Firm Size
Firm size may influence the value effect of ESG performance because larger firms usually have more resources, stronger disclosure capacity, and higher market visibility. They may also have greater ability to absorb the costs of ESG investment and convert sustainability practices into market-recognized value. Table 10 reports the subsample regression results for small and large firms, classified according to the sample median of total assets.
Table 10.
Heterogeneity analysis by firm size.
The results show that the positive effect of ESG performance is stronger for large firms. For small firms, the coefficient on ESG performance is 0.292 and significant at the 10% level. For large firms, the coefficient increases to 0.925 and is significant at the 1% level. This finding suggests that large firms are more able to translate ESG performance into higher firm value. One possible explanation for this phenomenon is that large firms have more financial resources, more developed non-financial reporting systems, and greater visibility among institutional investors. These conditions may help them reduce the short-term costs of ESG engagement and improve the credibility of ESG signals.
The pillar-level results also show clear differences between small and large firms. The environmental dimension has a negative and significant coefficient for both groups, but the estimated negative coefficient is larger in absolute magnitude for small firms. The coefficient on environmental performance is −0.621 for small firms and −0.137 for large firms. This result suggests that environmental investment may impose heavier short-term cost pressure on smaller firms, which often have fewer resources and weaker economies of scale.
In contrast, the positive value effects of the social and governance dimensions were more pronounced among large firms. The coefficient on social performance is positive and significant for large firms, with a value of 0.541, but it is not significant for small firms. The governance dimension is positive in both groups, but the coefficient is larger and more significant for large firms, with a value of 0.793 compared with 0.244 for small firms. These findings suggest that firm size shapes how ESG dimensions are valued by the market. Large firms appear to benefit more from social and governance performance, while small firms may face stronger cost pressure from environmental engagement.
4.7.2. Ownership Type
Ownership type may influence how ESG performance is valued by the capital market. In China, state-owned and non-state-owned enterprises differ in terms of policy responsibilities, resource access, governance structures, and market constraints. State-owned enterprises often have closer links with government objectives and may receive stronger policy and resource support. Non-state-owned enterprises rely more heavily on market mechanisms, external investors, and governance transparency. Therefore, the value effect of ESG performance may differ across types of ownership.
Table 11 reports the heterogeneity results by ownership type. The composite ESG score is positively associated with firm value in both groups. The coefficient on ESG performance is 0.330 for non-state-owned enterprises and 0.409 for state-owned enterprises, and both are statistically significant at the 5% level. This result suggests that ESG performance is valued by the capital market in both ownership groups.
Table 11.
Heterogeneity analysis by ownership type.
The pillar-level results show further differences. The environmental dimension has a negative and significant coefficient in both groups. The coefficient is −0.471 for non-state-owned enterprises and −0.156 for state-owned enterprises. This result suggests that environmental engagement may create stronger short-term cost pressure for non-state-owned enterprises, which usually have fewer policy -related resources and a more limited capacity to absorb environmental compliance costs.
The social dimension is positively associated with firm value in both groups, but the effect is stronger among state-owned enterprises. The coefficient of social performance is 0.213 for non-state-owned enterprises and 0.354 for state-owned enterprises. This result may show that social responsibility activities are more closely aligned with the public and policy-oriented roles of state-owned enterprises, making social performance more visible and valuable in this group.
The governance dimension shows a clear difference between the two groups. For non-state-owned enterprises, the coefficient of governance performance is 0.788 and statistically significant at the 1% level. For state-owned enterprises, the coefficient is positive but not statistically significant. This finding suggests that governance quality is more strongly valued in non-state-owned enterprises. One possible explanation for this phenomenon is that non-state-owned enterprises depend more on governance transparency, internal control quality, and investor protection to reduce agency concerns and build investor confidence.
4.7.3. Industry Pollution Intensity
Industry pollution intensity may influence how ESG performance is valued by the capital market. Firms in heavily polluting industries usually face stronger environmental regulation, higher compliance pressure, greater environmental risks, and closer public scrutiny. Therefore, the value effect of ESG performance may differ between heavily polluting and non-heavily polluting industries. Following the 2012 revised Guidelines for the Industry Classification of Listed Companies issued by the China Securities Regulatory Commission and prior studies on China’s heavily polluting listed firms (Cai et al., 2021; N. Ying et al., 2022), this study identifies heavily polluting industries based on two-digit industry codes. These industries include mining, textile manufacturing, the paper product industry, petroleum processing, chemical manufacturing, the rubber and plastic industry, the non-metallic mineral product industry, metal smelting and rolling processing, and electricity and heat production and supply. Other industries are classified as non-heavily polluting industries.
Table 12 reports the heterogeneity results stratified by industry pollution intensity. The composite ESG score is positively associated with firm value in both groups. The coefficient is 0.225 for firms in non-heavily polluting industries and 0.364 for firms in heavily polluting industries, with both coefficients significant at the 10% level. This result suggests that ESG performance is valued by the capital market in both industry groups, although the association appears stronger among heavily polluting firms.
Table 12.
Heterogeneity analysis according to industry pollution intensity.
The pillar-level results show more differentiated patterns. The environmental dimension has a negative and significant coefficient for non-heavily polluting firms, with a value of −0.457. For heavily polluting firms, the coefficient is also negative but not statistically significant. This finding suggests that environmental investments are more likely to be perceived as short-term cost burdens in non-heavily polluting industries, whereas for heavily polluting firms, environmental investments may be regarded as necessary compliance activities and therefore receive a weaker market response.
The social dimension is positively associated with firm value in both groups. The coefficient is 0.231 for non-heavily polluting firms and 0.383 for heavily polluting firms, and both are statistically significant at the 1% level. The larger estimated coefficient for heavily polluting firms may reflect the greater importance of maintaining stakeholder trust and corporate legitimacy in industries subject to stricter environmental regulation and greater public scrutiny.
The governance dimension shows a positive and significant coefficient only for non-heavily polluting firms. The coefficient is 0.597 and statistically significant at the 1% level. For heavily polluting firms, the coefficient is close to zero and statistically insignificant. This finding suggests that governance quality is more strongly associated with firm value in non-heavily polluting industries, while social performance appears to play a more important role in heavily polluting industries.
5. Discussion
This study provides new evidence on how ESG performance contributes to firm value in China’s A-share market by examining the roles of green innovation and digital transformation. Rather than treating ESG as a homogeneous construct, the findings suggest that ESG value creation is a dynamic process that depends on firms’ ability to convert sustainability commitments into innovation outcomes and on the organizational conditions supporting this transformation.
A first important finding is that ESG performance is positively associated with firm value, although the contribution of individual ESG dimensions differs considerably. While social and governance performance enhance firm value, environmental performance exhibits a negative short-term association. This pattern helps explain the inconsistent conclusions reported in previous studies on the ESG–firm value relationship. Environmental initiatives often require substantial upfront investment in pollution control, cleaner production, environmental compliance, and green technologies, creating immediate financial pressure before economic returns are realized. This timing difference helps explain why environmental performance is negatively associated with firm value in the short term, while ESG contributes positively to firm value through green innovation over a longer horizon. By contrast, improvements in social responsibility and corporate governance can strengthen stakeholder relationships, enhance disclosure quality, reduce agency conflicts, and improve investor confidence, making their value effects more visible in the short term. These findings suggest that ESG should not be viewed as a single value-creating construct, as its individual dimensions differ in both their economic functions and their timing of value creation.
The analysis further shows that green innovation represents a key mechanism through which ESG performance generates firm value. Instead of creating value solely through improved reputation or sustainability disclosure, ESG engagement appears to become economically meaningful when it is translated into tangible green technologies and innovation outputs. This finding supports the natural resource-based view, which argues that environmentally oriented capabilities can become valuable strategic resources. Firms investing in ESG are more likely to accumulate environmental knowledge, green technologies, and innovation capabilities that improve resource efficiency and strengthen long-term competitiveness. The mediation results therefore indicate that the economic benefits of ESG depend not only on the level of ESG performance itself but also on firms’ ability to transform sustainability commitments into innovation-based capabilities that are recognized by capital markets.
Another important insight concerns the role of digital transformation. The findings suggest that digital transformation does not directly increase the value relevance of ESG but strengthens the process through which ESG promotes green innovation. Firms with stronger digital capabilities are better able to process environmental information, integrate knowledge across departments, and allocate innovation resources more efficiently, thereby improving the implementation of ESG-related innovation activities. Moreover, the moderated mediation results demonstrate that the indirect contribution of ESG performance to firm value through green innovation becomes stronger as firms’ digital maturity increases. Digital transformation therefore functions as an enabling organizational capability that enhances the effectiveness of ESG implementation rather than serving as an independent source of firm value.
The heterogeneity analysis further demonstrates that the value relevance of ESG depends on firm characteristics. Larger firms benefit more from ESG engagement because they generally possess stronger financial resources, more mature governance systems, and greater capacity to absorb the short-term costs associated with sustainability investment. Ownership structure also influences the value implications of ESG. Although ESG performance is positively associated with firm value in both state-owned and non-state-owned enterprises, social performance plays a more prominent role in state-owned enterprises, whereas governance performance contributes more strongly to firm value in non-state-owned enterprises. These differences reflect the distinct institutional objectives and governance environments associated with different ownership structures. Industry characteristics generate additional variation. Social performance is more strongly valued in heavily polluting industries, where firms face greater regulatory scrutiny and public attention, whereas governance performance is relatively more important in non-heavily polluting industries. Together, these findings indicate that ESG does not create uniform economic benefits across firms but operates within specific organizational and institutional contexts.
Overall, the findings suggest that ESG value creation should be understood as a capability-building process rather than as an automatic outcome of sustainability engagement. Stakeholder theory explains why firms respond to increasing sustainability expectations through ESG activities, the natural resource-based view clarifies how these activities generate value through green innovation, and the dynamic capabilities perspective explains why digital transformation strengthens this process. By integrating these mechanisms into a unified framework, this study provides a more comprehensive explanation of how, through what pathway, and under which conditions ESG performance contributes to firm value in an emerging market.
6. Conclusions and Implications
6.1. Conclusions
This study shows that ESG performance does not create firm value automatically. Instead, its value relevance depends on whether firms can transform sustainability commitments into innovation outcomes and whether they possess the organizational capabilities needed to support this process. Using panel data from Chinese A-share listed firms between 2009 and 2023, the findings indicate that ESG contributes to firm value not simply because firms disclose more sustainability information, but because ESG practices become economically meaningful when they are embedded in firms’ long-term strategic development.
Three findings emerge from the analysis. First, ESG performance is positively associated with firm value, but its individual dimensions do not contribute equally. Social and governance performance are positively related to firm value, whereas environmental performance shows a negative short-term association. This result suggests that environmental initiatives often require substantial upfront investment before financial benefits are realized, while the economic benefits generated through green innovation may emerge only over a longer period. In contrast, improvements in social responsibility and corporate governance are more readily recognized by investors and therefore tend to be reflected in firm value more quickly.
Second, the study demonstrates that green innovation provides an important pathway through which ESG performance is translated into firm value. Firms with stronger ESG performance are more likely to develop green technologies and innovation capabilities, which subsequently improve market valuation. This finding indicates that the economic benefits of ESG are more likely to arise from substantive innovation activities than from sustainability disclosure alone.
Third, digital transformation strengthens this value creation process. The findings emphasize the enabling role of digital transformation in helping firms convert ESG engagement into green innovation, thereby reinforcing the indirect association between ESG performance and firm value. The heterogeneity analysis further shows that these relationships vary across firm size, ownership structure, and industry pollution intensity, suggesting that the effectiveness of ESG depends on firms’ resource endowments and institutional environments rather than following a uniform pattern.
Taken together, the findings suggest that ESG should be viewed as a capability-building process instead of a stand-alone corporate practice. Firms create greater value when ESG, green innovation, and digital transformation are developed as complementary strategic capabilities rather than as separate initiatives.
6.2. Policy and Managerial Implications
The findings have implications for corporate managers, investors, policymakers, and ESG standard setters.
For corporate managers, ESG should be incorporated into long-term strategic planning rather than treated primarily as a compliance requirement or disclosure exercise. The results indicate that ESG creates value when it stimulates green innovation. Managers should therefore align ESG objectives with environmental R&D, green technology development, cleaner production, and innovation investment, while integrating digital technologies into these activities to improve resource coordination, information sharing, and innovation efficiency.
For investors, ESG ratings should not be interpreted in isolation. The findings suggest that firms with similar ESG scores may differ substantially in their ability to generate long-term value if they differ in green innovation capability or digital maturity. Investment decisions should therefore consider whether ESG engagement is supported by substantive innovation activities and organizational capabilities rather than relying solely on ESG ratings.
For policymakers, encouraging ESG disclosure alone is unlikely to maximize the economic benefits of sustainability initiatives. Regulatory efforts should place greater emphasis on improving firms’ innovation capacity by expanding green R&D incentives, facilitating access to green finance, supporting digital infrastructure, and promoting technology diffusion. Such measures can reduce the initial costs associated with environmental investment and strengthen firms’ ability to transform ESG commitments into productive innovation.
The heterogeneity results also suggest that ESG policies should reflect differences in firm characteristics. Smaller firms may require greater financial and technical support during environmental transformation, while non-state-owned enterprises may benefit from improved access to green finance and governance incentives. Firms operating in heavily polluting industries should be encouraged to combine environmental compliance with continuous technological upgrading rather than focusing solely on regulatory requirements. A differentiated policy approach is therefore more likely to improve both corporate competitiveness and sustainable development outcomes.
6.3. Limitations and Future Research
This study has several limitations. First, this study focuses on Chinese A-share listed firms. Although China provides an important setting for examining ESG value creation in an emerging economy, institutional differences may limit the generalizability of the findings. Comparative studies across different countries could provide further evidence on whether the proposed mechanism operates similarly under different regulatory and market environments.
Second, ESG performance is measured using the Huazheng ESG rating. Although this rating is widely adopted in research on Chinese listed firms, different ESG rating agencies apply different methodologies and weighting schemes. Future studies could examine whether the reported relationships remain robust when alternative domestic or international ESG ratings are employed.
Third, the analysis concentrates on green innovation and digital transformation as the primary mechanism and boundary condition. Other factors, such as financing constraints, corporate reputation, analyst attention, supply chain resilience, or internal governance quality, may also influence how ESG performance affects firm value. Examining multiple mechanisms within a unified analytical framework would provide a more comprehensive understanding of ESG value creation.
Finally, this study evaluates the economic consequences of ESG performance but does not distinguish between substantive ESG practices and symbolic ESG engagement. Firms with similar ESG ratings may differ considerably in the authenticity and strategic depth of their sustainability activities. Future research could combine textual analysis, event studies, or qualitative ESG indicators to distinguish genuine sustainability efforts from symbolic disclosure and to examine how these differences influence long-term firm value.
Author Contributions
Conceptualization, D.W.; methodology, D.W.; software, D.W.; validation, D.W., A.S.B.A., and N.A.B.B.; formal analysis, D.W.; investigation, D.W.; resources, D.W.; data curation, D.W.; writing—original draft preparation, D.W.; writing—review and editing, A.S.B.A. and N.A.B.B.; supervision, A.S.B.A. and N.A.B.B.; project administration, A.S.B.A. All authors have read and agreed to the published version of the manuscript.
Funding
This research was funded by the Doctoral Research Start-up Fund of Panzhihua University for the project “Research on the Integrated Optimization of ESG Information Disclosure and Its Economic Consequences among Chinese Listed Companies under the New Development Philosophy, grant number 035200377.
Institutional Review Board Statement
Not applicable.
Informed Consent Statement
Not applicable.
Data Availability Statement
Restrictions apply to the availability of the data used in this study. The data were obtained from the Wind database, the China Stock Market and Accounting Research Database (CSMAR), the Huazheng ESG database, and the China National Intellectual Property Administration. Some of these data are provided by third-party or commercial databases, including Wind and CSMAR, and are available from the corresponding data providers subject to their licensing requirements. The replication codes and processed data that do not violate data-provider restrictions are available from the corresponding author upon reasonable request.
Acknowledgments
During the preparation of this manuscript, the authors used OpenAI’s ChatGPT-4o for language editing and proofreading. The authors reviewed and edited the output and take full responsibility for the content of this publication. No individuals are acknowledged in this section.
Conflicts of Interest
The authors declare no conflicts of interest. The funder had no role in the design of the study; in the collection, analysis, or interpretation of data; the writing of the manuscript; or the decision to publish the results.
Abbreviations
The following abbreviations are used in this manuscript:
| Abbreviation | Full name |
| ESG | Environmental, social, and governance |
| GI | Green innovation |
| DCG | Digital transformation |
| ROA | Return on assets |
| SOE | State-owned enterprise |
| VIF | Variance inflation factor |
| 2SLS | Two-stage least squares |
| CSMAR | China Stock Market and Accounting Research Database |
| CNIPA | China National Intellectual Property Administration |
References
- Aluchna, M., Roszkowska-Menkes, M., Kaminski, B., & Bosek-Rak, D. (2022). Do institutional investors encourage firm to social disclosure? The stakeholder salience perspective. Journal of Business Research, 142, 674–682. [Google Scholar] [CrossRef] [Scilit]
- Aouadi, A., & Marsat, S. (2018). Do ESG controversies matter for firm value? Evidence from international data. Journal of Business Ethics, 151(4), 1027–1047. [Google Scholar] [CrossRef] [Scilit]
- Atz, U., Van Holt, T., Liu, Z. Z., & Bruno, C. C. (2023). Does sustainability generate better financial performance? Review, meta-analysis, and propositions. Journal of Sustainable Finance & Investment, 13(1), 802–825. [Google Scholar] [CrossRef] [Scilit]
- Baron, R. M., & Kenny, D. A. (1986). The moderator–mediator variable distinction in social psychological research: Conceptual, strategic, and statistical considerations. Journal of Personality and Social Psychology, 51(6), 1173–1182. [Google Scholar] [CrossRef] [PubMed]
- Bataineh, M. J., Sánchez-Sellero, P., & Ayad, F. (2024). Green is the new black: How research and development and green innovation provide businesses a competitive edge. Business Strategy and the Environment, 33(2), 1004–1023. [Google Scholar] [CrossRef] [Scilit]
- Behl, A., Kumari, P. S. R., Makhija, H., & Sharma, D. (2022). Exploring the relationship of ESG score and firm value using cross-lagged panel analyses: Case of the Indian energy sector. Annals of Operations Research, 313(1), 231–256. [Google Scholar] [CrossRef] [Scilit]
- Berrone, P., Fosfuri, A., Gelabert, L., & Gomez-Mejia, L. R. (2013). Necessity as the mother of ‘green’ inventions: Institutional pressures and environmental innovations. Strategic Management Journal, 34(8), 891–909. [Google Scholar] [CrossRef] [Scilit]
- Bhagat, S., & Bolton, B. (2019). Corporate governance and firm performance: The sequel. Journal of Corporate Finance, 58, 142–168. [Google Scholar] [CrossRef] [Scilit]
- Binh, N. T. T., & Lee, H.-C. (2024). Unveiling the impacts of corporate environmental, social, and governance disclosure. Sustainability, 16(6), 2459. [Google Scholar] [CrossRef] [Scilit]
- Buallay, A. M. (2019). Between cost and value investigating the effects of sustainability reporting on a firm’s performance. Journal of Applied Accounting Research, 20(4), 481–496. [Google Scholar] [CrossRef] [Scilit]
- Buallay, A. M., Abu Wadi, R. M., Kukreja, G., & Hassan, A. A. (2020). Evaluating ESG disclosures of Islamic banks: Evidence from the organization of Islamic cooperation members. International Journal of Innovation and Sustainable Development, 14(3), 266–287. [Google Scholar] [CrossRef] [Scilit]
- Cai, R., Lv, T., & Deng, X. (2021). Evaluation of environmental information disclosure of listed companies in China’s heavy pollution industries: A text mining-based methodology. Sustainability, 13(10), 5415. [Google Scholar] [CrossRef] [Scilit]
- Cheng, R., Kim, H., & Ryu, D. (2024). ESG performance and firm value in the Chinese market. Investment Analysts Journal, 53(1), 1–15. [Google Scholar] [CrossRef] [Scilit]
- Dhaliwal, D. S., Radhakrishnan, S., Tsang, A., & Yang, Y. G. (2012). Nonfinancial disclosure and analyst forecast accuracy: International evidence on corporate social responsibility disclosure. The Accounting Review, 87(3), 723–759. [Google Scholar] [CrossRef] [Scilit]
- Drempetic, S., Klein, C., & Zwergel, B. (2020). The influence of firm size on the ESG score: Corporate sustainability ratings under review. Journal of Business Ethics, 167(2), 333–360. [Google Scholar] [CrossRef] [Scilit]
- Duque-Grisales, E., & Aguilera-Caracuel, J. (2021). Environmental, Social and Governance (ESG) scores and financial performance of multilatinas: Moderating effects of geographic international diversification and financial slack. Journal of Business Ethics, 168(2), 315–334. [Google Scholar] [CrossRef] [Scilit]
- Eccles, R. G., Ioannou, I., & Serafeim, G. (2014). The impact of corporate sustainability on organizational processes and performance. Management Science, 60(11), 2835–2857. [Google Scholar] [CrossRef] [Scilit]
- El-Kassar, A.-N., & Singh, S. K. (2019). Green innovation and organizational performance: The influence of big data and the moderating role of management commitment and HR practices. Technological Forecasting and Social Change, 144, 483–498. [Google Scholar] [CrossRef] [Scilit]
- Engelhardt, N., Ekkenga, J., & Posch, P. (2021). ESG ratings and stock performance during the COVID-19 crisis. Sustainability, 13(13), 7133. [Google Scholar] [CrossRef] [Scilit]
- Freeman, R. E. (1984). Strategic management: A stakeholder approach. Pitman. [Google Scholar]
- Friede, G., Busch, T., & Bassen, A. (2015). ESG and financial performance: Aggregated evidence from more than 2000 empirical studies. Journal of Sustainable Finance & Investment, 5(4), 210–233. [Google Scholar] [CrossRef] [Scilit]
- Gjergji, R., Vena, L., Sciascia, S., & Cortesi, A. (2021). The effects of environmental, social and governance disclosure on the cost of capital in small and medium enterprises: The role of family business status. Business Strategy and the Environment, 30(1), 683–693. [Google Scholar] [CrossRef] [Scilit]
- Gong, Q., Gu, J., Kong, Z., Shen, S., Dong, X., Li, Y., & Li, C. (2025). The impact of ESG ratings on corporate sustainability: Evidence from Chinese listed firms. Sustainability, 17(13), 5942. [Google Scholar] [CrossRef] [Scilit]
- Hart, S. L. (1995). A natural-resource-based view of the firm. Academy of Management Review, 20(4), 986–1014. [Google Scholar] [CrossRef] [Scilit]
- Hayes, A. F. (2015). An index and test of linear moderated mediation. Multivariate Behavioral Research, 50(1), 1–22. [Google Scholar] [CrossRef] [Scilit] [PubMed]
- Huang, C. (2025). Digital transformation and corporate ESG performance: Research based on a capability-motivation dual framework. PLoS ONE, 20(6), e0325295. [Google Scholar] [CrossRef] [Scilit] [PubMed]
- Jiang, L., Li, B., & Zhang, M. (2025). The impact of digital transformation on the efficiency of corporate resource allocation: Internal mechanisms and external environment. Technological Forecasting and Social Change, 215, 124107. [Google Scholar] [CrossRef] [Scilit]
- Khan, M., Serafeim, G., & Yoon, A. (2016). Corporate sustainability: First evidence on materiality. The Accounting Review, 91(6), 1697–1724. [Google Scholar] [CrossRef] [Scilit]
- Li, D., & Shu, B. (2025). Impacts of digital transformation on the quantity and quality of corporate green innovation: Evidence from China. Sustainability, 17(20), 9341. [Google Scholar] [CrossRef] [Scilit]
- Li, H., Liu, Z., & Hachard, V. (2024). Digital transformation driving green innovation: Evidence from Chinese A-Share firms. International Review of Economics & Finance, 95, 103487. [Google Scholar] [CrossRef] [Scilit]
- Li, X., Saat, M. M., Khatib, S. F. A., & Liu, Y. (2024). Sustainable development and firm value: How ESG performance shapes corporate success—A systematic literature review. Business Strategy & Development, 7(4), e70026. [Google Scholar] [CrossRef] [Scilit]
- Li, Y., Zheng, Y., Li, X., & Mu, Z. (2024). The impact of digital transformation on ESG performance. International Review of Economics & Finance, 96, 103686. [Google Scholar] [CrossRef] [Scilit]
- Lindenberg, E. B., & Ross, S. A. (1981). Tobin’s q ratio and industrial organization. The Journal of Business, 54(1), 1–32. [Google Scholar] [CrossRef] [Scilit]
- Luo, X., & Du, S. (2015). Exploring the relationship between corporate social responsibility and firm innovation. Marketing Letters, 26(4), 703–714. [Google Scholar] [CrossRef] [Scilit]
- Ma, S., & Ma, T. (2025). ESG controversies and firm value: Evidence from A-Share companies in China. Sustainability, 17(6), 2750. [Google Scholar] [CrossRef] [Scilit]
- Marquis, C., & Qian, C. (2014). Corporate social responsibility reporting in China: Symbol or substance? Organization Science, 25(1), 127–148. [Google Scholar] [CrossRef] [Scilit]
- Perfect, S. B., & Wiles, K. W. (1994). Alternative constructions of Tobin’s q: An empirical comparison. Journal of Empirical Finance, 1(3), 313–341. [Google Scholar] [CrossRef] [Scilit]
- Porter, M. E., & van der Linde, C. (1995). Toward a new conception of the environment-competitiveness relationship. Journal of Economic Perspectives, 9(4), 97–118. [Google Scholar] [CrossRef] [Scilit]
- Sirmon, D. G., Hitt, M. A., Ireland, R. D., & Gilbert, B. A. (2011). Resource orchestration to create competitive advantage: Breadth, depth, and life cycle effects. Journal of Management, 37(5), 1390–1412. [Google Scholar] [CrossRef] [Scilit]
- Suchman, M. C. (1995). Managing legitimacy: Strategic and institutional approaches. Academy of Management Review, 20(3), 571–610. [Google Scholar] [CrossRef] [Scilit]
- Sun, Y. (2024). Digital transformation and corporates’ green technology innovation performance—The mediating role of knowledge sharing. Finance Research Letters, 62, 105105. [Google Scholar] [CrossRef] [Scilit]
- Tan, W., Cai, Y., Luo, H., Zhou, M., & Shen, M. (2024). ESG, technological innovation and firm value: Evidence from China. International Review of Financial Analysis, 96, 103546. [Google Scholar] [CrossRef] [Scilit]
- Tan, Y., & Zhu, Z. (2022). The effect of ESG rating events on corporate green innovation in China: The mediating role of financial constraints and managers’ environmental awareness. Technology in Society, 68, 101906. [Google Scholar] [CrossRef] [Scilit]
- Velte, P. (2017). Does ESG performance have an impact on financial performance? Evidence from Germany. Journal of Global Responsibility, 8(2), 169–178. [Google Scholar] [CrossRef] [Scilit]
- Wang, X., & Zhong, X. (2024). Digital transformation and green innovation: Firm-level evidence from China. Frontiers in Environmental Science, 12, 1389255. [Google Scholar] [CrossRef] [Scilit]
- Wedajo, A. D., Salah, A. A., Bhat, M. A., Iqbal, R., & Khan, S. T. (2024). Analyzing the dynamic relationship between ESG scores and firm value in Chinese listed companies: Insights from generalized cross-lagged panel model. Discover Sustainability, 5, 336. [Google Scholar] [CrossRef] [Scilit]
- Wu, F., Hu, H., Lin, H., & Ren, X. (2021). Corporate digital transformation and capital market performance-empirical evidence from stock liquidity. Management World, 37(7), 130–144. [Google Scholar]
- Wu, L., Sun, H., & Chen, L. (2025). The impact of ESG information disclosure on corporate environmental performance: Evidence from China’s Shanghai and Shenzhen A-Share listed companies. Sustainability, 17(23), 10583. [Google Scholar] [CrossRef] [Scilit]
- Xu, C., Sun, G., & Kong, T. (2024). The impact of digital transformation on enterprise green innovation. International Review of Economics & Finance, 90, 1–12. [Google Scholar] [CrossRef] [Scilit]
- Yang, S., Tai, Y., & Liu, J. (2024). Mechanism analysis and path study of digital transformation on corporate governance: Evidence from Chinese listed companies. Sustainability, 16(21), 9245. [Google Scholar] [CrossRef] [Scilit]
- Ying, N., Yao, L., Jihong, X., & Daqing, W. (2022). Environmental regulation and corporate innovation behavior based on the “double carbon” strategy—Empirical analysis based on A-Share listed companies of heavy pollution industries on the Shanghai and Shenzhen stock exchanges. Frontiers in Ecology and Evolution, 10, 935621. [Google Scholar] [CrossRef] [Scilit]
- Ying, Y., & Jin, S. (2023). Digital transformation and corporate sustainability: The moderating effect of ambidextrous innovation. Systems, 11(7), 344. [Google Scholar] [CrossRef] [Scilit]
- Yu, E. P., & Luu, B. V. (2021). International variations in ESG disclosure—Do cross-listed companies care more? International Review of Financial Analysis, 75, 101731. [Google Scholar] [CrossRef] [Scilit]
- Zhang, F., Qin, X., & Liu, L. (2020). The interaction effect between ESG and green innovation and its impact on firm value from the perspective of information disclosure. Sustainability, 12(5), 1866. [Google Scholar] [CrossRef] [Scilit]
- Zhang, J., & Liu, Z. (2023). Study on the impact of corporate ESG performance on green innovation performance—Evidence from listed companies in China A-Shares. Sustainability, 15(20), 14750. [Google Scholar] [CrossRef] [Scilit]
- Zheng, M., Feng, G.-F., Jiang, R.-A., & Chang, C.-P. (2023). Does environmental, social, and governance performance move together with corporate green innovation in China? Business Strategy and the Environment, 32(4), 1670–1679. [Google Scholar] [CrossRef] [Scilit]
- Zhuo, R., Zhang, Y., Zheng, J., & Xie, H. (2024). Digitalization transformation and enterprise green innovation: Empirical evidence from Chinese listed companies. Frontiers in Environmental Science, 12, 1361576. [Google Scholar] [CrossRef] [Scilit]
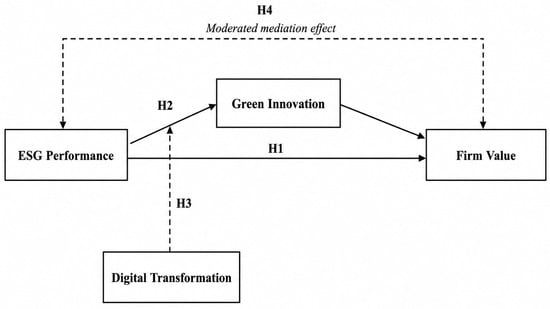
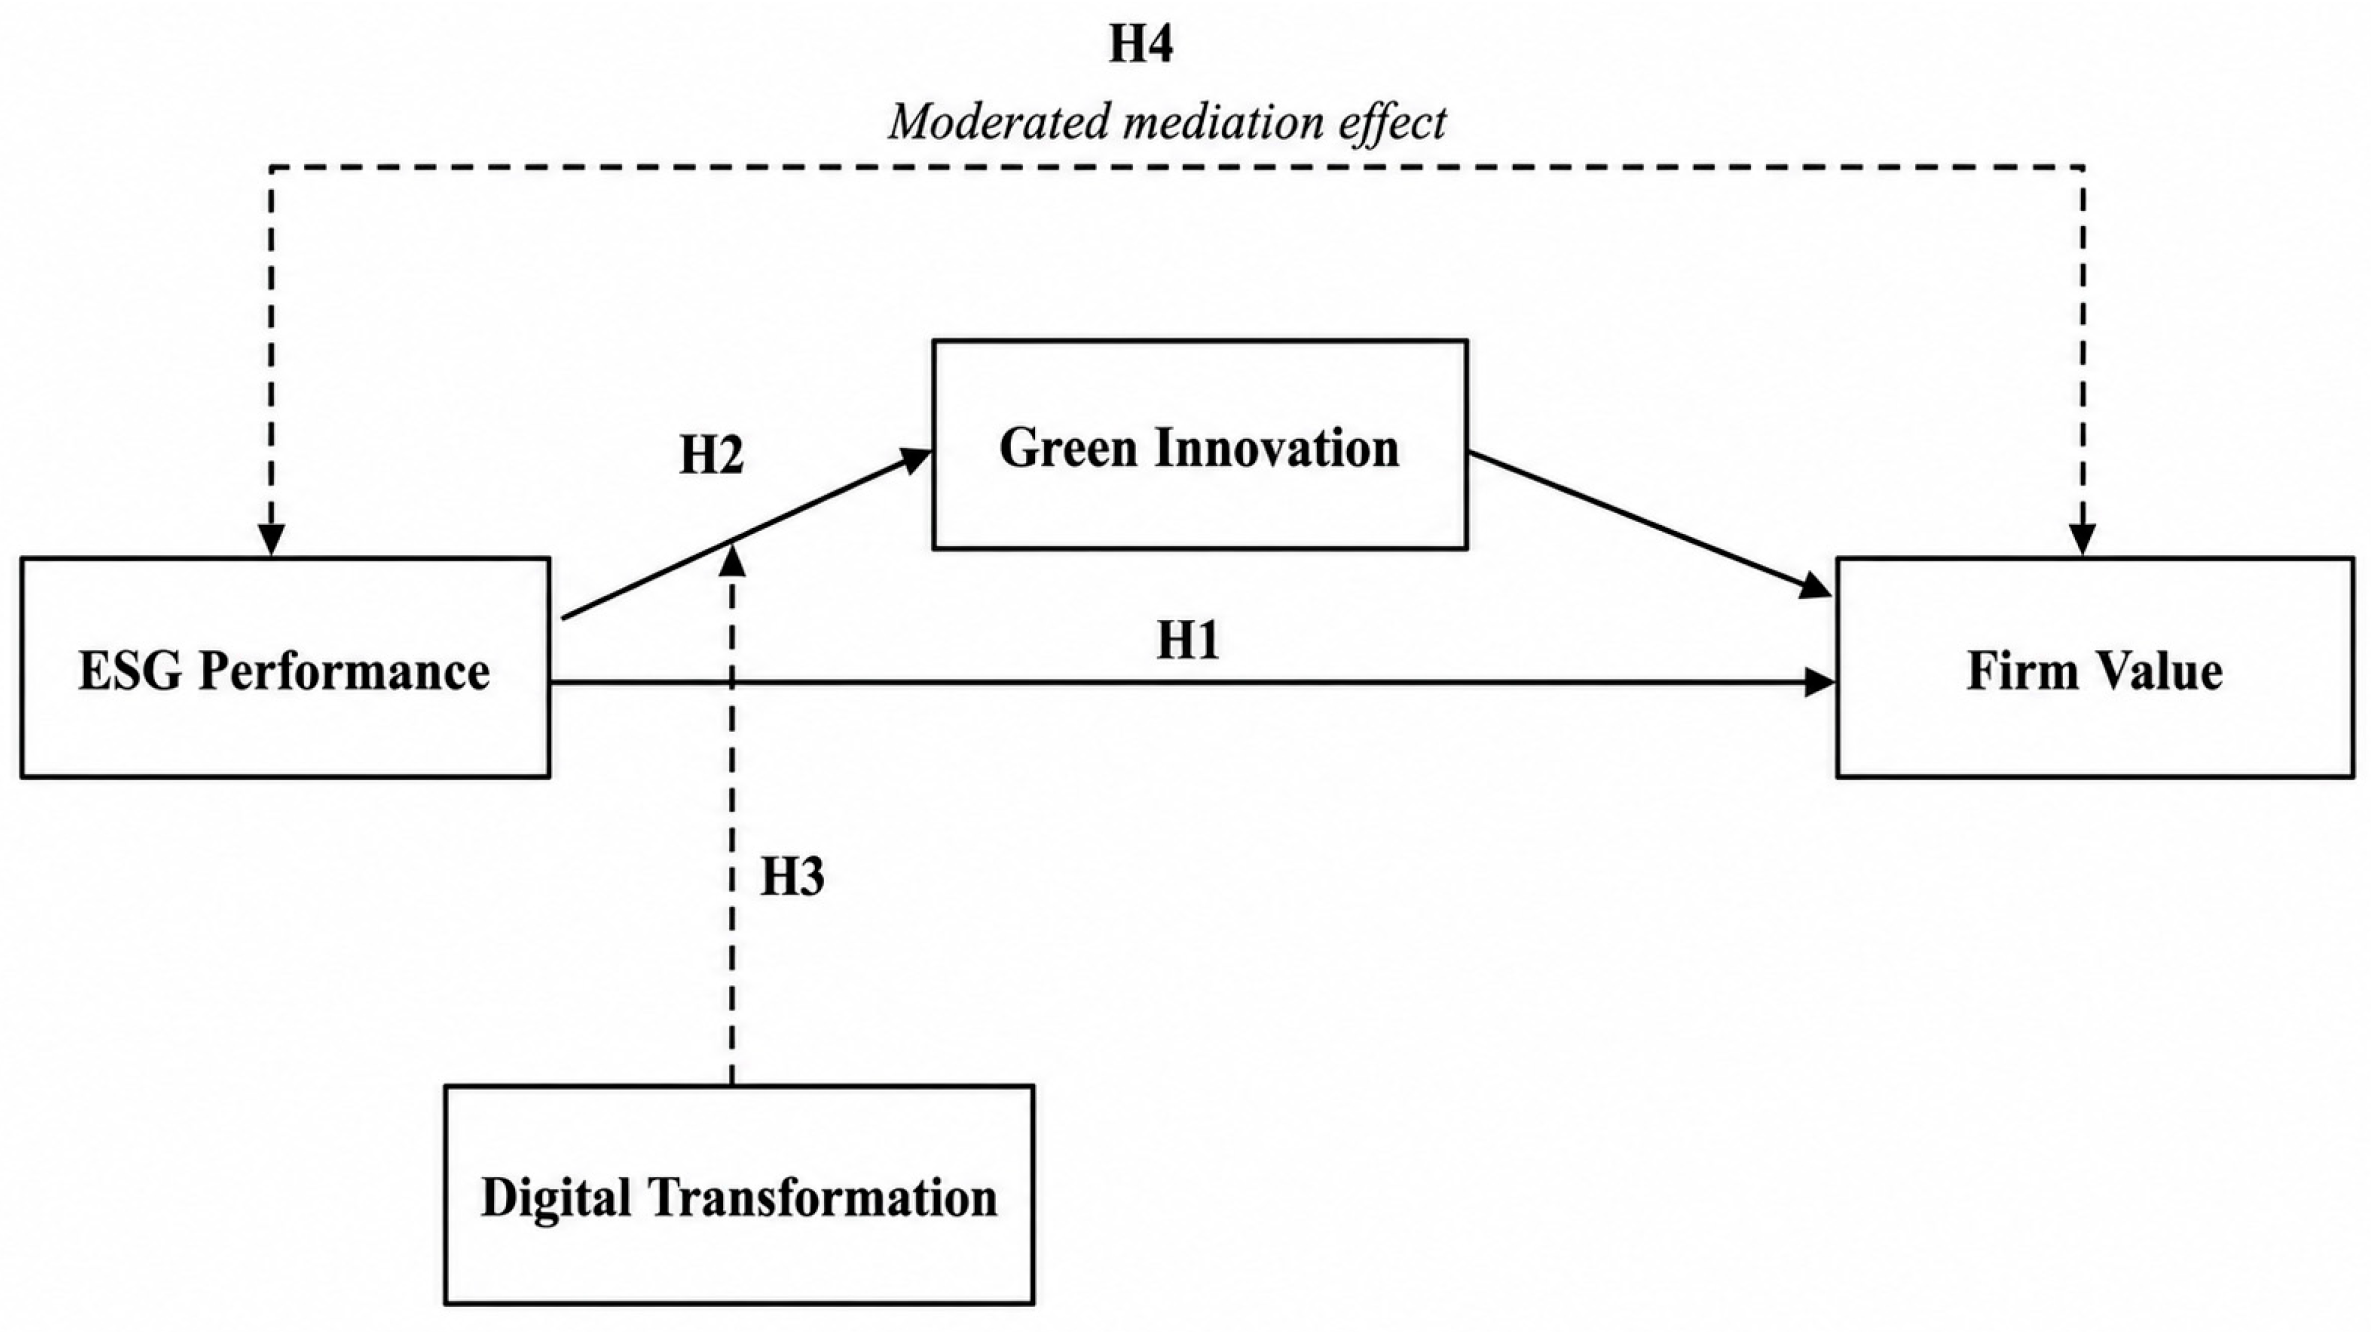

Disclaimer/Publisher’s Note: The statements, opinions and data contained in all publications are solely those of the individual author(s) and contributor(s) and not of MDPI and/or the editor(s). MDPI and/or the editor(s) disclaim responsibility for any injury to people or property resulting from any ideas, methods, instructions or products referred to in the content. |
© 2026 by the authors. Licensee MDPI, Basel, Switzerland. This article is an open access article distributed under the terms and conditions of the Creative Commons Attribution (CC BY) license.