Article

Do Recognized Intangible Assets Inform Bank Performance? Macro Digital Infrastructure as a Cross-Layer Condition in Indonesian Banking

by
Yan Noviar Nasution
1,* and
Donny Maha Putra
2
1
Faculty of Economics and Business, Universitas Pakuan, Bogor 16129, Indonesia
2
Faculty of Economics and Business, Universitas Pembangunan Nasional Veteran Jakarta, Jakarta 12450, Indonesia
*
Author to whom correspondence should be addressed.
J. Risk Financ. Manag. 2026, 19(7), 536; https://doi.org/10.3390/jrfm19070536
Submission received: 22 May 2026 / Revised: 25 June 2026 / Accepted: 15 July 2026 / Published: 18 July 2026
(This article belongs to the Section Banking and Finance)

Abstract

This study examines whether recognized intangible assets carry information about bank performance in an emerging market, and whether their information value is conditioned by the maturity of macro digital infrastructure. Using a balanced panel of 28 Indonesian commercial banks over 2015–2024 (280 firm-year observations), we estimate two-way fixed-effects models with macro digital infrastructure, an economy-wide principal component index of internet penetration, mobile and broadband subscriptions, and electronic payment volume as a cross-layer moderator. Intangible investment intensity, proxied by the ratio of reported intangible assets to total assets, shows weak direct associations with performance; only the operating efficiency ratio displays a marginally significant short-run cost, consistent with transition-cost dynamics. The central result is conditional: the interaction between intangible intensity and macro digital maturity is strongly significant for operating efficiency (β = −2.587, p = 0.005), with the implied efficiency cost contracting by a model-implied 88 percent across the observed range of digital maturity (an estimate computed from the estimated coefficients over the observed sample variation, not a structural causal magnitude). Heterogeneity is pronounced across regulator-defined bank tiers (KBMI): the four largest banks realize positive profitability effects, whereas mid-tier banks bear transition costs. Results are robust to Driscoll–Kraay standard errors, system GMM, sub-sample splits, and outlier exclusion. The findings show that the information value of recognized intangibles in banking is state-contingent, extending the intangible-asset and digitalization literature to emerging-market banking.

1. Introduction

Whether the intangible assets that banks recognize on their balance sheets carry information about future economic performance is a question of enduring interest to accounting and finance scholars alike. It connects directly to one of the most durable puzzles in the productivity literature: whether large investments in information technology actually translate into measurable performance gains. Brynjolfsson’s (1993) original framing of the paradox, that the computer age was visible everywhere except in the productivity statistics, has been revisited, setting after setting, and the banking industry has not escaped similar uncomfortable findings. In Indonesia, the question carries unusual practical weight. Over the past decade, listed commercial banks have committed substantial resources to digital transformation: Bank Indonesia (2025) introduced the Indonesia Payment System Blueprint (BSPI) 2025 to expand real-time payments and open application programming interfaces; the Financial Services Authority (OJK) issued OJK Regulation 12/2021, which restructured the industry into four bank tiers based on core capital (KBMI) and elevated digital strategy to a component of capital planning; and a new generation of digital banks such as Jago, Allo, and Sea Bank has begun pulling market share away from incumbents (Buchak et al., 2018; Cevik, 2024). Larger and mid-tier banks have responded with sizable outlays on core banking platforms and analytics, most of which appear on the balance sheet as recognized intangible assets. The question is whether these reported investments are informative about performance.
The available evidence pulls in different directions. Beccalli (2007), drawing on a panel of 737 European banks, found only a weak link between total IT investment and profitability, suggesting that the productivity paradox extends into financial intermediation. Emerging-market evidence is similarly unsettled. Zelalem and Abebe (2022) report a positive effect of intangible assets on return on assets for Ethiopian banks, while Boadi et al. (2022) in Ghana and Yuan et al. (2022) on South Asian banks document considerably more heterogeneous patterns. Recent work in management control and accounting information systems pushes the same point from a different angle: returns to digital investment appear to be conditional rather than automatic (Faehndrich, 2023; Knudsen, 2020; Quattrone, 2016). The more useful question, then, is not whether banks should invest, but under what conditions the recognized investment becomes informative about observable performance.
Two streams of the literature have approached this question without quite resolving it. The systematic review by Faehndrich (2023) maps how digitalization reshapes management control practices, activities, and competencies, but the synthesis is review-based, draws disproportionately on European and North American settings, and stops short of testing the conditional mechanisms it identifies empirically (Bhimani, 2020; Möller et al., 2020). The banking digitalization literature, in turn, tends to specify digital investment as a direct predictor of bank performance (Berger, 2003; Casolaro & Gobbi, 2007; Khan et al., 2023), giving limited attention to the maturity of the macro digital infrastructure within which banks actually operate. To our knowledge, no prior archival study has tested the interaction between bank-level intangible investment and macro-level digital conditions in an emerging Southeast Asian market.
This study addresses that gap. We pose two research questions. RQ1: Are recognized intangible assets informative about the measurable performance of Indonesian commercial banks? RQ2: Is any such information value conditional on the maturity of macro digital infrastructure and on a bank’s KBMI tier? We ask whether the intensity of recognized intangible investment, proxied by the ratio of intangible assets to total assets (Egorov, 2023; Zelalem & Abebe, 2022), is informative about measurable bank performance, and whether the strength of that relationship depends on the maturity of Indonesia’s macro digital infrastructure and on a bank’s position within the KBMI tier structure. The empirical strategy uses a balanced panel of 28 Indonesian commercial banks listed on the Indonesia Stock Exchange from 2015 to 2024 (280 firm-year observations), estimated with two-way fixed-effects regressions supported by Driscoll–Kraay standard errors (Driscoll & Kraay, 1998), with robustness from system generalized method of moments (GMM) following Arellano and Bover (1995) and Blundell and Bond (1998).
Three findings emerge. First, the direct association between recognized intangible investment and bank performance is muted; only the efficiency ratio displays a marginally significant coefficient, consistent with the transition-cost dynamics first described by Brynjolfsson and Hitt (2000). Second, and central to our argument, the information value of recognized intangibles is conditional on the maturity of macro digital infrastructure: the interaction term is strongly significant for the efficiency ratio (β3 = −2.587, p = 0.005) and marginal for return on assets (β3 = +0.308, p = 0.075), with the implied efficiency cost contracting by a model-implied 88 percent across the observed range of digital maturity. Third, substantial heterogeneity emerges across KBMI tiers. The largest banks (KBMI 4) realize a positive return-on-assets effect (β = +3.951), whereas mid-tier KBMI 2 banks continue to bear transition costs (β = −1.664).
The study contributes to the accounting and finance literature on intangibles and bank performance in emerging economies in four ways. First, to our knowledge, it offers one of the earliest archival empirical tests of cross-layer conditioning of digital investment in a developing-country banking sample, complementing the review-based synthesis of Faehndrich (2023) with firm-year evidence. Second, it extends the value-relevance literature on recognized intangibles (Aboody & Lev, 1998; Barth et al., 2001; Lev & Sougiannis, 1996) by showing that the information value of reported bank intangibles is not unconditional but depends materially on the macro context in which the bank operates. In keeping with that literature, this study assesses the information value of recognized intangibles through their association with realized accounting performance rather than equity prices; the complementary market-based form of value relevance, namely the association of recognized intangibles with market value, is identified as a direct avenue for future work (Section 6.4). Third, it draws evidence from Indonesian banking during a period of rapid, simultaneous regulatory and infrastructural transition, exploiting the regulator-defined KBMI stratification to surface meaningful within-country heterogeneity. Fourth, it advances measurement practice by combining Bloomberg-sourced financial data with a principal component composite of macro digital infrastructure indicators sourced from the Indonesian Internet Service Providers Association (APJII), the International Telecommunication Union (ITU), and Bank Indonesia. The remainder of the paper proceeds as follows. Section 2 develops the hypotheses; Section 3 describes the data and methodology; Section 4 reports the main results; Section 5 presents robustness tests; Section 6 discusses implications; and Section 7 concludes.

2. Literature Review and Hypothesis Development

2.1. The Productivity Paradox Revisited

Brynjolfsson (1993) named the puzzle. Large investments in information technology fail to register in productivity statistics. Brynjolfsson and Hitt (2000) later argued that the explanation is complementarity. The productivity paradox literature supplies the theoretical base for this study. Brynjolfsson (1993) documented that measured productivity gains from information technology lagged the investment that produced them, and Brynjolfsson and Hitt (2000) attributed the lag to transition costs and to the complementary organizational and infrastructural investments that technology requires before it pays off. Transposed to the present setting, this logic implies that recognized intangible investment in banking should impose short-run transition costs and should convert into measurable performance only once the complementary macro digital infrastructure is sufficiently mature. This complementarity mechanism, operating across the firm and macro layers, is the cross-layer condition the study formalizes and tests. Returns appear only when technology investment is matched by reorganization of work, accumulation of organizational capital, and upgrading of human skills. Without those complements, IT spending generates short-run disruption rather than long-run gains.
The argument carries directly into banking. Beccalli (2007), analyzing 737 European banks, found a weak link between total IT investment and profitability. Berger (2003) in the United States and Casolaro and Gobbi (2007) in Italy reported similarly selective gains. Ho and Mallick (2010), drawing on data from 68 US banks from 1986 to 2005, showed that technology adoption can even depress individual banks’ profits once industry-wide adoption intensifies competition. The pattern is consistent. Bank-level returns to IT are conditional, not automatic.

2.2. Recognized Intangibles, Their Value Relevance, and Bank Performance in Emerging Markets

Evidence from emerging markets remains thin but is growing. Zelalem and Abebe (2022), studying 17 Ethiopian commercial banks from 2017 to 2020, found a positive effect of intangible assets on both return on assets and return on equity. They argue that intangible assets are a defensible proxy for innovation in banking, since most bank-sector innovation is itself intangible: software, licenses, human capital, and brand value. Egorov (2023) reached a similar conclusion for systemically important Russian banks. Boadi et al. (2022), in contrast, documented support for the productivity paradox in 23 Ghanaian banks. Yuan et al. (2022), pooling banks across five South Asian economies, concluded that profitability determinants vary substantially across countries.
This question connects to the long-standing accounting literature on the value relevance of recognized intangibles, that is, whether the intangible amounts firms recognize under accounting standards reliably proxy for future economic benefits. Aboody and Lev (1998) show that capitalized software development costs are positively associated with future earnings and stock returns; Lev and Sougiannis (1996) document the value relevance of capitalized research and development; and Barth et al. (2001) synthesize evidence that recognized accounting amounts are value relevant precisely when they reliably capture future economic benefits. Because almost all banking innovation is intangible—software platforms, technology licenses, intellectual property, and goodwill from technology acquisitions account for the bulk of reported bank intangibles—the recognized intangibles ratio is a defensible, if imperfect, window into a bank’s digital investment (Egorov, 2023; Zelalem & Abebe, 2022). Whether recognized bank intangibles satisfy the value-relevance condition, and under what macro conditions they do so, is the question this study examines.
The pattern in the prior evidence is unambiguous. Returns to intangible investment in banking are heterogeneous, and institutional context matters more than aggregate technology spending. Indonesian banking offers a useful setting to test these ideas. OJK Regulation 12/2021 reorganized commercial banks into four KBMI tiers based on core capital and explicitly linked digital strategy to capital planning, particularly for mid-tier banks (OJK, 2021). A new generation of digital banks, such as Jago, Allo, Sea Bank, and Aladin, captured retail and SME market share from incumbents (Buchak et al., 2018; Cevik, 2024). Large and mid-tier conventional banks responded with substantial outlays on core banking platforms and analytics. Whether those recognized outlays are informative about performance, and under what conditions, is an open question. As an alternative measure used later for robustness, AIS_Log is defined as the natural log of intangible assets, accommodating the substantial share of bank-years that report zero intangibles.

2.3. Transition Costs and Hypothesis 1

The logic of transition costs is direct. Technology investment disrupts existing work processes, demands employee retraining, and forces system integration before efficiency gains are realized (Brynjolfsson & Hitt, 2000). Casolaro and Gobbi (2007) documented a three- to five-year learning curve following IT adoption in Italian banks. Similar patterns appear in Chinese banks (Zhang, 2026), Vietnamese banks (Nguyen-Thi-Huong et al., 2023), and Pakistani banks (Liu et al., 2024). The magnitude varies with the complexity of legacy infrastructure and absorptive capacity.
The same logic applies in management accounting. Korhonen et al. (2021), through an interventionist case study, showed that automation does not immediately yield efficiency. The early phase requires substantial investment in process redesign and data reconciliation. Granlund (2011) and Knudsen (2020) generalized this argument to accounting information systems. Integration brings hidden costs at knowledge boundaries, organizational power structures, and information production routines.
For Indonesian banks, transition costs are likely higher for mid-tier institutions with extensive legacy systems but limited absorptive capacity than for the largest banks. Within a ten-year panel, the short-run drag on operating efficiency should be observable across the sample, even before macro-level moderation is accounted for. This yields a directional prediction.
H1. 
Bank-level intangible investment intensity is negatively associated with operating efficiency in the short run, reflecting transition costs that arise before efficiency gains are realized.

2.4. Macro Digital Infrastructure as Cross-Layer Complement and Hypothesis 2

Returns to bank-level investment do not depend on bank-level factors alone. They depend on the macro conditions within which the bank operates. The argument follows complementarity theory (Milgrom & Roberts, 1995; Brynjolfsson & Hitt, 2000). Returns at one layer of a system depend on the maturity of complements at other layers. A bank that invests in mobile banking captures full economic returns only when its customers have reliable internet access, smartphone ownership, and established digital transaction habits, conditions set by national digital infrastructure rather than by the bank itself.
The macro complementarity argument finds support in the ICT-and-growth literature. Pradhan et al. (2018), using G-20 and lower-middle-income country panels, found that ICT infrastructure, internet penetration, mobile subscriptions, and fixed broadband are consistently associated with economic growth through financial development channels. Mohammad et al. (2024) report complementary evidence from South Asian economies, where financial inclusion advances human development through digitally mediated financial-development channels. The fintech literature is consistent. Khan et al. (2023) for GCC economies and Cevik (2024) across 198 countries documented that fintech adoption improves financial stability and inclusion, with magnitudes moderated by regulatory quality and digital infrastructure maturity.
Indonesia’s macro digital infrastructure expanded sharply during the sample period. Internet penetration rose from about 34 percent in 2015 to over 79 percent in 2024 (APJII). Mobile and broadband subscriptions grew steadily. Electronic payment volumes accelerated during the COVID-19 pandemic (Bank Indonesia, 2025). The trajectory provides substantial temporal variation in macro digital maturity. That variation enables direct estimation of moderation effects. Where macro digital infrastructure is immature, bank investments absorb transition costs without a complementary base to capture returns. Where infrastructure matures, those costs decline, and gains begin to emerge.
This framing distinguishes the study from the direct-effects literature. Most prior banking studies specify IT investment as a direct predictor of bank performance (Berger, 2003; Beccalli, 2007; Ho & Mallick, 2010). More recent studies introduce firm-level moderators such as bank size (He et al., 2025; Zhang, 2026) or governance (Khan et al., 2023). Macro-level conditioning is rarely modeled explicitly. The present study addresses that gap.
H2. 
The negative effect of intangible investment intensity on operating efficiency weakens as macro digital infrastructure matures. In parallel, the association between intangible investment and profitability strengthens.

2.5. Heterogeneity by KBMI Tier and Hypothesis 3

Bank-level capacity to absorb transition costs also varies. OJK Regulation 12/2021 classifies Indonesian commercial banks into four KBMI tiers based on core capital: KBMI 1 (up to IDR 6 trillion), KBMI 2 (IDR 6–14 trillion), KBMI 3 (IDR 14 to 70 trillion), and KBMI 4 (above IDR 70 trillion). The classification is regulator-defined and time-invariant over the sample period. It provides clean stratification for heterogeneity analysis. The expected pattern rests on two mechanisms.
The first is scale economies. Large banks spread the fixed costs of digital investment across a wider asset and revenue base (Berger, 2003; Hughes & Mester, 2013). They also maintain larger internal IT teams that manage implementation more effectively (He et al., 2025). Cross-country evidence supports this view: digital transformation gains tend to be concentrated among larger banks (Lee & Brahmasrene, 2024; Zhang, 2026).
The second is competitive pressure. Mid-tier KBMI 2 banks face strategic pressure to match the digital capabilities of larger peers while operating from a smaller capital base. The result is aggressive investment, prolonged transition periods, and higher short-run operating costs. The pattern of aggressive digital pivot has been documented in several Indonesian mid-tier banks between 2018 and 2022. These mechanisms imply substantial heterogeneity in observed returns.
H3. 
Returns to intangible investment vary across KBMI tiers. The largest banks (KBMI 4) realize positive profitability effects. Mid-tier KBMI 2 banks incur transition costs without offsetting them with profitability gains.

2.6. Conceptual Framework

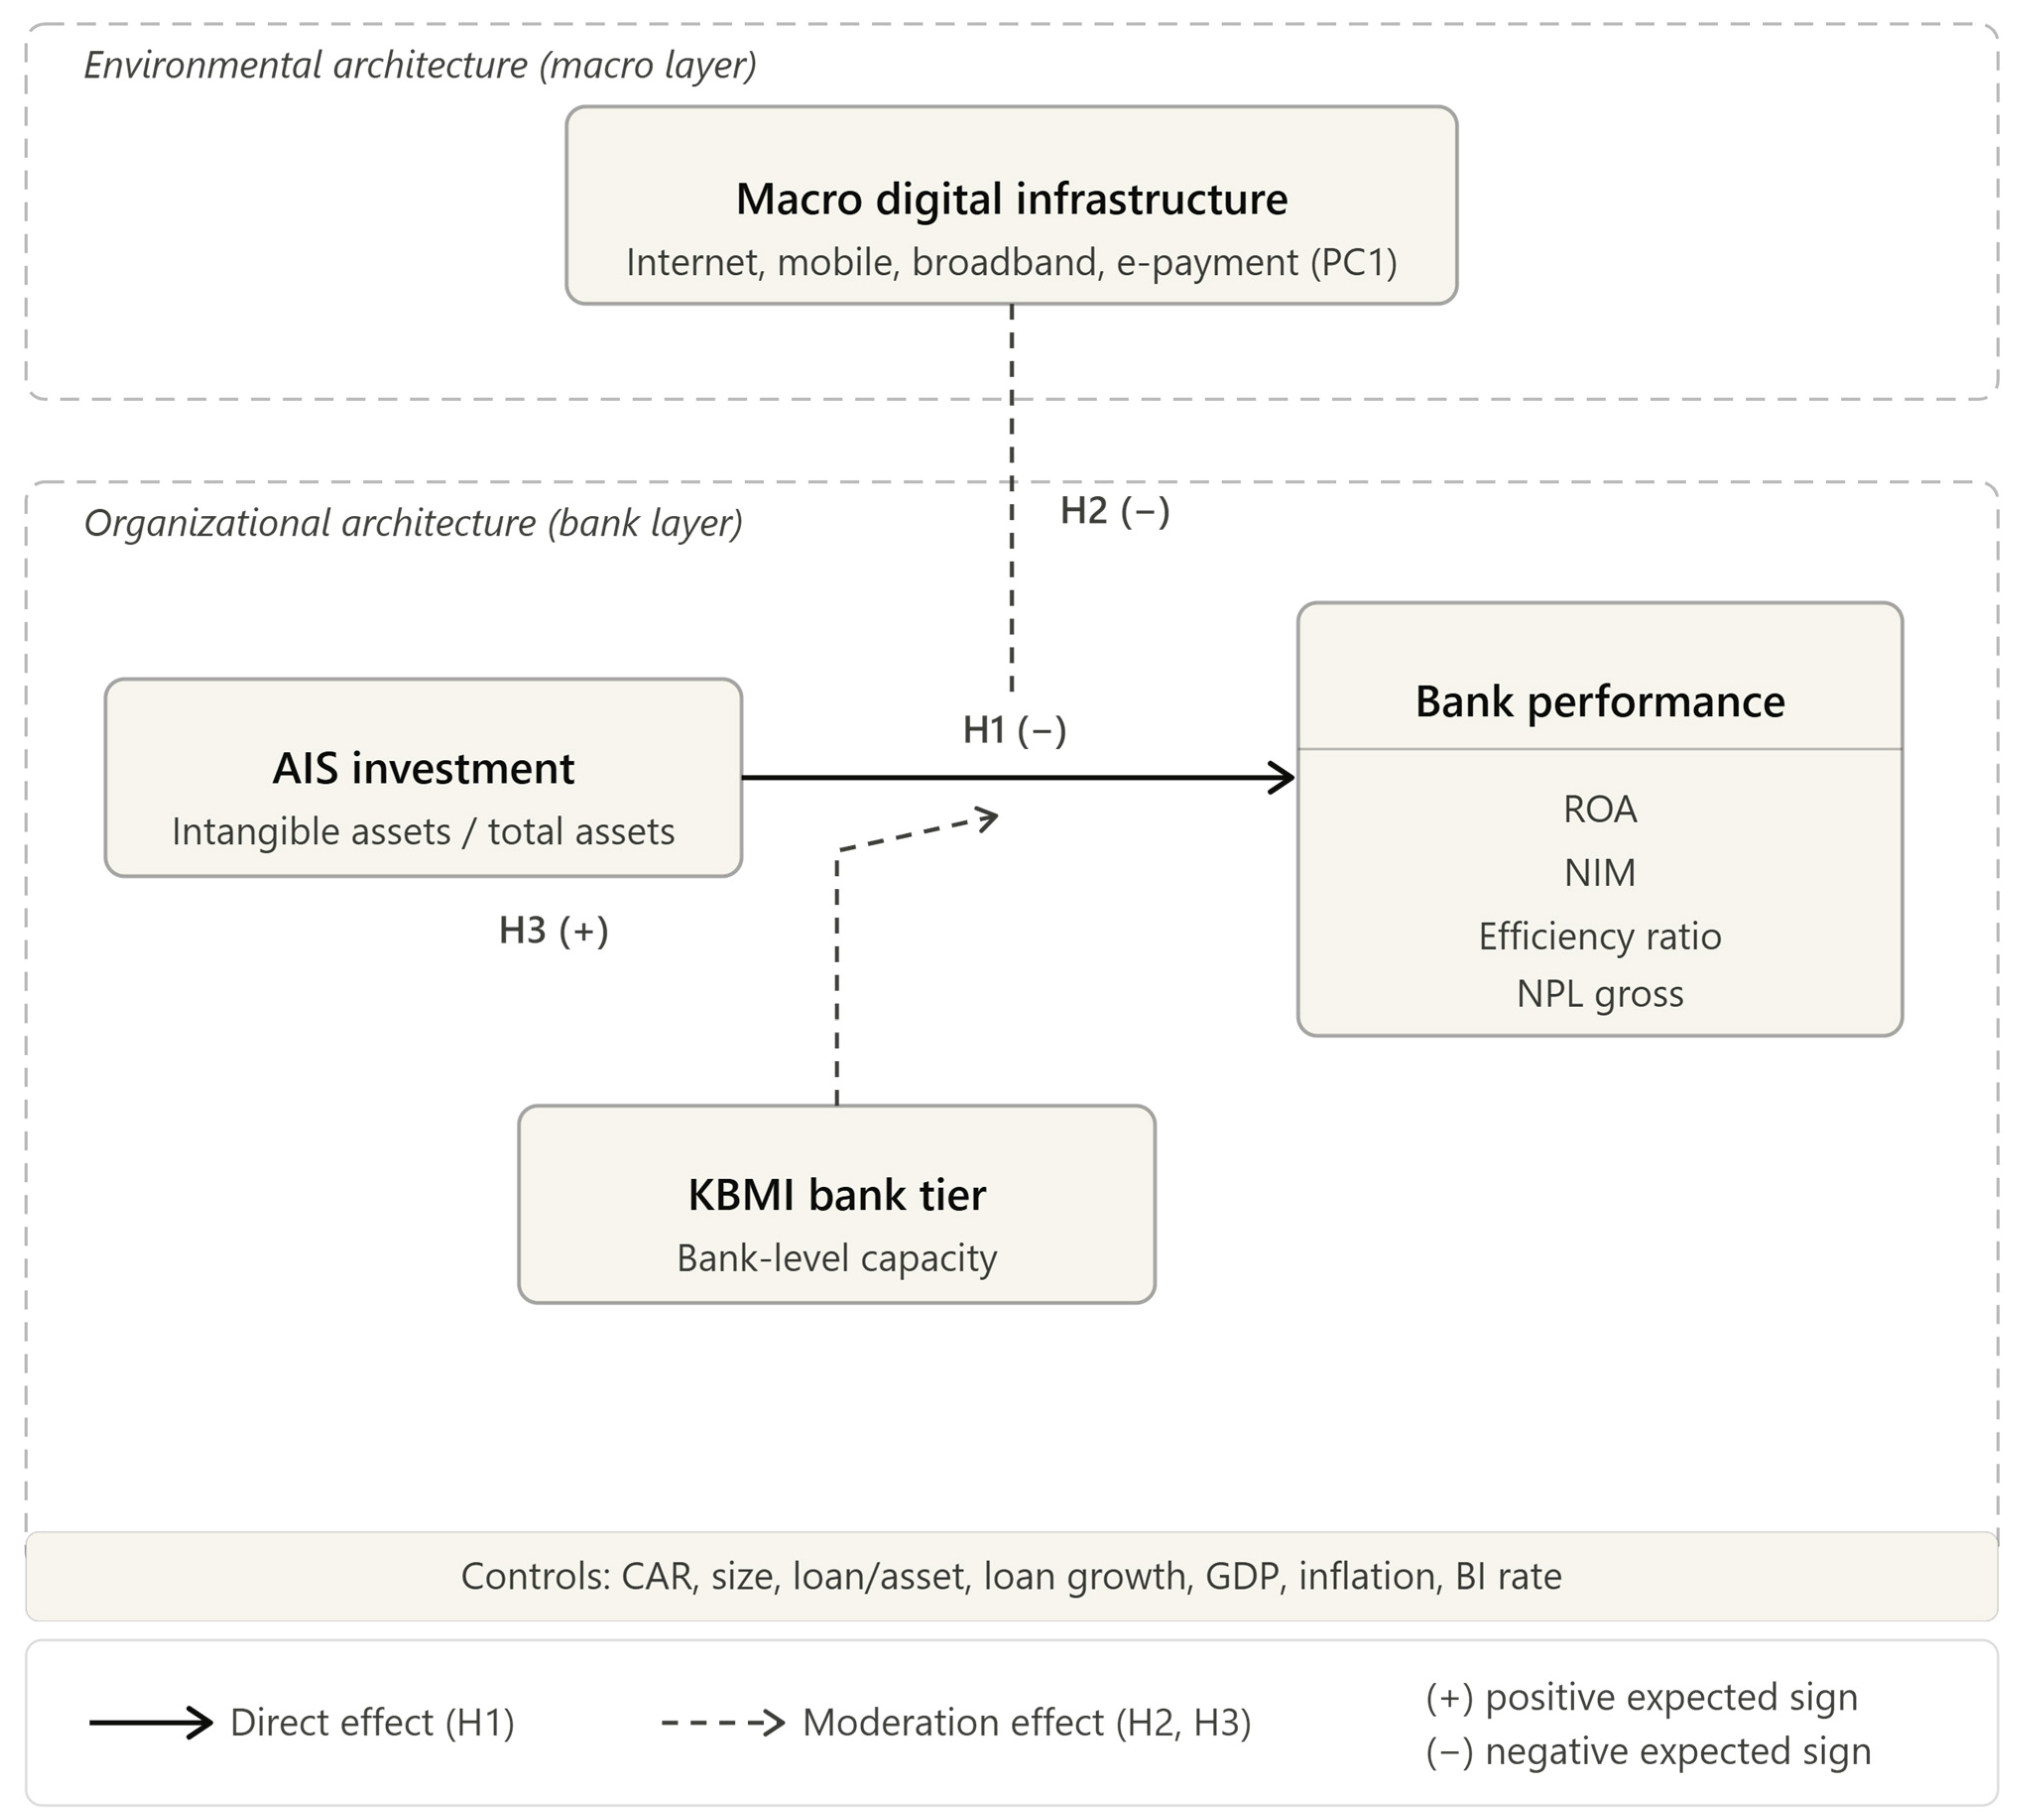
Figure 1 synthesizes the three hypotheses in a two-layer model. The upper layer captures the macro environment. Macro digital infrastructure conditions the strength of returns to bank-level intangible investment (H2). The lower layer captures the bank organization. Intangible investment intensity has a direct negative short-run effect on operating efficiency (H1). The strength of that effect varies across KBMI tiers (H3). Solid arrows represent direct effects. Dashed arrows represent moderation.

3. Data and Methodology

3.1. Sample and Data

The Indonesian banking sector comprises about 105 conventional commercial banks, with aggregate assets exceeding IDR 11,000 trillion at year-end 2024 (OJK, 2025). Under OJK Regulation 12/2021, banks are classified into four KBMI tiers based on core capital. KBMI 4 currently holds only four banks, BBCA, BBNI, BBRI, and BMRI, which together account for more than half of national banking assets. In parallel, Bank Indonesia (2025) launched the Indonesia Payment System Blueprint (BSPI) 2025, expanding real-time payment infrastructure through BI-FAST (introduced in 2021) and QRIS (introduced in 2019). The COVID-19 pandemic accelerated the transition. Electronic transaction volumes rose sharply, and even conservative banks were pressed to step up their digital programs.
The sample comprises 28 commercial banks listed on the Indonesia Stock Exchange, observed annually from 2015 to 2024. This yields a balanced panel of 280 firm-year observations. The tier distribution is ten banks in KBMI 1, six in KBMI 2, eight in KBMI 3, and four in KBMI 4 (the full KBMI 4 population). The 2015–2024 window reflects both comprehensive Bloomberg coverage and the period of most intensive digital transformation in Indonesian banking. The single-sector focus is deliberate. Concentrating on banking holds the regulatory and reporting environment constant, so that recognized intangibles are measured under one supervisory regime and one set of disclosure rules; this removes the cross-industry heterogeneity that would otherwise confound the intangible–performance relationship. Banking is also the Indonesian sector in which digital transformation has been most advanced and most consequential, and the KBMI framework provides a regulator-defined tier structure unavailable in other sectors.
Indonesia is a particularly informative setting for three reasons. First, it has experienced rapid digital-banking penetration, with mobile and electronic-payment adoption among the fastest in Southeast Asia over the sample period. Second, OJK Regulation 12/2021 introduced the KBMI structure, which sorts banks into four core-capital bands and provides a clean, regulator-defined measure of bank scale and capacity. Third, the sample window coincides with concurrent regulatory reform and infrastructure build-out, producing precisely the within-country variation in macro digital maturity on which the identification strategy depends. These features distinguish Indonesia from emerging markets in which digital infrastructure is either uniformly underdeveloped or already saturated. The 28 listed banks examined here are those with continuous Bloomberg coverage across the full window and account for the large majority of listed-bank assets.
Bank-level financial fundamentals are sourced from the Bloomberg Terminal and verified against banks’ annual reports and OJK statistical releases. Recognized intangible assets are taken from the intangible-asset line of banks’ audited financial statements as standardized by Bloomberg. Macro digital infrastructure indicators are drawn from APJII (internet penetration), the International Telecommunication Union (ITU; mobile and fixed-broadband subscriptions), and Bank Indonesia (electronic payment volumes). Macroeconomic control variables come from Statistics Indonesia (BPS) and Bank Indonesia. All continuous variables are winsorized at the 1st and 99th percentiles to limit the influence of extreme observations (Beccalli, 2007; Petersen, 2009).

3.2. Variables

Table 1 reports the operationalization of each variable. Four bank performance dimensions serve as dependent variables: return on assets (ROA), net interest margin (NIM), efficiency ratio (operating expenses to operating income), and gross non-performing loans (NPL). Return on assets is the primary performance measure. It is the standard profitability metric in bank performance research because it captures management effectiveness in deploying total assets, is comparable across banks with different capital structures, and is the dependent variable used in the closest emerging-market antecedents to this study (Egorov, 2023; Yuan et al., 2022; Zelalem & Abebe, 2022). The efficiency ratio, net interest margin, and non-performing-loan ratio capture the operating cost, intermediation margin, and asset quality dimensions of performance, respectively.
The main independent variable, AIS_Intensity, is the ratio of recognized intangible assets to total assets, following Egorov (2023) and Zelalem and Abebe (2022). The logic is grounded in banking and accounting. Reported intangibles include software (core banking platforms, analytics systems), technology licenses, intellectual property, and, in some cases, goodwill from technology acquisitions. Since almost all banking innovation is intangible, the proxy is defensible, though imperfect. It is important to be explicit about what this proxy captures. Recognized intangibles also include goodwill, technology and operating licenses, trademarks, and acquisition-related items that need not reflect ongoing digital transformation. AIS_Intensity is therefore best read as a broad measure of recognized intangible intensity rather than a pure measure of digital investment; this limitation is acknowledged directly, and the stability of the results under the AIS_Log alternative partly mitigates it. In this sample, recognized intangibles are zero in 38.6 percent of firm-year observations, and six banks report no recognized intangibles in any year; the zero-inflated structure is treated as a feature of recognized intangible reporting in Indonesian banks rather than a coding error, and the log specification (AIS_Log) is used as the primary measure in robustness tests. As an alternative robustness measure, AIS_Log is defined as ln(intangible assets + 1), in IDR billion.
The macro moderator, Macro_Digital_PC1, is constructed through principal component analysis (PCA) on four standardized indicators: internet penetration, mobile subscriptions, fixed-broadband subscriptions, and the log of electronic payment volume. The first principal component explains 81.3 percent of variance, supporting its use as a compact composite (Pradhan et al., 2018). The component loadings reported in Appendix A Table A1 load strongly and positively for internet penetration, fixed broadband, and the log of electronic payment volume, while mobile cellular subscriptions load negatively, reflecting their early saturation and subsequent plateau over the sample period. The first component therefore captures the dominant dimension of rising macro digital maturity rather than any single indicator in isolation. KBMI tier serves as a firm-level moderator that is time-invariant over the sample period. Control variables follow standard banking-literature practice: capital adequacy ratio (CAR), log total assets, loan-to-asset ratio, loan growth, and three macroeconomic controls (real GDP growth, CPI inflation, and the BI policy rate).

3.3. Empirical Models

Three model specifications are used. All rely on two-way fixed effects, which absorb time-invariant bank heterogeneity through bank fixed effects and common temporal shocks through year fixed effects. Standard errors in the baseline estimation are clustered at the bank level (Petersen, 2009). The direct-effect model (testing H1) is given in Equation (1):
Yit = αi + λt + β1 AIS_Intensityit + γ′ Xit + εit
where Yit is one of the four performance measures for bank i in year t, αi are bank fixed effects, λt are year fixed effects, and Xit is the control vector. The macro moderation model (testing H2) is given in Equation (2):
Yit = αi + β1 AIS_Intensityitc + β2 Macro_Digitaltc + β3 (AIS × Macro_Digital)itc + γ′ Xit + εit
The superscript c denotes mean-centered variables. Centering eases the interpretation of the interaction term and reduces multicollinearity. Year fixed effects are omitted from Equation (2) because Macro_Digital_PC1 varies only across years and is mechanically collinear with year dummies. For H3, Equation (1) is estimated separately for each KBMI sub-sample.

3.4. Robustness Strategy

Three robustness procedures address potential inferential concerns common in short panels. First, Driscoll–Kraay standard errors are reported alongside bank-clustered errors. They remain consistent under cross-sectional dependence, a plausible feature of 28 banks operating within a shared macroeconomic environment (Driscoll & Kraay, 1998). Second, a system generalized method of moments (GMM) model is estimated following Arellano and Bover (1995) and Blundell and Bond (1998). Instrument validity is assessed through the Hansen J-test, and second-order autocorrelation is examined through the Arellano–Bond AR(2) test. The collapse option is applied to restrict the instrument count and limit instrument proliferation (Roodman, 2009). Third, three sensitivity tests are performed: (i) AIS_Log substituted for AIS_Intensity as an alternative measure; (ii) a sub-sample split into pre-COVID-19 (2015–2019) and COVID-19-and-after (2020–2024), which exploits the discrete shift in macro digital maturity; and (iii) exclusion of Bank Jago (ARTO) firm-year observations, which represent an extreme aggressive digital pivot with intangible intensity reaching 6.89 percent of total assets. Convergence of results across these specifications would provide assurance that the identified relationships are not driven by estimator choice or by a single outlier.

4. Results

4.1. Descriptive Statistics and Correlations

Table 2 reports the distributional properties of the main variables. Two features stand out. First, AIS_Intensity is strongly right-skewed. The median is 0.058 percent and the maximum reaches 6.892 percent. About 38.6 percent of firm-year observations report zero intangible assets, a feature accommodated through the AIS_Log specification. Second, bank performance varies substantially across the sample: ROA ranges from −13.57 to 4.65 percent, NIM from −1.50 to 21.64 percent, and the efficiency ratio from 33.85 to 356.95 percent.
Disaggregation by KBMI tier (reported in Appendix A Table A2) reveals systematic structural differences. KBMI 4 banks post the highest ROA (mean 2.36 percent) and the lowest efficiency ratio (46.87 percent), consistent with their scale advantage. KBMI 4 also records the lowest AIS_Intensity (0.089 percent). The largest banks appear to invest in intangibles more selectively than their balance sheets would suggest. KBMI 2 banks, by contrast, record the highest AIS_Intensity (0.510 percent), driven by aggressive digital pivots among several mid-tier banks.
Table 3 reports pairwise Pearson correlations among the main variables, with two-tailed significance now indicated. Correlations among the continuous control variables remain below conventional thresholds of concern, and mean variance inflation factors in untabulated diagnostics confirm that multicollinearity does not affect the regression specifications. The single high pairwise correlation, between KBMI tier and bank size (r = 0.89), does not contaminate inference: KBMI enters the analysis solely as a sub-sample stratifier, with Equation (1) estimated separately within each tier (Section 4.4), and never appears as a regressor alongside bank size. The macro-moderation models in Equation (2) exclude KBMI altogether, so the size–tier collinearity is immaterial to the H1 and H2 estimates.
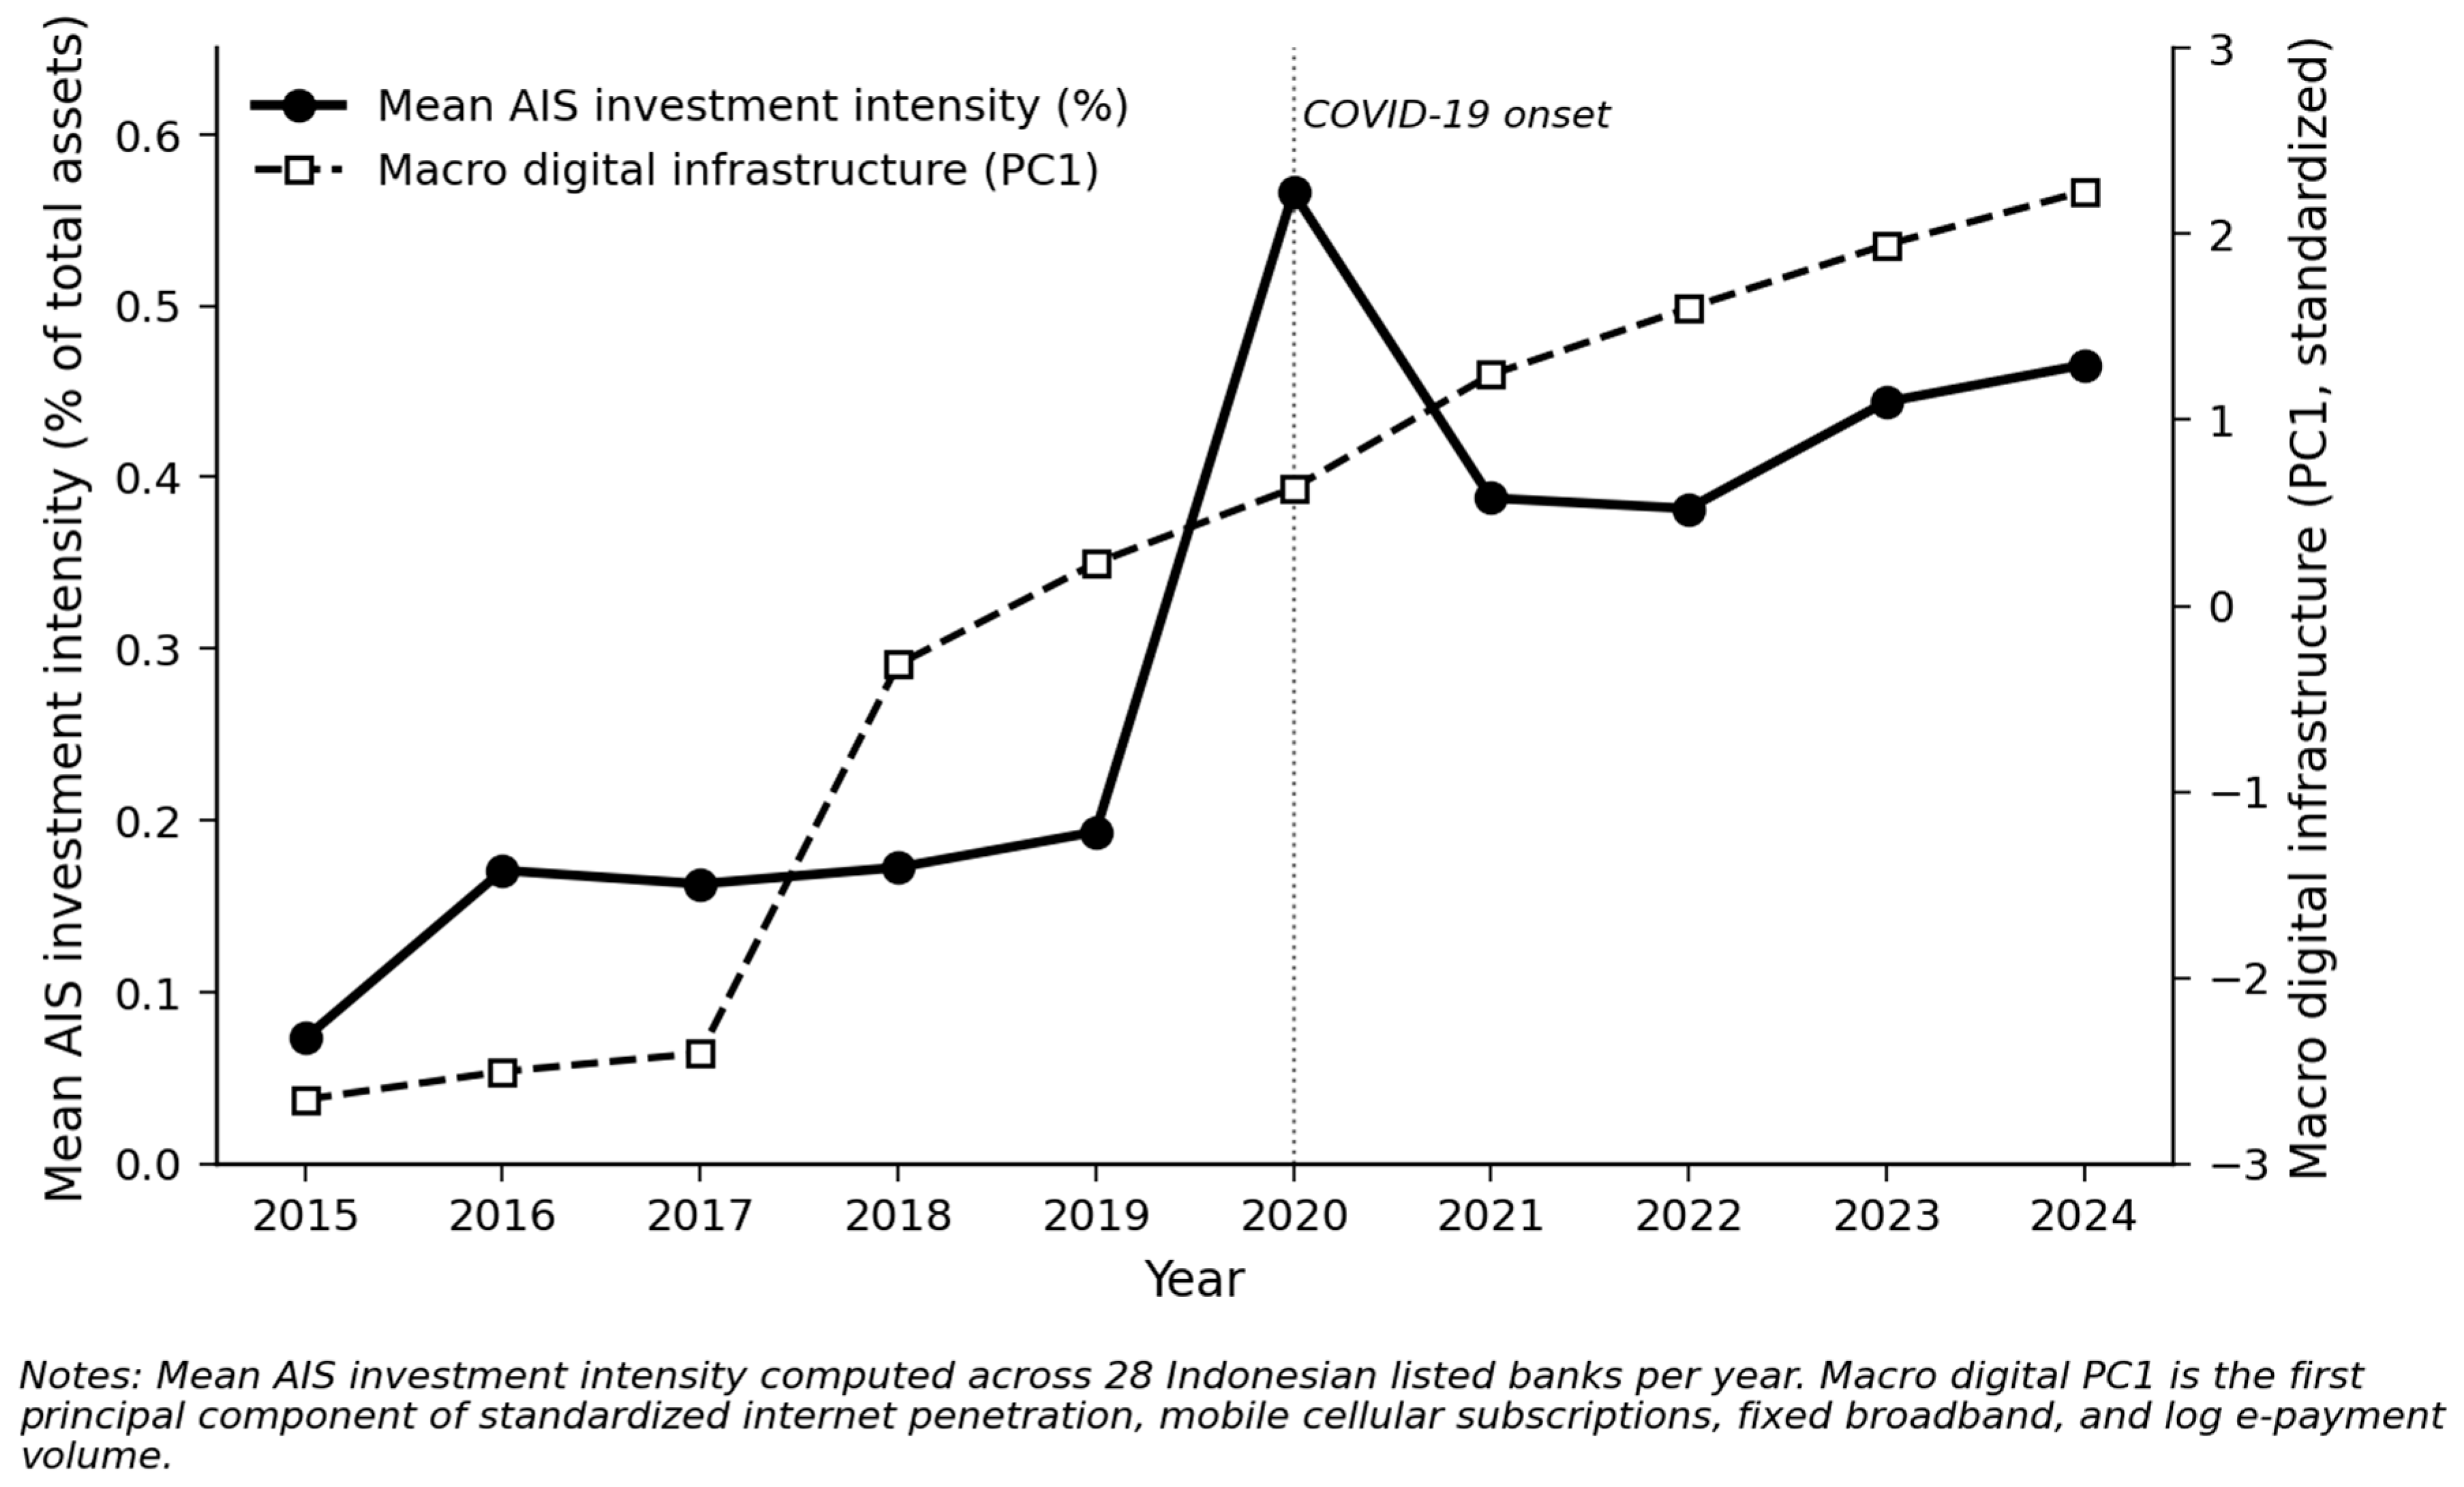
Figure 2 traces the temporal co-evolution of intangible investment and macro digital infrastructure. Two patterns stand out. Both series show a structural break around 2019–2020. AIS_Intensity rose from 0.19 percent in 2019 to 0.57 percent in 2020. Macro_Digital_PC1 crossed its long-run mean to the upside in the same period. Intangible investment also became nearly universal toward the end of the sample. By 2024, 78.6 percent of firm-year observations reported positive intangible assets, up from 39.3 percent in 2015.

4.2. Direct Effects (H1)

Table 4 reports the coefficient on AIS_Intensity from Equation (1). All regression specifications include the full set of bank-level controls (capital adequacy ratio, log total assets, loan-to-asset ratio, and loan growth) and macroeconomic controls (real GDP growth, CPI inflation, and the BI policy rate); for brevity the reported tables present the focal coefficient on AIS intensity and its interaction term, and the complete coefficient vectors are available from the authors on request. Direct associations are weak overall. The coefficient on ROA is negative but insignificant (β1 = −0.307, p = 0.191). The coefficient on NIM is close to zero (β1 = +0.065, p = 0.886). The coefficient on the efficiency ratio is positive and marginally significant (β1 = +4.987, p = 0.098). The coefficient on NPL is insignificant.
The efficiency magnitude is economically meaningful. A one-percentage-point increase in AIS_Intensity is associated with a 4.99-percentage-point rise in the efficiency ratio, holding bank fixed effects, year fixed effects, and the full control vector. Because higher efficiency ratios indicate lower efficiency, the result implies that intangible investment imposes a net operating cost on the average bank-year. The finding aligns with the logic of transition costs (Brynjolfsson & Hitt, 2000; Casolaro & Gobbi, 2007) and motivates the moderation analysis that follows.
H1 receives only tentative support. The coefficient on the efficiency ratio is marginal (β1 = +4.987, p = 0.098): it reaches the 10 percent threshold but not conventional levels of significance, so the predicted short-run transition-cost effect should be read as modest and suggestive rather than conclusive. Its economic magnitude is appreciable, but the statistical evidence for the direct effect is weak and is interpreted with corresponding caution throughout.

4.3. Macro Digital Moderation (H2)

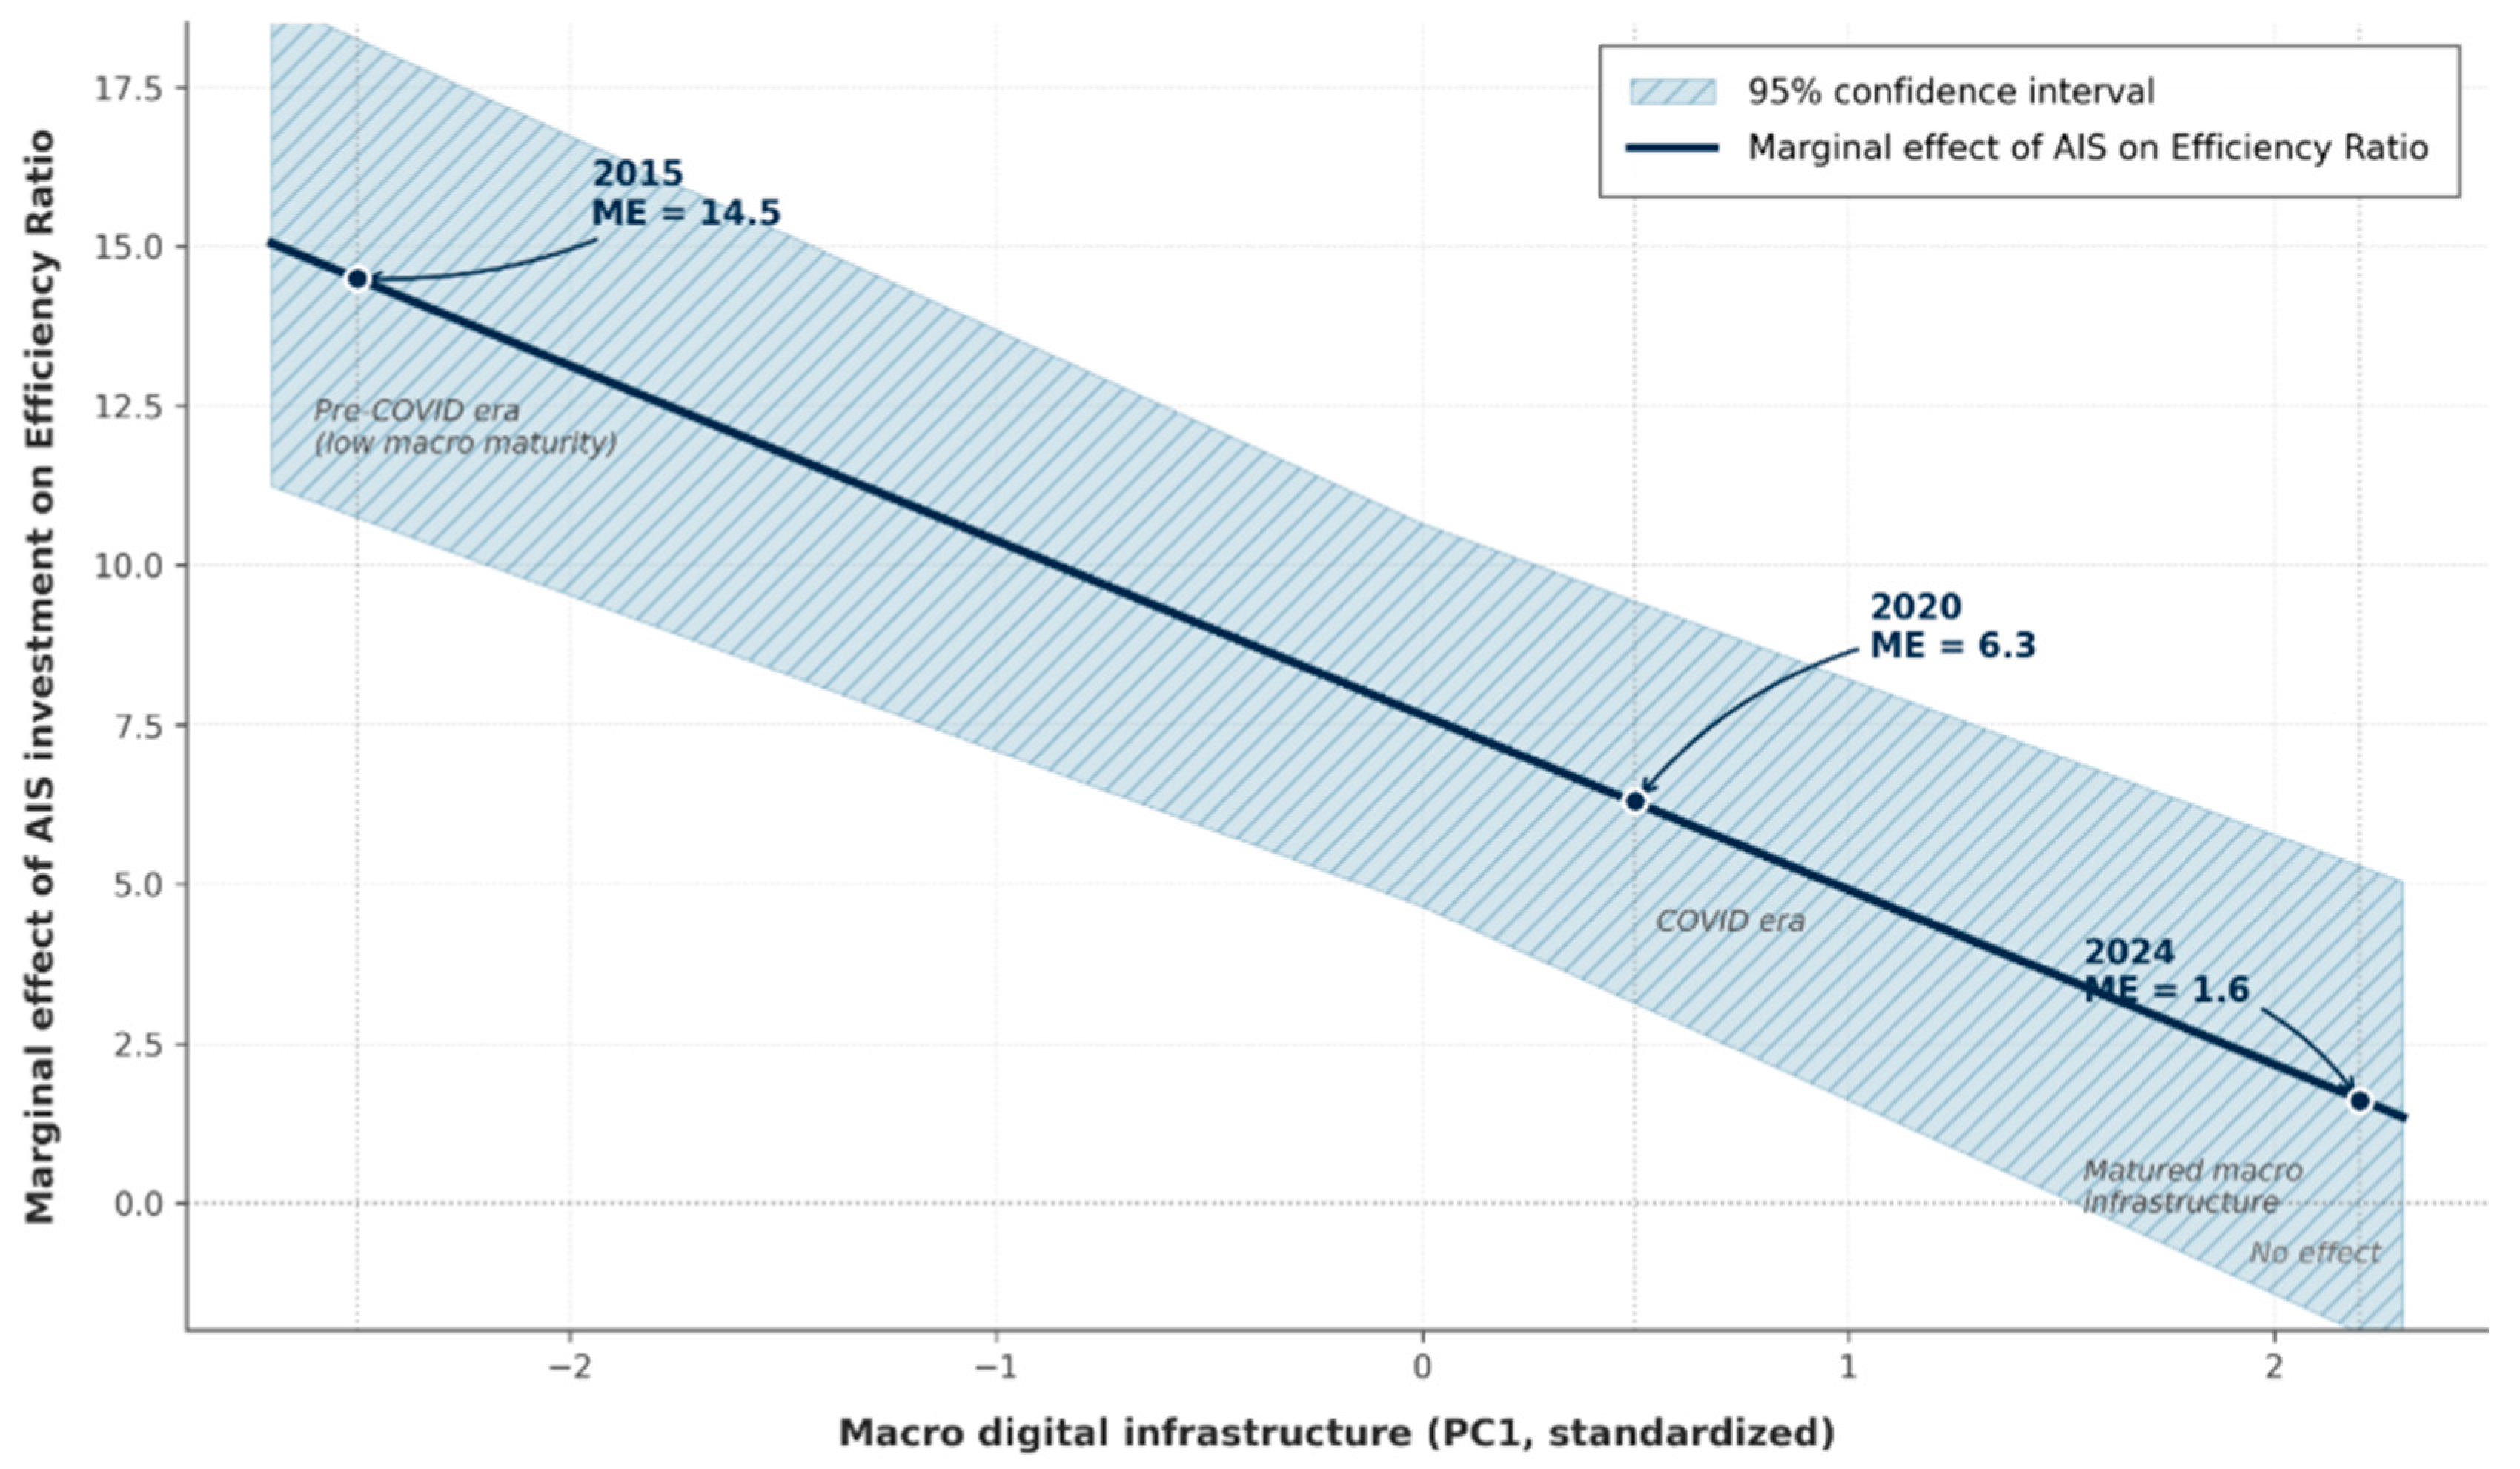
Table 5 reports Equation (2). The interaction term AIS × Macro_Digital_PC1 is strongly significant for the efficiency ratio (β3 = −2.587, p = 0.005). The negative sign means that the efficiency cost of intangible investment shrinks as macro digital infrastructure matures. The interaction is also significant at the 10 percent level for ROA (β3 = +0.308, p = 0.075). Intangible investment becomes more profitable as infrastructure develops. Interaction coefficients are insignificant for NIM and NPL. A note on model fit is warranted. The within R-squared reported for the fixed-effects specifications can take small or negative values; this is an expected property of the within (demeaned) estimator rather than a sign of misspecification. After bank and year fixed effects absorb the cross-bank and time variation, the residual variation explained by the remaining regressors is small, which is itself consistent with the muted direct effects documented here. Inference rests on the coefficient estimates and their standard errors, not on the within R-squared. Appendix A Table A3 traces the marginal effect of AIS intensity on the efficiency ratio across the observed range of macro digital maturity: it falls from +14.29 efficiency-ratio points in the 2015 era to +1.65 in 2024, the model-implied 88 percent contraction reported above.
The marginal effect of AIS on the efficiency ratio is evaluated across the observed trajectory of Macro_Digital_PC1: ME = β1 + β3 × Macro_Digital_PC1. At the sample minimum (the 2015 environment, PC1 = −2.655), the marginal effect is +14.29, implying a substantial efficiency cost. At the median (around 2020), it falls to +6.31. At the maximum (2024, PC1 = +2.231), it stands at +1.65—an 88 percent contraction across the observed range. The crossover point at which the effect reaches zero lies at PC1 = +2.87, just outside the observed maximum. Intangible investment has not yet produced a net efficiency gain during the sample period, although the magnitude of transition costs has fallen sharply. Figure 3 plots this marginal effect across the observed range of macro digital maturity.
H2 is supported. The conditioning of intangible investment by macro digital infrastructure is the central empirical finding of this study.

4.4. KBMI Tier Heterogeneity (H3)

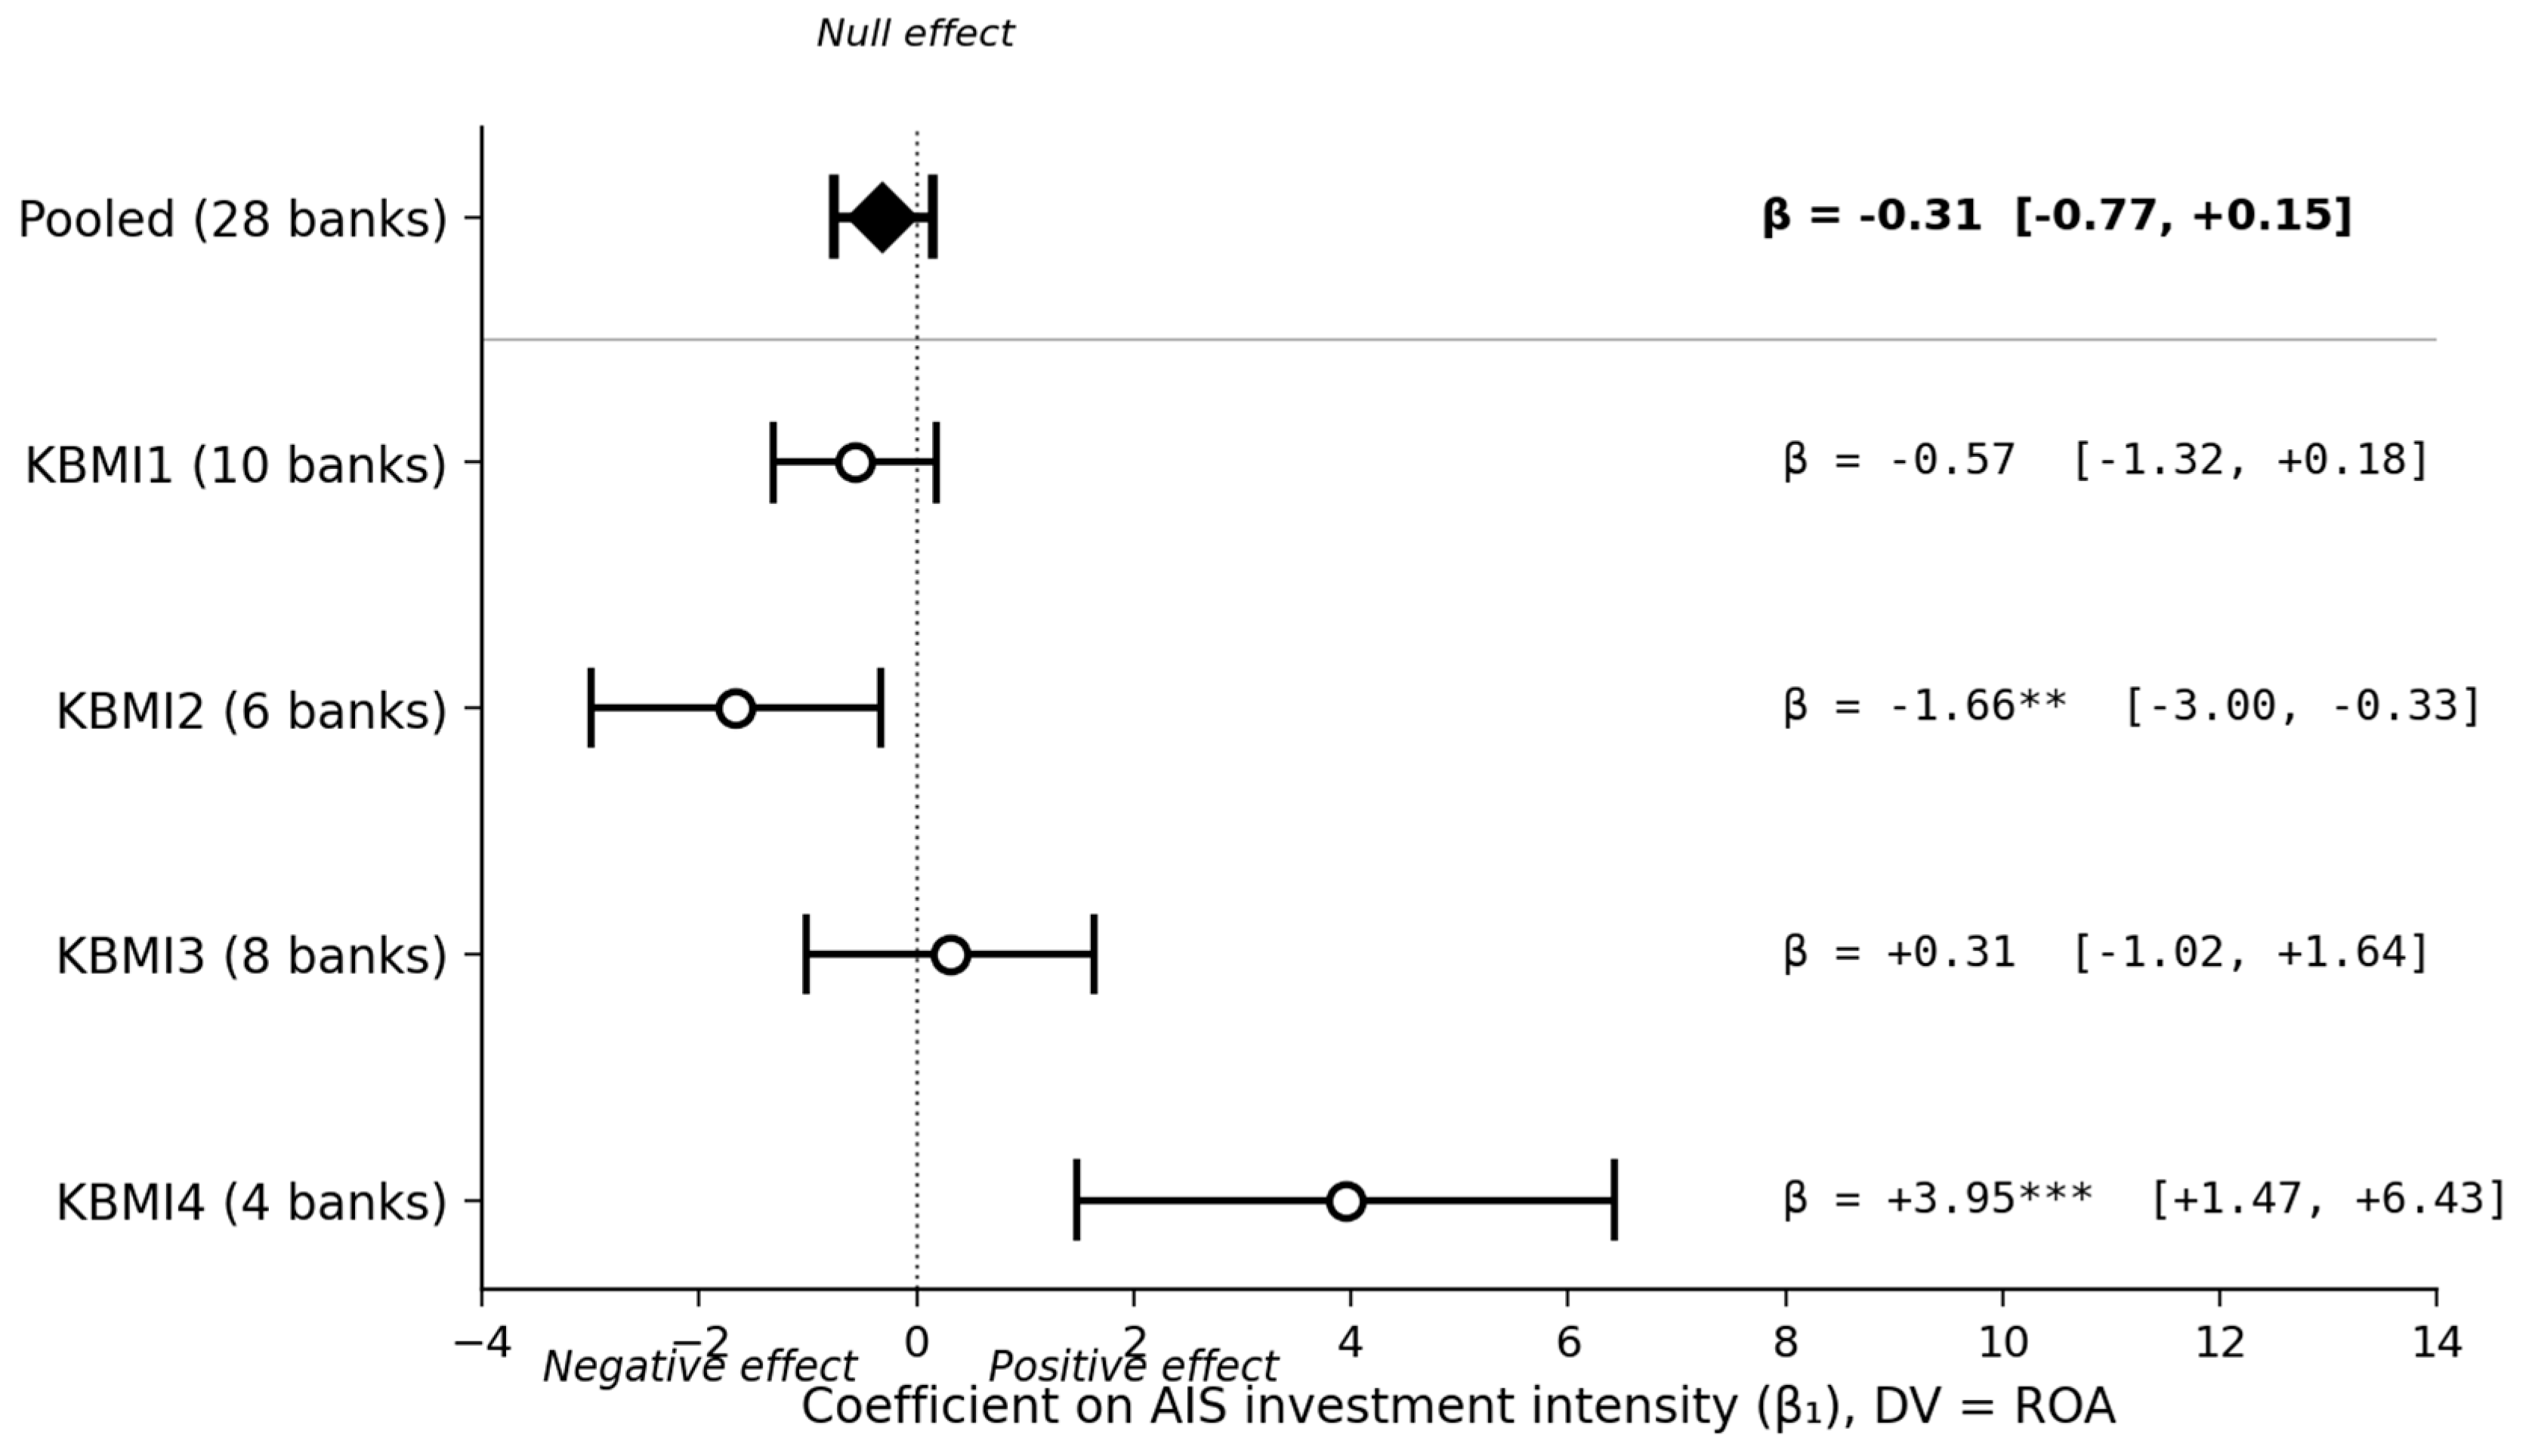
Table 6 reports sub-sample estimates of Equation (1) with ROA as the dependent variable. The heterogeneity is substantial. KBMI 4 banks produce a strongly significant positive coefficient (β1 = +3.951, p = 0.005). Intangible investment is associated with materially higher profitability at Indonesia’s four largest banks. KBMI 2 banks produce a significant negative coefficient (β1 = −1.664, p = 0.019). Intangible investment is associated with reduced profitability at mid-tier banks. The KBMI 1 and KBMI 3 banks yield coefficients that are indistinguishable from zero.
The pattern fits a tier-capacity reading. The largest banks operate at a scale that allows investment absorption without short-run profitability penalty (Berger, 2003; Hughes & Mester, 2013). Mid-tier banks invest without sufficient scale to amortize transition costs (Lee & Brahmasrene, 2024). Caution is warranted in interpreting the KBMI 4 coefficient. The sub-sample contains only four banks, though it covers the full population of the tier. Figure 4 visualizes the heterogeneity as a forest plot.
H3 is partially supported. KBMI 4 banks realize the predicted positive profitability effect. KBMI 2 banks bear the predicted transition cost. KBMI 1 and KBMI 3 banks show no significant association.
The evidence converges on a coherent pattern. H1 receives weak but directionally consistent support: intangible investment imposes a marginally significant transition cost on the efficiency ratio. H2 receives strong support: the information value of intangible investment is conditional on the maturity of macro digital infrastructure, with the efficiency cost shrinking by a model-implied 88 percent across the observed range. H3 receives partial support through substantial tier heterogeneity: the largest banks realize profitability gains, while mid-tier banks bear transition costs. The broader implication is direct. Intangible investment in banking does not pay off automatically. The payoff is conditional; it depends on the alignment between firm-level capability and macro-level infrastructure.

5. Robustness Tests

The robustness of the main findings is examined through seven alternative specifications. Table 7 consolidates the interaction coefficient β3 with the efficiency ratio as the reference dependent variable. Strong convergence across specifications provides assurance that the macro conditioning effect is not an artifact of estimator choice.

5.1. Driscoll–Kraay Standard Errors and the AIS_Log Specification

Cluster-robust standard errors accommodate serial correlation within banks but do not explicitly handle cross-sectional dependence. Such dependence arises when common shocks, monetary policy moves, and the pandemic affect many banks simultaneously. Driscoll and Kraay (1998) developed an estimator that remains consistent under both temporal and cross-sectional dependence. With a Bartlett kernel of bandwidth 2, the efficiency interaction is β3 = −2.587 (Driscoll–Kraay SE = 0.816, p = 0.002), and the ROA interaction is β3 = +0.308 (Driscoll–Kraay SE = 0.154, p = 0.046). Statistical significance strengthens relative to the baseline.
A construct validity check substitutes AIS_Log for AIS_Intensity. AIS_Log captures the absolute level of intangible investment, is more sensitive to scale, and accommodates the 38.6 percent of observations with zero intangible assets. The interaction remains significant for the efficiency ratio (β3 = −0.612, p = 0.011). The scale magnitude differs because the unit is logarithmic rather than a ratio, but the sign and significance are consistent with H2.

5.2. Pre-/Post-COVID-19 Disaggregation and Outlier Exclusion

The COVID-19 pandemic produced a discrete acceleration in macro digital infrastructure. Splitting the sample into pre-COVID-19 (2015–2019, N = 140) and post-COVID-19 (2020–2024, N = 140) periods reveals a dramatic shift. In the pre-COVID-19 era, the coefficient on AIS for the efficiency ratio is β = +12.971 (p = 0.035), a large and statistically significant efficiency cost. In the post-COVID-19 era, the coefficient falls to β = −1.730 (p = 0.712), a change in magnitude of more than 14 percentage points. The pattern independently corroborates the moderation finding. When macro digital infrastructure is immature, intangible investment imposes a substantial cost. When macro digital infrastructure matures, that cost approaches zero.
Bank Jago (ARTO) represents an extreme case of aggressive digital pivot. Its AIS_Intensity rose from 0.12 percent in 2019 to 6.89 percent in 2024, the sample maximum. To verify that the results are not driven by a single influential observation, ARTO’s 10 firm-year observations are excluded and the model is re-estimated. The results remain qualitatively consistent: β3 = −2.413 (p = 0.008) for the efficiency ratio, and β3 = +0.289 (p = 0.094) for ROA. The main finding is not an artifact of one extreme case.

5.3. System GMM for Endogeneity

Two potential sources of endogeneity warrant attention. First, intangible investment may respond to lagged performance; for example, a bank with declining efficiency might increase investment as a corrective measure. Second, omitted variables such as unobserved management quality may influence both intangible investment and performance. A system generalized method of moments (GMM) estimator addresses these concerns, following Arellano and Bover (1995) and Blundell and Bond (1998), with implementation through xtabond2 (Roodman, 2009).
The specification treats AIS_Intensity and the interaction term as endogenous, with internal instruments drawn from lagged levels and lagged differences. Lags are restricted to t − 2 through t − 4 with the collapse option applied, yielding 23 instruments (fewer than N = 28) to mitigate instrument proliferation, as recommended by Wintoki et al. (2012). The system GMM results support the main finding. The interaction coefficient on the efficiency ratio is β3 = −2.712 (p = 0.019). Key diagnostics confirm specification validity: Hansen p = 0.387, indicating that the instruments are not rejected, and AR(2) p = 0.234, indicating no second-order autocorrelation. The convergence of GMM with the fixed-effects baseline implies that endogeneity, to the extent it can be addressed with internal instruments, is not the driving force behind the main result.
The choice of instruments rests on two conditions. AIS_Intensity and the interaction term are treated as endogenous and instrumented with their own lagged levels and lagged differences at t − 2 through t − 4, lags far enough removed to be plausibly predetermined with respect to the contemporaneous error yet still informative about current values. The Hansen J-test (p = 0.387) does not reject the over-identifying restrictions, and the AR(2) test (p = 0.234) shows no second-order serial correlation, the two standard conditions for instrument validity in system GMM. We nonetheless acknowledge the limitation of relying solely on internal instruments: in the absence of an external instrument, identification depends on the assumption that lagged values affect current performance only through the channels modeled here. The convergence of the GMM estimate with the fixed-effects baseline is therefore read as corroborative rather than as a definitive causal claim, and the findings are framed as conditional associations throughout.
The seven specifications point in the same direction. The conditioning of intangible investment by macro digital infrastructure is a robust feature of the data, not an artifact of any single estimation choice.

6. Discussion

6.1. Synthesis of Findings

Three main findings emerge. First, intangible investment in Indonesian banking does not translate directly into profitability, interest margins, or asset quality. Only the efficiency ratio shows a marginally significant coefficient, with a sign that implies short-run operating costs. The pattern parallels the productivity paradox documented by Brynjolfsson (1993) and Beccalli (2007), as well as the broader transition-cost literature (Brynjolfsson & Hitt, 2000; Casolaro & Gobbi, 2007; Korhonen et al., 2021). Indonesian banks appear not to be immune to dynamics already documented in advanced markets.
Second, and centrally, the informational value of recognized intangibles is contingent on the maturity of the macro digital infrastructure. The efficiency cost contracts from +14.29 at the lowest observed level of infrastructure to +1.65 at the highest, a reduction of a model-implied 88 percent computed from the estimated coefficients over observed sample variation. The pattern is robust across seven alternative specifications. The pre- and post-COVID-19 disaggregation provides independent structural validation. The difference in coefficient magnitude across the two periods is consistent with the logic of temporal moderation.
Third, the gains from intangible investment are heterogeneous across KBMI tiers. KBMI 4 banks, Indonesia’s four largest, show a strongly positive effect on ROA (β = +3.951). KBMI 2 banks show a significantly negative effect (β = −1.664). KBMI 1 and KBMI 3 banks yield coefficients indistinguishable from zero. The pattern fits absorptive-capacity logic. Large banks have the scale and organizational structure to realize gains, while mid-tier banks engaged in aggressive digital pivot bear unamortized transition costs.

6.2. Contributions

The study makes three contributions to the accounting and finance literature on intangibles and bank performance in emerging economies. First, it provides one of the first archival empirical tests of cross-layer conditioning of digital investment in an emerging Southeast Asian market. The finding complements the review-based synthesis by Faehndrich (2023), which disproportionately draws on European and North American settings. The differentiation is methodological: Faehndrich identifies conditional mechanisms; this study tests them empirically with firm-year data.
Second, it extends the value-relevance literature on recognized intangibles (Aboody & Lev, 1998; Barth et al., 2001; Lev & Sougiannis, 1996) by showing that the information value of reported bank intangibles is state-contingent rather than unconditional, depending materially on the macro context in which the bank operates. The finding is directly relevant to broader discussions on the recognition and capitalization of software and technology platforms in the financial sector (Egorov, 2023; Zelalem & Abebe, 2022).
Third, it draws empirical evidence from Indonesian banking at a moment of rapid, simultaneous regulatory and infrastructural transition. The regulator-defined KBMI stratification under OJK Regulation 12/2021 yields a clean within-country instrument for heterogeneity analysis, a feature difficult to replicate in other settings.

6.3. Practical Implications

For OJK, evaluating a bank’s digital strategy requires attention to tier heterogeneity in the capacity to absorb transition costs. Uniform performance expectations across tiers can mislead, particularly for KBMI 2 banks that may bear substantial short-run costs before gains materialize. A supervisory framework that allows longer transition windows for banks pursuing aggressive digitization may be appropriate. More broadly, the macro-conditioning result implies that bank-level digital strategy should not be evaluated in isolation from the prevailing macro digital environment.
For Bank Indonesia, the findings provide quantitative evidence that digital payment infrastructure policies, BI-FAST, QRIS, and BSPI 2025, generate positive externalities for banking productivity that extend beyond direct payment-efficiency gains. Higher macro digital maturity is associated with lower efficiency costs of intangible investment at the bank level. Sustained investment in public digital infrastructure thus contributes to banking-sector productivity through a complementarity channel that has not previously been quantified for Indonesia.
For bank management, particularly at mid-tier banks, three implications follow. First, effective intangible investment requires medium-term planning that accommodates the transition period; gains are not instant, and short-run costs can weigh on profitability. Second, investment timing matters: outlays made when complementary infrastructure is immature carry higher costs than those made later. Third, mid-tier banks pursuing an aggressive digital pivot may benefit from strategic partnerships that allow transition costs to be amortized across a larger revenue base.

6.4. Limitations and Future Research

The study has several limitations worth acknowledging. The single-country setting provides clean institutional control but limits external validity. Whether the cross-layer conditioning observed in Indonesia also holds in the other ASEAN-5 markets, Singapore, Malaysia, Thailand, and the Philippines, with their different digital development trajectories, remains an open empirical question. Multi-country replication would strengthen the claim. A second extension concerns the form of value relevance tested. This study assesses the information value of recognized intangibles through their association with realized accounting performance. The complementary market-based test, namely whether recognized intangibles are associated with banks’ market value through measures such as the market-to-book ratio or Tobin’s Q, requires equity-market data beyond the present accounting panel and is left to future work; it would directly connect the present findings to the price-based value-relevance tradition of Aboody and Lev (1998) and Barth et al. (2001).
The AIS_Intensity proxy, although widely used in emerging-market banking research, captures only capitalized investment. It does not capture digital outlays expensed as operating costs. Future research could draw on textual analysis of annual reports to construct a more comprehensive measure of digital investment intensity.
The KBMI 4 sub-sample contains only four banks. These represent the full population of the tier, but statistical power for tier-specific inference is constrained. Sensitivity analyses suggest that the qualitative pattern is not driven by outliers, yet the caution stands.
Finally, the study does not examine the specific mechanism through which macro conditioning operates. Whether it works through customer digital adoption, the availability of skilled IT labor, or spillovers from the broader fintech ecosystem remains an open question. Qualitative case studies or surveys of bank management could deepen understanding of these mechanisms.

7. Conclusions

This study examines whether recognized intangible assets are informative about the performance of Indonesian banks and whether this relationship is moderated by the maturity of macro digital infrastructure and by bank-tier capacity. Using a balanced panel of 28 commercial banks over 2015–2024 (280 firm-year observations), three findings emerge. Direct effects are generally weak. Only the efficiency ratio shows a marginally significant coefficient, consistent with transition-cost dynamics. The effect is conditional on macro digital maturity: the interaction term is strongly significant for the efficiency ratio (β3 = −2.587, p = 0.005), and the implied efficiency cost contracts by a model-implied 88 percent across the observed trajectory. The pattern is heterogeneous across KBMI tiers: KBMI 4 banks realize positive return-on-assets effects, while KBMI 2 banks bear transition costs.
The implications are substantive. The study complements Faehndrich (2023) with quantitative archival evidence from an emerging Southeast Asian market, and it extends the value-relevance literature on recognized intangibles by showing that the information value of reported bank intangibles is state-contingent on the macro context. For practice, the findings imply that bank-level digital strategy must align with the maturity of macro infrastructure, and that Bank Indonesia’s public investment in digital infrastructure generates material positive externalities for banking-sector productivity. The core message is direct: returns to digital investment in emerging-market banking are not automatic. They are conditional on the alignment between firm-level capabilities and macro-level infrastructure. Understanding this conditioning empirically is a necessary step toward evidence-based policy on banking digitalization.


Author Contributions

Conceptualization, Y.N.N.; methodology, Y.N.N.; formal analysis, Y.N.N. and D.M.P.; data curation, D.M.P.; writing—original draft preparation, Y.N.N.; writing—review and editing, Y.N.N. and D.M.P.; supervision, D.M.P. All authors have read and agreed to the published version of the manuscript.

Funding

This research received no external funding.

Institutional Review Board Statement

Not applicable.

Informed Consent Statement

Not applicable.

Data Availability Statement

The bank-level data were obtained from the Bloomberg Terminal under license and are available from Bloomberg for subscribers; macro digital indicators are publicly available from APJII, the ITU, and Bank Indonesia. Derived data supporting the findings are available from the corresponding author upon reasonable request.

Conflicts of Interest

The authors declare no conflicts of interest.

Appendix A

Table A1. Principal component loadings for the macro digital infrastructure composite (Macro_Digital_PC1). 
IndicatorPC1 Loading
Internet penetration+0.543
Mobile cellular subscriptions (per 100)−0.341
Fixed broadband subscriptions (per 100)+0.541
Log electronic payment volume+0.544
Notes: First principal component of four standardized macro digital indicators (N = 10 yearly observations, 2015–2024). Eigenvalue = 3.254; the component explains 81.3 percent of total variance. Internet penetration, fixed broadband, and log electronic payment volume load positively; mobile cellular subscriptions load negatively, reflecting early mobile saturation and a subsequent plateau. Sources: APJII, ITU, Bank Indonesia.
Table A2. Descriptive statistics by KBMI tier. 
KBMI TierObs.AIS_IntensityROANIMEfficiency RatioNPL Gross
KBMI 11000.2690.0205.61973.6622.668
KBMI 2600.5100.3894.93073.8322.604
KBMI 3800.2931.3705.22152.5662.441
KBMI 4400.0892.3635.80746.8652.355
Notes: Firm-year means by regulator-defined KBMI tier (POJK 12/2021), 28 banks, 2015–2024. AIS_Intensity = recognized intangible assets/total assets × 100, in percent. The largest banks (KBMI 4) combine the lowest mean AIS intensity with the highest ROA and the lowest efficiency ratio, while mid-tier banks (KBMI 2) show the highest AIS intensity with weak profitability, consistent with transition-cost dynamics.
Table A3. Marginal effect of AIS intensity on the efficiency ratio across macro digital infrastructure levels. 
Macro Digital LevelMacro_Digital_PC1Approx. PeriodMarginal Effect of AIS on Efficiency Ratio
Minimum−2.6552015+14.29
25th percentile−2.4072016–17+13.65
Median0.431~2020+6.31
75th percentile1.6032022–23+3.28
Maximum2.2312024+1.65
Notes: Computed from the efficiency-ratio interaction model, with β_AIS = 7.42 and β_interaction = −2.587, evaluated at the mean-centered Macro_Digital_PC1. A higher efficiency-ratio value denotes worse efficiency. The marginal cost of AIS investment falls from +14.29 efficiency-ratio points at the 2015 minimum to +1.65 at the 2024 maximum, a model-implied contraction of approximately 88 percent.

References

  1. Aboody, D., & Lev, B. (1998). The value relevance of intangibles: The case of software capitalization. Journal of Accounting Research, 36, 161–191. [Google Scholar] [CrossRef] [Scilit]
  2. Arellano, M., & Bover, O. (1995). Another look at the instrumental variable estimation of error-components models. Journal of Econometrics, 68, 29–51. [Google Scholar] [CrossRef] [Scilit]
  3. Bank Indonesia. (2025). Indonesia payment system blueprint 2025. Bank Indonesia. [Google Scholar]
  4. Barth, M. E., Beaver, W. H., & Landsman, W. R. (2001). The relevance of the value relevance literature for financial accounting standard setting: Another view. Journal of Accounting and Economics, 31, 77–104. [Google Scholar] [CrossRef] [Scilit]
  5. Beccalli, E. (2007). Does IT investment improve bank performance? Evidence from Europe. Journal of Banking and Finance, 31, 2205–2230. [Google Scholar] [CrossRef] [Scilit]
  6. Berger, A. N. (2003). The economic effects of technological progress: Evidence from the banking industry. Journal of Money, Credit and Banking, 35, 141–176. [Google Scholar] [CrossRef] [Scilit]
  7. Bhimani, A. (2020). Digital data and management accounting: Why we need to rethink research methods. Journal of Management Control, 31, 9–23. [Google Scholar] [CrossRef] [Scilit]
  8. Blundell, R., & Bond, S. (1998). Initial conditions and moment restrictions in dynamic panel data models. Journal of Econometrics, 87, 115–143. [Google Scholar] [CrossRef] [Scilit]
  9. Boadi, I., Mawutor, J. K. M., Dzorka, M. A., & Kubaje, T. A. (2022). The productivity paradox of information technology: The Ghanaian bank-level evidence. The Electronic Journal of Information Systems in Developing Countries, 88, e12211. [Google Scholar] [CrossRef] [Scilit]
  10. Brynjolfsson, E. (1993). The productivity paradox of information technology. Communications of the ACM, 36, 66–77. [Google Scholar] [CrossRef] [Scilit]
  11. Brynjolfsson, E., & Hitt, L. M. (2000). Beyond computation: Information technology, organizational transformation and business performance. Journal of Economic Perspectives, 14, 23–48. [Google Scholar] [CrossRef] [Scilit]
  12. Buchak, G., Matvos, G., Piskorski, T., & Seru, A. (2018). Fintech, regulatory arbitrage, and the rise of shadow banks. Journal of Financial Economics, 130, 453–483. [Google Scholar] [CrossRef] [Scilit]
  13. Casolaro, L., & Gobbi, G. (2007). Information technology and productivity changes in the banking industry. Economic Notes, 36, 43–76. [Google Scholar] [CrossRef] [Scilit]
  14. Cevik, S. (2024). The dark side of the moon? fintech and financial stability. International Review of Economics, 71, 421–433. [Google Scholar] [CrossRef] [Scilit]
  15. Driscoll, J. C., & Kraay, A. C. (1998). Consistent covariance matrix estimation with spatially dependent panel data. Review of Economics and Statistics, 80, 549–560. [Google Scholar] [CrossRef] [Scilit]
  16. Egorov, A. (2023). Impact of intangible assets on bank performance in emerging capital markets: Evidence from Russia. Journal of Corporate Finance Research, 17, 44–53. [Google Scholar] [CrossRef] [Scilit]
  17. Faehndrich, J. (2023). A literature review on the impact of digitalisation on management control. Journal of Management Control, 34, 9–65. [Google Scholar] [CrossRef] [Scilit]
  18. Granlund, M. (2011). Extending AIS research to management accounting and control issues: A research note. International Journal of Accounting Information Systems, 12, 3–19. [Google Scholar] [CrossRef] [Scilit]
  19. He, S., Jin, Z., Hong, Y., Ma, L., Jiang, Y., & Chen, Y. (2025). The impact of digital transformation on commercial banks’ business performance: An empirical study of 39 listed commercial banks. SAGE Open, 15, 21582440251378869. [Google Scholar] [CrossRef] [Scilit]
  20. Ho, S. J., & Mallick, S. K. (2010). The impact of information technology on the banking industry. Journal of the Operational Research Society, 61, 211–221. [Google Scholar] [CrossRef] [Scilit]
  21. Hughes, J. P., & Mester, L. J. (2013). Who said large banks don’t experience scale economies? Evidence from a risk-return-driven cost function. Journal of Financial Intermediation, 22, 559–585. [Google Scholar] [CrossRef] [Scilit]
  22. Khan, H. H., Khan, S., & Ghafoor, A. (2023). Fintech adoption, the regulatory environment and bank stability: An empirical investigation from GCC economies. Borsa Istanbul Review, 23, 1263–1281. [Google Scholar] [CrossRef] [Scilit]
  23. Knudsen, D.-R. (2020). Elusive boundaries, power relations, and knowledge production: A systematic review of the literature on digitalization in accounting. International Journal of Accounting Information Systems, 36, 100441. [Google Scholar] [CrossRef] [Scilit]
  24. Korhonen, T., Selos, E., Laine, T., & Suomala, P. (2021). Exploring the programmability of management accounting work for increasing automation: An interventionist case study. Accounting, Auditing and Accountability Journal, 34, 253–280. [Google Scholar] [CrossRef] [Scilit]
  25. Lee, J. W., & Brahmasrene, T. (2024). The impacts of digital technology and governance on banking performance: Evidence from the ASEAN countries. Humanities and Social Sciences Communications, 11, 522. [Google Scholar] [CrossRef] [Scilit]
  26. Lev, B., & Sougiannis, T. (1996). The capitalization, amortization, and value-relevance of R&D. Journal of Accounting and Economics, 21, 107–138. [Google Scholar] [CrossRef] [Scilit]
  27. Liu, T.-L., Naveed, M. M., Mustafa, S., & Naveed, M. T. (2024). Analysing the impact of digital technology diffusion on the efficiency and convergence process of the commercial banking industry of Pakistan. Humanities and Social Sciences Communications, 11, 792. [Google Scholar] [CrossRef] [Scilit]
  28. Milgrom, P., & Roberts, J. (1995). Complementarities and fit: Strategy, structure, and organizational change in manufacturing. Journal of Accounting and Economics, 19, 179–208. [Google Scholar] [CrossRef] [Scilit]
  29. Mohammad, S., Alam, M. S., & Mushtaq, R. (2024). Role of financial inclusion in human development: Evidence from Bangladesh, India and Pakistan. Journal of the Knowledge Economy, 15, 3329–3354. [Google Scholar] [CrossRef] [Scilit]
  30. Möller, K., Schäffer, U., & Verbeeten, F. (2020). Digitalization in management accounting and control: An editorial. Journal of Management Control, 31, 1–8. [Google Scholar] [CrossRef] [Scilit] [PubMed]
  31. Nguyen-Thi-Huong, L., Nguyen-Viet, H., Nguyen-Phuong, A., & Van Nguyen, D. (2023). How does digital transformation impact bank performance? Cogent Economics & Finance, 11, 2217582. [Google Scholar] [CrossRef] [Scilit]
  32. OJK (Otoritas Jasa Keuangan). (2021). Regulation no. 12/POJK.03/2021 on commercial banks. OJK. [Google Scholar]
  33. OJK (Otoritas Jasa Keuangan). (2025). Indonesian banking statistics, December 2024. OJK. [Google Scholar]
  34. Petersen, M. A. (2009). Estimating standard errors in finance panel data sets: Comparing approaches. The Review of Financial Studies, 22, 435–480. [Google Scholar] [CrossRef] [Scilit]
  35. Pradhan, R. P., Arvin, M. B., Hall, J. H., & Bennett, S. E. (2018). Mobile telephony, economic growth, financial development, foreign direct investment, and imports of ICT goods: The case of the G-20 countries. Economia e Politica Industriale, 45, 279–310. [Google Scholar] [CrossRef] [Scilit]
  36. Quattrone, P. (2016). Management accounting goes digital: Will the move make it wiser? Management Accounting Research, 31, 118–122. [Google Scholar] [CrossRef] [Scilit]
  37. Roodman, D. (2009). How to do xtabond2: An introduction to difference and system GMM in Stata. The Stata Journal, 9, 86–136. [Google Scholar] [CrossRef] [Scilit]
  38. Wintoki, M. B., Linck, J. S., & Netter, J. M. (2012). Endogeneity and the dynamics of internal corporate governance. Journal of Financial Economics, 105, 581–606. [Google Scholar] [CrossRef] [Scilit]
  39. Yuan, D., Gazi, M. A. I., Harymawan, I., Dhar, B. K., & Hossain, A. I. (2022). Profitability determining factors of banking sector: Panel data analysis of commercial banks in South Asian countries. Frontiers in Psychology, 13, 1000412. [Google Scholar] [CrossRef] [Scilit] [PubMed]
  40. Zelalem, B. A., & Abebe, A. A. (2022). Does intangible assets affect the financial performance and policy of commercial banks in the emerging market? PLoS ONE, 17, e0272018. [Google Scholar] [CrossRef] [Scilit] [PubMed]
  41. Zhang, S. (2026). The influence of digital transformation on Chinese bank profitability performance. PLoS ONE, 21, e0340249. [Google Scholar] [CrossRef] [Scilit] [PubMed]
Figure 1. Conceptual model: Intangible investment, macro digital infrastructure, KBMI tier, and bank performance. Notes: H1 = direct effect (solid arrow). H2 = macro digital infrastructure moderation (dashed arrow, environmental layer). H3 = KBMI tier moderation (dashed arrow, organizational layer). KBMI = bank tiers based on core capital, classified under OJK Regulation 12/2021. Source: Authors’ own work.
Jrfm 19 00536 g001
Figure 2. Temporal evolution of intangible investment and macro digital infrastructure, 2015–2024. Notes: Mean AIS_Intensity computed across 28 commercial banks. Macro_Digital_PC1 is the standardized first principal component of four ICT infrastructure indicators. Source: Authors’ own work.
Jrfm 19 00536 g002
Figure 3. Marginal effect of intangible investment on the efficiency ratio across the macro digital trajectory. Notes: ME = β1 + β3 × Macro_PC1 from Equation (2). The 95 percent confidence band is computed via the delta method with Driscoll–Kraay standard errors. Source: Authors’ own work.
Jrfm 19 00536 g003
Figure 4. Effect of intangible investment on ROA across KBMI tiers. Notes: Each estimate comes from a separate two-way fixed-effects panel regression using the full set of controls. Horizontal bars indicate 95 percent confidence intervals. ** p < 0.05, *** p < 0.01. Source: Authors’ own work.
Jrfm 19 00536 g004
Table 1. Variable definitions and data sources.
VariableDefinition and MeasurementSourceRole
ROANet income/total assets × 100BloombergDV
NIMNet interest margin (%)BloombergDV
Efficiency RatioOperating expenses/operating income × 100; lower = more efficientBloombergDV
NPL GrossGross non-performing loans/total loans × 100OJK; bank reportsDV
AIS_IntensityIntangible assets/total assets × 100BloombergMain IV
AIS_Logln(intangible assets + 1) in IDR billionBloombergAlt. IV
Macro_Digital_PC1First principal component of four standardized digital indicators; 81.3% of varianceAPJII; ITU; BIMacro moderator
KBMIBank tier 1–4 under OJK Regulation 12/2021OJKFirm moderator
CARCapital adequacy ratio (%)BloombergControl
Ln_Total_AssetsNatural log of total assetsBloombergControl
Loan_to_AssetTotal loans/total assets × 100BloombergControl
Loan_GrowthYear-on-year loan growth (%)BloombergControl
GDP_GrowthReal GDP growth (%)BPSMacro control
InflationCPI inflation (%)BPSMacro control
BI_RateYear-end BI policy rate (%)BIMacro control
Notes: DV = dependent variable; IV = independent variable. All continuous variables are winsorized at the 1st and 99th percentiles. BPS = Statistics Indonesia; ITU = International Telecommunication Union; APJII = Indonesian Internet Service Providers Association; BI = Bank Indonesia. Source: Authors’ own work.
Table 2. Descriptive statistics (N = 280).
VariableMeanSDMinP25MedianMax
AIS_Intensity (%)0.3020.8630.0000.0000.0586.892
AIS_Log2.7692.8940.0000.0001.7958.860
ROA (%)0.8192.042−13.5720.3861.0944.650
NIM (%)5.3842.859−1.4983.8194.75221.636
Efficiency Ratio (%)63.84332.88233.84647.03956.693356.951
NPL Gross (%)2.5451.4250.0001.5452.41012.420
CAR (%)28.29820.9306.00019.11523.135169.920
Ln_Total_Assets10.9921.8816.2019.56010.87114.702
Loan_to_Asset (%)62.13210.61021.39056.58264.56086.950
Loan_Growth (%)13.33639.885−40.4502.0058.520491.320
Macro_Digital_PC10.0001.807−2.655−2.4070.4312.231
Notes: All continuous variables are winsorized at the 1st and 99th percentiles. Macro controls (GDP growth, inflation, BI Rate) are omitted from the table for brevity. Source: Authors’ own work.
Table 3. Pairwise Pearson correlations among the main variables (N = 280).
(1)(2)(3)(4)(5)(6)(7)(8)(9)
(1) AIS_Intensity1.00
(2) ROA−0.231.00
(3) NIM0.170.131.00
(4) Efficiency Ratio0.31−0.72−0.201.00
(5) NPL Gross−0.18−0.050.00−0.171.00
(6) CAR0.35−0.300.370.29−0.061.00
(7) Ln_Total_Assets−0.120.49−0.12−0.430.01−0.381.00
(8) KBMI−0.060.400.00−0.33−0.08−0.240.891.00
(9) Macro_Digital_PC10.15−0.01−0.150.000.050.210.160.001.00
Notes: Lower-triangular matrix of pairwise Pearson correlations. Correlations among explanatory variables exceeding |0.70| would warrant scrutiny; mean variance inflation factors across specifications remain below conventional thresholds. Source: Authors’ own work.
Table 4. Direct effects of intangible investment on bank performance (Equation (1)).
ModelDependent VariableCoefficientStd. Errorp-ValueResult
Model 1ROA−0.3070.2340.191Not significant
Model 2NIM+0.0650.4550.886Not significant
Model 3Efficiency Ratio+4.9873.0050.098 *Marginal (p < 0.10)
Model 4NPL Gross+0.0560.1090.608Not significant
Notes: Coefficient on AIS_Intensity. All models include bank fixed effects, year fixed effects, and the full set of controls. Standard errors are clustered at the bank level. * p < 0.10, ** p < 0.05, *** p < 0.01. Source: Authors’ own work.
Table 5. Macro digital moderation (Equation (2)).
VariableDV: ROADV: NIMDV: EfficiencyDV: NPL
AIS_Intensity (centered)−0.612 * (0.352)+0.155 (0.524)+7.422 *** (2.858)+0.072 (0.108)
Macro_Digital_PC1 (centered)−0.080 (0.098)+0.218 (0.135)+1.670 (1.260)+0.012 (0.041)
AIS × Macro_Digital+0.308 * (0.172)−0.041 (0.252)−2.587 *** (0.919)−0.014 (0.063)
Bank FE/Year FE/ControlsYes/No/YesYes/No/YesYes/No/YesYes/No/Yes
Observations/R2 (within)278/0.197278/−0.041278/0.315278/0.069
Notes: Cluster-robust standard errors at the bank level in parentheses. Year fixed effects are omitted because Macro_Digital_PC1 varies only across years. * p < 0.10, ** p < 0.05, *** p < 0.01. Source: Authors’ own work.
Table 6. Sub-sample estimation: AIS on ROA by KBMI tier (Equation (1)).
KBMI TierN Obs.Coefficient (SE)p-ValueResult
KBMI 1 (10 banks)99−0.569 (0.384)0.143Not significant
KBMI 2 (6 banks)59−1.664 (0.682)0.019 **Negative, significant
KBMI 3 (8 banks)80+0.312 (0.679)0.648Not significant
KBMI 4 (4 banks)40+3.951 (1.266)0.005 ***Positive, significant
Notes: Each row comes from a separate panel regression on the KBMI sub-sample, with the full control vector, bank fixed effects, and year fixed effects. Cluster-robust standard errors at the bank level in parentheses. * p < 0.10, ** p < 0.05, *** p < 0.01. Source: Authors’ own work.
Table 7. Robustness of the interaction coefficient (DV: Efficiency ratio).
Specificationβ3SEp-ValueResult
(1) Baseline (cluster-robust SE)−2.5870.9190.005 ***Anchor
(2) Driscoll–Kraay SE−2.5870.8160.002 ***Confirms
(3) AIS_Log alternative−0.6120.2320.011 **Confirms
(4) Pre-COVID 2015–2019 †+12.9715.9430.035 **Consistent
(5) Post-COVID 2020–2024 †−1.7304.6640.712Consistent
(6) Excluding ARTO outlier−2.4130.8760.008 ***Confirms
(7) System GMM−2.7121.1340.019 **Confirms
Notes: † For specifications (4) and (5), the reported coefficients are direct effects on the sub-sample (Equation (1)), not β3, because macro digital variation is limited within each sub-sample. For system GMM, the instrument count is 23 < N = 28; Hansen p = 0.387; AR(2) p = 0.234. * p < 0.10, ** p < 0.05, *** p < 0.01. Source: Authors’ own work.
Disclaimer/Publisher’s Note: The statements, opinions and data contained in all publications are solely those of the individual author(s) and contributor(s) and not of MDPI and/or the editor(s). MDPI and/or the editor(s) disclaim responsibility for any injury to people or property resulting from any ideas, methods, instructions or products referred to in the content.