Article

Macroeconomic Barriers to Green Bond Markets in the Majority World: A Cross-Country Panel Analysis


Department of Management Information Systems, Faculty of Economics and Administrative Sciences, İstinye University, Istanbul 34396, Türkiye
J. Risk Financ. Manag. 2026, 19(7), 531; https://doi.org/10.3390/jrfm19070531
Submission received: 17 June 2026 / Revised: 7 July 2026 / Accepted: 8 July 2026 / Published: 16 July 2026
(This article belongs to the Section Economics and Finance)

Abstract

Cities in the Majority World face a widening climate investment gap that is often attributed to the absence of suitable financing instruments. Green bonds promise to mobilise private capital for low-carbon urban infrastructure, yet they have diffused unevenly, leaving the economies with the greatest needs at the market’s margins. This study asks whether macroeconomic constraints—the cost of finance, monetary instability, and public indebtedness—systematically shape green bond issuance across emerging and developing economies. We assemble an original panel of 24 such economies over 2015–2024 (240 country-year observations) and estimate pooled ordinary least squares (OLS), random-effects, two-way fixed-effects, Tobit, and probit models with robust standard errors. The public debt-to-GDP ratio is positively associated with issuance in most specifications, though the strength of this relationship varies across estimators and it is not statistically significant in the preferred two-way fixed-effects model; the renewable energy share is consistently positive, while consumer price inflation shows no significant suppressive effect. A probit model of the extensive margin shows that public debt, the renewable energy share, and income per capita raise the probability of issuing among the economies for which the data permit estimation. The four lower-income Sub-Saharan economies in the sample fall outside this estimation owing to missing data, yet record no issuance whatsoever over the decade—a descriptive pattern consistent with the structural barriers the model identifies. The findings challenge the assumption that monetary stabilisation is a precondition for climate finance, pointing instead to capital-market depth and subnational fiscal capacity as the more binding constraints.

1. Introduction

The promise of green bonds rests on a simple proposition: that capital markets can be redirected toward climate-aligned infrastructure at the scale and speed the transition demands. Over little more than a decade, the instrument has moved from a niche experiment to a recognisable asset class, attracting issuers, underwriters, and investors who treat environmental labelling as a meaningful signal. The proceeds of these instruments are by design earmarked for environmentally beneficial projects, which distinguishes them from conventional debt and links their growth to the broader logic of climate finance (Dan & Tiron-Tudor, 2021). Yet the geography of that growth is profoundly uneven. The countries that hold the largest share of unmet climate investment needs, and that face the steepest physical exposure to climate risk, remain at the margins of the market. This article examines why, with particular attention to the cities of the Majority World on whose infrastructure the global transition disproportionately depends.
A note on terminology is warranted at the outset, because this study uses the term Majority World deliberately rather than as a loose synonym for its alternatives. We use Majority World to denote the low- and middle-income economies of Africa, Asia, and Latin America and the Caribbean that together account for the large majority of the world’s population—a framing that foregrounds demographic and developmental weight rather than the peripheral or deficit-based connotations carried by “less developed” or by the geographic shorthand “Global South.” The terms are not interchangeable: “emerging market and developing economies” is a specific institutional classification used by the International Monetary Fund; “Global South” is a geopolitical category; and “developing economies” is a development-status label. In operational terms, our sample is drawn from the IMF grouping of emerging market and developing economies (see Section 3.1), and we retain the institutional labels “emerging” and “developing economies” when referring to that classification or to prior literature that uses it. We adopt Majority World as the organising concept, however, because the paper’s concern is precisely the economies in which most of the world’s population, urban growth, and unmet climate-investment need are concentrated.
The framing matters. Much of the early scholarship treated green bonds as a financial innovation whose diffusion could be understood through pricing dynamics, investor preferences, and the existence or absence of a price premium for environmental labelling (Cheong & Choi, 2020; Zerbib, 2019). That literature has been productive, but it carries an implicit assumption that the conditions enabling issuance are broadly available once the right instruments and standards are in place. The experience of lower-income and emerging economies suggests otherwise. Here the binding constraints are frequently macroeconomic rather than micro-financial. Exchange rate volatility, sovereign risk premia, inflation, and the simple cost of borrowing shape whether a green bond can be priced at all, and whether it can compete with the alternative uses of scarce fiscal and institutional capacity (Ameli et al., 2021).
Consider the structural problem that frames the present study. A growing body of work argues that developing economies face a self-reinforcing dynamic in which the high cost of finance suppresses climate investment, which in turn keeps perceived risk elevated and finance costly (Ameli et al., 2021). This climate investment trap operates with a logic similar to that of a poverty trap, and it has direct consequences for any debt instrument intended to mobilise private capital for green projects. Green bonds do not escape this gravity. If the underlying cost of sovereign and corporate borrowing is high, the marginal benefit of a green label—whatever modest premium it may command—is unlikely to overcome the broader macroeconomic discount that investors apply. The market for resilient urban infrastructure across the Global South illustrates the gap starkly: the cost of achieving resilience dwarfs the public finance available, and the search for return-seeking capital has so far failed to close that distance at scale (Bigger & Webber, 2021; Climate Policy Initiative, 2016).
The existing literature has begun to map the determinants of green bond issuance, but its empirical centre of gravity sits in advanced and high-capacity markets. Studies of the European Union have related issuance levels to environmental, social, governance, and macroeconomic indicators, finding that credit rating, ESG scores, fiscal balance, and inflation significantly shape issuance volumes (Dan & Tiron-Tudor, 2021). Country-level analyses of China have traced the role of transnational governance and policy diffusion in building a domestic market almost from scratch (Elliott & Zhang, 2019). Work on India has emphasised institutional pressure and the adaptive capacity of market actors as drivers of early growth (Saravade & Weber, 2020). Regional accounts of Latin America and the Caribbean have documented rapid expansion—roughly USD 26 billion issued by 2020—while flagging an underexplored question about which conditions allow particular jurisdictions to issue (Mejía-Escobar et al., 2021). What these contributions share is an attention to enabling conditions; what they less often do is isolate the macroeconomic barriers that operate across many countries at once.
This is the gap the present study addresses. Rather than asking what explains issuance in a single high-capacity setting, the article asks what holds it back across the diverse set of economies sometimes grouped as the Majority World. The analytical wager is that a cross-country panel design can reveal whether macroeconomic constraints, rather than instrument design or investor taste, are the dominant binding factors outside the established markets. Several strands of evidence motivate this wager. Geopolitical risk has been shown to bear a measurable relationship to issuance values across countries (Mertzanis & Tebourbi, 2024). The post-pandemic environment compressed green investment globally and exposed how sensitive the instrument is to the prevailing risk and return field (Taghizadeh-Hesary et al., 2021). And comparative observations on green finance more broadly suggest that the procedures developed economies follow with relative ease are considerably harder to replicate in developing ones (Mumtaz & Smith, 2019).
Three questions organise the analysis that follows. First, which macroeconomic variables most strongly predict green bond issuance across emerging and developing economies? Second, do these macroeconomic effects dominate the institutional and demand-side factors emphasised in the existing literature? Third, what do the answers imply for the climate investment trap and for the design of policy that might loosen it? The study contributes to scholarship in three ways. It shifts the empirical lens from the advanced markets that dominate the field toward the economies where the financing need is most acute; it treats macroeconomic conditions not as control variables but as the central object of inquiry; and it introduces subnational fiscal autonomy as a candidate mediator of the macroeconomic transmission mechanism, connecting the green finance literature to the literature on fiscal decentralisation and municipal creditworthiness.
A clarification of scope is essential at the outset. Although the ultimate concern of this study is the financing of cities, our dependent variable measures national green bond issuance, because subnational issuance in the Majority World is too rare to support cross-country estimation—a scarcity we document in Section 3.2 and treat as a finding in its own right. We therefore frame the analysis explicitly as a study of the national enabling environment for green bond markets, on the argument that this environment is the upstream precondition for any subnational issuance. A municipality cannot issue a green bond into a market that does not exist domestically; the conditions that permit a sovereign or corporate green bond market to form—a green taxonomy, a certifying ecosystem, an investable asset pipeline, and investor familiarity—are the same conditions a city must inherit before it can issue in its own name. By identifying which macroeconomic and structural conditions allow national markets to form, we map the terrain that determines whether the financing of sustainable cities is even possible. We make this causal chain explicit in the discussion and illustrate it with the few subnational issuances that do exist.
The stakes of getting this right extend beyond academic tidiness. If green bonds are to play more than a symbolic role in the regions that need climate capital most, the conversation must move past the assumption that labelling and standardisation are sufficient. The evidence assembled here points toward a more nuanced conclusion than either techno-optimism or fatalism would suggest. The remainder of the paper proceeds as follows. Section 2 reviews the theoretical and empirical literature and develops the study’s hypotheses. Section 3 describes the data and methods. Section 4 presents the results. Section 5 discusses their implications for urban climate finance policy. Section 6 concludes the paper.

2. Literature Review

2.1. Theoretical and Conceptual Foundations

A green bond is a fixed-income instrument whose defining feature is the earmarking of proceeds for environmentally beneficial projects, a use-of-proceeds commitment that distinguishes it from conventional debt and ties its development to certification standards, second-party opinions, and a credible pipeline of qualifying assets (Dan & Tiron-Tudor, 2021). The market has grown from a niche experiment into a recognisable asset class, and much of the early scholarship sought to understand that diffusion through pricing dynamics—most prominently the “greenium,” the modest but persistent yield advantage at which green bonds trade relative to otherwise comparable conventional bonds (Karpf & Mandel, 2018; Zerbib, 2019; Gianfrate & Peri, 2019; Baker et al., 2022). This pricing literature has been productive, but it carries an implicit assumption that the conditions enabling issuance are broadly available once instruments and standards are in place—an assumption that the experience of lower-income economies calls into question and that motivates a shift in analytical attention from micro-financial pricing to the macro-structural conditions of market formation.
The macroeconomic foundations of this study rest on the climate-investment-trap mechanism, in which a high cost of finance suppresses climate investment, which in turn keeps perceived risk elevated and finance costly, producing a self-reinforcing equilibrium analogous to a poverty trap (Ameli et al., 2021). Within this framework, monetary instability and sovereign risk premia are expected to deter issuance, while public indebtedness carries a theoretically ambiguous sign: elevated debt may crowd out new issuance, or it may incentivise governments to seek the broader, ESG-oriented investor base and the reputational and market-access benefits that green labelling confers (Ando et al., 2022). A competing strand emphasises that green bonds in these markets are predominantly denominated in foreign currency and priced against global liquidity conditions, so that the real burden of debt service may be partly insulated from domestic monetary dynamics (Shin, 2014; Arslanalp & Tsuda, 2014). These opposing mechanisms make the net macroeconomic effect an empirical question rather than a settled one.
A second conceptual pillar concerns the structural and supply-side prerequisites of issuance. Labelled instruments require an underlying portfolio of certifiable green projects; the depth of a country’s renewable-energy base therefore proxies the pipeline of qualifying assets on which issuance depends (Tolliver et al., 2020). This supply-side logic connects to the broader energy-transition literature and to the intuition, associated with the renewable-energy variant of the environmental Kuznets curve, that the renewable share of the energy mix tends to rise with income and structural development—so that the same conditions that deepen capital markets also expand the certifiable green-asset base. Disclosure quality and financial development are expected to ease issuance by reducing information asymmetries (Steuer & Tröger, 2022). Finally, because the ultimate concern of this study is the financing of cities, the literature on subnational fiscal capacity and municipal creditworthiness is directly relevant: developing-country municipalities face weak credit-rating infrastructure, shallow local capital markets, and underdeveloped municipal-finance frameworks that constrain participation independently of national macroeconomic conditions (Climate Policy Initiative, 2016; Herrera, 2024; Asian Development Bank, 2024).

2.2. Empirical Literature and Hypothesis Development

Empirical work on the determinants of green bond issuance has expanded rapidly, but its centre of gravity remains in advanced and high-capacity markets. Analyses of the European Union relate issuance to environmental, social, governance, and macroeconomic indicators, finding that credit rating, ESG scores, fiscal balance, and inflation shape issuance volumes (Dan & Tiron-Tudor, 2021). Country studies trace the role of transnational governance in building China’s market almost from scratch (Elliott & Zhang, 2019) and the institutional pressures driving early growth in India (Saravade & Weber, 2020); regional accounts document rapid expansion in Latin America and the Caribbean (Mejía-Escobar et al., 2021) Broader cross-country work links issuance to geopolitical risk (Mertzanis & Tebourbi, 2024), to survey-elicited issuer motivations beyond the greenium (Sangiorgi & Schopohl, 2021), and to energy-related sustainable-development outcomes in emerging market and developing economies (Novák & Ge, 2025), while methodological work cautions that dynamic panel estimators such as system GMM tend to proliferate instruments and perform unreliably in the short panels typical of developing-country samples (Roodman, 2009). What these contributions share is an attention to enabling conditions; what they less often do is isolate the macroeconomic barriers that operate across many countries at once—the gap this study addresses.
A further feature of issuance in the Majority World concerns the identity of the issuer and the instrument’s legal form. Sovereign issuance is often more pivotal than corporate issuance in opening these markets, and in several predominantly Muslim economies the leading instrument is not the conventional green bond but the green sukuk—a Shari’ah-compliant structure frequently marketed to international investors. Indonesia is the paradigmatic case: its sovereign green issuance has been dominated by green sukuk floated on international markets, and recent evidence shows that bond characteristics and macroeconomic factors affect government-issued and corporate-issued green instruments differently (Endri et al., 2025). This distinction matters for the present design. Because our dependent variable aggregates issuance to the national level, it encompasses sovereign and corporate issuance and both conventional green bonds and green sukuk; we therefore interpret our estimates as describing the national enabling environment rather than the behaviour of any single issuer type, and we return to the sovereign-versus-corporate composition in the discussion.
Drawing these theoretical and empirical strands together, and in alignment with the empirical model specified in Section 3.4, we test four hypotheses. The climate-investment-trap and market-access channels yield competing expectations for public debt; we state the hypothesis in the direction implied by the green-label-as-market-access mechanism. H1: the public debt-to-GDP ratio is positively associated with green bond issuance. H2: monetary instability—consumer price inflation and its volatility—is negatively associated with issuance. H3: a larger renewable-energy share, proxying the depth of the certifiable green-asset pipeline, is positively associated with issuance. H4 (exploratory): greater subnational fiscal autonomy buffers the inflation channel, so that the marginal effect of inflation on issuance becomes less negative as fiscal autonomy rises. Hypotheses H1–H3 correspond to the coefficients on debt, the monetary variables, and the renewable share in Equation (1), while H4 corresponds to the interaction term in Equations (2) and (3); given the data limitations documented in Section 3.3, H4 is examined on an exploratory basis.

3. Materials and Methods

This study analyses how macroeconomic conditions constrain the development of green bond markets across countries in the Majority World. It adopts a cross-country panel design that treats green bond issuance as the outcome of a configuration of structural financial and monetary conditions rather than the product of policy intent alone. The empirical strategy follows a tradition in which the determinants of green bond issuance are modelled through macroeconomic and institutional covariates, an approach already established for advanced and integrated markets such as the European Union (Dan & Tiron-Tudor, 2021; Tolliver et al., 2020). The present article extends that logic to economies where capital is scarcer, currencies weaker, and external financing conditions more volatile.

3.1. Sample and Scope

As set out in the Introduction, this study uses the term Majority World deliberately, not as a loose synonym for “emerging” or “developing economies”: it foregrounds the low- and middle-income economies that account for most of the world’s population and in which the unmet urban climate-investment need is concentrated. The sample defined here operationalises exactly that concept. The sample comprises 24 emerging market and developing economies, broadly consistent with the country groupings used in recent green finance research on these regions (Novák & Ge, 2025). Country selection reflects two practical constraints. First, an economy must either have recorded at least one labelled green bond issuance during the observation window, or possess sufficient macroeconomic data coverage to serve as a meaningful non-issuing comparator, so that the analysis captures both the extensive and intensive margins of issuance. Second, sufficient macroeconomic data must be available to populate the explanatory variables without extensive interpolation. Regional coverage spans Latin America and the Caribbean (Argentina, Brazil, Chile, Colombia, Costa Rica, Mexico, Panama, Peru); the broader Europe–Middle East–Africa grouping (Egypt, Kenya, Morocco, Nigeria, South Africa, Turkey); emerging and developing Asia-Pacific (Bangladesh, India, Indonesia, Philippines, Thailand, Vietnam); and Sub-Saharan Africa (Ghana, Rwanda, Senegal, Tanzania). Other Sub-Saharan economies that issued over the period—South Africa, Kenya, and Nigeria—appear, alongside Egypt, Morocco, and Turkey, within the broader Europe–Middle East–Africa category. The choice deliberately mirrors prior regional mappings, including the observation that Latin America and the Caribbean had issued roughly USD 26 billion in green bonds by 2020 (Mejía-Escobar et al., 2021).
The observation period, 2015–2024, covers the years during which green bond markets moved from a niche instrument to a recognisable asset class, beginning with the year of the Paris Agreement. This window matters analytically. Earlier determinant studies note that issuance behaviour differs sharply between early entrants and later adopters, partly because pioneers operated without external support during the market’s formative years (Sangiorgi & Schopohl, 2021). Treating the full period as homogeneous would obscure that dynamic. The present study therefore allows for time effects that absorb the secular growth of the global market. The resulting panel comprises 240 country-year observations.
A clarification of the estimation samples is in order, because this full panel of 240 country-year observations is larger than the samples on which the regression models in Section 4.3 are estimated. The models use listwise deletion, and the binding constraint is the renewable-energy-share variable, which is observed for only 16 of the 24 countries (160 of 240 observations). Requiring this variable alone removes eight countries at a stroke—Costa Rica, Ghana, Kenya, Nigeria, Panama, Rwanda, Senegal, and Tanzania. Within the sixteen remaining countries, missing values on the other covariates (chiefly GDP per capita, inflation volatility, and climate vulnerability) remove a further 50 observations, producing the broad estimation sample of 110 observations across 16 countries used in Models 1–3 and 6 and in the probit. The subnational fiscal-autonomy variable is observed for only 13 countries (100 observations); requiring it in addition reduces the restricted sample used in Models 4, 5, and 7 to 62 observations across 9 countries. The descriptive statistics and the regional breakdown draw on all available data and therefore retain the full 24-country panel; the gap between the descriptive and the estimation samples is thus entirely a function of covariate coverage, not of any selection on the outcome (every country with green bond data is retained wherever the covariates permit). We flag this explicitly because it bears directly on interpretation: any result that depends on the renewable-energy-share variable necessarily excludes the lowest-income economies in the sample—including the four Sub-Saharan economies that record no issuance—a point we return to in Section 4.4 and the Limitations and Future Research section.

3.2. The Subnational Dimension and a Data Limitation

The motivating concern of this study is the financing of cities, and the ideal dependent variable would be subnational—municipal or provincial—green bond issuance. Here we confront a fundamental constraint that is itself a finding. Subnational green bond issuance in the Majority World remains exceptionally rare. Across the entire Green Bond Transparency Platform, only a handful of local-government green bonds appear within our sample: Mexico City (2016–2018) and the Argentine municipalities of Córdoba and Godoy Cruz (2022–2023). This pattern is consistent with the wider literature: Herrera (2024) documents only nine municipal green bonds issued across all of Africa and Latin America over 2014–2023, and the Climate Policy Initiative (2016) noted that Johannesburg’s 2014 bond was for years the sole municipal green bond from any developing-country city. The scarcity reflects the well-documented creditworthiness constraints facing developing-country municipalities, fewer than 20% of which can access local capital markets and only 4% of which are deemed creditworthy enough for international markets (Climate Policy Initiative, 2016); where municipal green issuance has occurred in emerging Asia, it has depended heavily on advisory support and lending from development finance institutions rather than on independent market access (Asian Development Bank, 2024).
Consequently, the dependent variable in our primary analysis is total national green bond issuance rather than municipal issuance specifically. This is a deliberate and necessary choice: it allows us to identify the macroeconomic and structural conditions under which a green bond market develops at all—the very conditions that must be present before subnational issuance becomes feasible. We treat the national enabling environment as the upstream determinant of subnational possibility, and we return in the discussion to what this implies for cities directly.

3.3. Variables and Measurement

The dependent variable is the annual value of green bond issuance by entities domiciled in each country, measured in USD millions and sourced from the KAPSARC Green Bond Issuances database (KAPSARC, 2024), supplemented for subnational issuances by the Green Bond Transparency Platform (GBTP, 2024). Because issuance is highly skewed and frequently zero, the variable enters as log(1 + volume), a standard transformation that accommodates zero observations while permitting a semi-elasticity interpretation. Zero-issuance observations—57.5% of country-year pairs—are retained to capture both the decision to issue and the volume of issuance.
The explanatory variables fall into three groups. The first captures the domestic macro-fiscal environment that prior work identifies as central to climate-related investment. Following the climate-investment-trap mechanism (Ameli et al., 2021), we include consumer price inflation (annual percentage change) and its three-year rolling standard deviation as a measure of monetary uncertainty, alongside the gross public debt-to-GDP ratio. The debt ratio carries a theoretically ambiguous sign: higher debt may crowd out new issuance, or it may incentivise governments to seek the broader investor base and reputational benefits that green labelling provides (Ando et al., 2022). All macroeconomic data are drawn from the IMF World Economic Outlook database, April 2026 vintage (International Monetary Fund, 2026).
The second group reflects structural and institutional capacity. We include the share of renewable energy in total energy consumption, which proxies the depth of the certifiable green-asset pipeline on which labelled issuance depends (Tolliver et al., 2020), sourced from the Our World in Data energy repository. Financial development and the disclosure environment are expected to ease issuance by reducing information asymmetries (Steuer & Tröger, 2022); we proxy the broader development level with log GDP per capita (purchasing power parity, PPP-adjusted).
We additionally examine subnational fiscal autonomy on an exploratory basis, measured as the ratio of local-government to general-government financial assets and normalised to a 0–100 scale, derived from the IMF Government Finance Statistics dataset via the World Bank (2024) Data360 platform. Two caveats apply. First, this proxy is constructed from financial-asset stocks rather than the revenue or expenditure shares that are standard in the fiscal-federalism literature, and should be read as a coarse indicator of local fiscal weight rather than autonomy in a strict sense. Second, it is observed for only 41.7% of country-years (nine countries with usable time series). For these reasons we do not treat fiscal autonomy as a confirmatory variable; the specifications that include it (Models 4, 5, and 7) are exploratory and reported for completeness rather than as tests of a central hypothesis.
The third group captures climate exposure. We include the climate vulnerability score derived from the Notre Dame Global Adaptation Initiative Country Index (ND-GAIN, 2024), computed as 100 minus the ND-GAIN score so that higher values denote greater vulnerability. As an exploratory extension, we add an interaction term between inflation and subnational fiscal autonomy to probe whether fiscal decentralisation might condition the inflation channel, with a hypothesised negative sign; given the data limitations noted above, we interpret this term cautiously. Table 1 summarises the definitions, measurement, sources, and role of all variables used in the analysis.

3.4. Empirical Specification

Let the latent propensity of country i in year t to issue green debt be a linear function of the macroeconomic, structural, and climate covariates described above. The baseline panel model is specified as:
y i t = β 0 + β 1 I N F i t + β 2 V O L i t + β 3 D E B T i t + β 4 V U L N i t + β 5 l n G D P i t + β 6 R E N i t + μ i + λ t + ε i t
where yit = ln(1 + GreenBondit) is the log-transformed annual issuance volume; INF is consumer price inflation; VOL is inflation volatility; DEBT is the public debt-to-GDP ratio; VULN is climate vulnerability; lnGDP is log GDP per capita; REN is the renewable energy share; μi denotes country effects; λt denotes year effects; and εit is the idiosyncratic error. The Pooled OLS estimator (Model 1) restricts μi = λt = 0. The random-effects estimator (Model 2) treats μi as a random draw uncorrelated with the regressors, E[μi|Xit] = 0, while the two-way fixed-effects estimator (Model 3) allows arbitrary correlation between μi and the covariates and additionally sweeps out common time shocks λt, including the COVID-19 contraction that compressed green investment worldwide (Taghizadeh-Hesary et al., 2021).
To test whether fiscal decentralisation mediates the transmission of monetary instability, the restricted-sample specifications (Models 4 and 5) augment Equation (1) with subnational fiscal autonomy FAit and its interaction with inflation:
y i t = β 0 + β 1 I N F i t + β 2 V O L i t + β 3 D E B T i t + β 4 V U L N i t + β 5 l n G D P i t + β 6 R E N i t + γ F A i t + δ I N F i t × F A i t + μ i + λ t + ε i t
In Equation (2) the marginal effect of inflation on issuance is no longer constant but depends on the level of fiscal autonomy:
y i t I N F i t = β 1 + δ F A i t
A negative δ would indicate that greater subnational fiscal autonomy buffers green bond markets against the suppressive effect of inflation, while a positive β1 combined with δ ≈ 0 would imply that fiscal structure does not condition the inflation channel.

3.5. Censored Regression and Estimator Selection

We report a suite of estimators rather than a single preferred model, and the rationale is methodological rather than presentational. The dependent variable combines two features that no single estimator handles cleanly: it is left-censored, because a majority of country-years record exactly zero issuance, and it is generated by a panel, so that unobserved country heterogeneity may be correlated with the regressors. Each estimator addresses a different facet of this structure and serves as a robustness check on the others. Pooled OLS (Model 1) offers a transparent benchmark but ignores both censoring and heterogeneity; the random-effects (Model 2) and two-way fixed-effects (Model 3) estimators model country heterogeneity under progressively weaker assumptions, with the Hausman test adjudicating between them; the Tobit estimators (Models 6 and 7) explicitly model the censoring at zero that would otherwise bias the linear estimators; and the probit isolates the extensive margin—the decision to issue at all—which the volume models pool with the intensive margin. The objective in presenting the full set is to let the reader see which conclusions are robust to the choice of estimator and which are specification-dependent: convergence of a result across linear, censored, and panel-censored estimators is treated as evidence that it is not an artefact of any single modelling assumption.
Because 57.5% of country-year observations record zero issuance, the dependent variable is left-censored at zero: for non-issuing observations we observe only that the latent issuance propensity y*it falls below the issuance threshold, not its true value. Ordinary least squares applied to such data yields inconsistent estimates (Tobin, 1958). We therefore estimate a Type I Tobit model in which the observed outcome relates to the latent variable as:
y i t = y i t * if   y i t * > 0 , and y i t = 0 otherwise
The model is estimated by maximum likelihood, with the log-likelihood combining the density for uncensored observations and the cumulative probability mass for censored ones:
l n L = uncensored l n 1 σ φ y i t x i t β σ + censored l n Φ x i t β σ
where φ(·) and Φ(·) are the standard normal density and distribution functions. We estimate both a pooled Tobit (Models 6 and 7) and, to respect the panel structure, a random-effects Tobit in which a country-specific term enters the latent equation and is integrated out by 12-point Gauss–Hermite quadrature. Because the dependent variable mixes an extensive margin (whether a country issues at all) with an intensive margin (how much), we additionally estimate a probit model of the binary issuance decision, reporting average marginal effects (Wooldridge, 2010). The probit directly addresses the most policy-relevant fact in the data—that some regions never enter the market—which the volume models alone cannot isolate.
To choose between the random-effects and fixed-effects specifications, we apply the Hausman (1978) test of the null hypothesis that country effects are uncorrelated with the regressors. The test statistic is:
H = β ^ F E β ^ R E V a r β ^ F E V a r β ^ R E 1 β ^ F E β ^ R E
For the broad-sample specification, the test yields H = 19.83 (k = 6, p = 0.003), rejecting the null and indicating that country effects are systematically correlated with the regressors. The two-way fixed-effects estimator (Model 3) is therefore the preferred inference model for volume, with random effects and Pooled OLS reported as complementary specifications. To address the concern that the debt–issuance association might reflect reverse causality, we re-estimate the model with the debt ratio and other regressors lagged by one year. To verify that results are not driven by the two hyperinflationary outliers, we re-estimate the broad-sample models excluding Argentina and Turkey. Standard errors are clustered at the country level for Models 1, 4, and 5, and are heteroskedasticity-robust for the random-effects and two-way fixed-effects Models 2 and 3, since clustering on the small number of countries in the panel can yield unreliable variance estimates. The Tobit (Models 6 and 7) and probit models are estimated by maximum likelihood and report conventional asymptotic standard errors, which are not clustered; this is stated in the notes to Tables 5 and 6. We note that the modest panel size precludes dynamic estimators such as system generalised method of moments (GMM) that would otherwise model issuance persistence; we return to this in the limitations. All estimations were carried out in Python 3.10 using the pandas, numpy, scipy, statsmodels, linearmodels, and matplotlib libraries; the complete code and the analysis panel are provided in the replication package accompanying this article; which is available online as Supplementary Materials (see the Data Availability Statement).

4. Results

4.1. Descriptive Statistics

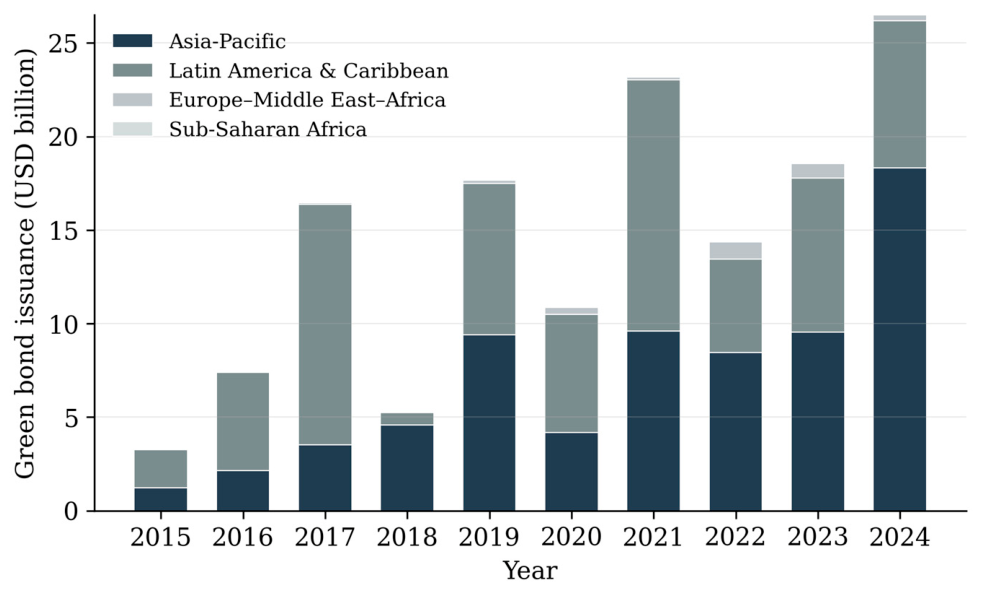
Table 2 reports descriptive statistics for the full panel. Mean annual green bond issuance is USD 598 million, with a standard deviation of USD 1,391 million and a median of zero, reflecting both the high concentration of issuance among a few large markets and the large fraction of non-issuing country-years. Aggregate annual issuance across the sample grew nearly eightfold over the decade, from USD 3.3 billion in 2015 to USD 26.5 billion in 2024 (Figure 1), with the strongest years in 2021 (USD 23.2 billion) and 2024. India, Indonesia, Chile, and Mexico are the largest cumulative issuers, together accounting for roughly 65% of the sample total of USD 143.6 billion.
Mean consumer price inflation is 9.1%, but with extreme values driven by Argentina (peaking near 220% in 2023–2024) and Turkey (72% in 2022). Mean public debt stands at 54.5% of GDP. The climate vulnerability index averages 53.4 on its 0–100 scale. Subnational fiscal autonomy data are available for 100 of 240 observations and average 14.9%, indicating that local governments in these economies control a comparatively small share of public financial assets—consistent with the centralised fiscal structures documented in the municipal finance literature (Herrera, 2024).
Table 3 reports the pairwise correlations among the variables. Two features warrant note. Inflation and its volatility are very highly correlated (r = 0.95), so their individual coefficients cannot be cleanly separated when both enter the same specification; we therefore treat them only as alternative proxies for monetary instability and, in Section 4.3, re-estimate the models with each measure entered on its own as a robustness check; and climate vulnerability is strongly negatively correlated with income per capita (r = −0.81), reflecting that the poorer economies in the sample are also the most climate-exposed. No other pair approaches a level that would raise serious multicollinearity concerns. Among the regressors, issuance is most strongly correlated with income per capita (r = 0.35) and the renewable energy share (r = 0.19), foreshadowing the regression results.

4.2. Regional Heterogeneity

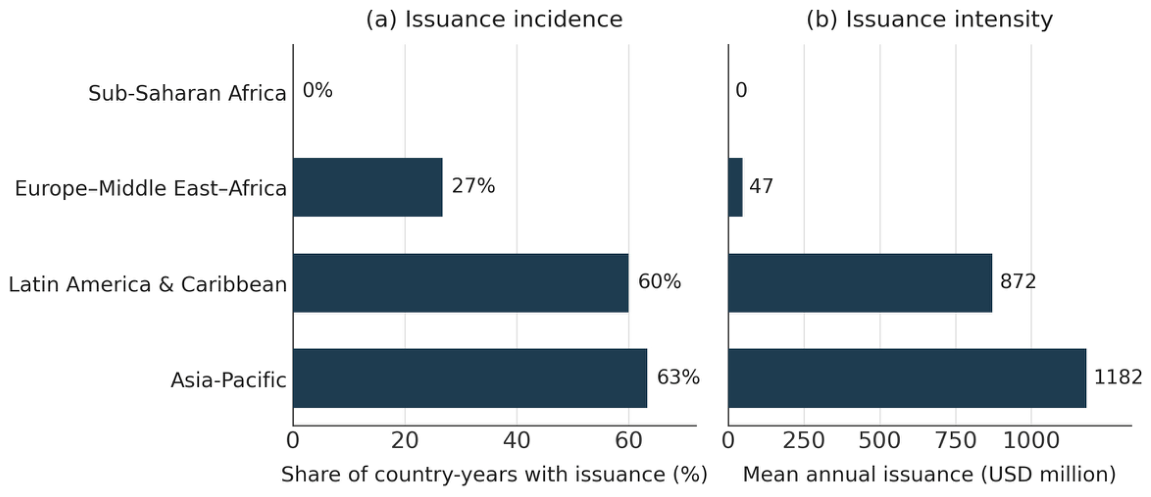
Table 4 and Figure 2 disaggregate issuance by region and reveals stark divergence. Asia-Pacific records the highest issuance rate (63.3% of observations) and mean volume, driven by India, Indonesia, and the Philippines. Latin America follows closely (60.0%). The Europe–Middle East–Africa grouping issues in only 26.7% of observations, while the four lower-income Sub-Saharan African countries recorded no green bond issuance whatsoever over the decade—despite facing the highest climate vulnerability scores in the dataset. This juxtaposition, of greatest need and least market access, is the empirical signature of the structural barriers that precede macroeconomic considerations, and it foreshadows our central interpretive claim.
The Europe–Middle East–Africa results merit closer attention because they complicate a simple inflation story. Turkey, despite recording the second-highest inflation in the sample, issued no green bonds at the national level over the period, while South Africa—with far lower inflation but comparable institutional development—accounted for almost the entire regional total of USD 2.5 billion. The contrast suggests that issuance presence is governed less by the level of monetary instability than by the depth of market infrastructure and the existence of an investable pipeline.

4.3. Panel Regression Results

Table 5 presents the seven model specifications, comprising the linear panel estimators (Models 1–5) and the censored Tobit estimators (Models 6–7). Several findings are robust across the panel.
First, the public debt-to-gross-domestic-product (GDP) ratio is positive in all seven specifications and statistically significant in five of them, ranging from 0.026 in the Pooled OLS baseline to 0.133 in the Tobit specification with fiscal autonomy. The strength of the association is not uniform across estimators, however. It is significant at conventional levels in Models 1, 2, 4, 5, and 7—though only marginally so in Models 1 and 5 (p < 0.10)—whereas in the preferred two-way fixed-effects model (Model 3: 0.032, p > 0.10) and in the broad pooled Tobit (Model 6), the coefficient remains positive but is not statistically significant. The Hausman test reported in Section 3.5 (H = 19.83, p = 0.003) identifies the fixed-effects estimator as preferred over random effects; in that specification the debt coefficient stays positive but is not individually distinguishable from zero, indicating that the result rests primarily on between-country rather than within-country variation. We therefore characterise the relationship as predominantly positive, but not equally strong across all specifications. It is nonetheless robust in sign: when the debt ratio is lagged by one year, the relationship remains positive and significant (0.058, p = 0.009), which weakens—though it cannot fully eliminate—a reverse-causality interpretation in which the capacity to issue drives debt accumulation. We are nonetheless cautious about causal language. The conditional association is consistent with at least two non-exclusive readings: a behavioural channel, in which governments facing elevated conventional borrowing costs use the green label as a credibility and market-access mechanism that taps ESG-oriented investor pools (Baker et al., 2022; Zerbib, 2019); and a market-development channel, in which the same institutional depth that sustains a sovereign debt market also enables green issuance, so that debt and issuance are jointly determined by an unobserved third factor. Our design cannot adjudicate between these, and we therefore describe the finding as a robust association rather than a demonstrated mechanism. Either reading resonates with the recent appearance of sovereign sustainability-linked instruments in Chile and Egypt and with the climate-vulnerability-debt-trap dynamic that the Inter-American Development Bank identifies in fiscally constrained economies (Inter-American Development Bank [IDB], 2025).
Second, renewable energy share is positive and significant in Models 2, 3, and 5 (0.085, 0.324, and 0.371 respectively). Countries further along their energy transition generate a larger pipeline of certifiable green assets, which supports market development—consistent with the supply-side theory of issuance, in which a labelled instrument requires an underlying portfolio of qualifying projects (Tolliver et al., 2020).
Third, and contrary to theoretical expectation, consumer price inflation exhibits no statistically significant suppressive effect in the broad-sample specifications (all p > 0.25). In the restricted sample with fiscal autonomy, the inflation coefficient is negative in Models 4, 5, and 7, but it is statistically significant in only one of them—the Tobit Model 7 (p < 0.01)—while remaining insignificant in the linear Models 4 and 5. The more accurate statement, therefore, is that the negative relationship appears in the restricted specification but is significant in only one of the relevant models. Because this sub-sample is in any case dominated by the two hyperinflationary outliers, Argentina and Turkey, even that isolated result should be read as specific to extreme monetary regimes rather than general. The interaction term (INF × FA) is statistically insignificant throughout, and by Equation (3) this implies that the marginal effect of inflation does not vary systematically with subnational fiscal autonomy in our data. The broad-sample null is consistent with the foreign-currency-denomination hypothesis: because green bonds in Majority World markets are predominantly issued in USD or EUR and priced against global liquidity conditions (Shin, 2014; Arslanalp & Tsuda, 2014), the real burden of debt service is insulated from domestic monetary dynamics.
Because inflation and its volatility are highly collinear (r = 0.95), their individual coefficients are difficult to interpret when both enter the same specification, and the volatility coefficient in particular is unstable in sign across models. As a robustness check, we re-estimated the broad two-way fixed-effects model with the two monetary measures entered one at a time. The substantive conclusions are unaffected. The renewable-energy-share coefficient remains positive and of similar magnitude (0.30 with inflation only and 0.31 with volatility only, against 0.32 when both are included), and public debt remains positive and statistically insignificant in the fixed-effects specification throughout. Each monetary measure enters with a negative sign when included on its own—consistent with the direction hypothesised in H2—but neither is statistically significant (inflation alone: −0.035, p = 0.07; volatility alone: −0.052, p = 0.18). The high collinearity therefore inflates the instability of the individual monetary coefficients without altering the study’s central findings; we retain the joint specification in Table 5 for comparability with the wider literature, but interpret inflation and its volatility only as alternative proxies for the same underlying construct of monetary instability.
Fourth, subnational fiscal autonomy enters with a statistically insignificant coefficient in every specification in which it appears. This must be read cautiously given the low coverage (41.7%) and small effective sample (nine countries). We treat this as a data-constrained null rather than evidence of no relationship. Climate vulnerability shows no significant association with issuance volume in the preferred specifications (though it enters negatively and significantly in the random-effects Tobit, suggesting that more vulnerable economies issue less). We lack proceeds-allocation data and therefore offer only a conjecture for the volume null: green bond proceeds in these markets may flow predominantly to mitigation rather than adaptation, and more vulnerable economies tend to have shallower capital markets irrespective of their climate profile (Herrera, 2026). We flag this interpretation as speculative pending project-level data.
The Tobit estimates (Models 6 and 7), which explicitly model the censoring of the 57.5% of observations at zero issuance, reproduce the qualitative pattern of the linear models. A random-effects Tobit that respects the panel structure (integrating a country-specific term out by Gauss–Hermite quadrature) improves substantially on the pooled fit (log-likelihood −212.4 versus −233.4), confirming that country heterogeneity matters; in this specification renewable energy share remains strongly significant (0.256, p < 0.001) while debt is positive but imprecisely estimated (0.025, p = 0.285). The consistency of the renewables and inflation findings across linear, censored, and panel-censored estimators provides reassurance that they are not artefacts of the treatment of zero-issuance observations.
Robustness to outliers. Because Argentina and Turkey contribute the sample’s extreme inflation values, we re-estimate the broad-sample models excluding both. The central results are unchanged: in the random-effects specification, debt remains positive and significant (0.052, p = 0.050) and renewable share positive (0.072), while in the two-way fixed-effects specification, renewable share is strongly significant (0.464, p = 0.013). Inflation remains insignificant throughout. This addresses the concern that the negative inflation coefficient observed in the restricted nine-country sample is an outlier artefact rather than a general feature; once the hyperinflationary cases are removed, no systematic inflation effect survives in any specification.

4.4. The Extensive Margin: Who Issues at All?

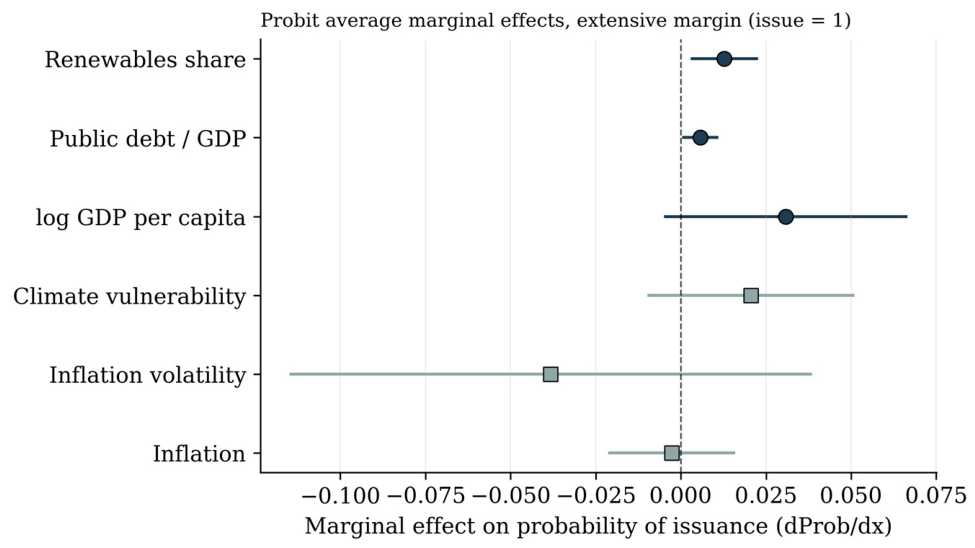
The volume models pool two distinct decisions—whether to enter the market and how much to issue—yet the most striking pattern in the data concerns the first. We therefore estimate a probit model of the binary issuance decision (full results in Table 6 and the replication package). Three covariates significantly raise the probability of issuing. A one-percentage-point increase in the debt ratio raises the issuance probability by 0.6 percentage points (p = 0.018); a one-point increase in renewable energy share raises it by 1.3 points (p = 0.007); and higher income per capita is positively associated with market entry (p = 0.089). Inflation and inflation volatility have no significant effect on the decision to issue. These average marginal effects describe the economies that enter the estimation, and an important caveat follows. The four lower-income Sub-Saharan economies in the sample (Ghana, Rwanda, Senegal, and Tanzania) are not part of the probit sample: they drop out because the renewable-energy-share variable is unobserved for them throughout the period (see Section 3.1 and the full probit results in Table 6). The model therefore cannot, by construction, explain the behaviour of these four countries directly. What it does establish is the structural profile that predicts market entry among the sixteen countries it covers—a low probability of issuing where income, the renewable-asset pipeline, and capital-market depth are shallow and where the monetary variables are immaterial. The complete non-issuance of the four Sub-Saharan economies, documented descriptively in Table 4, is consistent with this profile and with the municipal-finance literature, but it is best read as an out-of-sample pattern that the model rationalises rather than as a direct estimation result. Interpreted in this way, the barrier to entry is structural and developmental rather than monetary.
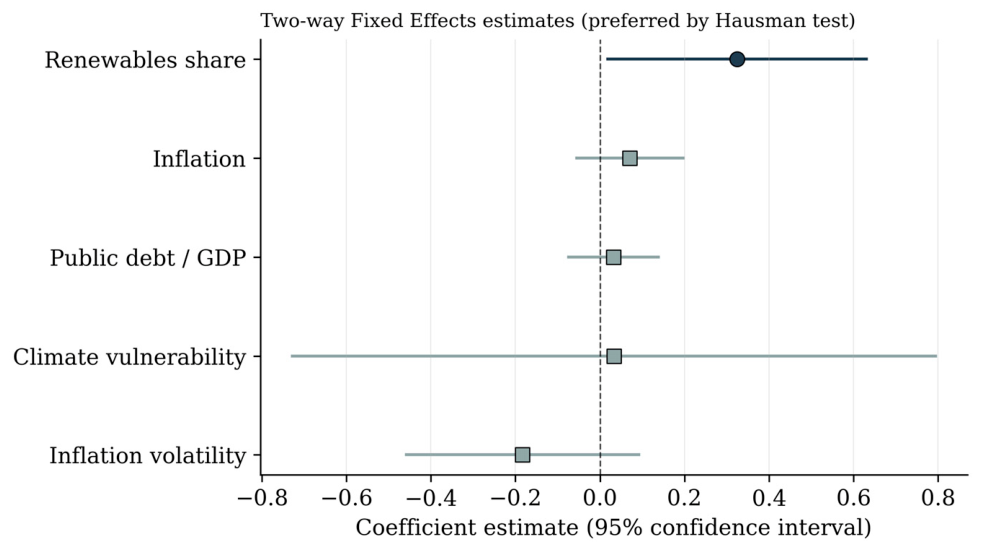
Figure 3 plots the two-way fixed-effects coefficient estimates with 95% confidence intervals (the specification preferred by the Hausman test). Renewable energy share is the covariate whose interval most clearly excludes zero; the monetary variables, debt, and climate vulnerability are not individually distinguishable from zero in the within estimator, underscoring that the debt result rests on between-country variation.
The probit average marginal effects translate these patterns into the probability of market entry. Public debt, renewable energy share, and income per capita significantly raise the probability of issuing, whereas the monetary variables do not. The full probit estimates—coefficients, standard errors, p-values, and average marginal effects—are reported in Table 6. This structural profile is consistent with, though it does not by itself estimate, the complete non-issuance of the four lower-income Sub-Saharan economies, which lie outside the probit sample owing to missing renewable-energy data (see Figure 4).

5. Discussion

Our findings contribute to and complicate the emerging literature on green bond market development in the Global South. Three substantive conclusions warrant discussion.
First, the positive association between public debt and green bond issuance challenges the assumption that macroeconomic fragility is the primary barrier to climate finance in the Majority World. Our results suggest instead that fiscal stress can function as a catalyst for green bond market entry, because labelled instruments may give high-debt governments a mechanism to reach environmental, social, and governance (ESG)-oriented international capital that would otherwise demand a higher conventional risk premium. This proposed channel is consistent with the greenium literature, which documents a modest but persistent yield advantage for green bonds (Baker et al., 2022; Gianfrate & Peri, 2019; Karpf & Mandel, 2018; Zerbib, 2019). We note, however, that the greenium is a pricing phenomenon and our data contain no bond-level pricing information; we therefore invoke this literature to motivate a plausible mechanism, not as direct evidence of one. For Majority World governments, even a modest yield advantage may suffice to justify developing green bond frameworks under fiscal pressure. The policy implication is significant: multilateral institutions should treat green bond technical assistance as a debt-management tool, not merely a climate-finance mechanism, and explore integrating green issuance into sovereign debt-restructuring frameworks such as debt-for-nature swaps (Organisation for Economic Co-Operation and Development [OECD], 2025).
Second, the null effect of inflation reframes how the urban climate finance literature should conceptualise macroeconomic risk. Much policy advice implicitly identifies monetary instability as a primary deterrent to private climate investment in cities (International Monetary Fund, 2024). Our results suggest this framing is misapplied to green bond markets specifically, where the effective currency of pricing and repayment is decoupled from domestic monetary conditions (Shin, 2014). City and national policymakers should not treat inflation stabilisation as a precondition for developing green bond frameworks. The Turkish case is instructive: despite inflation exceeding 70%, the binding constraint on issuance was not monetary but structural—the absence of a developed domestic green bond market and pipeline. This points policymakers toward the supply-side prerequisites our results highlight: a credible pipeline of certified green assets and a deepening renewable energy base.
Third, the complete absence of the four lower-income Sub-Saharan economies from green bond markets—despite their high climate vulnerability—points to a structural barrier not captured by macroeconomic variables. While our fiscal autonomy measure is too sparsely populated to be conclusive, the broader municipal finance literature is unambiguous: developing-country cities face weak credit-rating infrastructure, shallow local capital markets, absent green taxonomies, and underdeveloped municipal finance frameworks that precede macroeconomic considerations entirely (Asian Development Bank, 2024; Climate Policy Initiative, 2016; Herrera, 2024). The case-study evidence reinforces this: analyses of Mexico City and Cape Town show that green municipal bonds often carry higher issuance costs—certification, monitoring, reporting—that are difficult for subnational governments to replicate after an initial issuance, blunting the instrument’s promise (Herrera, 2026). Addressing these constraints requires institutional capacity building, credit-enhancement facilities, and concessional guarantee mechanisms targeted at municipal issuers, rather than macroeconomic stabilisation alone.
Bringing the analysis back to cities, the handful of subnational issuances that do exist illustrate why the national enabling environment matters so decisively. Johannesburg’s 2014 green bond—for several years the only municipal green bond from any developing-country city—was possible precisely because South Africa possessed the deepest domestic bond market in our sample, the same market depth that our extensive-margin model identifies as a precondition for national issuance (Climate Policy Initiative, 2016). Mexico City could issue in 2016–2018 because Mexico had an established sovereign and corporate green bond market into which the city could place its paper. Conversely, no city in a country without a functioning national green bond market appears anywhere in the data. The causal chain runs from national market formation to subnational possibility: the macroeconomic and structural conditions we identify are not a detour from the question of city finance but its upstream determinant. The policy corollary is that efforts to enable municipal green bonds in, say, Lagos, Nairobi, or Dhaka must begin with the national-level scaffolding—taxonomy, certification capacity, and a demonstration pipeline—rather than with the municipality in isolation.
Taken together, these findings suggest a reordering of the policy sequence. The dominant implicit model treats macroeconomic stability as the foundation upon which, eventually, climate finance can be built. Our evidence suggests that for green bonds specifically, the more binding constraints lie elsewhere—in the structural depth of capital markets, the pipeline of investable green assets, and the fiscal and institutional capacity of subnational governments to act as issuers in their own right. This does not dissolve the climate investment trap that Ameli et al. (2021) describe; rather, it locates the trap’s tightest point not in the general cost of finance but in the institutional preconditions for market participation.
Situated against the current literature, these results both extend and qualify recent contributions. They corroborate the supply-side emphasis of Tolliver et al. (2020) on the certifiable-asset pipeline, yet they part company with the determinant studies centred on advanced markets (Dan & Tiron-Tudor, 2021) by showing that inflation—central to that work—loses its explanatory force once attention shifts to Majority World economies, where issuance is largely foreign-currency denominated (Shin, 2014). They complement, at the cross-country level, the country-specific evidence of Endri et al. (2025) that macroeconomic and instrument characteristics shape government and corporate green issuance differently, and they sharpen the debt-trap diagnosis of Ameli et al. (2021) by relocating the binding constraint from the price of finance to the institutional preconditions of market entry. The contribution is therefore twofold. Empirically, the study assembles a Majority-World-only panel and isolates the extensive margin that volume-based studies obscure; conceptually, it reframes the policy debate, replacing the sequential “stabilise first, finance later” logic with a parallel-track view. The practical implication for multilateral lenders and city governments is concrete: technical assistance is most productively directed at green taxonomies, certification capacity, and demonstration pipelines rather than at monetary stabilisation treated as a precondition.

6. Conclusions

This study has provided a systematic cross-country panel analysis of the macroeconomic determinants of green bond issuance in a sample composed exclusively of Majority World economies. Drawing on data from 24 countries across four regions over 2015–2024, we find that public debt burden and renewable energy share are the most consistent positive predictors of issuance, while consumer price inflation shows no significant deterrent effect. These results carry direct implications for how the international community frames the challenge of mobilising green bond capital for cities.
The central message is that the framing of macroeconomic instability as the primary barrier to urban climate finance is empirically incomplete. Fiscal stress can catalyse green bond entry when supported by appropriate enabling frameworks, while the deeper structural constraints—subnational fiscal capacity, capital-market infrastructure, and green-asset pipeline development—are both more binding and less well-addressed by current international support architectures.
For an audience of city policymakers and mayors, the most actionable implication is that green bond market development should proceed in parallel with, not sequentially after, macroeconomic stabilisation. Cities and national governments that wait for stable monetary conditions before building green bond frameworks will forgo a decade or more of potential climate finance mobilisation. They should instead invest now in the supply-side prerequisites: building investable asset pipelines, developing domestic green taxonomies, and strengthening the subnational fiscal frameworks that would enable municipalities to participate as issuers in their own right. The cities that most need climate capital cannot afford to treat green finance as a reward for macroeconomic virtue; they must build the institutional foundations that make it possible.

Limitations and Future Research

These conclusions should be read in light of the study’s limitations, which in turn define an agenda for future research. The dependent variable captures national rather than subnational issuance, because city-level green bond data in the Majority World remain too sparse for cross-country estimation—a scarcity that is itself a finding; constructing a systematic subnational green bond dataset is a priority for future work. The estimation samples are further constrained by covariate coverage, most importantly the renewable-energy-share variable, which excludes the lowest-income economies and limits what can be inferred about them directly; extending coverage of structural and fiscal indicators for these economies would allow the extensive-margin analysis to encompass the very countries whose non-issuance motivates the study. Subnational fiscal autonomy, moreover, is observed for only 41.7% of country-years and is proxied imperfectly by financial-asset shares, so the specifications that include it are exploratory. The debt–issuance relationship, though robust in sign, is identified from observational cross-country variation and is consistent with more than one mechanism; bond-level pricing data and instrumental-variable or natural-experiment designs would help separate the market-access channel from joint determination. Finally, the panel is too small for dynamic estimators such as system GMM that would model issuance persistence (Roodman, 2009); as the market matures and the time dimension lengthens, such estimators will become feasible and should be pursued. We hope the replication package accompanying this article lowers the cost of these extensions.

Supplementary Materials

The following supporting information can be downloaded at: https://www.mdpi.com/article/10.3390/jrfm19070531/s1. The Supplementary Material consists of a replication package containing the cleaned analysis panel (240 country-year observations), the complete Python code that rebuilds the panel from its primary sources and reproduces all tables and figures, the generated figure files, and a README documenting the workflow.

Funding

This research received no external funding.

Institutional Review Board Statement

Not applicable.

Informed Consent Statement

Not applicable.

Data Availability Statement

The cleaned analysis panel (240 country-year observations), the complete estimation code (Python), and scripts to rebuild the panel from its primary sources are provided in a replication package accompanying this article. All primary data are publicly available: the IMF World Economic Outlook (April 2026); the KAPSARC Green Bond Issuances database and the Green Bond Transparency Platform; the Notre Dame Global Adaptation Initiative (ND-GAIN) Country Index; the World Bank (2024) Data360 Government Finance Statistics; and the Our World in Data energy repository.

Conflicts of Interest

The author declares no conflicts of interest.

References

  1. Ameli, N., Dessens, O., Winning, M., Cronin, J., Chenet, H., Drummond, P., Calzadilla, A., Anandarajah, G., & Grubb, M. (2021). Higher cost of finance exacerbates a climate investment trap in developing economies. Nature Communications, 12, 4046. [Google Scholar] [CrossRef] [Scilit] [PubMed]
  2. Ando, S., Roch, F., Wiriadinata, U., & Fu, C. (2022). Sovereign climate debt instruments: An overview of the green and catastrophe bond markets (IMF Staff Climate Note 2022/004). International Monetary Fund. [Google Scholar] [CrossRef] [Scilit]
  3. Arslanalp, S., & Tsuda, T. (2014). Tracking global demand for emerging market sovereign debt (IMF Working Paper No. 14/39). International Monetary Fund. [Google Scholar] [CrossRef] [Scilit]
  4. Asian Development Bank. (2024). Accelerating green bonds for municipalities in Southeast Asia. Asian Development Bank. [Google Scholar] [CrossRef] [Scilit]
  5. Baker, M., Bergstresser, D., Serafeim, G., & Wurgler, J. (2022). The pricing and ownership of US green bonds. Annual Review of Financial Economics, 14, 415–437. [Google Scholar] [CrossRef] [Scilit]
  6. Bigger, P., & Webber, S. (2021). Green structural adjustment in the World Bank’s resilient city. Annals of the American Association of Geographers, 111(1), 36–51. [Google Scholar] [CrossRef] [Scilit]
  7. Cheong, C., & Choi, J. (2020). Green bonds: A survey. Journal of Derivatives and Quantitative Studies, 28(4), 175–189. [Google Scholar] [CrossRef] [Scilit]
  8. Climate Policy Initiative. (2016). Green bonds for cities: A strategic guide for city-level policymakers in developing countries. Climate Policy Initiative. [Google Scholar]
  9. Dan, A., & Tiron-Tudor, A. (2021). The determinants of green bond issuance in the European Union. Journal of Risk and Financial Management, 14(9), 446. [Google Scholar] [CrossRef] [Scilit]
  10. Elliott, C., & Zhang, L.-Y. (2019). Diffusion and innovation for transition: Transnational governance in China’s green bond market development. Journal of Environmental Policy & Planning, 21(4), 391–406. [Google Scholar] [CrossRef] [Scilit]
  11. Endri, E., Harahap, I. M., & Hindardjo, A. (2025). The determinants of green bond issuance in Indonesia: An analysis of sustainable financial instruments. Journal of Risk and Financial Management, 18(12), 672. [Google Scholar] [CrossRef] [Scilit]
  12. Gianfrate, G., & Peri, M. (2019). The green advantage: Exploring the convenience of issuing green bonds. Journal of Cleaner Production, 219, 127–135. [Google Scholar] [CrossRef] [Scilit]
  13. Green Bond Transparency Platform (GBTP). (2024). Green bond transparency platform [data set]. Inter-American Development Bank. Available online: https://www.greenbondtransparency.com/ (accessed on 1 June 2026).
  14. Hausman, J. A. (1978). Specification tests in econometrics. Econometrica, 46(6), 1251–1271. [Google Scholar] [CrossRef] [Scilit]
  15. Herrera, H. (2024). The proliferation of municipal green bonds in Africa and Latin America: The need for a climate justice approach. Environment and Urbanization, 36(1), 89–108. [Google Scholar] [CrossRef] [Scilit]
  16. Herrera, H. (2026). Green bonds as adaptation finance: Climate justice insights from Cape Town and San Francisco. Environmental Research: Climate, 5(1), 015012. [Google Scholar] [CrossRef] [Scilit]
  17. Inter-American Development Bank [IDB]. (2025). How developing countries reduce the impact of climate vulnerability on sovereign risk. IDB. [Google Scholar]
  18. International Monetary Fund. (2024). Fiscal monitor: Putting a lid on public debt. International Monetary Fund. [Google Scholar]
  19. International Monetary Fund. (2026). World Economic Outlook: Global economy in the shadow of war (April 2026). International Monetary Fund. Available online: https://data.imf.org/en/datasets/IMF.RES:WEO (accessed on 1 June 2026).
  20. KAPSARC. (2024). Green bond issuances dataset. King Abdullah Petroleum Studies and Research Center. Available online: https://datasource.kapsarc.org/explore/dataset/green-bond-issuances/ (accessed on 1 June 2026).
  21. Karpf, A., & Mandel, A. (2018). The changing value of the ‘green’ label on the US municipal bond market. Nature Climate Change, 8(2), 161–165. [Google Scholar] [CrossRef] [Scilit]
  22. Mejía-Escobar, J. C., González-Ruíz, J. D., & Franco-Sepúlveda, G. (2021). Current state and development of green bonds market in the Latin America and the Caribbean. Sustainability, 13(19), 10872. [Google Scholar] [CrossRef] [Scilit]
  23. Mertzanis, C., & Tebourbi, I. (2024). Geopolitical risk and global green bond market growth. European Financial Management, 30(4), 2156–2190. [Google Scholar] [CrossRef] [Scilit]
  24. Mumtaz, M. Z., & Smith, Z. A. (2019). Green finance for sustainable development in Pakistan. IPRI Journal, 19(2), 1–34. [Google Scholar] [CrossRef] [Scilit]
  25. ND-GAIN. (2024). ND-GAIN country index [data set]. University of Notre Dame. Available online: https://gain.nd.edu/our-work/country-index/ (accessed on 1 June 2026).
  26. Novák, Z., & Ge, C. (2025). Exploring the relationship between green bond issuance and energy-related SDGs in emerging market and developing economies. Periodica Polytechnica Social and Management Sciences, 34(1), 104–113. [Google Scholar] [CrossRef] [Scilit]
  27. Organisation for Economic Co-Operation and Development [OECD]. (2025). Global debt report 2025: Debt financing for the climate transition. OECD Publishing. [Google Scholar]
  28. Roodman, D. (2009). A note on the theme of too many instruments. Oxford Bulletin of Economics and Statistics, 71(1), 135–158. [Google Scholar] [CrossRef] [Scilit]
  29. Sangiorgi, I., & Schopohl, L. (2021). Explaining green bond issuance using survey evidence: Beyond the greenium. The British Accounting Review, 53(4), 101071. [Google Scholar] [CrossRef] [Scilit]
  30. Saravade, V., & Weber, O. (2020). An institutional pressure and adaptive capacity framework for green bonds: Insights from India’s emerging green bond market. World, 1(3), 239–263. [Google Scholar] [CrossRef] [Scilit]
  31. Shin, H. S. (2014). The second phase of global liquidity and its impact on emerging economies. In Volatile capital flows in Korea (pp. 247–257). Palgrave Macmillan. [Google Scholar] [CrossRef] [Scilit] [PubMed]
  32. Steuer, S., & Tröger, T. H. (2022). The role of disclosure in green finance. Journal of Financial Regulation, 8(1), 1–50. [Google Scholar] [CrossRef] [Scilit]
  33. Taghizadeh-Hesary, F., Yoshino, N., & Phoumin, H. (2021). Analyzing the characteristics of green bond markets to facilitate green finance in the post-COVID-19 world. Sustainability, 13(10), 5719. [Google Scholar] [CrossRef] [Scilit]
  34. Tobin, J. (1958). Estimation of relationships for limited dependent variables. Econometrica, 26(1), 24–36. [Google Scholar] [CrossRef] [Scilit]
  35. Tolliver, C., Keeley, A. R., & Managi, S. (2020). Drivers of green bond market growth: The importance of nationally determined contributions to the Paris Agreement and implications for sustainability. Journal of Cleaner Production, 244, 118643. [Google Scholar] [CrossRef] [Scilit]
  36. Wooldridge, J. M. (2010). Econometric analysis of cross section and panel data (2nd ed.). MIT Press. [Google Scholar]
  37. World Bank. (2024). Data360 [data set]. World Bank. Available online: https://data360.worldbank.org/ (accessed on 1 June 2026).
  38. Zerbib, O. D. (2019). The effect of pro-environmental preferences on bond prices: Evidence from green bonds. Journal of Banking & Finance, 98, 39–60. [Google Scholar] [CrossRef] [Scilit]
Figure 1. Annual green bond issuance by region, 2015–2024 (USD billion). Aggregate issuance grew nearly eightfold over the period, with Asia-Pacific and Latin America accounting for the overwhelming majority of volume and the four lower-income Sub-Saharan economies recording no issuance.
Jrfm 19 00531 g001
Figure 2. Regional disparities in green bond market participation: (a) the share of country-years in which any issuance occurred (issuance incidence); (b) mean annual issuance volume (issuance intensity). Regional differences are driven by both the likelihood of issuing and the scale of issuance.
Jrfm 19 00531 g002
Figure 3. Two-way fixed-effects coefficient estimates with 95% confidence intervals (the specification preferred by the Hausman test). Renewable energy share is the only covariate whose interval clearly excludes zero.
Jrfm 19 00531 g003
Figure 4. Probit average marginal effects on the probability of green bond issuance (extensive margin). Public debt, renewable energy share, and income per capita significantly raise the probability of issuing; the monetary variables do not.
Jrfm 19 00531 g004
Table 1. Operational definitions, measurement, sources, and role of the variables.
VariableDefinition and MeasurementSourceRole in the Empirical Model
Green bond issuance (dependent)log(1 + annual green bond issuance), USD millionsKAPSARC; GBTPDependent variable
InflationConsumer price inflation, annual %IMF WEO (April 2026)H2 (monetary instability)
Inflation volatility3-year rolling standard deviation of inflationDerived from IMF WEOH2 (monetary instability)
Public debt/GDPGross general-government debt, % of GDPIMF WEOH1 (fiscal stress)
Renewable energy shareRenewables as a share of total energy, %Our World in DataH3 (green-asset pipeline)
log GDP per capitaLog GDP per capita, PPP-adjustedOur World in Data/IMFControl (development level)
Climate vulnerability100 − ND-GAIN country score (higher = more vulnerable)ND-GAIN Country IndexControl (climate exposure)
Subnational fiscal autonomyLocal-government/general-government financial assets × 100 (0–100)IMF GFS via WB Data360H4 (exploratory)
Inflation × fiscal autonomyInteraction of inflation and fiscal autonomyDerivedH4 (exploratory)
Notes: GBTP = Green Bond Transparency Platform; KAPSARC = King Abdullah Petroleum Studies and Research Center; IMF WEO = IMF World Economic Outlook; ND-GAIN = Notre Dame Global Adaptation Initiative; GFS = Government Finance Statistics; WB = World Bank; PPP = purchasing power parity. H1–H4 refer to the hypotheses developed in Section 2.2.
Table 2. Descriptive statistics, full panel (24 countries, 2015–2024, N = 240).
VariableMeanSDMinMedianMaxCoverage
Green bond volume (USD mn)598.21391.10.00.09109.7100%
Inflation (%)9.0719.34−1.64.5219.999%
Inflation volatility2.976.800.021.274.189%
Public debt/GDP (%)54.522.314.952.0154.6100%
Fiscal autonomy (0–100)14.97.62.615.237.942%
Climate vulnerability53.45.739.252.164.790%
GDP per capita (PPP USD)10,6976333163210,23127,40780%
Renewables share (%)14.411.60.610.749.667%
Notes: Fiscal autonomy = local-government financial assets/general-government financial assets × 100. Climate vulnerability = 100 − ND-GAIN score. Coverage = share of country-year observations with non-missing data.
Table 3. Pairwise (Pearson) correlations among the analysis variables, full panel.
Variable(1)(2)(3)(4)(5)(6)(7)(8)
(1) Issuance (log)1.00
(2) Inflation−0.001.00
(3) Inflation vol.−0.030.951.00
(4) Debt/GDP0.110.260.281.00
(5) Fiscal autonomy0.15−0.03−0.08−0.101.00
(6) Climate vuln.−0.25−0.05−0.140.010.101.00
(7) log GDP p.c.0.350.150.16−0.040.05−0.811.00
(8) Renewables0.19−0.010.010.020.33−0.340.301.00
Notes: Pearson correlation coefficients computed on all available country-year observations (pairwise deletion). The issuance variable is log(1 + green bond volume). Numbers in column headings correspond to the row labels.
Table 4. Green bond issuance by region, 2015–2024.
RegionCountriesObs.IssuingMean (USD mn)Total (USD bn)
Asia-Pacific66063.3%118270.9
Latin America & Caribbean88060.0%87269.8
Europe–Middle East–Africa66026.7%472.8
Sub-Saharan Africa (low-income)4400.0%00.0
Total2424042.5%598143.6
Notes: Europe–Middle East–Africa comprises Egypt, Kenya, Morocco, Nigeria, South Africa, and Turkey.
Table 5. Regression results; dependent variable log(1 + green bond volume).
Variable(1) OLS(2) RE(3) FE(4) OLS(5) FE(6) Tobit(7) Tobit
Inflation−0.041−0.0170.071−0.217−0.238−0.024−0.524 ***
(0.063)(0.065)(0.064)(0.188)(0.241)(0.082)(0.107)
Inflation volatility−0.112−0.025−0.1830.586 **0.378−0.469 *0.683 ***
(0.163)(0.138)(0.140)(0.248)(0.346)(0.257)(0.243)
Public debt/GDP0.026 *0.047 **0.0320.093 ***0.124 *0.0510.133 **
(0.015)(0.021)(0.054)(0.020)(0.063)(0.046)(0.053)
Fiscal autonomy0.028−0.053−0.012
(0.106)(0.136) (0.149)
Inflation × Fiscal aut.−0.013−0.001−0.005
(0.014)(0.012) (0.011)
Climate vulnerability0.131−0.0140.033−0.246−0.5260.196 *−0.352
(0.108)(0.183)(0.388)(0.191)(0.641)(0.105)(0.250)
log GDP per capita2.368 *0.533−3.196−1.1328.0843.896 *−2.085
(1.245)(1.827)(6.429)(2.354)(8.914)(2.247)(3.639)
Renewables share0.048 **0.085 **0.324 **−0.0230.371 **0.074−0.036
(0.022)(0.042)(0.156)(0.030)(0.156)(0.087)(0.077)
Country effectsNoREYesNoYesNoNo
Year effectsNoNoYesNoNoNoNo
CensoringNoNoNoNoNoYesYes
Observations110110110626211062
Countries16161699169
Notes: Standard errors in parentheses are clustered at the country level for Models 1, 4, and 5 and are heteroskedasticity-robust for Models 2 and 3; the Tobit Models 6 and 7 report conventional asymptotic (maximum-likelihood) standard errors, which are not clustered. * p < 0.10, ** p < 0.05, *** p < 0.01. Models 6 and 7 are left-censored Type I Tobit estimators (censoring at zero) estimated by maximum likelihood; The estimated standard deviation of the error term is σ^ = 4.80 (Model 6) and 3.50 (Model 7). McFadden pseudo-R2 for the Tobit models is 0.06 (Model 6) and 0.11 (Model 7); a random-effects Tobit (reported in the text and replication package) improves the log-likelihood to −212.4. The Hausman test (H = 19.83, p = 0.003) favours fixed effects over random effects for the broad sample. RE = random effects; FE = fixed effects. An em dash (—) indicates that a variable is not included in the specification.
Table 6. Probit model of the extensive margin (dependent variable: issued = 1 if green bond volume > 0).
VariableCoefficientStd. Errorp-ValueAME
Renewable energy share0.0375 **0.01630.0210.0128 **
Public debt/GDP0.0171 **0.00770.0260.0058 **
log GDP per capita0.9047 *0.53740.0920.3084 *
Climate vulnerability0.06040.04550.1840.0206
Inflation volatility−0.11210.10940.306−0.0382
Inflation−0.00780.02460.752−0.0027
Constant−12.427 *7.0750.079
Notes: Maximum-likelihood probit estimates. The reported standard errors are conventional asymptotic (maximum-likelihood) standard errors and are not clustered. N = 110 country-year observations across 16 countries; 66 issuing observations; McFadden pseudo-R2 = 0.115; log-likelihood = −65.5. Coefficients are probit index coefficients; AME = average marginal effect (per one-unit change in the regressor, computed at the sample means; income enters per log-unit). * p < 0.10, ** p < 0.05. The four lower-income Sub-Saharan economies (Ghana, Rwanda, Senegal, Tanzania) are not in the estimation sample because the renewable-energy-share variable is unobserved for them throughout 2015–2024.
Disclaimer/Publisher’s Note: The statements, opinions and data contained in all publications are solely those of the individual author(s) and contributor(s) and not of MDPI and/or the editor(s). MDPI and/or the editor(s) disclaim responsibility for any injury to people or property resulting from any ideas, methods, instructions or products referred to in the content.