Article

Does Board Gender Diversity Moderate the Relationship Between CEO Overconfidence and Tax Avoidance?

by
Ahmad Shatnawi
1,*,
Hanady Bataineh
2,
Eyad Abdel Halym Hyasat
2 and
Adel Dhaher Atqaa Alresheedi
3
1
Financial and Administrative Sciences Department, Al-Huson University College, Al-Balqa Applied University, Irbid 21510, Jordan
2
Accounting Department, Faculty of Business, Al-Balqa Applied University, Al-Salt 19117, Jordan
3
Department of Accounting, Qassim University College of Business and Economics, Buraidah 51431, Saudi Arabia
*
Author to whom correspondence should be addressed.
J. Risk Financial Manag. 2026, 19(7), 512; https://doi.org/10.3390/jrfm19070512
Submission received: 18 April 2026 / Revised: 20 June 2026 / Accepted: 22 June 2026 / Published: 9 July 2026
(This article belongs to the Section Business and Entrepreneurship)

Abstract

This study aims to examine the moderating effect of board gender diversity in the relationship between the overconfidence of the CEO and corporate tax avoidance of listed firms in Jordan. Based on upper echelons theory, agency theory, and resource dependence theory, it examines the potential influence of female board representation on the tax implications of managerial overconfidence in an emerging-market context. The study uses panel data of 70 industrial and service enterprises listed on the Amman Stock Exchange (ASE) for the period (2019–2024), yielding 420 firm-year observations. To measure corporate tax avoidance, we use the effective tax rate (ETR) and cash flow effective tax rate (CFETR), and CEO overconfidence is measured by a composite index of observable executive characteristics. The level of board gender diversity is computed as the percentage of female directors, and the hypotheses are tested with panel regression models that include relevant firm-level control variables. The results indicate that CEO overconfidence is negatively and significantly related to ETR, suggesting that the overconfident CEO is more likely to engage in tax avoidance. The moderating results also indicate that the relationship between board gender diversity and tax avoidance is reshaped by enhancing accrual-based tax avoidance and curbing cash-based tax avoidance. The results contribute to the literature on executive traits, corporate governance, and tax behavior by providing evidence from Jordan and by applying a practical measure of CEO overconfidence suitable for contexts with limited data availability.

1. Introduction

Over the last few years, the issue of tax avoidance has been actively discussed in the accounting and finance literature across various institutional settings (Almaharmeh et al., 2024; Dang & Nguyen, 2022), and Hanlon and Heitzman (2010) have defined tax avoidance as the minimization of explicit corporate taxes payment by applying different means, strategies, and actions. As corporate tax burdens have increased over time, tax avoidance has become a substantial component of corporate financial management, directly affecting firms’ cash flows and the wealth available to shareholders (Almaharmeh et al., 2024). Consequently, many businesses are encouraged to utilize several tax avoidance techniques to minimize their tax liabilities and conserve their financial resources (S. Chen et al., 2010).
In fact, previous studies have revealed a significant difference in tax avoidance strategies among companies, and these differences are attributed to various factors (such as institutional environments, ownership structures, corporate governance mechanisms, and firm-specific characteristics) (Almaharmeh et al., 2024; Souguir et al., 2024). More recent studies, relying on the upper-echelons view, have redirected the focus to individual executive traits, claiming that the psychological traits and behavioral patterns of top executives are likely to play a major role in corporate policies and strategies (Hsieh et al., 2018; Lakhal et al., 2023). According to this view, the outcomes of an organization are a manifestation of the values, experiences, and cognitive attributes of top managers (Hambrick, 2007). One such trait is the CEO’s overconfidence, which is the subject of the current research and which strongly influences the corporate risk tolerance policies, reporting practices, investment, and financing decisions.
In the finance and accounting literature, overconfident CEOs are considered to be managers who tend to underestimate risk and overestimate their ability to produce future cash flows, or alternatively, to systematically overestimate corporate investment opportunities (Malmendier & Tate, 2005). Both theoretical and empirical evidence suggest that overconfident CEOs are more likely to adopt aggressive investment policies (Malmendier & Tate, 2008), engage in excessive mergers and acquisitions (Schrand & Zechman, 2012), and take more risks (J. Li & Tang, 2010; Z. Li & Zhang, 2022). These behaviors can be carried over naturally to corporate tax strategies. Hsieh et al. (2018), for example, find that overconfident CEOs and CFOs lead to higher levels of tax avoidance, and Lakhal et al. (2023) show that overconfident CEOs are positively associated with tax avoidance. Further evidence suggests that executives who are more risk-seeking are more likely to be involved in higher levels of tax avoidance (Baghdadi et al., 2022).
Despite theoretical expectations and empirical evidence on the executive overconfidence–tax avoidance relationship, two gaps remain. First, most evidence comes from developed markets, where evidence in emerging economies, especially the Middle East and North Africa (MENA) region, remains scarce (Hsieh et al., 2018; Lakhal et al., 2023). Limited research has focused on board gender diversity in the MENA context, with the majority of studies focused on governance mechanisms, including board nationality diversity, disclosure practices, ownership structures, and digital transformation (Alshabibi et al., 2022; Khelil & Khlif, 2023; Lassoued et al., 2025; Souguir et al., 2025). Second, and more importantly, prior studies have explored the direct impact of CEO overconfidence on accrual-based and cash-based tax avoidance, with few studies examining whether board gender diversity moderates this relationship and whether the moderation effect varies between these two forms of tax avoidance. To fill these gaps, this study investigates whether board gender diversity moderates the relationship between CEO overconfidence and the two forms of tax avoidance in the case of Jordanian companies.
Board gender diversity has received growing interest in the academic and policy literature as a determinant of improved monitoring and corporate strategic decisions. The existing literature, adopting the resource dependence and agency perspectives, identifies that female directors improve control and reduce managerial opportunism (Amin et al., 2022) and tend to have a diversity of cognitive resources, broader networks of stakeholders, and increased legitimacy (Hillman & Dalziel, 2003). Through their advisory and monitoring functions, female directors are anticipated to influence firms’ strategic and financial decision-making, including those related to tax avoidance policies. Empirical studies found that boards with a larger percentage of female directors are less likely to be aggressive in their tax policies and more likely to adhere to rules of law and be concerned about the image of the company (L. H. Chen et al., 2019; Lanis et al., 2017). Consequently, we will examine the moderating effect of board gender diversity on the executive overconfidence–tax avoidance relationship.
However, the influence of board gender diversity may differ across forms of tax avoidance. Previous research, drawing upon the agency perspective, suggests that board members are expected to balance the benefits of tax planning against the risks of aggressive tax avoidance (Armstrong et al., 2015). Therefore, when companies do not take full advantage of available tax planning opportunities, board members are more likely to support tax strategies that optimize shareholder value as long as such strategies remain within acceptable and lawful limits (Armstrong et al., 2015). From this perspective, female directors may influence tax avoidance differently depending on the form of tax avoidance strategies implemented. That is, female directors may support tax planning that is legally defensible and value-enhancing while also constraining strategies that increase regulatory, reputational, or litigation risk. In financial reporting contexts, accounting-based tax avoidance strategies depend on accounting adjustments and timing differences, making them more rule-based and legally defensible within the financial reporting framework. In contrast, cash-based tax avoidance strategies are, in many cases, viewed as more risk-intensive and observable strategies, and consequently, may expose firms to regulatory scrutiny and financial penalties (Dyreng et al., 2008; Hanlon & Heitzman, 2010).
Given this distinction, it is unclear whether gender diversity in the boardroom affects the link between CEO overconfidence and tax avoidance similarly for both forms of tax avoidance—or whether the moderation is in the opposite direction. This study, thus, answers the following theoretical question: Does board gender diversity moderate the relationship between CEO overconfidence and tax avoidance and, if so, is the direction of the moderation different for accrual-based and cash-based tax avoidance strategies?. Specifically, we hypothesize that gender diversity on the board reinforces the relationship between CEO overconfidence and accrual-based tax avoidance but weakens the correlation between CEO overconfidence and cash-based tax avoidance.
The Jordanian context provides a good opportunity to examine the hypothesis that the relation between CEO overconfidence and tax avoidance is moderated by gender diversity. Jordan is an emerging market where ownership is highly concentrated, boards have less representation of women, and corporate governance structures are still evolving, creating a special context in which the characteristics of the executive interact with the structure of the boards. Although the importance of governance mechanisms as determinants of tax behavior has been highlighted, the behavioral aspect, specifically CEO overconfidence, has received little attention (Alqatamin et al., 2017; Bataineh, 2025). Because of the limited amount of data available in Jordan, we rely on a composite index for measuring CEO overconfidence, using six observable executive traits: gender, age, educational level, financial background, tenure, and political connections.
This study contributes to the literature in several ways. First, it adds to the behavioral corporate governance literature by connecting CEO overconfidence to tax avoidance in an emerging market setting. Second, it combines upper echelons theory with agency and resource dependence views to test the moderating effect of board gender diversity. Third, it offers new evidence on the topic of Jordan, which adds to the scanty literature on executive characteristics and tax conduct in the Middle East markets. Lastly, and most importantly, the study provides a more detailed analysis of the impact of managerial biases on different forms of corporate tax strategy by utilizing both accrual-based (ETR) and cash-based (CFETR) measures of tax avoidance, revealing that gender diversity reshapes the nature of tax avoidance, not just its level.

2. Literature Review and Hypotheses Development

2.1. CEO Overconfidence

The CEO, as the highest-ranking executive in an organization, plays a key role in shaping corporate strategy, vision, policies and culture to ensure the company’s success (Aliani et al., 2016; García-Meca et al., 2021). Their influence is deeply embedded in the upper echelon perspective, which suggests that corporate strategic decisions, policies, priorities, and practices are a reflection of the experiences, personalities, and values of top managers (Hambrick, 2007). A growing body of research in the accounting and behavioral finance literature has explored how the attributes-related personal traits of the top executive manager team influence the corporate strategic policies (García-Meca et al., 2021). Among these attributes, CEO overconfidence, the trait of interest in the present study, has been the focus, given the latter’s significant influence on corporate risk-taking policies, reporting practices, investment, and financing decisions.
The concept of overconfidence originates from behavioral economics and psychology studies, where overconfidence refers to an individual’s systematic tendency to overestimate personal abilities, the precision of private information, or control over future outcomes (Taylor & Brown, 1988; Weinstein, 1980). In the finance and accounting literature, overconfident CEOs are viewed as managers who usually tend to underestimate risk and overestimate their capacity to generate future cash flows, or equivalently, systematically overestimate corporate investment opportunities. However, early research by Malmendier and Tate (2005) explicitly introduces observable CEO-level proxies for overconfidence, where a CEO is viewed as overconfident when they systematically delay exercising deep-in-the-money stock options. Their argument stems from the view that CEO overconfidence tends to overestimate and inflate their abilities to generate superior future performance. Using this measure, they show that overconfident CEOs overinvest, particularly when internal funds are abundant, and engage in value-destroying mergers and acquisitions. These findings establish CEO overconfidence as a measurable and economically significant managerial trait, but the lack of data availability in several developing business environments, including Jordan, makes this measure inapplicable.
Subsequent studies extend these insights across a wide range of corporate policies, including corporate financial reporting policy and decisions. Indicatively, Ahmed and Duellman (2013) analytically show that overconfident managers view conservative accounting as an unnecessary pessimistic accounting approach because they overestimate the future performance of the firm. In a situation where financial performance falls short of expectation, Schrand and Zechman (2012) also indicate that overconfident executives tend to be more prone to manipulating reported accounting figures in order to close the gap between expectations and reality. Further, overconfident managers and CEOs are more likely to distort disclosure practices and withhold unfavorable information (Sumiyana et al., 2023), while simultaneously engaging in higher levels of risk-taking, as their biased beliefs lead them to overestimate future outcomes and underestimate potential risks (Malmendier & Tate, 2005).
The effects of CEOs’ overconfidence go beyond their reporting behavior to the corporate financial and investment policy. Hirshleifer et al. (2012) demonstrate, for instance, that overconfident CEOs adopt aggressive investment policies that lead to higher firm risk and higher stock return volatility. Additionally, findings from Gervais et al. (2011) suggest that such managers are inclined to persist in unsuccessful ventures and take risks even when faced with unclear or unfavorable information. Furthermore, Malmendier and Tate (2005, 2008), while analyzing the relationship between CEO overconfidence and value-destroying mergers, display that CEOs who are highly overconfident, due to overestimating investment opportunities, are more likely to engage in acquisition or merger transactions or ambitious expansion programs without fully considering the potential risks that destroy corporate value. In other words, increased merger activity tends to result in lower average deal quality, leading to negative market reactions to merger announcements. Overconfidence is also associated with distinctive payout and financing policies, as they prefer to lower the cash outflow of dividends, reflecting a belief that internally retained funds can be invested more profitably under their leadership (Cordeiro, 2009).
Overconfident executives are more likely than others to engage in practices that destroy firm performance or resource availability, even when such practices involve increased risk or ethical ambiguity, because such actions support the CEO’s self-perception and reinforce their desire for achievement and recognition. Collectively, this literature indicates that CEO overconfidence can shape an extensive range of corporate policies, including—as explored in the next section—the firm’s propensity to engage in tax avoidance.

2.2. CEO Overconfidence and Tax Avoidance

In recent years, research on tax avoidance has identified significant variation in tax avoidance activities among firms, and such variation is attributed to the business setting to which the firms belong (Armstrong et al., 2012; Dyreng et al., 2008), and firm-specific factors, such as equity ownership, and more importantly, traits, preferences, and incentives of the firm’s management—the trait of interest in the present study. As the most important decision makers in firms, the literature considers the link of corporate tax strategies/policies and executive managers (Armstrong et al., 2012; Dyreng et al., 2010), and more recently, studies consider the individual executive characteristics-tax avoidance relationship (Koester et al., 2017). These studies argue that executive managers use aggressive tax avoidance to increase after-tax performance as one form of rent extraction at the expense of shareholders.
From the upper echelon perspective, corporate decisions and organizational performance outcomes are influenced by management attributes, such as CEOs’ attributes (Hambrick, 2007; Hambrick & Mason, 1984). Among these characteristics is overconfidence, which reflects a manager’s tendency to overestimate their knowledge and decision-making ability and to expect outcomes that are unrealistically favorable (Gilson, 1989; Taylor & Brown, 1988; Weinstein, 1980). This bias is especially salient among CEOs, as individuals with strong confidence and optimism are more likely to be promoted to the highest executive positions (Goel & Thakor, 2008). Self-serving motivations, such as bonus entitlements and professional reputation concerns, make overconfident CEOs highly committed to achieving those performance goals (Gilson, 1989). Their optimistic predispositions could affect decisions on major corporate reporting issues and financial policies (borrow more money) and overestimate corporate investment opportunities, leading them to pursue riskier projects (Hackbarth, 2008; Heaton, 2002). Firms with wide-scale investment opportunities have a high motivation to lower their taxes, which results in the release of internal cash flows for growth (Edwards et al., 2016). Tax avoidance presents a legally legitimate way for overconfident CEOs to increase the amount of resources available to finance their ambitious investment strategies.
The existing literature provides much evidence that CEOs’ overconfidence is associated with aggressive corporate behavior. To illustrate, overconfident executives are more likely to adopt more aggressive tax planning strategies since they underestimate the expenses that can be incurred in the event of regulatory scrutiny and penalties (Chyz et al., 2019). In the same vein, Kubick and Lockhart (2017) noted that overconfident CEOs are more likely to seek greater tax aggressiveness, especially when supported by external rewards like CEO awards. Empirical evidence from different institutional contexts further supports this relationship. CEO overconfidence has been observed to have a positive effect on tax planning activities in emerging markets (Aliani et al., 2016). Similarly, in Brazil, overconfident CEOs tend to pursue more tax-aggressive behavior (Carrer & Slavov, 2021). Consistent results are reported in Asian settings, where overconfidence in CEOs is a major contributor to tax avoidance, and the effect varies according to the type of CEO (Sutrisno et al., 2022).
The more recent research is based on this evidence, but incorporates additional moderating and contextual factors. Indicatively, Karavitis et al. (2025) demonstrate that overconfident CEOs commit tax avoidance and, at the same time, they use corporate social responsibility practices to justify their behavior. Likewise, Listiani et al. (2025) discover that the strength of this relationship is dependent on firm characteristics, including size and the demographics of the CEO. In general, the literature is consistent in its argument that CEO overconfidence results in greater corporate tax avoidance in various countries and institutional contexts. While prior evidence from developed and some emerging markets supports this relationship, the Jordanian institutional context offers a distinct test of its generalisability. Furthermore, establishing the direct effect is essential before investigating how board gender diversity reshapes this relationship. Thus, this study suggests the following hypothesis:
H1. 
Firms with overconfident CEOs are more likely to engage in tax avoidance, relative to firms with non-overconfident CEOs.

2.3. The Moderating Role of Board Gender Diversity

Although the CEO, as the highest-ranking executive in an organization, plays a key role in shaping corporate strategy, vision, policies, and culture, and more importantly, corporate tax planning (Dyreng et al., 2010), their influence is more likely to be affected by board members, such as female directors, especially, when CEOs are overconfident and tend to prioritize risky and aggressive strategies. Such governance dynamics are driven by the agency perspective (Jensen & Meckling, 1976), which emphasizes the board’s monitoring role, and the resource dependence perspective (Pfeffer & Salancik, 1978), which focuses on the board’s advisory function.
Within the governance literature, female directors are associated with stronger monitoring and enhanced governance quality. Prior research suggests that firms with greater female board representation exhibit lower levels of tax avoidance (Khaoula & Ali, 2012; Lanis et al., 2017; Hoseini et al., 2019). This relationship is commonly attributed to their unique attributes, particularly their distinctive managerial style, interpersonal skills (Gull et al., 2018), greater ethical sensitivity and awareness of social and reputational risks (Farooq et al., 2022), as well as having a stronger orientation toward transparency and accountability, and facilitate compliance with ethical and regulatory standards (Dakhli, 2022; A. Shatnawi et al., 2022), as well as their association with more conservative financial reporting practices and reduced financial manipulation (Francis et al., 2015; Srinidhi et al., 2011; A. A. Shatnawi, 2021). Thus, female directors are generally perceived as being more effective at controlling management, especially when it comes to opportunistic financial reporting and tax decisions.
Evidence from the MENA region, which forms the context of this study, further highlights the importance of governance mechanisms in shaping corporate tax behavior. The recent studies demonstrate that the decision of tax planning in MENA countries is impacted by the board characteristics, disclosure practices, digital transformation, and ownership structures (Alshabibi et al., 2022; Khelil & Khlif, 2023; Lassoued et al., 2025; Souguir et al., 2025). Interestingly, the nationalities of the board members do not seem to have a negative effect on tax evasion, as foreign directors are more likely to hold an advisory role than a supervisory role (Alshabibi et al., 2022), suggesting that the effects of board diversity on governance are not consistent across all dimensions of that diversity. However, the effect of board gender diversity on tax avoidance has received less attention, and even less is known about whether the effect of board gender diversity is moderated by the relationship between CEO overconfidence and tax avoidance.
Nevertheless, the moderating role of board gender diversity may vary depending on the form of tax avoidance strategies employed. This study follows Hanlon and Heitzman (2010) and defines two measures of tax avoidance, cash-based tax avoidance (CFETR) and accrual-based tax avoidance (GAAP effective tax rate, or ETR). In general, accounting-based tax avoidance strategies depend on accounting adjustments and timing differences, making them more rule-based and legally defensible within the financial reporting framework. In contrast, the cash tax avoidance strategies are viewed as risk-intensive and observable strategies (Dyreng et al., 2008; Hanlon & Heitzman, 2010). This distinction is important because governance mechanisms may shape not only the extent of tax avoidance, but also its form. Consequently, the influence of board gender diversity may vary across different dimensions of tax avoidance. Examining accrual-based and cash-based tax avoidance separately therefore provides a more nuanced understanding of how board gender diversity interacts with CEO overconfidence in shaping corporate tax behavior.

2.3.1. Board Gender Diversity, CEO Overconfidence, and Accrual-Based Tax Avoidance

CEO overconfidence is often linked to overly optimistic expectations of future firm performance and a failure to recognize risk (Malmendier & Tate, 2005). Consequently, overconfident CEO’s will be more inclined to adopt aggressive corporate policies that may yield immediate economic benefits but can also incur regulatory costs and reputational damage. While the increased monitoring of boards could reduce visible forms of tax avoidance, it would not necessarily remove the managerial incentives to reduce corporate tax burdens. As overt behaviors become more closely scrutinized, managers may attempt to shift their focus to activities less subject to direct audit (Holmström & Milgrom, 1991). One such alternative is accrual-based tax avoidance, which relies primarily on accounting estimates, timing differences, and financial reporting decisions that are in line with accounting principles (Hanlon & Heitzman, 2010). These strategies are not always reflected in actual cash tax payments (Dyreng et al., 2008); they are, therefore, more legally defensible than others. As a result, they could be overlooked by board members who are more attuned to the more visible clues of tax avoidance.
Agency theory also suggests that board members are supposed to effectively balance the benefits of tax-saving planning efforts against the risks of aggressive tax planning activities (Armstrong et al., 2015). That is, when companies do not take full advantage of available tax planning opportunities, good governance mechanisms are more likely to promote tax strategies that optimize shareholder value while reducing risky tax activity (Armstrong et al., 2015). Based on this premise, the female board members are more likely to accept tax planning when it does not violate the acceptable accounting and legal framework. In a similar vein, Riguen et al. (2019) confirm that female board members have a substantial effect on tax avoidance practices, and such effect depends on the governance and regulatory environment and is not uniformly stunted.
Furthermore, overconfident CEOs might be especially vulnerable to a sophistication displacement mechanism. This mechanism is characterized by managers reacting to increased oversight by employing more complex and less transparent means to achieve the same objective, rather than abandoning the original goal. As in the multitask agency framework of Holmström and Milgrom (1991), increased oversight of visible managerial actions may prompt managers to shift their efforts to activities subject to less direct scrutiny. Because overconfident CEOs tend to overestimate their ability to manage risks and achieve desired outcomes (Malmendier & Tate, 2005), they may perceive increased board scrutiny as a challenge to be overcome rather than a constraint that fundamentally alters their objectives. Prior evidence further suggests that having female directors on boards can mitigate the consequences of CEO overconfidence and enhance the effectiveness of board oversight (Banerjee et al., 2018; L. H. Chen et al., 2019; Lakhal et al., 2023). Therefore, oversight efforts by board members may not deter overconfident CEOs from using tax avoidance strategies but rather shift the focus to tax planning strategies embedded in accounting choices and discretionary estimates in financial reporting. As accrual-based tax avoidance involves accounting estimates, timing differences, and reporting decisions within financial reporting frameworks (Hanlon & Heitzman, 2010; Dyreng et al., 2008), it may provide overconfident CEOs with an alternative mechanism through which to pursue tax-reduction objectives while adapting to enhanced board oversight.
Accordingly, the compliance-oriented monitoring role of female directors and the sophistication displacement mechanism suggest that gender diversity on boards can exacerbate accrual-based tax avoidance by overconfident CEOs, as female directors are more likely to facilitate legally defensible accrual-based strategies, while overconfident CEOs simultaneously redirect tax avoidance to less obvious channels in response to tightening oversight. Thus, this study suggests the following hypothesis:
H2a. 
Board gender diversity strengthens the relationship between CEO overconfidence and accrual-based tax avoidance.

2.3.2. Board Gender Diversity, CEO Overconfidence, and Cash-Based Tax Avoidance

In contrast, cash-based tax avoidance strategies often generate visible reductions in tax payments and may attract scrutiny from tax authorities and external stakeholders (Hanlon & Heitzman, 2010; Dyreng et al., 2008). Since female directors are more ethically sensitive, aware of reputational risk, and have a compliance orientation, they are more likely to restrain an overconfident CEO whose natural disposition is towards aggressive cash tax reduction (Farooq et al., 2022). As a result, the monitoring effect of female directors is expected to weaken the tendency of overconfident CEOs to engage in aggressive cash-based tax avoidance. This logic is consistent with Banerjee et al. (2018), who report the mitigating effects of gender-diverse boards in the firms of overconfident CEOs. These mechanisms suggest that board gender diversity alters the composition of tax avoidance rather than merely reducing its overall level, as it weakens the association between CEO overconfidence and cash-based tax while strengthening the association between CEO overconfidence and accrual-based tax avoidance. Thus, this study suggests the following hypothesis:
H2b. 
Board gender diversity weakens the relationship between CEO overconfidence and cash-based tax avoidance.
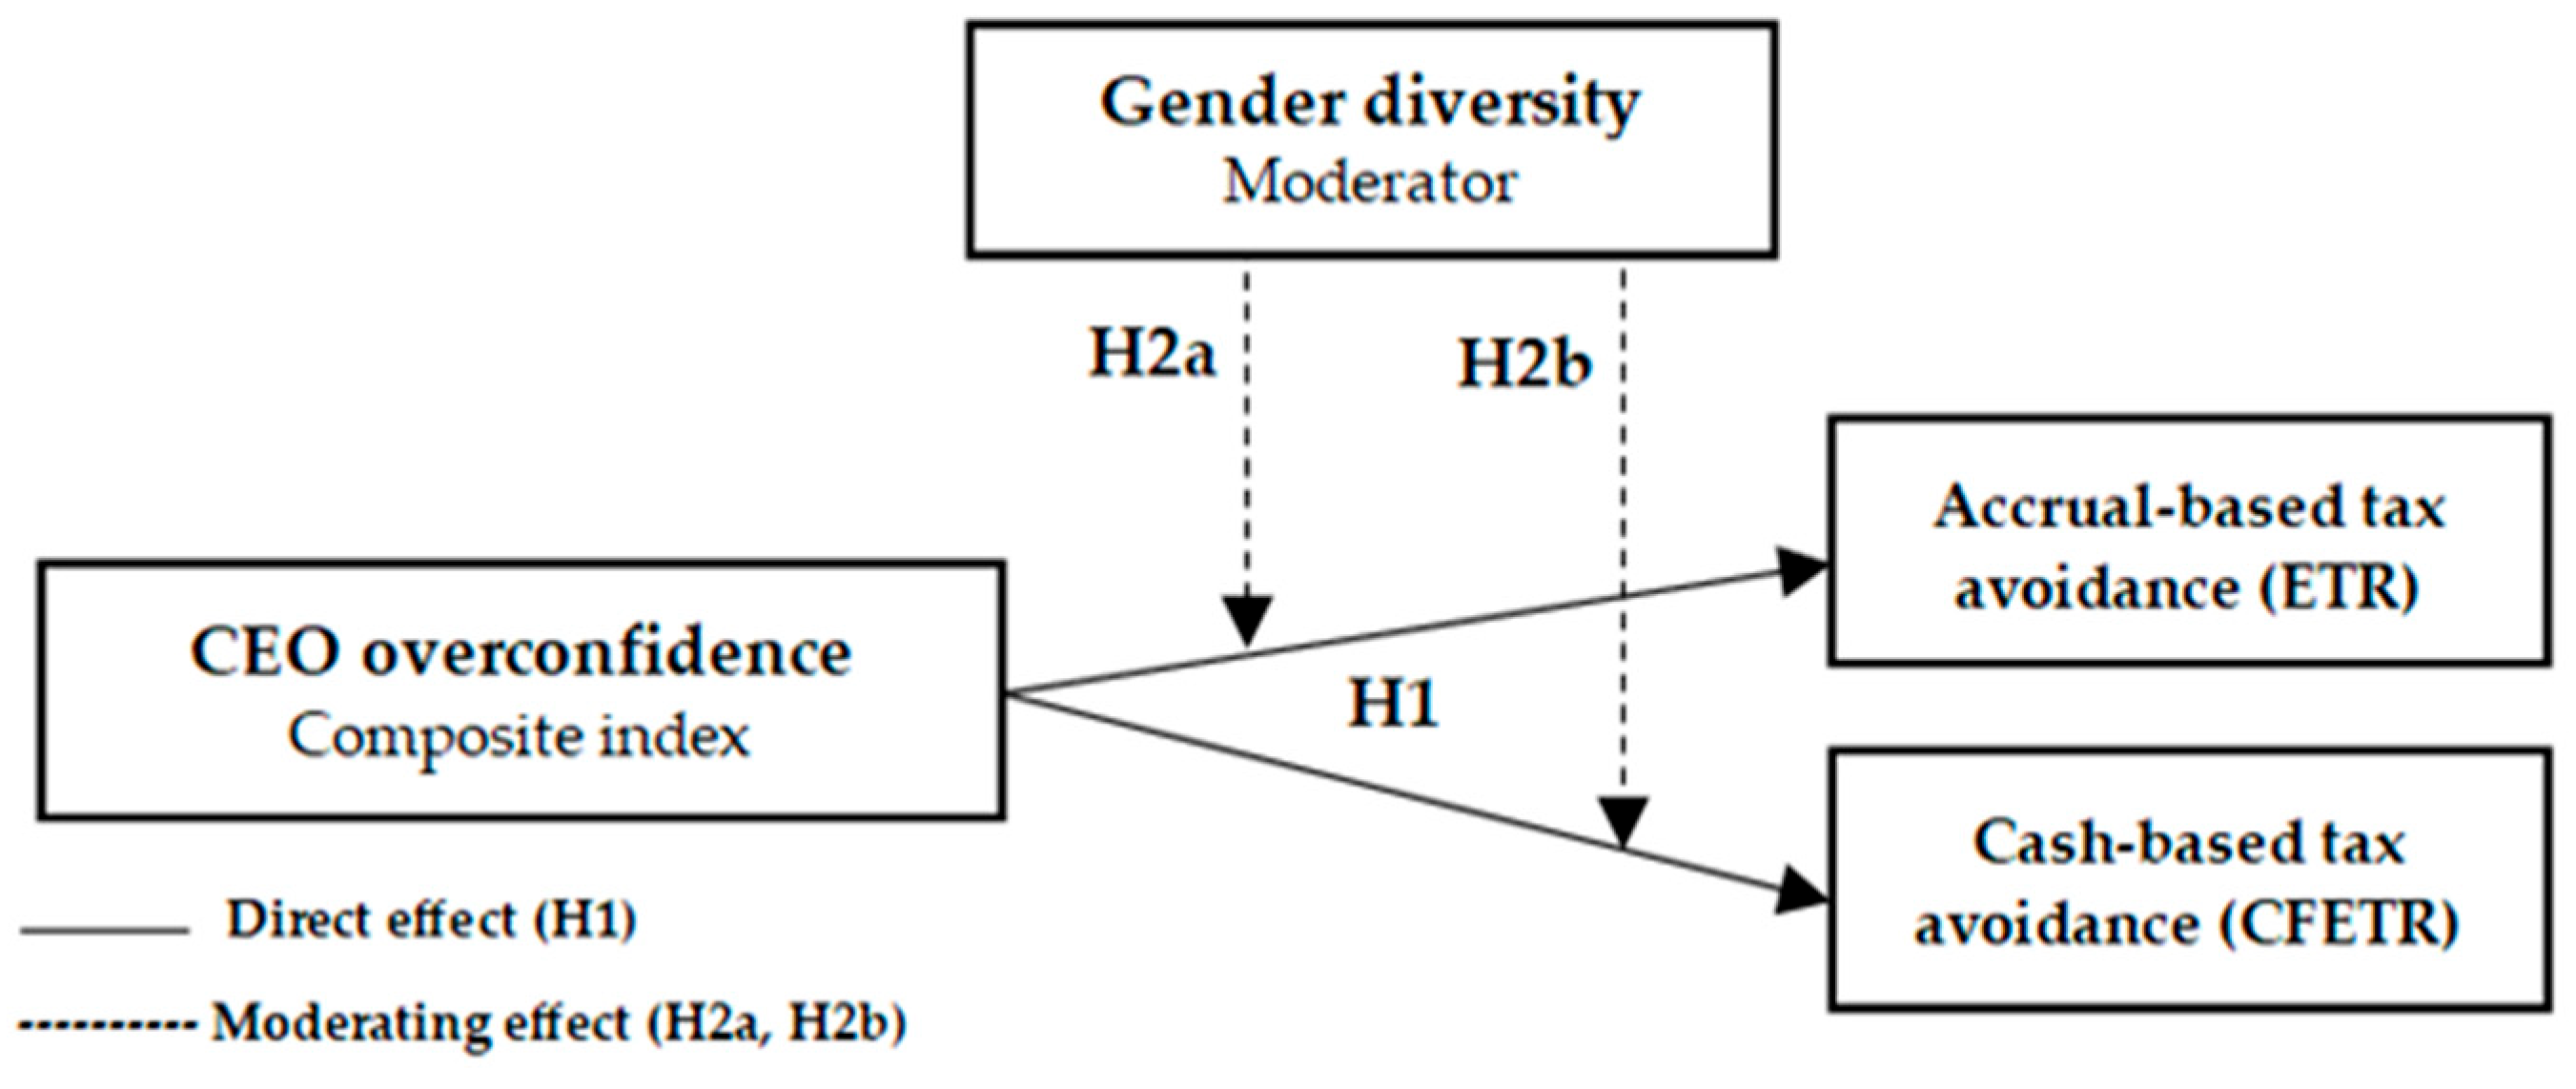
Figure 1 illustrates the conceptual framework of this study, depicting the direct effect of CEO overconfidence on both accrual-based and cash-based tax avoidance (H1), and the differential moderating role of board gender diversity on each relationship (H2a and H2b).

3. Research Design

3.1. Sample and Data Collection

The sample of the current study included all the firms listed on the Amman Stock Exchange (ASE) within the period between 2019 and 2024. Financial firms are not to be considered, as they are governed by a different set of regulations, market trading rules, and corporate governance policies. The sample selection used the most recent information available before the publication date. Due to the lack of annual financial reports and the insufficiency of the data, 70 firms, 32 in the industrial sector and 38 in the service sector, were included in the analysis, which resulted in 420 observations. The data related to the study variables, which are CEO overconfidence, gender diversity, tax avoidance, and corporate characteristics, were obtained in the annual financial reports of the firms, which were available on the ASE site.

3.2. Variables Measurement

This study examines how CEO overconfidence affects tax avoidance, with the moderating effect of gender diversity in this association. Our dependent variable is tax avoidance, measured by the two proxies: effective tax rate (ETR) and cash flow effective tax rate (CFETR), where ETR is calculated as total tax expense divided by pre-tax income. This indicator measures any form of tax reduction through tax sheltering or tax planning (Dyreng et al., 2017). A lower ETR indicates increased engagement in tax avoidance. The second proxy for tax avoidance is CFETR, which is calculated by dividing total tax expense by pre-tax operating cash flows. This measure captures tax avoidance that is unrelated to earnings management (X. Chen et al., 2014).
Based on previous studies, a common measure of CEO overconfidence (the independent variable) is associated with the exercise of stock options held by managers. However, such data are unavailable in Jordan. To fill this gap, the concept of CEO overconfidence is evaluated based on personality traits, in accordance with the conceptual framework supported in previous studies by Z. Li and Zhang (2022) and Ananzeh (2024). These studies focused on a specific set of traits, but the present study focuses on a different set of traits that is more suitable to the Jordanian business environment and can be quantitatively assessed by analyzing the available annual reports. We define CEO overconfidence as a combination of the six attributes of CEOs that cause them to overestimate future events, which can affect the preparation of financial statements or firm policies (Lee, 2016). The following equation is used to measure the CEO’s level of confidence:
Confidence Level = Gender + Age + Educational Level + Financial Background + Tenure + Political Connections
For instance, male CEOs often exhibit greater overconfidence than female CEOs. Therefore, the gender variable in Equation (1) takes the value of 1 if the CEO is male and 0 otherwise. Older CEOs tend to be more cautious compared to younger CEOs. Therefore, the age variable is given the value of 1 if the CEO is younger than the average age of CEOs in the firms included in the sample and 0 otherwise. Educational level is an important factor affecting CEO confidence. This variable is given the value of 1 if the CEO has a master’s degree or higher and 0 otherwise. Regarding financial background, this variable is given the value of 1 if the CEO has financial experience—i.e., previous work in a financial institution, such as a regulatory body, central bank, or commercial bank, etc.—and 0 otherwise. The tenure of the CEO, which is the total number of years that the CEO has served in the firm, is calculated as follows: in case the tenure of the CEO is five years or above, he or she is given a value of 1; in case the tenure of the CEO is less than five years, he or she is given a value of 0. Long-term CEOs are more likely to be overconfident, and this may affect the financial decisions of the firm. Finally, it is argued that CEOs with political connections leverage their influence, making them more motivated and confident in their decisions. If the CEO previously held a government position, such as minister, deputy minister, or governor, the corresponding variable is set to 1; otherwise, it is set to 0. Therefore, the confidence level calculated from the above equation will range from zero (the least confident CEO) to six (the most confident CEO).
The gender diversity (moderating variable) is measured as the percentage of female directors on the firm’s board of directors. In addition to the main variables of this study, several control variables were included: firm size, firm profitability, firm leverage, and firm age. Table 1 summarizes the variables included in this study and the main sources of the indicators used.

3.3. Validation of the Overconfidence Index

To assess whether the composite index captures theoretically predicted overconfident behavior, we conducted three validation tests using observable firm outcomes. First, we compared the leverage ratio (total debt/total assets) of the high-scoring (score ≥ 4) versus the low-scoring (score ≤ 2) CEOs. High-scoring CEOs had significantly higher leverage (mean = 0.46, 0.36, difference = 0.10, t = 2.25, p < 0.01), also consistent with overconfident CEOs making a lower estimate of the financial risk associated with their firms (Malmendier & Tate, 2005). Second, we examined investment intensity (capital expenditures/total assets). Firms led by high-scoring CEOs invested more aggressively (mean = 0.16 vs. 0.11, difference = 0.05, t = 2.41, p < 0.05), supporting the prediction that overconfident CEOs over-invest (Ben-David et al., 2013). Third, we analyzed earnings volatility (standard deviation of ROA over 2019–2024). High-scoring CEOs exhibited 35% higher volatility (mean = 0.042 vs. 0.031, difference = 0.011, t = 2.12, p < 0.05), indicating greater risk-taking behavior (J. Li & Tang, 2010). Collectively, these results support the construct validity of our composite index as a theory-informed proxy for CEO overconfidence in the Jordanian context.
Moreover, we construct a composite score based on observable CEO characteristics associated with overconfidence, including gender diversity, which is also considered a moderating variable in the second model. To tackle the overlap problem (if any), the gender variable was removed from the index, and then all models were re-estimated in the additional tests section.

3.4. Research Model

To test the impact of CEO overconfidence on tax avoidance, as well as to examine the effect of the moderating role of gender diversity on such a relationship in Jordanian industrial and service firms listed on the ASE for the 2019–2024 period. The following two models were developed:
In the first model, the effect of CEO overconfidence on tax avoidance is examined.
TAXOVit = β0 + β1CEOVERit + β2SIZEit + β3PROFit + β4LEVit + β5AGEit + β6YEARit + εit
In the second model, the interaction term between CEO overconfidence and tax avoidance is included to examine the moderating effect of gender diversity on the relationship between CEO overconfidence and tax avoidance.
TAXOVit = β0 + β1CEOVERit + β2(CEOVER ∗ GEND)it + β3SIZEit + β4PROFit + β5LEVit + β6AGEit + β7YEARit + εit

4. Results

4.1. Descriptive Analysis

This sample consists of 420 firm-year observations from 70 firms listed on the ASE over a six-year period between 2019 and 2024. To eliminate outliers that may cause a bias in the regression estimates, all continuous variables were winsorized at the 5th and 95th percentiles. Results are robust to alternative winsorization cutoffs at the 1st and 99th percentiles, as well as to unwinsorized data (untabulated). Table 2 displays the descriptive statistics for the full sample and subsets by CEO overconfidence and gender diversity.
The mean effective tax rate (ETR) for the entire sample is 11.86%, with a standard deviation of 11.70%, whereas the mean cash flow effective tax rate (CFETR) is 7.12%, with greater variability than the mean (SD = 12.77%). The identified differences between (ETR) and CFETR suggest that firms are systematically involved in tax planning strategies to lower their effective tax burdens, thus demonstrating tax avoidance. The CEO overconfidence index is 2.99 on a scale of 0 to 6, indicating a moderate degree of overconfidence among CEOs. This does not change in the size of the gendered boardrooms; female directors average only 5.21% of the board, a number which varies significantly across firms (SD = 8.81%). Notably, 291 of the 420 firm-year observations (69%) have zero female directors, reflecting the limited female board representation in the Jordanian context. The implications of this distribution for statistical power are examined in Section 5.
The sample is split into two groups according to CEO overconfidence levels (Low OC vs. High OC) and board gender diversity (Low Gender Div. vs. High Gender Div.). The effective tax rate of high CEO overconfidence firms (11.02%) is lower than the effective tax rate of low CEO overconfidence firms (12.28%), which suggests that there is a possible relationship between CEO overconfidence and tax avoidance, as a lower effective tax rate indicates increased engagement in tax avoidance. Equally, firms that have greater board gender diversity are more likely to have higher ETRs (14.80%) than those with lower diversity (10.87%), suggesting that board gender composition may affect tax strategy. These results suggest initial support that, although overconfident CEOs might have more aggressive tax planning, the availability of females in the boardroom may alleviate this tendency. The control variables have a moderate variance. The average size of the firms (log of total assets) is 17.46 (SD 1.37), the average profitability is 1.87 per cent (SD 5.79), leverage is 36.52 per cent (SD 22.67), and the average age of the firms is 30 years (SD 15.97).
Table 3 provides Pearson’s correlation coefficients among all study variables and VIF statistics to verify multicollinearity. Both ETR and CFETR, as indicators of tax avoidance, are moderately positively correlated (r = 0.411, p < 0.01), thus suggesting that ETR can be a valid alternative measure of tax avoidance. The correlations between ETR and CFETR are very weak with CEO overconfidence; this implies that CEO overconfidence is not a sufficient factor to explain the differences in the effective tax rates of firms.
Gender diversity has strong positive correlations to the two tax avoidance measures (ETR = r = 0.168, p < 0.01; CFETR: r = 0.145, p < 0.01), suggesting that higher effective tax rates and less aggressive tax avoidance are also associated with boards having more female members. Firm size, profitability, and age are positively correlated with the dependent variables. Although leverage (LEV) has mixed correlations with control variables, all correlations between the control variables are less than 0.8, which implies that there are no multicollinearity issues (Kennedy, 2008). Furthermore, to address multicollinearity concerns in regression models, VIF statistics were calculated for all independent variables. VIF values are generally between 1.02 and 1.42, considerably below the standard 10 and even lower than 5, whichever is more conservative. These low VIF values suggest that multicollinearity does not pose a significant threat to the stability of regression coefficient estimates.

4.2. Panel Data Diagnostic Tests

Before estimating the main regression models, there were two diagnostic tests to determine the proper estimation technique and three diagnostic tests to detect possible violations of classical regression assumptions. Table 4 summarizes these diagnostic procedures on all four models.
Breusch–Pagan Lagrange Multiplier (LM) test was used to determine whether a pooled OLS regression is sufficient to describe the data or whether a panel data model is justified (Breusch & Pagan, 1980). All four models rejected the null hypothesis of no individual-specific effects models (Model 1: chibar2(01) = 126.76, p < 0.01; Model 2: chibar2(01) = 122.02, p < 0.01; Model 3: chibar2(01) = 10.53, p < 0.01; Model 4: chibar2(01) = 10.08, p < 0.01), indicating significant differences between firms and justifies the use of panel data estimation. The Hausman specification test, which evaluates the consistency of random effects versus fixed effects estimators, fails to reject the null hypothesis at the 5% significance level across all model specifications (Model 1: χ2 = 9.66, p = 0.086; Model 2: χ2 = 10.34, p = 0.170; Model 3: χ2 = 5.55, p = 0.352; Model 4: χ2 = 7.17, p = 0.412). These results consistently suggest that the random effects specification is more appropriate and consistent for all models.
The Wooldridge test for first-order autocorrelation reveals no evidence of serial correlation in any of the four models at p > 0.05, and the autocorrelation does not pose a significant problem in these models. The presence of heteroscedasticity in the panel data models was tested by the Modified Wald test of groupwise heteroskedasticity (Baum, 2001). The modified Wald test rejected the null hypothesis of homoscedastic errors in all models, with p = 0.000 ***, suggesting that severe heteroscedasticity can lead to inaccurate estimates and biased standard errors if left unchecked. The Pesaran CD test for cross-sectional dependence shows no significant evidence of contemporaneous correlation across firms (all p-values > 0.05), confirming that the panel observations are cross-sectionally independent. Given the presence of significant heteroscedasticity but the absence of autocorrelation and cross-sectional dependence, feasible generalized least squares (FGLS) estimation was employed as the primary analytical approach to obtain efficient parameter estimates with robust standard errors.

4.3. Main Regression Results: FGLS Estimation

Table 5 presents the FGLS regression results for all four models’ specifications examining the relationships among CEO overconfidence, gender diversity, and tax avoidance. Model 1 tests the direct effect of CEO overconfidence on ETR, revealing a significant negative relationship (β = −0.0286, p < 0.05). Therefore, the hypothesis (H1) is accepted. This result indicates that overconfident CEOs in firms are more likely to be involved in tax avoidance, which is reflected in a lower effective tax rate.
The negative relationship between CEO overconfidence and the ETR can be explained by the behavioral finance theory that states that overconfident executives are more likely to overrate their ability to handle tax risks and, at the same time, underestimate the possible regulatory and reputational costs associated with higher tax audits, financial fines, and negative perceptions related to aggressive tax practices. This cognitive bias enhances the chances of CEOs adopting more aggressive tax strategies, which will raise the degree of corporate tax avoidance. The result is also supported by the upper echelons theory, which assumes that the psychological characteristics of senior managers influence the process of strategic decision-making. Overconfident CEOs are more likely to overestimate their own abilities and expected performance and, in turn, pursue aggressive tax avoidance policies to maintain optimistic performance expectations and, at the same time, reduce their overall tax liabilities (Hsieh et al., 2018; Souguir et al., 2024). The agency theory also shows that executives can pursue opportunistic tax avoidance measures to maximize their own benefits and to boost short-term corporate performance (Zafira & Taqi, 2024).
Model 2 extends this analysis by including gender diversity as a moderator of the CEO overconfidence–tax avoidance relationship. The independent variable and moderator were mean-centered prior to defining the interaction term to prevent nonessential multicollinearity. The empirical results indicate that the effective tax rate is negatively and significantly associated with the centered CEO overconfidence variable (β = −0.0505, p < 0.1), meaning that overconfident CEOs are more likely to engage in higher tax avoidance. Furthermore, the interaction coefficient between centered CEO overconfidence and centered gender diversity has a negative and statistically significant coefficient (β = −0.092, p < 0.05), indicating that board gender diversity strengthens the negative relationship between CEO overconfidence and ETR—that is, accrual-based tax avoidance is amplified in firms with both overconfident CEOs and greater female board representation. Consequently, H2a is confirmed.
This result is consistent with the two complementary mechanisms. First, the compliance-endorsement mechanism suggests that female directors, through their compliance-oriented monitoring role, are more likely to support legally defensible accrual-based tax strategies that operate within established accounting frameworks, particularly when overconfident CEOs would otherwise neglect such strategies in favor of riskier approaches (Armstrong et al., 2015; Riguen et al., 2020). Second, as in the sophistication displacement mechanism (Holmström & Milgrom, 1991), overconfident CEOs—those who see the ability to cope with board scrutiny as a challenge to be overcome rather than a constraint to be accepted (Malmendier & Tate, 2005)—are also more likely to shift their tax-reducing activities toward less visible accrual-based mechanisms when board oversight is higher. Accrual-based methods rely on accounting estimates, timing differences, and financial reporting discretion that are more difficult for even diligent directors to uncover and challenge (Hanlon & Heitzman, 2010; Dyreng et al., 2008), offering overconfident CEOs another path by which to achieve tax-reduction goals and adjust to increased board scrutiny. Empirical evidence confirms that governance pressure can shift the composition rather than reduce the level of tax avoidance, with firms substituting toward more complex and less detectable strategies under scrutiny (Badertscher et al., 2013; Lennox et al., 2013). Prior evidence further supports that female directors can mitigate the consequences of CEO overconfidence and strengthen board monitoring effectiveness (Banerjee et al., 2018; L. H. Chen et al., 2019; Lakhal et al., 2023), yet this enhanced monitoring paradoxically encourages a substitution toward accrual-based tax strategies rather than eliminating tax-reduction incentives entirely. These findings extend the work of Lakhal et al. (2023), who found that overconfident CEOs are more likely to engage in tax avoidance, by demonstrating that gender diversity does not uniformly suppress avoidance but rather reshapes its composition.
Model 3 tests how the overconfidence of CEOs affects an alternative tax-avoidance measure, CFETR, that measures effective tax rates but is less prone to earnings management. CEO overconfidence is also negative, but not statistically significant (β = −0.00261, p > 0.10), meaning that the correlation between executive overconfidence and cash-based tax avoidance measures is weaker compared with the accrual-based ones. This pattern is consistent with the theoretical distinction, in which cash-based avoidance is characterized as more visible and risk-intensive, making it a less attractive channel for overconfident CEOs operating under enhanced board oversight (Hanlon & Heitzman, 2010; Dyreng et al., 2008). Furthermore, and consistent with H2b, the interaction coefficient for CFETR in Model 4 is positive and significant (β = 0.088, p < 0.05), meaning that female directors moderate the effect of overconfident CEOs on cash tax payments, constraining aggressive cash-based tax avoidance as predicted. Consequently, H2b is confirmed. This result is consistent with the monitoring argument in that female directors, given their stronger ethical sensitivity, awareness of reputational risks, and compliance orientation (Farooq et al., 2022), are well-positioned to identify and challenge visible cash-based strategies, raising the perceived and actual costs of overt tax avoidance (Adams & Ferreira, 2009; Lanis et al., 2017). This is consistent with Banerjee et al. (2018), who report mitigating effects of gender diverse boards in overconfident CEO-managed firms.
A combination of these two opposing trends—amplification of accrual-based avoidance and constraint of cash-based avoidance—supports our overall theoretical focus that gender diversity of the board of directors affects the composition of tax avoidance, not just the amount of tax avoidance, which is in line with H2a and H2b, respectively. The empirical results are consistent with agency theory which suggests that gender-diverse boards lead to more effective board control, stronger ethical board oversight, and more risk averse behavior (Ali et al., 2025; Bart & McQueen, 2013), and resource dependence theory which argues that gender diversity on boards introduces a wider range of cognitive and ethical views that improve governance, especially in emerging markets where CEO discretionary power is high (Hillman & Dalziel, 2003; Pfeffer & Salancik, 1978; Lakhal et al., 2023). Furthermore, the findings align with L. H. Chen et al. (2019) who report that more gender-diverse boards are more likely to be “cautious” about reputational risks associated with aggressive tax policies, supporting the political-cost theory.
It is important to be careful and transparent in interpreting the amplification of accrual-based tax avoidance that can be observed in firms with female directors and overconfident CEOs. Two competing explanations deserve equal consideration. The first, the compliance-endorsement and sophistication displacement explanation, suggests that female directors are actively promoting legally defensible accrual-based strategies while overconfident CEOs are channeling tax avoidance into less detectable pathways as a result of increased monitoring (Armstrong et al., 2015; Holmström & Milgrom, 1991; Badertscher et al., 2013). The simultaneous constraint on CFETR lends credibility to this interpretation, pointing toward deliberate strategic adaptation rather than governance breakdown. The second (governance failure explanation) indicates that although the female directors are diligent and ethical, they may not have the financial expertise to identify and question sophisticated accrual-based strategies, allowing their intensification to pass them by. While we favor the first explanation as theoretically more parsimonious—given that a pure governance failure would more plausibly produce consistent amplification across both tax avoidance measures rather than the divergent pattern observed—we acknowledge that the current research design cannot fully distinguish between them, leaving this an important question for future research.
The control variables had the same effects, as expected, in all four models. Firm size (SIZE) had a statistically significant positive correlation (0.036–0.041 ***)—meaning that larger firms face greater effective tax rates (ETR) and cash flow effective tax rates (CFETR) due to increased regulatory scrutiny. Profitability (PROF) also showed a positive and statistically significant correlation (0.054–0.304 ***), whereby more profitable firms pay higher taxes. Leverage (LEV) had a positive correlation in ETR models (0.001 *), and a slightly negative coefficient in CFETR models (−0.0002 to −0.002 *), suggesting minimal cash savings from debt financing. Firm age (AGE) had a positive and significant correlation (0.0001–0.0058 ***), meaning that the older a firm is more likely to comply with tax regulations. The robustness of the effects of the control variables across the four models provides further support that our results related to CEO overconfidence, gender diversity, and tax avoidance are not due to omitted firm characteristics (Hanlon & Heitzman, 2010).

5. Robustness Tests

5.1. Additional Tests

Several additional tests were performed to test the validity and stability of the main results. First, we re-estimated all models with industry fixed effects, the random effects estimator, and Driscoll–Kraay standard errors. This approach was driven by the result of a preliminary t test which shows that the mean value of the effective tax rate (ETR) and the cash flow effective tax rate (CFETR) are significantly different between manufacturing (0.2016 and 0.0560) and service (0.0992 and 0.0755) sectors, respectively, which suggests that time-invariant industry heterogeneity should be controlled for.
The results regarding the effect of CEO overconfidence on tax avoidance are reported in Table 6, and the board gender diversity is also included as a moderating variable. The interaction coefficient for ETR is negative and significant (β = −0.048, p < 0.1), while that for CFETR is positive and significant (β = 0.0626, p < 0.1), which is similar to our primary results. The coefficients obtained from the random-effects model with Driscoll–Kraay standard errors are smaller than the original FGLS estimates (β = −0.092 for ETR and β = 0.088 for CFETR), which is not surprising. The main FGLS models control for year effects only, while Table 6 additionally absorbs industry heterogeneity. As the preliminary t-test confirms, tax avoidance patterns differ meaningfully across industries, so this additional control naturally attenuates the coefficients. The conservative nature of Driscoll–Kraay standard errors, with only 70 clusters, further explains the reduction in precision. That the signs and significance hold across both specifications, with further corroboration from the subsample analysis in Table 7 and the additional robustness check in Table 8, gives us confidence in the reliability of these findings.
Second, a subsample analysis is conducted to examine whether COVID-19 affects the results reported in the preceding tables. The prior empirical literature suggests that tax avoidance increased during the COVID-19 pandemic compared to the pre-pandemic period (see, for example, Athira & Ramesh, 2023). To ensure that our findings are not driven by the pandemic period, we divide the sample into two sub-periods: 2019 as the pre-pandemic baseline, and 2020–2024 as the COVID-19 shock period. Notably, the results of the t-test analysis (untabulated) indicate a significant difference (p < 0.1) between the two periods, showing that tax avoidance increased during the pandemic period among the firms in our sample, which is consistent with prior studies. Moreover, the subsample results reported in Table 7 indicate that the effects of CEO overconfidence, gender diversity, and the interaction terms on ETR remain robust across both periods, while a slight difference is observed for CFETR.

5.2. Endogeneity Test

To address potential endogeneity concerns, this study employed the Durbin–Wu–Hausman test to determine whether the variables of interest were endogenous. The findings confirmed the presence of endogeneity, indicating that the residuals were correlated with the explanatory variables, namely, CEO overconfidence. To tackle this concern, the instrumental variable approach (2SLS) was employed (Hyasat et al., 2025). Following the established literature, we instrument CEO (CEOOVER) using the industry-year median CEO overconfidence measure, while gender diversity (GEND) is instrumented using industry-level gender composition. The results of the first stage (untabulated) confirm the relevance of the instruments, with statistically significant coefficients and F-statistics exceeding the conventional threshold of 10. The second-stage results are reported using IV estimations, ensuring consistent parameter estimates under potential endogeneity. Table 8 presents the second-stage GMM-IV estimation results. In this stage, the fitted values generated from the first-stage estimation were used to assess their impact on tax avoidance. The results of this test are consistent with those obtained from the main tests.
As an additional robustness test for endogeneity, the dynamic panel GMM using xtabond2 (Blundell–Bond system GMM) with two-step robust standard errors is conducted. In this test (untabulated), CEO overconfidence (CEOOVER), gender diversity (GEND), and their interaction are considered as endogenous, and instrumented by their own first. The Hansen J test fails to reject instrument validity (p > 0.10), and the AR(2) test indicates no second-order serial correlation (p > 0.10). The coefficients and significance levels of the main variables remain consistent with our IV-2SLS results, confirming that our findings are robust to alternative endogeneity corrections.
Table 8. Estimates of IV 2SLStest (Second-Stage).
VariablesModel 1: ETRModel 2: ETR (GEND/Interaction)Model 3: CFETRModel 4: CFETR (GEND/Interaction)
CEOOVER−0.042 *−0.052 *−0.021−0.031
GEND0.1791.1490.036 *0.072
CEOVER ∗ GEND−0.044 *0.02 *
SIZE0.0435 ***0.0511 ***0.0463 ***0.0472 ***
PROF0.451 ***0.0422 ***0.021 ***0.031 ***
LEV0.0010.001−0.0002−0.001
AGE0.006 ***0.006 ***0.004−0.003
_cons−0.142−0.0680.070 ***0.069 ***
Observations341341342342
R-squared0.2770.2770.2010.202
Year DummyYes Yes Yes Yes
Notes: * p < 0.10, *** p < 0.01. Table 8 reports the IV-2SLS coefficients for the endogenous variables (CEOOVER, GEND, CEOVER ∗ GEND). All models include control variables and year fixed effects. First-stage F-statistics exceed 10, Hansen J overidentification p-values are > 0.10, and Durbin–Wu–Hausman tests reject exogeneity (p < 0.05), confirming the appropriateness of the IV approach.

5.3. Sensitivity Tests

5.3.1. Robustness to Alternative CEO Overconfidence Measures

The main analysis employs an equal-weighted composite index of six CEO characteristics to proxy for overconfidence. One limitation of this approach is that each trait is assumed to have an equal contribution to the underlying psychological bias. To examine the robustness of our results to this assumption, we re-estimated all the models with the three alternative specifications of the CEO overconfidence measure. First, we constructed a PCA-weighted index derived from the first principal component of the six items, which assigns data-driven weights based on their covariance structure. The first principal component explained 41.3% of the total variance. The component loadings were as follows: political connections (0.51), young age (0.48), master’s degree (0.45), long tenure (0.43), male gender (0.42), financial background (0.41), confirming that the items do not contribute equally to the underlying construct. Second, we created a binary indicator equal to 1 if the original composite score was 3 or higher (a median split). Third, we removed the gender component from the original index to address potential overlap with the moderating variable (board gender diversity). As reported in Table 9, the results remain highly consistent across alternative measures of CEO overconfidence. For ETR, the direct effect of CEO overconfidence remains negative and statistically significant across all specifications, ranging from −0.046 to −0.052, while the interaction term with board gender diversity ranges from −0.069 to −0.091 (all p < 0.05). Similarly, for CFETR, the interaction term remains positive and statistically significant across all alternative specifications, ranging from 0.052 to 0.087 (all p < 0.05), whereas the direct effect of CEO overconfidence remains statistically insignificant. These findings indicate that the results are not driven by the specific construction of the CEO overconfidence measure and remain robust to alternative weighting schemes, component definitions, and index specifications.

5.3.2. Sensitivity Analysis: Firms with Female Board Representation

One more potential concern arising from the low mean female board representation (5.21%, SD = 8.81%) is that the interaction result may be driven by the large proportion of firm-year observations with zero female directors (291 observations, 69% of the sample) rather than reflecting a genuine moderating effect within firms that have meaningful female board representation. To address this concern, we re-estimated Models 2 and 4 using only the 129 firm-year observations with at least one female director. The results (untabulated) of this test indicate that the interaction coefficients remain directionally consistent and statistically significant (ETR: β = −0.04, p < 0.1; CFETR: β = 0.047, p < 0.1), confirming that the moderating effect is not an artifact of the zero-representation subgroup and that the interaction is identified from firms with genuine female board presence.

6. Conclusions

The purpose of this paper is to analytically examine the relationship between CEO overconfidence and corporate tax avoidance while also accounting for the moderating effect of gender diversity. Using a sample of Jordanian industrial and service sector firms listed on the Amman stock exchange (ASE) between 2019 and 2024, the empirical evidence indicates that the CEO overconfidence has a negative effect on both the accrual-based (ETR) and cash-based (CFETR) tax rates, which means that there is a tendency towards more aggressive tax avoidance strategies. The results also demonstrate that the gender diversity in boards has a subtle moderating effect on this relationship. In particular, the presence of female directors strengthens the relationship between CEO overconfidence and accrual-based tax planning, suggesting that increased board scrutiny may push overconfident CEOs towards more sophisticated, accounting-based tax planning rather than cash-based tax avoidance. Conversely, the positive interaction effect of CFETR indicates that female directors on boards decrease the cash-based tax avoidance and, therefore, increase cash tax payments. This pattern is in line with the agency theory, reputation theory, and political cost factors, whereby gender-diverse boards enhance the quality of oversight, improve compliance with ethical standards, and heighten awareness of operational and reputational risks. In general, the findings indicate that board gender diversity does not uniformly reduce tax avoidance but rather reshapes its form, channeling overconfident CEOs’ tax behavior toward more compliant and less transparent strategies.
Based on the findings, several practical recommendations emerge for strengthening governance and reducing tax avoidance. Firstly, boards are encouraged to improve the technical skills of female board members in tax-related areas and to involve them more effectively in audit and risk committee discussions, as ethical and behavioral oversight may not be sufficient to identify complex and opaque tax avoidance structures. Secondly, the behavioral traits of chief executives, such as overconfidence, should be systematically assessed by the board members when evaluating the tax strategies, since empirical evidence shows that overconfident executives are more likely to engage in aggressive tax minimization; therefore, increased monitoring is essential to ensure legal and ethical compliance. Thirdly, regulators and tax authorities should differentiate between accounting effective tax rates and effective cash flow tax rates in monitoring and enforcement practices, using separate indicators and reporting requirements. Finally, in emerging markets, firms should improve their transparent tax governance by establishing internal tax risk management committees and enhancing the disclosure of tax estimates and liabilities. This is beneficial for tax compliance and reduces reputational risks.
This study has several limitations. First, the use of a composite index as a proxy for overconfidence is an indirect method, as options-based is not available in the Jordanian context. While the results of our research support the sophistication-displacement mechanism, we cannot directly observe the CEO’s intentions or the process through which this displacement takes place. The overconfidence index is multidimensional, but it cannot be directly used to measure the process of cognitive substitution hypothesized in H2b, which therefore remains an inferential argument. Future research could tackle this by qualitative analysis or by using more granular tax strategy data that would allow for direct observation of changes in tax planning behavior at the firm level. Second, while the average female board representation ratio in our sample is low (5.2%), many firms do not have any female directors on the boardroom. This, in turn, limits the generalizability of our results. Future research could replicate the study in other emerging markets with more substantial female board representation and utilize different methods for measuring CEO overconfidence. Third, our sample only includes a year before COVID-19 (2019), which may influence the findings of the subsample analysis. Future studies could use a longer time frame to include additional years before, during, and after the COVID-19 pandemic to gain a better understanding of the proposed relationships. Future studies can also consider the influence of specific female director characteristics (such as financial expertise, board experience, and independence) rather than simply counting their numbers or percentages.


Author Contributions

Conceptualization, A.S., H.B., E.A.H.H. and A.D.A.A.; methodology, H.B. and A.S.; software, H.B.; validation, A.S., E.A.H.H. and A.D.A.A.; formal analysis, H.B. and A.S.; investigation, H.B.; resources, A.S.; data curation, A.D.A.A.; writing—original draft preparation, H.B. and A.S.; writing—review and editing, A.S.; visualization, E.A.H.H.; supervision, A.S.; project administration, A.S. All authors have read and agreed to the published version of the manuscript.

Funding

This research received no external funding.

Institutional Review Board Statement

Not applicable.

Informed Consent Statement

Not applicable.

Data Availability Statement

The data used in this study are available upon request.

Conflicts of Interest

The authors declare no conflicts of interest.

References

  1. Adams, R. B., & Ferreira, D. (2009). Women in the boardroom and their impact on governance and performance. Journal of Financial Economics, 94(2), 291–309. [Google Scholar] [CrossRef]
  2. Ahmed, A. S., & Duellman, S. (2013). Managerial overconfidence and accounting conservatism. Journal of Accounting Research, 51(1), 1–30. [Google Scholar]
  3. Ali, R., Amin, A., Rehman, R. U., & Elamer, A. A. (2025). Gender diversity in boardrooms: The impact of female co-opted directors on corporate governance, firm risk, and firm value. International Journal of Manpower, 46(8), 1389–1417. [Google Scholar] [CrossRef]
  4. Aliani, K., Mhamid, I., & Rossi, M. (2016). Does CEO overconfidence influence tax planning? Evidence from Tunisian context. International Journal of Managerial and Financial Accounting, 8(3–4), 197–208. [Google Scholar] [CrossRef]
  5. Alkurdi, A., Almarayeh, T., Bataineh, H., Al Amosh, H., & Khatib, S. F. (2024a). Corporate profitability and effective tax rate: The moderating role of board gender diversity. Journal of Islamic Accounting and Business Research, 15(1), 153–171. [Google Scholar]
  6. Alkurdi, A., Bataineh, H., Al Tarawneh, E. M., & Khatib, S. F. (2024b). Institutional investors’ impact on sustainability disclosure: Exploring the moderating role of financial performance. Journal of Financial Reporting and Accounting. Advance online publication. [Google Scholar] [CrossRef]
  7. Almaharmeh, M. I., Shehadeh, A., Alkayed, H., Aladwan, M., & Iskandrani, M. (2024). Family ownership, corporate governance quality and tax avoidance: Evidence from an emerging market—The case of Jordan. Journal of Risk and Financial Management, 17(2), 86. [Google Scholar] [CrossRef]
  8. Alqatamin, R. M., Aribi, Z. A., & Arun, T. (2017). The effect of the CEO’s characteristics on EM: Evidence from Jordan. International Journal of Accounting & Information Management, 25(3), 356–375. [Google Scholar] [CrossRef]
  9. Alshabibi, B., Pria, S., & Hussainey, K. (2022). Nationality diversity in corporate boards and tax avoidance: Evidence from Oman. Administrative Sciences, 12(3), 111. [Google Scholar] [CrossRef]
  10. Amin, A., Ur Rehman, R., Ali, R., & Ntim, C. G. (2022). Does gender diversity on the board reduce agency cost? Evidence from Pakistan. Gender in Management: An International Journal, 37(2), 164–181. [Google Scholar]
  11. Ananzeh, H. (2024). Audit committee financial expertise and internal control weakness: Does CEO overconfidence matter? Journal of Financial Reporting and Accounting. Advance online publication. [Google Scholar] [CrossRef]
  12. Armstrong, C. S., Blouin, J. L., Jagolinzer, A. D., & Larcker, D. F. (2015). Corporate governance, incentives, and tax avoidance. Journal of Accounting and Economics, 60(1), 1–17. [Google Scholar] [CrossRef]
  13. Armstrong, C. S., Blouin, J. L., & Larcker, D. F. (2012). The incentives for tax planning. Journal of Accounting and Economics, 53(1–2), 391–411. [Google Scholar] [CrossRef]
  14. Athira, A., & Ramesh, V. K. (2023). COVID-19 and corporate tax avoidance: International evidence. International Business Review, 32(4), 102143. [Google Scholar] [CrossRef] [PubMed]
  15. Badertscher, B. A., Katz, S. P., & Rego, S. O. (2013). The separation of ownership and control and corporate tax avoidance. Journal of Accounting and Economics, 56(2–3), 228–250. [Google Scholar] [CrossRef]
  16. Baghdadi, G., Podolski, E. J., & Veeraraghavan, M. (2022). CEO risk-seeking and corporate tax avoidance: Evidence from pilot CEOs. Journal of Corporate Finance, 76, 102282. [Google Scholar] [CrossRef]
  17. Banerjee, S., Masulis, R. W., & Upadhyay, A. (2018). Mitigating effects of gender diverse boards in companies managed by overconfident CEOs (Research Paper). Stevens Institute of Technology School of Business. [Google Scholar]
  18. Bart, C., & McQueen, G. (2013). Why women make better directors. International Journal of Business Governance and Ethics, 8(1), 93–99. [Google Scholar] [CrossRef]
  19. Bataineh, H. (2025). The moderating effect of female directors on the relationship between ownership structure and tax avoidance practices. Journal of Risk and Financial Management, 18(7), 350. [Google Scholar] [CrossRef]
  20. Baum, C. F. (2001). Residual diagnostics for cross-section time series regression models. The Stata Journal, 1(1), 101–104. [Google Scholar] [CrossRef]
  21. Ben-David, I., Graham, J. R., & Harvey, C. R. (2013). Managerial miscalibration. The Quarterly Journal of Economics, 128(4), 1547–1584. [Google Scholar] [CrossRef]
  22. Breusch, T. S., & Pagan, A. R. (1980). The Lagrange multiplier test and its applications to model specification in econometrics. The Review of Economic Studies, 47(1), 239–253. [Google Scholar] [CrossRef]
  23. Carrer, G., & Slavov, T. (2021). Tax aggressiveness and CEO overconfidence in the stock market: Evidence from Brazil. Investment Management & Financial Innovations, 18(1), 165. [Google Scholar] [CrossRef]
  24. Chen, L. H., Gramlich, J., & Houser, K. A. (2019). The effects of board gender diversity on a firm’s risk strategies. Accounting & Finance, 59(2), 991–1031. [Google Scholar]
  25. Chen, S., Chen, X., Cheng, Q., & Shevlin, T. (2010). Are family firms more tax aggressive than non-family firms? Journal of Financial Economics, 95(1), 41–61. [Google Scholar] [CrossRef]
  26. Chen, X., Hu, N., Wang, X., & Tang, X. (2014). Tax avoidance and firm value: Evidence from China. Nankai Business Review International, 5(1), 25–42. [Google Scholar] [CrossRef]
  27. Chyz, J. A., Gaertner, F. B., Kausar, A., & Watson, L. (2019). Overconfidence and corporate tax policy. Review of Accounting Studies, 24(3), 1114–1145. [Google Scholar] [CrossRef]
  28. Cordeiro, L. (2009). Managerial overconfidence and dividend policy. SSRN. Available online: https://ssrn.com/abstract=1343805 (accessed on 18 April 2026).
  29. Dakhli, A. (2022). Do women on corporate boardrooms have an impact on tax avoidance? The mediating role of corporate social responsibility. Corporate Governance: The International Journal of Business in Society, 22(4), 821–845. [Google Scholar]
  30. Dang, V. C., & Nguyen, Q. K. (2022). Audit committee characteristics and tax avoidance: Evidence from an emerging economy. Cogent Economics & Finance, 10(1), 2023263. [Google Scholar] [CrossRef]
  31. Dyreng, S. D., Hanlon, M., & Maydew, E. L. (2008). Long-run corporate tax avoidance. The Accounting Review, 83(1), 61–82. [Google Scholar] [CrossRef]
  32. Dyreng, S. D., Hanlon, M., & Maydew, E. L. (2010). The effects of executives on corporate tax avoidance. The Accounting Review, 85(4), 1163–1189. [Google Scholar] [CrossRef]
  33. Dyreng, S. D., Hanlon, M., Maydew, E. L., & Thornock, J. R. (2017). Changes in corporate effective tax rates over the past 25 years. Journal of Financial Economics, 124(3), 441–463. [Google Scholar] [CrossRef]
  34. Edwards, A., Schwab, C., & Shevlin, T. (2016). Financial constraints and cash tax savings. The Accounting Review, 91(3), 859–881. [Google Scholar]
  35. Farooq, M. U., Su, K., Boubaker, S., & Gull, A. A. (2022). Does gender promote ethical and risk-averse behavior among CEOs? An illustration through related-party transactions. Finance Research Letters, 47, 102730. [Google Scholar] [CrossRef]
  36. Francis, B., Hasan, I., Park, J. C., & Wu, Q. (2015). Gender differences in financial reporting decision making: Evidence from accounting conservatism. Contemporary Accounting Research, 32(3), 1285–1318. [Google Scholar]
  37. García-Meca, E., Ramón-Llorens, M. C., & Martínez-Ferrero, J. (2021). Are narcissistic CEOs more tax aggressive? The moderating role of internal audit committees. Journal of Business Research, 129, 223–235. [Google Scholar] [CrossRef]
  38. Gervais, S., Heaton, J. B., & Odean, T. (2011). Overconfidence, compensation contracts, and capital budgeting. The Journal of Finance, 66(5), 1735–1777. [Google Scholar] [CrossRef]
  39. Gilson, S. C. (1989). Management turnover and financial distress. Journal of Financial Economics, 25(2), 241–262. [Google Scholar] [CrossRef]
  40. Goel, A. M., & Thakor, A. V. (2008). Overconfidence, CEO selection, and corporate governance. The Journal of Finance, 63(6), 2737–2784. [Google Scholar] [CrossRef]
  41. Gull, A. A., Nekhili, M., Nagati, H., & Chtioui, T. (2018). Beyond gender diversity: How specific attributes of female directors affect earnings management. The British Accounting Review, 50(3), 255–274. [Google Scholar] [CrossRef]
  42. Hackbarth, D. (2008). Managerial traits and capital structure decisions. Journal of Financial and Quantitative Analysis, 43(4), 843–881. [Google Scholar] [CrossRef]
  43. Hambrick, D. C. (2007). Upper echelons theory: An update. Academy of Management Review, 32(2), 334–343. [Google Scholar] [CrossRef]
  44. Hambrick, D. C., & Mason, P. A. (1984). Upper echelons: The organization as a reflection of its top managers. Academy of Management Review, 9(2), 193–206. [Google Scholar] [CrossRef]
  45. Hanlon, M., & Heitzman, S. (2010). A review of tax research. Journal of Accounting and Economics, 50(2–3), 127–178. [Google Scholar] [CrossRef]
  46. Heaton, J. B. (2002). Managerial optimism and corporate finance. Financial Management, 31(2), 33–45. [Google Scholar] [CrossRef]
  47. Hillman, A. J., & Dalziel, T. (2003). Boards of directors and firm performance: Integrating agency and resource dependence perspectives. Academy of Management Review, 28(3), 383–396. [Google Scholar] [CrossRef]
  48. Hirshleifer, D., Low, A., & Teoh, S. H. (2012). Are overconfident CEOs better innovators? The Journal of Finance, 67(4), 1457–1498. [Google Scholar] [CrossRef]
  49. Holmström, B., & Milgrom, P. (1991). Multitask principal-agent analyses: Incentive contracts, asset ownership, and job design [Special Issue]. Journal of Law, Economics, & Organization, 7, 24–52. [Google Scholar]
  50. Hoseini, M., Safari Gerayli, M., & Valiyan, H. (2019). Demographic characteristics of the board of directors’ structure and tax avoidance: Evidence from Tehran Stock Exchange. International Journal of Social Economics, 46(2), 199–212. [Google Scholar] [CrossRef]
  51. Hossain, M. S., Islam, M. Z., Ali, M. S., Safiuddin, M., Ling, C. C., & Fung, C. Y. (2025). The nexus of tax avoidance and firms characteristics–does board gender diversity have a role? Evidence from an emerging economy. Asia-Pacific Journal of Business Administration, 17(2), 401–427. [Google Scholar]
  52. Hsieh, T.-S., Wang, Z., & Demirkan, S. (2018). Overconfidence and tax avoidance: The role of CEO and CFO interaction. Journal of Accounting and Public Policy, 37(3), 241–253. [Google Scholar] [CrossRef]
  53. Hyasat, E., Shatnawi, A., Alsharairi, M., & Moh’D Ababneh, A. (2025). Board CSR committees and environmental management teams: An empirical analysis of their complimentary effect on environmentally responsible performance. Faculty of Mediterranean Business Studies Tivat, Montenegro, 21(2), 57–74. [Google Scholar]
  54. Jarboui, A., Kachouri Ben Saad, M., & Riguen, R. (2020). Tax avoidance: Do board gender diversity and sustainability performance make a difference? Journal of Financial Crime, 27(4), 1389–1408. [Google Scholar] [CrossRef]
  55. Jensen, M. C., & Meckling, W. H. (1976). Theory of the firm: Managerial behavior, agency costs and ownership structure. Journal of Financial Economics, 3(4), 305–360. [Google Scholar] [CrossRef]
  56. Karavitis, P., Kazakis, P., & Xu, T. (2025). Overconfident CEOs, corporate social responsibility, and tax avoidance: Evidence from China. Journal of International Accounting, Auditing and Taxation, 59, 100702. [Google Scholar] [CrossRef]
  57. Kennedy, P. (2008). A guide to econometrics (6th ed.). Blackwell Publishing. [Google Scholar]
  58. Khaoula, A., & Ali, Z. M. (2012). The board of directors and the corporate tax planning: Empirical evidence from Tunisia. International Journal of Accounting and Financial Reporting, 2(2), 142–157. [Google Scholar] [CrossRef]
  59. Khelil, I., & Khlif, H. (2023). Tax avoidance in family firms: A literature review. Journal of Financial Crime, 30(4), 1021–1035. [Google Scholar]
  60. Koester, A., Shevlin, T., & Wangerin, D. (2017). The role of managerial ability in corporate tax avoidance. Management Science, 63(10), 3285–3310. [Google Scholar] [CrossRef]
  61. Kubick, T. R., & Lockhart, G. B. (2017). Overconfidence, CEO awards, and corporate tax aggressiveness. Journal of Financial and Quantitative Analysis, 52(2), 811–836. [Google Scholar]
  62. Lakhal, F., Khemiri, S., Bacha, S., & Guizani, A. (2023). CEO overconfidence and tax practices: Does board gender diversity matter? Management International, 27(4), 10–22. [Google Scholar] [CrossRef]
  63. Lanis, R., Richardson, G., & Taylor, G. (2017). Board of director gender and corporate tax aggressiveness: An empirical analysis. Journal of Business Ethics, 144(3), 577–596. [Google Scholar]
  64. Lassoued, N., Khanchel, I., & Belhoula, M. M. (2025). The tell-tale tone: Negative tone disclosure and tax avoidance in MENA Banks. Managerial and Decision Economics, 46(8), 4155–4169. [Google Scholar] [CrossRef]
  65. Lee, J. E. (2016). CEO overconfidence and the effectiveness of internal control over financial reporting. Journal of Applied Business Research, 32(1), 81. [Google Scholar]
  66. Lennox, C., Lisowsky, P., & Pittman, J. (2013). Tax aggressiveness and accounting fraud. Journal of Accounting Research, 51(4), 739–778. [Google Scholar] [CrossRef]
  67. Li, J., & Tang, Y. (2010). CEO hubris and firm risk taking in China: The moderating role of managerial discretion. Academy of Management Journal, 53(1), 45–68. [Google Scholar] [CrossRef]
  68. Li, Z., & Zhang, Y. (2022). CEO overconfidence and corporate innovation outcomes: Evidence from China. Frontiers in Psychology, 13, 760102. [Google Scholar] [CrossRef] [PubMed]
  69. Listiani, N., Supramono, S., Damayanti, T. W., & Nugrahanti, Y. W. (2025). CEO overconfidence and tax aggressiveness: The role of CEO age and firm size. Oradea Journal of Business and Economics, 10(2), 84. [Google Scholar]
  70. Malmendier, U., & Tate, G. (2005). CEO overconfidence and corporate investment. The Journal of Finance, 60(6), 2661–2700. [Google Scholar] [CrossRef]
  71. Malmendier, U., & Tate, G. (2008). Who makes acquisitions? CEO overconfidence and the market’s reaction. Journal of Financial Economics, 89(1), 20–43. [Google Scholar] [CrossRef]
  72. Nassar, M. A., Zaidan, H., Shakhshir, M. I., & Ahmad, A. L. (2024). The impact of family ownership on tax avoidance in Jordan: The moderating effect of audit quality. In Achieving sustainable business through AI, technology education and computer science: Volume 2: Teaching technology and business sustainability (pp. 487–498). Springer. [Google Scholar]
  73. Pfeffer, J., & Salancik, G. R. (1978). The external control of organizations: A resource dependence perspective. Harper & Row. [Google Scholar]
  74. Riguen, R., Salhi, B., & Jarboui, A. (2019). Female directors and corporate tax avoidance: Evidence from the Tunisian context. International Journal of Law and Management, 61(2), 583–598. [Google Scholar]
  75. Riguen, R., Salhi, B., & Jarboui, A. (2020). Do women on boards represent less corporate tax avoidance? A moderation analysis. International Journal of Sociology and Social Policy, 40(1–2), 114–132. [Google Scholar] [CrossRef]
  76. Salehi, M., Tarighi, H., & Shahri, T. A. (2020). The effect of auditor characteristics on tax avoidance of Iranian companies. Journal of Asian Business and Economic Studies, 27(2), 119–134. [Google Scholar] [CrossRef]
  77. Schrand, C. M., & Zechman, S. L. (2012). Executive overconfidence and the slippery slope to financial misreporting. Journal of Accounting and Economics, 53(1–2), 311–329. [Google Scholar] [CrossRef]
  78. Shatnawi, A., Al-Gasawneh, J., Mansur, H., & Alresheedi, A. (2022). The effect of board nationality and educational diversity on CSR performance: Empirical evidence from Australian companies. Uncertain Supply Chain Management, 10(4), 1467–1478. [Google Scholar] [CrossRef]
  79. Shatnawi, A. A. (2021). The impact of board CSR orientation on CSR strategy, CSR, and earnings management [Doctoral dissertation, Queensland University of Technology]. [Google Scholar] [CrossRef]
  80. Souguir, Z., Lassoued, N., & Bouzgarrou, H. (2024). CEO overconfidence and tax avoidance: Role of institutional and family ownership. International Journal of Managerial Finance, 20(3), 768–793. [Google Scholar]
  81. Souguir, Z., Lassoued, N., Khanchel, I., & Bejaoui, E. (2025). Behind the screens: Digital transformation and tax policy. Journal of Risk and Financial Management, 18(7), 390. [Google Scholar] [CrossRef]
  82. Srinidhi, B., Gul, F. A., & Tsui, J. (2011). Female directors and earnings quality. Contemporary Accounting Research, 28(5), 1610–1644. [Google Scholar] [CrossRef]
  83. Sumiyana, S., Na’im, A., Nugroho, A. H., & Kurniawan, F. (2023). Multiple measurements of CEOs’ overconfidence and future earnings management: Evidence from Asia-Pacific developing countries. Humanities and Social Sciences Communications, 10(1), 743. [Google Scholar] [CrossRef]
  84. Sutrisno, P., Utama, S., Anitawati Hermawan, A., & Fatima, E. (2022). Founder and descendant vs. professional CEO: Does CEO overconfidence affect tax avoidance in the Indonesia case? Economies, 10(12), 327. [Google Scholar] [CrossRef]
  85. Taylor, S. E., & Brown, J. D. (1988). Illusion and well-being: A social psychological perspective on mental health. Psychological Bulletin, 103(2), 193. [Google Scholar] [CrossRef] [PubMed]
  86. Weinstein, N. D. (1980). Unrealistic optimism about future life events. Journal of Personality and Social Psychology, 39(5), 806. [Google Scholar] [CrossRef]
  87. Zafira, A., & Taqi, M. (2024). The influence of the cost of debt on tax avoidance with managerial opportunism and company size as moderation variables. Business and Sustainability, 3(1). [Google Scholar] [CrossRef]
Figure 1. Conceptual framework illustrating the direct effects of CEO overconfidence on accrual-based tax avoidance (ETR) and cash-based tax avoidance (CFETR) and the moderating role of board gender diversity in both relationships.
Jrfm 19 00512 g001
Table 1. Variables Measurements.
VariableAbbreviationMeasurementPrevious Literature
Panel A. Dependent Variable (Tax Avoidance)
Effective Tax Rate ETRTotal tax expense divided by pre-tax incomeSouguir et al. (2024), Bataineh (2025), and Alkurdi et al. (2024a)
Cash Flow Effective Tax Rate CFETRTotal tax expenses divided by operating cash flowsNassar et al. (2024), Hanlon and Heitzman (2010), and Dyreng et al. (2008).
Panel B. Independent Variable (CEO Overconfidence)
CEO OverconfidenceCEOVERConfidence Level = Gender + Age + Educational Level + Financial Background + Tenure+ Political ConnectionsIn accordance with the conceptual framework of Z. Li and Zhang (2022) and Ananzeh (2024).
Panel C. Moderating Variable (Gender Diversity)
Gender DiversityGENDPercentage of female directors on the firm’s board of directors.Jarboui et al. (2020), Lakhal et al. (2023), and Ali et al. (2025)
Panel D. Control Variables
Firm SizeSIZENatural logarithm of total assets at year-endAlkurdi et al. (2024b)
Firm ProfitabilityPROFNet income to total assets ratioJarboui et al. (2020) and Hossain et al. (2025)
Firm LeverageLEVThe ratio of total firm debt to total assets.Baghdadi et al. (2022) and Souguir et al. (2024)
Firm AgeAGENumber of years since the firm’s inception as a listed corporationSalehi et al. (2020) and Amin et al. (2022).
Table 2. Descriptive Statistics of Study Variables.
VariablesFull SampleCEO OverconfidenceGender Diversity
Low OCHigh OCLow Gender Div.High Gender Div.
MeanSDMeanSDMeanSDMeanSDMeanSD
ETR0.11860.11700.12280.11270.11020.12520.10870.11920.14800.1053
CFETR0.07120.12770.07000.12540.07360.13270.05920.11910.10670.1454
CEOOVER2.98811.05792.99041.06792.98111.0326
GEND0.05210.08810.05060.08530.05500.0937
SIZE17.45721.367917.44211.289517.48771.518517.37331.390817.70581.2717
PROF1.87335.78512.02265.75351.57165.85771.03085.70324.36915.3084
LEV36.519522.666035.024022.138239.542823.488038.903623.267729.457119.2070
AGE29.959515.965128.829214.892732.244617.776729.308915.707531.886816.6318
Table 3. Pearson Correlation Matrix and Variance Inflation Factors.
VariablesETRCFETRCEOOVERGENDSIZEPROFLEVAGEVIF
ETR1 -
CFETR0.411 ***1 -
CEOOVER−0.067−0.021 1.02
GEND0.168 ***0.145 ***0.0231 1.07
SIZE0.331 ***0.200 ***0.092 *0.140 ***1 1.42
PROF0.444 ***0.392 ***−0.0180.217 ***0.229 ***1 1.26
LEV−0.008−0.146 ***0.097 **−0.137 ***0.297 ***−0.289 ***1 1.34
AGE0.205 ***0.156 ***−0.020.030.301 ***0.108 **−0.04711.14
Significant levels are: * p < 0.10, ** p < 0.05, *** p < 0.01. VIF values lower than 10 indicate the absence of severe multicollinearity issues.
Table 4. Summary of Diagnostic Test Results.
Diagnostic TestModel 1: ETRModel 2: ETR (GEND/Interaction)Model 3: CFETRModel 4: CFETR (GEND/Interaction)
Lagrange Multiplier (Breusch–Pagan RE)chibar2(01) = 126.76, p = 0.000 ***chibar2(01) = 122.02, p = 0.000 ***chibar2(01) = 10.53, p = 0.001 ***chibar2(01) = 10.08, p = 0.001 ***
Hausman Test (FE vs. RE)χ2(5) = 9.66, p = 0.086 *χ2(7) = 10.34, p = 0.170χ2(5) = 5.55, p = 0.352χ2(7) = 7.17, p = 0.412
Wooldridge Test for AutocorrelationF(1, 69) = 1.482, p = 0.228F(1, 69) = 1.478, p = 0.228F(1, 69) = 0.024, p = 0.878F(1, 69) = 0.038, p = 0.847
Wald Test for Heteroscedasticityχ2(70) = 4.45 × 10+6, p = 0.000 ***χ2(70) = 4.99 × 10+6, p = 0.000 ***χ2(70) = 1.13 × 10+7, p = 0.000 ***χ2(70) = 1.30 × 10+7, p = 0.000 ***
Pesaran CD Test (Cross-sectional Dependence)CD = 0.484, p = 0.628CD = 0.314, p = 0.753CD = 0.129, p = 0.898CD = 0.077, p = 0.939
Significant levels are: * p < 0.10, *** p < 0.01. Lagrange Multiplier (Breusch–Pagan RE) tests the existence of random effects; the Hausman Test evaluates whether fixed effects are adequate to account for random effects; the Wooldridge Test studies first-order autocorrelation; the Wald Test finds groupwise heteroscedasticity; the Pesaran CD Test determines cross-sectional dependence. For all models, significant heteroscedasticity is found. As a result, efficient estimates are obtained through FGLS estimation.
Table 5. FGLS Regression Results.
VariableModel 1: ETRModel 2: ETR (GEND/Interaction)Model 3: CFETRModel 4: CFETR (GEND/Interaction)
CEOOVER −0.0286 **−0.00261
CEOOVER_c−0.0505 *−0.003
GEND_c−1.07620.0484
CEOVER_c ∗ GEND_c−0.092 **0.088 **
SIZE0.0365 ***0.0413 ***0.03262 ***0.03042 ***
PROF0.0542 ***0.0338 ***0.012 ***0.013 ***
LEV0.001 *0.001 *−0.0002 *−0.002 *
AGE0.0053 ***0.0058 ***0.0001 *0.003 *
_cons−0.2234 ***−0.1887 ***0.0654 ***0.064 ***
Wald chi2 118.87 ***120.94 *** 81.22 ***440.65 ***
R-Squared0.27370.27750.24660.2415
N420420420420
Groups70707070
Time Periods6666
Year DummyYesYesYesYes
Notes: * p < 0.10, ** p < 0.05, *** p < 0.01. This table presents feasible generalized least squares (FGLS) regression estimates addressing heteroscedasticity in panel data. CEOOVER_c and GEND_c represent mean-centered variables to reduce nonessential multicollinearity in moderation analysis. Dependent variables: ETR (Effective Tax Rate) and CFETR (Cash Flow Effective Tax Rate). Standard errors are heteroscedasticity-robust.
Table 6. Random Effects Regression Results with Robust Clustered Standard Errors.
VariableModel 1: ETRModel 2: ETR (GEND/Interaction)Model 3: CFETRModel 4: CFETR (GEND/Interaction)
CEOOVER −0.0292−0.00361
CEOOVER_c−0.0612−0.0032
GEND_c0.049670.0369
CEOVER_c ∗ GEND_c−0.048 *0.0626 *
SIZE0.0554 ***0.0492 ***0.041 ***0.0419 ***
PROF0.042 **0.0467 **0.025 **0.0360 **
LEV0.0030.0041−0.0028−0.0062
AGE0.0041 *0.0073 *0.00570.00561
_cons−0.182−0.171−0.158−0.149
R20.2710.2640.1860.1782
N420420420420
Year DummyYes Yes Yes Yes
Sector DummyYes Yes Yes Yes
Notes: * p < 0.10, ** p < 0.05, *** p < 0.01. This table presents random effects regression estimates with robust standard errors clustered at the firm level as a validity check. Clustering accounts for within-firm correlation of residuals and provides conservative inference robust to heteroscedasticity. CEOOVER_c and GEND_crepresentsmean-centred variables.
Table 7. Subsample analysis of examining the COVID-19 effect.
VariablesPre-Pandemic PeriodPandemic COVID-19 Period
ETRInteractionCFETRInteractionETRInteractionCFETRInteraction
CEOOVER−0.0644 *−0.072 ***−0.0216 *0.017
CEOOVER_c−0.1249 **−0.0076 ***−0.0315 *0.0026
GEND_c0.0772 **0.0183 *0.2433 **0.0789
CEOVER_c ∗ GEND_c−0.0529 **0.049 *−0.0789 *0.0187 *
SIZE0.0351 ***0.0423 ***0.0461 ***0.0434 ***0.051 ***0.0461 ***0.0463 ***0.0324 ***
PROF0.0409 ***0.0319 ***0.0312 ***0.0312 ***0.0447 ***0.0241 ***0.0221 ***0.0211 ***
LEV0.00230.0024−0.001−0.0010.0080.0080.0070.005
AGE0.00420.006 *0.0010.0010.0055 ***0.0058 ***0.001 *0.003 *
_cons−0.0890.00930.0882 ***0.0888 ***−0.1998−0.20260.0649 ***0.062 ***
R-Squared0.1720.1530.1410.1520.2540.2570.320.224
Observations87878787328326329327
Year DummyYesYesYesYesYesYesYesYes
Notes: * p < 0.10, ** p < 0.05, *** p < 0.01. This table reports the results of the random-effects model during and before the COVID-19 pandemic period. All models include control variables and year fixed effects.
Table 9. Alternative CEO Overconfidence Measures.
SpecificationDependent VariableCEO Overconfidence (Centered Effect)Overconfidence × Gender Diversity (Interaction)Observations
Original equal-weighted indexETR−0.0502 **−0.091 **420
CFETR−0.00320.087 **420
PCA-weighted indexETR−0.046 **−0.081 **420
CFETR−0.00310.073 **420
Median split binary indicator (≥3)ETR−0.052 **−0.088 **420
CFETR−0.0040.056 **420
Index excluding the gender componentETR−0.048 **−0.069 **420
CFETR−0.00240.052 **420
Notes: ** p < 0.05. All models include the same control variables as the main specification (SIZE, PROF, LEV, AGE) and year fixed effects. Reported CEO overconfidence coefficients are mean-centered and therefore directly comparable to the interaction models reported in Table 5. The PCA-weighted index uses principal component loadings derived from the underlying CEO characteristics. The consistency of coefficient signs, significance levels, and magnitudes across alternative specifications indicates that the findings are robust to alternative operationalizations of CEO overconfidence.
Disclaimer/Publisher’s Note: The statements, opinions and data contained in all publications are solely those of the individual author(s) and contributor(s) and not of MDPI and/or the editor(s). MDPI and/or the editor(s) disclaim responsibility for any injury to people or property resulting from any ideas, methods, instructions or products referred to in the content.