


Abstract
This paper examines the association between two Financial Technology (FinTech)-related policy windows and the profitability of Qatari commercial banks over a twenty-year horizon (2005–2024). The analysis is anchored by two structural breaks: in 2017, the Qatar Central Bank (QCB) established its FinTech task force and lifted restrictions on the implementation of a regulatory sandbox and centralised electronic know your customer (e-KYC) framework; and during the digital-acceleration period in 2020 in response to the COVID-19 pandemic and the issuance of digital banking licences. FinTech adoption is not measured directly at the bank level; the two policy windows are used as intent-to-treat proxies. Using return on assets (ROA) and return on equity (ROE), bank performance is measured and influenced by bank size (log of total assets), bank age and type (Islamic and conventional). Multiple diagnostics of Hausman and Breusch–Pagan support the use of fixed-effects (FE) panel regressions with cluster-robust standard errors on an unbalanced panel of 125 bank–year observations. The results show a positive coefficient on the post-2017 dummy in the ROE model (β = 0.0306, p = 0.054, cluster-robust) and no detectable change in ROA (β = −0.00058, p = 0.868). For the post-2020 phase, both coefficients are positive but do not reach conventional significance (ROA: β = 0.00218, p = 0.539; ROE: β = 0.0224, p = 0.150). There is no systematic difference between Islamic and conventional banks that is offered by the interaction terms in either phase. Given the small sample (nine banks, eight effective clusters after the FE singleton drop; 125 observations) and the use of policy-window proxies rather than direct bank-level FinTech measures, the design cannot isolate the effect of the FinTech-related reforms from concurrent macroeconomic, sectorial or pandemic-related developments, and the cluster-robust p-values should be read as approximate. The results are therefore presented as preliminary and indicative. Read in light of these design constraints, the results are consistent with incremental rather than transformative change around the FinTech-related policy windows in Qatar, with results influenced more by timing, scale economies, and regulatory saturation than by bank type. The country-specific empirical findings can help restore context to the literature on the Gulf Cooperation Council (GCC) average, and provide measured guidance for bank managers and regulators working toward the Qatar National Vision 2030 digital aspiration.
1. Introduction
Financial technology (FinTech) stands as one of the most disruptive forces of the current banking industry, changing cost functions, distribution models and competitive lines (Boot et al., 2021; Philippon, 2020; Vives, 2019). In advanced economies, AI, blockchain and open-banking platforms have slowly replaced traditional intermediation models (Arner et al., 2016). Adoption has not been as consistent in the Gulf Cooperation Council (GCC); regulatory uncertainties, legacy infrastructure, and cybersecurity concerns have dampened the enthusiasm for widespread adoption compared to the U.S., China, and some Southeast Asian nations (Morshed, 2025; S. Khan & Al-Harby, 2022). In this regional mosaic, the State of Qatar finds itself at a strategically key yet under-researched location.
The Qatar Central Bank (QCB) has placed digital finance at the heart of the national economic diversification agenda under the Qatar National Vision 2030. In 2017, a national FinTech task force was established, followed by the regulatory ‘sandbox’ and, in 2019, the Qatar FinTech Hub; the Third Financial Sector Strategy (FSS3, 2024–2030) represents a further deliberate effort to position Doha as a regional digital-finance node (International Monetary Fund, 2025; J. Khan et al., 2022). With the onset of the COVID-19 pandemic, this trajectory accelerated sharply, compressing into roughly two years a digital transition that had been envisaged over a decade. Yet the financial consequences of these regulatory and pandemic shocks for individual Qatari banks remain only partially quantified.
Previous empirical studies on FinTech and bank performances in the GCC have either been cross-country (Abu Khalaf et al., 2025; Afzal et al., 2025; AlShouha et al., 2024; Alshouha et al., 2025) or adopted a cross-sectional design (AlHares et al., 2022). Pooled estimates might overlook country-specific dynamics as Qatar’s banking sector is small, concentrated and dominated by conventional and Islamic banks. Furthermore, some country-specific findings seem to contradict each other, as Al-Kubaisi and Abu Khalaf (2023) found a negative relationship between mobile banking and profitability in Qatari banks compared with the positive relationship found in the regional studies (Alafeef et al., 2024). This dissonance is an indication of the necessity to provide evidence with respect to the institutional context of Qatar.
This study addresses that gap. It evaluates how two policy-defined episodes (the regulatory reform phase of 2017 and the digital-acceleration phase of 2020) affected the profitability of banks in Qatar. The analysis is conducted using a 20-year sample from nine commercial banks collected from Refinitiv Eikon, exploiting the difference in the levels of the phases between banks within the same group. This paper also examines whether there was a difference in the response of Islamic and conventional banks, given the dual influence of Shariah-compliance constraints and the prominence of Islamic banking in the domestic banking market (Abdul Rahman et al., 2023; Aysan et al., 2022).
The contribution is threefold. First, this paper offers one of the first country-specific, multi-decade econometric assessments of FinTech and bank performance in Qatar, complementing pooled GCC estimates with within-country evidence. Second, it disentangles two policy episodes that are typically conflated in the literature, showing that they have different effects in magnitude, sign and the profitability indicator they affect. Third, this paper engages directly with the Vision 2030 policy debate, offering targeted recommendations for the QCB and bank managers operating under the new digital-licencing framework.
The remainder of this paper is structured as follows. Section 2 reviews the relevant theory and empirical evidence and develops the hypotheses. Section 3 describes the data, variables and estimation strategy. Section 4 presents the descriptive and regression results. Section 5 discusses the findings in the light of the wider literature, and Section 6 concludes with implications for theory, management practice and regulatory design.
2. Literature Review and Hypothesis Development
2.1. Theoretical Foundations
This research adopts three interrelated theories. According to the technology acceptance model (TAM) (Davis, 1989), technology adoption behaviour can be explained by two factors: perceived usefulness and perceived ease of use. In the banking sector, recent studies have shown that trust, performance expectancy, and facilitating conditions have an impact when adopting FinTech. In this context, TAM can shed light on the varying levels of engagement with digital platforms observed across Qatari banks, and is, therefore, relevant to this study.
How innovations (new ideas, products, services, and frameworks) diffuse through a social system can be modelled by the Diffusion of Innovation (DOI) theory (Rogers, 2003). Among the obstacles to the uptake of FinTech in the GCC are institutional obstacles, customer inertia and lack of FinTech literacy. These observations are broadly consistent with DOI’s prediction of differential diffusion (S. Khan & Al-Harby, 2022): large banks such as Qatar National Bank (QNB) and Commercial Bank of Qatar (CBQ) tend to be the early adopters in Qatar, while smaller banks tend to be the laggards.
According to the Resource-Based View (RBV; Barney, 1991), sustained competitive advantage should come from valuable, rare, inimitable, and non-substitutable (VRIN) resources. Proprietary IT infrastructure, data-analytics capability and digitally skilled staff are key to successful FinTech deployment in the banking environment. RBV therefore posits that the FinTech–performance association will be moderated by scale economies and the depth of resources, which can be straightforwardly incorporated into the empirical specification using the control for bank size.
The three frameworks are linked to the empirical model through explicit channels. TAM motivates the use of the post-2017 and post-2020 policy-window dummies: the QCB reforms and the digital-acceleration shock are expected to shift bankers’ perceived usefulness and ease of use of FinTech, raising adoption intensity at observable break points. DOI motivates the post-period × bank-type interaction: if Shariah-compliance constraints place Islamic banks in a different adopter category from conventional peers, the interaction term should be non-zero. RBV motivates the bank-size control: ln(Assets) proxies for the resource depth and scale economies through which VRIN capabilities translate into measurable profitability outcomes. Bank age plays a secondary RBV role, capturing accumulated organisational learning. The framework-to-variable map is summarised compactly: TAM → Postt; DOI → Postt × BankTypei; RBV → ln(Assets)it and Ageit.
These three frameworks should be understood as interpretive lenses rather than as fully tested mechanisms. The empirical specification operationalises selected channels through observable proxies—the policy-window dummies, bank size, bank age and bank type—but the underlying psychological and organisational constructs (perceived usefulness and ease of use, adopter category membership, VRIN resource characteristics) are not directly measured. The link from each framework to the corresponding regression variable is therefore an interpretive choice motivated by theory rather than a direct empirical test of TAM, DOI or RBV as such.
2.2. FinTech and Bank Performance: Global and Regional Evidence
The emerging global literature points to the fact that the effect of FinTech on the performance of banks is somewhat context-specific. According to Vives (2019), early adopters do not tend to implement radical changes, and Philippon (2020) and Boot et al. (2021) observe a gap between FinTech investment and economic gains. The cross-country evidence examined by Frost (2020) shows that adoption is driven by unmet demand, the cost of traditional sources of finance, regulatory accommodation and demographic factors—conditions that only partly apply to concentrated markets in the GCC.
Recent studies conducted with panels of Middle East and North Africa (MENA) and GCC institutions indicate a positive but weak association between FinTech penetration and profitability. In MENA banks, the impact of FinTech on ROA and ROE is positive, as reported by Abu Khalaf et al. (2025), while Afzal et al. (2025) show that FinTech has a positive impact on stability indicators. In the wider Middle East region, Alafeef et al. (2024) document cost-efficiency improvements but acknowledge that profitability gains weaken as core technologies become mainstreamed. Alshouha et al. (2025) provide nuanced evidence that FinTech lowers liquidity risk in GCC banks, with bank size acting as a moderator, while S. Khan et al. (2022) show that the FinTech–stability relationship depends on the regulatory environment. Alslaibi (2024) adds country-specific evidence from Palestine on how FinTech-driven efficiency translates into profitability before and during the COVID-19 shock, and Alslaibi et al. (2025) extend the discussion to the Arab Levant by isolating capital adequacy, inflation and bank size as the dominant correlates of regional bank performance. Thakur et al. (2023) bring the discussion to the Information and Communication Technology (ICT) side of bank performance.
2.3. FinTech in Qatar and the Research Gap
Empirical work focused on Qatar itself is sparse. S. Khan and Al-Harby (2022) rank Qatar fourth within the GCC on digital financial-access measures, including mobile payments and debit-card penetration, behind the UAE, Saudi Arabia and Bahrain. J. Khan et al. (2022) discuss the legal architecture of regional regulatory sandboxes, including Qatar’s, but do not attempt to measure performance implications. At the institutional level, conflicting findings have emerged: a positive relationship between digitalisation and profitability is reported in regional studies (AlShouha et al., 2024), while a negative relationship is reported between specific mobile-banking initiatives and the profitability of Qatari banks (Al-Kubaisi & Abu Khalaf, 2023). These contradictions show that combining the estimates of the GCC countries could mask results at the individual country level.
There are two other characteristics that set Qatar’s banking sector apart. Firstly, Islamic banks hold and manage substantial assets within the system, and their FinTech solutions are influenced by Shariah-compliance factors, as highlighted by Abdul Rahman et al. (2023) and Aysan et al. (2022). Second, there is a high degree of concentration in the sector, with a few large firms determining patterns of system-wide adoption. These characteristics justify a country-based, multi-period treatment, as is done in this paper.
2.4. Hypotheses and Conceptual Model
Drawing on the literature, this study formulates three hypotheses corresponding to two policy episodes and one cross-sectional contrast:
H1a/H1b.
The post-2017 regulatory reform phase is associated with higher ROA (H1a) and ROE (H1b) in Qatari banks.
H2a/H2b.
The post-2020 digital-acceleration phase is associated with higher ROA (H2a) and ROE (H2b).
H3.
The post-period performance effects differ between Islamic and conventional banks.
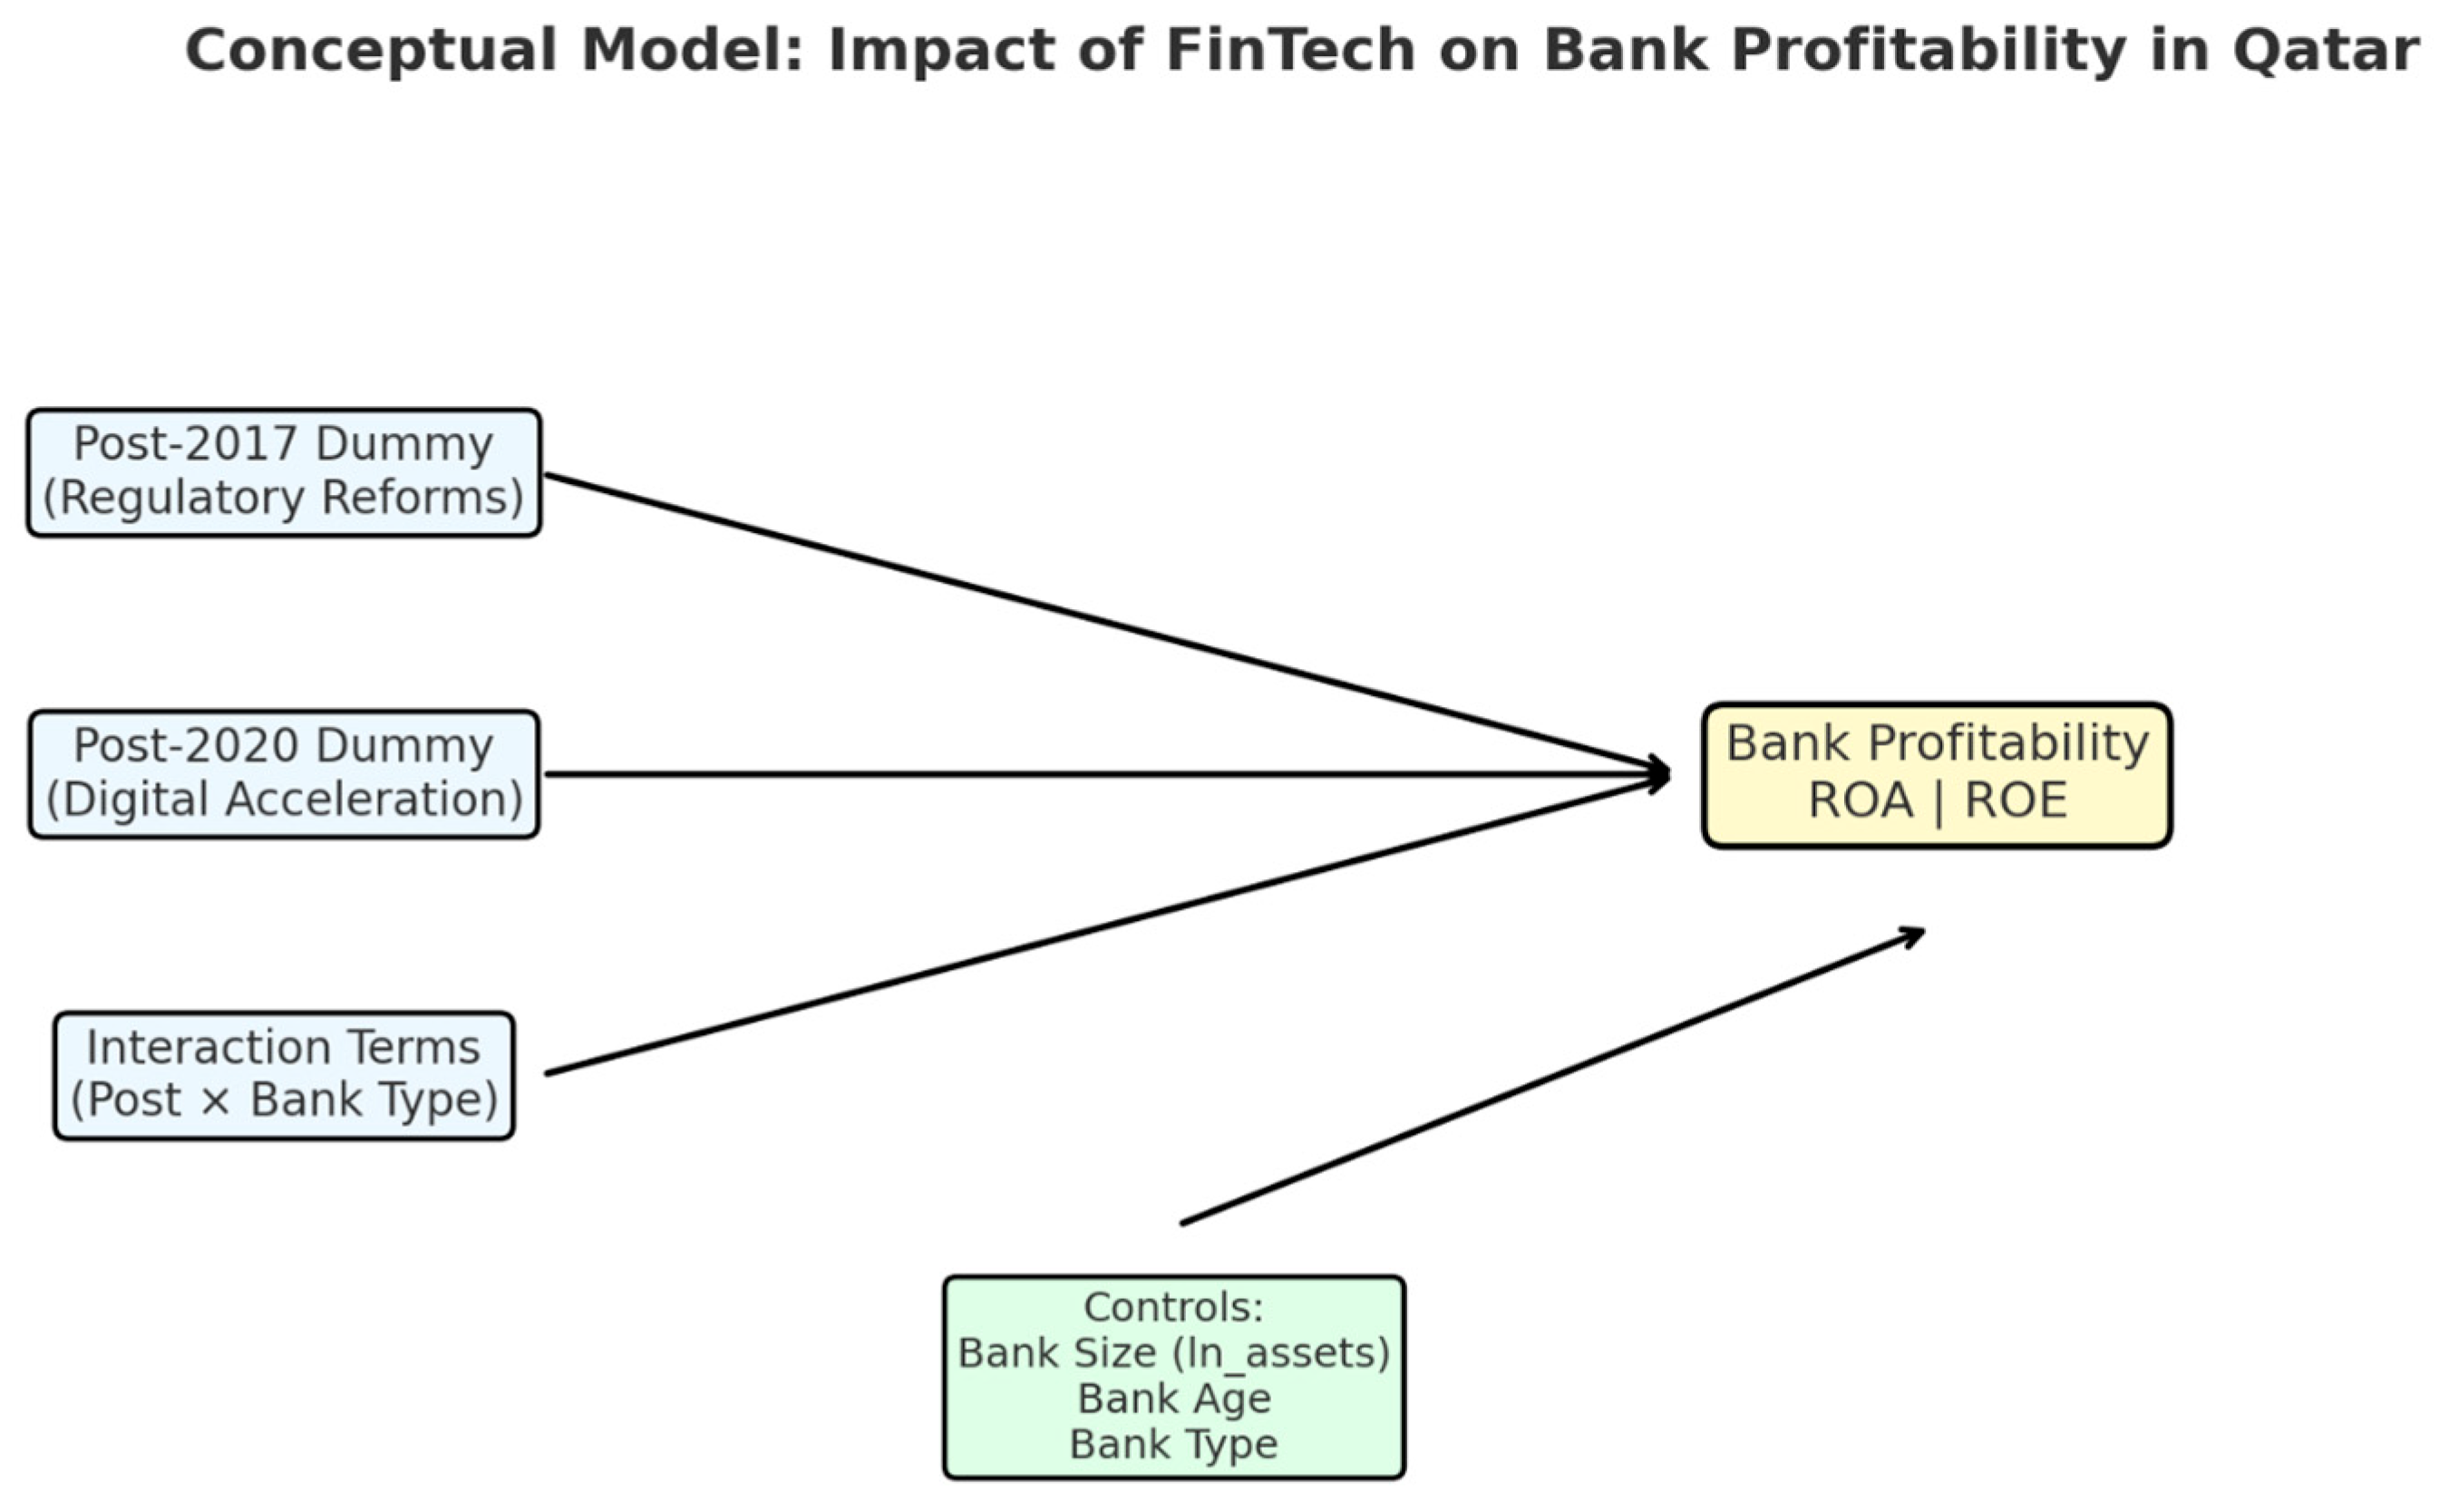
Figure 1 summarises the conceptual model. Two policy dummies and an interaction with bank type drive bank profitability, while bank size, age and type act as controls.
Figure 1.
Conceptual model: drivers of bank profitability in Qatar (2005–2024). The model relates the two policy-defined episodes (post-2017 regulatory reform, post-2020 digital acceleration) and their interaction with bank type to ROA and ROE, controlling for bank size, age and type.
3. Data and Methodology
3.1. Sample, Period and Data Source
The sample comprises nine commercial banks operating in Qatar between fiscal years 2005 and 2024, yielding an unbalanced panel of 125 bank–year observations. The 20-year horizon brackets the two structural breaks of interest: the 2017 regulatory phase (QCB FinTech task force, sandbox and eKYC framework) and the 2020 digital-acceleration phase (COVID-19 and the Qatar FinTech Strategy roll-out) (International Monetary Fund, 2025). Commercial and Islamic banks, as defined by QCB, are included if they have (i) operated in Qatar for a non-trivial portion of the sample window, and (ii) audited annual reports available during their operating years. The selected institutions are listed in Table 1.
Table 1.
Qatari commercial banks included in the analysis.
Two qualifications follow. First, the panel is unbalanced because two banks entered late: Lesha Bank (formerly Qatar First Bank) was QFC-licenced from 2008 and publicly listed in 2016, while Dukhan Bank was rebranded from the former Barwa Bank with full operations from around 2009 and underwent a further restructuring in 2020. The descriptive statistic of bank age = 1 in Table 2 reflects the start of Lesha Bank’s listed operations. Second, the regression sample contains eight banks rather than nine because one bank does not contribute enough within-variation under the FE within-transformation (a singleton time-series for at least one window) and was dropped automatically by plm.
Table 2.
Descriptive statistics for key variables (2005–2024).
All financial data are sourced from Refinitiv Eikon, which provides standardised, audited and regulator-verified financial statements, ensuring comparability across institutions and over time (Alafeef et al., 2024; Alnsour, 2023). Using one high-quality source mitigates measurement error and supports the longitudinal panel design.
3.2. Variables
The dependent variables are two profitability ratios commonly used in the banking literature: Return on Assets (ROA = net income ÷ total assets), capturing operational profitability; and Return on Equity (ROE = net income ÷ shareholders’ equity), capturing shareholder returns. Two binary policy variables drive the analysis: post2017 (=1 for years ≥ 2017) and post2020 (=1 for years ≥ 2020). Three controls follow standard practice: bank size, measured as the natural log of total assets (ln_assets); bank age, the number of years since establishment; and bank type, a dummy equal to one for Islamic banks and zero for conventional banks. Interaction terms between each policy dummy and bank type test for differential responses.
The two policy dummies are best interpreted as an intent-to-treat identification: each captures the regulator’s policy window rather than a direct, bank-level measure of FinTech adoption (such as the share of digital transactions, IT capital expenditure, mobile-banking usage or API deployments). Granular, bank-level FinTech-intensity proxies of this kind are not consistently disclosed by Qatari banks across the 20-year horizon, which is a known data constraint for single-country GCC studies. The implications of this design choice—and a plan to relax it in future work as disclosures improve—are discussed in Section 5.4.
3.3. Estimation Strategy
The study employs a fixed-effects (FE) panel data approach to control for time-invariant, bank-specific characteristics such as governance culture, risk appetite and ownership structure. The baseline specification is as follows:
where Yit is ROA or ROE for bank i in year t, αi is the bank-level fixed effect, Postt is either the post2017 or post2020 dummy, and εit is the idiosyncratic error. A second specification adds the interaction term Postt × BankTypei to test H3.
Yit = αi + β1 Postt + β2 ln(Assets)it + β3 Ageit + εit
Model selection follows standard panel diagnostics. The Hausman test compares FE against a random-effects (RE) alternative, while the Breusch–Pagan Lagrange Multiplier test compares RE against pooled OLS. In both phases, the Hausman statistic strongly rejects RE consistency, justifying FE estimation (Section 4). Cluster-robust standard errors at the bank level correct for heteroskedasticity and within-bank serial correlation, in line with Wooldridge (2010). Estimation is carried out in R using the plm package; lmtest and sandwich provide the robust inference. Inference is, however, based on only eight effective bank clusters (after the FE singleton drop). With small cluster counts the cluster-robust variance estimator is known to be downward-biassed and the resulting test statistics may over-reject the null (Cameron & Miller, 2015). The cluster-robust p-values reported below should therefore be read as approximate, and the coefficient on the post-2017 ROE dummy, in particular, should not be over-interpreted on the basis of being close to the conventional 10% threshold.
Two design choices warrant explicit acknowledgement. First, the specification does not include year fixed effects. With only nine banks adopting under a single regulatory regime, year dummies would absorb the policy-window dummies that are themselves the object of interest, and a clean untreated control group does not exist within Qatar. The Qatari design is therefore best read as a within-country, intent-to-treat assessment of two policy windows, with the COVID-19 confound openly acknowledged; the cross-GCC extension flagged in Section 5.4 would allow a difference-in-differences design with untreated controls. Second, additional bank–time-varying controls—capitalisation, cost-to-income ratio, non-performing-loan ratios, liquidity coverage, income diversification—would be ideal but are not consistently available for all nine institutions across the full sample window. Their omission inflates the explanatory weight that the bank-size variable absorbs; this point is revisited in Section 5.4. Taken together, the absence of year fixed effects, an untreated control group and an event-study structure means that the model cannot isolate the effect of the FinTech-related reforms from concurrent macroeconomic, sectorial or pandemic-related developments. The post-2017 and post-2020 coefficients should therefore be read as upper-bound estimates of an association around the policy windows, not as causal estimates of FinTech adoption effects.
Following Gujarati and Porter (2009) and Hair et al. (2019), asset size is log-transformed to mitigate skewness. For descriptive completeness, Shapiro–Wilk tests are also reported alongside the descriptive statistics, although their interpretation is limited: FE consistency does not require normality of residuals (Wooldridge, 2010), so these tests are reported as a description of the data rather than as a precondition for inference. Within-R2 is reported for explanatory power and p-values for statistical inference.
4. Empirical Results
4.1. Descriptive Statistics and Diagnostics
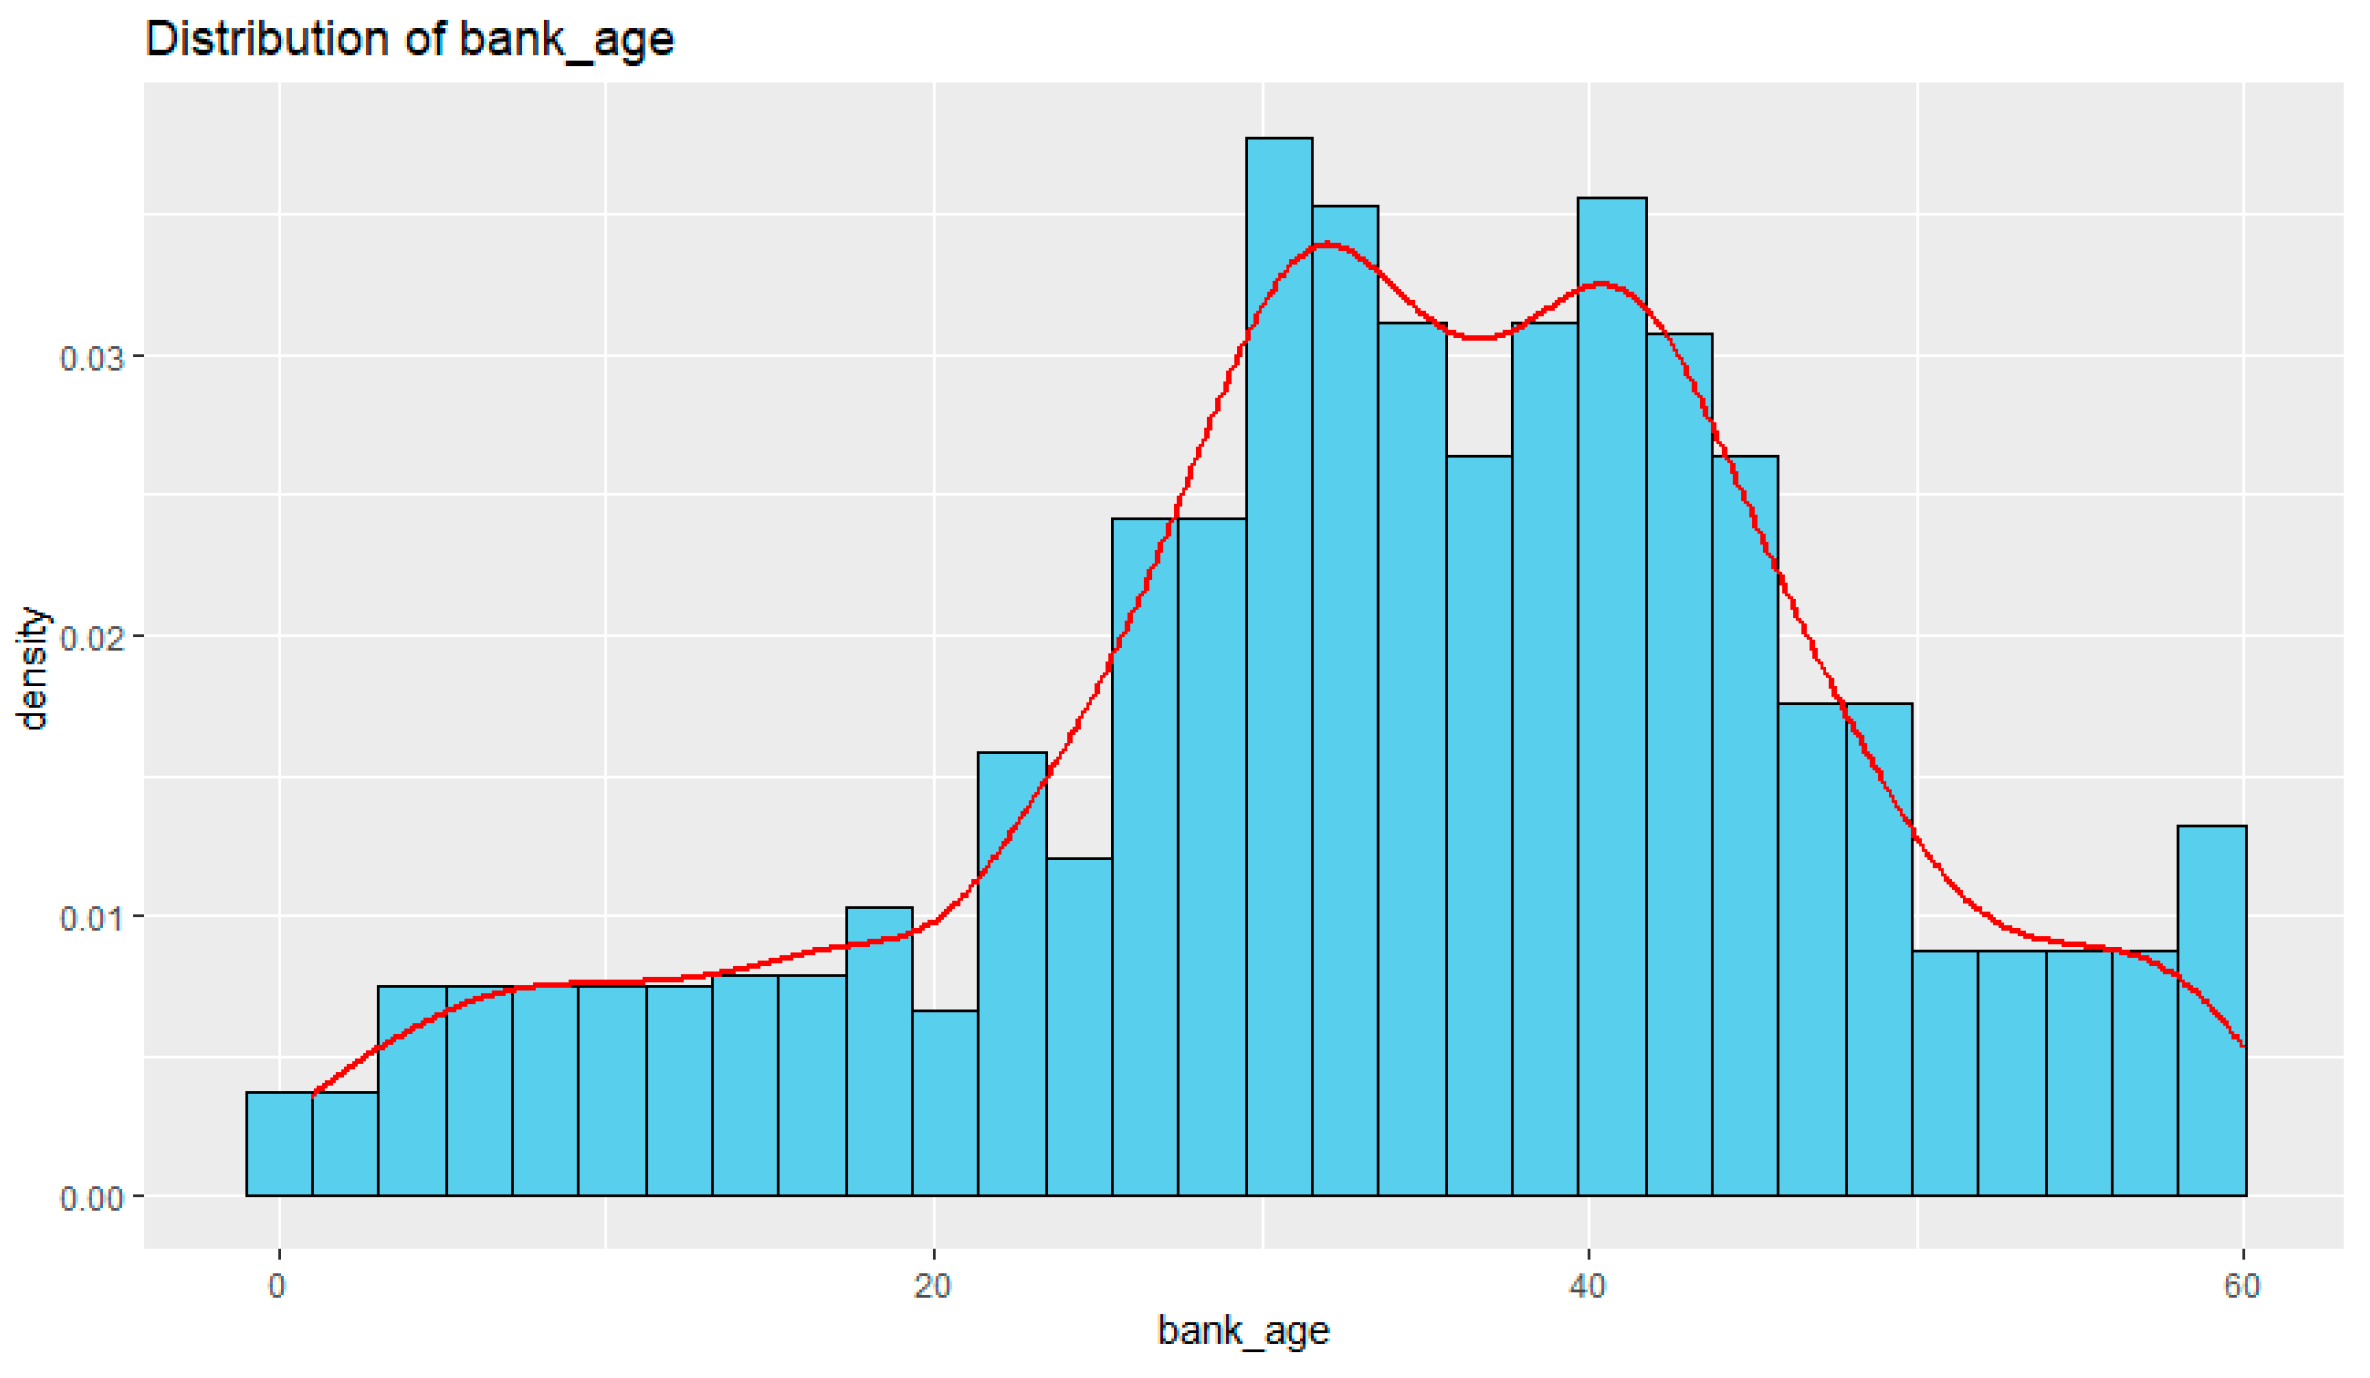
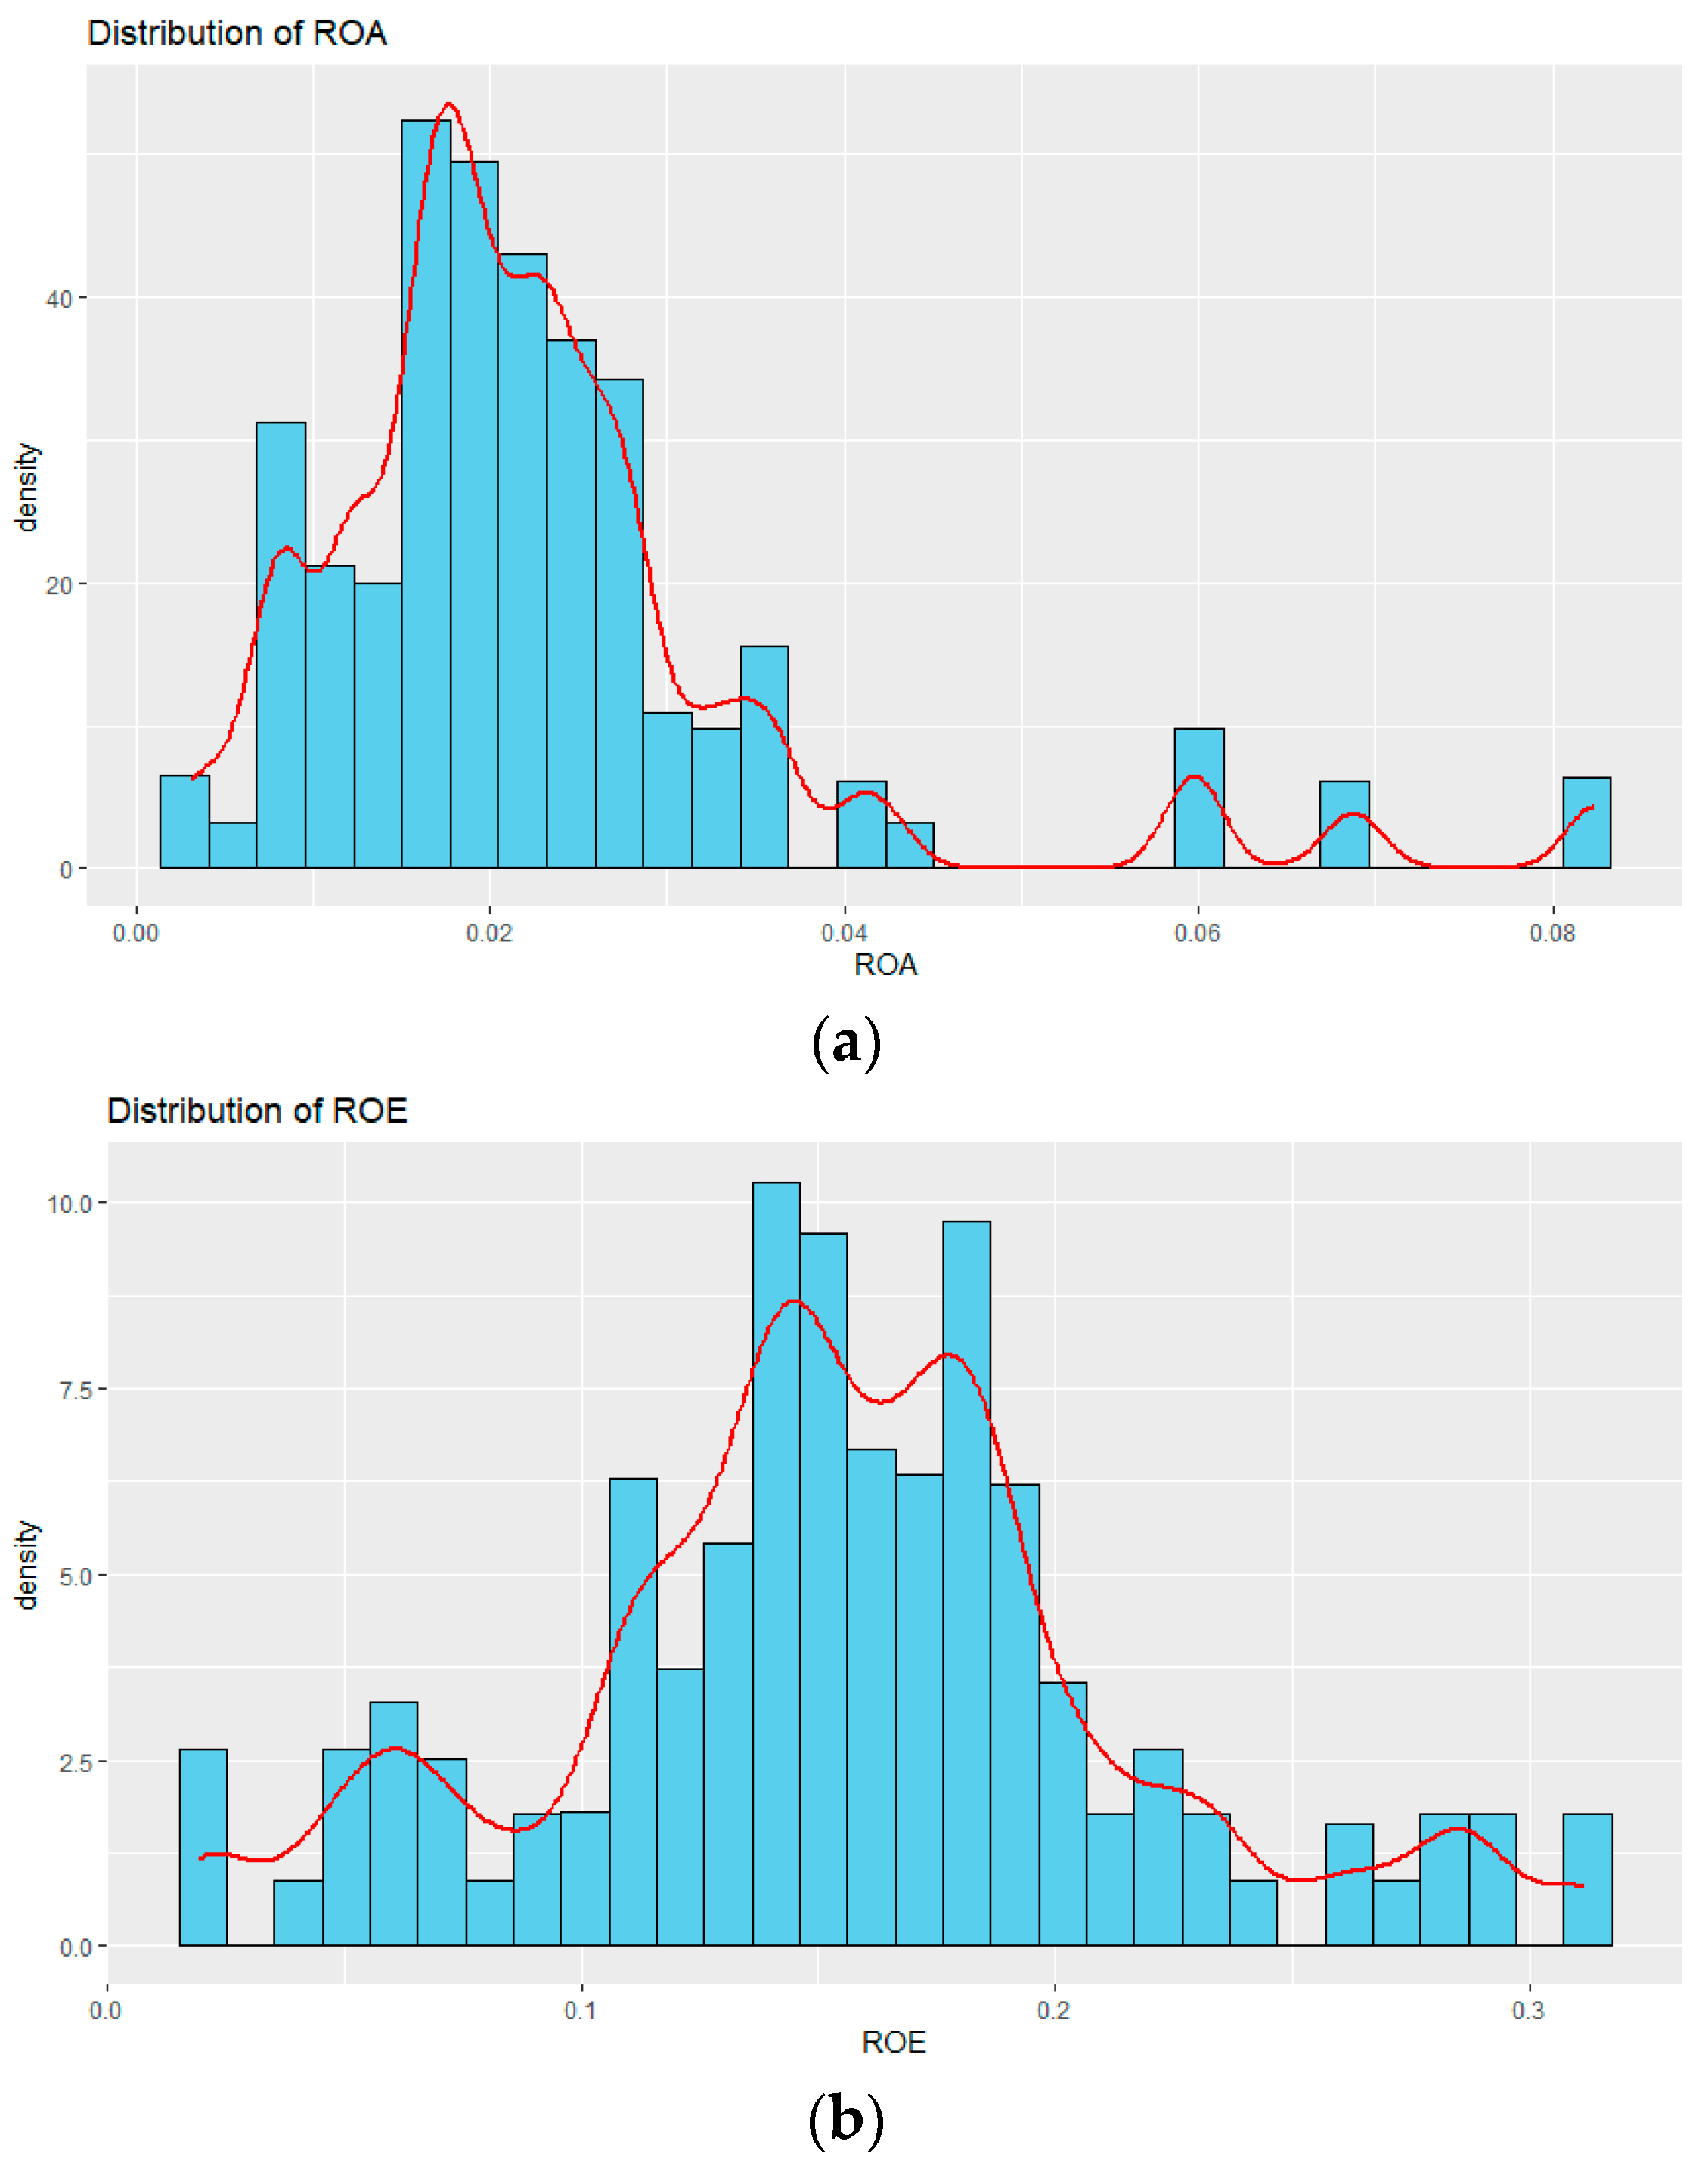
The descriptive statistics are presented in Table 2. The distribution of ROA is positively skewed and leptokurtic with a mean of 2.0%: most banks fall within a narrow profitability band and a few produce exceptional returns. ROE averages 16.0% and is approximately symmetric (skewness = 0.18). Total assets range between QAR 1.69 billion and QAR 356.13 billion, a dispersion typical of concentrated banking markets. Following Hair et al. (2019) the log-transformation (ln_assets) reduces skewness to 0.41. Bank age ranges from 1 year to 60 years (mean 33.9 years), reflecting a mix of established and younger institutions. Shapiro–Wilk tests reject normality for all variables, which is unsurprising for financial ratios (Gujarati & Porter, 2009), although, as noted in Section 3.3, this has no direct bearing on the consistency of the FE estimator (Wooldridge, 2010).
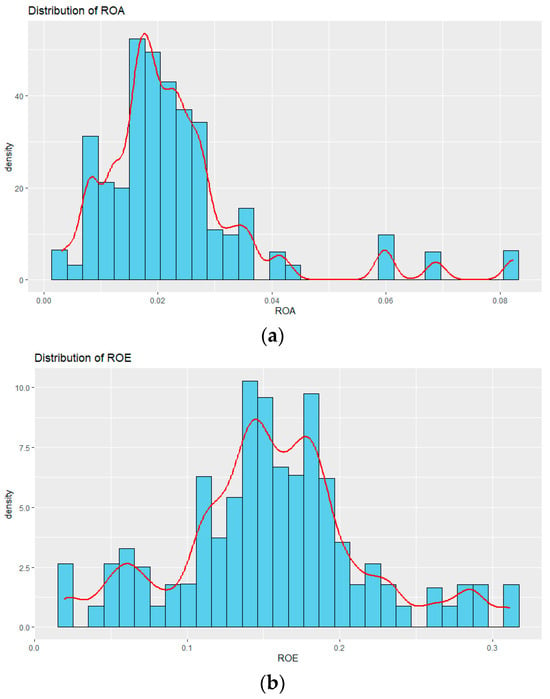
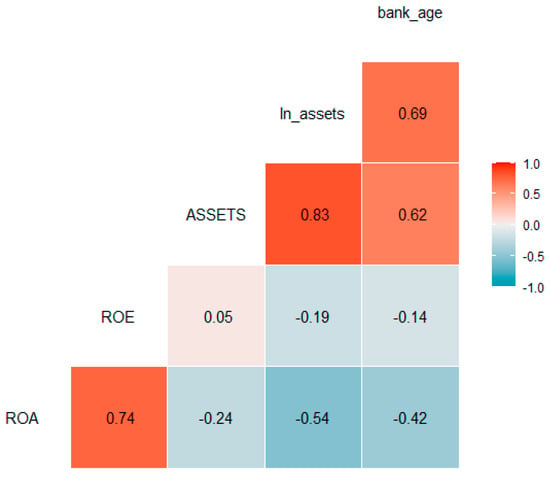
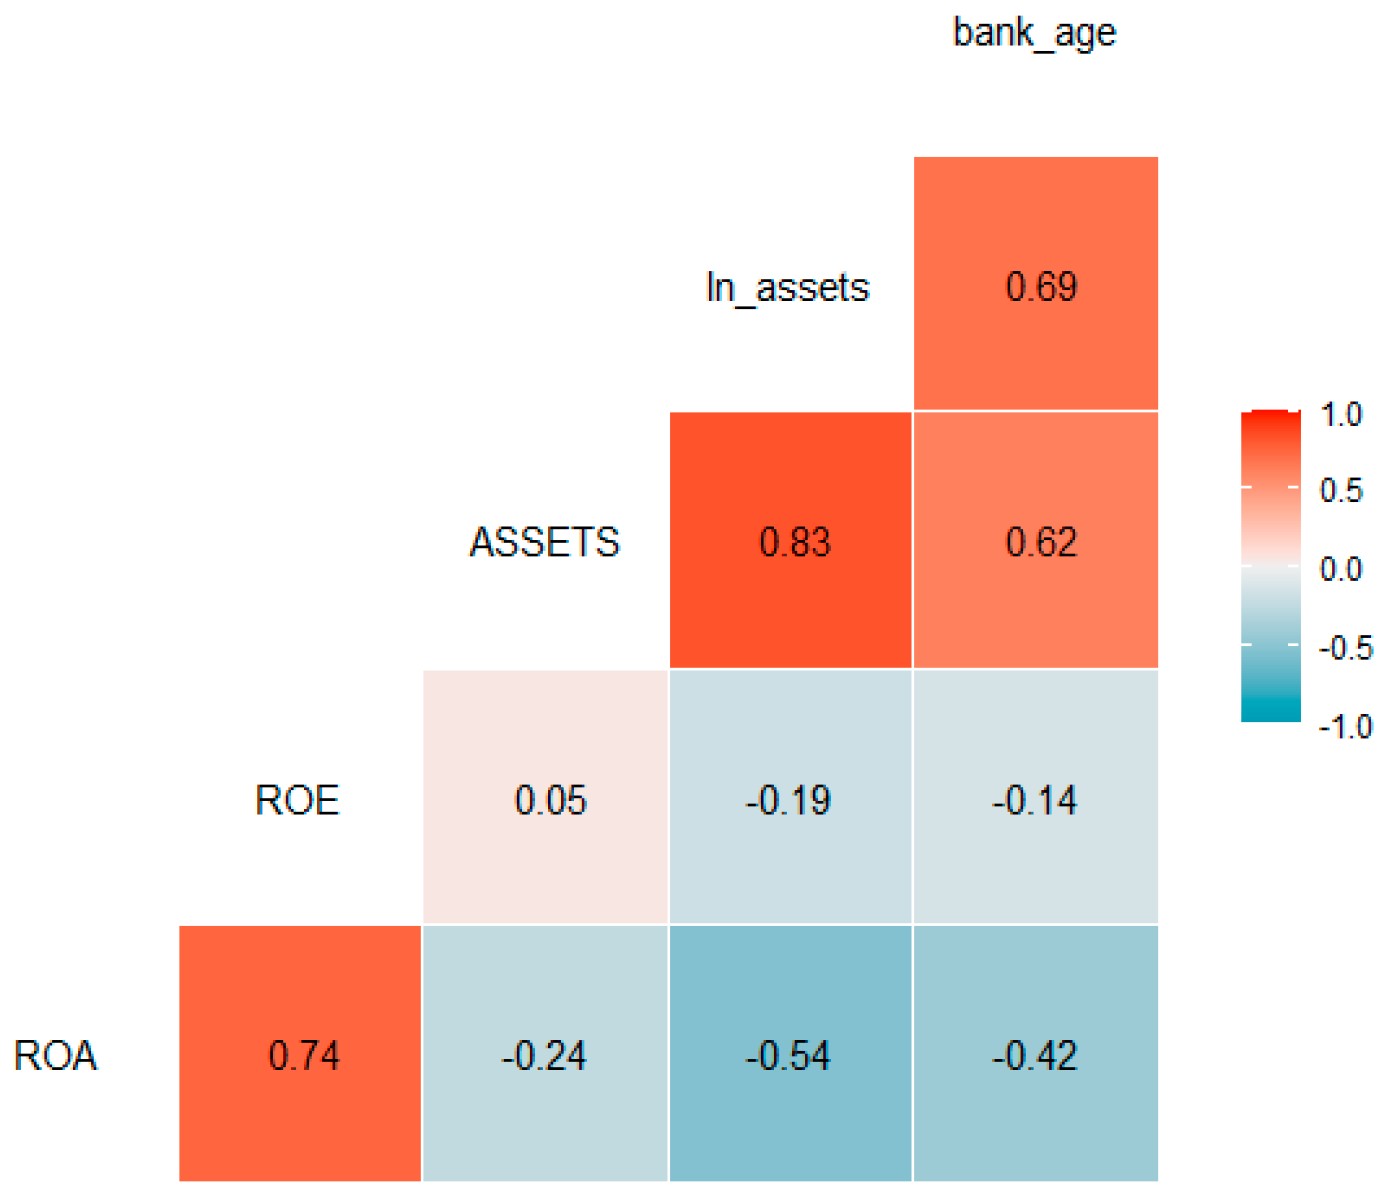
The distributions of ROA and ROE are given in Figure 2. The right tail of ROA is heavier than would be consistent with the high kurtosis statistic, whereas ROE seems to be broadly symmetric with a double mode. The correlation matrix is shown in Figure 3. As expected, ROA and ROE are very closely linked (r = 0.74) and both are negatively correlated with bank size (ROA–ln_assets r = −0.54) and bank age (ROA–age r = −0.42). This trend confirms the findings of Demirgüç-Kunt and Huizinga (2010), according to whom the smaller a bank’s size and the younger it is, the more likely it is to detect high profits.
Figure 2.
(a) Distribution of ROA (right-skewed, leptokurtic); (b) distribution of ROE (approximately symmetric, bimodal).
Figure 3.
Correlation matrix of the key variables. ROA and ROE are strongly positively correlated (r = 0.74); both correlate negatively with bank size and bank age.
4.2. The Post-2017 Regulatory Phase
Table 3 reports the FE estimates for the post-2017 specification. The Hausman test rejects RE consistency strongly (χ2(3) = 138.94 with p < 0.001), and the Breusch–Pagan LM test confirms significant panel effects (Appendix A Figure A1; χ2(1) = 6.28, p = 0.012). FE is therefore the appropriate estimator. ROA is practically unchanged after 2017 (β = −0.00058; p = 0.868), meaning that there is little observed differential asset-based profitability after the regulation changes. Bank size (β = −0.0173, p < 0.001) is significant and negative, as discussed in the work of Demirgüç-Kunt and Huizinga (2010), supporting the agility advantage of smaller banks. The within-R2 is large at 0.587.
Table 3.
Fixed-effects panel regressions for the post-2017 phase.
For ROE, the picture is different: post2017 carries a positive coefficient of β = 0.0306 with an exact cluster-robust p-value of p = 0.054, that is, it is sitting at the conventional 10% threshold for a two-sided test. Given the eight-cluster setting flagged in Section 3.3, this estimate should be treated as suggestive rather than as strong evidence. The point estimate suggests that, on average, ROE rose by about three percentage points over the years following the QCB reforms, after accounting for size and age. The ROE model does not show significant effects for size or age of the bank. The heterogeneity test along the dimension of BankType (the last column of Table 3) yields an insignificant interaction term (β = −0.00424, p = 0.336); meaning that there is no systematic differential impact between Islamic and conventional banks.
4.3. The Post-2020 Digital-Acceleration Phase
Table 4 reports the corresponding FE estimates for the post-2020 phase. Diagnostics again favour FE (Hausman χ2(3) = 1697, p < 0.001; Breusch–Pagan LM χ2(1) = 18.667, p < 0.001). The post2020 coefficient in ROA is positive but is not significantly different from zero (β = 0.00218, p = 0.539). Bank size is strongly negative (β = −0.0160, p ≈ 0.05), however, and remains so in every specification: larger banks systematically achieve lower ROA, consistent with diseconomies in asset utilisation among the large banks in Qatar.
Table 4.
Fixed-effects panel regressions for the post-2020 phase.
In the ROE model, the post2020 coefficient is positive but not significant (β = 0.0224, p = 0.150). Bank age, on the other hand, is significantly negative (β = −0.00613, p = 0.017), indicating deteriorating shareholder returns for older banks during the pandemic/post-pandemic year. Within R2 for ROE is 0.425, which is slightly lower than that for ROA (0.588).
Interaction effects are again not statistically significant. The interaction coefficient is small and insignificant (β = −0.00051, p = 0.914) in the ROA model with Post2020 × BankType, while bank size has a strong negative effect (β = −0.0144, p < 0.001). The same pattern applies to ROE with the same interaction (column 4): bank size has an even more pronounced negative effect (β = −0.0469, p = 0.0026), but the interaction term is not statistically significant (β = 0.00956, p = 0.709). Across all four columns, H3 is not supported: Qatari Islamic and conventional banks did not respond differentially to the post-2020 shock.
4.4. Hypothesis Testing Summary
The results of the hypotheses are summarised in Table 5. H1a is not supported: there is no significant ROA effect post-2017. H1b is partially supported: ROE shows a marginally significant uplift after the 2017 reforms. Neither H2a nor H2b is supported—the post-2020 coefficients for ROA and ROE are positive but statistically insignificant. H3 is not supported in either window, with no evidence of differential Islamic-versus-conventional dynamics.
Table 5.
Hypothesis outcomes.
Two cross-cutting patterns deserve emphasis. First, the kind of profitability indicator that moves varies from episode to episode: ROE moves (weakly) with the 2017 regulatory phase; neither ROA nor ROE moves clearly with the 2020 phase. Second, in every specification, bank size is the most robust correlate of profitability, with a negative sign. These findings suggest that the FinTech–performance nexus in Qatar is dominated less by the policy episodes themselves than by structural attributes within the banks—scale, specifically.
5. Discussion
5.1. Interpreting the Post-2017 Effects
The marginal improvement in ROE following the 2017 reforms is broadly consistent with Vives (2019) and Philippon (2020)’s incrementalist argument, though the magnitude is small and the significance only marginal, so the interpretation should be treated as tentative. The QCB’s task force and eKYC framework reduced compliance friction, which could have contributed to an improvement in shareholder returns through cost rationalisation and revenues generated through digital channels. The absence of an ROA effect is also in line with the literature, which reports that cost-efficiency effects tend to appear first in ROE due to the direct transfer of cost decreases to the bottom line, compared to productivity-per-asset (Alafeef et al., 2024; Al-Shari & Lokhande, 2023). The pattern mirrors Alslaibi (2024)’s Palestinian evidence of the efficiency-to-profitability transmission, and it also aligns with Frost (2020), who notes that in concentrated markets with incumbent pricing power, the profitability effect of digitalisation tends to occur first on equity returns.
The Qatari estimate contrasts with the sensational headlines of larger emerging-market studies. As outlined by Boot et al. (2021), the effect on ROA seems to be larger in less concentrated markets, while AlShouha et al. (2024) find that the effect on profitability gains is stronger when looking at the wider Arab world. Qatar’s small, concentrated sector—dominated by a few large incumbents—may simply have less room for FinTech-driven disruption, reinforcing the case for context-specific evidence and weighing against the temptation to read the marginal ROE coefficient as a strong endorsement of the 2017 reforms.
5.2. Why Post-2020 Effects Are Muted
Three forces appear to dampen the post-2020 signal. First, the COVID-19 pandemic was not a “pure” treatment but rather a distortion: provisioning needs, lending moratoria, and capital-conservation activities inflated balance sheets and depressed profitability, masking any contribution that FinTech may have provided. This is also consistent with the cross-country evidence in Alslaibi et al. (2025), where pandemic-period bank performance in Arab Levant economies was dominated by capital adequacy and bank size rather than digital adoption. Second, in line with the comparative study of the United States and Canada by Kalai and Toukabri (2024), the gains in short-run productivity may in part reflect compliance constraints introduced by the QCB in its 2024 digital-banking framework. Third, the period corresponds with FinTech saturation: once core mobile and digital services have been mainstreamed—as had largely happened in Qatar by 2021—there is reduced value-add from deeper FinTech uptake (Alafeef et al., 2024; AlShouha et al., 2024).
The fact that bank size was such a strong and consistent negative influence on results undermines any easy pro-larger-bank story. Larger Qatari banks earn lower profits on a per-asset basis, likely because they have greater exposure to sovereign and corporate loans with relatively lower returns, and because returns from FinTech services scale with the size of their balance sheets but spread across a wider asset base. This confirms the moderating effect of bank size reported by Alshouha et al. (2025) in the case of liquidity risk and now extends the logic to profitability. It is also an omitted-variable warning: without controls for capitalisation, cost-to-income or asset quality (Section 5.4), parts of these effects could be bundled into the size coefficient.
5.3. Theoretical and Practical Implications
The results elaborate the TAM, DOI and RBV in the context of Qatar. The ROE uplift of 2017 was modest, indicating a shift from perceived usefulness to actual returns for shareholders at the system level, rather than at the asset-utilisation level. A DOI perspective reveals that there is no significant difference between conventional banks and Islamic banks, implying that diffusion is more homogeneous in Qatar’s small banking system: when a large incumbent adopts, others follow. The continuous negative size coefficient suggests that the VRIN resources in Qatari banks have not thus far contributed to differential profitability through FinTech; the advantage may be manifested in dimensions not captured by ROA or ROE, such as resilience, regulatory standing, or customer trust.
Bank managers have two implications. First, the level of investment and profitability anticipated from FinTech adoption must be kept in check, as it is incremental rather than transformational. Recommendations about specific investment areas—cybersecurity, AI-driven analytics, blockchain-based smart contracts or Islamic digital wallets—are beyond what this study can empirically support, since none of these activities is measured at the bank level. The more guarded implication is that, in a concentrated banking system with uniform regulation, the marginal returns to additional FinTech-related reforms appear limited at the level of headline ROA and ROE. Specifically for Islamic banks, the lack of a differential effect over the two policy windows is consistent with the broader Shariah-compliant FinTech evidence reviewed by Abdul Rahman et al. (2023), but the present design cannot itself test whether Shariah-compliant digital products generate a competitive premium.
5.4. Limitations
Several qualifications apply to the findings, and we present them here candidly so that the marginal coefficients reported above are read in this context.
Low Statistical Power: The sample comprises 9 banks and 125 bank–year observations, but the post-2020 data window is only 4 to 5 years. With such a panel, the lower limit on the detectable effect for the policy dummies—under standard FE inference with cluster-robust errors and conventional 80% power at the 5% level—is in the neighbourhood of β ≈ 0.025–0.035 for ROA and ROE on the scales used here. This means coefficients smaller than this floor will fail to reach significance regardless of any true underlying economic effect. The marginally significant 2017 ROE coefficient (β = 0.0306, p ≈ 0.054) is close to that floor; it may represent a true policy effect, but a Type II error on the other policy windows cannot be ruled out. The findings should therefore be interpreted not as final or definitive tests of the hypotheses but as preliminary and indicative.
Absent Measures of Bank-Level Fintech Intensity and Intent-To-Treat Design: The two policy dummies represent regulatory windows rather than direct bank-level FinTech adoption, as noted in Section 3 and subsequent sections. Across the complete 2005–2024 period, granular operational proxies—shares of digital transactions, IT capital expenditure, mobile-banking usage, digital customer penetration, platform investment, and API or AI deployment—are not consistently disclosed by all Qatari banks. The use of policy dummies is a deliberate identification choice given this data constraint, but the trade-off is that the coefficients capture the effect of the policy windows themselves, not direct measures of adoption intensity, and the COVID-19 confound to the post-2020 dummy is openly acknowledged.
No Year Fixed Effects; No Untreated Control Group: With nine banks adopting under a single national regulatory regime, year fixed effects would absorb the policy-window dummies, and a clean untreated control group does not exist domestically. The interpretation of the coefficients therefore relies on within-bank variation across pre- and post-policy windows, which cannot fully separate the policy shock from concurrent macroeconomic changes. A cross-GCC extension—treating Qatar as the treated unit and one or more non-treated GCC peers as controls in a difference-in-differences design—is the natural way to relax this constraint and is high on the future-work agenda. In the absence of a clean event-study design, the post-2017 and post-2020 coefficients should be read as upper-bound estimates of an association around the policy windows, not as causal estimates of FinTech-related reforms. They cannot be cleanly separated from concurrent macroeconomic, sectorial or pandemic-related developments.
Limited Bank-Time-Varying Controls: Capitalisation (equity/assets), cost-to-income ratio, non-performing-loan ratios, liquidity coverage and income-diversification indicators would all be desirable additions, especially given that the negative bank-size coefficient probably absorbs part of their explanatory power. These controls are not consistently disclosed for all sampled banks over the full window in the Refinitiv Eikon panel. As bank-level disclosure improves—both through QCB regulatory templates and through standardised vendor data—future work should re-estimate the model with this richer covariate set. Accordingly, the negative coefficient on bank size should not be interpreted as direct causal evidence of a size disadvantage but rather as a composite signal that may absorb the explanatory power of these omitted bank characteristics.
Small Cluster Count: Cluster-robust inference is implemented with only eight effective bank clusters (after the FE singleton drop). With small cluster counts, the variance estimator is known to be downward-biassed and the resulting test statistics may over-reject the null (Cameron & Miller, 2015). The cluster-robust p-values—in particular, the p = 0.054 on the post-2017 ROE coefficient—should therefore be read as approximate guides rather than as precise tests. Wild-cluster bootstrap or alternative small-sample corrections would be a natural robustness extension once the sample is broadened to a multi-country panel.
Generalisability and External Validity: The exhaustive coverage of the listed Qatari banking sector is a strength for country-level inference but a limit for external validity: the results should not be projected onto larger or less concentrated GCC markets without an explicit cross-GCC re-estimation.
Replication: The variable construction beyond the brief description in Section 3, the R workflow used for FE estimation and cluster-robust inference (plm, lmtest, sandwich), and the regression output reproduced in Appendix A together form an informal replication package. The full R scripts and the disaggregated data extracts (subject to Refinitiv Eikon licencing) are available from the corresponding author on reasonable request.
6. Conclusions
This paper offered a country case study, focusing on Qatar, to examine the association between two FinTech-related policy windows and the profitability of commercial banks over a horizon of 20 years using panel investigation techniques. Two policy episodes were analysed: the regulatory reform phase in 2017, in which the Qatar Central Bank developed its FinTech infrastructure; and the digital-acceleration phase in 2020, when years of digital evolution were compressed into months by COVID-19. The analysis uses a 125-observation unbalanced panel and an FE design with cluster-robust inference. Return on Equity carries a positive coefficient on the post-2017 dummy (β = 0.0306, p = 0.054, cluster-robust) while Return on Assets does not (β = −0.00058, p = 0.868); both post-2020 coefficients are positive but do not reach conventional significance (ROA: p = 0.539; ROE: p = 0.150). Bank size emerges as the strongest correlate across all specifications; Islamic and conventional banks did not behave differently in the interaction tests. The findings should be interpreted as preliminary and indicative. With nine banks, eight effective clusters, 125 observations, and policy-window proxies in place of direct FinTech measures, the design is not sufficiently powered to detect small-scale policy effects, the cluster-robust p-values are approximate, and the model cannot separate the policy windows from contemporaneous macroeconomic, sectorial or pandemic-related developments (see Section 5.4).
The implications are nuanced. For bank managers, the results temper expectations of significant profitability gains around the FinTech-related policy windows. The empirical evidence does not directly support strong recommendations on specific FinTech investment areas—cybersecurity, AI analytics, blockchain or Islamic digital wallets—since none of these activities is measured at the bank level. The more guarded implication is that, in a concentrated market with uniform regulation, marginal returns to additional FinTech-related reforms appear limited at the level of headline profitability indicators. Smaller banks may want to look at joint platforms and shared digital infrastructure as a way to reduce fixed costs. For Islamic banks, the lack of a differential effect over the two policy windows suggests that Shariah-compliant FinTech innovation can be pursued as a long-term differentiator, even if a profitability premium does not manifest in the near term.
For policymakers, particularly the QCB, the results are consistent with—but do not directly test—the broader policy discussion of tiered or ecosystem-style regulation. What the data do show is that bank size dominates the within-bank variation in profitability across both policy windows, which suggests that policies neutralising size-based barriers may matter as much as further FinTech-specific rules at this stage. Future regulatory work in the spirit of Qatar National Vision 2030 would benefit from outcome-based metrics (financial inclusion, resilience, consumer trust) alongside adoption-based metrics, but this study cannot itself adjudicate which regulatory architecture would deliver those outcomes.
For the academic literature, this paper contributes one of the few available empirical, country-specific econometric assessments of FinTech and bank performance for Qatar across a multi-decade period, complementing cross-country GCC estimates with within-country evidence. It also documents an empirical asymmetry between policy episodes: the 2017 reform window shifts ROE marginally, while the 2020 digital-acceleration window does not meaningfully move either measure. Future research should extend the design to a multi-country GCC panel, incorporate direct FinTech-intensity proxies as disclosure improves, add bank–time-varying controls (capitalisation, cost-to-income, asset quality), and complement the econometric estimates with qualitative interviews to unpack the strategic logic behind the headline coefficients.
Author Contributions
Conceptualization, A.M.A.A.; Methodology, A.M.A.A.; Software, A.M.A.A.; Formal analysis, A.M.A.A.; Investigation, A.M.A.A.; Resources, A.M.A.A.; Writing—review & editing, A.M.; Visualization, A.M.; Supervision, A.M.; Project administration, A.M. All authors have read and agreed to the published version of the manuscript.
Funding
This research received no external funding.
Institutional Review Board Statement
Not applicable.
Informed Consent Statement
Not applicable.
Data Availability Statement
The financial data analysed in this study were obtained from Refinitiv Eikon under an institutional licence. Aggregated descriptive statistics and regression outputs are available from the corresponding author upon reasonable request. An informal replication package—variable construction details, the R workflow used for FE estimation and cluster-robust inference (plm, lmtest, sandwich), and the disaggregated extracts (subject to Refinitiv Eikon licencing)—is also available from the corresponding author upon reasonable request.
Acknowledgments
The author gratefully acknowledges the supervision of Nodir Karimov at Newcastle Business School and the helpful comments of two anonymous referees.
Conflicts of Interest
The author declares no conflicts of interest.
Abbreviations
| AI | Artificial Intelligence | MENA | Middle East and North Africa |
| CBQ | Commercial Bank of Qatar | QCB | Qatar Central Bank |
| FE | Fixed Effects | QFC | Qatar Financial Centre |
| FinTech | Financial Technology | QNB | Qatar National Bank |
| GCC | Gulf Cooperation Council | RBV | Resource-Based View |
| ICT | Information and Communication Technology | RE | Random Effects |
| KYC | Know Your Customer | ROA | Return on Assets |
| LM | Lagrange Multiplier | ROE | Return on Equity |
Appendix A. Statistical Output Evidence (R Plm and Sandwich)
This appendix reproduces the raw R console output that underpins the regression results reported in Table 3 and Table 4. The estimation environment uses R 4.3 with the plm package for panel estimation and sandwich/lmtest for cluster-robust coefficient testing.
Figure A1.
Breusch–Pagan Lagrange Multiplier test for random effects in the ROA model. The result (χ2 = 6.275, p = 0.0122) supports the presence of significant panel effects.
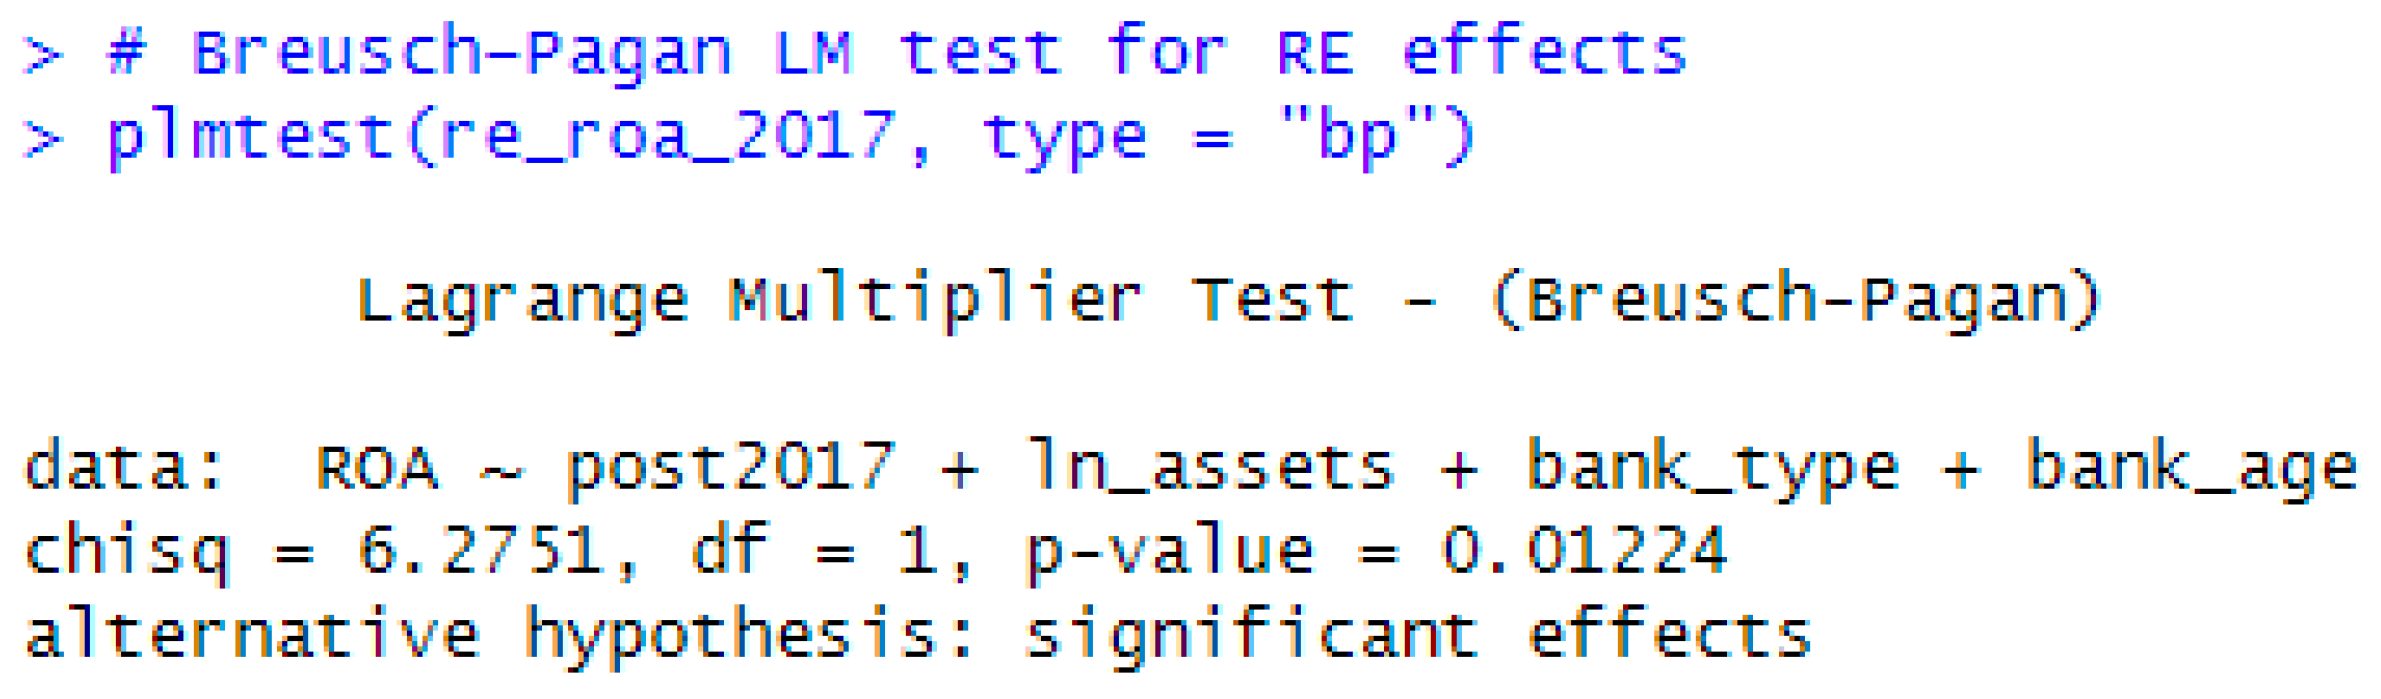
Figure A2.
FE summary-ROA, post-2017.
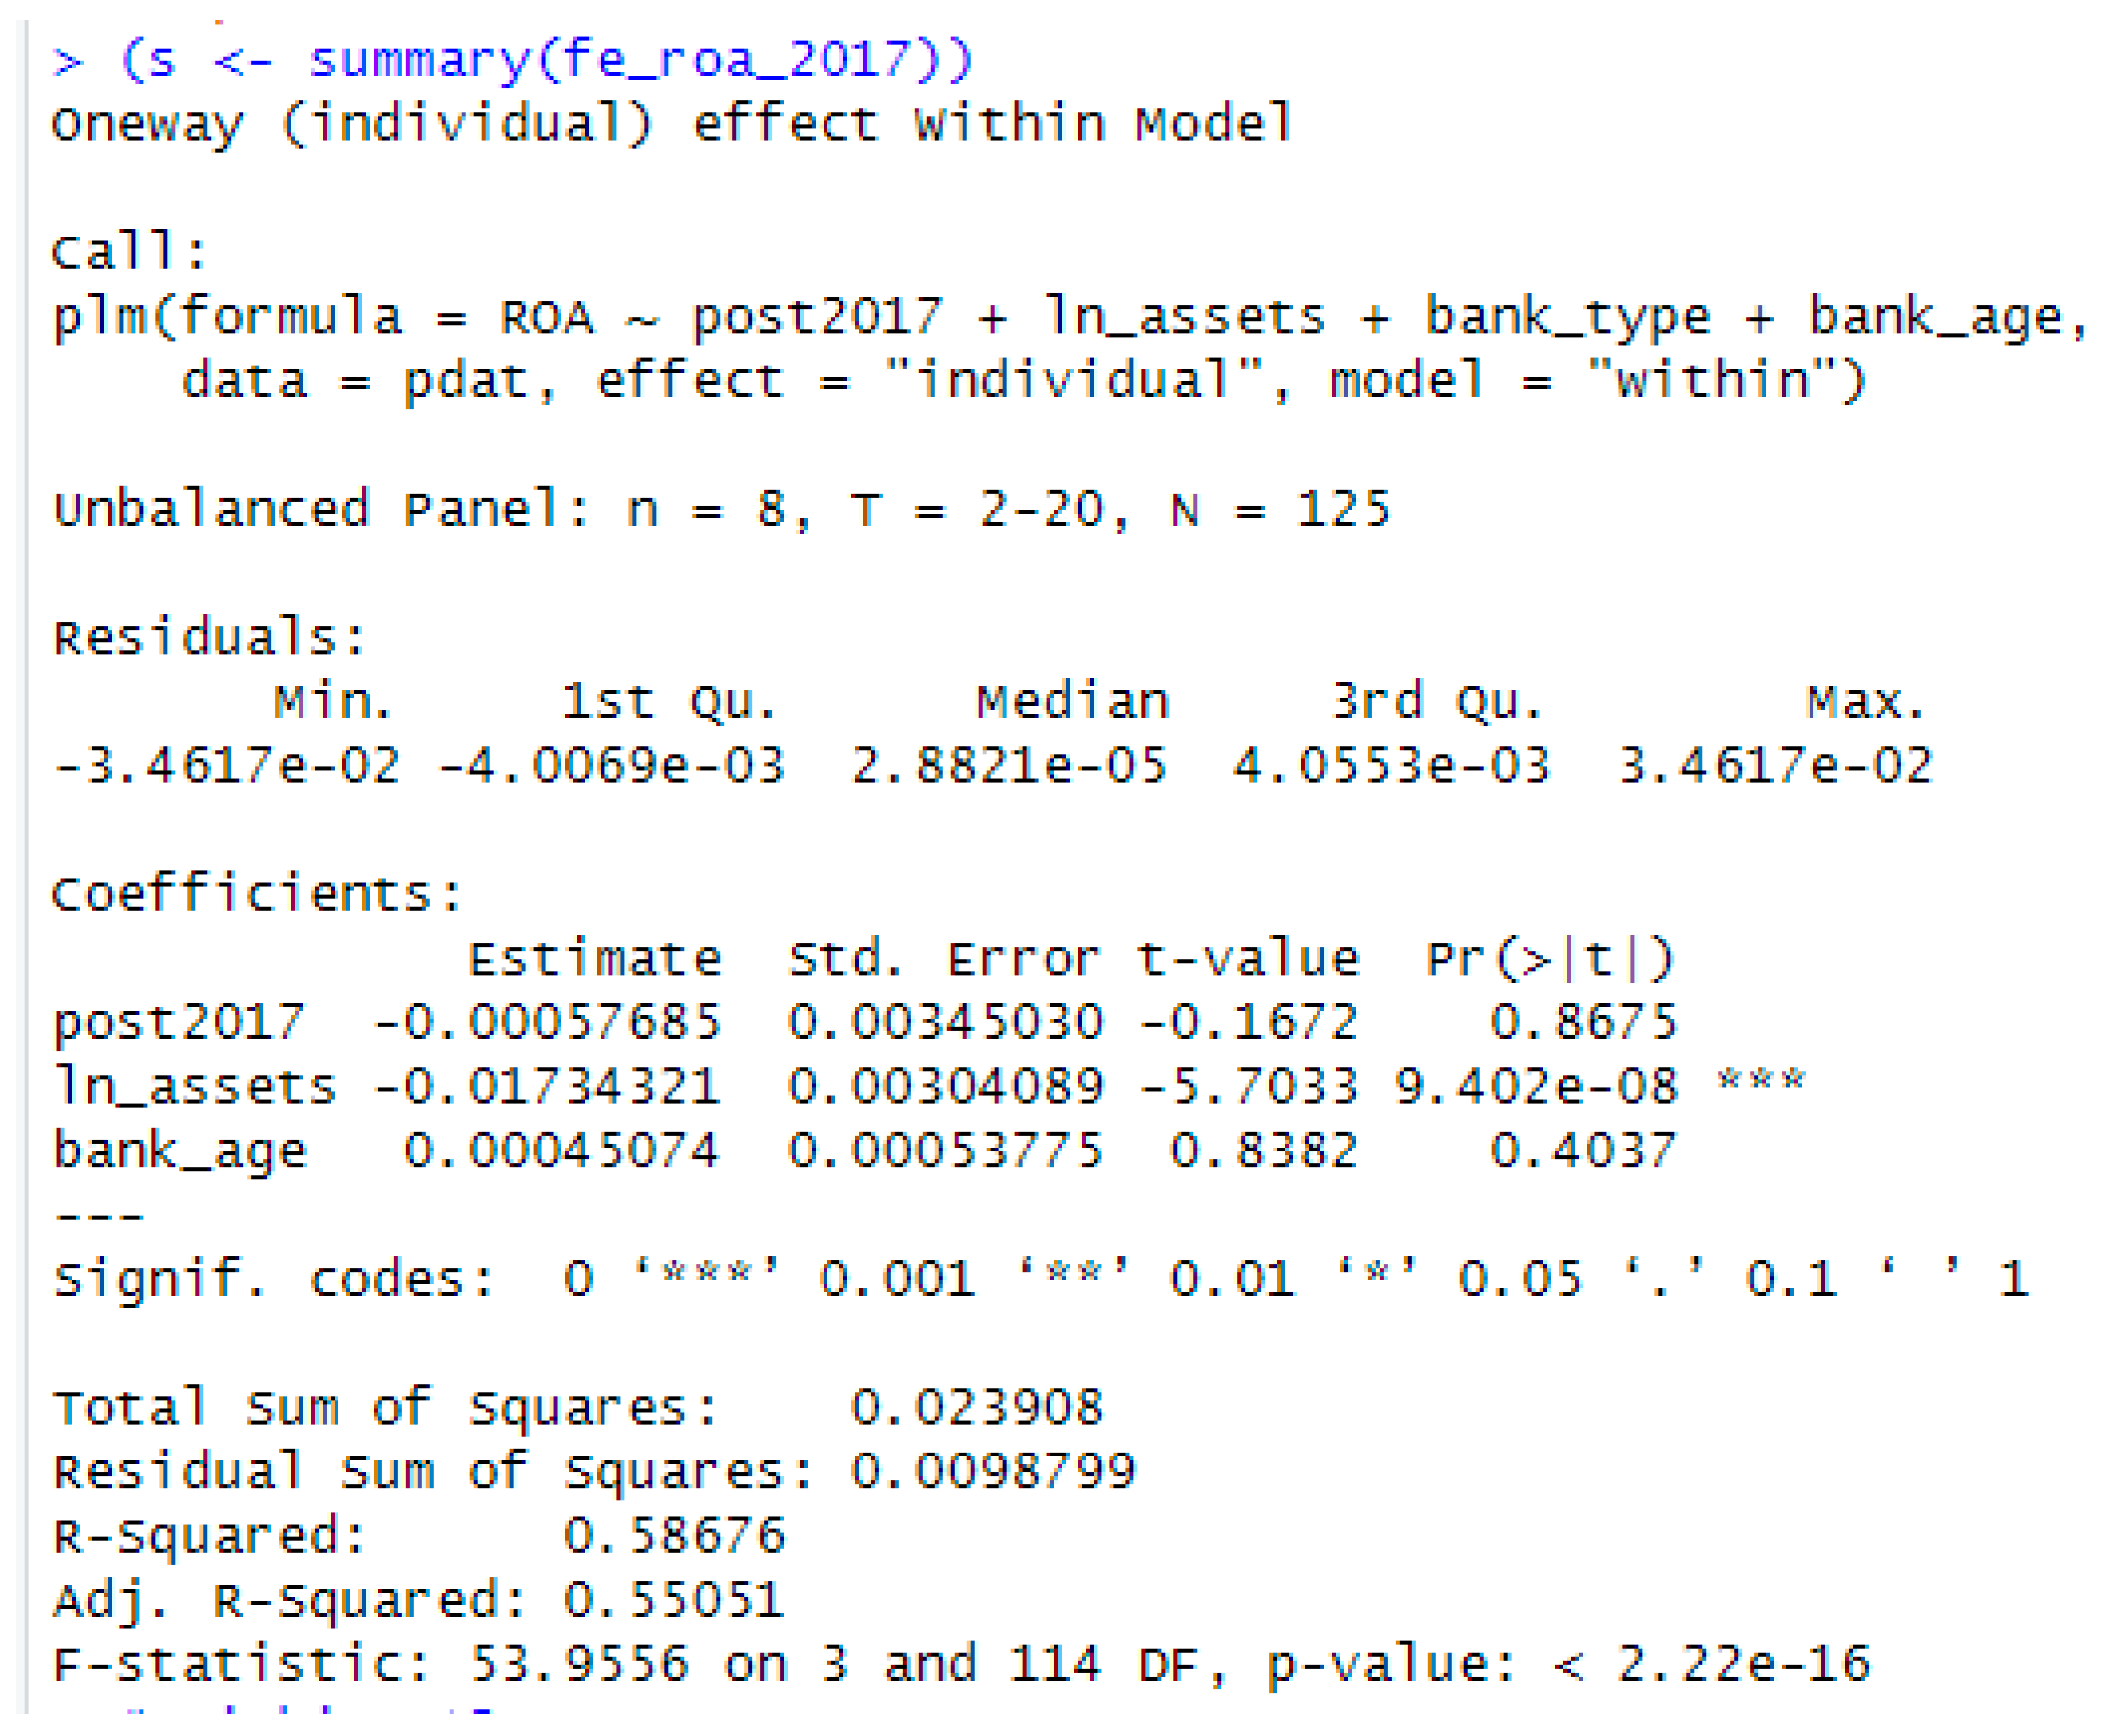
Figure A3.
Cluster-robust coefficients-ROE, post-2017.
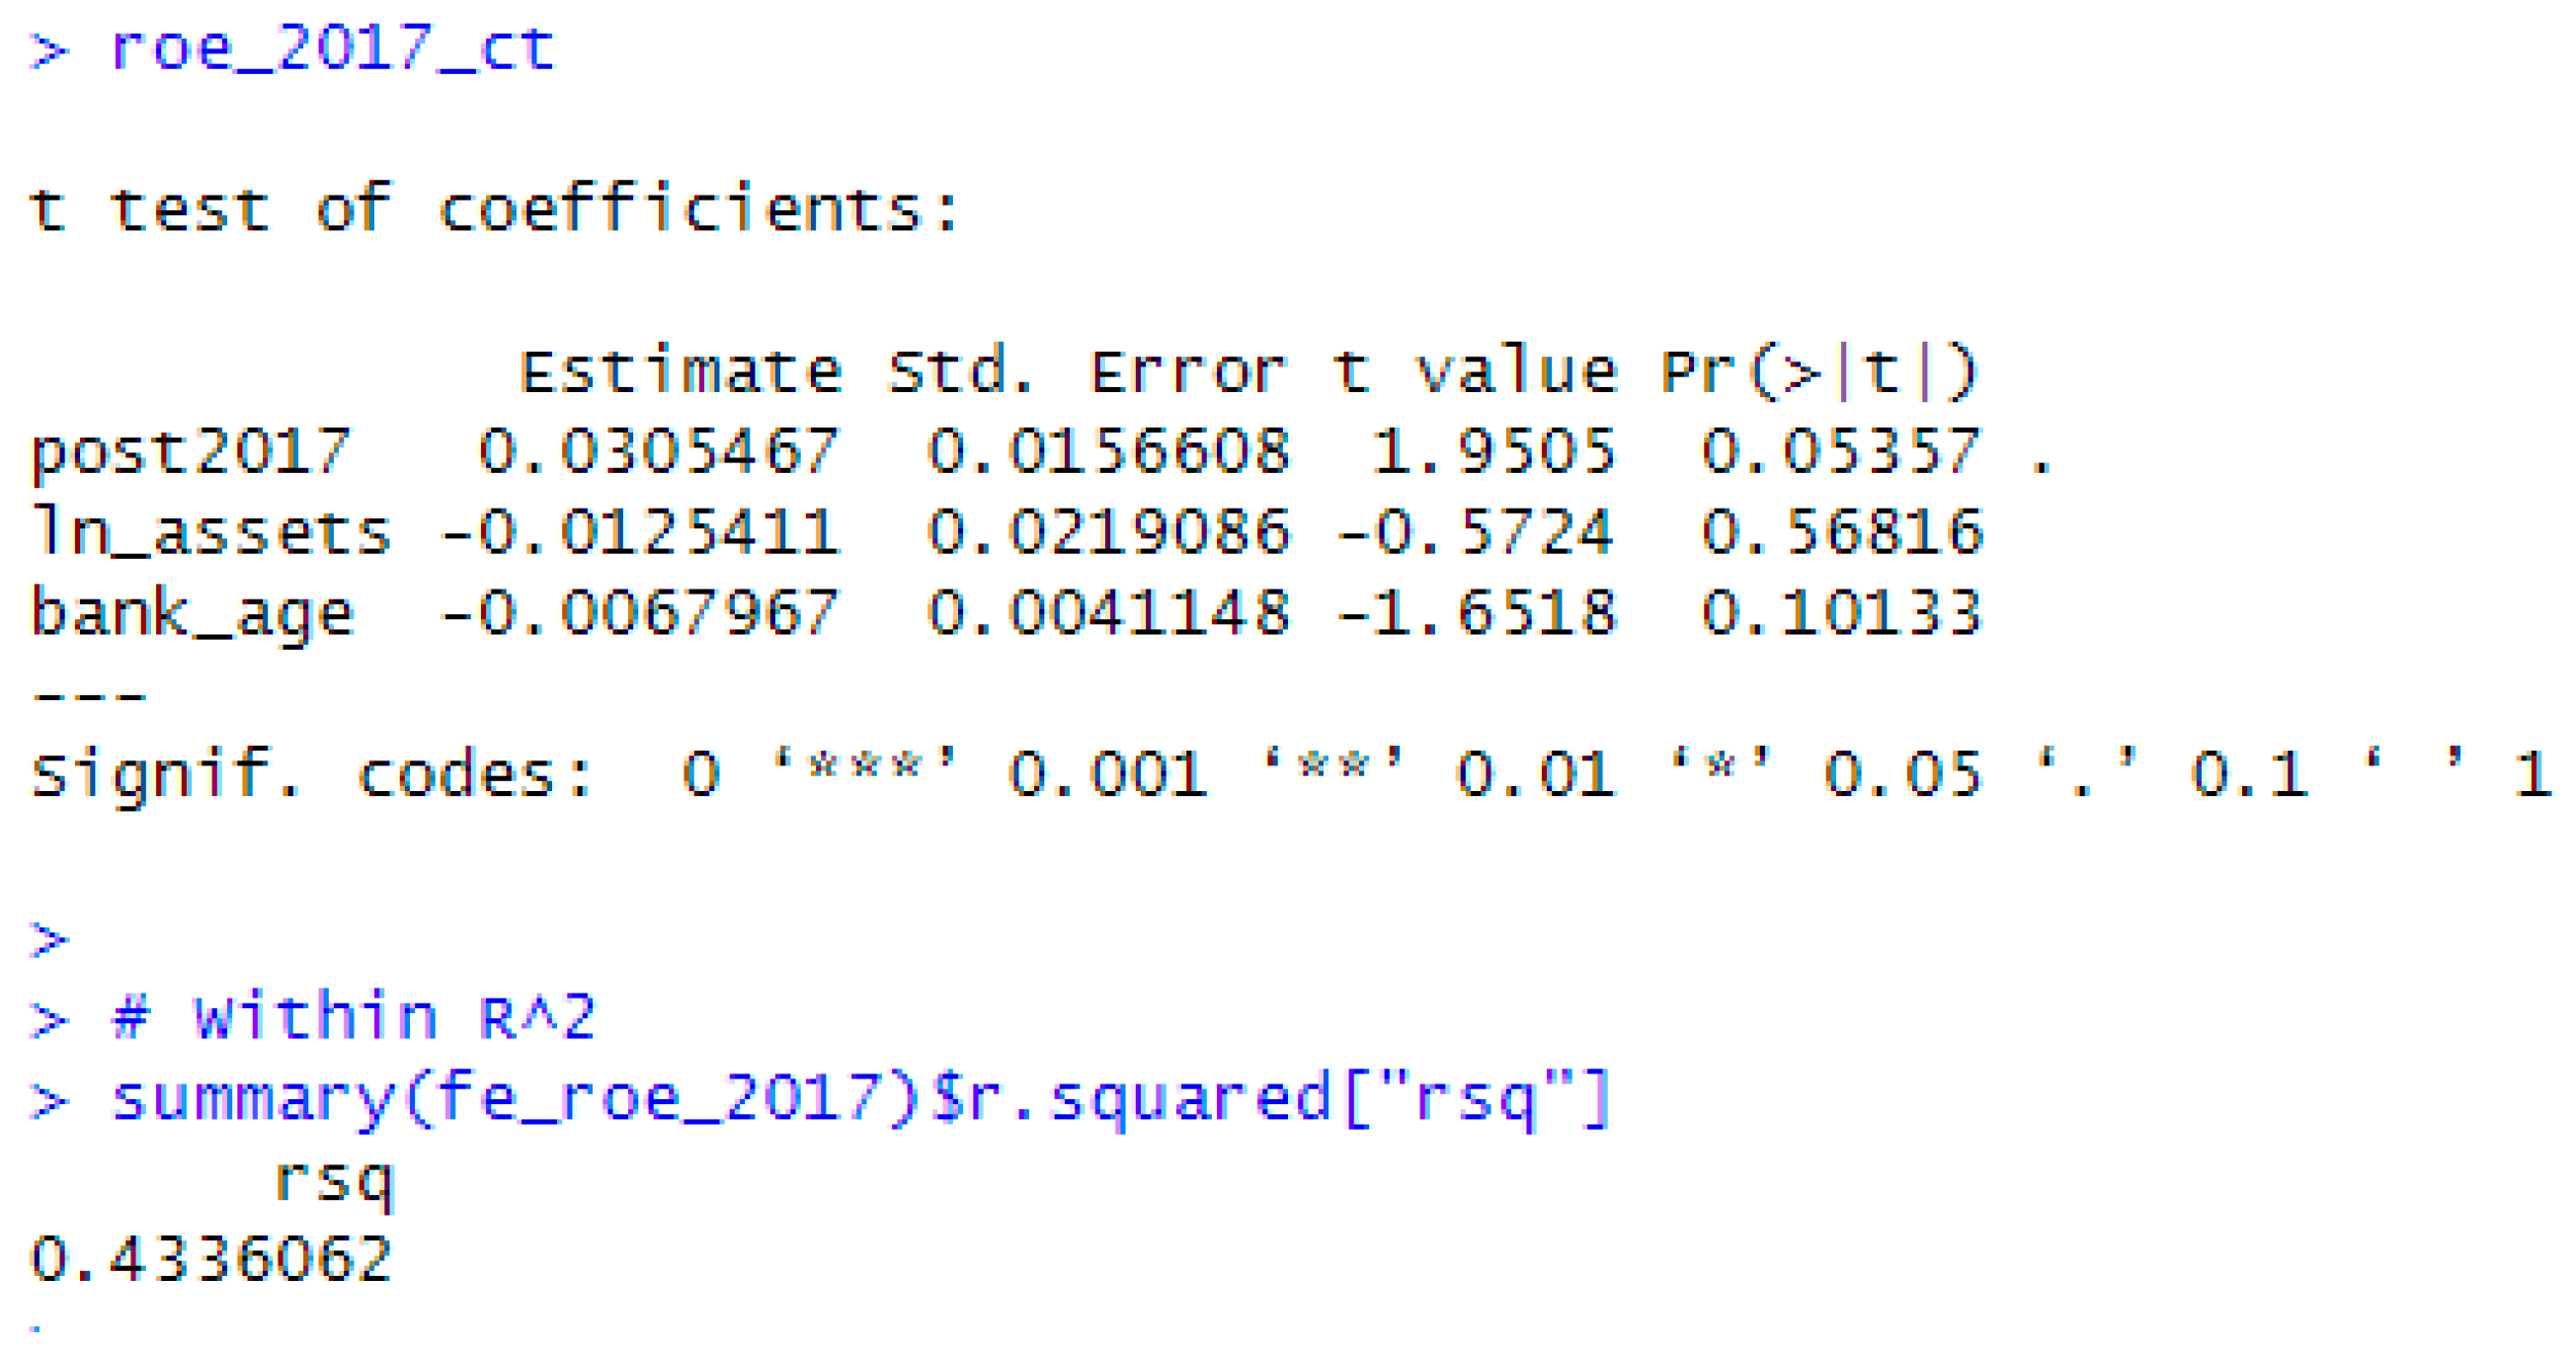
Figure A4.
Heterogeneity test for the post-2017 ROA model with the Post2017 × BankType interaction. The interaction term is insignificant (p = 0.336).
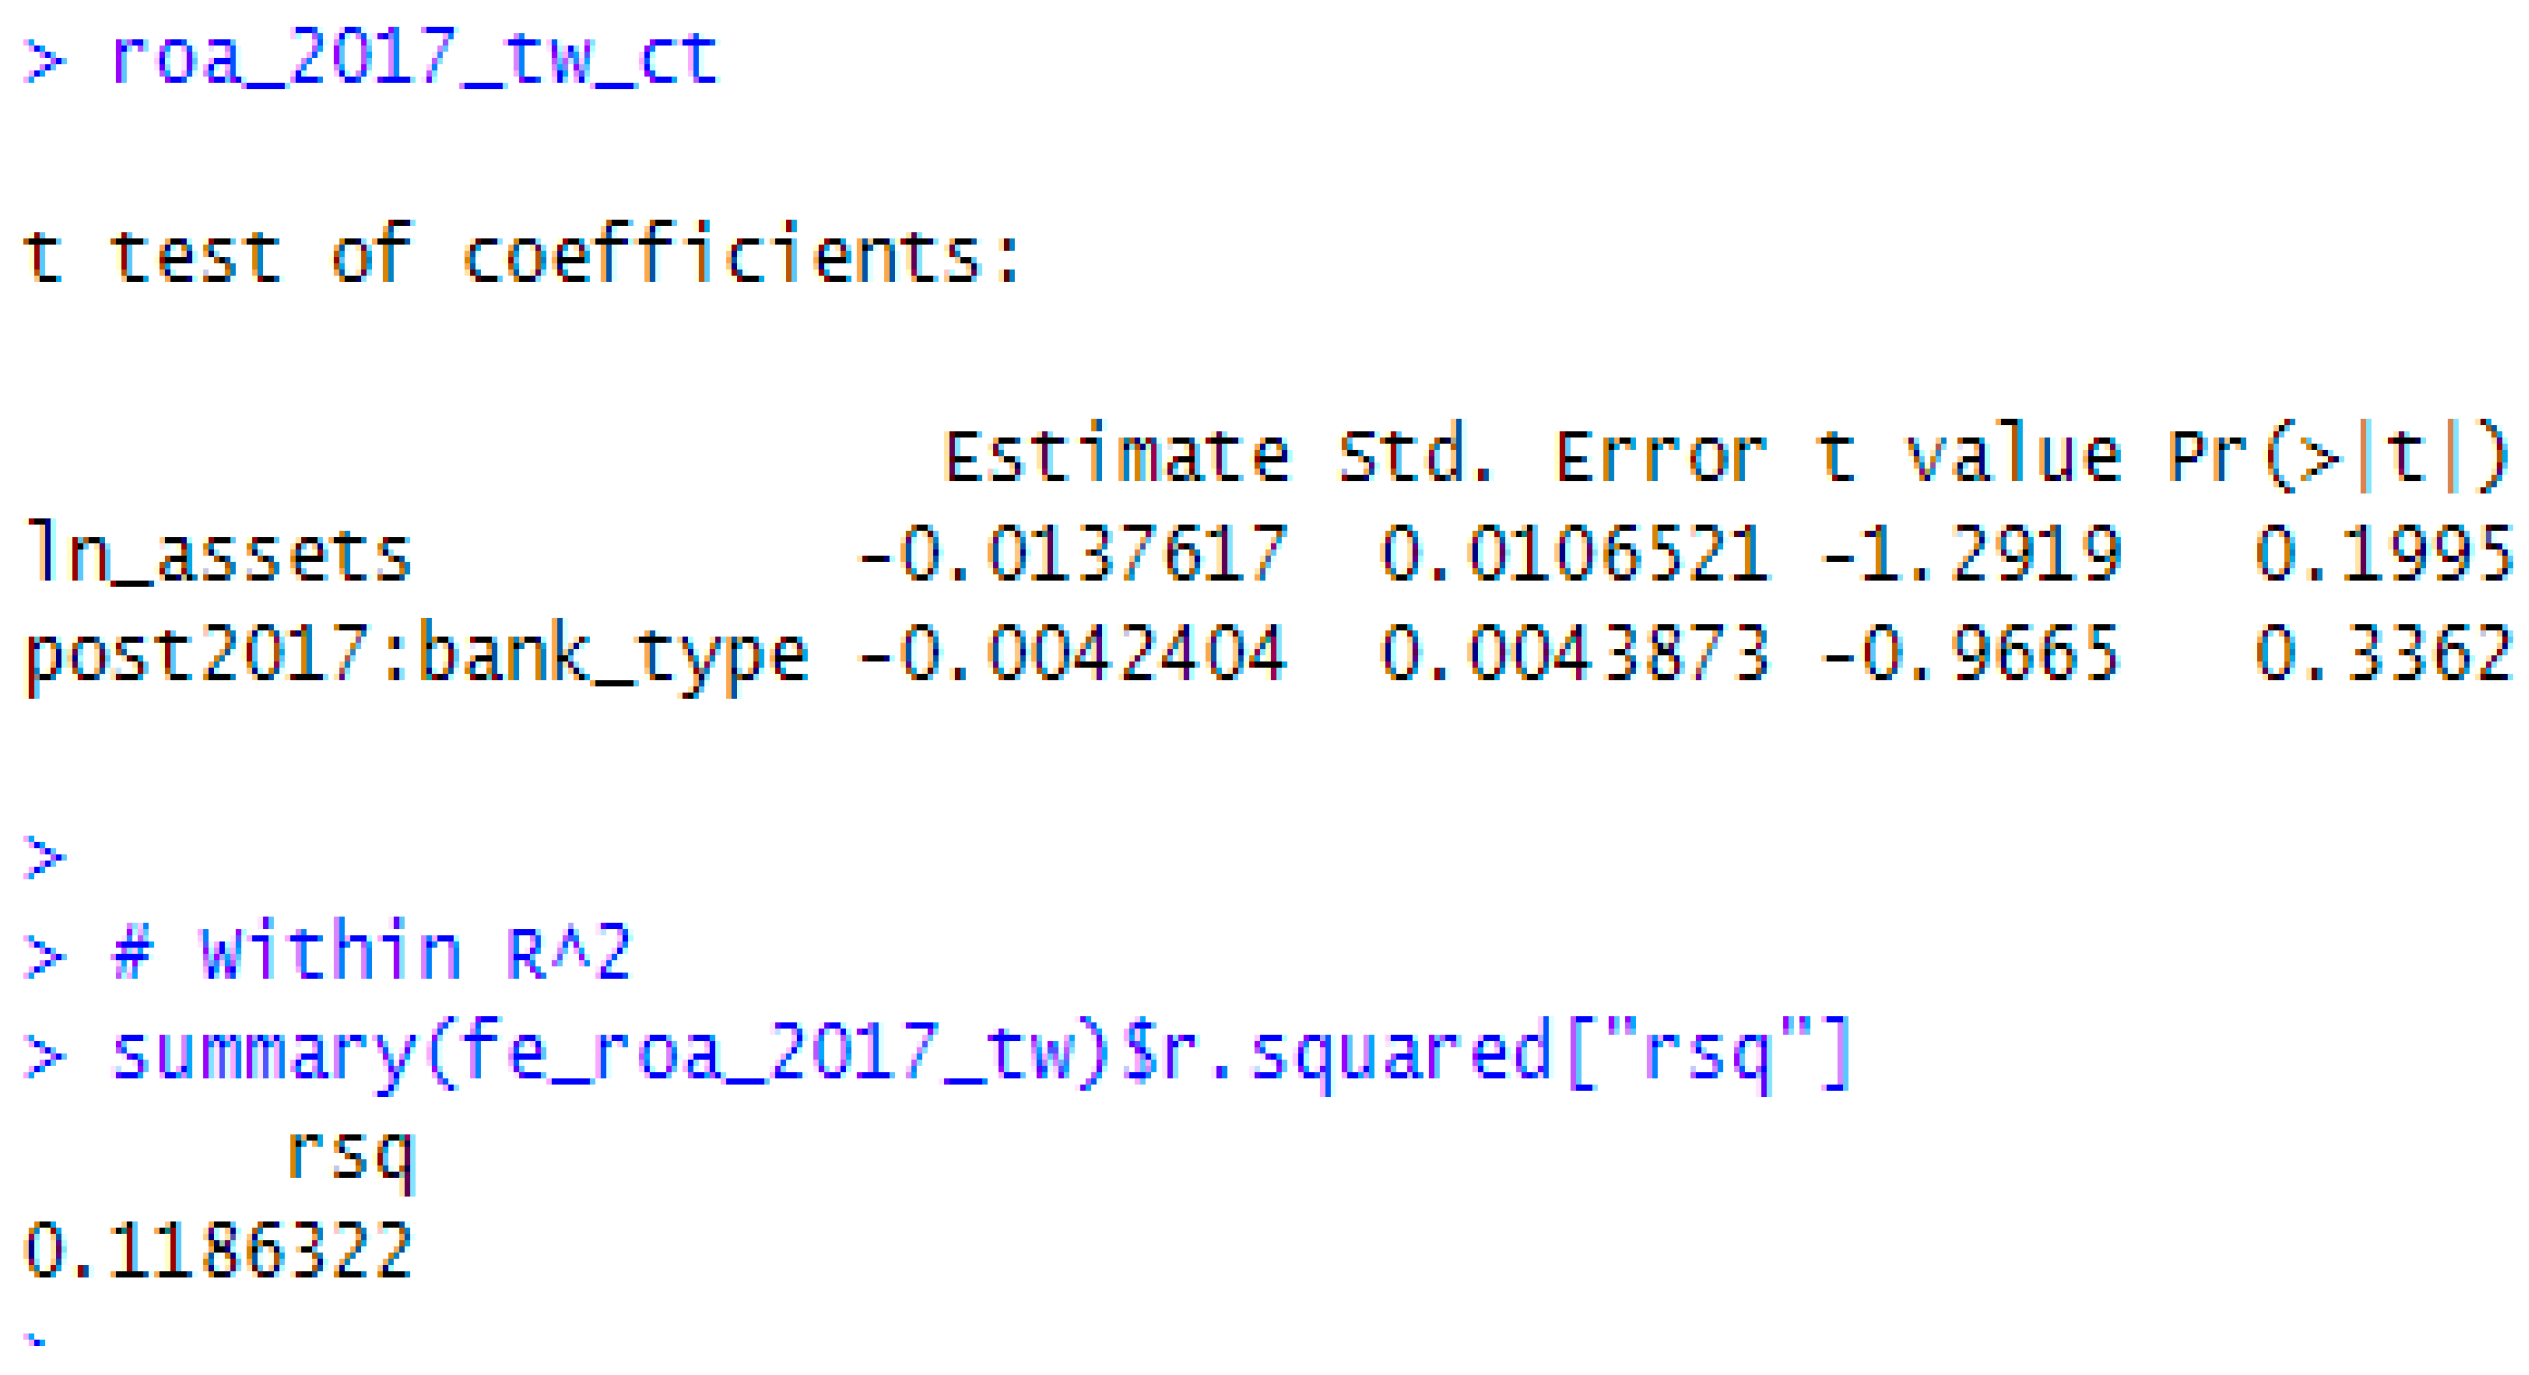
Figure A5.
FE summary-ROA, post-2020.
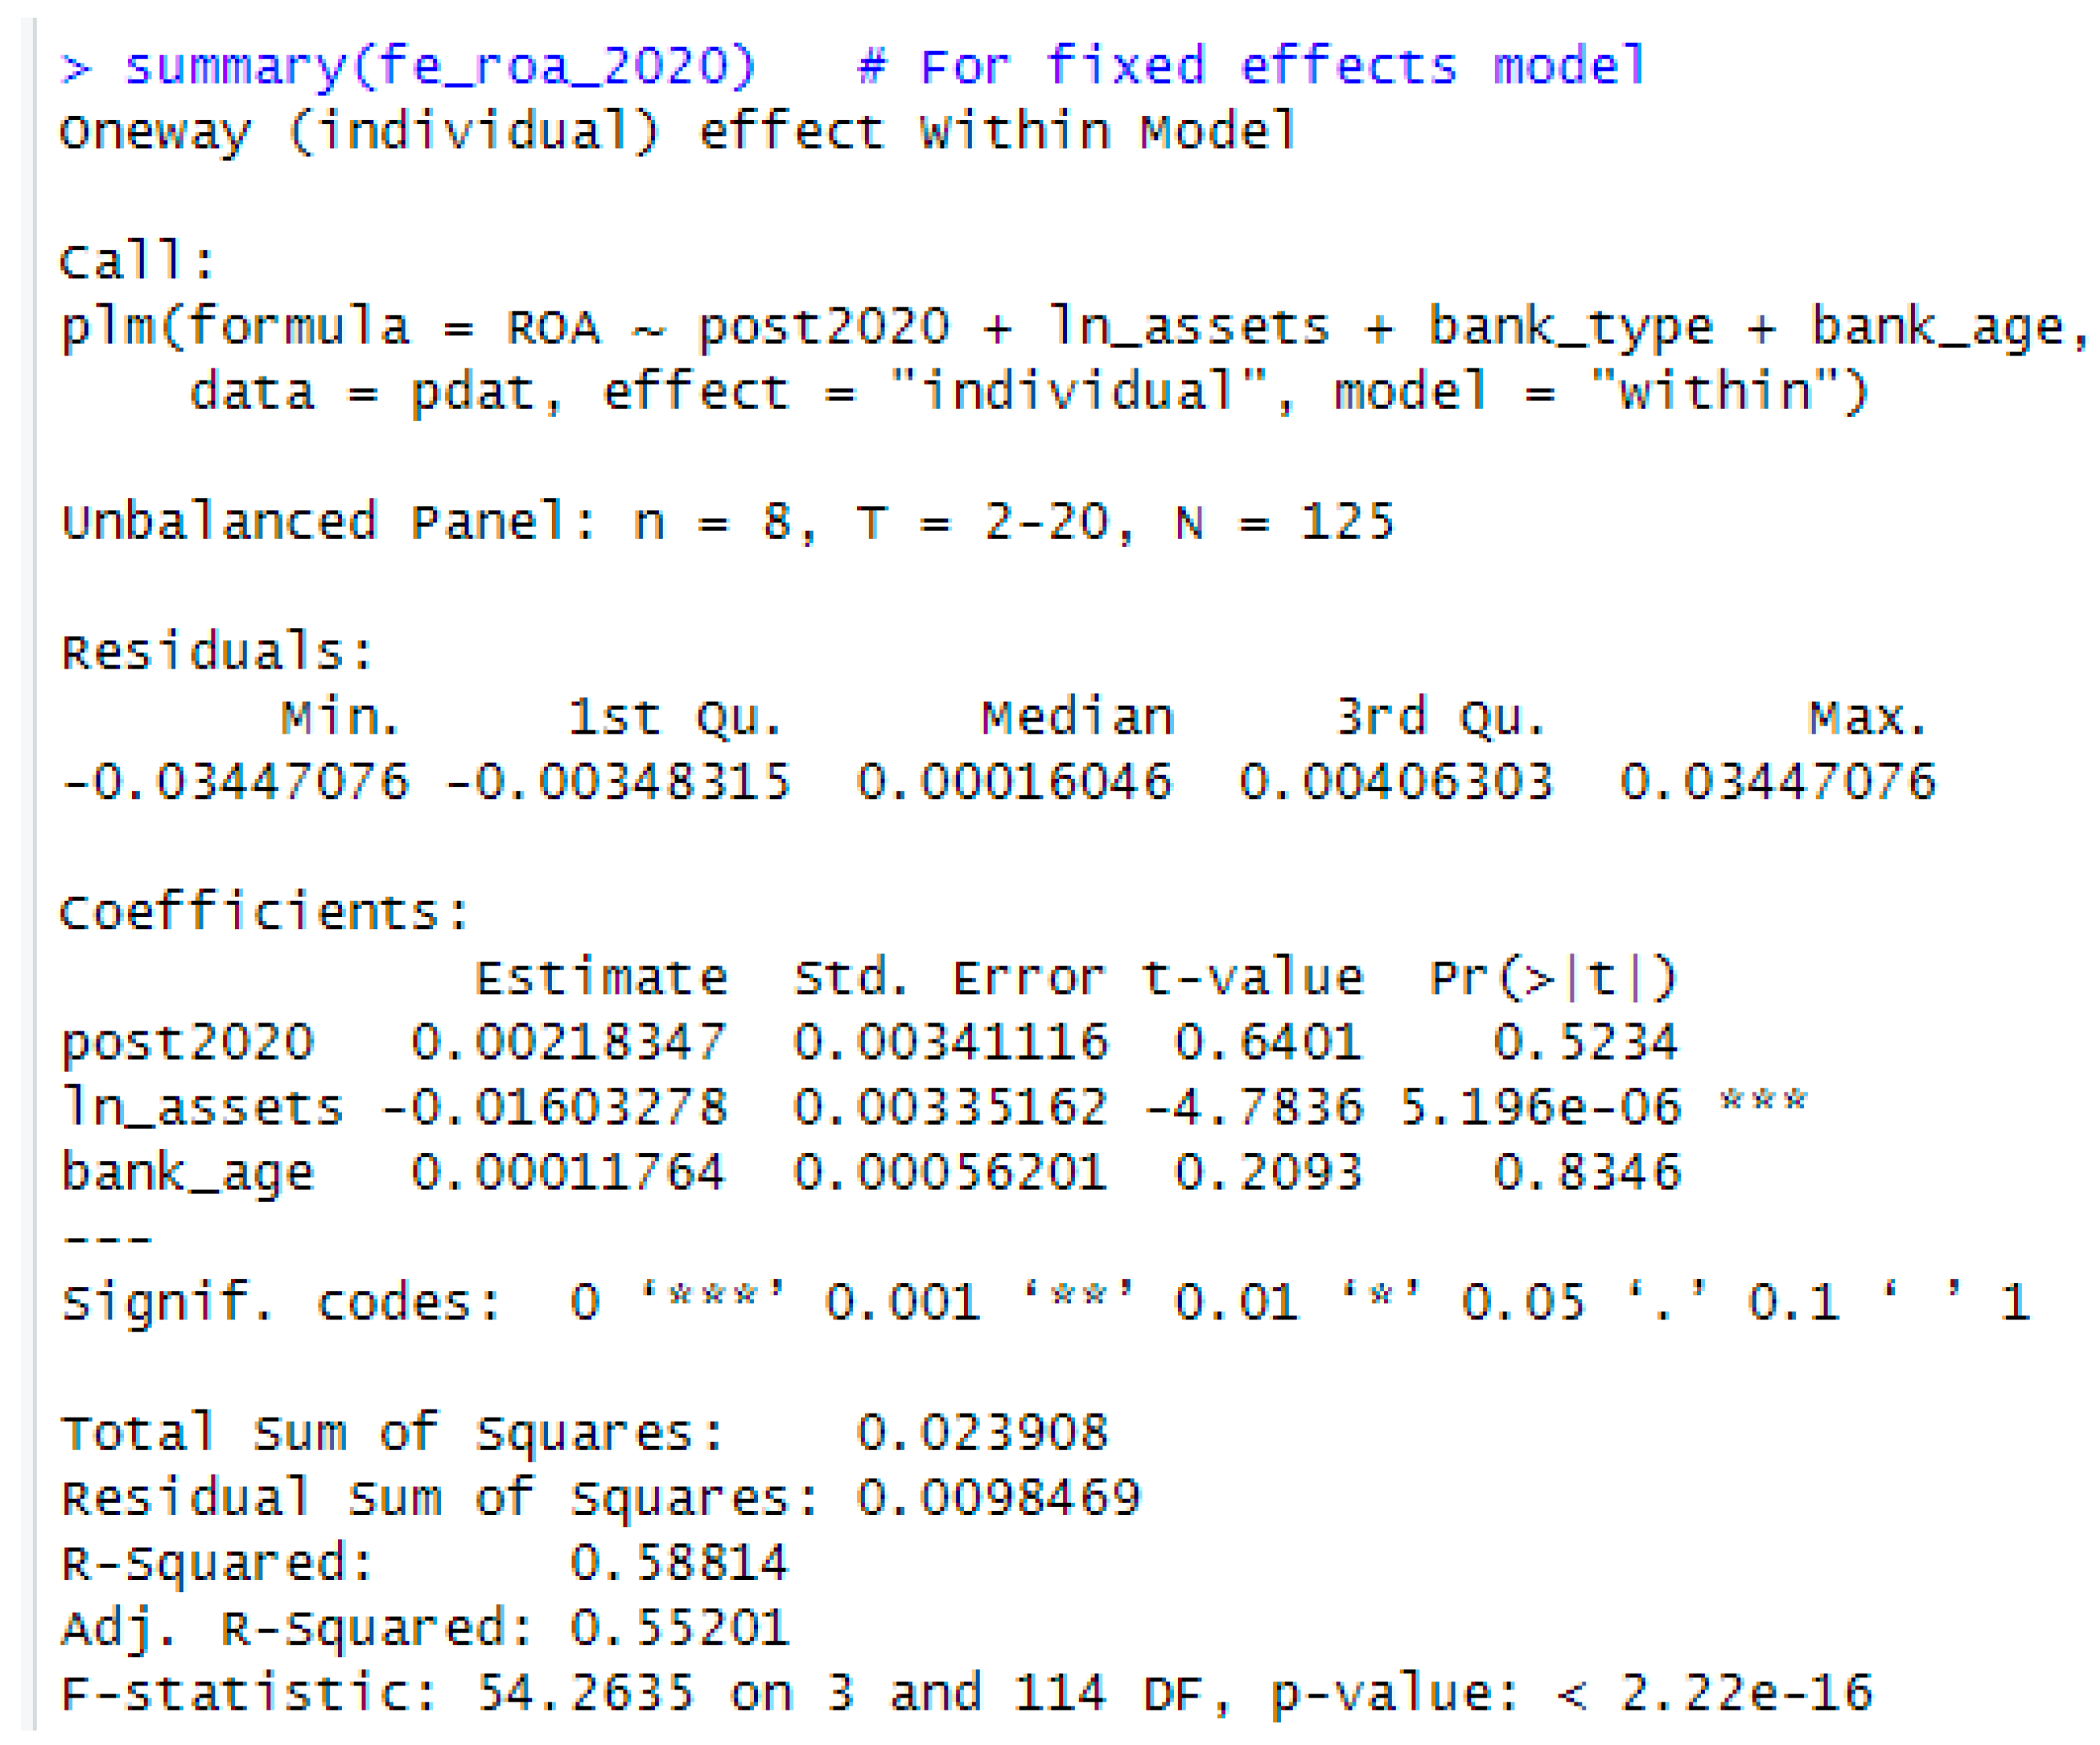
Figure A6.
ROA with Post2020 × BankType interaction.
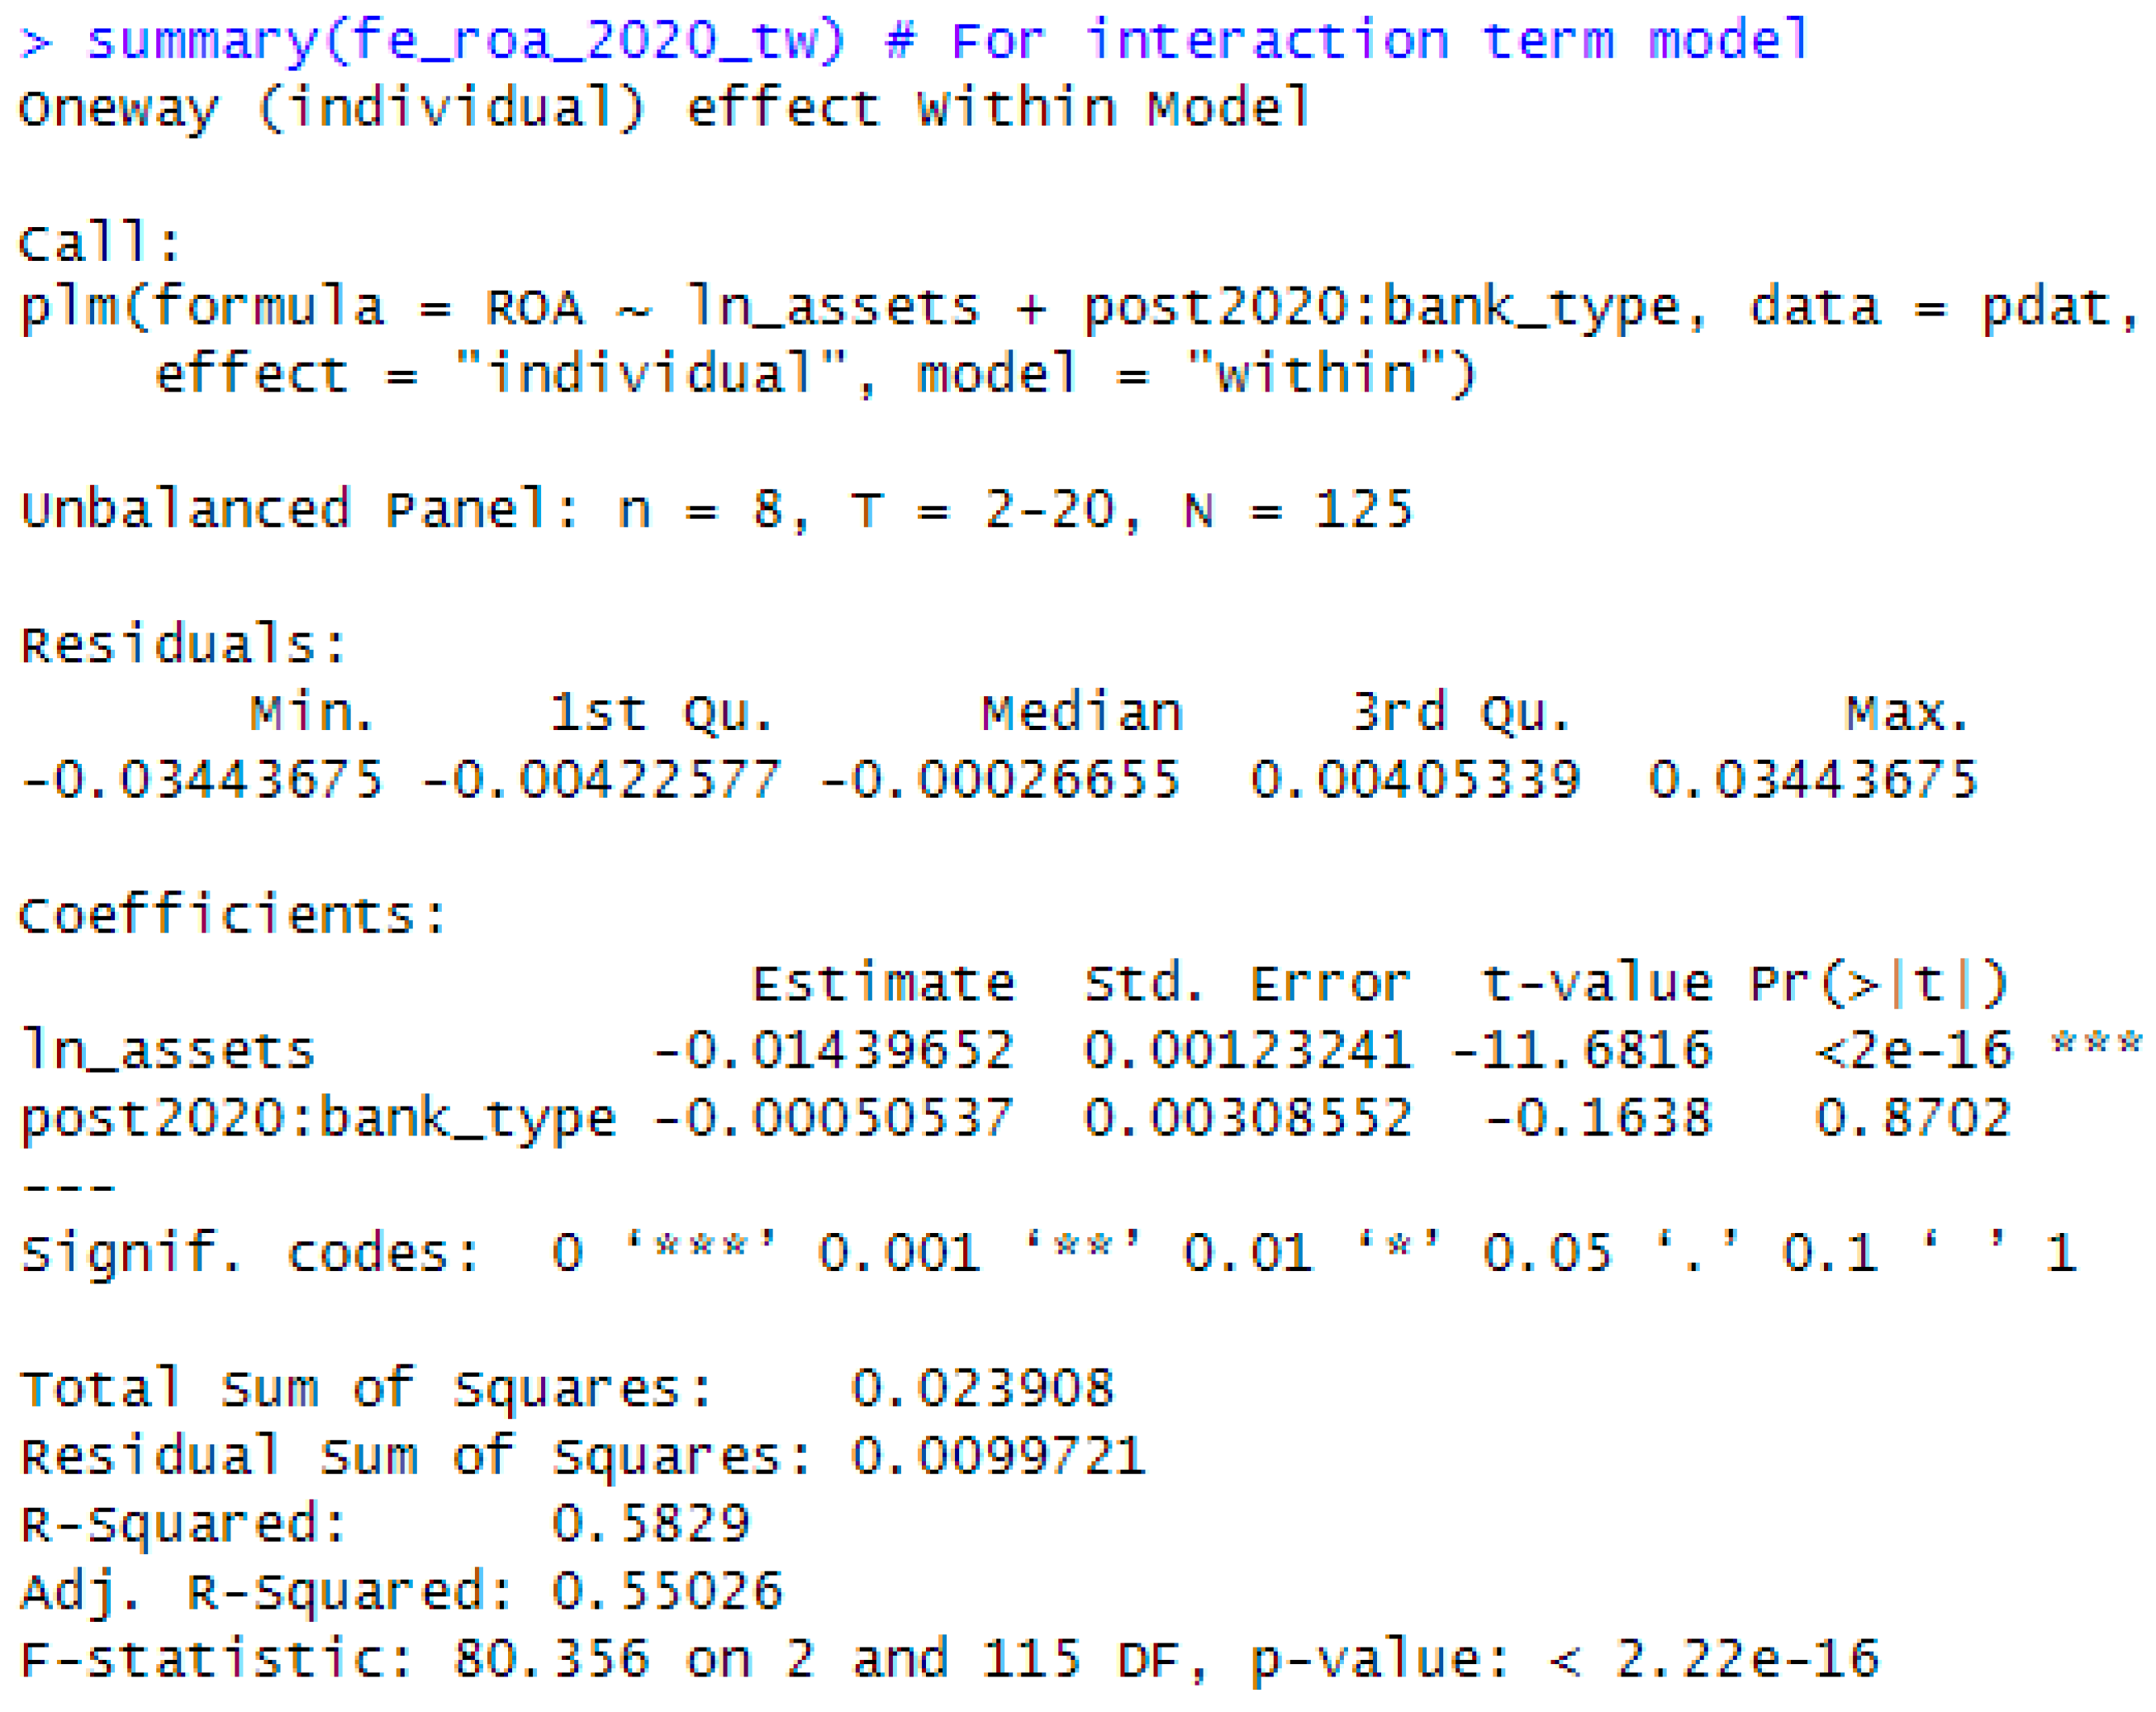
Figure A7.
FE summary-ROE, post-2020.
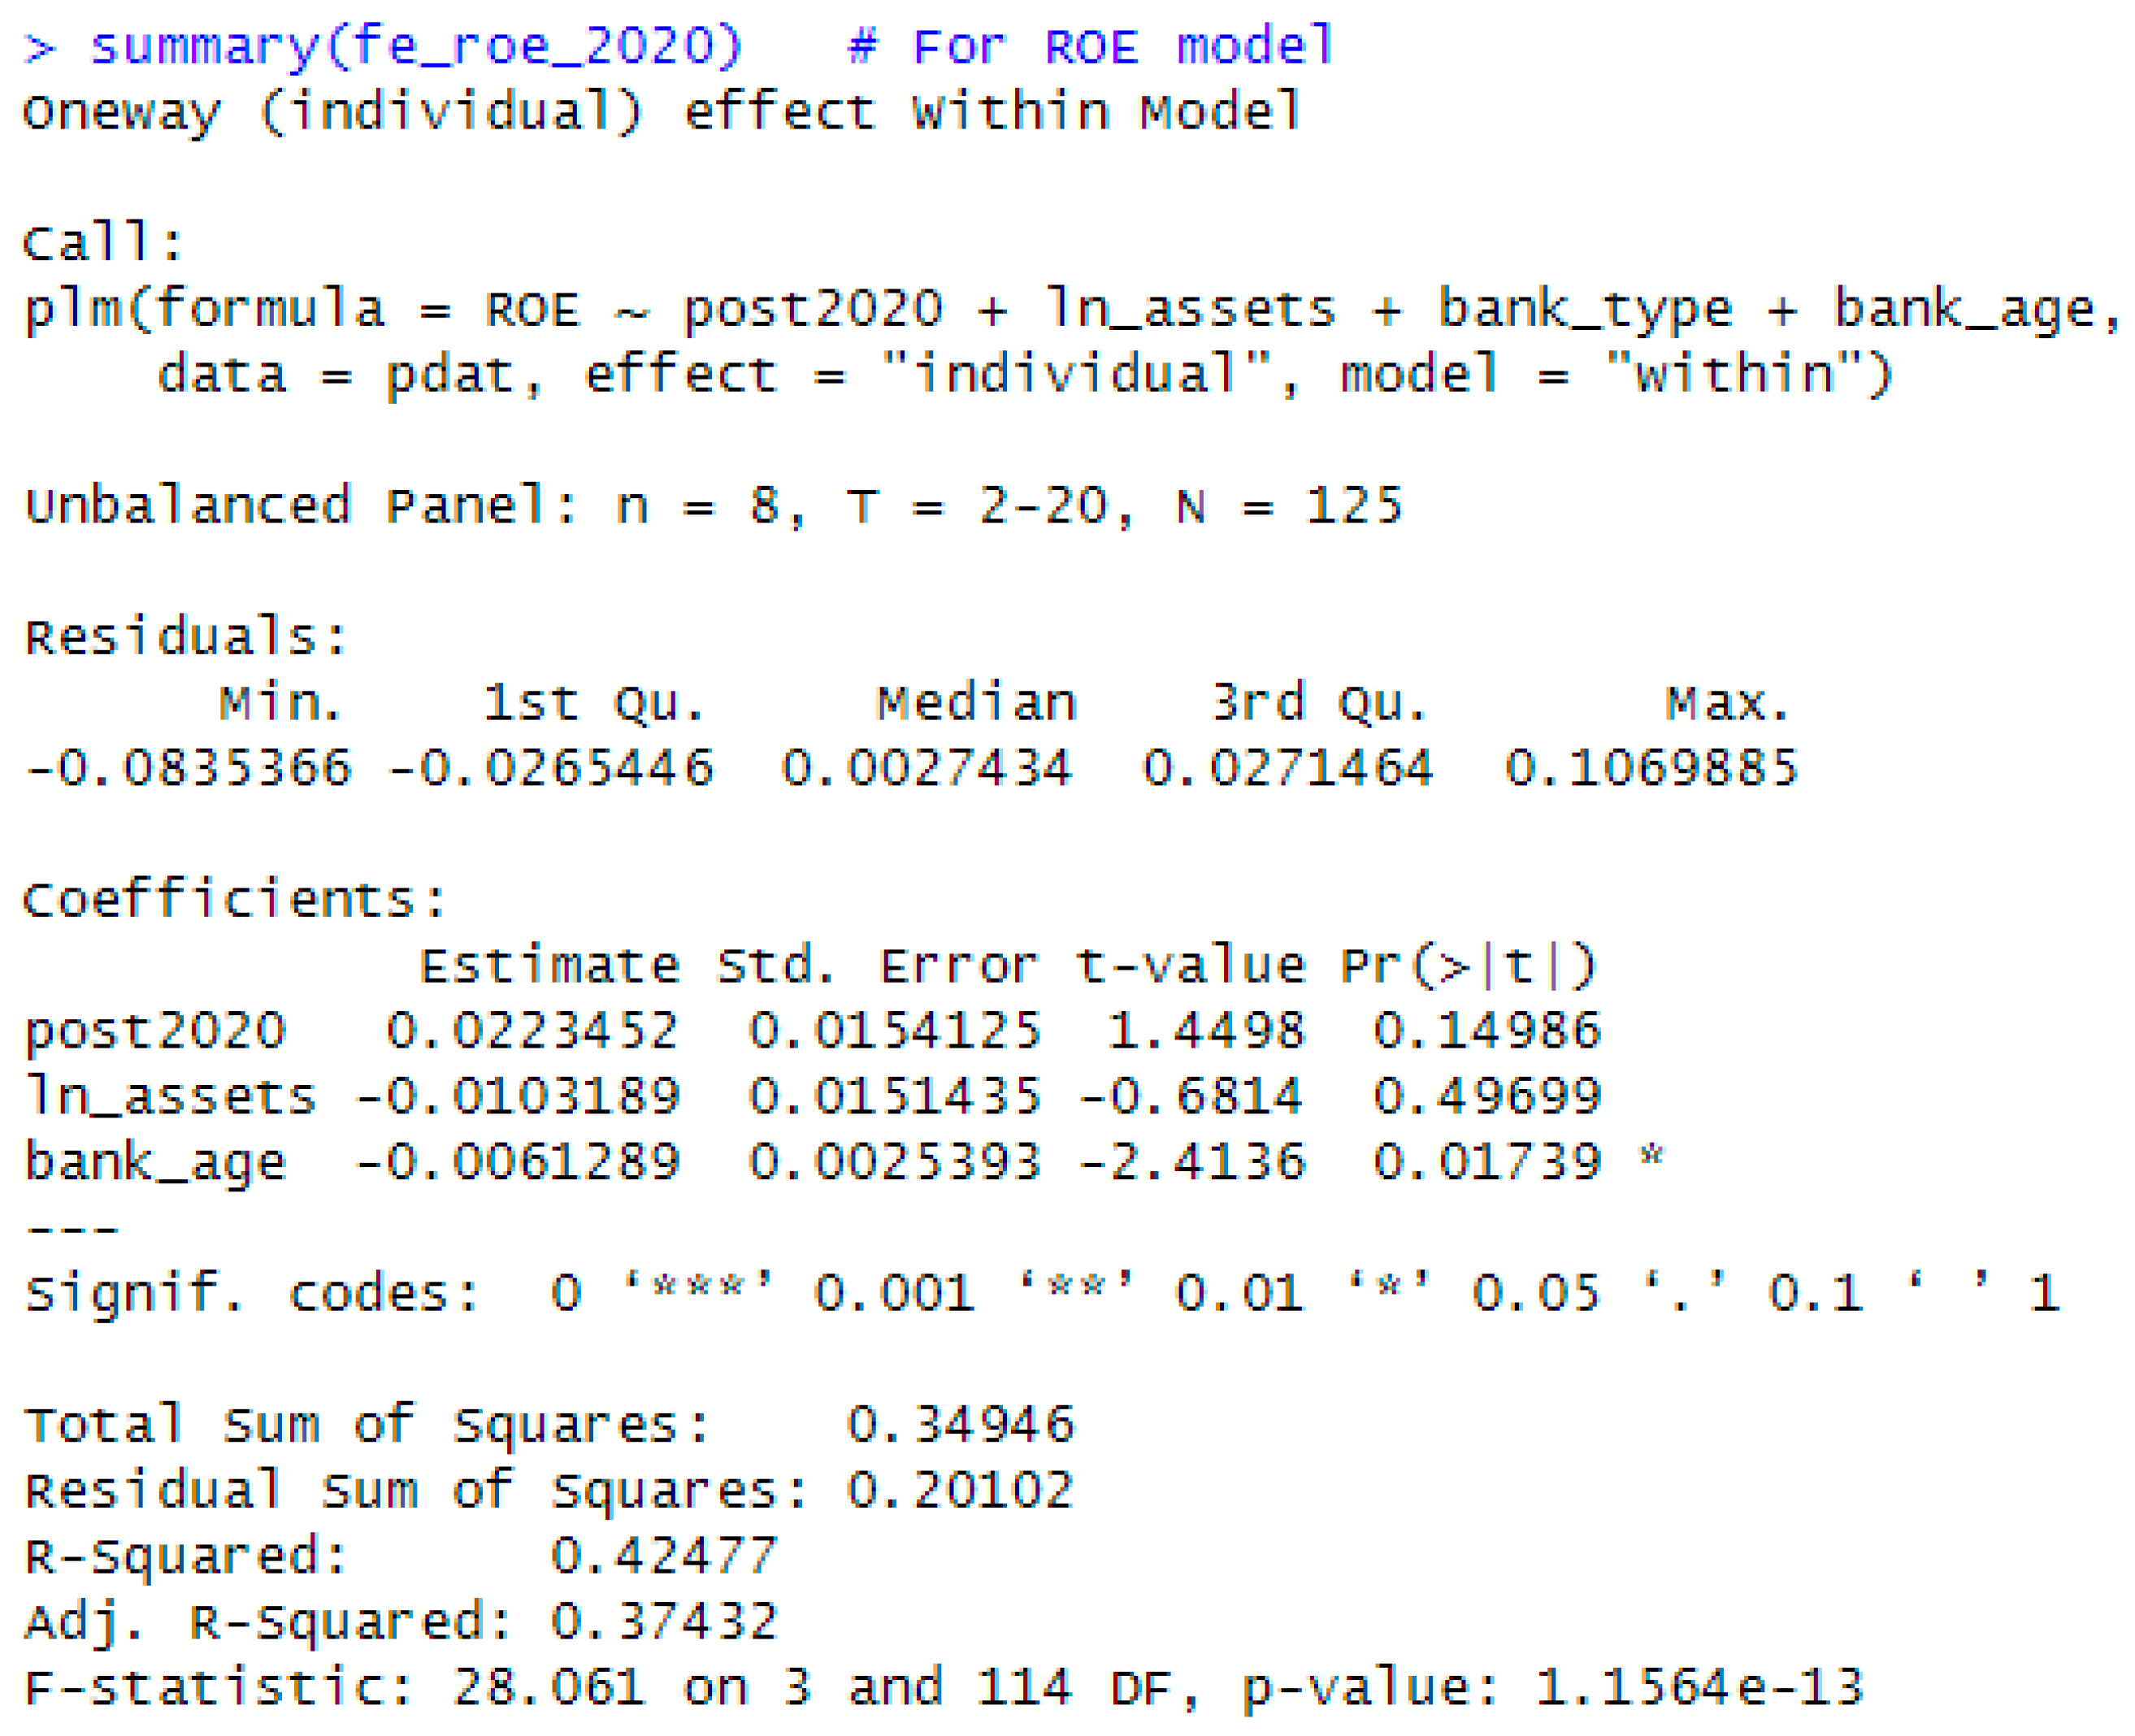
Figure A8.
Cluster-robust coefficients-ROE with interaction.
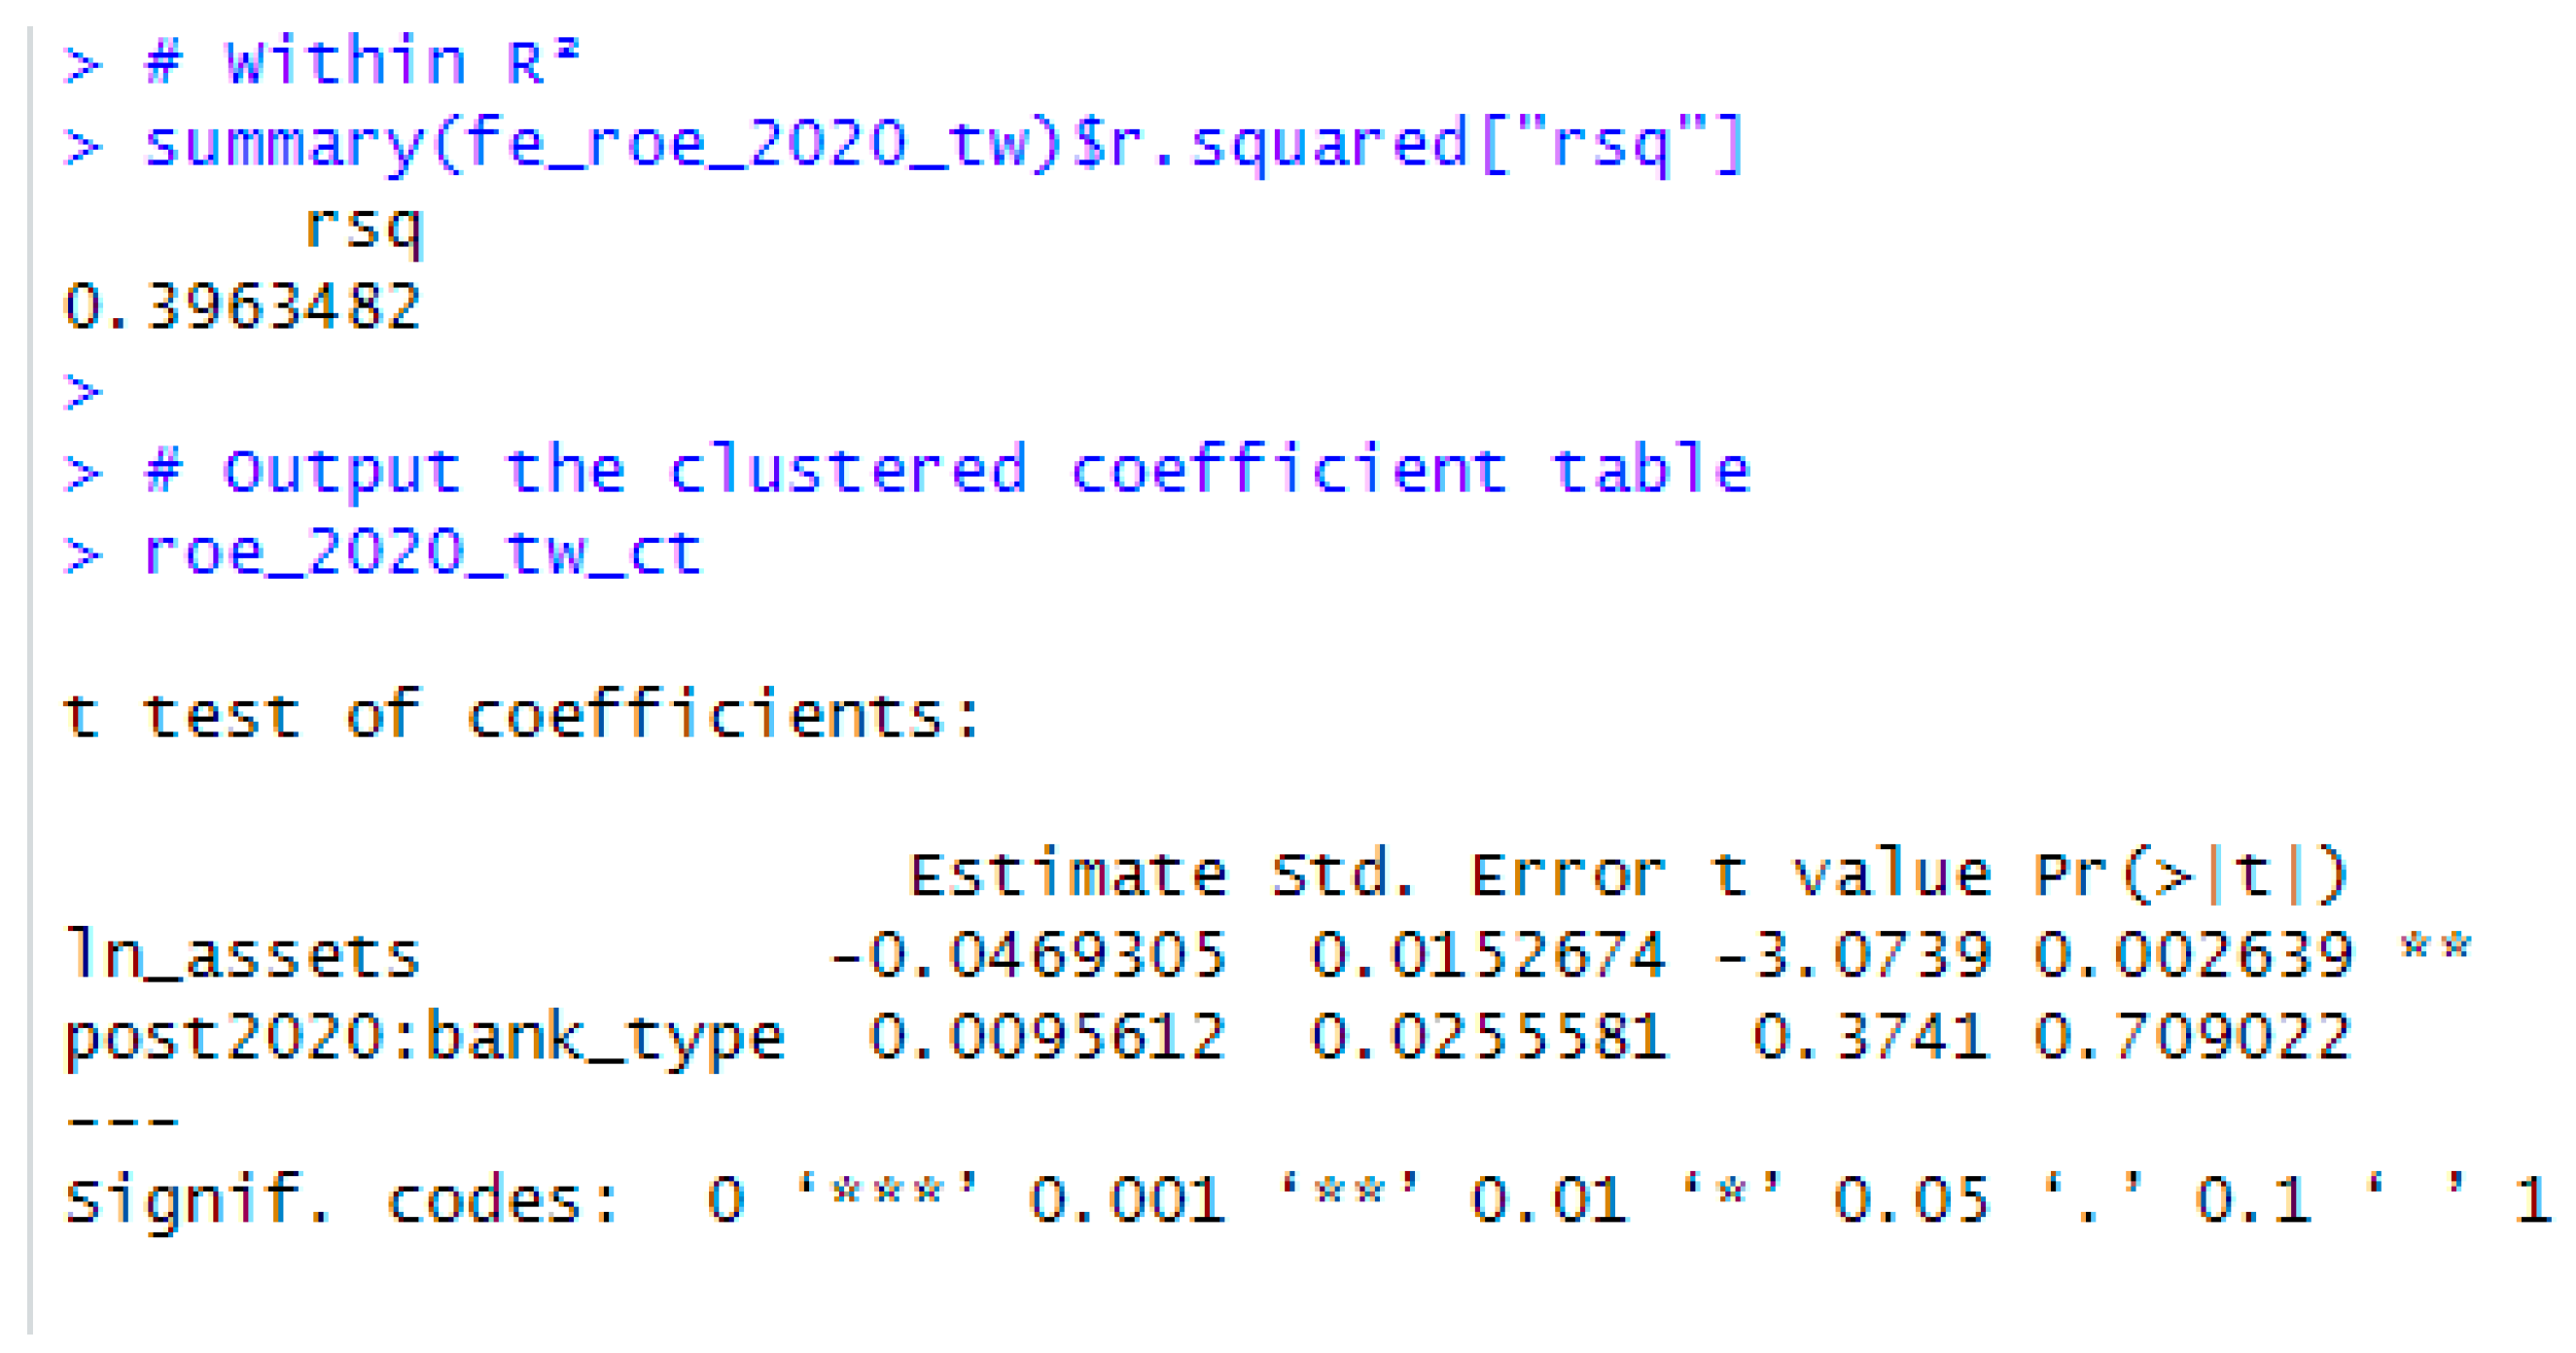
Figure A9.
Distribution of ln_assets. Log transformation reduces skewness to 0.41.
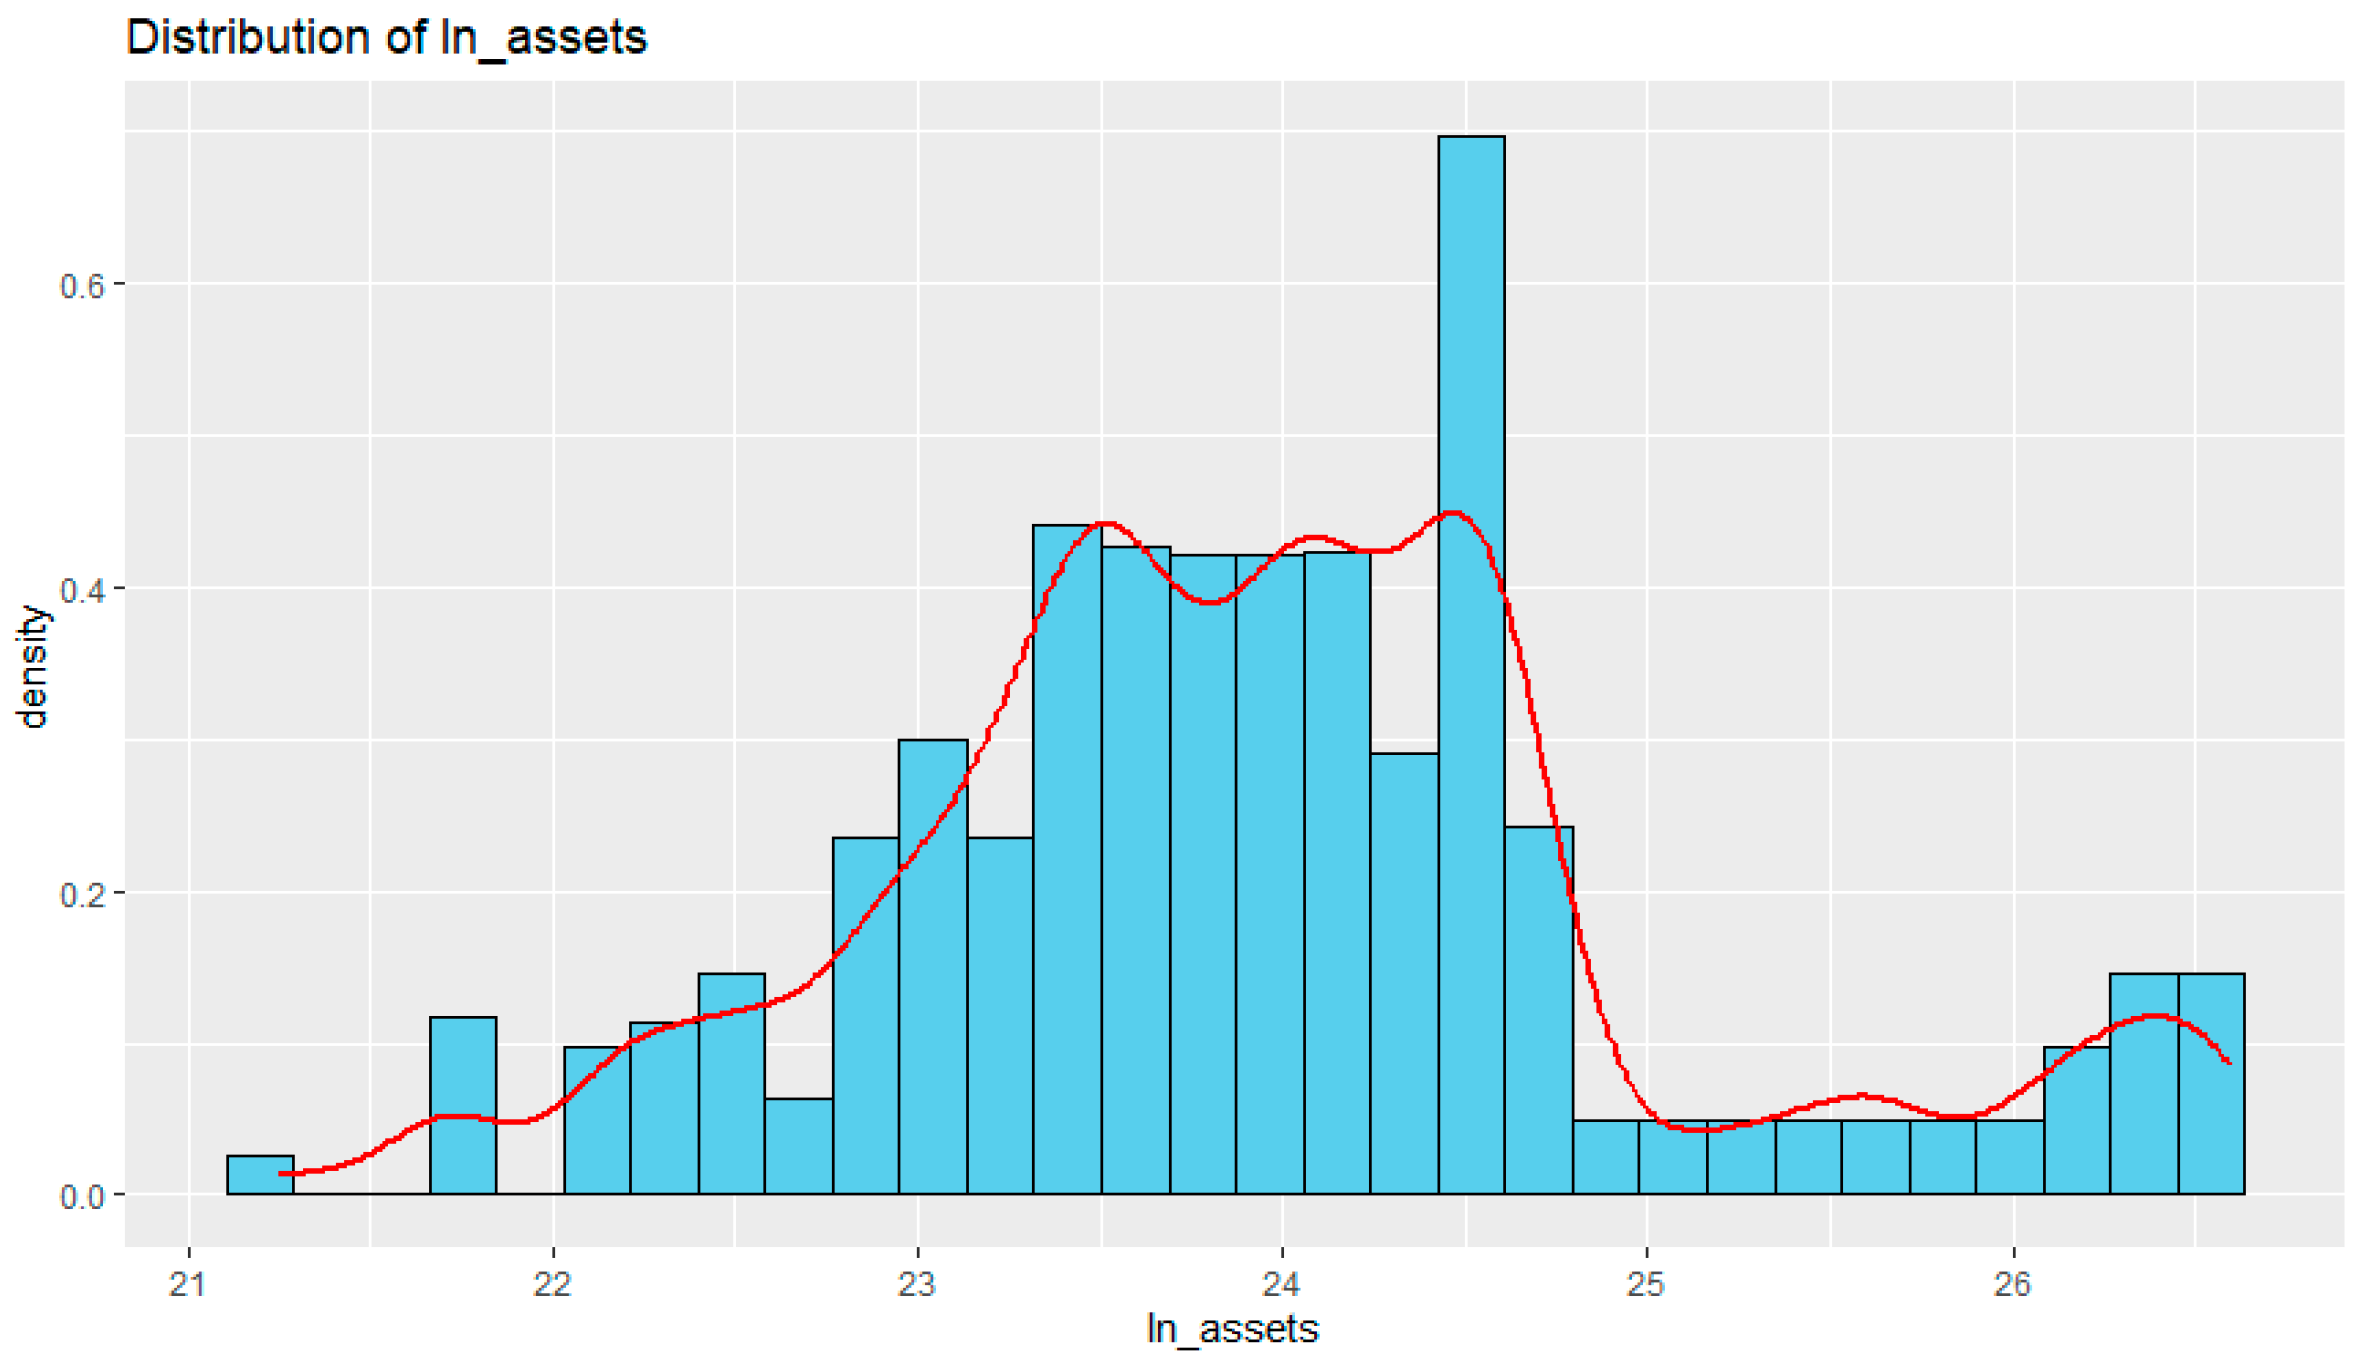
Figure A10.
Distribution of bank age.
Appendix B. Response to Reviewer Comments
This appendix maps each point raised by the two reviewers and by the editorial office to the specific revision made in the manuscript. Rows prefixed with “R3” (and the corresponding revisions, highlighted in yellow throughout the manuscript) reflect the second-round review report.
| Source | Comment | Where Addressed | How Addressed |
| R2 #1 | No actual bank-level FinTech adoption measures (digital transactions, IT capex, mobile-banking usage, etc.). | §3 (3.2); §5.4 | Section 3.2 now explicitly characterises the policy dummies as an intent-to-treat identification and acknowledges the absence of granular bank-level proxies. Section 5.4 “Low statistical power” and “Intent-to-treat design” paragraphs discuss the trade-off and flag bank-level FinTech-intensity proxies as a priority for future work once disclosure improves. |
| R2 #2 | No year FE, no untreated control, no event-study structure; pandemic acknowledged as not a clean treatment but interpretation proceeds. | §3 (3.3); §5.4 | A new paragraph in 3.3 explains why year FE would absorb the policy dummies in a single-country, lock-step regulatory setting, and that no domestic untreated control exists. A dedicated paragraph in 5.4 confirms the limitation and flags a cross-GCC difference-in-differences extension as the natural relaxation. |
| R2 #3 | TAM, DOI and RBV not integrated into the model. | §2 (2.1) | A new paragraph maps the three frameworks to specific empirical-model variables: TAM → Postt (policy windows); DOI → Postt × BankTypei (interaction); RBV → ln(Assets)it and Ageit. |
| R2 #4 | Need more bank-time-varying controls (capitalisation, cost/income, NPL, liquidity, income diversification). | §3 (3.3); §5.4 | 3.3 now acknowledges the data constraint and that the bank-size coefficient absorbs part of these omitted controls. 5.4 “Limited bank–time-varying controls” specifies the missing controls and tags re-estimation with richer covariates as priority future work. |
| R2 #5 | Sample inconsistency: bank age = 1 in descriptives; 9 banks listed but 8 in regression. | §3 (3.1); footnote to Table 1 | Section 3.1 now explains that Lesha Bank was QFC-licenced from 2008 and publicly listed in 2016, and Dukhan Bank (formerly Barwa Bank) commenced full operations around 2009 with further restructuring in 2020—which produces the age = 1 entry. It also clarifies that one bank is dropped by plm under the FE within-transformation due to a singleton time-series, yielding 8 banks in the regression. |
| R2 #6 | Discussion is stronger than the marginally significant (10%) results warrant. | §5; §6 | The tone of 5.1, 5.2 and the Conclusion has been moderated throughout (“broadly consistent”, “tentative”, “preliminary”, “marginal”), and the abstract now explicitly states that findings are preliminary and indicative. |
| R2 #7 | Title promises competitiveness but no market-share measurement. | Title | “and Competitiveness” has been removed from the title; the revised title focuses on profitability, which the data and design can credibly support. |
| R2 #8 | Need a replication package: variable construction, data processing and workflow. | Data Availability Statement; §5.4 | The Data Availability Statement now offers an informal replication package (variable construction, R workflow using plm/lmtest/sandwich, and disaggregated extracts) available from the corresponding author on reasonable request. Appendix A continues to reproduce the R console output. |
| R2 #9a | “Interaction term disapprove” is incorrect statistical English. | §4 (4.3) | Replaced with “Interaction effects are again not statistically significant” and the equivalent phrasing throughout. |
| R2 #9b | “Accepted”/“Rejected” hypothesis language. | §4 (4.4); Table 5 | Replaced with “Supported”/“Not supported”/“Partially supported” throughout. |
| R2 #9c | “Christian banks and Islamic banks” is incorrect in context. | §5 (5.3) | Replaced with “conventional and Islamic banks”. |
| R2 #10 | Reference consistency check (at least one mismatch with the claim). | §2 (2.2); references | The MENA cross-country claim in 2.2 has been re-attributed explicitly to Abu Khalaf et al. (2025) (consistent with their reported positive ROA/ROE finding). References have been audited end-to-end. |
| R2 #11 | Shapiro–Wilk normality not justified for panel FE; normality is not consequential for FE. | §3 (3.3); §4 (4.1) | 3.3 and 4.1 now explicitly state that FE consistency does not require normality (Wooldridge, 2010); the Shapiro–Wilk results are retained only as a descriptive note. |
| R2 #12 | Add suggested studies (DOI 10.17549/gbfr.2024.29.10.94 and DOI 10.21511/bbs.20(2).2025.12). | §2 (2.2); §5 (5.1, 5.2); references | Added Alslaibi (2024) GBFR and Alslaibi et al. (2025) BBS to Section 2.2 (regional context), Section 5.1 (transmission of efficiency to profitability) and Section 5.2 (pandemic-period bank performance). |
| R1 | Low statistical power not sufficiently discussed. | §5.4 | A dedicated “Low statistical power” paragraph now states that under 9 banks and 125 observations, the minimum detectable effect at conventional 80% power and 5% level is bounded below at β ≈ 0.025–0.035 on the ROA/ROE scales. The marginally significant 2017 ROE result sits very close to that floor; Type II error on the other policy windows cannot be ruled out; the findings are framed as preliminary and indicative. |
| Editor—refs | FinTech Times (2024) hard to verify. | §1; §3 (3.1); references | Replaced with International Monetary Fund (2025)—IMF 2024 Article IV Consultation, Staff Country Report 2025/047 (with DOI 10.5089/9798229001069.002)—which independently documents the QCB Third Financial Sector Strategy and digital-finance agenda. |
| Editor—refs | Frost (2020) BIS Quarterly Review March 2023, 45–62 not traceable. | §2 (2.2); §5 (5.1); references | Replaced with the verifiable original: Frost (2020), BIS Working Papers No. 838 (URL: bis.org/publ/work838.pdf). |
| Editor—refs | Qatar Central Bank (2024). Third Financial Sector Strategy 2024–2030—hard to verify as a direct source. | §1; references | Replaced with the IMF 2024 Article IV Consultation (DOI 10.5089/9798229001069.002), which describes FSS3 from an independent multilateral source. |
| Editor—refs | SDK Finance (2024). The complete list of FinTech regulations in the Middle East—not a verifiable academic source. | §1; §3 (3.1); references | Replaced with International Monetary Fund (2025) and S. Khan et al. (2022) (already in the bibliography) for the regulatory context. |
| Editor—refs | References to JRFM must not exceed three citations. | References; §2 (2.2) | The current revision cites JRFM exactly three times: Alshouha et al. (2025), Butt and Chamberlain (2025), Thakur et al. (2023). The previously cited fourth JRFM paper (Lamey et al., 2024) has been removed from the reference list and the corresponding text in 2.2 has been adjusted. |
| Editor—English | English should be improved. | Throughout | The manuscript has been copy-edited throughout for grammar, sentence flow and clarity; awkward phrasing has been replaced and tense/voice consistency improved. |
| Editor—tables | Table formatting. | Table 1, Table 2, Table 3, Table 4 and Table 5 | Tables retain a clean booktabs style (single top/middle/bottom rules, no vertical lines), with the hypothesis-outcome column updated to the “Supported/Not supported” convention. |
| R3 #1 | “FinTech” wording is problematic because the study does not use direct bank-level FinTech measures; only post-2017 and post-2020 policy dummies. | Title; Abstract; §6 | The title now reads “Assessing the Association between FinTech-related Policy Reforms and the Profitability of Banks in Qatar: A Preliminary Two-Decade Panel Analysis”. The abstract opening, framing sentence and conclusion lead now refer to “the association between two FinTech-related policy windows” and explicitly note that FinTech adoption is not measured directly at the bank level. |
| R3 #2 | Repeated language like “impact of fintech”, “fintech uptake”, “fintech onboarding”, “fintech adoption effects” remains stronger than the design supports. Reframe as a preliminary study using policy-window proxies. | Title; Abstract; §6; §5.3 | The manuscript is now framed throughout as a preliminary policy-window study. “Impact of FinTech”, “FinTech uptake” and “FinTech onboarding” have been replaced by “association between two FinTech-related policy windows”, “post-policy windows” and equivalent design-honest wording. The conclusion now opens with the policy-window framing rather than with the previous “estimate the effect of FinTech uptake” formulation. |
| R3 #3 | Report exact p-values where possible; avoid ambiguous phrasing such as “statistically weak”. Acknowledge that cluster-robust SEs with only eight bank clusters can be unstable. | Abstract; §3 (3.3); §4 (4.2); §5.4; §6 | The abstract and §4.2 now report exact cluster-robust p-values (e.g., p = 0.054, p = 0.868, p = 0.539, p = 0.150) and drop the “marginally significant” framing in favour of “at the conventional 10% threshold; should be treated as suggestive”. §3.3 adds an explicit caveat citing Cameron and Miller (2015) on small-cluster cluster-robust inference, and §5.4 includes a new “Small cluster count” limitations paragraph reiterating the eight-cluster caveat and pointing to wild-cluster bootstrap as a future-work robustness check. |
| R3 #4 | Practical implications related to AI analytics, cybersecurity, blockchain, Islamic digital wallets, ecosystem regulation, and specific digital transformation areas go beyond the empirical evidence—these areas are not directly tested. | §5 (5.3); §6 | §5.3 and §6 (bank managers and policymakers paragraphs) have been rewritten. The specific recommendations on cybersecurity, AI analytics, blockchain, Islamic digital wallets and ecosystem regulation are now explicitly flagged as “beyond what this study can support empirically, since none of these activities is measured at the bank level”. The retained implications are restricted to what the design actually shows: limited marginal returns to additional FinTech-related reforms in a concentrated, uniformly regulated market, and the dominance of bank size in the within-bank variation. |
| R3 #5 | Theoretical frameworks (TAM, DOI, RBV) should be presented as interpretive lenses rather than fully tested mechanisms. | §2 (2.1) | A new closing paragraph in §2.1 now states that “these three frameworks should be understood as interpretive lenses rather than as fully tested mechanisms”. It explains that the empirical specification operationalises selected channels through observable proxies (policy dummies, bank size, bank age, bank type), while the underlying constructs (perceived usefulness and ease of use, adopter category, VRIN characteristics) are not directly measured—so the framework-to-variable map is an interpretive choice motivated by theory, not a direct empirical test of TAM, DOI or RBV. |
| R3 #6 | The negative and significant coefficient on bank size may be absorbing omitted bank characteristics—either add available controls or declare a limitation. | §5.4 | The “Limited bank–time-varying controls” paragraph in §5.4 is extended with an explicit closing sentence: “the negative coefficient on bank size should not be interpreted as direct causal evidence of a size disadvantage but rather as a composite signal that may absorb the explanatory power of these omitted bank characteristics” (capitalisation, asset quality, cost-to-income, income diversification, etc.). |
| R3 #7 | The model cannot isolate the effect of FinTech-related reforms from concurrent macroeconomic, sectorial or pandemic-related developments. Strengthen this acknowledgement. | §3 (3.3); §5.4 | §3.3 (“Two design choices” paragraph) now closes with: “Taken together, the absence of year fixed effects, an untreated control group and an event-study structure means that the model cannot isolate the effect of the FinTech-related reforms from concurrent macroeconomic, sectorial or pandemic-related developments”, and explicitly labels the post-2017 and post-2020 coefficients as “upper-bound estimates of an association around the policy windows, not as causal estimates of FinTech adoption effects”. §5.4 mirrors this language in the “No year fixed effects” limitations paragraph. |
References
- Abdul Rahman, A. A., Ur Rahiman, H., Meero, A., Amin, A. R., & Hamdan, H. (2023). FinTech innovations and Islamic banking performance: Post-pandemic challenges and opportunities. Banks and Bank Systems, 18(4), 281–292. [Google Scholar] [CrossRef] [Scilit]
- Abu Khalaf, B., Al-Sharkas, A., & Sarea, A. (2025). Realizing opportunities: The influence of FinTech on the success of MENA banks. Discover Sustainability, 6(1), 501. [Google Scholar] [CrossRef] [Scilit]
- Afzal, A. M., Abu Khalaf, B., Al-Naimi, M. S., & Samara, E. (2025). The impact of FinTech on the stability of Middle Eastern and North African (MENA) banks. Risks, 13(6), 106. [Google Scholar] [CrossRef] [Scilit]
- Alafeef, M. A., Kalyebara, B., Kalbouneh, N. Y., Abuoliem, N., & Bani Yousef, A. N. (2024). The impact of FinTech on banking performance: Evidence from Middle Eastern countries. International Journal of Data and Network Science, 8(4), 2219–2230. [Google Scholar] [CrossRef] [Scilit]
- AlHares, A., Dahkan, A., & Abu-Asi, T. (2022). The effect of financial technology on the sustainability of banks in the gulf cooperation council countries. Corporate Governance and Organizational Behavior Review, 6(4), 395. [Google Scholar] [CrossRef] [Scilit]
- Al-Kubaisi, M. K., & Abu Khalaf, B. (2023). Does green banking affect banks’ profitability? Journal of Governance and Regulation, 12(4), 157–164. [Google Scholar] [CrossRef] [Scilit]
- Alnsour, I. R. (2023). The effect of financial technology on Islamic banks’ performance in Jordan: Panel data analysis. International Journal of Data and Network Science, 7(4), 1515–1524. [Google Scholar] [CrossRef] [Scilit]
- Al-Shari, H. A., & Lokhande, M. A. (2023). The relationship between the risks of adopting FinTech in banks and their impact on the performance. Cogent Business & Management, 10(1), 2174242. [Google Scholar] [CrossRef] [Scilit]
- Alshouha, L., Khasawneh, O., Alshannag, F., & Al Tanbour, K. (2025). Nexus between FinTech innovations and liquidity risk in GCC banks: The moderating role of bank size. Journal of Risk and Financial Management, 18(5), 226. [Google Scholar] [CrossRef] [Scilit]
- AlShouha, L., Khasawneh, O., El-qawaqneh, S., Al-Naimi, A. A., Saram, M., & Ismail, W. N. S. W. (2024). The impact of financial technology on bank performance in Arabian countries. Banks and Bank Systems, 19(2), 234–247. [Google Scholar] [CrossRef] [Scilit]
- Alslaibi, N. A. (2024). Testing sustainable solutions: Analyzing the impact of FinTech on profitability before and during COVID in Palestine banking sector. Global Business & Finance Review, 29(10), 94. [Google Scholar] [CrossRef] [Scilit]
- Alslaibi, N. A., Qawasmeh, R., Samara, H., & Abualrob, R. M. (2025). Key drivers of bank financial performance: Insights from the Arab Levant region. Banks and Bank Systems, 20(2), 143–155. [Google Scholar] [CrossRef] [Scilit]
- Arner, D. W., Barberis, J., & Buckley, R. P. (2016). The evolution of FinTech: A new post-crisis paradigm? Georgetown Journal of International Law, 47, 1271–1319. [Google Scholar]
- Aysan, A. F., Belatik, A., Unal, I. M., & Ettaai, R. (2022). FinTech strategies of Islamic banks: A global empirical analysis. FinTech, 1(2), 206–215. [Google Scholar] [CrossRef] [Scilit]
- Barney, J. (1991). Firm resources and sustained competitive advantage. Journal of Management, 17(1), 99–120. [Google Scholar] [CrossRef] [Scilit]
- Boot, A., Hoffmann, P., Laeven, L., & Ratnovski, L. (2021). FinTech: What’s old, what’s new? Journal of Financial Stability, 53, 100837. [Google Scholar] [CrossRef] [Scilit]
- Butt, U., & Chamberlain, T. (2025). Performance of Islamic banks during the COVID-19 pandemic: An empirical analysis and comparison with conventional banking. Journal of Risk and Financial Management, 18(6), 308. [Google Scholar] [CrossRef] [Scilit]
- Cameron, A. C., & Miller, D. L. (2015). A practitioner’s guide to cluster-robust inference. The Journal of Human Resources, 50(2), 317–372. [Google Scholar] [CrossRef] [Scilit]
- Davis, F. D. (1989). Perceived usefulness, perceived ease of use, and user acceptance of information technology. MIS Quarterly, 13(3), 319–340. [Google Scholar] [CrossRef] [Scilit]
- Demirgüç-Kunt, A., & Huizinga, H. (2010). Bank activity and funding strategies: The impact on risk and returns. Journal of Financial Economics, 98(3), 626–650. [Google Scholar] [CrossRef] [Scilit]
- Frost, J. (2020). The economic forces driving FinTech adoption across countries (BIS working papers No. 838). Bank for International Settlements. Available online: https://www.bis.org/publ/work838.pdf (accessed on 1 May 2025).
- Gujarati, D. N., & Porter, D. C. (2009). Basic econometrics (5th ed.). McGraw-Hill Irwin. [Google Scholar]
- Hair, J. F., Black, W. C., Babin, B. J., & Anderson, R. E. (2019). Multivariate data analysis (8th ed.). Cengage Learning. [Google Scholar]
- International Monetary Fund. (2025). Qatar: 2024 article IV consultation—Press release; Staff report; and statement by the executive director for Qatar (IMF Staff Country Reports No. 2025/047). International Monetary Fund. [Google Scholar] [CrossRef] [Scilit]
- Kalai, L., & Toukabri, M. (2024). Risks, regulations, and impacts of FinTech adoption on commercial banks in the United States and Canada: A comparative analysis. Thunderbird International Business Review, 66(5), 554–569. [Google Scholar] [CrossRef] [Scilit]
- Khan, J., Dahdal, A., & Ibrahim, I. A. (2022). Sandboxes in the desert: Is a cross-border ‘Gulf Box’ feasible? Law, Innovation and Technology, 14(2), 203–229. [Google Scholar]
- Khan, S., & Al-Harby, A. S. A. (2022). The use of FinTech and its impact on financial intermediation: A comparison of Saudi Arabia with other GCC economies. Intellectual Economics, 16(2), 26–43. [Google Scholar] [CrossRef] [Scilit]
- Khan, S., Khan, H. H., & Ghafoor, A. (2022). FinTech adoption, the regulatory environment and bank stability: An empirical investigation from GCC economies. Borsa Istanbul Review, 23(6), 1263–1281. [Google Scholar]
- Morshed, A. (2025). Navigating tradition and modernity: Digital accounting and financial integration in family-owned enterprises in the Arab Gulf. Sustainable Futures, 7(1), 100345. [Google Scholar]
- Philippon, T. (2020). On FinTech and financial inclusion. Annual Review of Financial Economics, 12, 141–158. [Google Scholar]
- Rogers, E. M. (2003). Diffusion of innovations (5th ed.). Free Press. [Google Scholar]
- Thakur, S., Rastogi, S., Parashar, N., Tejasmayee, P., & Kappal, J. M. (2023). The impact of ICT on the profitability of Indian banks: The moderating role of NPA. Journal of Risk and Financial Management, 16(4), 211. [Google Scholar] [CrossRef] [Scilit]
- Vives, X. (2019). Digital disruption in banking. Annual Review of Financial Economics, 11, 243–272. [Google Scholar] [CrossRef] [Scilit]
- Wooldridge, J. M. (2010). Econometric analysis of cross section and panel data (2nd ed.). MIT Press. [Google Scholar]

Disclaimer/Publisher’s Note: The statements, opinions and data contained in all publications are solely those of the individual author(s) and contributor(s) and not of MDPI and/or the editor(s). MDPI and/or the editor(s) disclaim responsibility for any injury to people or property resulting from any ideas, methods, instructions or products referred to in the content. |
© 2026 by the authors. Licensee MDPI, Basel, Switzerland. This article is an open access article distributed under the terms and conditions of the Creative Commons Attribution (CC BY) license.