Article

Machine Learning-Based Forecasting of Sukuk Index Movements: Evidence from Turkey and Malaysia †

by
Mehmet Ekmekcioglu
* and
Kaya Tokmakcioglu
Department of Management Engineering, Istanbul Technical University, 34357 Istanbul, Turkey
*
Author to whom correspondence should be addressed.
This paper has been published as an output of the general research project titled “Modeling the Price Movements of the Sukuk Index” (Project Code: SGA-2025-46968), conducted within Istanbul Technical University.
J. Risk Financial Manag. 2026, 19(7), 486; https://doi.org/10.3390/jrfm19070486
Submission received: 29 April 2026 / Revised: 15 June 2026 / Accepted: 17 June 2026 / Published: 1 July 2026
(This article belongs to the Special Issue Islamic Financial Markets in Times of Global Uncertainty)

Abstract

Islamic finance has rapidly expanded into a major component of global financial systems, positioning Sukuk as a core instrument for Sharia-compliant investment and capital raising. Despite growing academic attention to Sukuk pricing and valuation, to the best of our knowledge, no prior study has systematically classified the directional movements of Sukuk index prices using machine learning techniques. This study addresses that gap by developing predictive classification models for the directional (upward or downward) movements of Sukuk indices and applying them to both Turkey and Malaysia. It represents one of the first systematic attempts to forecast Sukuk index direction and the first application of machine learning-based directional forecasting to the Turkish Sukuk market. Using a diverse set of financial and macroeconomic indicators, we employ advanced machine learning algorithms including extreme gradient boosting (XGBoost), categorical boosting (CatBoost), and support vector machines (SVMs), and further enhance prediction accuracy through ensemble methods such as majority voting, weighted averaging, and soft voting. Model performance is evaluated using accuracy, precision, recall, F1-score, and ROC-AUC. The findings indicate that SVM consistently delivers the strongest standalone performance across both markets, while ensemble methods generate substantial improvements in Malaysia. Overall, predictive performance is higher in Malaysia, which may be associated with its more stable and liquid Sukuk market environment compared to Turkey.

1. Introduction

1.1. Growth and Importance of Sukuk Markets

Islamic finance has emerged as a rapidly expanding segment of the global financial system, driven by growing demand for ethical and Shariah-compliant financial services. Rooted in Islamic economic principles, it prohibits interest (riba), excessive uncertainty (gharar), and speculative behavior (maysir), while promoting risk-sharing, asset-backing, and real economic activity. The resilience of Islamic financial institutions during the 2008 global financial crisis further strengthened their appeal to both Muslim and non-Muslim investors seeking more stable and principled alternatives (Ahmed, 2011; Iqbal & Mirakhor, 2011).
Within this framework, sukuk—often referred to as Islamic bonds—have become one of the most prominent instruments in Islamic finance, offering Shariah-compliant alternatives to conventional debt instruments through asset-backed structures and risk-sharing mechanisms. Unlike conventional bonds, sukuk represent ownership in tangible assets or services rather than interest-bearing debt, aligning them more closely with Islamic legal and economic doctrines (Karim et al., 2014). As global interest in Islamic finance continues to grow, sukuk have attracted increasing attention not only from investors in Muslim-majority countries but also from international markets seeking diversification and ethical investment options. The global sukuk market has expanded significantly, with annual issuances exceeding USD 212 billion in 2023, primarily led by Malaysia, Saudi Arabia, the UAE, and Indonesia (IIFM, 2024). Recent evidence suggests that this growth momentum continued in 2024, with global sukuk issuances increasing by 25.6%, supported by favorable financing conditions and growing demand from both sovereign and corporate issuers (IFSB, 2025). Reflecting this rising prominence, academic interest in sukuk has also expanded, with numerous studies examining their structural formation, legal frameworks, and pricing methodologies.
Jobst et al. (2008) and Zaher and Hassan (2001) explored the legal and institutional aspects of sukuk issuance and its implications for global financial markets, drawing attention to the importance of regulatory harmonization and the challenges posed by differing interpretations of Shariah compliance. Wilson (2008) focused on innovation in sukuk structuring and emphasized the legal complexity that arises when attempting to merge Islamic principles with conventional financial market practices. Similarly, El-Gamal (2006) addressed broader institutional and legal challenges in Islamic finance, highlighting the tensions between economic substance and formal Shariah compliance in sukuk contracts.
Usmani (2007), one of the leading scholars in Islamic jurisprudence, analyzed the contemporary applications of sukuk and stressed the necessity of aligning sukuk structures strictly with Islamic principles to preserve their legitimacy. Ahmed (2010) further highlighted how legal and institutional limitations may hinder the development of Islamic financial products, including sukuk, particularly in jurisdictions lacking established Islamic finance frameworks. Thomas et al. (2005) provided detailed insights into the contractual and structural aspects of sukuk transactions and underscored jurisdictional differences in enforceability and regulatory treatment.

1.2. Sukuk Forecasting Literature

In addition to these legal and structural perspectives, several empirical studies have examined sukuk dynamics in well-established Islamic finance markets such as Malaysia and the GCC countries. These studies have explored various aspects of sukuk instruments, including their pricing behavior, yield structures, comparative performance against conventional bonds, and the determinants of credit ratings. For example, Safari et al. (2014) examined the relationship between sukuk contract structures and yield levels using panel regression analysis. Cakir and Raei (2007) compared the hedging performance of sukuk and Eurobonds through variance, correlation, and regression-based analyses. Alam et al. (2013) and Godlewski et al. (2013) employed classical regression and variance analysis to measure differences in returns and risk structures between sukuk and bonds. More recently, Rosadhillah and Ülev (2024) employed an ARIMA framework to forecast the outstanding volume of sovereign sukuk in Turkey and investigated its relationship with inflation and exchange rates, while Hartono et al. (2025) applied a similar approach to forecast the outstanding value of Indonesian sovereign sukuk. These studies primarily aim to explain sukuk yields, volumes, or price levels through explanatory variables to understand the factors driving their dynamics.
While these contributions have enriched the understanding of sukuk markets in regions with mature Islamic finance ecosystems, they share two key limitations. First, they predominantly rely on traditional econometric and regression-based methods, which often assume linear relationships and may fail to capture the complex, non-linear patterns present in financial time series data. Second, the majority of these studies focus on price level estimation rather than attempting to forecast directional movements (i.e., whether the price will go up or down), which is often more relevant for decision-making by investors and portfolio managers. Moreover, these existing works lack the incorporation of modern machine learning techniques, which offer greater flexibility in handling high-dimensional data, uncovering hidden patterns, and improving forecasting accuracy. The absence of such approaches in sukuk research highlights a methodological gap, which can be better understood by examining how advanced machine learning techniques have been applied across other financial domains such as equity, FX and cryptocurrency markets.

1.3. Machine Learning Applications in Financial Forecasting

Early applications of machine learning in equity markets showed the potential of classification approaches for predicting short-term price movements. Kim (2003) and Kara et al. (2011) demonstrated that Support Vector Machines (SVMs) and Artificial Neural Networks (ANN) could effectively forecast stock price direction using technical indicators. More recent advances include ensemble and deep learning methods: Krauss et al. (2017) showed that ensembles of deep neural networks, random forests, and gradient boosting outperform logistic regression in predicting S&P 500 returns. Fischer and Krauss (2018) demonstrated that Long Short-Term Memory (LSTM) networks outperform traditional econometric benchmarks by effectively capturing sequential dependencies in daily returns, while Nelson et al. (2017) confirmed the superior performance of LSTM over classical time-series models in forecasting stock market trends in the Brazilian context. More recently, Uhunmwangho (2024) conducted a comparative study on Microsoft Corp.’s stock, showing that XGBoost significantly outperformed LSTM in predicting price direction, achieving approximately five percentage points higher directional accuracy compared to LSTM. This evidence reinforces the robustness of boosting methods over deep sequential models in equity market forecasting.
Foreign exchange (FX) markets have increasingly become a testing ground for classification-based forecasting methods, where the primary objective is to predict the directional movement of exchange rates rather than their exact levels. Huang et al. (2005) applied support vector machines (SVMs) to forecast the directional changes in major currency pairs such as USD/DEM and USD/JPY, demonstrating that SVM outperformed backpropagation neural networks in capturing market dynamics. Similarly, Tsai and Hsiao (2010) employed ensemble-based feature selection and classification frameworks, showing that integrated models yield superior directional accuracy compared to single-model approaches. More recent advances have incorporated boosting methods into FX classification. Galeshchuk and Mukherjee (2017) applied deep neural networks to currency forecasting and found that they achieved substantially higher directional accuracy compared to traditional econometric models. Their results highlighted the ability of deep learning methods to capture complex, non-linear dynamics in FX markets more effectively than classical approaches.
The cryptocurrency market has emerged as a critical testing ground for machine learning, due to its high volatility and limited historical data. McNally et al. (2018) employed LSTM and RNN architectures and reported substantially higher directional accuracy compared to econometric baselines in volatile periods. More recently, Mallqui and Fernandes (2019) applied a range of machine learning techniques, including ensemble boosting, to predict Bitcoin price direction and found that boosting-based classifiers significantly outperformed conventional approaches. Thus, even in volatile and data-constrained markets such as cryptocurrency, machine learning has demonstrated effectiveness, further reinforcing the feasibility and relevance of classification-based approaches.
These advances collectively highlight the robustness and adaptability of machine learning across diverse financial domains. Recent review studies further reinforce this view. For example, Hoang and Wiegratz (2023) identify the reduction in prediction error as one of the primary applications of machine learning in finance and argue that ML methods offer significant advantages over traditional econometric approaches when modeling complex and non-linear financial relationships. Consistent with these findings, Odeyemi et al. (2024) conclude that machine learning methods provide substantial benefits over conventional approaches in financial forecasting, particularly in environments characterized by complex and non-linear relationships. Together, these studies emphasize the growing adoption of machine learning techniques across financial research and practice, highlighting their substantial potential for future forecasting applications.

1.4. Machine Learning Applications in Sukuk Markets

Building on these developments, recent empirical works have begun to explore sukuk from a predictive modeling perspective. For example, Wardani et al. (2020) estimated the yields of government-issued treasury sukuk in Indonesia used to finance national research and development activities under different price scenarios (continuity, abandonment, and substitution), applying a binomial decision tree approach. Yiğiter et al. (2018) utilized daily price data of participation certificates issued by Vakıf Portfolio and applied the K-Nearest Neighbors (KNN) algorithm to forecast their price values, reporting strong predictive accuracy. Çetin and Meltek (2021) predicted the price of a single sukuk certificate issued by the Turkish Treasury using an Artificial Neural Network (ANN) model, incorporating predictors such as the Dollar Index, Volatility Index, Geopolitical Risk Index, S&P MENA Sukuk Index, and Eurobond prices, achieving notably high accuracy. Similarly, Meltek (2022) applied deep learning algorithms including Long Short-Term Memory (LSTM), Recurrent Neural Networks (RNN), and Radial Basis Function Neural Networks (RBFNN) to forecast the prices of Dow Jones MENA and GCC Sukuk indices using macro-financial indicators. Among these, RNN yielded the best performance, with the Dollar Index, Volatility Index, and Bond Prices emerging as the most significant predictive variables. A recent review by Islam et al. (2024) further supports these findings by highlighting the growing use of machine learning techniques in Sukuk forecasting and pricing studies and reporting that neural-network-based models have generally demonstrated promising performance compared with traditional statistical approaches.

1.5. Research Gap and Contributions

Despite the growing literature on Sukuk valuation and the increasing application of machine learning techniques in financial forecasting, several important gaps remain. Existing Sukuk studies have largely focused on price and yield estimation rather than directional forecasting. Moreover, empirical evidence on machine learning applications in Sukuk markets remains limited, particularly for emerging markets such as Turkey. Finally, comparative studies examining forecasting performance across Sukuk markets with different levels of maturity remain scarce. These limitations motivate the development of a machine learning-based directional forecasting framework for Sukuk markets.
The main contributions of this study are twofold.
First, this study extends the Sukuk forecasting literature by shifting the focus from traditional price and yield estimation toward directional forecasting of Sukuk index movements. In doing so, it provides one of the first machine learning-based classification frameworks designed specifically for Sukuk markets and represents the first application of machine learning-based directional forecasting to the Turkish Sukuk market.
Second, the study provides a comparative analysis of the Turkish and Malaysian Sukuk markets, allowing an assessment of how differences in market maturity and market characteristics may influence forecasting performance. By applying a unified machine learning framework across both markets, the study contributes new evidence on the effectiveness of machine learning techniques for directional Sukuk forecasting under different market conditions. The findings also offer practical implications for investors, portfolio managers, and risk managers operating in Islamic capital markets.
Accordingly, this study contributes to both the Islamic finance literature and the broader financial forecasting literature by extending machine learning-based directional forecasting to Sukuk markets and providing comparative evidence across markets with different levels of development and maturity.

2. Materials and Methods

2.1. Data

The empirical analysis in this study is based on financial and macroeconomic indicators relevant to Sukuk index movements and is conducted using data constructed at a daily frequency. The dataset primarily consists of global risk indicators, macro-financial variables, credit risk measures, and technical indicators that are widely employed in empirical studies on asset pricing and financial market forecasting. Specifically, the predictor variables include the U.S. Dollar Index (DXY), the CBOE Volatility Index (VIX), Eurobond prices (EB), the S&P Dow Jones Sukuk Index (DJ), and Credit Default Swap (CDS) spreads. In addition, lagged values of Sukuk prices (Lag1 and Lag2) and a 10-day Simple Moving Average (SMA-10) are incorporated as technical indicators to capture short-term market dynamics and trend-following behavior.
The CBOE Volatility Index (VIX) is a forward-looking measure of market expectations regarding near-term volatility in the U.S. equity market and is widely interpreted as a proxy for global risk sentiment and investor uncertainty. Higher values of the VIX indicate increased risk aversion and heightened market stress, which may reduce investor demand for Sukuk instruments and exert downward pressure on Sukuk prices.
The U.S. Dollar Index (DXY) measures the value of the U.S. dollar relative to a basket of major international currencies and reflects global liquidity conditions, capital flows, and monetary policy expectations. Given that Sukuk instruments in this study are denominated in U.S. dollars, fluctuations in DXY are particularly relevant for understanding valuation effects and investor behavior. An appreciation of the U.S. dollar may tighten global financial conditions and reduce capital flows to emerging markets, potentially leading to lower Sukuk valuations.
Eurobond prices (EB) represent the market valuation of sovereign debt issued in international markets and provide information on global interest rate movements, external financing conditions, and sovereign risk perceptions. As sovereign credit conditions are closely linked to Sukuk pricing, Eurobond prices serve as an important indicator of the broader fixed-income environment. Rising Eurobond prices generally reflect favorable fixed-income market conditions and may be associated with higher Sukuk valuations due to similarities in investor allocation decisions.
Moreover, the S&P Dow Jones Sukuk Index (DJ) is included as a global benchmark for Shariah-compliant fixed-income securities, capturing the overall performance and risk–return characteristics of the international Sukuk market and allowing the models to account for spillover effects between global and local Sukuk markets. Improvements in the global Sukuk market are expected to have a positive spillover effect on country-specific Sukuk indices.
In addition, Credit Default Swap (CDS) spreads are employed as market-based measures of sovereign credit risk, reflecting changes in perceived default probabilities and global risk appetite. CDS spreads are widely used in empirical finance as forward-looking indicators of creditworthiness and complement traditional bond-based measures of sovereign risk. An increase in CDS spreads signals deteriorating sovereign credit quality and is therefore expected to exert downward pressure on Sukuk prices. This variable is particularly relevant for comparing mature and emerging Sukuk markets, as sovereign credit risk may affect market behavior differently across countries with distinct risk profiles.
In order to capture short-term dynamics in Sukuk price movements, technical indicators are also incorporated into the dataset. Lagged values of prices (Lag1 and Lag2) account for temporal dependence, persistence, and potential mean-reversion effects in financial time series. Positive autocorrelation may imply that past price movements contain predictive information regarding future Sukuk index movements. Furthermore, the 10-day Simple Moving Average (SMA-10) smooths short-term price fluctuations and serves as a trend-following indicator, enabling the models to exploit momentum-related patterns in Sukuk prices. Values above the moving average may indicate an upward trend, whereas values below the moving average may signal downward market momentum.
The dependent variables forecasted in this study correspond to the sovereign Sukuk indices of Turkey and Malaysia, which serve as benchmark indicators for Shariah-compliant fixed-income markets in their respective countries. For Turkey, the BIST-KYD Government Lease Certificates USD Index (in Turkish: BIST-KYD Kamu Kira Sertifikaları USD Endeksi, T1) is employed as the dependent variable. Jointly published by Borsa Istanbul (BIST) and the Turkish Institutional Investment Managers’ Association (KYD), this index tracks the price performance of U.S. dollar-denominated government-issued lease certificates (Sukuk) and reflects the dynamics of an emerging Islamic capital market characterized by heightened sensitivity to global financial conditions. For Malaysia, the TR BPAM Government Sukuk Index (index code: TRBPAMGOVI), produced by Bond Pricing Agency Malaysia (BPAM), is used as the dependent variable and represents a benchmark for sovereign Sukuk instruments in a highly developed and liquid Islamic capital market. Based on these indices, the target variable, is defined as a binary indicator of daily Sukuk index movements, where a value of “1” denotes an upward movement and “0” denotes a downward movement. The empirical analysis is conducted for two markets with distinct structural characteristics. While Turkey represents an emerging Sukuk market with a relatively recent benchmark history following the introduction of its Sukuk index in 2021, Malaysia is widely recognized as the most mature and developed Sukuk market globally.
Although Turkey and Malaysia differ substantially in terms of market maturity, liquidity, and institutional development, the same set of predictor variables is employed for both markets to ensure methodological consistency and comparability. The selected variables capture global risk sentiment (VIX), international liquidity conditions (DXY), sovereign credit risk (CDS), benchmark fixed-income market performance (Eurobond prices), global Sukuk market conditions (Dow Jones Sukuk Index), and short-term market dynamics (Lag1, Lag2, and SMA). Since these factors are expected to influence Sukuk markets regardless of their level of development, applying a common predictor set allows differences in forecasting performance to be attributed primarily to market characteristics rather than variations in model inputs.
This dual-market setting enables a comparative evaluation of predictive performance across heterogeneous market environments and allows the study to assess the robustness of directional forecasting models under different levels of market maturity.
All macro-financial and global risk indicators are obtained from the Reuters terminal, ensuring data consistency, reliability, and widespread acceptance in empirical financial research. Data for the Turkish Sukuk index are sourced directly from Borsa Istanbul, which serves as the official exchange and primary data provider for domestic Sukuk instruments in Turkey. The empirical analysis covers the period from 19 April 2021 to 5 March 2025, corresponding to the availability window of the Turkish Sukuk index following its introduction. After accounting for non-trading days and aligning all variables across markets, the final dataset comprises approximately 1000 daily observations. Prior to model estimation, all variables are aligned and preprocessed to address scaling differences and ensure consistency between predictors and target labels.

2.2. Descriptive Statistics and Exploratory Analysis

Descriptive statistics for the Malaysian dataset are presented in Table 1.
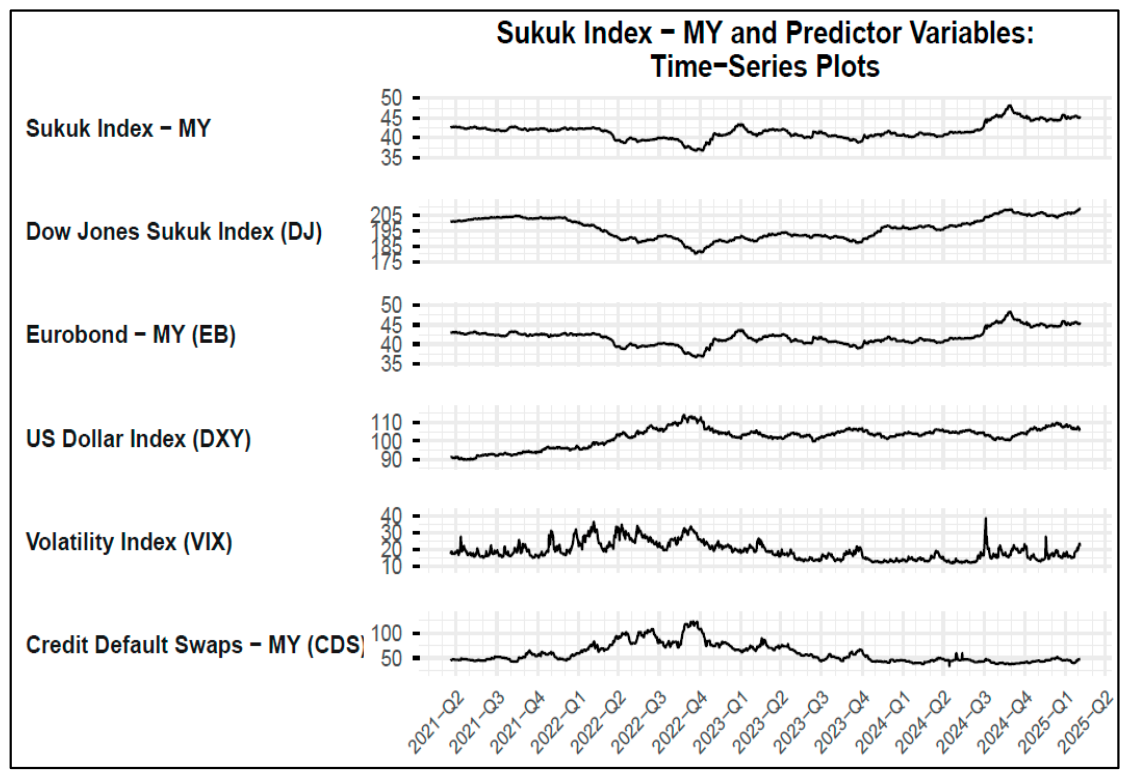
The Malaysian Sukuk Index exhibits relatively low volatility, with a mean value of 41.62 and a standard deviation of 2.00. Among the explanatory variables, CDS spreads display the highest dispersion (SD = 19.08), indicating substantial variation in perceived sovereign credit risk over the sample period. The VIX index also exhibits notable variability, as illustrated in Figure 1, reflecting changing global risk sentiment. Most variables show moderate skewness and kurtosis values, suggesting that extreme departures from normality are limited. Overall, the descriptive statistics suggest a relatively stable Sukuk market environment, which is broadly consistent with Malaysia’s established position in the global Islamic capital market.
Table 2 presents the class distribution of the Malaysian Sukuk Index movement direction. The dataset is relatively balanced, with 535 observations (53.4%) classified as downward movements and 466 observations (46.6%) classified as upward movements. The small difference between the two classes suggests that class imbalance is not a major concern in the Malaysian dataset.
Descriptive statistics for the Turkey dataset are presented in Table 3.
The Turkish Sukuk Index has a mean value of 1103 and a standard deviation of 93.3, indicating variability in index levels over the sample period. Among the explanatory variables, CDS spreads display the highest dispersion (SD = 164), suggesting substantial fluctuations in sovereign risk. Most variables exhibit moderate skewness and kurtosis values, indicating that extreme departures from normality are limited.
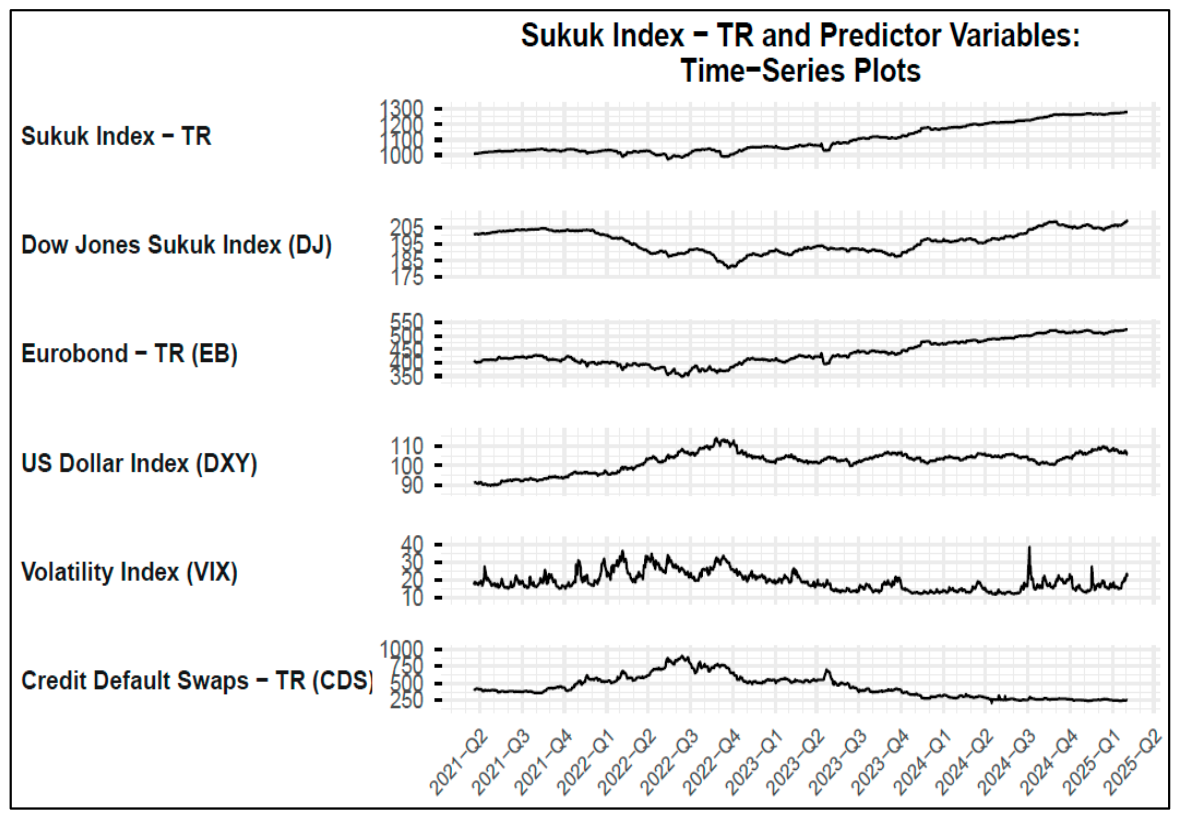
Figure 2 further illustrates the time-series behavior of the Turkish Sukuk Index and the explanatory variables over the sample period. The CDS series exhibits substantial fluctuations, highlighting the dynamic nature of sovereign risk conditions in Turkey during the sample period. The Turkish Sukuk Index also displays noticeable variation over time, although its overall trend remains relatively stable. These visual patterns are consistent with the descriptive statistics reported in Table 3.
A comparison of the Malaysian and Turkish datasets reveals substantial differences in country-specific risk indicators. While global variables such as DXY, VIX, and the Dow Jones Sukuk Index exhibit nearly identical statistical characteristics across both samples, notable divergences emerge in sovereign risk measures. The average CDS spread in Tur-key (448 basis points) was approximately 7.5 times higher than that observed in Malaysia (59 basis points), while the standard deviation of CDS spreads was more than eight times greater. These differences indicate substantially higher sovereign risk and risk variability in the Turkish market during the sample period. However, these differences should not be viewed as the sole explanation for forecasting performance variations. Predictive out-comes may also be influenced by factors such as sample size, data availability, class dis-tribution, model specification, and the selected predictor set.
Table 4 presents the class distribution of the Turkish Sukuk Index movement direction.
As reported in Table 4, upward movements account for 63% of observations in the Turkish dataset, whereas the Malaysian dataset exhibits a more balanced class structure. This imbalance may partially explain the high recall and comparatively lower ROC-AUC values observed for several classification models, as the models may be more likely to predict the dominant class.

2.3. Methodology

The methodology involves the implementation of the following supervised learning algorithms: XGBoost, CatBoost, and SVM, combined with ensemble techniques such as majority voting, weighted average, and soft voting to improve predictive performance. All models are built and tested using the R programming language, and their accuracy is evaluated through a consistent train-test split strategy.
Support Vector Machines (SVMs), introduced by Cortes and Vapnik (1995), are widely used supervised learning models for classification tasks, particularly effective in high-dimensional settings. The method is based on the concept of the maximal margin hyperplane, defined as the separating hyperplane that maximizes the margin, i.e., the minimum distance between the hyperplane and the training observations (James et al., 2013). Classification of new observations is performed according to which side of this hyperplane they fall. However, although the maximal margin classifier performs well on training data, it is highly sensitive to individual observations, and even a single data point can substantially alter the decision boundary. To address this limitation, the Support Vector Classifier introduces a regularization parameter (cost parameter), allowing for controlled misclassification in exchange for improved generalization. SVM further extends this framework through the use of kernel functions, enabling the construction of non-linear decision boundaries. In this study, linear, polynomial, and radial basis function (RBF) kernels are employed to capture different data structures. Given the complex and non-linear nature of financial markets, SVM has been widely applied in financial forecasting due to its strong generalization capability and effectiveness in modeling high-dimensional data, making it a reliable approach for predicting Sukuk index movements.
CatBoost (Categorical Boosting), developed by Prokhorenkova et al. (2018), is a gradient boosting algorithm that incorporates ordered boosting and symmetric tree structures to improve predictive performance and reduce overfitting. By mitigating prediction bias and target leakage through its ordered learning mechanism, CatBoost enhances generalization performance, particularly in datasets with complex feature interactions. In the context of Sukuk markets, where macroeconomic indicators, global risk measures, and technical variables interact in a non-linear manner, CatBoost provides a robust and efficient modeling approach. Its ability to capture intricate relationships among predictors, combined with fast convergence and strong out-of-sample performance, makes it well-suited for accurately classifying upward and downward movements in Sukuk indices.
Extreme Gradient Boosting (XGBoost), developed by Chen and Guestrin (2016), is an advanced tree-based ensemble learning algorithm that builds predictive models through a sequential boosting process. The method iteratively constructs decision trees, where each new tree is trained to correct the errors of previously generated trees, thereby improving overall predictive accuracy. XGBoost incorporates regularization mechanisms, shrinkage techniques, and efficient parallel computation to reduce overfitting while enhancing model generalization. Its ability to capture complex non-linear relationships, handle interactions among predictor variables, and effectively process high-dimensional data has led to its widespread application in financial forecasting. In the context of Sukuk index movement prediction, where market behavior is influenced by macroeconomic conditions, global risk factors, and technical indicators, XGBoost provides a robust framework for identifying non-linear patterns and improving directional classification performance.
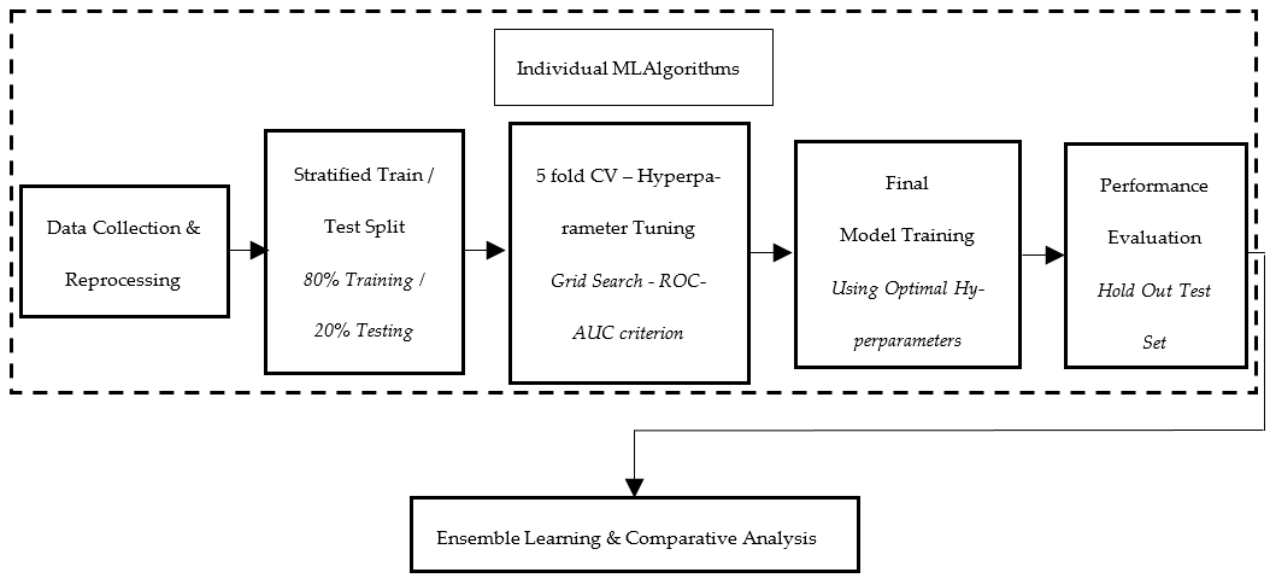
Figure 3 represents the research framework and model validation process.
To ensure optimal model performance and avoid overfitting, hyperparameters for each machine learning algorithm were tuned using grid search optimization combined with stratified cross-validation. Grid search allows systematic evaluation of different parameter combinations in order to identify the specification that maximizes predictive performance on unseen data. For the Support Vector Machine (SVM), the cost parameter (C) and kernel-specific parameters such as sigma for the radial basis function kernel were optimized across a predefined parameter grid. For CatBoost, key hyperparameters including tree depth, learning rate, number of iterations, border count, and L2 regularization parameter were tuned. For XGBoost, the number of boosting rounds, maximum tree depth, learning rate, minimum loss reduction (gamma), column subsampling ratio, minimum child weight, and row subsampling ratio were optimized.
To ensure reproducibility, the hyperparameter search ranges used during grid search optimization are reported in Table 5. The same search space was applied to both the Turkish and Malaysian datasets, and the final selected parameters are reported below the performance tables.
Given the presence of class imbalance in the dataset, stratified k-fold cross-validation is employed during hyperparameter tuning to preserve the relative proportion of upward and downward movements in each fold. This approach ensures more stable and reliable estimates of out-of-sample performance compared to random partitioning. The same tuning framework is applied consistently across both Turkish and Malaysian datasets to maintain methodological comparability between markets. Although rolling-window and walk-forward validation approaches may be preferable for financial time-series applications due to their ability to preserve temporal ordering, stratified train-test splits and cross-validation remain widely used in machine learning-based financial forecasting studies, particularly when the objective is to compare the relative performance of alternative classification algorithms under a consistent evaluation framework.
All random processes were controlled using fixed random seeds in order to ensure reproducibility of results.
To further enhance predictive accuracy, ensemble strategies are adopted by combining the outputs of individual classifiers. Three ensemble techniques are applied: majority voting, which aggregates class predictions through a simple voting mechanism; weighted average, which assigns higher influence to models with superior validation accuracy; and soft voting, which averages class probabilities to produce a consensus prediction. These methods are designed to exploit the complementary strengths of individual algorithms, thereby reducing both variance and bias in the final forecasts.
The analysis is fully reproducible, and code and data can be provided upon request.


3. Results

The predictive performance of the employed machine learning models is evaluated for both the Turkish and Malaysian Sukuk markets. Table 6 and Table 7 summarize the results across both markets. Model performance is assessed using Accuracy, Precision, Recall, F1-score, and ROC-AUC metrics to evaluate both classification accuracy and discrimination ability.
Table 8 reports the confusion matrices of the main machine learning models for both markets. The results reveal a noticeable asymmetry in the Turkish market, where most models correctly classify a large proportion of upward movements but exhibit weaker performance in identifying downward movements. This pattern is consistent with the class distribution reported in Table 4, where upward observations account for 63% of the sample. In contrast, the Malaysian market displays a more balanced classification performance across both classes, which is reflected in its substantially higher ROC-AUC values.

3.1. Results for the Turkish Market

For the Turkish dataset, the predictive performances of the individual machine learning models remain relatively similar. SVM, XGBoost, and CatBoost all achieve an accuracy of 63.0%, indicating that no single standalone model clearly dominates the others in terms of classification accuracy. All three models exhibit high recall values, exceeding 92%, while F1-scores range between 76.3% and 76.7%.
In terms of ROC-AUC, SVM achieves the highest value (0.635), followed by XGBoost (0.611) and CatBoost (0.597). This suggests that although the models produce comparable classification accuracies, SVM provides superior discriminative capability in distinguishing upward and downward market movements.
The ensemble approaches yield mixed results. Majority Voting achieves 62.5% accuracy, slightly below the best standalone models, while Soft Voting achieves 63.0% accuracy and a ROC-AUC of 0.627. The Weighted Average ensemble produces the highest overall performance, achieving 64.1% accuracy, a 77.5% F1-score, and 98.4% recall. Although its ROC-AUC (0.611) remains below that of SVM, the Weighted Average ensemble demonstrates the strongest classification performance among all evaluated models for the Turkish market.

3.2. Results for the Malaysian Market

For the Malaysian dataset, predictive performance is considerably stronger across all evaluated models. Among the standalone machine learning algorithms, SVM achieves the highest performance, with an accuracy of 83.5%, a precision of 81.3%, a recall of 83.9%, an F1-score of 82.5%, and a ROC-AUC of 0.901.
XGBoost delivers the second-best standalone performance, achieving 76.0% accuracy, 73.6% F1-score, and a ROC-AUC of 0.780. CatBoost produces lower predictive performance, with an accuracy of 69.5%, an F1-score of 66.3%, and a ROC-AUC of 0.751.
The ensemble learning methods further improve predictive performance. Majority Voting achieves 77.0% accuracy and a ROC-AUC of 0.843, while Soft Voting increases accuracy to 81.0% and achieves a ROC-AUC of 0.868. The Weighted Average ensemble produces the strongest overall results, achieving 85.0% accuracy, 84.0% F1-score, and a ROC-AUC of 0.888.
Although SVM maintains the highest standalone ROC-AUC value, the Weighted Average ensemble provides the highest classification accuracy and F1-score among all evaluated models, indicating that combining multiple machine learning algorithms can further enhance forecasting performance in the Malaysian Sukuk market.

3.3. Comparative Results

The comparative analysis reveals substantial differences in predictive performance between the Turkish and Malaysian Sukuk markets. Across all standalone models, classification accuracy is considerably higher in Malaysia than in Turkey. While SVM, XGBoost, and CatBoost each achieve approximately 63.0% accuracy in the Turkish market, their performance ranges from 69.5% to 83.5% in the Malaysian market.
A similar pattern is observed for ROC-AUC values. In Turkey, ROC-AUC values range from 0.597 to 0.635 for standalone models, whereas in Malaysia they range from 0.751 to 0.901. SVM consistently achieves the highest ROC-AUC value in both markets, indicating superior discriminative ability relative to the other standalone classifiers.
The effectiveness of ensemble learning also differs across markets. In the Turkish dataset, ensemble methods provide only modest improvements over standalone models. The Weighted Average ensemble increases accuracy from 63.0% to 64.1%, representing a relatively limited gain. In contrast, ensemble learning produces more substantial improvements in the Malaysian market, where the Weighted Average ensemble increases accuracy from 83.5% to 85.0% and achieves an F1-score of 84.0%.
Across both markets, the Weighted Average ensemble consistently delivers the highest classification accuracy and F1-score among all evaluated approaches. These findings suggest that ensemble learning can improve directional forecasting performance in Sukuk markets, although the magnitude of improvement appears to depend on underlying market characteristics.
Overall, the results indicate that the Malaysian Sukuk market exhibits a substantially higher degree of predictability than the Turkish Sukuk market, regardless of the machine learning algorithm employed. This pattern remains consistent across standalone classifiers and ensemble models, supporting the robustness of the findings.

3.4. Robustness Checks and Benchmark Model Comparison

To evaluate the robustness of the main findings and address potential model-specific biases, additional benchmark algorithms were implemented. Specifically, Logistic Regression, Random Forest, NGBoost, and LightGBM were estimated using the same predictor set, stratified train-test split, and five-fold cross-validation framework applied in the main analysis. This procedure allows the assessment of whether the conclusions obtained from SVM, XGBoost, CatBoost, and ensemble models remain stable across alternative machine learning specifications.
Table 9 summarizes the benchmark model results for the Turkish Sukuk market. The benchmark models produced performance levels comparable to those observed in the primary analysis. Logistic Regression achieved the highest benchmark accuracy (62.3%), followed by NGBoost (62.0%), LightGBM (60.9%), and Random Forest (59.4%). Similarly, F1-scores ranged from 71.7% to 76.2%, while ROC-AUC values varied between 0.563 and 0.603. Among the benchmark models, NGBoost achieved the highest ROC-AUC value (0.603), although its overall predictive performance remained comparable to the other alternative specifications.
Table 10 summarizes the benchmark model results for the Malaysian Sukuk market. Logistic Regression produced the strongest benchmark performance, with an accuracy of 84.5%, an F1-score of 83.2%, and a ROC-AUC value of 0.918. NGBoost and LightGBM achieved similar performance levels, while Random Forest generated the lowest accuracy (66.5%).
The confusion matrices reported in Table 11 provide additional insight into classification behavior across benchmark models. For the Turkish market, all benchmark algorithms correctly classify a large proportion of upward movements but exhibit limited ability to identify downward movements. This finding is consistent with the class imbalance observed in the Turkish dataset, where upward movements account for approximately 63% of observations. In contrast, the Malaysian market displays a more balanced classification pattern across both classes, supporting the substantially higher ROC-AUC values observed throughout the analysis.
The benchmark analysis confirms the robustness of the main findings. First, predictive performance is consistently higher in the Malaysian market than in the Turkish market across all benchmark models. Second, the main conclusions obtained from the primary models, particularly SVM and the ensemble approaches, remain largely unchanged after considering alternative machine learning specifications. The primary model set was selected based on standalone predictive performance among the advanced machine learning algorithms evaluated in this study, where SVM, XGBoost, and CatBoost achieved the highest classification accuracies in the Turkish market. To preserve methodological consistency and ensure comparability across markets, the same modeling framework was subsequently applied to both Turkey and Malaysia.
The robustness analysis in the present study focuses on alternative machine learning specifications while maintaining an identical predictor set, forecasting horizon, and train-test split configuration. Additional robustness checks based on alternative forecasting horizons, technical indicators, or different training-test periods were not implemented due to data availability constraints and the relatively limited sample size of the Sukuk datasets. Nevertheless, the consistent performance patterns observed across a diverse set of benchmark algorithms suggest that the main conclusions of the study are not driven by a particular model specification and remain stable across alternative machine learning techniques.

4. Discussion

The findings of this study provide important insights into the predictability of Sukuk index movements and directly address the methodological gap identified in the literature. While prior studies on sukuk have primarily focused on price and yield estimation using traditional econometric approaches (Safari et al., 2014; Alam et al., 2013), this study adopts a directional classification framework and suggests that machine learning models can be effectively applied to forecast the direction of Sukuk index movements.
For the Turkish market, the results indicate that all machine learning models yield similar performance levels, characterized by high recall but relatively low ROC-AUC values. This pattern suggests that these models predominantly capture the dominant upward trend rather than effectively distinguishing between upward and downward movements. Such behavior is consistent with broader evidence in the financial machine learning literature, suggesting that predictive performance may be driven more by data characteristics than by model specification (Krauss et al., 2017; Fischer & Krauss, 2018).
The limited improvement obtained from ensemble methods in the Turkish dataset further reinforces the interpretation that predictive performance is constrained by the underlying data structure. While prior studies show that combining multiple machine learning models can improve forecasting accuracy (Krauss et al., 2017), and that ensemble-based approaches may outperform individual classifiers in financial prediction tasks (Tsai & Hsiao, 2010), the results of this study suggest that such improvements are not guaranteed across all market conditions. In particular, in emerging markets characterized by lower liquidity and structural instability, the effectiveness of ensemble learning appears to be limited, indicating that model performance is highly dependent on underlying market dynamics.
In contrast, the Malaysian market exhibits substantially stronger predictive performance across all models. The superior performance of SVM, in particular, is consistent with earlier studies in financial forecasting, such as Kim (2003) and Kara et al. (2011), which suggest the effectiveness of Support Vector Machines in directional prediction tasks. The high ROC-AUC values observed in this study further indicate that machine learning models are able to capture meaningful and stable patterns in the Malaysian Sukuk market, reflecting its more mature and liquid structure.
The effectiveness of ensemble learning is also more pronounced in the Malaysian dataset. The improvements achieved through Soft Voting and Weighted Average approaches support the findings of Tsai and Hsiao (2010), who show that integrated and ensemble-based models outperform individual classifiers in financial prediction tasks. These results suggest that when the underlying signal is sufficiently strong, combining models enhances predictive stability and overall performance.
The superior forecasting performance observed in the Malaysian market may also be associated with structural characteristics beyond model-specific factors. Malaysia is widely recognized as the most developed Sukuk market globally and accounts for a substantial share of global Sukuk issuance (IIFM, 2024). In addition, the Malaysian market benefits from a well-established regulatory framework, deeper market liquidity, broader investor participation, and a longer history of Sukuk issuance. In contrast, the Turkish Sukuk market is relatively younger, with its benchmark Sukuk index introduced only in 2021, and exhibits a shorter data history and more limited market depth. These differences may contribute to more efficient price discovery and more stable information transmission in Malaysia, thereby facilitating stronger predictive performance. Nevertheless, these structural characteristics should not be viewed as the sole explanation for forecasting outcomes, which may also be influenced by data availability, model specification, and predictor selection.
More broadly, the results of this study confirm the applicability of machine learning techniques—widely validated in equity, FX, and cryptocurrency markets (Huang et al., 2005; McNally et al., 2018)—to the Sukuk domain. However, unlike these markets, where large datasets and high liquidity often support strong predictive performance, the findings highlight that Sukuk markets exhibit heterogeneous behavior depending on their level of development. This reinforces the argument that the success of machine learning models is highly context-dependent and influenced by market-specific characteristics.
Importantly, this study extends the emerging literature on machine learning applications in Sukuk markets. While recent studies have begun to explore predictive modeling using techniques such as KNN and ANN (Yiğiter et al., 2018; Çetin & Meltek, 2021; Meltek, 2022), these works primarily focus on price prediction rather than directional forecasting. By introducing a classification-based framework and comparing model performance across two markets with different levels of maturity, this study provides new empirical evidence and broadens the methodological scope of Sukuk research.
Overall, the findings suggest that machine learning models are capable of capturing directional patterns in Sukuk markets, but their effectiveness varies significantly depending on market structure. Ensemble learning improves predictive performance in more mature markets such as Malaysia, while its contribution remains limited in emerging markets such as Turkey, where structural constraints and data characteristics pose significant challenges. These findings underscore the importance of aligning machine learning approaches with underlying market conditions when applying predictive models in financial contexts, particularly in emerging markets where structural constraints may limit model effectiveness.

5. Conclusions

This study contributes to the Sukuk forecasting literature by introducing a machine learning-based directional forecasting framework for Sukuk indices and by providing the first application of such an approach to the Turkish Sukuk market. In addition, by applying a unified machine learning framework across the Turkish and Malaysian markets, the study provides comparative evidence on how market characteristics influence forecasting performance.
The empirical findings demonstrate that while machine learning models are capable of capturing directional dynamics in Sukuk markets, their performance is highly dependent on market-specific characteristics. Substantially higher predictive accuracy is observed in the Malaysian market, which may be associated with its more developed Islamic finance ecosystem, higher liquidity, and more established market structure. In contrast, the relatively younger Turkish Sukuk market exhibits lower predictive performance, which may be associated with limited market depth, structural volatility, and sensitivity to external shocks.
From a theoretical perspective, this study extends the application of machine learning to Sukuk markets by introducing a directional forecasting framework and highlights the importance of market structure in shaping predictive performance.
From a practical perspective, the findings provide actionable insights for investors, portfolio managers, and risk managers. In more mature markets such as Malaysia, machine learning and ensemble-based models can be effectively integrated into data-driven investment strategies to anticipate market direction, improve portfolio allocation, and enhance risk management practices. In contrast, in less developed markets such as Turkey, the results highlight the need for cautious model application, as structural instability, lower liquidity, and higher exposure to external shocks may limit predictive reliability. Accordingly, model selection, weighting strategies, and risk controls should be carefully tailored to market conditions, emphasizing the critical role of data quality and underlying market dynamics in real-world financial decision-making.
Despite its contributions, this study has several limitations. An important limitation relates to the validation strategy. Consistent with many machine learning studies in the financial forecasting literature, this study employs a stratified train–test split and 5-fold cross-validation to evaluate model performance and tune hyperparameters. However, financial time-series data exhibit temporal dependencies that may be better captured through time-sensitive validation approaches such as rolling-window, expanding-window, or walk-forward validation. Future research may investigate the robustness of the reported findings using these alternative validation frameworks.
In addition, the analysis relies on a specific set of macro-financial and technical variables, and alternative predictors may provide additional explanatory power. Although the dataset contains approximately 1000 daily observations, the Turkish Sukuk index is available only from 2021 onward, resulting in a relatively short historical sample for machine learning applications. This limited data history may restrict both predictive performance and the generalizability of the findings, particularly for the Turkish market. Furthermore, the study focuses on a single forecasting horizon, and alternative forecasting horizons may provide additional insights into the stability of predictive performance. Future research may extend the proposed framework by incorporating alternative features, such as sentiment indicators, additional macroeconomic variables, and market microstructure measures. Further investigations may also evaluate deep learning architectures and hybrid ensemble approaches to enhance forecasting accuracy. Finally, expanding the analysis to additional Sukuk markets and longer time horizons would further strengthen the robustness and generalizability of the findings.

Author Contributions

Conceptualization, M.E.; Methodology, M.E.; Software, M.E.; Formal analysis, M.E.; Data curation, M.E.; Writing—original draft, M.E.; Writing—review and editing, M.E.; Supervision, K.T.; Project administration, K.T. All authors have read and agreed to the published version of the manuscript.

Funding

This research received no external funding.

Institutional Review Board Statement

Not Applicable.

Informed Consent Statement

Not Applicable.

Data Availability Statement

Restrictions apply to the availability of these data. The macro-financial and global risk indicators used in this study were obtained from the Reuters terminal, while the Turkish Sukuk index data were obtained from Borsa Istanbul. Access to these data may be subject to licensing and access restrictions imposed by the original data providers. Processed data supporting the findings of this study are available from the corresponding author upon reasonable request.

Conflicts of Interest

The authors declare no conflict of interest.

References

  1. Ahmed, H. (2010). Product development in Islamic banks: Challenges and options. Edinburgh University Press. [Google Scholar]
  2. Ahmed, H. (2011). Product development in Islamic banks. Edinburgh University Press. [Google Scholar]
  3. Alam, N., Hassan, M. K., & Haque, M. A. (2013). Are Islamic bonds different from conventional bonds? International evidence from capitak market tests. Borsa Istanbul Review, 3, 22–29. [Google Scholar] [CrossRef]
  4. Cakir, S., & Raei, F. (2007). Sukuk vs. Eurobonds: Is there a difference in risk exposures? IMF Working Paper No. 07/237. International Monetary Fund. [Google Scholar]
  5. Chen, T., & Guestrin, C. (2016). XGBoost: A scalable tree boosting system. In Proceedings of the 22nd ACM SIGKDD international conference on knowledge discovery and data mining (pp. 785–794). Association for Computing Machinery. [Google Scholar]
  6. Cortes, C., & Vapnik, V. (1995). Support-vector networks. Machine Learning, 20(3), 273–297. [Google Scholar] [CrossRef]
  7. Çetin, C., & Meltek, M. (2021). Forecasting Turkish treasury-issued sukuk prices using artificial neural networks. Acta Infologica, 5(2), 241–254. [Google Scholar]
  8. El-Gamal, M. A. (2006). Islamic finance: Law, economics, and practice. Cambridge University Press. [Google Scholar]
  9. Fischer, T., & Krauss, C. (2018). Deep learning with long short-term memory networks for financial market predictions. European Journal of Operational Research, 270(2), 654–669. [Google Scholar] [CrossRef]
  10. Galeshchuk, S., & Mukherjee, S. (2017). Deep networks for predicting direction of change in foreign exchange rates. Intelligent Systems in Accounting, Finance and Management, 24(4), 100–110. [Google Scholar] [CrossRef]
  11. Godlewski, C. J., Turk-Ariss, R., & Weill, L. (2013). Sukuk vs. conventional bonds: A stock market perspective. Journal of Comparative Economics, 41(3), 745–761. [Google Scholar] [CrossRef]
  12. Hartono, H. S., Nurrachmi, R., & Salleh, S. N. S. (2025). Forecasting the outstanding value of Indonesian sovereign sukuk using ARIMA models. Economica: Jurnal Ekonomi Islam, 16(2), 387–411. [Google Scholar] [CrossRef]
  13. Hoang, D. T., & Wiegratz, J. (2023). Machine learning in finance: A review of applications and trends. European Financial Management, 29(5), 1657–1701. [Google Scholar] [CrossRef]
  14. Huang, W., Nakamori, Y., & Wang, S.-Y. (2005). Forecasting stock market movement direction with support vector machine. Computers & Operations Research, 32(10), 2513–2522. [Google Scholar]
  15. International Islamic Financial Market (IIFM). (2024). IIFM sukuk report: A comprehensive study of the global sukuk market. International Islamic Financial Market. [Google Scholar]
  16. Iqbal, Z., & Mirakhor, A. (2011). An introduction to ıslamic finance: Theory and practice (2nd ed.). Wiley. [Google Scholar]
  17. Islam, M. T., Malakar, S., Hassan, K. L., Dey, R., Mahajan, R., & Kassim, S. (2024). A comparative analysis of machine learning approaches in sukuk price estimation across global regions. Available online: https://ssrn.com/abstract=4945306 (accessed on 1 March 2026).
  18. Islamic Financial Services Board (IFSB). (2025). IFSB stability report 2025. Islamic Financial Services Board. [Google Scholar]
  19. James, G., Witten, D., Hastie, T., & Tibshirani, R. (2013). An introduction to statistical learning. Springer. [Google Scholar]
  20. Jobst, A. A., Kunzel, P., Mills, P., & Amadou, N. R. (2008). Islamic bond issuance: What sovereign debt managers need to know. IMF Policy Discussion Paper No. 08/3. International Monetary Fund. [Google Scholar]
  21. Kara, Y., Boyacioglu, M. A., & Baykan, Ö. K. (2011). Predicting direction of stock price index movement using artificial neural networks and support vector machines. Expert Systems with Applications, 38(5), 5311–5319. [Google Scholar] [CrossRef]
  22. Karim, R. A. A., Archer, S., & Abdel-Karim, R. A. (2014). Islamic finance: The new regulatory challenge (2nd ed.). Wiley. [Google Scholar]
  23. Kim, K.-J. (2003). Financial time series forecasting using support vector machines. Neurocomputing, 55(1–2), 307–319. [Google Scholar] [CrossRef]
  24. Krauss, C., Do, X. A., & Huck, N. (2017). Deep neural networks, gradient-boosted trees, random forests: Statistical arbitrage on the S&P 500. European Journal of Operational Research, 259(2), 689–702. [Google Scholar]
  25. Mallqui, D. C. A., & Fernandes, R. A. S. (2019). Predicting the direction, maximum, minimum and closing prices of daily Bitcoin exchange rate using machine learning techniques. Applied Soft Computing, 75, 596–606. [Google Scholar] [CrossRef]
  26. McNally, S., Roche, J., & Caton, S. (2018, March 21–23). Predicting the price of Bitcoin using machine learning. 26th Euromicro International Conference on Parallel, Distributed and Network-Based Processing, Cambridge, UK. [Google Scholar]
  27. Meltek, M. (2022). Forecasting of dow jones sukuk index prices using artifical intelligence systems. Economic Computation and Economic Cybernetics Studies and Research, 56(1), 107–124. [Google Scholar] [CrossRef]
  28. Nelson, D. M. Q., Pereira, A. C. M., & de Oliveira, R. A. (2017, May 14–19). Stock market’s price movement prediction with LSTM neural networks. International Joint Conference on Neural Networks, Anchorage, AK, USA. [Google Scholar]
  29. Odeyemi, O., Mhlongo, N. Z., Daraojimba, D. O., Ajayi-Nifise, A. O., & Falaiye, T. (2024). Machine learning in financial forecasting: A U.S. review: Exploring the advancements, challenges, and implications of AI-driven predictions in financial markets. World Journal of Advanced Research and Reviews, 21(2), 1969–1984. [Google Scholar]
  30. Prokhorenkova, L., Gusev, G., Vorobev, A., Dorogush, A. V., & Gulin, A. (2018, December 2–8). CatBoost: Unbiased boosting with categorical features. 32nd Conference on Neural Information Processing Systems (NeurIPS 2018), Montréal, QC, Canada. [Google Scholar] [CrossRef]
  31. Rosadhillah, M., & Ülev, S. (2024). Forecasting Sovereign Sukuk Outstanding Volume in Türkiye: An ARIMA-Based Analysis. Ekonomi Islam Indonesia, 6(1). [Google Scholar] [CrossRef]
  32. Safari, M., Ariff, M., & Mohamad, S. (2014). Sukuk securities: New ways of debt contracting. John Wiley and Sons. [Google Scholar] [CrossRef]
  33. Thomas, A., Cox, S., & Kraty, B. (2005). Structuring Islamic finance transactions. Euromoney Books. [Google Scholar]
  34. Tsai, C.-F., & Hsiao, Y.-C. (2010). Combining multiple feature selection methods for stock prediction. Decision Support Systems, 50(1), 258–269. [Google Scholar] [CrossRef]
  35. Uhunmwangho, O. P. (2024). Comparing XGBoost and LSTM models for prediction of microsoft corp’s stock price direction. Mountain Top University Journal of Applied Science and Technology, 4(2), 64–88. [Google Scholar]
  36. Usmani, M. T. (2007). Sukuk and their contemporary applications. Islamic Fiqh Academy. [Google Scholar]
  37. Wardani, L., Viverita, V., Husodo, Z. A., & Sunaryo, S. (2020). Contingent claim approach for pricing of sovereign sukuk for R&D financing in Indonesia. Emerging Markets Finance and Trade, 56(2), 338–350. [Google Scholar] [CrossRef]
  38. Wilson, R. (2008). Innovation in the structuring of Islamic sukuk securities. Humanomics, 24(3), 170–181. [Google Scholar] [CrossRef]
  39. Yiğiter, Ş. Y., Sarı, S. S., Karabulut, T., & Başakın, E. E. (2018). Estimation of lease certificate price evaluation through machine learning method. International Journal of Islamic Economics and Finance Studies, 4(3), 74–82. [Google Scholar] [CrossRef][Green Version]
  40. Zaher, T. S., & Hassan, M. K. (2001). A comparative literature survey of Islamic finance and banking. Financial Markets, Institutions & Instruments, 10(4), 155–199. [Google Scholar] [CrossRef]
Figure 1. Time Series Plots for Malaysian Market.
Jrfm 19 00486 g001
Figure 2. Time Series Plots for Turkish Market.
Jrfm 19 00486 g002
Figure 3. Research Framework and Model Validation Process.
Jrfm 19 00486 g003
Table 1. Descriptive Statistics of the Malaysian Dataset.
VariableNMeanStd. Dev.MinMaxSkewnessKurtosis
Sukuk Index100141.6242.00436.76848.1390.4920.542
EB100141.8252.03236.74748.3310.3780.456
DXY1001102.125.29389.640114.110−0.636−0.231
VIX100119.1015.23311.86038.5700.9210.248
DJ1001196.4736.801180.180209.100−0.089−1.095
CDS100159.46219.07633.520123.6601.2110.848
Lag1100141.6212.00136.76848.1390.4920.556
Lag2100141.6201.99836.76848.1390.4910.569
SMA100141.6111.97036.96947.6800.4980.546
Table 2. Class Distribution of Malaysia Sukuk Index Movement Direction.
DirectionCountPercentage
Up46646.6%
Down53553.4%
Table 3. Descriptive Statistics of the Turkish Dataset.
VariableNMeanStd. Dev.MinMaxSkewnessKurtosis
Sukuk Index963110393.397212810.621−1.13
DJ9631966.85180209−0.092−1.10
EB96343747.63475250.389−1.04
DXY9631025.2689.6114−0.625−0.203
VIX96319.15.2311.938.60.9190.262
CDS9634481642109060.663−0.434
Lag1963110393.297212810.625−1.13
Lag296311039397212800.628−1.12
SMA963110192.398112770.651−1.09
Table 4. Class Distribution of Turkey Sukuk Index Movement Direction.
DirectionCountPercentage
Up60763%
Down35637%
Table 5. Hyperparameter search ranges.
ModelHyperparameterSearch Range
SVMCost/C{0.1, 1, 10, 50}
SVMSigma{0.01, 0.05, 0.10, 0.20}
CatBoostDepth{4, 6, 8}
CatBoostLearning rate{0.01, 0.05, 0.10}
CatBoostIterations{100, 200, 400, 500}
CatBoostL2 leaf reg{3, 5, 10}
CatBoostBorder count{16, 32, 64}
XGBoostnrounds{50, 100}
XGBoostMax depth{2, 3, 4}
XGBoosteta{0.01, 0.05, 0.10}
XGBoostgamma{0, 1}
XGBoostCol sample by tree{0.8, 1.0}
XGBoostMin child weight{1, 3}
XGBoostSubsample{0.8, 1.0}
Table 6. Results for Turkish Sukuk Market.
ML AlgorithmAccuracyPrecisionRecallF1 ScoreROC_AUC
SVM63.0%63.7%95.8%76.6%63.5%
XGBoost63.0%64.0%92.4%76.3%61.1%
CatBoost63.0%63.1%96.7%76.7%59.7%
Major Voting62.5%63.4%95.9%76.3%52.0%
Soft Voting63.0%63.6%96.7%76.7%62.7%
Weighted Average64.1%64.0%98.4%77.5%61.1%
Note: SVM(Sigma = 0.05, C = 50), XGboost(nrounds = 50, max_depth = 2, eta = 0.05, gamma = 1, colsample_bytree = 1, min_child_weight = 1, subsample = 0.8), Catboost(depth = 6, learning rate = 0.05_iterations = 500, border count = 32, I2_leaf_reg = 3), Weighted Average(weights: SVM = 0.1, XGboost = 0, CatBoost = 0.9).
Table 7. Results for Malaysian Sukuk Market.
ML AlgorithmAccuracyPrecisionRecallF1 ScoreROC_AUC
SVM83.5%81.3%83.9%82.5%90.1%
XGBoost76.0%75.3%72.0%73.6%78.0%
CatBoost69.5%68.2%64.5%66.3%75.1%
Major Voting77.0%75.8%74.2%75.0%84.3%
Soft Voting81.0%79.0%80.7%79.8%86.8%
Weighted Average85.0%83.2%85.0%84.0%88.8%
Note: SVM(Sigma = 0.2, C = 50), XGboost(nrounds = 100, max_depth = 4, eta = 0.1, gamma = 0, colsample_bytree = 1, min_child_weight = 1, subsample = 1), Catboost(depth = 4, learning rate = 0.05_iterations = 400, border count = 64, I2_leaf_reg = 3), Weighted Average(weights: SVM= 0.5, XGboost = 0.5, Catboost = 0).
Table 8. Confusion Matrices of Main Models.
ModelsTurkeyMalaysia
SVM Reference Reference
PredictionDownUpPredictionDownUp
Down55Down9015
Up66116Up1778
CatBoost Reference Reference
PredictionDownUpPredictionDownUp
Down44Down7933
Up67117Up2860
XGBoost Reference Reference
PredictionDownUpPredictionDownUp
Down77Down8526
Up64114Up2267
Table 9. Benchmark Model Results for Turkish Sukuk Market.
ML AlgorithmAccuracyPrecisionRecallF1 ScoreROC_AUC
Random Forest59.38%63.87%81.82%71.74%59.25%
Logistic Regression62.25%64.2%91.7%75.5%56.3%
NGBoost61.97%62.9%96.7%76.2%60.3%
LightGBM60.94%63.53%89.26%74.23%58.97%
Note: RF(mtry = 5), NGBoost (n_estimators = 100, learning_rate = 0.05, minibatch_frac = 0.8, col_sample = 1), LightGBM(nrounds = 50, num_leaves = 31, learning rate = 0.05, max_depth = 5, min_data_in_leaf = 10, bagging fraction = 0.8, feature fraction = 1).
Table 10. Benchmark Model Results for Malaysian Sukuk Market.
ML AlgorithmAccuracyPrecisionRecallF1 ScoreROC_AUC
Random Forest66.5%65.1%60.2%62.6%73.3%
Logistic Regression84.5%83.7%82.8%83.2%91.8%
NGBoost74.0%73.0%69.9%71.4%75.7%
LightGBM73.5%72.2%69.9%71.0%75.1%
Note: RF(mtry = 7), NGBoost (n_estimators = 200, learning_rate = 0.05, minibatch_frac = 0.8, col_sample = 0.8), LightGBM(nrounds = 100, num_leaves = 15, learning rate = 0.1, max_depth = 5, min_data_in_leaf = 10, bagging fraction = 0.8, feature fraction = 1).
Table 11. Confusion Matrices of Benchmark Models.
ModelsTurkeyMalaysia
NGBoost Reference Reference
PredictionDownUpPredictionDownUp
Down24Down8328
Up69117Up2465
Logistic Regression Reference Reference
PredictionDownUpPredictionDownUp
Down910Down9216
Up62111Up1577
Random Forest Reference Reference
PredictionDownUpPredictionDownUp
Down1522Down7737
Up5699Up3056
lightGBM Reference Reference
PredictionDownUpPredictionDownUp
Down913Down8228
Up62108Up2565
Disclaimer/Publisher’s Note: The statements, opinions and data contained in all publications are solely those of the individual author(s) and contributor(s) and not of MDPI and/or the editor(s). MDPI and/or the editor(s) disclaim responsibility for any injury to people or property resulting from any ideas, methods, instructions or products referred to in the content.