Article

Do Monetary and Fiscal Policies Affect Territorial and Consumption-Based CO2 Emissions? Evidence from E-7 Countries


by
Meryem Filiz Baştürk
Faculty of Economics and Administrative Sciences, Bursa Uludağ University, Bursa 16059, Türkiye
J. Risk Financial Manag. 2026, 19(7), 483; https://doi.org/10.3390/jrfm19070483
Submission received: 19 May 2026 / Revised: 26 June 2026 / Accepted: 27 June 2026 / Published: 30 June 2026
(This article belongs to the Section Economics and Finance)

Abstract

Climate change and the problems it causes have led to global action (the UN Sustainable Development Goals and the Paris Climate Change Agreement), and specific targets have been set to reduce global temperatures. Meeting the determined targets has become crucial. Therefore, evaluating the effectiveness of macroeconomic policies (monetary and fiscal) on carbon emissions becomes inevitable. This study examines the effects of monetary and fiscal policies on territorial and consumption-based C O 2 emissions in E-7 countries from 1996 to 2021. The Augmented Mean Group (AMG) estimator, which accounts for cross-sectional dependency and heterogeneity, was employed. The study concludes that monetary policy exerts a statistically significant negative impact on territorial and consumption-based C O 2 emissions, whereas fiscal policy has a statistically insignificant negative impact on them. A 1% increase in broad money, as an indicator of monetary policy, decreased territorial-based C O 2 emissions by 0.14 and consumption-based C O 2 emissions by 0.28. The results of the Dumitrescu and Hurlin causality analysis reveal a bidirectional causal relationship between monetary policy and territorial- and consumption-based C O 2 emissions.

1. Introduction

Climate change and the problems it causes have prompted global-scale efforts to address the issue. International agreements (UN Sustainable Development Goals and Paris Climate Change Agreement) have played a critical role and brought environmental targets to the agenda of policymakers (Dikau & Volz, 2021). Achieving the determined targets has become essential for all economies, because the destructive dimension caused by the “brown economy” concerns all economies (Huy & Dinh, 2025; Van et al., 2025; Dinh, 2025). However, the situation is more serious when viewed from the perspective of E-7 economies, which have high growth rates and must maintain them. These economies face the dual challenge of sustaining rapid growth while meeting their commitments to significant carbon emission reductions. China’s commitment includes a dual carbon target. In this context, it has committed to reaching a carbon peak by 2030 and achieving carbon neutrality by 2060 (Zhan et al., 2024). India’s commitment to carbon neutrality is set for 2070 (Hossain et al., 2023). Türkiye has a net-zero emission target for 2053 (IDB, 2024). Brazil has a net-zero target for 2050, and Indonesia for 2060 (den Elzen et al., 2025). There is a trade-off: high growth versus low-carbon emission targets.
Achieving low-carbon goals, promoting sustainable development, and driving ongoing growth require an integrated strategy that considers social, economic, and environmental factors (Dinh et al., 2025; Van et al., 2025). There is no single policy option for economies to achieve low-carbon reduction goals. A holistic approach encompassing a multitude of policies is required (Mu et al., 2025; Khan et al., 2025; Zhan et al., 2024). Macroeconomic policies (monetary and fiscal) have been actively employed in many developing countries (e.g., increased investment in clean energy, promotion of environmentally sound production and consumption) to attain the stated objectives. Fiscal policy is important due to the high initial costs associated with investments in clean energy (Mazzucato, 2021). Monetary policy makes central banks important in the transition to a low-carbon economy through the financial system (Lupu et al., 2024). Central banks’ monetary policies are crucial for transitioning to a low-carbon economy, particularly within developing economies (Dikau & Ryan-Collins, 2017). Thus, evaluating the impact of both macroeconomic policies is essential.
Previous studies in the literature have evaluated the effects of macroeconomic policies (monetary and fiscal) on carbon emissions in emerging market economies, predominantly for the BRICS economies. This research aims to address a gap in the existing literature by focusing on E-7 countries, evaluating the impact of monetary and fiscal policy, and considering both territorial-based and consumption-based C O 2 emissions.
This research examines the effects of monetary and fiscal policies on territorial-based and consumption-based C O 2 emissions in E-7 countries from 1996 to 2021. Monetary policy is represented using broad money. The rationale for employing broad money stems from the unavailability of short-term interest rate data for some countries examined in this study. In the research, six countries (Brazil, China, India, Indonesia, Mexico, and Türkiye) among the E-7 countries were taken into consideration. Russia was omitted from the analysis because of a lack of data for several key variables during the specified period. Given their high carbon emissions, especially those of China and India, the E-7 nations were chosen as the focus of this study.
In various studies, environmental degradation has been represented either by C O 2 (Kahuthu, 2006; Zhang, 2011; Saboori & Sulaiman, 2013; Lin & Benjamin, 2017; Omri & Saadaoui, 2023; Baştürk, 2024; Yuan et al., 2025) or by ecological footprint (Kiani et al., 2023; Ma et al., 2023; Tsompo et al., 2025). In this aspect, the present research distinguishes itself from prior studies. This research employed a method consistent with Halkos and Paizanos (2016), categorizing carbon emissions as territorial-based and consumption-based. This distinction becomes more important when examining the E-7 economies. In order to reduce costs and sidestep stringent environmental regulations at home, many companies in developed countries have transferred their manufacturing processes to developing economies (Udeagha & Muchapondwa, 2023). Considering carbon emissions as territorial-based and consumption-based allows for a more comprehensive analysis. Territorial-based C O 2 emissions cover emissions from fossil fuels produced within a country’s borders. This approach, however, suffers from several drawbacks. Emissions from international shipping and air travel are excluded, and the export of energy-intensive goods leads to carbon leakage, as emissions from their production are assigned to the producing economies (Franzen & Mader, 2018; Weimin & Chishti, 2021). In consumption-based C O 2 emissions, which is obtained by adding import emissions to the territorial-based C O 2 and subtracting export emissions, the “consumer assumes responsibility principle” applies (Fan et al., 2016; Mahmood et al., 2022). Differentiating between territorial and consumption-based C O 2 emissions is crucial for effective policy development and implementation (Halkos & Paizanos, 2013).
This research seeks to expand current knowledge in three areas by examining E-7 economies that pursue both high growth and low-carbon reduction goals. First, it attempts to show the impact of monetary policy on territorial- and consumption-based C O 2 emissions. Second, it investigates whether fiscal policy affects territorial and consumption-based C O 2 emissions. Understanding the effects of macroeconomic policies on territorial- and consumption-based C O 2 emissions is crucial for policymakers to develop sound policy strategies. Third, it aims to enrich the limited literature, which currently lacks precise results.
The rest of the research is organized as follows. Part two presents the theoretical basis. A literature review constitutes the third part. In the fourth part, the method and model are described. Empirical results are shown in the fifth part. The conclusion is in the sixth part. This study aims to investigate the impact of monetary and fiscal policies on territorial and consumption-based C O 2 emissions across the E-7 countries.

2. Theoretical Background

Monetary and fiscal policies are the two primary tools policymakers use to curb the environmental impact of carbon emissions. These two policy tools work through different channels to affect carbon emissions. Monetary policy influences carbon emissions (territorial-based and consumption-based) via two channels. First, it affects producers through their investment decisions. When the central bank lowers interest rates or increases the money supply, producers’ demand for loanable funds to make new investments increases. If this investment increase is channeled into clean technology and green energy projects, a low-carbon economy and reduced carbon emissions are possible. Second, it affects consumers through their consumption decisions. Central bank actions, such as lowering interest rates or expanding the money supply, lead to increased consumer borrowing. This results in increased consumer purchasing power and consumption. If consumer demand shifts towards green products, it helps lower carbon emissions (Jiang et al., 2020; Sharma et al., 2023; Zia et al., 2025; Mahmood et al., 2022).
Hypothesis 1: 
Monetary policy has a negative impact on territorial-based C O 2 emissions.
Hypothesis 2: 
Monetary policy has a negative impact on consumption-based C O 2 emissions.
Government expenditures, a fiscal policy tool, impacts territorial-based and consumption-based C O 2 emissions via varied pathways. Government expenditures affect territorial-based C O 2 emissions through fourth channels. The first of these channels is the income effect. According to this channel, increased government expenditures lead to higher income levels. Higher incomes drive demand for improved environmental quality. The second channel is the composition effect. According to this channel, increasing government expenditures encourages human capital-intensive activities. Thus, activities less damaging to the environment are supported over capital-intensive activities more damaging to the environment. The third channel is the technique effect. In this channel, government expenditures reduce environmental pollution by increasing labor efficiency in the education and health sectors. The fourth channel is the scale effect. According to this channel, government expenditures can increase economic growth, which in turn leads to increased territorial-based C O 2 emissions. While the income effect, composition effect, and technique effect lead to decreasing effects on territorial-based C O 2 emissions, the scale effect creates an increasing impact. Government expenditures affect consumption-based C O 2 emissions through the income channel, the environmental regulation channel, and the composition of consumer goods. The first channel suggests rising government expenditures boosts current and future consumer income, harming the environment. The second viewpoint proposes that government expenditures support institutions that lessen pollution with enhanced environmental controls. These two channels have opposite effects. Consumer preference shifts towards electric vehicles, driven by a public service announcement on channel three, have led to a reduction in fossil fuel use and mitigated the effects of carbon emissions on the environment (Halkos & Paizanos, 2016). Fiscal policy has both mitigating and increasing effects on territorial-based and consumption-based C O 2 through different channels. However, the net effect of fiscal policy on both is expected to be negative.
Hypothesis 3: 
Fiscal policy has a negative impact on territorial-based C O 2 emissions.
Hypothesis 4: 
Fiscal policy has a negative impact on consumption-based C O 2 emissions.
The effects of the monetary and fiscal policies described above on territorial-based and consumption-based C O 2 emissions are shown in the Table 1 below.

3. Literature Review

The literature has examined how monetary and fiscal policy affect environmental degradation, both jointly and separately. In these studies, environmental degradation is mostly represented either by carbon emissions or ecological footprint. A few studies, such as those by Halkos and Paizanos (2016) and Mahmood et al. (2022), categorize carbon emissions as both territorial- and consumption-based. Halkos and Paizanos (2016) differentiated this in their work as production- and consumption-generated C O 2 emissions. However, production-generated and territorial-based, as well as consumption-generated and consumption-based, refer to the same concept. Though there has been much research on emerging markets, no studies on the E-7 countries were found. Studies have frequently examined the BRICS (Chishti et al., 2021; Lau et al., 2024; Arjun & Mishra, 2025) or ASEAN (Mughal et al., 2021; Khan et al., 2025). It is difficult to assess if the studies conducted have reached a clear conclusion. While some studies have concluded that these policies have reduced carbon emissions, others have found that they have increased them. For example, Chishti et al. (2021) investigated the effects of monetary and fiscal policies on environmental pollution in BRICS economies. According to the study, contractionary monetary and fiscal policies improved environmental quality. The BRICS economies were also studied by Lau et al. (2024). In this study, monetary and fiscal policies were found to reduce carbon emissions and improve environmental quality. The research by Arjun and Mishra (2025) explored the relationship between fiscal and monetary policy and environmental quality in BRICS-T countries. Research shows that monetary policy has been effective in reducing pollution levels. However, fiscal policy did not produce the same outcome. Apart from BRICS economies, there are also studies evaluating ASEAN economies. Mughal et al. (2021) examined the effects of monetary and fiscal policy on environmental quality across five ASEAN countries. It was stated that contractionary monetary and expansionary fiscal policies reduce carbon emissions in the long run. Khan et al. (2025) studied the effects of monetary and fiscal policies on carbon emissions within ten ASEAN countries. It was found that both policies reduced carbon emissions. Besides BRICS and ASEAN, GCC countries were also analyzed. Mahmood et al. (2022) examined the relationship between monetary and fiscal policies and C O 2 emissions (territorial-based and consumption-based) in GCC economies. It was stated that the money supply has a negative impact on territorial and consumption-based C O 2 emissions in the long run. However, government expenditures were shown to have a positive long-run impact on C O 2 emissions, both territorial- and consumption-based.
A country-specific analysis frequently focused on China. Yousaf et al. (2022) found that increased discount rates (monetary policy) and government expenditures (fiscal policy) in China lessened the ecological footprint. China was also examined by Zeraibi et al. (2022). They found that expansionary fiscal policy raised carbon emissions, while expansionary monetary policy lowered them, in both the short and long term. Sharma et al. (2023) investigated the effectiveness of monetary and fiscal policies in India. The study concluded that fiscal policy has a more significant effect on carbon emissions than monetary policy.
Notably, there are few studies on the relationship between monetary policy and carbon emissions. The relatively new focus on how monetary policy affects carbon emissions likely explains this (Anastasiou et al., 2024; Bletsas et al., 2022). The study conducted by Isiksal et al. (2019) for Türkiye analyzed the effect of monetary policy on carbon emissions. The study concluded that increasing the real interest rate reduces carbon emissions. A US-focused study by Mu et al. (2025) investigated how monetary policy affects carbon emissions alongside trade and energy variables. It was concluded that monetary policy positively correlated with carbon emissions in the short term and negatively in the long term. Some studies also analyze this relationship by focusing on particular country groups. Jiang et al. (2020) examined how monetary policy affected carbon emissions across 14 Asian economies. The study revealed that tighter monetary policy led to lower carbon emissions. Zia et al. (2025) assessed the effect of green monetary policy on carbon emissions across specific G-20 nations. A significant reduction in carbon emissions resulted from the green monetary policy. Most research in the literature indicates that monetary policy cuts carbon emissions. However, territorial- and consumption-based C O 2 emissions were not separated in these studies.
Based on research solely assessing the impact of fiscal policy, Halkos and Paizanos (2016) for the US showed that government expenditures significantly and negatively impacted both production- and consumption-generated C O 2 emissions. Ma et al. (2023) research evaluated the effect of fiscal policy instruments—government expenditures and tax revenue—on the ecological footprint across BRICS economies. Tax revenue, renewable energy, green innovation, and energy transition were all associated with less environmental damage, whereas government expenditures and non-renewable energy sources worsened it. Mar’I et al. (2023) examined the relationship between fiscal policy and C O 2 emissions in G-20 countries. Fiscal policy’s positive impact on C O 2 was determined. A global study by Oluklulu and Kasal (2025) examined how fiscal policy affected C O 2 levels in 150 countries between 2000 and 2020. The countries considered were divided into three groups and analyzed as low- and lower middle-income, upper middle-income, and high-income countries. It was stated that an increase in government revenue and expenditure reduces C O 2 emissions in high-income countries. Another worldwide study was conducted by Baştürk (2025). The study, which surveyed 88 countries, concluded that fiscal policy negatively influences carbon emissions.
Emerging markets receive the most attention in the literature. However, a firm conclusion remains unachieved. These economies’ need for high growth alongside their low-carbon goals makes them interesting. More studies of these economies will lead to better policy conclusions. Table 2 below summarizes studies assessing the effects of monetary and fiscal policy on carbon emissions.

4. Methodology

The examination of E-7 economies over the period from 1996 to 2021 required acknowledging their significant economic linkages and the apparent cross-sectional correlation inherent in macroeconomic time series (Baltagi, 2013; Westerlund & Edgerton, 2008). Therefore, cross-sectional dependency was first examined. For this purpose, Pesaran (2004) cross-sectional dependency test was used. Following this, a homogeneity test by Pesaran and Yamagata (2008) checked for homogeneity in the slope parameters. In the next step, the integration degree of the variables was determined by the Pesaran (2007) second-generation unit root test. The Pesaran (2007) unit root test was preferred because it considers the cross-sectional dependency. After this step, a long-run relationship between the variables is analyzed with the Westerlund (2007) cointegration test. Then, the AMG estimator developed by Eberhardt and Bond (2009) and Eberhardt and Teal (2010), which considers cross-sectional dependency and heterogeneity, was employed. For a robustness check, the CCEMG estimator developed by Pesaran (2006) was used. Finally, to determine whether a causal relationship exists between the variables, the Dumitrescu and Hurlin (2012) causality test was performed in the study.

4.1. Cross-Section Dependence and Slope Homogeneity Test

Cross-sectional dependence was investigated using the CD test developed by Pesaran (2004). The CD test statistic is given below.
CD = 2 T N ( N 1 ) i = 1 N 1 j = i + 1 N ρ ^ i j
Homogeneity of the slope parameters was tested using the delta Δ ~ test of Pesaran and Yamagata (2008). This test offers two test statistics (Pesaran & Yamagata, 2008).
Δ ~ = N ( N 1 S ~ k 2 k )
Δ ~ a d j = N ( N 1 S ^ E ( z ~ i T ) V a r ( z ~ i T )   )

4.2. Panel Unit Root Test

The research employed Pesaran’s (2007) CADF test—a second-generation unit root test that addresses cross-sectional dependence—to analyze the stationarity of variables and their integration order. First-generation unit root tests like Maddala and Wu (1999), Levin et al. (2002), Choi (2001), and Im et al. (2003) ignore cross-sectional dependence. CADF regression can be shown as follows (Baltagi, 2013).
Δ y i t = α i + ρ i * y i , t 1 + d 0 y ¯ t 1 + d 1 Δ y ¯ t + ε i t
y ¯ t is the average of all N observations at time t. When CADF regression applies to each unit i in the panel, the CIPS statistic can be obtained as follows (Baltagi, 2013):
CIPS   =   1 N i = 1 N C A D F i

4.3. Panel Cointegration Test

This research did not employ Kao (1999) or Pedroni (1999, 2004) tests when examining cointegration, as these tests ignore cross-sectional dependence. Considering cross-sectional dependence, a Westerlund (2007) cointegration test was used to examine a co-integrating relationship. Westerlund (2007) cointegration test includes four test statistics: G t , G a , P t and P a . Choi (2015) stated that G t outperforms others regarding finite sample size. G t and G a represent the group mean test statistics. P t and P a represent panel test statistics.
G t =   1 N i = 1 N a ^ i S E ( a ^ i )
G a =   1 N i = 1 N T a ^ i   a ^ i ( 1 )
P t =   a ^ S E ( a ^ )
P a =   T a ^

4.4. The Augmented Mean Group (AMG)

This research employed the Augmented Mean Group (AMG) estimator developed by Eberhardt and Bond (2009) and Eberhardt and Teal (2010). The estimator’s preference stemmed from its consideration of cross-sectional dependence and heterogeneity. The AMG estimator has two stages. The first stage represents the standard FD-OLS regression. The second stage involves including μ ^ t in each N country regressions. The first and second stages are presented below (Eberhardt & Bond, 2009; Eberhardt & Teal, 2010).
Δ y i t = b Δ x i t + t = 2 T c t Δ D t + e i t = > c ^ t μ ^ t
y i t = α i +   b i x i t + c i t + d i μ ^ t + e i t
b ^ A M G = N 1 i b ^ i

4.5. Model Specification

The log-linear models estimated in the study are shown below.
Model-1 : lnT - C O 2 i t = α 0 + α 1 l n F P i t + a 2 l n M P i t + α 3 l n G D P i t + α 4 l n R E N i t + ε i t
Model-2 : lnC - C O 2 i t = β 0 + β 1 l n F P i t + β 2 l n M P i t + β 3 l n G D P i t + β 4 l n R E N i t + ε i t
Here, i denotes countries and t denotes the period. The dependent variables lnT- C O 2 i t and lnC- C O 2 i t represent territorial-based C O 2 i t emissions per capita and consumption-based C O 2 i t emissions per capita. The independent variables l n F P i t and l n M P i t represent government expenditures and broad money, respectively. The control variables are l n G D P i t and l n R E N i t , which represent real GDP per capita and renewable energy consumption per capita.

4.6. Variable Selection

This research examines the effects of monetary and fiscal policies on carbon emissions (territorial-based and consumption-based) in E-7 countries between 1996 and 2021. Fiscal policy is represented by government expenditures. According to the IMF’s (2014) GFS method, the variable includes goods and services, employee compensation, subsidies, consumption of fixed capital, interest, grants, social benefits, and other expenses. Monetary policy is represented using broad money. The reason for using broad money is that short-term interest rate data, which is frequently used as a monetary policy variable for some countries examined in this study, was unavailable. These variables (government expenditures for fiscal policy, and broad money for monetary policy) were selected as they are commonly used in the literature (Khan et al., 2025; Mahmood et al., 2022; Arjun & Mishra, 2025; Zeraibi et al., 2022), and data are available for the studied countries and time period.
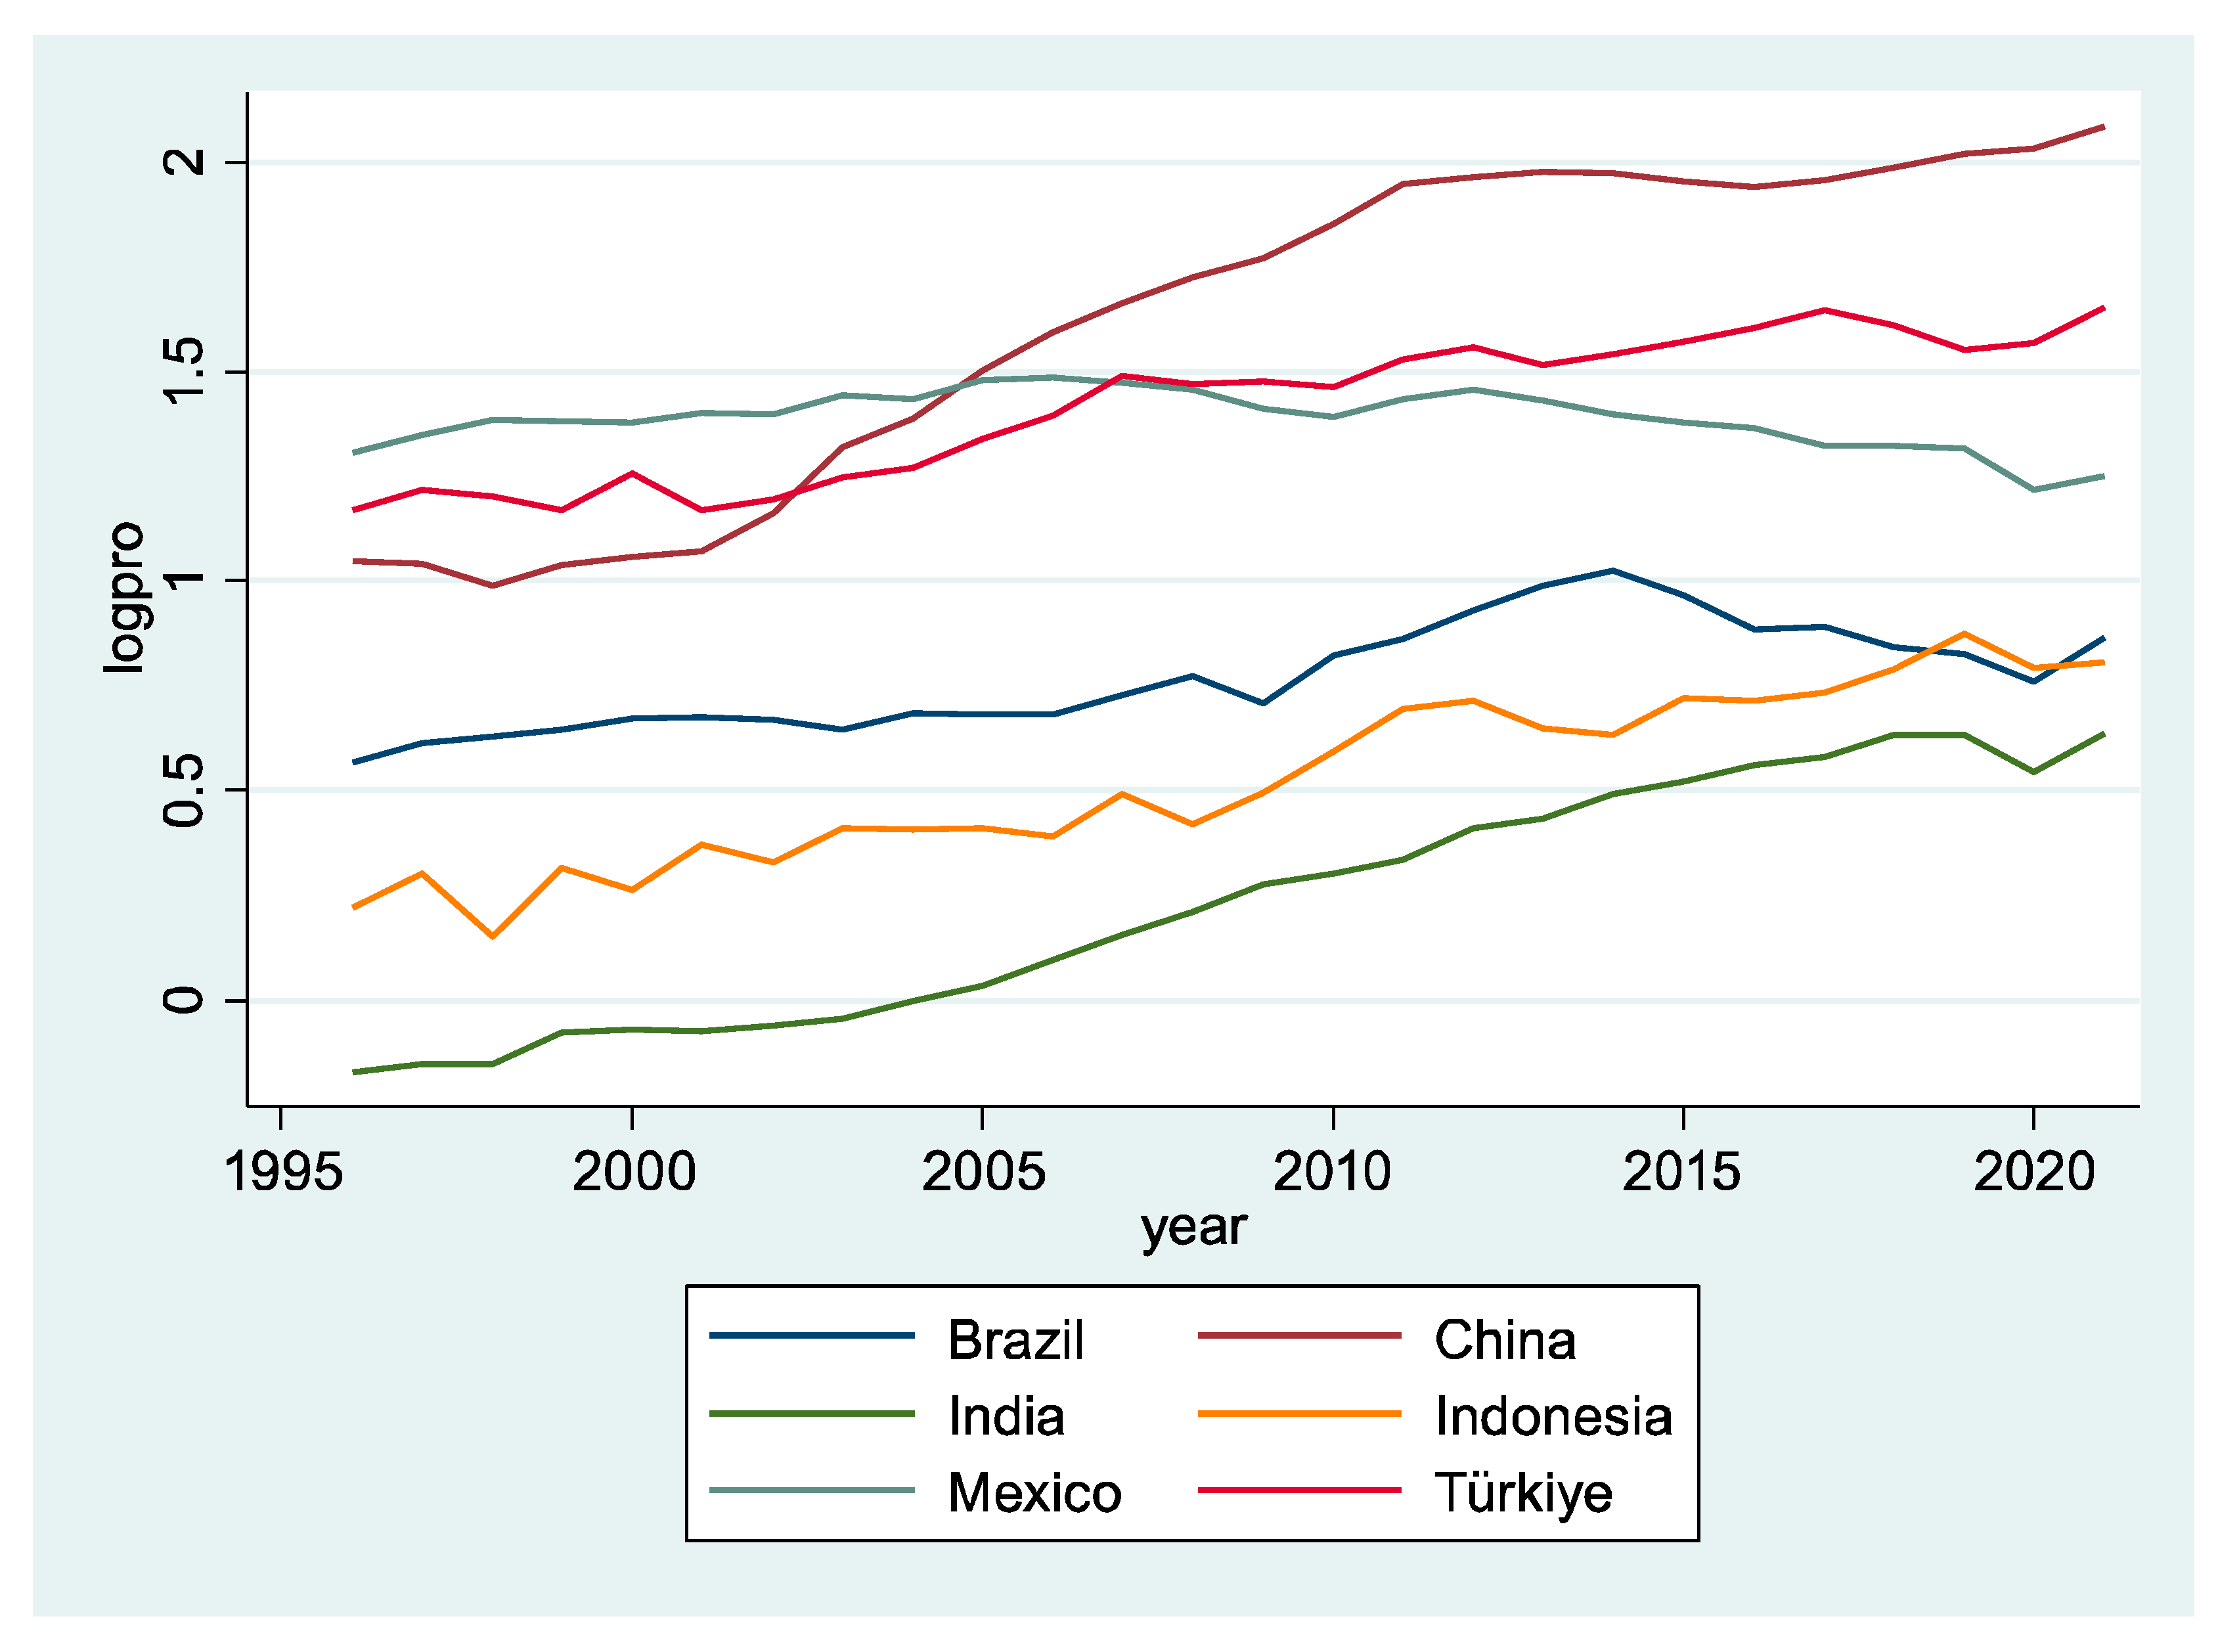
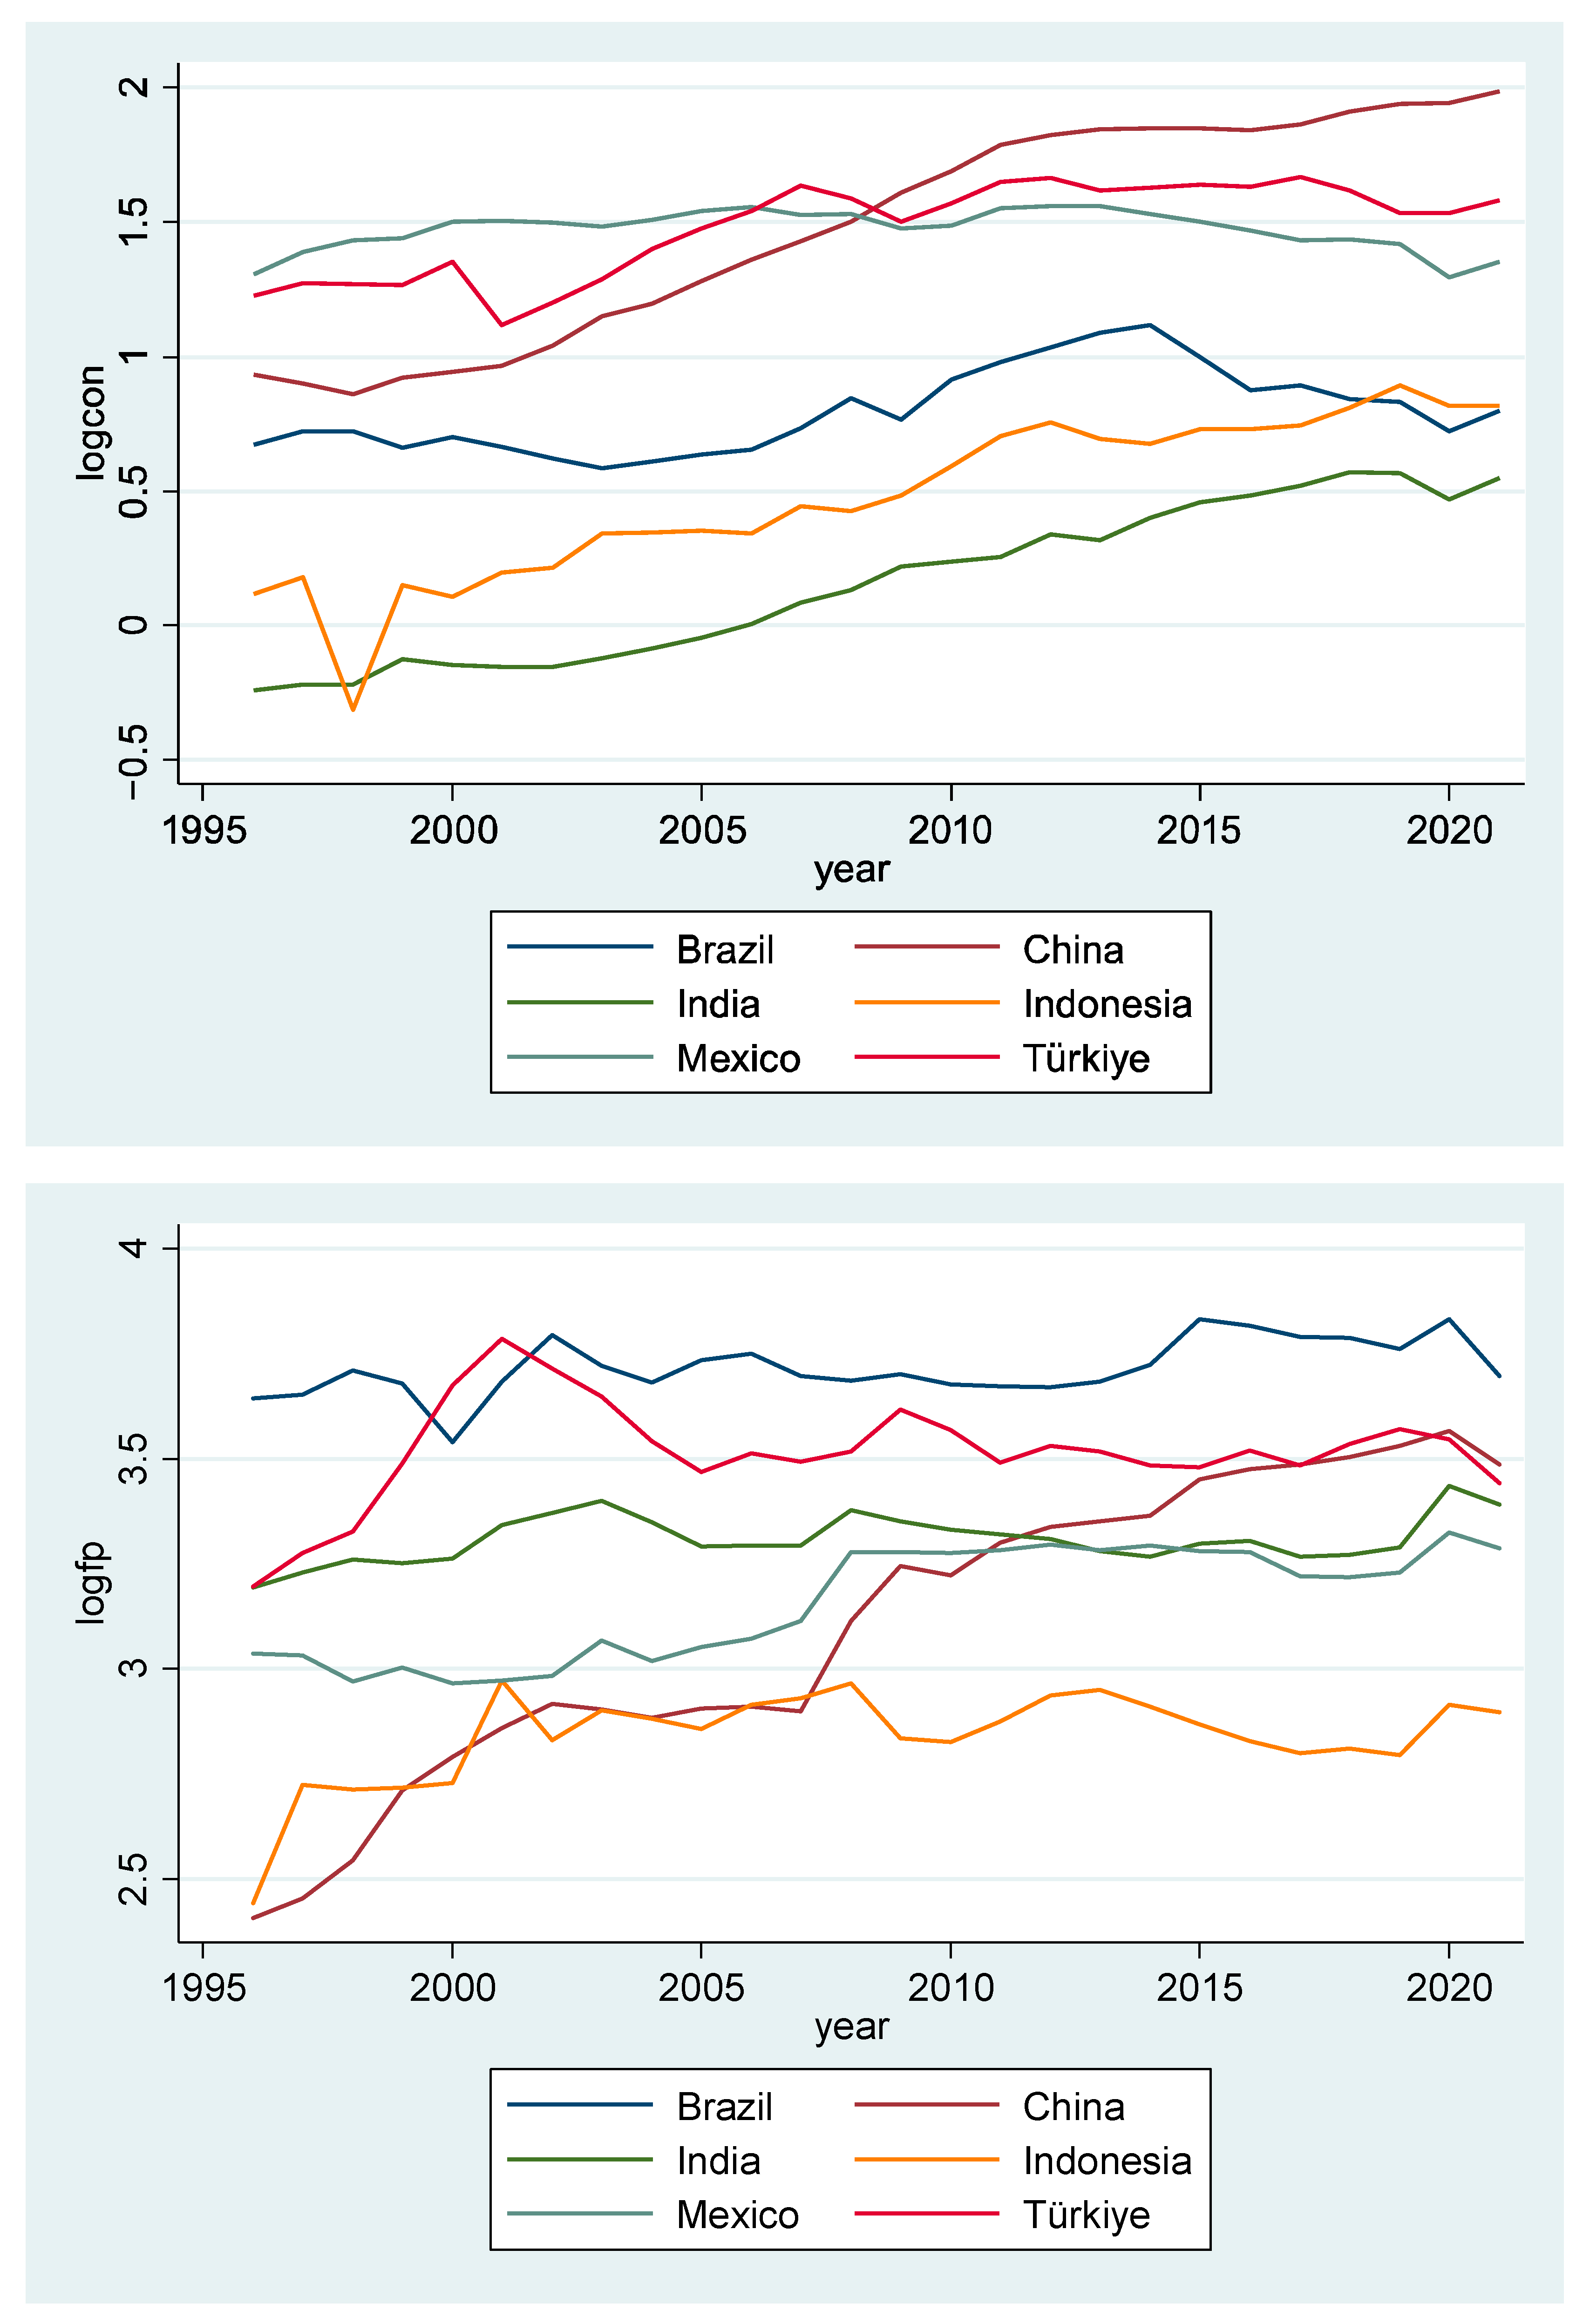
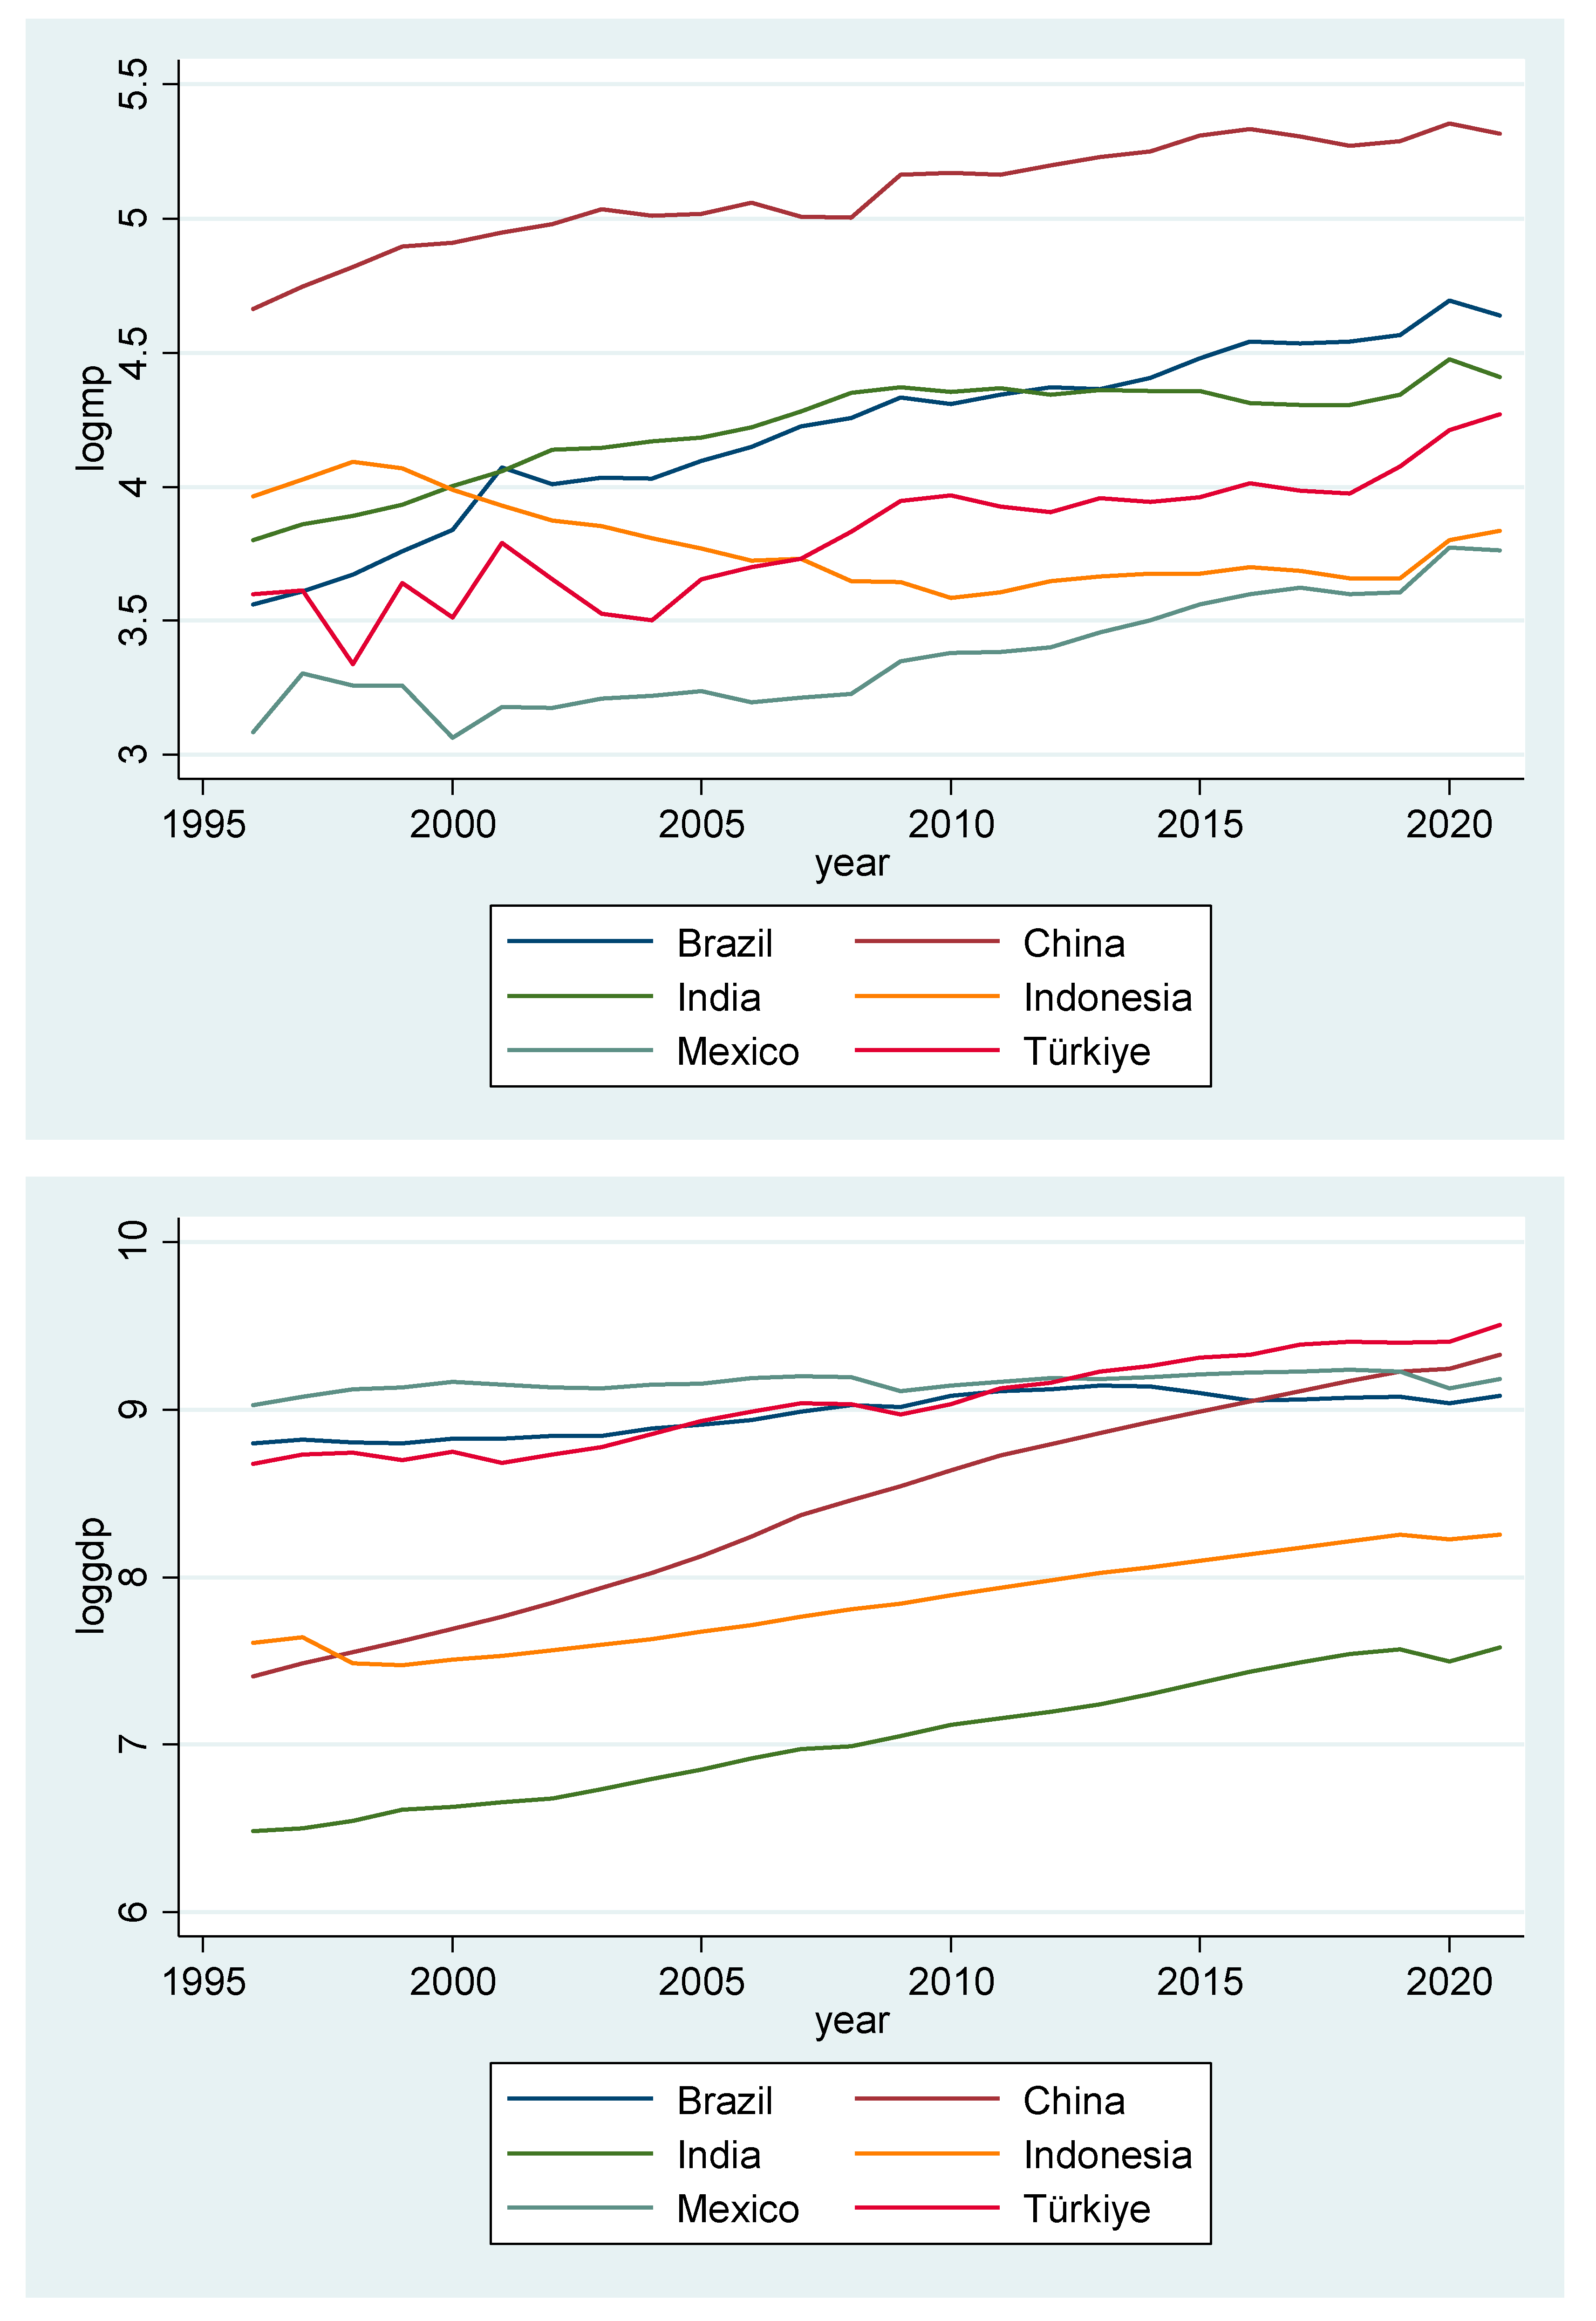
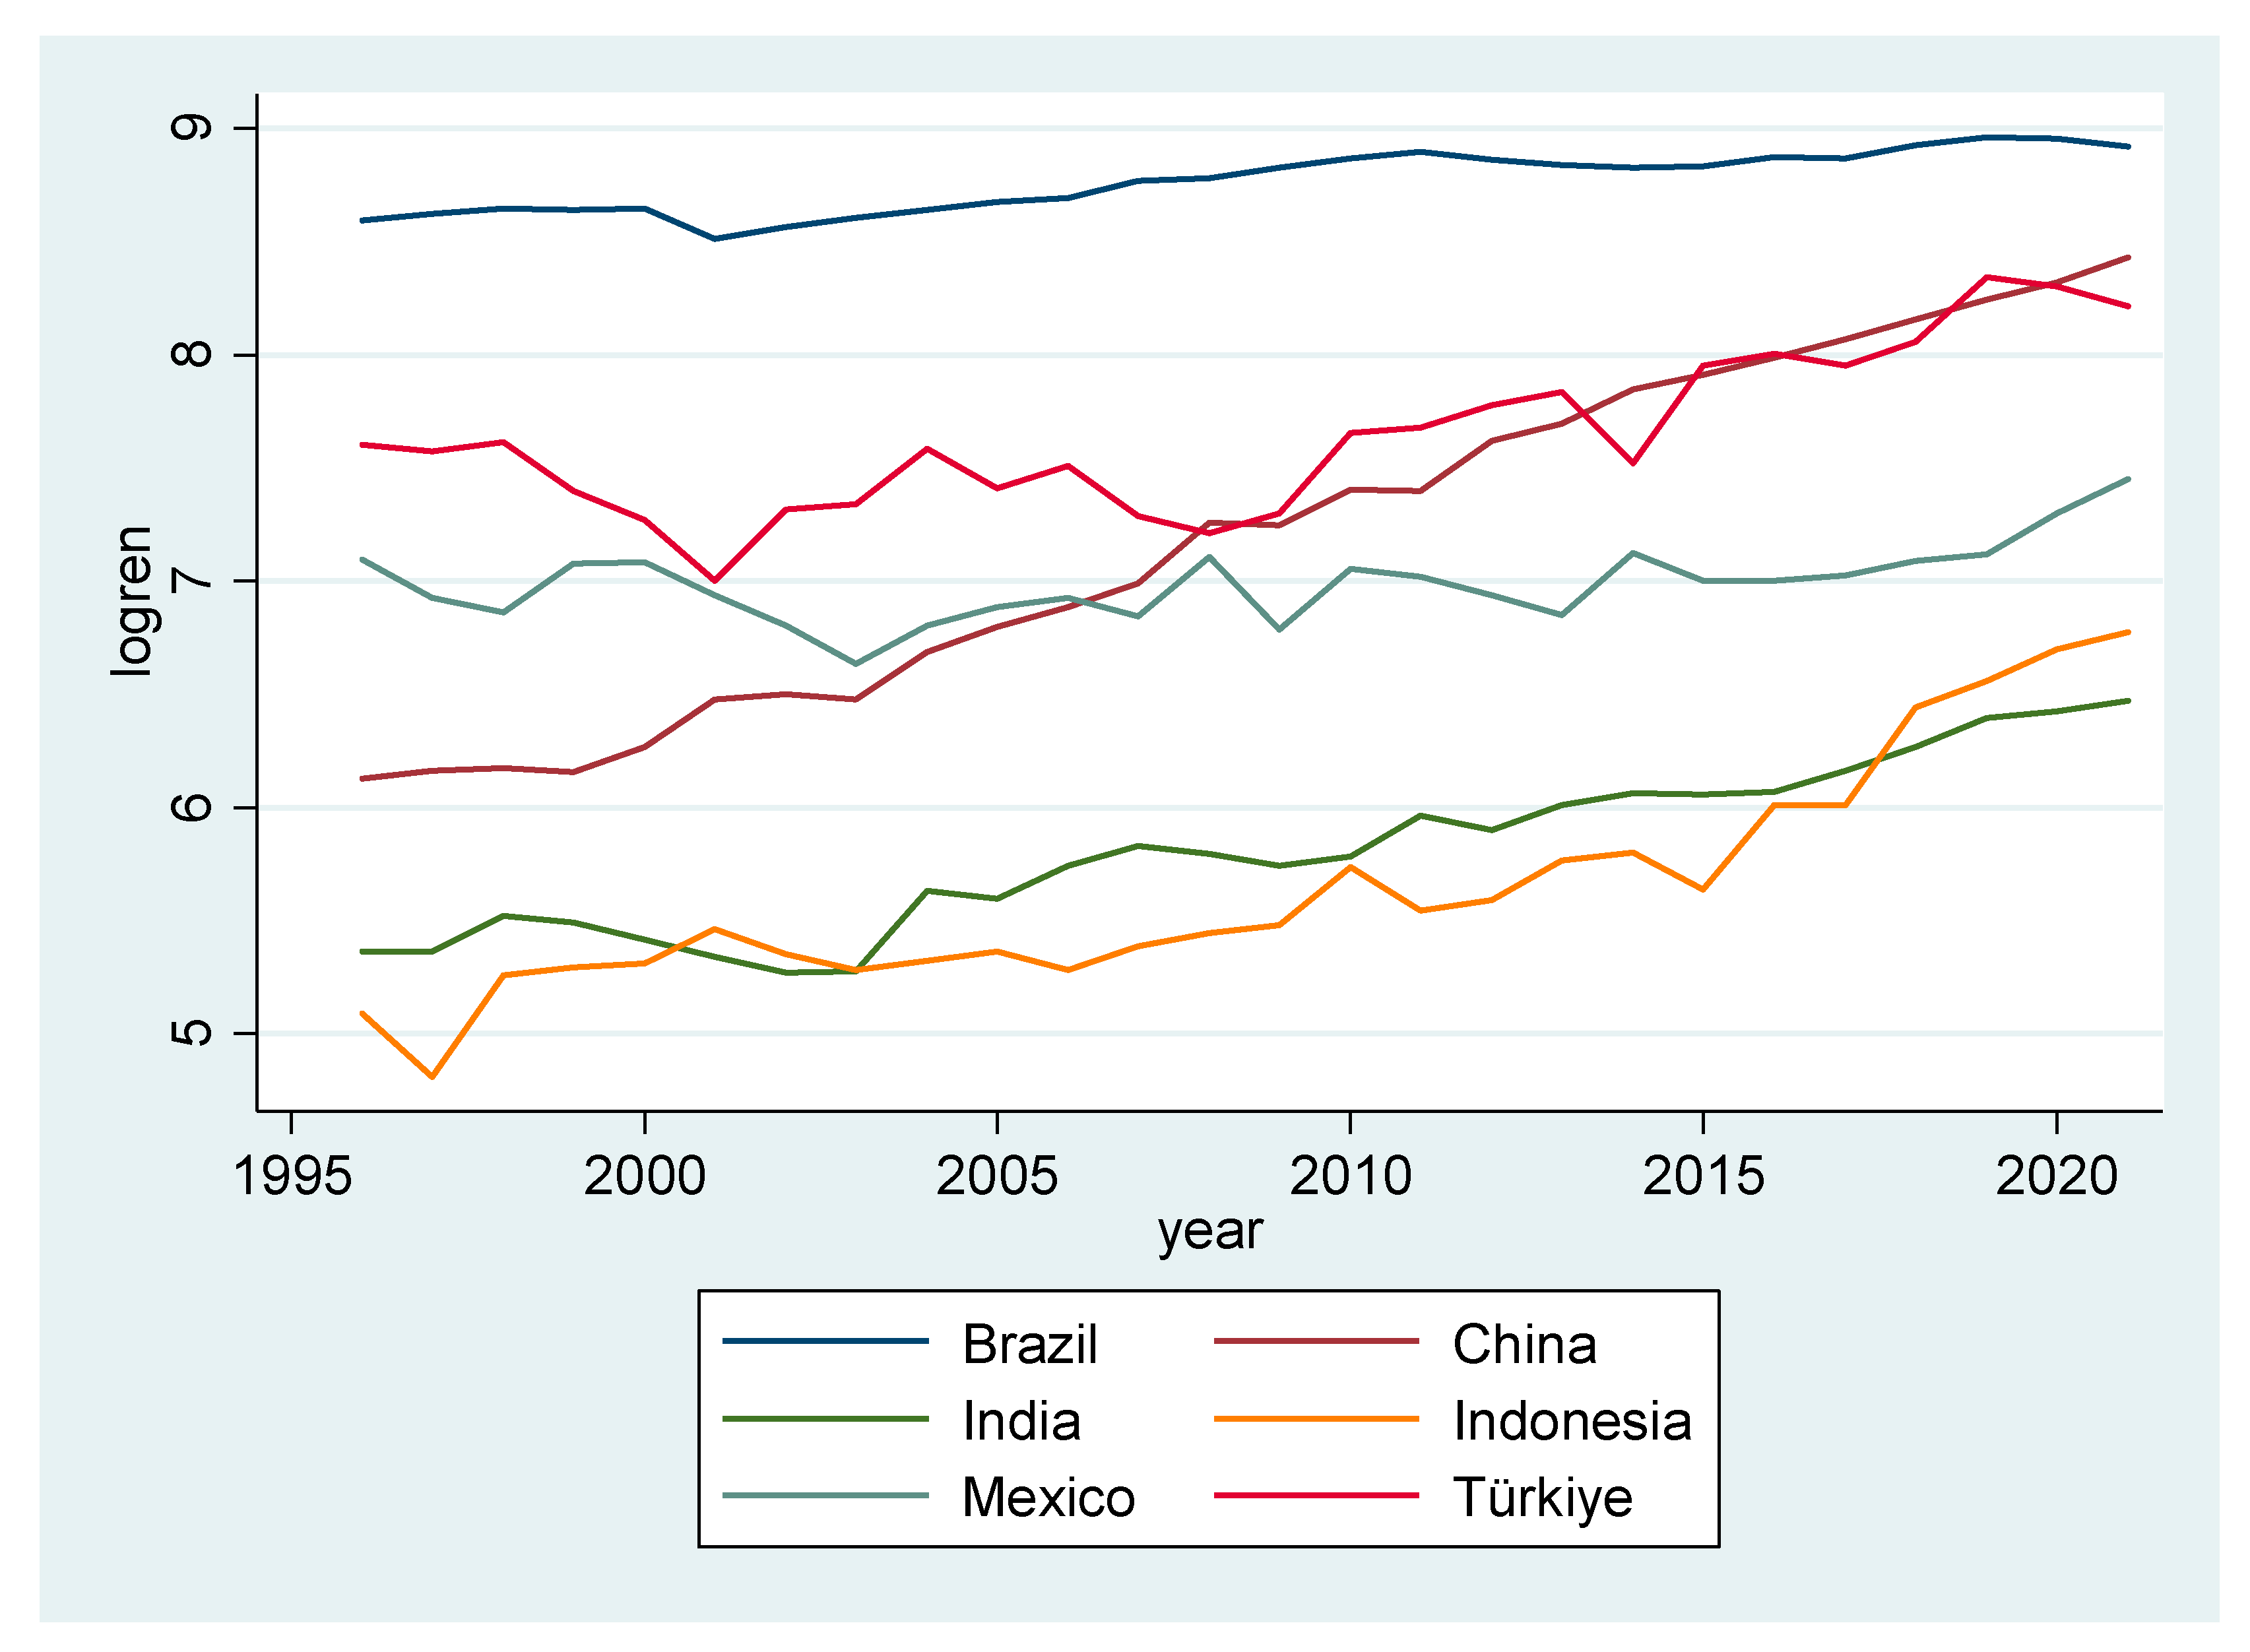
Real GDP and renewable energy consumption were included in the analysis as control variables. As a control variable, real GDP affects carbon emissions from territorial-based and consumption-based in both ways. Higher real GDP reduces territorial-based and consumption-based C O 2 by contributing to increased green investments and demand for green goods. However, a rise in real GDP also leads to higher carbon emissions from territorial-based and consumption-based via the need for fossil fuels because of excessive energy consumption (Marques et al., 2011). Regarding renewable energy consumption, another control variable, the increase in renewable energy consumption is expected to reduce territorial-based and consumption-based C O 2 . Table 3 lists the variables, their units, and their sources. The logarithms of all variables were used. Grafical depictions of the variables are provided in the Appendix A.

5. Empirical Results and Discussion

5.1. Descriptive Statistics

The descriptive statistics for the variables are shown in Table 4. The data reveals that government expenditures have the lowest, and renewable energy consumption has the highest standard deviation.

5.2. Cross-Sectional Dependence and Slope Homogeneity Test Results

Pesaran (2004) CD test results are presented in Table 5. It is observed that the hypothesis, H o : There is no cross-sectional dependence, is rejected and all variables have cross-sectional dependence.
Table 6 shows the Pesaran and Yamagata (2008) homogeneity test results. The hypothesis of homogeneous slope coefficients ( H o ) is rejected. The model displays heterogeneous slope parameters.

5.3. Panel Unit Root Test Results

Since the variables include cross-sectional dependence, the CADF unit root test developed by Pesaran (2007), one of the second-generation unit root tests, was preferred. Table 7 indicates that the null hypothesis of a unit root ( H o ) cannot be rejected, implying all variables are I(1). When the first differences of the variables are taken, it is observed that they become stationary.

5.4. Panel Cointegration Test Results

All variables in the analysis are stationary in their first differences. There may be a long-run relationship between them. The existence of a long-term relationship was checked by the Westerlund (2007) cointegration test. The analysis of Model 1 and Model 2 test results focused on robust p-values obtained via bootstrapping, which accounts for cross-sectional dependency. When the test results are examined in Table 8, the G t test statistic, which was stated by Choi (2015) to have better performance than the other test statistics in both models (Model 1 and Model 2), shows the existence of cointegration. Model 2 also exhibits cointegration at the 10% significance level, according to the P t test statistic.

5.5. The AMG Model Results

The research employed the AMG estimator, which accounts for cross-sectional dependency and heterogeneity. Table 9 shows the AMG estimation results.
Model 1, using territorial-based C O 2 emissions as the dependent variable, shows that government expenditures negatively impacts emissions, although this effect is statistically insignificant. A negative and statistically significant relationship exists between broad money and territorial-based C O 2 emissions. This findings support hypothesis H 1 . The control variable, real GDP, has a positive and statistically significant effect on territorial-based C O 2 emissions. Higher real GDP caused an increase in territorial-based C O 2 emissions. Renewable energy consumption, another control variable included in the analysis to show the effect of renewable energy sources, known for their environmental friendliness, on carbon emissions, has a negative and statistically significant effect on territorial-based C O 2 emissions. As expected, the increase in renewable energy consumption decreased territorial-based C O 2 emissions.
Model 2, using consumption-based C O 2 emissions as the dependent variable, shows that government expenditures negatively impacts these emissions, although not significantly. Broad money shows a statistically significant, negative effect on consumption-based C O 2 emissions. Hypothesis H 2 is also confirmed in the study. Real GDP significantly and positively impacts consumption-based C O 2 emissions. Consumption-based C O 2 emissions are negatively impacted by renewable energy consumption; however, this impact is not statistically significant.
Models 1 and 2 show that monetary policy decreases territorial-based C O 2 emissions and consumption-based C O 2 emissions. This result is unsurprising given the active role that developing countries’ central banks play in low-carbon transition (Dikau & Ryan-Collins, 2017). This situation is inevitable, especially for the E-7 countries. The E-7 countries of China and Brazil are especially rich in resources. However, the exploitation of these resources by developed economies has led to environmental damage. Due to carbon emissions resulting from environmental damage, central banks in China, Brazil, and other E-7 countries face greater challenges compared to those in developed countries (Barmes & Livingstone, 2021). These economies are more vulnerable to the effects of climate change, global warming, and extreme weather (Dikau & Ryan-Collins, 2017). This prompts central banks to take a more active role in the shift to a low-carbon economy. For example, in China, the largest E-7 economy, the People’s Bank of China (PBoC), due to its unique position in the Chinese economy, follows a policy defined as “window guidance”. This application helps the PBoC align loan sectors with its strategic plan, which is reviewed monthly in meetings with commercial banks. Here, directing the loans to the low-carbon sector is a priority (Campiglio, 2016). The People’s Bank of China (PBoC) has also implemented a carbon emission reduction facility to achieve its carbon neutrality target. The goal of this policy tool is to lower carbon emissions, foster clean energy, advance carbon reduction technologies, and safeguard the environment. These practices also function as a clear policy signal for low-carbon targets (People’s Bank of China, 2021). In India, loans to the renewable energy sector are included in the Reserve Bank of India (RBI)’s Priority Sector Lending Program. In 2008, the Banco Central do Brasil (BCB) introduced regulations to protect the environment by reducing loans to companies operating in the Amazon region (Dikau & Ryan-Collins, 2017).
Both models (Model 1 and Model 2) indicate that fiscal policy has a negative but not statistically significant effect on territorial-based C O 2 emissions and consumption-based C O 2 emissions. This situation is considered for E-7 economies, as these economies are emerging market economies and should maintain high growth rates. Fossil energy is crucial for their growth. However, each of these economies also has goals for reducing carbon emissions. It is difficult for governments to achieve these two conflicting objectives. Governments’ expenditures on fossil fuels for economic growth causes scale effects. Governments can also meet low-carbon targets by boosting demand for a better environment through spending (income effect), cutting pollution by increasing labor efficiency in education and health (technique effect), and promoting a shift to clean energy (composition effect). The statistical insignificance of the effect may be caused by the conflicting impacts of scale and the other effects (income, technique, and composition) on territorial-based C O 2 emissions. The statistically insignificant effect of government expenditures on consumption-based C O 2 emissions may stem from the income and environmental regulation channels balancing each other out. Even though this research found a statistically insignificant impact of fiscal policy on C O 2 emissions from territorial-based and consumption-based, it should support monetary policy, considering the high initial costs of green investments such as renewable energy.
Real GDP, which is included as a control variable in both models, increases territorial-based and consumption-based C O 2 emissions. Real GDP growth leads to more energy-intensive goods being demanded by producers and consumers, which then increases carbon emissions. Territorial-based C O 2 emissions were reduced by renewable energy consumption, as expected. Renewable energy consumption negatively affected consumption-based C O 2 emissions, but it was statistically insignificant. This can be explained because changes in consumption patterns take time to be seen.
These research results align with those of similar studies in the literature. According to Zeraibi et al. (2022), monetary policy in China decreased C O 2 levels. Mahmood et al. (2022) study showed that monetary policy negatively impacts both territorial-based and consumption-based C O 2 emissions. The study by Arjun and Mishra (2025) shows monetary policy as a tool for reducing environmental pollution. The US-specific study by Mu et al. (2025) found that monetary policy reduces carbon emissions in the long run.

5.6. Robustness Check

To verify the reliability of Models 1 and 2, which employed the AMG estimator, a robustness check was conducted. For this purpose, the CCEMG estimator developed by Pesaran (2006) was used. CCEMG’s estimation results for Model 1 and Model 2 are presented in Table 10 below.
When the CCEMG results for Model 1 are examined, they differ slightly from the AMG results, which serve as the base model. Territorial-based C O 2 emissions in CCEMG were negatively affected by fiscal policy at the 10% significance level. The impact of monetary policy on territorial-based C O 2 emissions was also negative, but not statistically significant. The real GDP, used as a control variable, positively and significantly impacted territorial-based C O 2 emissions. Renewable energy consumption, another control variable, had a negative and statistically insignificant effect on territorial-based C O 2 emissions.
Analysis of Model 2’s CCEMG results indicates a resemblance to those of the AMG base model. Fiscal policy’s impact on consumption-based C O 2 emissions is negative but not statistically significant. Monetary policy, however, has a negative and statistically significant effect on consumption-based C O 2 emissions. The control variable, real GDP, has a positive and statistically significant effect on consumption-based C O 2 emissions. Renewable energy consumption has a negative impact on consumption-based C O 2 emissions, though it is not statistically significant.

5.7. Dumitrescu and Hurlin Panel Causality Test Results

The AMG and CCEMG estimators predict the long-term relationship. However, they do not provide any clues about the causal relationship between the variables. Therefore, to determine whether the causal relationship between the variables supports the obtained results, the Dumitrescu and Hurlin (2012) causality test was performed in the study. The test results for both Model 1 and Model 2 are shown in Table 11 and Table 12 below.
For Model 1, examining the results of the Dumitrescu and Hurlin (2012) causality test reveals a bidirectional causal relationship between monetary policy- and territorial-based C O 2 emissions. No causal relationship was found between fiscal policy and territorial-based C O 2 emissions. While there is a bidirectional causality between the control variable, real GDP, and territorial-based C O 2 emissions, there is a unidirectional causality between the other control variable, renewable energy consumption, and territorial-based C O 2 emissions. The direction of causality is from territorial-based C O 2 emissions to renewable energy consumption. The causal interactions of the dependent, explanatory, and control variables confirm the AMG estimation outcomes.
Regarding Model 2, the results of the Dumitrescu and Hurlin (2012) causality test indicate a bidirectional relationship between monetary policy and consumption-based C O 2 emissions. There is no causal relationship between fiscal policy and consumption-based C O 2 emissions. The relationship between real GDP and consumption-based C O 2 is bidirectional, whereas that between renewable energy consumption and consumption-based C O 2 is unidirectional. AMG’s predictions are supported by the causal connections found in Model 2.

6. Conclusions

Global climate change poses a core challenge to economies today. This issue has prompted a global effort to find solutions. Many economies support the UN’s Sustainable Development Goals and the Paris Agreement on climate change. Achieving the set targets is a crucial duty of policymakers. Two primary tools (monetary policy and fiscal policy) are available to policymakers for their objectives.
This research evaluates the impact of monetary and fiscal policy on territorial-based and consumption-based C O 2 emissions in E-7 countries for the period 1996–2021. Research focuses on the E-7 because of their leading role in the world economy. Rapid growth characterizes these economies, and this expansion must continue. These economies need to achieve international climate targets (Paris Agreement) and their own national climate goals (including China’s aim for carbon neutrality by 2060 (Zhan et al., 2024). India has a carbon neutrality commitment for 2070 (Hossain et al., 2023). Türkiye has a net-zero emission target for 2053 (IDB, 2024). Brazil has a net-zero target for 2050, and Indonesia for 2060 (den Elzen et al., 2025). This situation creates a trade-off. Because of this trade-off, selecting the optimal policy mix is crucial for policymakers. Therefore, evaluating the effectiveness of macroeconomic policies on carbon emissions becomes inevitable.
The research began by examining cross-sectional dependency. Following this, a homogeneity test was performed. Since it was determined that the variables contained cross-sectional dependence, the CADF test, developed by Pesaran (2007) as one of the second-generation unit root tests, was performed. Given that all variables in the analysis exhibited unit roots, a Westerlund (2007) cointegration test was applied to examine a long-run relationship. After all these analyses were performed, the AMG estimator developed by Eberhardt and Bond (2009) and Eberhardt and Teal (2010), which considers cross-sectional dependency and heterogeneity, was used. Territorial-based and consumption-based C O 2 emissions are analyzed separately in this research. In both models, monetary policy is found to have a negative and statistically significant effect on both territorial- and consumption-based C O 2 emissions. The research control variable, real GDP, positively and significantly impacts territorial and consumption-based C O 2 emissions. Territorial-based C O 2 emissions are negatively and significantly influenced by renewable energy consumption, another control variable. Despite a negative effect on consumption-based C O 2 emissions from renewable energy consumption, this impact is statistically insignificant. Here, it is seen that investments in renewable energy sources reduce carbon emissions via territorial-based C O 2 emissions. The CCEMG estimator, developed by Pesaran (2006), was also used for robustness check. Finally, Dumitrescu and Hurlin (2012) causality test was performed. AMG and CCEMG estimators predict the long-term relationship. However, they do not provide any clues about the causal relationship between the variables. Model 1 and Model 2’s causality results confirmed AMG’s findings. The findings from Model 1 suggest a bidirectional relationship between monetary policy and territorial-based C O 2 emissions, while no causal link was observed between fiscal policy and territorial-based C O 2 emissions. Model 2 identified a bidirectional causal link between monetary policy and consumption-based C O 2 emissions, but no causal relationship was found between fiscal policy and consumption-based C O 2 emissions.
The research results also make it possible to draw some policy conclusions. First, monetary policy could reduce carbon emissions (territorial-based and consumption based) in the E-7 countries within the scope of the analysis. For policymakers in these economies, using monetary policy effectively to transition to a low-carbon economy is a rational policy option. Second, renewable energy consumption reduces territorial-based C O 2 emissions, clearly showing the role that investments in renewable energy sources play in achieving the targets set in international agreements. Third, policymakers can use fiscal policy as a supporting tool besides monetary policy to reduce carbon emissions. This research determined that the impact of fiscal policy on territorial and consumption-based C O 2 emissions was negative, though not statistically significant. However, given the limited financing resources in E-7 economies and the high initial costs of green investments, fiscal policy emerges as a factor that should not be overlooked. Thus, coordinating macroeconomic policies (monetary and fiscal) is crucial for policymakers in moving toward a low-carbon economy. Using a single policy instrument to achieve all goals can be a challenge.
This research also has shortcomings. First, data from Russia (an E-7 country) was unavailable; it was omitted from the analysis. Second, fiscal policy and monetary policy were represented by one variable. Due to the limited availability of fiscal and monetary policy data, a single variable was used. Third, the analyses focus solely on E-7 countries. A comparison with developed countries in other studies will reveal more comprehensive results.

Funding

This research received no external funding.

Institutional Review Board Statement

Not applicable.

Informed Consent Statement

Not applicable.

Data Availability Statement

The open access datasets employed in the analyses can be reached from the following links: https://databank.worldbank.org/source/world-development-indicators (accessed on 10 June 2024); https://ourworldindata.org/ (accessed on 15 June 2024); https://www.imf.org/external/datamapper/exp@FPP/USA/FRA/JPN/GBR/SWE/ESP/ITA/ZAF/IND (accessed on 15 June 2024).

Conflicts of Interest

The author declares no conflicts of interest.

Appendix A

Jrfm 19 00483 g001
Jrfm 19 00483 g002
Jrfm 19 00483 g003
Jrfm 19 00483 g004

References

  1. Anastasiou, D., Ballis, A., Guizani, A., Kallandranis, C., & Lakhal, F. (2024). Monetary policy impact on sustainability: Analyzing interest rates and corporate carbon emissions. Journal of Environmental Management, 368, 122119. [Google Scholar] [CrossRef] [PubMed]
  2. Arjun, & Mishra, B. R. (2025). Asymmetric role of environmental policy stringency, fiscal, and monetary policy on environmental sustainability: Evidence from BRICS-T countries. Natural Resources Forum, 49(2), 1187–1218. [Google Scholar] [CrossRef]
  3. Baltagi, B. H. (2013). Econometric analysis of panel data (5th ed.). John Wiley& Sons, Ltd. [Google Scholar]
  4. Barmes, D., & Livingstone, Z. (2021). The green central banking scorecard: How green are G20 central banks and financial supervisors? Positive money. Available online: https://positivemoney.org/publications/green-central-banking-scorecard/ (accessed on 7 April 2024).
  5. Baştürk, M. F. (2024). Does green finance reduce carbon emissions? Global evidence based on system generalized method of moments. Sustainability, 16(18), 8210. [Google Scholar] [CrossRef]
  6. Baştürk, M. F. (2025). Fiscal policy for mitigating carbon emissions worldwide evidence. Discover Sustainability, 6(1), 872. [Google Scholar] [CrossRef]
  7. Bletsas, K., Oikonomou, G., Panagiotidis, M., & Spyromitros, E. (2022). Carbon dioxide and greenhouse gas emissions: The role of monetary policy, fiscal policy, and institutional quality. Energies, 15(13), 4733. [Google Scholar] [CrossRef]
  8. Campiglio, E. (2016). Beyond carbon pricing: The role of banking and monetary policy in financing the transition to a low-carbon economy. Ecological Economics, 121, 220–230. [Google Scholar] [CrossRef]
  9. Chishti, M. Z., Ahmad, M., Rehman, A., & Khan, M. K. (2021). Mitigations pathways towards sustainable development: Assessing the influence of fiscal and monetary policies on carbon emissions in BRICS economies. Journal of Cleaner Production, 292, 126035. [Google Scholar] [CrossRef]
  10. Choi, I. (2001). Unit root tests for panel data. Journal of International Money and Finance, 20(2), 249–272. [Google Scholar] [CrossRef]
  11. Choi, I. (2015). Panel cointegration. In B. H. Baltagi (Ed.), The Oxford handbook of panel data. Oxford University Press. [Google Scholar]
  12. den Elzen, M. G. J., Dafnomilis, I., Nascimento, L., Beusen, A., Forsell, N., Gubbels, J., Harmsen, M., Hooijschuur, E., Araujo Gutiérrez, Z., & Kuramochi, T. (2025). Uncertainties around net-zero climate targets have major impact on greenhouse gas emissions projections. Annals of the New York Academy of Sciences, 1544(1), 209–222. [Google Scholar] [CrossRef] [PubMed]
  13. Dikau, S., & Ryan-Collins, J. (2017). Green central banking in emerging market and developing country economies. Available online: https://eprints.soas.ac.uk/24876/1/Green-Central-Banking.pdf (accessed on 5 June 2023).
  14. Dikau, S., & Volz, U. (2021). Central bank mandates, sustainability objectives and the promotion of green finance. Ecological Economics, 184, 107022. [Google Scholar] [CrossRef]
  15. Dinh, L. Q. (2025). The optimal inflation threshold in digital financial inclusion: A key to sustainable development. SN Business & Economics, 5(5), 40. [Google Scholar] [CrossRef]
  16. Dinh, L. Q., Oanh, T. T. K., & Ha, N. T. H. (2025). Financial stability and sustainable development: Perspectives from fiscal and monetary policy. International Journal of Finance & Economics, 30(2), 1724–1741. [Google Scholar] [CrossRef]
  17. Dumitrescu, E. I., & Hurlin, C. (2012). Testing for Granger non-causality in heterogeneous panels. Economic Modelling, 29(4), 1450–1460. [Google Scholar] [CrossRef]
  18. Eberhardt, M., & Bond, S. (2009). Cross-section dependence in nonstationary panel models: A novel estimator. MPRA paper No. 17870. Available online: https://mpra.ub.uni-muenchen.de/17870/ (accessed on 3 May 2023).
  19. Eberhardt, M., & Teal, F. (2010). Productivity analysis in global manufacturing production. Department of Economics Discussion Paper Series, No: 515. University of Oxford, Department of Economics. [Google Scholar]
  20. Fan, J. L., Hou, Y. B., Wang, Q., Wang, C., & Wei, Y. M. (2016). Exploring the characteristics of production-based and consumption-based carbon emissions of major economies: A multiple-dimension comparison. Applied Energy, 184, 790–799. [Google Scholar] [CrossRef]
  21. Franzen, A., & Mader, S. (2018). Consumption-based versus production-based accounting of CO2 emissions: Is there evidence for carbon leakage? Environmental Science & Policy, 84, 34–40. [Google Scholar] [CrossRef]
  22. Halkos, G. E., & Paizanos, E. A. (2013). The effect of government expenditure on the environment: An empirical investigation. Ecological Economics, 91, 48–56. [Google Scholar] [CrossRef]
  23. Halkos, G. E., & Paizanos, E. A. (2016). The effects of fiscal policy on CO2 emissions: Evidence from the USA. Energy Policy, 88, 317–328. [Google Scholar] [CrossRef]
  24. Hossain, M. S., Fang, Y. R., Ma, T., Huang, C., & Dai, H. (2023). The role of electric vehicles in decarbonizing India’s road passenger toward carbon neutrality and clean air: A state-level analysis. Energy, 273, 127218. [Google Scholar] [CrossRef]
  25. Huy, N. Q., & Dinh, L. Q. (2025). Balancing bank profits with sustainable development goals: Examining the pivotal role of financial stability. Sustainable Development, 33, 1182–1199. [Google Scholar] [CrossRef]
  26. IDB [İklim Değişikliği Başkanlığı]. (2024). İklim değişikliği azaltım stratejisi ve eylem planı (2024–2030). Available online: https://iklim.gov.tr/db/turkce/icerikler/files/%C4%B0klim%20De%C4%9Fi%C5%9Fikli%C4%9Fi%20Azalt%C4%B1m%20Stratejisi%20ve%20Eylem%20Plan%C4%B1%20(2024-2030).pdf (accessed on 4 May 2025).
  27. Im, K. S., Pesaran, M. H., & Shin, Y. (2003). Testing for unit roots in heterogeneous panels. Journal of Econometrics, 115(1), 53–74. [Google Scholar] [CrossRef]
  28. IMF. (2014). Government finance statistics manual 2014. Available online: https://www.imf.org/external/pubs/ft/gfs/manual/2014/gfsfinal.pdf (accessed on 2 January 2025).
  29. Isiksal, A. Z., Samour, A., & Resatoglu, N. G. (2019). Testing the impact of real interest rate, income, and energy consumption on Turkey’s CO2 emissions. Environmental Science and Pollution Research, 26(20), 20219–20231. [Google Scholar] [CrossRef] [PubMed]
  30. Jiang, Q., Khattak, S. I., Ahmad, M., & Ping, L. (2020). A new approach to environmental sustainability: Assessing the impact of monetary policy on CO2 emissions in Asian economies. Sustainable Development, 28(5), 1331–1346. [Google Scholar] [CrossRef]
  31. Kahuthu, A. (2006). Economic growth and environmental degradation in a global context. Environment, Development and Sustainability, 8(1), 55–68. [Google Scholar] [CrossRef]
  32. Kao, C. (1999). Spurious regression and residual-based tests for cointegration in panel data. Journal of Econometrics, 90(1), 1–44. [Google Scholar] [CrossRef]
  33. Khan, M. A., Zahir, S., Othman, N. S., & Awan, A. M. (2025). Exploring the synergies between natural resources, technological innovation, and fiscal and monetary policies for promoting environmental sustainability in ASEAN countries. Environment, Development and Sustainability, 1–30. [Google Scholar] [CrossRef]
  34. Kiani, T. A., Sabir, S., Qayyum, U., & Anjum, S. (2023). Estimating the effect of technological innovations on environmental degradation: Empirical evidence from selected ASEAN and SAARC countries. Environment, Development and Sustainability, 25(7), 6529–6550. [Google Scholar] [CrossRef]
  35. Lau, C. K., Patel, G., Mahalik, M. K., Sahoo, B. K., & Gozgor, G. (2024). Effectiveness of fiscal and monetary policies in promoting environmental quality: Evidence from five large emerging economies. Emerging Markets Finance and Trade, 60(1), 203–215. [Google Scholar] [CrossRef]
  36. Levin, A., Lin, C. F., & Chu, C. S. J. (2002). Unit root tests in panel data: Asymptotic and finite-sample properties. Journal of Econometrics, 108(1), 1–24. [Google Scholar] [CrossRef]
  37. Lin, B., & Benjamin, N. I. (2017). Influencing factors on carbon emissions in China transport industry. A new evidence from quantile regression analysis. Journal of Cleaner Production, 150, 175–187. [Google Scholar] [CrossRef]
  38. Lupu, I., Criste, A., Ciumara, T., Milea, C., & Lupu, R. (2024). Addressing the renewable energy challenges through the lens of monetary policy—Insights from the literature. Energies, 17(19), 4820. [Google Scholar] [CrossRef]
  39. Ma, B., Sharif, A., Bashir, M., & Bashir, M. F. (2023). The dynamic influence of energy consumption, fiscal policy and green innovation on environmental degradation in BRICST economies. Energy Policy, 183, 113823. [Google Scholar] [CrossRef]
  40. Maddala, G. S., & Wu, S. (1999). A comparative study of unit root tests with panel data and a new simple test. Oxford Bulletin of Economics and Statistics, 61(S1), 631–652. [Google Scholar] [CrossRef]
  41. Mahmood, H., Adow, A. H., Abbas, M., Iqbal, A., Murshed, M., & Furqan, M. (2022). The fiscal and monetary policies and environment in GCC countries: Analysis of territory and consumption-based CO2 emissions. Sustainability, 14(3), 1225. [Google Scholar] [CrossRef]
  42. Mar’I, M., Seraj, M., & Tursoy, T. (2023). The role of fiscal policy in G20 countries in the context of the environmental Kuznets curve hypothesis. Energies, 16(5), 2215. [Google Scholar] [CrossRef]
  43. Marques, A. C., Fuinhas, J. A., & Manso, J. P. (2011). A quantile approach to identify factors promoting renewable energy in European countries. Environmental and Resource Economics, 49(3), 351–366. [Google Scholar] [CrossRef]
  44. Mazzucato, M. (2021). Girişimci devlet kamu sektörü-özel sektör karşitliği masalinin çürütülmesi. Koç Üniversitesi Yayınları. [Google Scholar]
  45. Mu, H., Ramzan, M., Nassani, A. A., Awosusi, A. A., & Olanrewaju, V. O. (2025). Pathway towards decarbonization: How do renewable energy, natural gas consumption trade and monetary policy influence this pursuit? International Journal of Sustainable Development & World Ecology, 32(3), 279–294. [Google Scholar] [CrossRef]
  46. Mughal, N., Kashif, M., Arif, A., Guerrero, J. W. G., Nabua, W. C., & Niedbała, G. (2021). Dynamic effects of fiscal and monetary policy instruments on environmental pollution in ASEAN. Environmental Science and Pollution Research, 28(46), 65116–65126. [Google Scholar] [CrossRef] [PubMed]
  47. Oluklulu, S., & Kasal, S. (2025). What is the role of fiscal policy in reducing CO2 emissions? Evidence from different income groups. Humanities and Social Sciences Communications, 12(1), 591. [Google Scholar] [CrossRef]
  48. Omri, E., & Saadaoui, H. (2023). An empirical investigation of the relationships between nuclear energy, economic growth, trade openness, fossil fuels, and carbon emissions in France: Fresh evidence using asymmetric cointegration. Environmental Science and Pollution Research, 30(5), 13224–13245. [Google Scholar] [CrossRef] [PubMed]
  49. Pedroni, P. (1999). Critical values for cointegration tests in heterogeneous panels with multiple regressors. Oxford Bulletin of Economics and Statistics, 61(S1), 653–670. [Google Scholar] [CrossRef]
  50. Pedroni, P. (2004). Panel cointegration: Asymptotic and finite sample properties of pooled time series tests with an application to the PPP hypothesis. Econometric Theory, 20(3), 597–625. [Google Scholar] [CrossRef]
  51. People’s Bank of China. (2021). The People’s Bank of China launches the carbon emission reduction facility. Press release. People’s Bank of China. [Google Scholar]
  52. Pesaran, M. H. (2004). General diagnostic tests for cross section dependence in panels (CESifo working paper series, No. 1229). IZA Discussion Paper No. 1240. Available online: https://ssrn.com/abstract=572504 (accessed on 4 July 2024).
  53. Pesaran, M. H. (2006). Estimation and inference in large heterogeneous panels with a multifactor error structure. Econometrica, 74(4), 967–1012. [Google Scholar] [CrossRef]
  54. Pesaran, M. H. (2007). A simple panel unit root test in the presence of cross-section dependence. Journal of Applied Econometrics, 22(2), 265–312. [Google Scholar] [CrossRef]
  55. Pesaran, M. H., & Yamagata, T. (2008). Testing slope homogeneity in large panels. Journal of Econometrics, 142(1), 50–93. [Google Scholar] [CrossRef]
  56. Saboori, B., & Sulaiman, J. (2013). Environmental degradation, economic growth and energy consumption: Evidence of the environmental Kuznets curve in Malaysia. Energy Policy, 60, 892–905. [Google Scholar] [CrossRef]
  57. Sharma, V., Fatima, S., Alam, Q., & Bharadwaj, Y. P. (2023). Modelling the role of fiscal and monetary policy instruments on carbon emission in non-linear framework: A case of emerging economy. International Social Science Journal, 73(248), 435–461. [Google Scholar] [CrossRef]
  58. Tsompo, T., Sardianou, E., Horobet, A., Zambrano-Monserrate, M. A., & Kostakis, I. (2025). Balancing growth and sustainability: The impact of economic status, energy, trade and finance on the ecological footprint in selected ASEAN economies. Sustainability Analytics and Modeling, 5, 100041. [Google Scholar] [CrossRef]
  59. Udeagha, M. C., & Muchapondwa, E. (2023). Achieving regional sustainability and carbon neutrality target in Brazil, Russia, India, China, and South Africa economies: Understanding the importance of fiscal decentralization, export diversification and environmental innovation. Sustainable Development, 31(4), 2620–2635. [Google Scholar] [CrossRef]
  60. Van, H. N., Quoc, H. N., & Le, Q. D. (2025). Towards sustainable development: Drivers from financial and institutional development. Journal of Public Affairs, 25(3), e70073. [Google Scholar] [CrossRef]
  61. Weimin, Z., & Chishti, M. Z. (2021). Toward sustainable development: Assessing the effects of commercial policies on consumption and production-based carbon emissions in developing economies. Sage Open, 11(4), 21582440211061580. [Google Scholar] [CrossRef]
  62. Westerlund, J. (2007). Testing for error correction in panel data. Oxford Bulletin of Economics and Statistics, 69(6), 709–748. [Google Scholar] [CrossRef]
  63. Westerlund, J., & Edgerton, D. L. (2008). A simple test for cointegration in dependent panels with structural breaks. Oxford Bulletin of Economics and statistics, 70(5), 665–704. [Google Scholar] [CrossRef]
  64. Yousaf, U. S., Ali, F., Syed, S. H., Aziz, B., & Sarwar, S. (2022). Exploring environment sensitivity to fiscal and monetary policies in China: Using ecological footprints as a contemporary proxy. Environmental Science and Pollution Research, 29(24), 36412–36425. [Google Scholar] [CrossRef] [PubMed]
  65. Yuan, R., Masron, T. A., Chen, Y., & Azman, N. S. (2025). Government effectiveness on environmental degradation in developing countries. International Journal of Environmental Science and Technology, 22, 14279–14292. [Google Scholar] [CrossRef]
  66. Zeraibi, A., Ahmed, Z., Shehzad, K., Murshed, M., Nathaniel, S. P., & Mahmood, H. (2022). Revisiting the EKC hypothesis by assessing the complementarities between fiscal, monetary, and environmental development policies in China. Environmental Science and Pollution Research, 29(16), 23545–23560. [Google Scholar] [CrossRef] [PubMed]
  67. Zhan, J., Wang, C., Wang, H., Zhang, F., & Li, Z. (2024). Pathways to achieve carbon emission peak and carbon neutrality by 2060: A case study in the Beijing-Tianjin-Hebei region, China. Renewable and Sustainable Energy Reviews, 189, 113955. [Google Scholar] [CrossRef]
  68. Zhang, Y. J. (2011). The impact of financial development on carbon emissions: An empirical analysis in China. Energy Policy, 39(4), 2197–2203. [Google Scholar] [CrossRef]
  69. Zia, H. M. Y., Yang, W., Masood, A., Ahmed, A., & Aldawsari, S. H. (2025). Can money help to achieve the Paris agreement goal? The missing piece of the puzzle: How green monetary policy can bridge the emissions gap. Economic Analysis and Policy, 85, 494–529. [Google Scholar] [CrossRef]

Table 1. The effects of the monetary and fiscal policies on C O 2 emissions.
Territorial-Based C O 2 Consumption-Based C O 2
Monetary PolicyProducers’ investment decisionsConsumers’ consumption decisions
Fiscal PolicyIncome effect
Composition effect
Technique effect
Scale effect
Income channel
Environmental regulation channel
Composition of consumer goods
Table 2. Literature review of monetary and fiscal policies on carbon emissions.
Author/AuthorsCountry/CountriesPeriodMethodologyResults
Chishti et al. (2021)BRICS1985–2014OLS, DOLS, FMOLS, PMGContractionary monetary and fiscal policies reduce carbon emissions.
Lau et al. (2024)BRICS1990–2018PMG-ARDL, FMOLSExpansionary monetary and fiscal policies improve environmental quality.
Arjun and Mishra (2025)BRICS-T1990–2022FMOLS, DOLS, FE_OLS, MMQRMonetary policy reduces pollution.
Mughal et al. (2021)5 ASEAN countries1990–2019NARDLIn the long run, contractionary monetary policy and expansionary fiscal policy reduce carbon emissions.
Khan et al. (2025)10 ASEAN countries1980–2022ARDL/PMGMonetary and fiscal policies reduce carbon emissions.
Mahmood et al. (2022)GCC1990–2019PMG, FMOLS, DOLS Monetary policy has a negative long-term impact on both territorial and consumption-based emissions. Fiscal policy has a positive long-term impact on both territorial and consumption-based emissions.
Zeraibi et al. (2022)China1980–2018ARDLExpansionary monetary policy reduces carbon emissions. Expansionary fiscal policy increases carbon emissions.
Sharma et al. (2023)India1971–2019NARDLFiscal policy has a more significant effect on carbon emissions than monetary policy.
Table 3. Definitions of the variables.
VariablesSymbolUnitSource
Territorial-based C O 2 lnT- C O 2 Per capita tons per personOur World in Data
Consumption-based C O 2 lnC- C O 2 Per capita tons per personOur World in Data
Government expenditurelnFP(% of GDP)IMF
Broad money lnMP(% of GDP)WDI (World Bank)
Real GDP lnGDPPer capita (constant 2015 US$)WDI (World Bank)
Renewable energy consumptionlnRENPer capita (kilowatt-hours of primary energy per person)Our World in Data
Table 4. Descriptive statistics.
VariablesMeanStd. Dev.MinMaxObservationsGroupsTime
lnT- C O 2 0.9920.563−0.1732.082156626
lnC- C O 2 0.9760.591−0.3101.986156626
lnFP3.2730.3322.4063.832156626
lnMP4.0810.5813.0615.356156626
lnGDP8.4170.8356.4839.506156626
lnREN7.0081.1544.8088.962156626
Table 5. Cross-sectional dependency results.
VariableCD Testp-Value
lnT- C O 2 10.29 ***0.000
lnC- C O 2 11.43 ***0.000
lnFP8.07 ***0.000
lnMP6.77 ***0.000
lnGDP17.03 ***0.000
lnREN15.09 ***0.000
Note: *** shows significance at the %1 level.
Table 6. Homogeneity test results.
Model 1Model 2
TestTest StatisticsTest Statistics
Δ ~ 8.276 ***6.551 ***
Δ ~ a d j 9.437 ***7.469 ***
Note: *** shows significance at the %1 level.
Table 7. Panel unit root test results.
SeriesLevelFirst DifferenceIntegration Order
lnT- C O 2 −2.235−4.450 ***I(1)
lnC- C O 2 −2.768−4.745 ***I(1)
lnFP−2.121−4.144 ***I(1)
lnMP−2.612−4.592 ***I(1)
lnGDP−2.602−3.652 ***I(1)
lnREN−2.595−5.612 ***I(1)
Note: ***, **, * indicate 1%, 5%, 10% significance levels, respectively.
Table 8. Cointegration test results.
Model 1Model 2
StatisticsValuesRobust p-ValuesValuesRobust p-Values
G t −3.2880.000−3.0360.000
G a −1.7670.650−1.7440.670
P t −2.8680.460−4.4350.070
P a −1.1160.710−1.6090.440
Note: ***, **, * indicate 1%, 5%, 10% significance levels, respectively.
Table 9. AMG estimation results.
Model 1Model 2
Coeffp-ValueCoeffp-Value
lnFP−0.0610.262−0.0220.748
lnMP−0.140 **0.034−0.280 ***0.000
lnGDP0.792 ***0.0001.190 ***0.000
lnREN−0.140 *0.058−0.0710.199
constant−3.842 ***0.002−7.374 ***0.000
Note: ***, **, * indicate 1%, 5%, 10% significance levels, respectively.
Table 10. CCEMG test results.
Model 1Model 2
Coeffp-ValueCoeffp-Value
lnFP−0.153 *0.093−0.0530.341
lnMP−0.1990.114−0.360 **0.029
lnGDP0.774 ***0.0021.153 ***0.000
lnREN−0.1280.391−0.0370.753
constant2.0000.5850.1000.978
Note: ***, **, * indicate 1%, 5%, 10% significance levels, respectively.
Table 11. Dumitrescu and Hurlin panel causality test results for Model 1.
Null HypothesisW-StatZbar Tildep-ValueConclusion
InFP → InT- C O 2 1.6190.7560.449no causality
InT- C O 2 → InFP1.7981.0170.308
InMP → InT- C O 2 4.269 ***4.6200.000
InT- C O 2 → InMP3.553 ***3.5770.000
InGDP → InT- C O 2 4.590 ***5.0870.000
InT- C O 2 → InGDP3.493 ***3.4890.000
InREN → InT- C O 2 1.8231.0550.291
InT- C O 2 → InREN3.637 ***3.6990.000
Note: ***, **, * indicate 1%, 5%, 10% significance levels, respectively. ↔ represents two-way causality association, → one-way causality association.
Table 12. Dumitrescu and Hurlin panel causality test results for Model 2.
Null HypothesisW-StatZbar Tildep-ValueConclusion
InFP → InC- C O 2 1.2040.1510.879no causality
InC- C O 2 → InFP1.4780.5520.580
InMP → InC- C O 2 3.271 ***3.1640.001
InC- C O 2 → InMP2.950 ***2.6970.007
InGDP → InC- C O 2 4.605 ***5.1090.000
InC- C O 2 → InGDP2.505 **2.0490.040
InREN → InC- C O 2 1.9981.3100.190
InC- C O 2 → InREN2.409 *1.9080.056
Note: ***, **, * indicate 1%, 5%, 10% significance levels, respectively. ↔ represents two-way causality association, → one-way causality association.
Disclaimer/Publisher’s Note: The statements, opinions and data contained in all publications are solely those of the individual author(s) and contributor(s) and not of MDPI and/or the editor(s). MDPI and/or the editor(s) disclaim responsibility for any injury to people or property resulting from any ideas, methods, instructions or products referred to in the content.