4. Materials and Methods
This study is based on the processing of financial data extracted from the Orbis Europe Full platform, managed by Moody’s. The survey covers the period 2014–2023 and analyses a sample of 59 listed energy companies. The dataset is structured as an unbalanced panel, as the availability of ESG data and economic and financial variables is inconsistent across companies and years under consideration. Some firms are therefore only present in specific time periods, depending on the availability of information in the databases used, particularly for ESG ratings extracted from Yahoo Finance. The empirical analyses are conducted using firm-year observations, consistent with the dataset’s unbalanced panel structure. Any descriptive aggregations by country are used solely for illustrative and exploratory purposes and should not be interpreted as macroeconomic indicators or structural comparisons between national economies.
The dataset used in the inferential analyses is structured at the firm-year level. Economic and financial indicators, such as ROE, ROA, ROCE, and financial leverage, vary annually over the period 2014–2023, whilst the ESG rating available on Yahoo Finance is associated with the individual firm and is held constant across annual observations for the same company. This approach preserves the temporal variability of economic and financial indicators. However, the presence of repeated observations for the same firm may generate intra-firm correlation. Therefore, the inferential results are interpreted in an exploratory and associative manner and not as definitive causal evidence.
The study analyses the following economic and financial performance ratios:
The economic and financial data collected were subjected to a preliminary descriptive statistical analysis. The aim is to synthesise the distributions of the main performance and sustainability indicators using fundamental descriptive statistics, such as the mean, median, standard deviation, sample variance, skewness, minimum, and maximum values (
Hair et al., 2019). These statistics provide a preliminary picture of the dataset’s dispersion and heterogeneity, offering methodological support for subsequent inferential analysis. To reduce the influence of outliers on statistical and econometric analyses, the economic and financial variables under consideration were winsorised at the 5th and 95th percentiles. Values below the 5th and above the 95th percentile, in particular, were capped at their respective thresholds, thereby preserving the sample size and limiting potential distortion of the descriptive statistics and econometric estimates. All the econometric analyses presented in the following sections (Correlation, OLS regression and SEM) were carried out using the winsorised variables.
Regarding the dependent variable, each company included in the sample was assigned an ESG rating (ESG rating), derived from the collection and standardisation of data available on the Yahoo Finance platform, a platform used in several recent empirical studies to analyse the relationship between sustainability and economic performance (
He et al., 2023). Although less comprehensive than specialised databases (Refinitiv, Bloomberg, MSCI), Yahoo Finance provides standardised and comparable data, ideal for international comparative analysis. The choice of this source is motivated by its widespread use in recent empirical research and the availability of consistent ESG data across the entire sample analysed (
Shobhwani & Lodha, 2023;
Balan et al., 2026).
The ESG scores used in this study are derived from sustainability data available on Yahoo Finance and are interpreted as an ESG risk rating. Under this metric, higher values indicate a greater level of unmanaged ESG risk, whilst lower values indicate a more favourable ESG profile. Therefore, the ESG rating is not interpreted as a direct measure of ‘better ESG performance’, but rather as a proxy for the company’s overall ESG risk. Consequently, in the empirical analyses, a positive coefficient indicates an association with higher ESG risk, whilst a negative coefficient indicates an association with lower ESG risk.
This choice, however, entails certain methodological limitations, particularly regarding the transparency of the criteria used to construct the ratings and their comparability with those of other specialised ESG providers. The results must therefore be interpreted with due caution. Future research could replicate the analysis using ESG scores from specialised providers to assess the robustness of the observed associations.
To analyse the relationships between ESG ratings and economic and financial performance indicators, a multi-method approach was adopted, comprising three complementary statistical techniques: correlation analysis, OLS multiple regression, and path analysis using structural equation modelling (SEM) (
Hair et al., 2019). This approach should not be interpreted as a hierarchical progression towards causal identification, but rather as a set of different analytical tools used to observe the phenomenon from complementary statistical perspectives. The aim is to provide a more detailed representation of the interdependencies between economic and financial variables and ESG ratings.
The initial phase was devoted to multiple correlation analysis. This technique enabled us to map the interrelationships among all the variables and quantify the strength and direction of the linear associations. This exploratory approach is useful for identifying potential multicollinearity issues (
O’Brien, 2007) and for providing a preliminary picture of the statistical relationships among the variables under consideration.
- 2.
Multiple Regression (OLS)
Subsequently, multiple regression (OLS) was applied, an inferential technique widely used in econometric analysis (
Hair et al., 2019). Regression was used to estimate the statistical associations between a set of independent accounting variables (ROE, ROA, ROCE and financial leverage) and the ESG rating (dependent variable). This phase provided a quantitative measure of the association between each explanatory factor and the ESG rating, offering an initial interpretative framework of the linear relationships between the variables (hypothesis H1).
- 3.
Structural Equation Modelling (SEM)
The adopted SEM model incorporates a path analysis structure, allowing simultaneous analysis of relationships between observed variables and latent constructs within a unified structural framework (
Anderson & Gerbing, 1988).
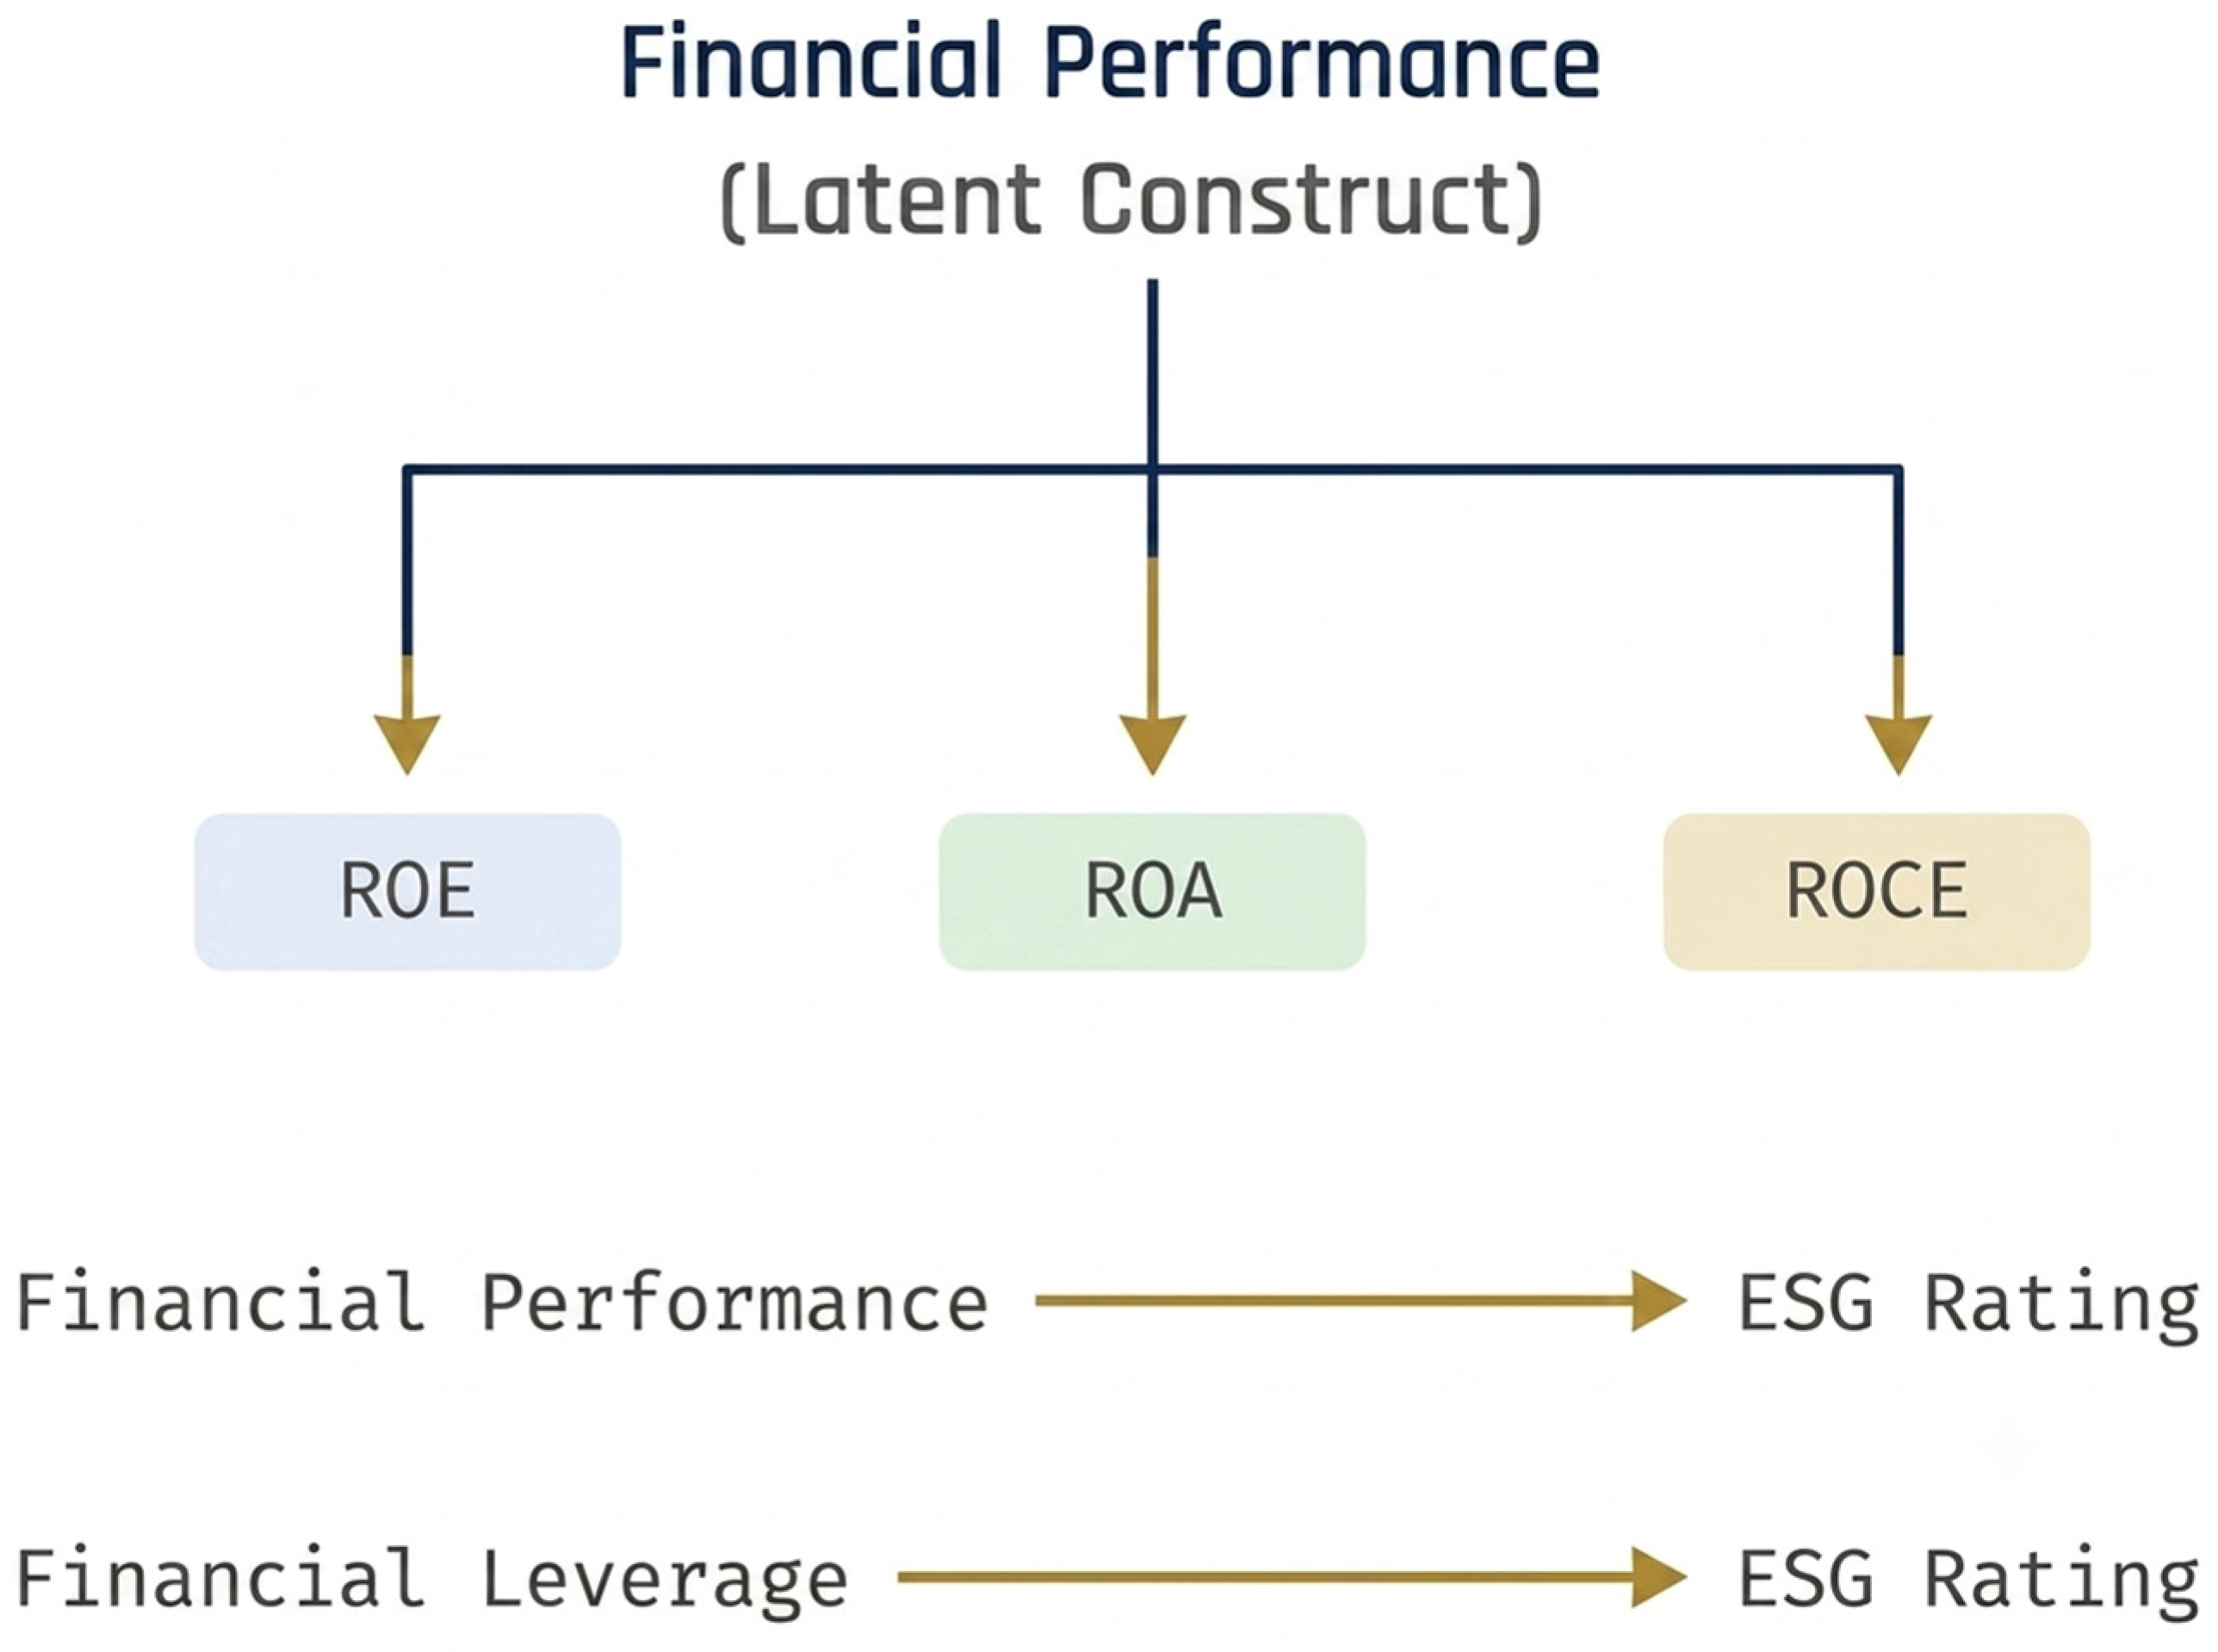
In the proposed model, a latent variable termed ‘economic performance’ was defined and measured using the ROE, ROA, and ROCE indicators. The structural model was used to analyse the relationships among economic performance, financial leverage, and ESG ratings.
The model’s fit was assessed using the main fit indices commonly employed in the SEM literature, including the Comparative Fit Index (CFI), Tucker–Lewis Index (TLI), Root Mean Square Error of Approximation (RMSEA) and Standardised Root Mean Square Residual (SRMR) (
Hair et al., 2019).
The combined use of these techniques therefore allows for the integration of descriptive, inferential and structural evidence, offering a more nuanced understanding of the relationships between sustainability and economic and financial performance in the European energy sector (
Hair et al., 2019).
5. Descriptive Analysis of the Sample
ESG (environmental, social and governance) criteria are becoming increasingly important in shaping the industrial and financial strategies of the European energy sector. In line with the objectives of the European Green Deal and the energy transition directives, companies in the sector are called upon to financial statments profitability with environmental sustainability. The progressive decarbonisation of energy sources, the development of renewable energy and the adoption of energy-efficiency technologies are all outcomes of a focus on the environment. The sector is responsible for ensuring managerial transparency, ethical conduct, and compliance with EU regulations, whilst, at a social level, it is committed to providing safe working conditions, inclusion, and equitable access to energy.
This study examines the relationship between economic and financial performance and ESG ratings in the European energy sector, with a particular focus on the role of these practices in supporting a sustainable transition, operational efficiency and a reduction in environmental impact. Between 2014 and 2023, 59 listed companies operating in the European energy sector were selected, based on the availability of certified ESG ratings in the Yahoo Finance databases.
A sectoral analysis of the sample (
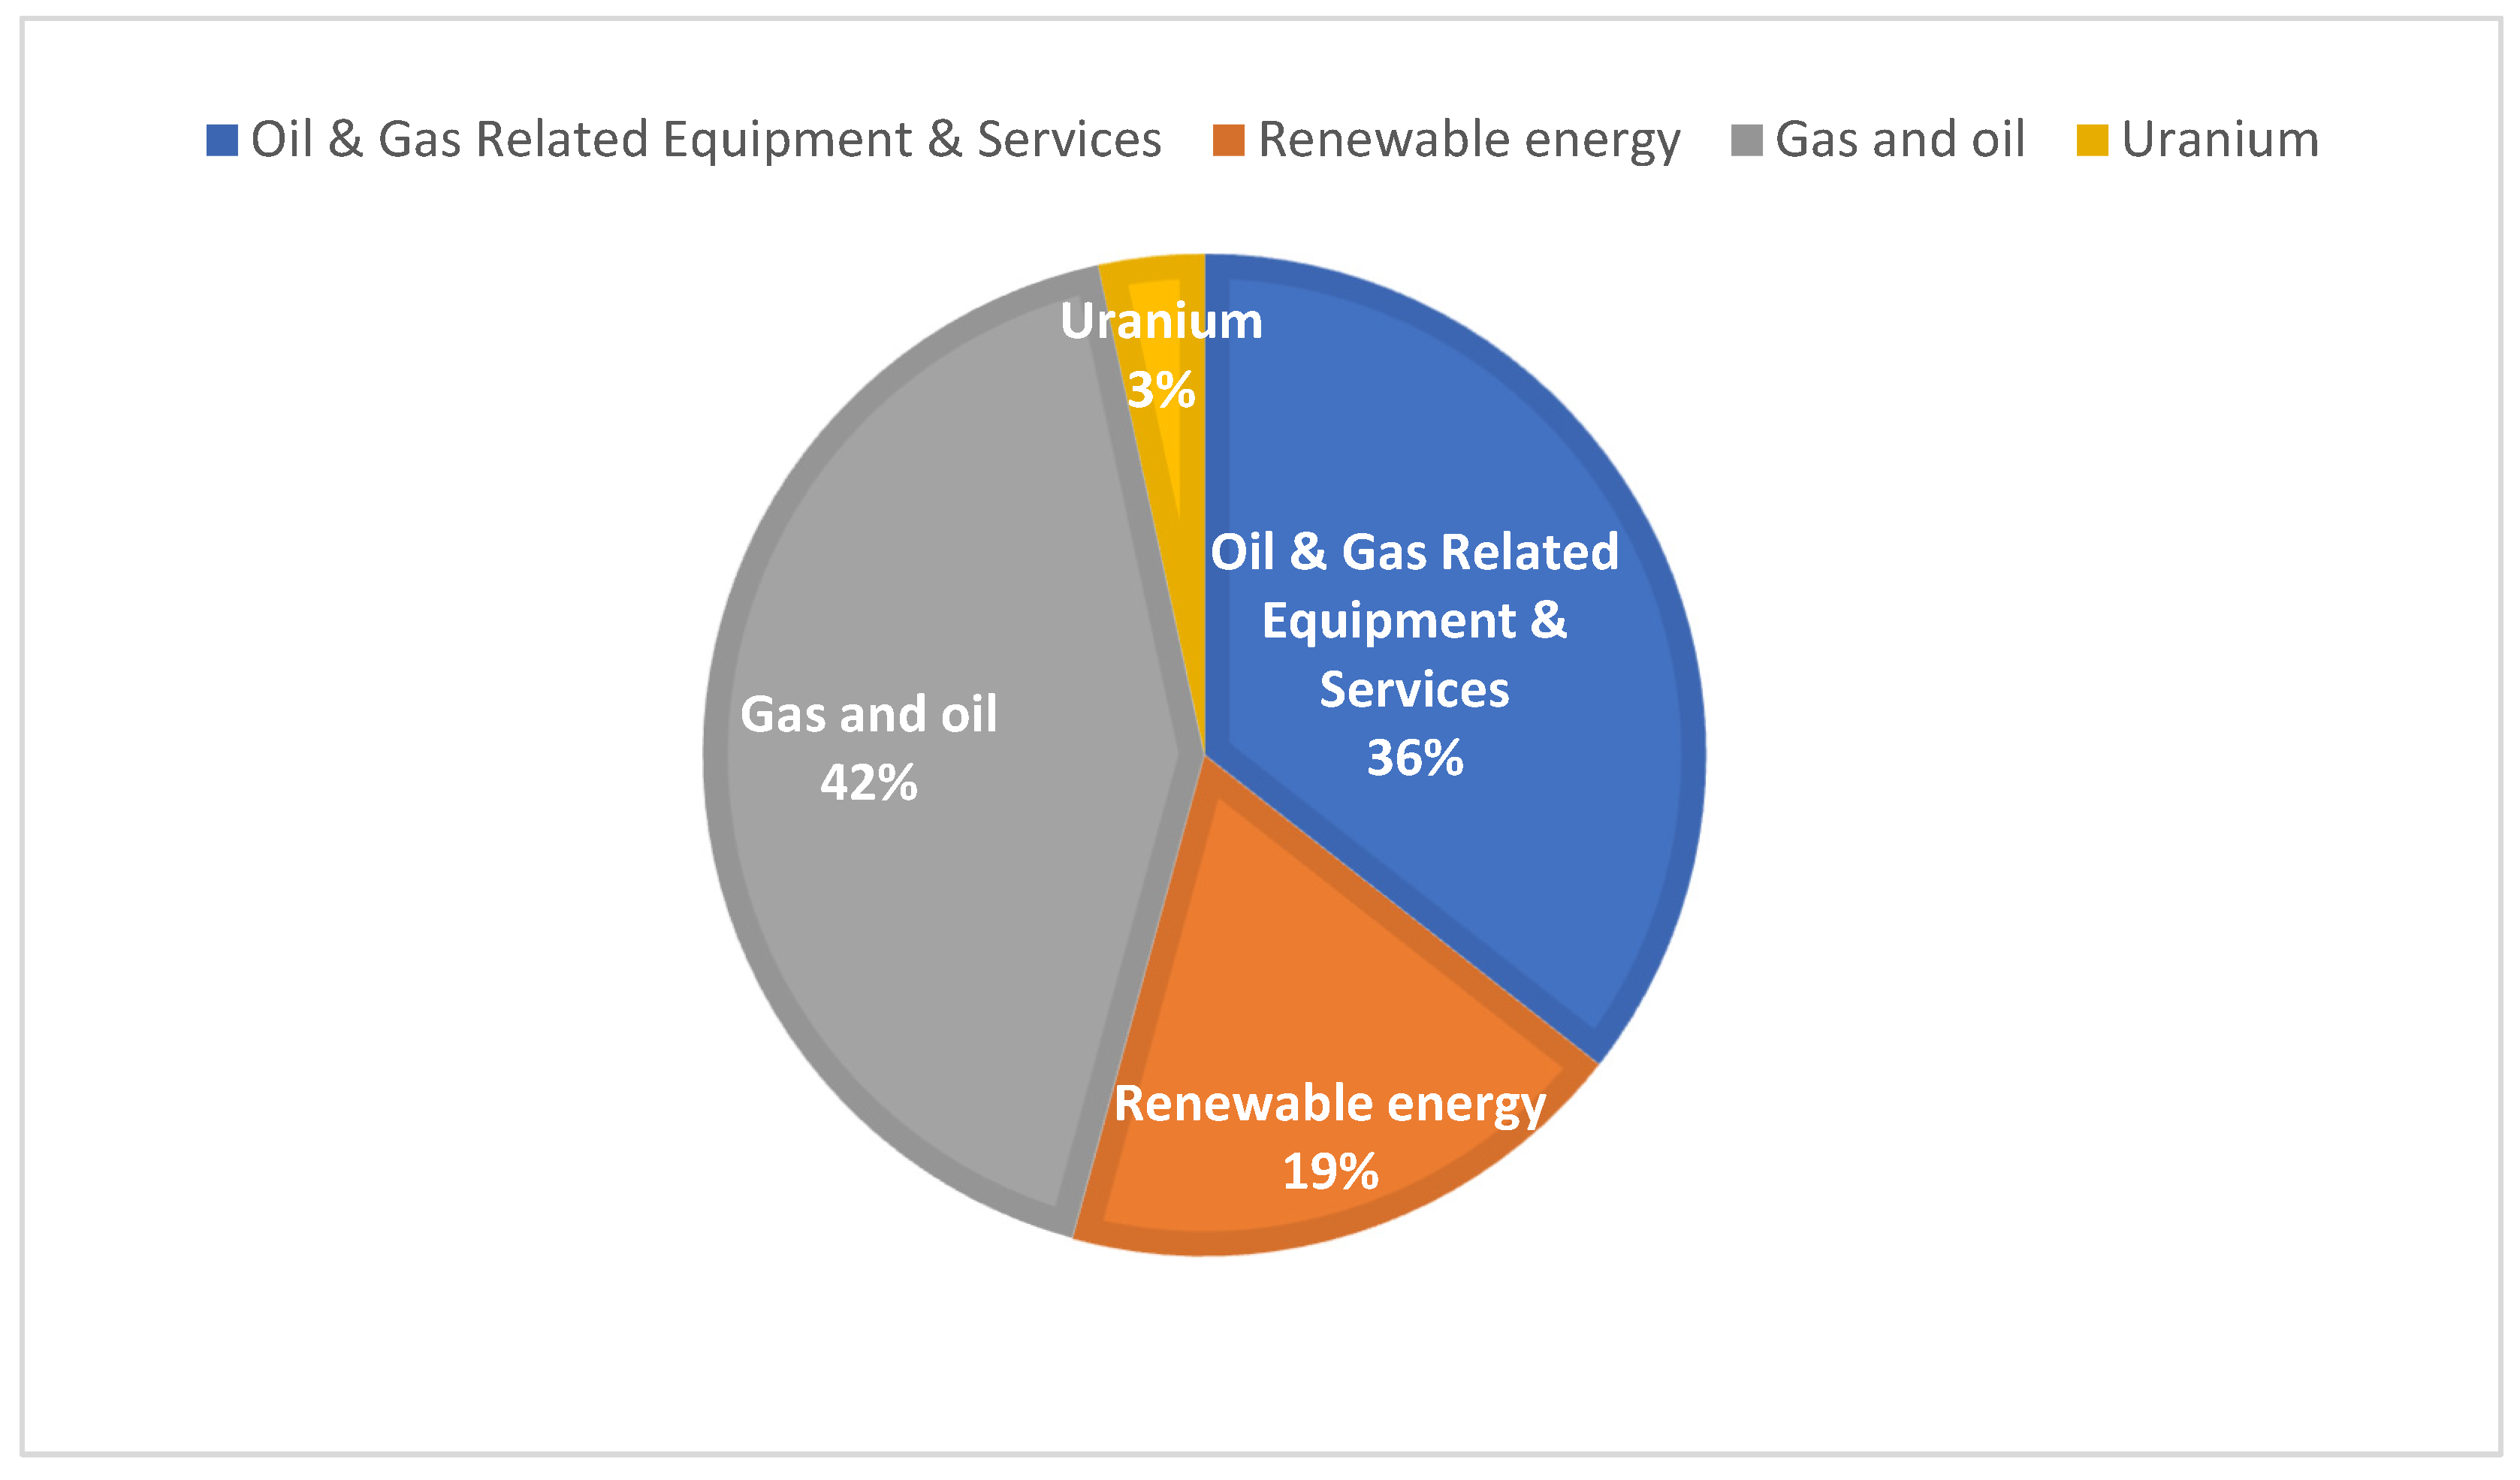
Figure 2) shows an apparent prevalence of companies operating in traditional sectors: around 42% are active in the gas and oil sectors, 36% in services and equipment related to these energy sources, whilst 19% belong to the renewable energy sector and 3% to the uranium sector. This empirical distribution confirms the persistent imbalance between fossil and sustainable energy sources, despite regulatory and market pressures encouraging the transition.
Table 1 describes the sample of companies, broken down by European country, for which ESG data is available.
Analysis of the sample reveals a marked concentration of representation in a few key markets. The sample shows a greater presence of companies based in the United Kingdom, France, Norway, Germany and Italy, reflecting the availability of ESG and financial data in the databases used; it should not be interpreted as representative of the overall structure of the European energy sector.
Table 2 shows the average ESG ratings of the companies included in the sample, broken down by country. Unlike a cumulative aggregate, the values presented have been calculated as the arithmetic mean of the ESG scores of the companies belonging to each country, according to the following formula:
where:
represents the average ESG rating of country j;
represents the ESG rating of the individual company I belonging to the country j;
nj indicates the number of businesses observed in country j.
The descriptive analysis reveals moderate variation in the distribution of average ESG ratings among companies in different European countries. The highest average values are observed in Portugal (38.2), Belgium (34.4) and the United Kingdom (32.8), whilst relatively lower values are found in Denmark (16.3) and the Republic of Ireland (11.9).
As the score is interpreted as an ESG risk rating, higher values indicate greater ESG risk, not better sustainability performance. Therefore, in the sample analysed, countries with higher average values have a higher average ESG risk profile, whilst lower values indicate a relatively more favourable ESG profile.
Analysis of the ESG components also reveals different patterns in the composition of the scores. In many cases, the environmental component (E) is the dominant factor, consistent with the growing importance of energy transition and environmental sustainability policies in the European energy sector. In Denmark and the Netherlands, however, the social component (S) accounts for a relatively higher proportion than the environmental dimension, highlighting a greater focus on social and governance aspects.
The absence of complete data for certain ESG components, such as in Estonia and the Republic of Ireland, reflects the limitations of the databases used and confirms the unbalanced nature of the panel analysed.
These differences, however, must be interpreted with caution; indeed, the reported values derive from an unbalanced sample of firms and reflect solely the characteristics of the companies included in the dataset and the availability of ESG information in the various geographical contexts observed. The country-level aggregations are therefore used exclusively for descriptive and exploratory purposes and do not represent national macroeconomic indicators, nor do they allow for structural comparisons between European economies.
Overall, the descriptive analysis of the sample highlights significant heterogeneity in the distribution of ESG characteristics among the companies considered, confirming the structural complexity of the relationship between sustainability and economic and financial performance in the European energy sector. On this basis, the following sections delve deeper into the econometric analysis of the relationships between ESG ratings and corporate performance ratios.
6. Analysis of the Main Financial Statements Ratios
6.1. ROE
Return on equity (ROE) is a financial indicator that measures the profitability of an investment in a company’s equity. It is calculated as (net profit/equity) × 100.
This ratio summarises the overall cost-effectiveness of the business and thus assesses the performance of senior management.
Table 3 presents the descriptive statistics.
The descriptive statistical analysis of ROE reveals significant variation in the profitability of the companies in the sample analysed. The average values show a mixed trend over time, ranging from particularly low or negative levels, such as 2015 (−4.29%), to very high levels in subsequent years, notably 2022 (30.58%) and 2023 (27.82%).
The decline in profitability observed in 2020, with an average value of 1.73%, may reflect the effects of the pandemic crisis on the economic and financial performance of companies in the European energy sector.
The high standard deviations and wide range between the minimum and maximum values highlight significant dispersion in profitability among the companies under consideration. This variability suggests the presence of significantly different operational, financial, and strategic conditions within the analysed sample.
The kurtosis and skewness values also indicate non-normal distributions and the presence of extreme observations. In particular, the positive skewness coefficients recorded across several financial years point to companies with exceptionally high profitability, whilst the negative values observed in some years highlight particularly unfavourable results. Similarly, the high kurtosis values suggest a concentration of observations around the mean, with outliers.
Overall, the descriptive results confirm a high degree of heterogeneity in the economic and financial conditions of the firms in the sample, highlighting differences in profitability and operational risk over the period under consideration.
6.2. ROA
Return on Assets (ROA) measures a company’s ability to generate a revenue stream by effectively managing its businesses, thereby making them profitable. It is calculated using the following formula: net profit/total assets × 100.
Table 4 presents the descriptive statistics for the report.
The analysis of ROA reveals significant variation in the companies’ ability to generate profitability from their assets. The average values show a variable trend over time, ranging from particularly low levels in 2015 (−0.10%) and 2020 (0.10%) to higher values in 2022–2023, peaking at 9.65% in 2022.
The relatively high standard deviations across all the years analysed highlight marked dispersion in the observations, indicating significant differences in the firms’ ability to use their assets to generate income efficiently.
The skewness coefficients indicate that, in several years, the distributions are not perfectly symmetrical, suggesting the presence of both positive and negative outliers. In particular, the positive asymmetry values observed mainly in 2021 and 2022 indicate the presence of firms with profitability levels significantly above the sample average. The kurtosis values, which are higher in some years, also signal distributions characterised by greater concentration of observations around the mean and by outliers.
This pattern highlights differences in operational efficiency and asset utilisation across the companies considered, confirming significant economic and financial variability within the European energy sector during the period analysed.
The descriptive results suggest that the distribution of ROA should be interpreted with caution, as extreme values can significantly influence aggregate statistics and the representativeness of the arithmetic mean.
6.3. ROCE
Return on capital employed (ROCE) is a long-term profitability indicator that measures how effectively a company uses its funds. It is calculated as EBIT/Invested capital × 100.
Table 5 presents the main descriptive statistics.
The ROCE analysis highlights significant variation in the companies in the sample’s ability to generate returns on invested capital. The average values show a mixed trend over time, characterised by overall growth with significant fluctuations, including a sharp decline in 2020 (2.28%) and particularly high values in 2022 (19.02%).
The high standard deviations and the wide range between the minimum and maximum values confirm marked dispersion in performance among the companies considered. This variability suggests different levels of efficiency in the use of invested capital and reflects the diversity of the operational, financial and strategic conditions that characterise the European energy sector.
The skewness coefficients, which are positive across all the financial years analysed, indicate the presence of companies with profitability levels significantly above the sample average, a phenomenon particularly evident in 2017 and 2019. The kurtosis values, which are higher in some years, also indicate distributions characterised by outliers and a greater concentration of data around the mean.
ROCE therefore exhibits a highly variable distribution across the companies considered, suggesting caution in interpreting aggregate statistics, particularly the arithmetic mean, in the presence of extreme values.
6.4. Leverage
The leverage ratio, or debt ratio, is an indicator of the amount of debt a company or entity uses to finance its activities relative to its equity. It is calculated by dividing the total liabilities (debts) by the company’s equity.
Table 6 shows the main descriptive statistics.
The statistical analysis of financial leverage reveals significant heterogeneity in the firms’ debt structures. The average leverage ratios are relatively high throughout the entire period under review, suggesting that the companies in question rely heavily on debt financing. In particular, average debt levels rose significantly between 2019 and 2022, before falling in 2023.
The marked gap between the mean and the median, observable in most years, together with high standard deviations, indicates a high degree of dispersion in the observations and suggests the presence of some firms with debt levels significantly above the sample average.
The positive skewness coefficients across all the analysed years confirm a distribution skewed towards high leverage ratios. Furthermore, the higher kurtosis values observed in some years indicate the presence of outliers and distributions more concentrated around the mean.
The distribution of financial leverage is therefore uneven, confirming the existence of different financial configurations among the firms analysed. Some firms exhibit relatively balanced capital structures, whilst others have significantly higher levels of financial exposure, resulting in different financial risk profiles.
7. Econometric Analysis
In economic research and business practice, econometric analyses examining the relationship between ESG performance and companies’ economic and financial performance have become increasingly popular. These studies aim to examine empirically the extent to which implementing sustainable practices affects a company’s profitability indicators and market value. The most recent empirical research suggests a positive correlation between ESG performance and long-term financial results. This link is attributed to improved corporate reputation, reduced operational risks and increased management efficiency resulting from more responsible governance (
Fatemi et al., 2018). However, several authors note that the economic effects of ESG strategies are primarily evident in the medium- to long-term and depend on the extent to which sustainability is effectively integrated into the company’s overall strategy (
Eccles et al., 2014).
In this study, correlation, regression and path analysis techniques—tools commonly used in the scientific literature on this subject—are employed to conduct an econometric analysis of the relationship between ESG performance and economic and financial outcomes in the European energy sector. Correlation is a statistical measure of the degree of linear association between two variables and serves as a starting point for examining whether profitability and sustainability are significantly related.
On the other hand, regression techniques allow us to estimate the strength and direction of the effects of ESG variables on economic performance, while accounting for external factors.
On the other hand, regression techniques allow estimation of the strength and direction of the associations between ESG ratings and economic and financial indicators, without attributing causal significance to the results. Finally, path analysis is used to explore more complex relationships and identify direct and indirect effects, offering a structural view of the link between sustainability and corporate value. The combined use of these methodologies, widely employed in recent empirical studies, enables robust results and allows the link between ESG practices and economic and financial performance to be validated with greater precision.
Before presenting the econometric results, it should be noted that the correlation, OLS regression, and SEM analyses were conducted at the firm-year level. The economic and financial indicators vary annually over the period 2014–2023, whilst the ESG rating available on Yahoo Finance is associated with the individual firm and is held constant across annual observations for the same company. Therefore, the results should be interpreted as exploratory evidence of statistical association rather than definitive proof of causal relationships.
One of the most common statistical tools for examining the interaction between two quantitative variables is linear correlation. Pearson’s correlation coefficient (r) measures the strength and direction of the linear relationship between two quantitative variables and ranges from −1 to +1. Values close to +1 indicate a strong positive correlation, values close to −1 indicate a strong negative correlation, whilst values close to 0 indicate a weak or absent linear relationship between the variables (
Pearson, 1896).
Linear correlation is often used in economics and finance, as well as in sustainability research, to examine the links between ESG variables and corporate or financial performance indicators. This constitutes a preliminary step towards identifying potential relationship patterns that warrant further investigation using regression models or multivariate approaches.
Table 7 shows the correlation between the variables under study.
The correlation matrix reveals generally weak linear associations between the ESG rating and the economic and financial indicators considered. In particular, the correlations between ESG and ROE, ROA, and ROCE are modest and positive, suggesting the absence of strong linear relationships between sustainability performance and accounting indicators in the analysed sample.
Profitability indicators, on the other hand, show particularly high positive correlations with one another, consistent with their shared economic and financial nature. In particular, ROE, ROA, and ROCE exhibit very high correlation coefficients, highlighting a strong interdependence among the measures of corporate profitability.
Leverage shows negative correlations with ROE, ROA and ROCE, suggesting that higher levels of debt may be associated with greater ESG risk, although there is no fully robust statistical evidence to support this.
Overall, the results of the correlation matrix suggest that the relationship between ESG and economic and financial performance is not attributable to simple direct linear associations, confirming the need to use more sophisticated analytical approaches to capture the interdependencies among the variables under consideration.
Table 8 shows the results of the regression analysis.
Because the OLS regression is estimated using firm-year observations, potential intra-firm correlation may affect the standard errors. Therefore, the regression results are interpreted with caution and used primarily as preliminary exploratory evidence before the SEM analysis.
The results of the regression analysis highlight the model’s limited explanatory power in explaining variability in ESG ratings. Indeed, the coefficient of determination (R2 = 0.1076) indicates that the economic and financial variables considered explain only a small proportion of the observed variability in ESG performance. The model’s overall F-test is also not statistically significant (p-value = 0.2639), suggesting no robust linear relationship between the independent variables and the ESG rating.
The intercept is positive and statistically significant (p < 0.001), with an estimated value of 22.28, indicating that the ESG rating maintains positive values on average even in the absence of changes in the economic and financial variables considered.
Regarding the coefficients of the individual variables, ROE and ROCE are not statistically significant, suggesting no stable linear relationship between these profitability indicators and ESG performance in the analysed sample. ROA, on the other hand, has a positive coefficient and marginal significance (p = 0.0612), suggesting a possible positive association between asset efficiency and ESG ratings. Similarly, financial leverage shows a positive coefficient with weak significance (p = 0.0930), suggesting that higher levels of debt may be associated with slightly superior ESG performance, though the evidence is not fully robust.
Overall, the results suggest that the relationship between financial performance and ESG ratings is not explained by simple, direct linear relationships, confirming the need for more sophisticated analytical approaches to capture the complexity of interdependencies among the variables under consideration. To assess multicollinearity among the independent variables, the variance inflation factor (VIF) was calculated (
Table 9).
The results show relatively high VIF values for certain variables, particularly ROE (VIF = 10.17) and ROCE (VIF = 7.82), suggesting possible multicollinearity among the profitability indicators.
This result appears consistent with the high correlations observed in the correlation matrix among ROE, ROA, and ROCE, as these are economic and financial indicators that partially overlap in measuring corporate profitability.
Financial leverage, on the other hand, has a low VIF (1.38), indicating no significant linear correlation with the other independent variables.
Although the observed levels of multicollinearity do not completely compromise model estimation, they could reduce the stability of the estimated coefficients and the statistical significance of the individual explanatory variables. This further underscores the complexity of the relationships between economic and financial indicators and ESG ratings in the analysed sample.
From an economic perspective, the results suggest that ESG performance is not directly explained by accounting indicators of profitability or financial leverage, but rather reflects sustainability-oriented strategic and governance choices, with their effects becoming apparent in the medium- to long-term. The lack of statistical significance could be due to the multidimensional nature of ESG metrics, sectoral variability, or unobservable factors, such as communication policies, corporate culture and stakeholder engagement practices.
In conclusion, the regression suggests a non-linear, complex relationship between economic performance and sustainability, consistent with the empirical literature (
Friede et al., 2015;
Eccles et al., 2014).
The high correlation among ROE, ROA, and ROCE, as confirmed by the variance inflation factor (VIF) values, indicates multicollinearity among the profitability indicators. This situation may compromise the stability of the estimates obtained through multiple regression and, consequently, make it difficult to identify the specific contribution of individual explanatory variables.
To overcome this methodological issue, an approach based on structural equation modelling (SEM) was adopted, which allows for the simultaneous representation of relationships among observed variables and latent constructs that cannot be directly measured.
Economic performance, in particular, was modelled as a reflective latent variable measured using three profitability indicators widely used in the financial literature (ROE, ROA and ROCE), whilst financial leverage was treated as an observed control variable. The structural model was used to assess the relationships among economic performance, financial leverage, and ESG ratings.
The model results show high saturation coefficients for all indicators, with standardised loadings exceeding 0.80, confirming that the three variables consistently represent the latent dimension of economic performance.
Table 11 shows the results of the SEM model.
The results of the structural model indicate that economic performance positively affects the ESG rating, but this relationship is not statistically significant (β = 0.146; p = 0.291). Financial leverage also has a positive coefficient and is marginally significant (β = 0.194; p = 0.082).
The coefficient of determination for the endogenous variable, ESG rating (R2 = 0.059), indicates that economic performance and financial leverage explain 5.9% of the observed variability in the ESG rating. This result suggests that ESG scores reflect dimensions beyond traditional accounting measures of profitability, such as corporate governance, environmental policies, disclosure transparency and stakeholder relationship management.
The analysis confirms that corporate sustainability cannot be interpreted solely as a consequence of economic and financial performance but rather as an autonomous and multidimensional aspect of corporate value creation.
Table 12 shows the SEM model fit indices.
The results indicate that the model’s overall fit is acceptable. The Comparative Fit Index (CFI = 0.941) exceeds the commonly used threshold of 0.90, indicating that the model adequately represents the observed relationships in the data. The value of the Standardised Root Mean Square Residual (SRMR = 0.087) is close to the threshold of acceptability generally adopted in the literature.
The Tucker–Lewis Index (TLI = 0.881) lies slightly below the reference value of 0.90, suggesting room for improvement in the model specification. The Root Mean Square Error of Approximation (RMSEA = 0.184), on the other hand, indicates a lower level of fit than conventional standards. This indicator, however, must be interpreted with caution in the presence of relatively small samples and models characterised by a low number of degrees of freedom, conditions under which the RMSEA frequently tends to overestimate the model’s misfit.
Ultimately, the fit indices demonstrate the model’s ability to represent the main relationships between financial performance and ESG ratings, although some indicators suggest room for improvement in the model specification.
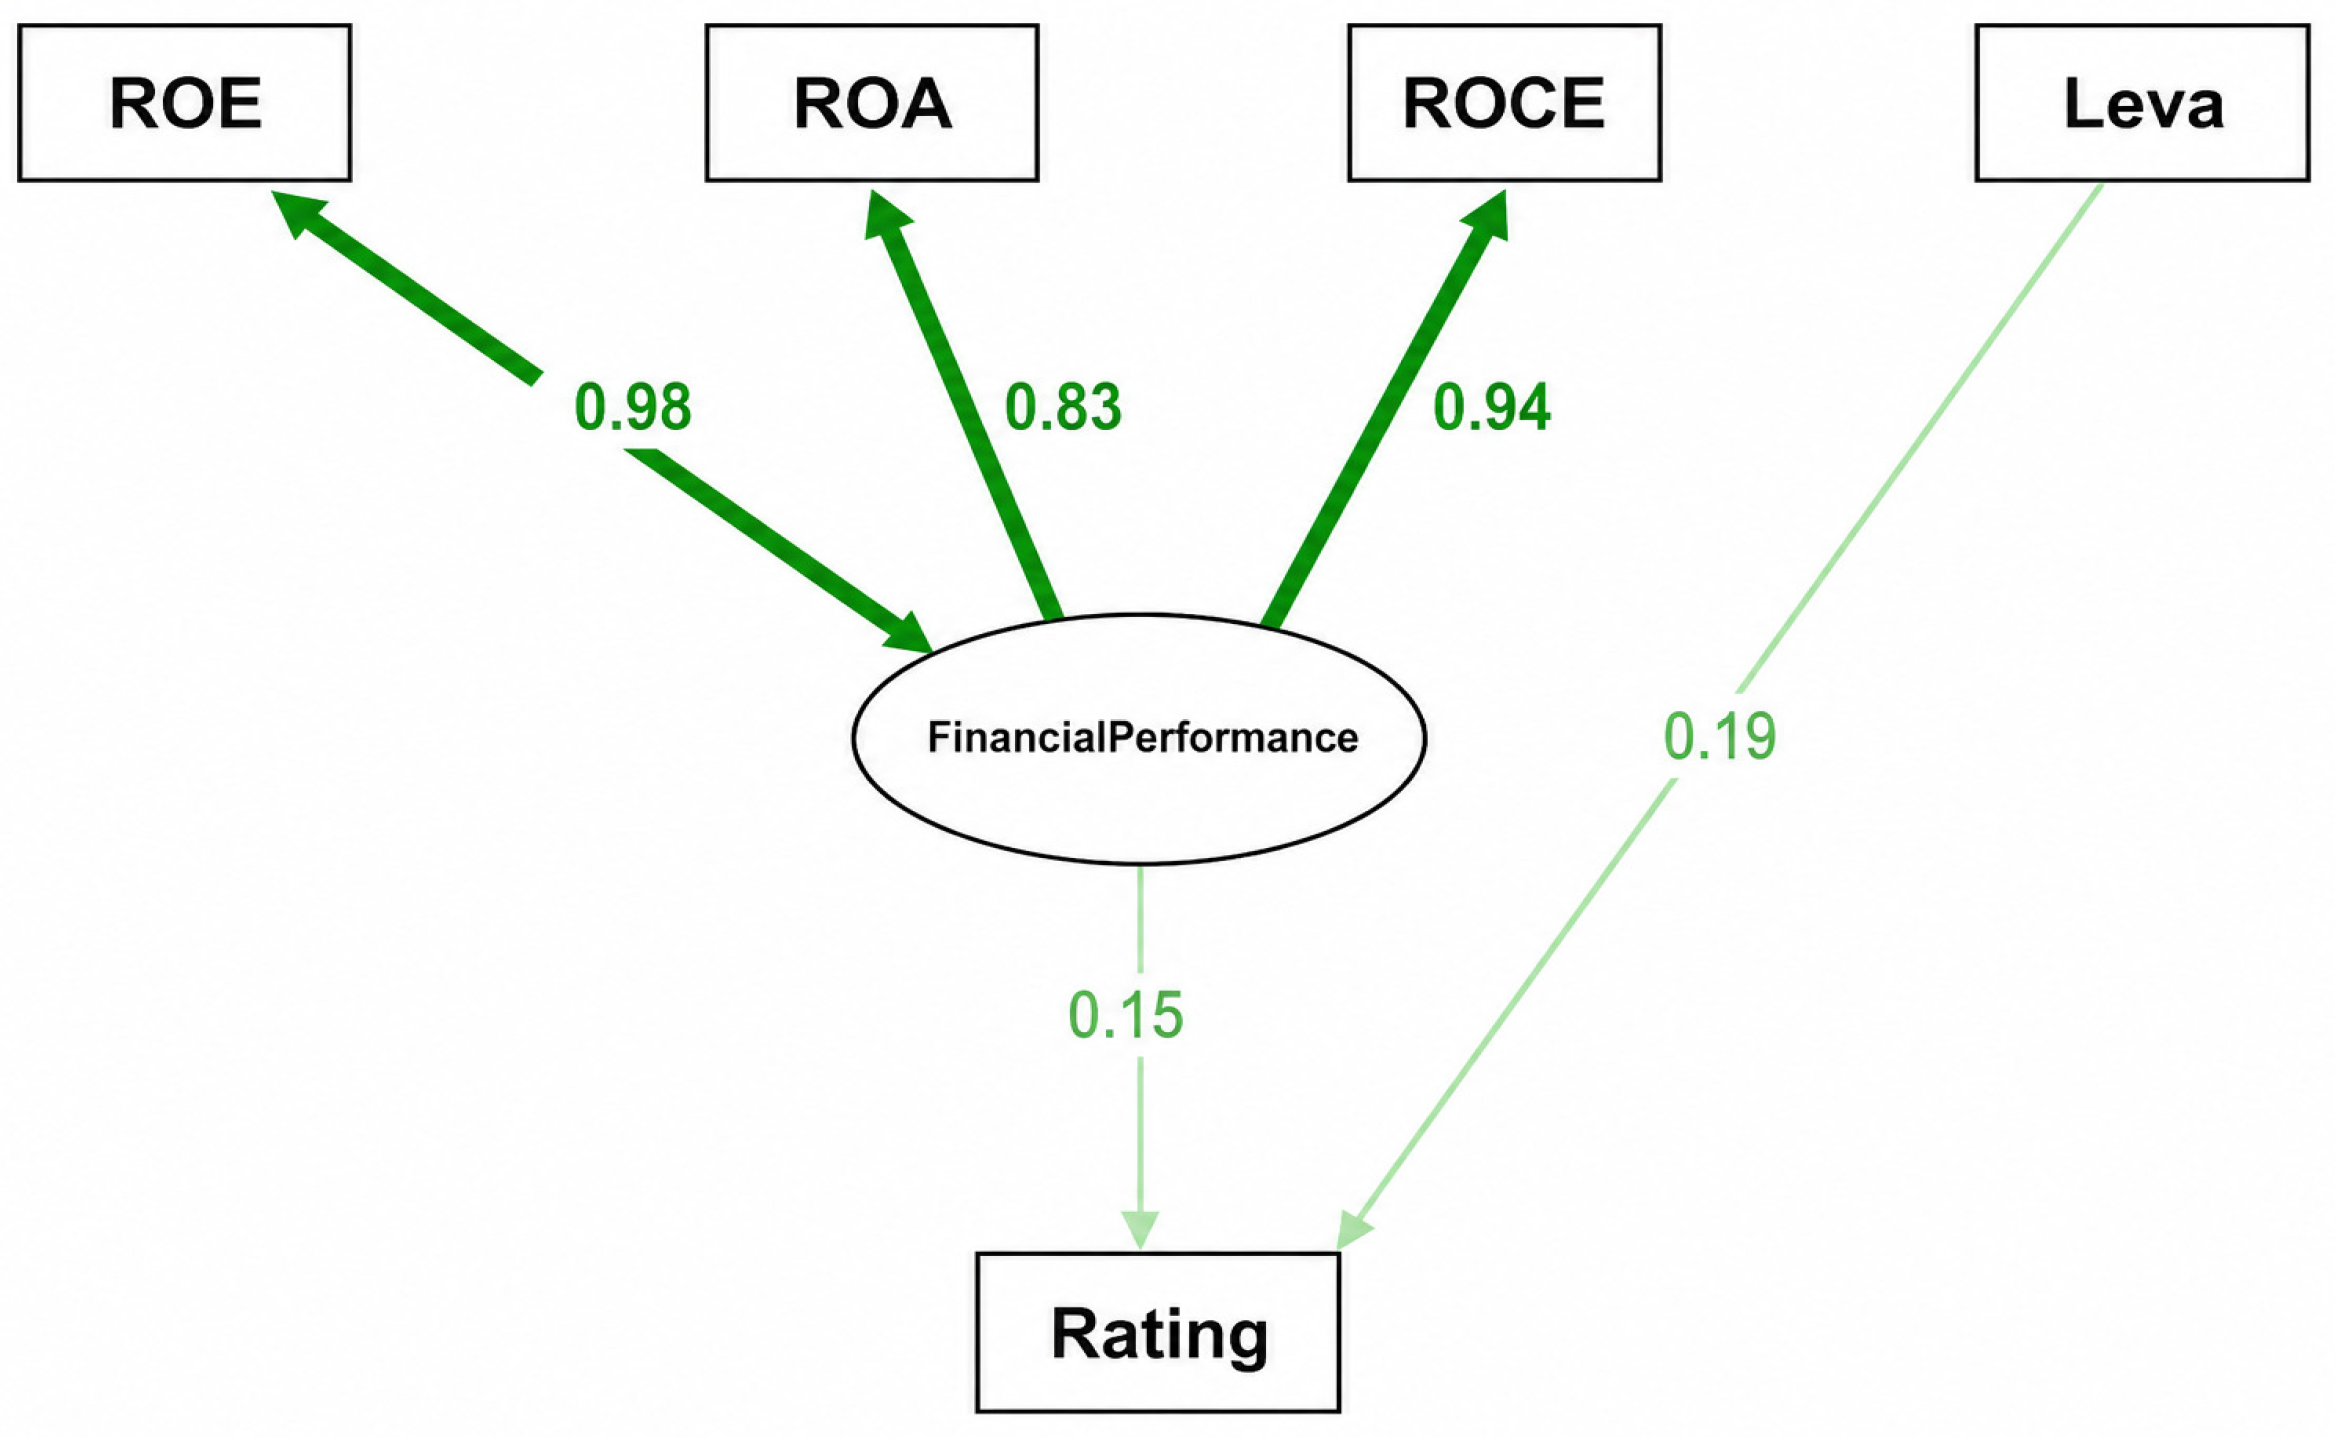
Figure 3 represents the structure of the predicted model.
Figure 3 illustrates the structure of the estimated relationships between the variables under consideration. In particular, economic performance is represented as a latent variable measured by three profitability indicators.
The standardised coefficients associated with the indicators are particularly high (ROE = 0.98; ROA = 0.83; ROCE = 0.94), confirming that the three variables share a common economic–financial dimension and consistently represent the latent construct of economic performance.
Regarding the structural model, economic performance shows a positive association with the ESG rating (β = 0.15), whilst financial leverage also shows a positive association (β = 0.19). Although these relationships are modest in strength, they suggest that companies with better economic and financial conditions tend to have higher ESG risk ratings, suggesting a possible association with greater ESG risk. This result should be interpreted with caution, particularly given its low statistical significance.
Path analysis confirms that a multidimensional structure characterises the relationship between economic performance and ESG ratings and that it cannot be interpreted solely through simple, direct linear relationships. The results suggest, in fact, that corporate sustainability also depends on additional organisational, strategic and governance factors not directly observed in the model.
Given the firm-year structure of the dataset and the presence of repeated observations for the same company, the results should be interpreted as exploratory evidence of structural associations between the variables under consideration, rather than as definitive proof of causal relationships.
9. Conclusions, Implications, Limitations and Prospects
This study addressed the long-debated link between sustainability performance (ESG rating) and economic and financial performance (CFP) in the critical, capital-intensive environment of European energy companies (2014–2023), adopting a robust multi-method approach based on correlation analysis, OLS regression, and path analysis.
9.1. Conclusions and Theoretical Contribution
The results of the study show that the relationship between ESG risk ratings and economic and financial performance in the European energy sector cannot be adequately represented by simple linear models. As the ESG rating used in the study is interpreted as an ESG risk rating, higher values indicate a greater level of unmanaged ESG risk, whilst lower values indicate a relatively more favourable ESG profile.
Hypothesis H1 is not supported, as the OLS analysis reveals that the accounting variables have limited explanatory power for the ESG Risk rating. The SEM model also shows a positive association between economic performance and the ESG Risk rating, but this relationship is not statistically significant. Therefore, it cannot be concluded that better economic and financial conditions are robustly associated with higher or lower ESG risk.
Hypothesis H2 is supported. The SEM model allows ROE, ROA and ROCE to be represented as consistent observable indicators of a common latent dimension of economic performance, confirming the multidimensional and highly interrelated nature of accounting profitability indicators.
Hypothesis H3 is only partially supported. Financial leverage shows a positive and marginally significant association with the ESG Risk rating. This result suggests that higher levels of debt may be associated with greater ESG risk, but the statistical evidence is not sufficiently robust to draw definitive conclusions.
Overall, the results indicate that the level of ESG risk among European energy companies does not depend exclusively on short-term corporate profitability, but reflects a broader set of strategic, organisational, financial, regulatory and governance factors. The theoretical contribution of the study, therefore, lies in proposing an exploratory structural representation of economic performance as a latent construct and in highlighting the need to interpret risk-based ESG ratings in a manner consistent with the scale’s direction.
9.2. Management and Policy Implications
The study’s findings highlight that improved financial performance does not automatically translate into higher ESG ratings. Companies in the energy sector should therefore view sustainability as a distinct management dimension to be integrated into corporate strategies through environmental, social and governance policies that are consistent with long-term objectives.
From a managerial perspective, the results highlight the need not to evaluate ESG investments solely through traditional accounting indicators, such as ROE, ROA and ROCE. In line with
Fatemi et al. (
2018), the assessment of ESG strategies should be complemented by indicators that capture the long-term effects of sustainability, such as risk reduction, the cost of capital, and the ability to attract investors.
From a public policy perspective, the results suggest the importance of promoting increasingly transparent and comparable ESG reporting standards to improve the quality of information available to investors, companies, and stakeholders. In this regard, strengthening non-financial disclosure systems can make the organisational and strategic dimensions that influence corporate sustainability more observable.
9.3. Limits and Prospects
This study has several limitations that provide opportunities for future research.
Firstly, the analysis focused exclusively on accounting-based economic and financial indicators, such as ROE, ROA, ROCE and financial leverage. Although these measures are widely used in the literature on corporate financial performance, they may not fully capture the strategic value of sustainability, particularly in capital-intensive sectors. Future research could supplement the analysis with market-based indicators, such as market capitalisation, enterprise value, cost of capital or share returns, which better reflect investor expectations and the long-term effects of ESG strategies.
Secondly, the study uses a single source for ESG measurement. The data available on Yahoo Finance is interpreted as an ESG risk rating; therefore, higher values indicate a greater level of unmanaged ESG risk rather than better sustainability performance. This aspect calls for caution when interpreting the results, as different providers may adopt methodologies, weightings and rating scales that are not perfectly comparable. Future studies could replicate the analysis using ESG ratings from different specialist providers, consensus scores, or metrics explicitly geared towards ESG performance, to test the robustness of the results with respect to the source and direction of the scale used.
Thirdly, the dataset has an unbalanced panel structure, characterised by uneven availability of observations across firms and years. This configuration may reflect not only actual longitudinal firm dynamics, but also changes in the sample composition due to varying data availability. Furthermore, repeated observations for the same firm may introduce intra-firm correlation, potentially affecting the estimation of standard errors in inferential models.
From an econometric perspective, the possible presence of endogeneity, reverse causality, omitted variables and unobservable dynamic effects could influence the estimates obtained via OLS regression and path analysis. Although the SEM model allows for the simultaneous representation of relationships between observed variables and latent constructs, it does not, in the present research design, constitute a strategy for causal identification. The results should therefore be interpreted as exploratory evidence of statistical and structural associations between ESG risk ratings and economic and financial performance, rather than definitive proof of causal relationships.
Future research could address these limitations by employing dynamic panel models, fixed-effects or random-effects models, standard errors clustered at the firm level, instrumental-variable approaches, GMM models, or longitudinal and multilevel SEM techniques that are better suited to causal identification. Such approaches allow for a more rigorous consideration of the panel structure of the data, possible intra-firm dependence and the potentially bidirectional relationship between economic and financial conditions and ESG risk.
Finally, future research could extend the model to other capital-intensive sectors, such as telecommunications, heavy industry, transport or utilities, to ascertain whether the observed associations between economic performance, financial leverage and ESG risk are specific to the European energy sector or generalisable to other industrial contexts characterised by high investment requirements and significant regulatory pressures.
Ultimately, this study contributes to the academic debate on the complex interaction between ESG and corporate financial performance, offering an exploratory and structural analysis of the associations between latent economic performance, financial leverage and ESG risk ratings. At the same time, the results highlight the need to interpret risk-based ESG ratings with caution and to develop more robust empirical models in the future to analyse the relationships among sustainability, ESG risk, and economic and financial performance.