1. Introduction
The financial outlook of a firm is an important consideration for stakeholders including investors, creditors, regulators, and portfolio managers. Previous studies suggest that accounting-based indicators, especially those that capture liquidity, profitability, and leverage, contain substantial information regarding company distress and default risk (
Beaver, 1966;
Altman, 1968;
Ohlson, 1980;
Shumway, 2001). Traditional models, such as Altman’s Z-score (
Altman, 1968,
2009;
Agarwal & Taffler, 2008), provide an essential benchmark, but their linear functional forms and simplistic categorization structures may not adequately capture the complex and nonlinear dynamics of financial degradation. Businesses seldom transition suddenly from a state of stability to one of distress; rather, they generally undergo a gradual deterioration in liquidity, profitability, and financial adaptability.
Recent developments in machine learning have introduced a wide range of nonlinear classification techniques capable of modeling complex interactions and threshold effects in financial data. Empirical studies consistently document that methods such as Random Forest, Gradient Boosting, and Support Vector Machines outperform traditional parametric models in predicting financial distress and credit risk (
Frydman et al., 1985;
Barboza et al., 2017;
Lessmann et al., 2015). Yet, as more advanced algorithms rapidly emerge, an important unresolved issue persists: does making models more complex enhance our ability to predict distress, or do improvements level off after essential nonlinear patterns are addressed?
The study employs a multiclass Corporate Outlook framework consisting of negative, neutral, or positive, to reflect the nonlinear variation in distance-to-default, rather than using a binary credit outlook. The study compares multinomial Logistic Regression alongside a range of nonlinear classifiers, including Random Forest, Gradient Boosting, XGBoost, kernel SVM, and K-Nearest Neighbors (
Malhotra et al., 2024a,
2024b).
The empirical methodology employs stratified train–test splits, k-fold cross-validation, repeated cross-validation, and leave-one-out estimation to promote methodological rigor across different sampling strategies. Additionally, pairwise statistical tests are performed to assess the statistical significance of observed performance differences. SHAP (SHapley Additive exPlanations;
Lundberg & Lee, 2017) is utilized to analyze the influence of financial variables and to verify whether model behavior is consistent with established theory.
The results indicate that nonlinear classifiers outperform multinomial Logistic Regression by about ten percentage points out-of-sample, reflecting the influence of nonlinear factors in corporate credit changes. Nonlinear models yield comparable results, indicating added complexity offers minimal benefit. SHAP analysis shows predictions reflect credit risk theory by penalizing weak finances and highlighting reduced returns from excess liquidity.
The study shows that increasing model complexity in financial outlook forecasting has limited economic benefits. While accommodating nonlinear relationships offers some advantages, further complexity adds little value.
This study primarily aims to assess whether enhancing model flexibility by incorporating nonlinear structures and advanced classification architectures leads to improved mapping between firm fundamentals and credit risk regimes. While traditional models rely on linear specifications, machine learning methods allow for interactions, threshold effects, and state-dependent relationships that may better capture the underlying dynamics of credit deterioration.
A key challenge in applying nonlinear machine learning models to credit risk is the lack of interpretability, often limiting their adoption in practice. To address this, the study employs SHapley Additive exPlanations (SHAP), an explainable artificial intelligence framework that decomposes model predictions into feature-level contributions. This allows us to assess whether the improved predictive performance of nonlinear models reflects economically meaningful relationships—such as convex deterioration in financial distress and diminishing marginal effects of liquidity—rather than purely statistical associations. In doing so, SHAP provides a direct link between predictive modeling and structural credit risk theory.
To achieve reliable outcomes that are not influenced by sample fluctuations, a common challenge in financial machine learning studies, the analysis also employs multiple cross-validation techniques and rigorous statistical tests.
These findings help clarify how corporate credit risk functions. The results suggest that improvements in prediction are mainly due to adding nonlinear elements rather than making algorithms more complex. Additionally, interpretable machine learning models offer not only precise predictions but also valuable economic insights. The findings also challenge the prevailing emphasis on increasingly complex machine learning architectures by demonstrating that predictive gains plateau once nonlinear structure is incorporated.
2. Previous Studies
Research on corporate financial distress and credit risk prediction has a long and well-established tradition in finance and accounting. Initial empirical models relied almost exclusively on accounting-based predictors of default.
Beaver (
1966) and
Altman (
1968) showed that liquidity, profitability, leverage, and operating efficiency metrics have explanatory power over firms’ failure outcomes. These methods were extended through probabilistic predictions with
Ohlson’s (
1980) logit framework and
Shumway’s (
2001) hazard-based specification. Estimation efficiency was improved and time-varying failures accounted for through these methods. Classical models have been used as benchmarks for many recent studies. However, they rely on stringent assumptions of linearity and distribution and cannot flexibly account for interactions between financial ratios especially when they shift throughout time and economic conditions (
Altman, 2009;
Agarwal & Taffler, 2008).
An obvious reaction to these problems was to turn to machine learning methods for bankruptcy and distress prediction. Some of the first applications of Decision Trees, neural networks and Support Vector Machines report improved performance when compared to traditional statistical models (
Min & Lee, 2005;
Kim & Kang, 2010).
Frydman et al. (
1985) used recursive partitioning to predict financial distress using exclusively nonparametric tests, stressing the usefulness of nonlinear decision making in classification problems. In recent years, with the increasing availability of computational power, ensemble models have started to play an increasing role. Authors using bagging, boosting and Random Forests report very good prediction accuracy and out-of-sample results, especially in mixed populations of firms (
Barboza et al., 2017).
Gradient Boosting-based models have been regarded as state-of-the-art in more recent studies. Gradient Boosting Machines and Extreme Gradient Boosting (XGBoost), for instance, have been shown to surpass traditional standalone classifiers by progressively adjusting misclassification errors and leveraging complex nonlinear relationships between financial ratios (
Zhou et al., 2021).
Amirshahi and Lahmiri (
2024) also find that well-calibrated ensemble models utilizing Gradient Boosting methods maintain high robustness in extremely skewed bankruptcy data and often achieve superior performance than oversampling-based methods. This further suggests that ensemble methods are ideally suited for credit risk datasets with low default rates and imbalanced error penalties.
Despite these methodological advances, the dominant paradigm in the distress literature remains binary classification, distinguishing only between distressed and non-distressed firms. While analytically convenient, this binary framing abstracts from the gradual and continuous nature of corporate financial deterioration. In practice, firms often transition through intermediate financial states—exhibiting weakening liquidity or profitability without immediate failure—before entering severe distress. Recognizing this limitation, a smaller but growing stream of research has begun to explore multiclass or rating-based approaches that better align with how credit analysts and rating agencies assess credit quality (
Frydman et al., 1985;
Barboza et al., 2017).
A recent study by
Malhotra et al. (
2024a) used a multiclass credit outlook framework to analyze the credit outlook for banks and nonbanking finance companies. Firms are segmented into three categories—negative, neutral, and positive outlook. Implementing traditional ML models such as Logistic Regression, k-Nearest Neighbor, Decision Trees, Support Vector Machines, and naïve Bayes, they discover that similarity algorithms, particularly kNN, are successful at pinpointing credit transitions. Expanding upon this framework,
Malhotra et al. (
2024b) assess the performance of advanced ensemble learning models like Random Forests, Gradient Boosting, and XGBoost. The study reports significant improvements in predictive accuracy and finds XGBoost outperforming other models across different outlook categories. The combined findings of these two papers highlight the empirical usefulness of moving past the binary classification of distress prediction towards outlook-based credit classification and the benefits of leveraging ensemble learning.
At the same time, the increasing reliance on complex machine learning models has raised concerns regarding interpretability and transparency. High-performing ensemble models are often criticized as “black boxes,” limiting their practical adoption in regulatory and risk-management settings. Recent advances in explainable artificial intelligence, particularly SHAP (
Lundberg & Lee, 2017), offer a principled approach to decomposing model predictions into economically meaningful feature contributions. While SHAP has been applied in various financial prediction contexts, relatively few studies integrate explainability tools into a comparative evaluation of machine learning models for corporate distress or credit outlook assessment.
While prior research has made significant progress in modeling corporate financial distress and credit risk, three important limitations remain. First, most studies adopt a binary classification framework, distinguishing only between distressed and non-distressed firms, thereby overlooking transitional credit regimes that are central to structural credit risk theory. Second, although recent machine learning studies document improved predictive performance, they typically focus on model comparison without examining whether incremental increases in model complexity yield economically meaningful gains beyond the introduction of nonlinear structure. Third, the growing use of advanced machine learning models has raised concerns regarding interpretability, yet relatively few studies systematically evaluate whether model predictions are consistent with underlying economic theory.
The present study addresses these gaps in three ways. First, we adopt a multiclass credit outlook framework that captures negative, neutral, and positive credit states, providing a more nuanced representation of corporate financial dynamics. Second, we explicitly examine the role of model complexity by comparing a parametric benchmark with a range of nonlinear classifiers under a unified validation framework, allowing us to assess whether predictive gains plateau once nonlinear relationships are incorporated. Third, we integrate SHAP-based interpretability to evaluate whether the relationships learned by the models reflect economically meaningful structures, such as convex deterioration and diminishing marginal effects, consistent with structural credit risk theory. In doing so, the study contributes not only to predictive modeling, but also to the understanding of the functional form underlying credit risk dynamics.
3. Theoretical Framework and Model Architecture
3.1. Structural Credit Risk and Transitional Default Dynamics
Structural credit risk theory, beginning with
Merton (
1974), models equity as a call option on firm assets and defines default as the event in which asset value falls below the face value of debt. A central implication of this framework is convexity: the probability of default increases nonlinearly as asset value approaches the default boundary. Small deteriorations near the threshold generate disproportionately large increases in risk, whereas similar shocks applied to financially strong firms have limited impact.
Default risk, therefore, evolves continuously across financial states rather than switching discretely from safe to distressed. This theoretical insight motivates two empirical considerations. First, modeling credit risk as strictly binary may obscure economically meaningful transitional regimes. Second, linear functional forms may fail to capture convex deterioration and interaction effects embedded in accounting data.
To address these issues, this study adopts a multiclass outlook framework and compares parametric and nonlinear classification architectures.
3.2. Multiclass Outlook as Transitional Risk Regimes
Credit analysts and ratings agencies typically classify firms as having negative, neutral (or stable), or positive outlooks to convey expectations about the future direction of creditworthiness. The classifications correspond intuitively with the distance-to-default model. Firms with positive outlooks should have a higher distance-to-default. Conceptually they should sit above the distance-to-default frontier, as they are considered a well-capitalized company. Neutral or stable outlook companies fall in between. Companies with negative outlooks sit closer to the default frontier as they are not as well capitalized.
A multiclass framework therefore better aligns empirical modeling with structural credit theory by capturing transitional deterioration and recovery dynamics. If convex deterioration effects are economically meaningful, models capable of nonlinear decision boundaries should outperform strictly linear parametric specifications in discriminating among these regimes.
3.3. Multinomial Logistic Regression: The Parametric Benchmark
Multinomial Logistic Regression serves as both the theoretical and empirical benchmark in this study. This model specification comes from a long tradition in the literature on financial distress prediction, dating back to
Ohlson (
1980) and
Shumway (
2001). It assumes that the financial variables linearly affect log-odds of belonging to a certain class. The marginal effect of a given covariate on the response is then constant in the log odds-space, corresponding to a constant percentage shift in the predicted probability. If two financial variables interact with one another, this interaction must be modeled explicitly; it is not identified by the base model. The decision boundaries in the original feature space will be linear.
If corporate credit deterioration is approximately linear in financial ratios, Logistic Regression should perform comparably to nonlinear alternatives. Conversely, if structural convexity and interaction effects are present, Logistic Regression should exhibit inferior discrimination.
Thus, Logistic Regression represents not merely another model, but the empirical embodiment of classical parametric distress theory.
3.4. Nonlinear Classification Architectures
To evaluate whether relaxing linear separability can improve prediction performance, five nonlinear classifiers are trained. This permits direct comparisons to be made between traditional linear approaches and those that allow for more complex relationships within the data. These nonlinear classifiers were chosen because they should be able to outperform linear models when there are nonlinear relationships between features.
3.5. k-Nearest Neighbor (k = 7)
A similarity-based classifier that assigns outlook categories according to local financial proximity in feature space. kNN captures nonlinear clustering patterns without imposing global parametric structure.
3.6. Kernelized Support Vector Machine (RBF Kernel)
A margin-based classifier that constructs nonlinear decision boundaries through kernel transformation. The RBF kernel allows flexible separation of overlapping financial states while maintaining regularization.
3.7. Random Forest
A set of random Decision Trees trained on bootstrapped samples of data and features. Random Forest captures interaction effects and nonlinear threshold behavior while reducing variance through aggregation.
3.8. Gradient Boosting
A sequential ensemble method that iteratively corrects classification errors. By focusing on difficult observations, Gradient Boosting can capture subtle nonlinear patterns and asymmetric penalization of financial deterioration.
3.9. Extreme Gradient Boosting (XGBoost)
An optimized boosting implementation incorporating regularization, shrinkage, and computational efficiency. XGBoost balances model flexibility with generalization and is widely regarded as a high-performance classifier in credit risk applications.
3.10. Model Architecture as a Direct Test of Structural Theory
Comparison of multinomial Logistic Regression and nonlinear classifiers yields a straightforward empirical test of the hypothesis that credit deterioration is structurally convex. Should the dynamics of structural credit risk be present in accounting data, then patterns of model performance and interpretability ought to bear the imprint of that nonlinearity. Nonlinear classifiers should deliver superior discriminatory power relative to Logistic Regression for multiclass outlook prediction (H1). Marginal penalization for financial deterioration should accelerate as firms near a negative credit outlook threshold (H2), but the marginal benefit of excess liquidity should diminish beyond some point of adequacy (H3). Beyond the threshold of nonlinear separability, additional increases to algorithmic complexity should yield only marginal improvements in model performance (H4). Here, model architecture acts as an empirical test of functional form for credit deterioration.
The formulation of the hypotheses is grounded in both structural credit risk theory and prior empirical evidence on financial distress prediction. Structural models of credit risk (
Merton, 1974) predict that default risk evolves nonlinearly as firms approach distress thresholds, implying that linear specifications may fail to capture the convex nature of financial deterioration. Empirical studies in bankruptcy and credit risk prediction further document that nonlinear machine learning models, including tree-based and kernel-based approaches, consistently outperform traditional parametric models in classification accuracy (
Barboza et al., 2017;
Lessmann et al., 2015). At the same time, recent research suggests that gains from increasingly complex algorithms may exhibit diminishing returns once nonlinear relationships are adequately modeled (
Zhou et al., 2021). Finally, advances in explainable machine learning indicate that financial variables often exhibit asymmetric and state-dependent effects, particularly in the presence of financial distress (
Lundberg & Lee, 2017). Building on these theoretical and empirical insights, the following hypotheses are proposed.
H1. The nonlinear classifiers demonstrate higher statistical discrimination between the multiclass outlook states when compared to the multinomial Logistic Regression, aligning with previous findings that machine learning methods perform better than traditional parametric methods at credit risk prediction (Barboza et al., 2017; Lessmann et al., 2015).
H2. Consistent with structural credit risk theory, declines in liquidity and profitability are expected to be associated with disproportionately larger negative outlook revisions for firms nearing distress thresholds (Merton, 1974).
H3. Improvements in liquidity beyond adequacy thresholds are expected to exhibit diminishing marginal contributions in the classification of positive outlooks (Merton, 1974; Lundberg & Lee, 2017).
H4. Once nonlinear relationships have been accounted for, marginal improvements in algorithmic sophistication only slightly improve out-of-sample performance. This phenomenon is also observed when comparing the predictive capabilities of modern machine learning algorithms, as out-of-sample predictive gains begin to level off once nonlinear relationships have been modeled (Zhou et al., 2021).
Hypotheses H1 and H4 are evaluated through comparative cross-validation performance, while Hypotheses H2 and H3 are explored using SHAP-based interpretability analysis to examine whether the nonlinear classifiers exhibit state-dependent and economically meaningful relationships consistent with structural credit risk theory.
3.11. Interpretability and Economic Coherence
To mitigate issues associated with black-box predictions, we used SHAP (
Lundberg & Lee, 2017) to partition model outputs into individual marginal feature contributions.
By examining SHAP summary and dependence plots, we assess whether nonlinear classifiers encode:
Convex penalization of deterioration;
Diminishing marginal liquidity benefits;
Interaction-sensitive financial dynamics.
If such patterns emerge, nonlinear machine learning models function as economically coherent implementations of structural credit theory rather than opaque statistical devices.
4. Data and Methodology
4.1. Data and Sample Construction
The study uses a proprietary dataset featuring 1914 non-financial companies. Financial information comes from the Corporate Credit Outlook: Financial Baseline Forecast database, which offers standardized firm-level financial indicators widely used to assess credit risk. Financial institutions are excluded due to their distinct balance-sheet structures and regulatory environments, consistent with prior distress prediction studies (e.g.,
Altman, 1968;
Shumway, 2001).
The sample includes firm-year observations for which complete financial information is available across all variables employed in the analysis. To mitigate the influence of extreme outliers, financial ratios are inspected for plausibility and consistency with standard accounting conventions. All variables are measured on a comparable scale, and continuous features are standardized prior to model estimation to ensure numerical stability, particularly for distance-based and margin-based classifiers.
4.2. Outlook Classification
This study uses a multiclass outlook framework rather than the typical distress prediction models that depend on binary results. Firms are placed into one of three distinct categories, with no overlap between them.
Negative Outlook: Firms exhibiting weak liquidity and profitability profiles consistent with elevated financial distress risk.
Neutral Outlook: Firms displaying adequate but unexceptional financial performance, without immediate indicators of severe distress or strong financial resilience.
Positive Outlook: Firms characterized by strong liquidity, profitability, and financial flexibility.
The analysis employs a set of five core financial variables capturing liquidity, profitability, cash flow generation, and capital structure. These measures are widely used in credit outlook and credit risk literature and are selected to balance economic relevance with interpretability.
Differentiating between negative, neutral and positive outlooks enables a richer and economically more relevant picture of corporate credit outlook than simple distressed/not distressed signals (
Altman, 1968;
Ohlson, 1980;
Shumway, 2001). We emphasize that the objective of this study is not to predict external rating-agency outlooks or market-implied credit signals, but rather to model accounting-based credit risk regimes derived from firm fundamentals. The dependent variable should therefore be interpreted as a fundamentals-driven proxy for underlying financial condition and distance-to-default dynamics rather than as a direct substitute for agency-issued credit outlooks. While the outlook categories are constructed using Altman-style thresholds, the machine learning models do not mechanically replicate the original Z-score formulation because they estimate nonlinear classification boundaries and interaction effects across the financial variables rather than a fixed linear weighting scheme. Accordingly, the study should be viewed as examining whether nonlinear machine learning architectures improve the mapping between firm fundamentals and accounting-based credit risk states.
- (1)
Capital Productivity;
- (2)
Return on Assets (ROA);
- (3)
Cash Generation Ratio;
- (4)
Capital Adequacy;
- (5)
Current Excess Cash Flow (%).
Each of these measures captures a distinct dimension of financial resilience, ranging from operational efficiency to leverage sustainability, and together they form the input feature set for the machine learning models. All variables were examined for outliers and normalized to ensure comparability across firms and prevent bias in model estimation.
4.3. Capital Productivity
Capital Productivity is indicated by the Total Asset Turnover Ratio. This profitability ratio indicates how well the assets of a business are used to generate revenue. To calculate Total Asset turnover, take either Gross Revenues or Net Sales and divide by Total Assets. The higher the resulting ratio, the better. The lower the ratio, the worse you are at utilizing your assets/resources. Capital Productivity is of great concern to manufacturers since many industries fall into the category of capital-intensive businesses, therefore affecting profitability and solvency (
Beaver, 1966;
Altman, 1968;
Frydman et al., 1985;
Barboza et al., 2017).
4.4. Return on Assets (ROA)
Return on Assets (ROA) measures a company’s profitability against its Total Assets, calculated as Net Income divided by Total Assets. ROA shows how well investments generate earnings; consistently low ROA, especially below debt interest rates, signals financial risk and potential trouble meeting obligations (
Beaver, 1966;
Altman, 1968;
Ohlson, 1980;
Shumway, 2001).
4.5. Cash Generation Ratio
The Cash Flow as a Percentage of Total Liabilities shows how much cash a firm generates compared to its financial obligations, calculated as Net Income plus Depreciation Expense divided by Total Liabilities. A high ratio indicates strong liquidity and repayment ability, while a low ratio suggests limited cash flow. This metric connects profitability to liability management and tests a firm’s creditworthiness (
Beaver, 1966;
Shumway, 2001;
Hillegeist et al., 2004;
Sun et al., 2014).
4.6. Capital Adequacy
Capital Adequacy measures a firm’s leverage and long-term solvency, calculated as Total Liabilities divided by (Equity plus Long-Term Liabilities). Lower ratios signal stronger capitalization and lower default risk, while higher ratios reflect greater vulnerability to credit shocks and less financial flexibility (
Altman, 1968;
Ohlson, 1980;
Agarwal & Taffler 2008).
4.7. Current Excess Cash Flow (%)
Current Excess Cash Flow measures discretionary liquidity. Current Excess Cash Flow is defined as operating cash flow minus capital expenditures divided by Total Liabilities. Since Current Excess Cash Flow shows how much cash is available to pay liabilities after covering capital expenditures, higher values indicate lower financial distress (
Beaver, 1966;
Altman, 2009;
Barboza et al., 2017;
Zhou et al., 2021).
After variables were constructed and standardized, the dataset was split into training and testing sets. Supervised learning models classified firms as positive, neutral, or negative based on financial data. Performance was checked with k-fold cross-validation to ensure generalizability. Metrics like accuracy, precision, recall, F1-score, and AUC measured classification effectiveness.
This framework also allows for comparison between models and handles imbalance within the data. Training multiple algorithms on the same data with the same variables showcases what each machine learning algorithm excels at while giving a larger systematic view on corporate creditworthiness.
The variables account for aspects of financial health that are complementary to each other and are found in both traditional forms of distress modeling as well as modern machine learning approaches (e.g.,
Beaver, 1966;
Altman, 1968;
Barboza et al., 2017).
4.8. Machine Learning Models
We evaluate six supervised machine learning classifiers:
Multinomial Logistic Regression.
k-Nearest Neighbor (k = 7).
Kernelized Support Vector Machine (RBF kernel).
Random Forest Classifier.
Gradient Boosting Classifier.
Extreme Gradient Boosting (XGBoost) Classifier.
Models range from similarity-based to margin-based to ensemble learning models. Many researchers have applied these models to assess credit risk and predict financial distress (e.g.,
Min & Lee, 2005;
Lessmann et al., 2015). Further, we chose hyperparameters based on standard defaults from the literature and the values deemed empirically stable to allow for comparison between models.
4.9. Model Evaluation and Validation Strategy
To ensure robust performance assessment and avoid overfitting, model evaluation is conducted under multiple validation frameworks:
Stratified Train–Test Split (67/33).
10-fold Cross-Validation.
Repeated Stratified Cross-Validation (10 × 2).
Leave-One-Out Cross-Validation.
Stratification preserves class proportions across training and testing samples, which is essential given the multiclass structure of the outcome variable.
Model performance is assessed primarily using classification accuracy, supplemented by confusion matrices to examine class-specific prediction behavior. It is particularly important to minimize Type II errors in credit risk evaluation, since failing to detect financially troubled companies typically leads to greater costs than incorrectly identifying firms as distressed. This emphasis aligns with prior studies highlighting the asymmetric costs of distress misclassification (e.g.,
Altman & Sabato, 2007).
4.10. Model Interpretability
To make machine learning models more interpretable, model predictions are broken down into contributions from individual features using SHAP (SHapley Additive exPlanations) values (
Lundberg & Lee, 2017). SHAP values are computed mainly for the ensemble models (Random Forest, Gradient Boosting, XGBoost) to determine which financial variables are contributing to model predictions and whether the models produce economically coherent predictions.
By integrating explainability into the evaluation framework, the study ensures that performance gains are grounded in economically meaningful signals rather than opaque or spurious patterns, thereby enhancing the practical relevance of the findings.
4.11. Data Characteristics
The empirical sample is derived from the Corporate Outlook database and consists of 1914 publicly traded U.S. manufacturing firms classified under SIC codes 2000–3999 and 5000–5999. The study focuses on non-financial firms to ensure consistency with Altman’s original manufacturing Z-Score specification.
Outlook categories are constructed using Altman’s manufacturing thresholds applied to the predicted Z Score. Firms are classified into three mutually exclusive states:
Credit 1 (Negative Outlook): Z < 1.81;
Credit 2 (Neutral Outlook): 1.81 ≤ Z ≤ 2.99;
Credit 3 (Positive Outlook): Z > 2.99.
This classification aligns with the classic Distress, Gray, and Safe Zones found in structural credit risk studies, offering a well-founded multiclass framework for evaluating credit transitions.
4.12. Distribution Across Outlook Classes
The class distribution is as follows:
176 firms (9.20%) are classified as Negative Outlook;
427 firms (22.31%) as Neutral Outlook;
1311 firms (68.50%) as Positive Outlook.
Distribution of classes is significantly imbalanced toward the Positive outlook class (about 68.5% of sample). This is not surprising from an economic standpoint, because the majority of public manufacturing companies should fall outside the distress zone at any given time.
Nonetheless, this also means that there is a class imbalance problem. Any model can have a high overall accuracy by simply predicting Positive class the majority of the time. Therefore, we used stratified sampling for all model validations to avoid this issue (train–test split will have an equal proportion of classes).
In addition to assessing overall accuracy, we evaluated model performance using class-sensitive metrics, including precision, recall, and F1-scores for each outlook category. Further, we also focused on the Negative outlook class. Although representing only 9.2% of the sample, Negative outlook class carries disproportionate economic importance due to the asymmetric cost of misclassification.
More importantly, rather than being driven solely by majority-class prediction, we observed the superior performance of nonlinear classifiers across all three outlook states. This indicates that performance gains reflect improved nonlinear separability consistent with structural convexity in credit risk rather than exploitation of class frequency.
Table 1 presents summary statistics for the financial variables across negative, neutral, and positive outlook categories.
The summary statistics give a good picture of how well the companies in the sample are doing financially and how well they run their businesses. The average firm in the complete sample has moderate Capital Productivity with a mean of 1.08, but there is a lot of cross-sectional variation with a standard deviation of 0.75, which means that enterprises use capital in very different ways. The average Return on Assets (ROA) is 4.27 percent, but there is a lot of variation with a standard deviation of 13.79, indicating both profitable and unprofitable enterprises in the sample. Cash creation is much more unpredictable, with a mean of 31.11 percent and a very high standard deviation of 82.43. This shows that companies’ operating cash flow performance is very different from each other. The average Capital Adequacy is 59.67 percent, which means that most companies have enough capital to cover their costs. However, the substantial standard deviation (48.20) shows that some companies are not very financially stable. Finally, the average excess cash flow is 13.13 percent implying a small amount of extra cash flow on average, but large variation. Consequently, some companies have more financial flexibility, while others have little or no liquidity buffers.
Further, a breakdown of the sample by credit rating shows a consistent link between rating and firm performance. Companies with the lowest credit rating (Rating = 1) are usually in trouble with their money. They have negative average ROA (−9.56%), cash generation (−5.51%), and excess cash flow (−10.23%). This means they may be losing money or not able to create enough cash flow on their own. Further, their Capital Adequacy measure is elevated (87.98%), but the standard deviation is very large (236.92) indicating an unstable measure and probably including some very troubled companies with either very low or very high levels of capital.
Firms with a rating of 2 (those receiving an intermediate rating) perform better. Their ROA turns positive (0.77%) and they generate more cash (9.14%) and excess cash flow (3.02%) than firms in Rating 1. Capital Productivity also increases to 0.93. The reduction in the standard deviations of the variables indicates that these firms are in a better financial position than their lower-rated counterparts.
Financial metrics presented by the top performing group (Rating = 3) are predictably the strongest among all groups. They are found to have the highest Capital Productivity (1.07), highest positive ROA (4.99%) and highest cash generation (36.08%). Even excess cash flow increases to 15.02%. The lower Capital Adequacy ratio (49.55%) suggests lower leverage exposure and greater financial stability among healthier firms.
The statistics in
Table 1 show that firms with stronger finances (Rating 3) tend to be more productive, profitable, liquid and stable. Firms in Rating 1 show some signs of operating stress and financial distress, suffering losses and generating poor cash flows. The notable statistical differences across credit ratings validate the utility of these rating categories and establishes an empirical basis for modeling the outlook/predictive classification that follows.
Furthermore, the significant dispersion in liquidity and profitability ratios justifies the use of nonlinear classification models as these variables embody transitional solvency characteristics not readily captured by traditional linear specifications.
5. Empirical Results
This section presents the empirical findings with a comparative analysis of linear and nonlinear classifiers in predicting multiclass corporate credit outlook. We organized our empirical results around three key findings: (i) the poor performance of linear models, (ii) improved performance stemming from nonlinear classification, and (iii) equivalence in performance across nonlinear specifications.
5.1. Model Specifications and Hyperparameter Selection
To assure comparability and fairness of model evaluation, we integrated all classifiers using the same pre-processing and evaluation pipeline. Further, we imputed and scaled the numerical data using the median. In addition, we one-hot encoded categorical variables and imputed using the most frequent category and, importantly, to prevent such information leakage to the testing data during cross-validation, we applied all pre-processing actions within the training folds.
Likewise, we selected the hyperparameters using only the training data, before the out-of-sample evaluation. Finally, the chosen configurations reflect a combination of previous empirical literature, initial validation studies, and stability concerns to achieve a compromise between predicted accuracy, generalizability, and computing practicality. The primary goal of this study is comparative model evaluation, not exhaustive hyper-parameter optimization. Therefore, we used stable and common parameterizations for all models in the analysis. This approach ensures that the observed differences in predictive performance are mainly due to model structure rather than the level of tuning.
To begin with, we employed Logistic Regression, a widely used model in credit risk and bankruptcy prediction research, as the benchmark parametric classifier. We estimated the model using the LBFGS optimization algorithm with a maximum of 2000 iterations to ensure convergence stability in the multiclass setting. Logistic Regression provides an interpretable linear benchmark against which the predictive gains of more complex nonlinear models can be evaluated.
Next, we implemented the XGBoost Classifier to capture nonlinear interactions and hierarchical relationships among financial variables. The model employed 600 estimators, a maximum tree depth of four, a learning rate of 0.05, a subsample ratio of 0.90, a column subsample ratio of 0.90, and an L2 regularization parameter (lambda) of 1.0. Further, we specified the multiclass objective function using a multiclass softmax framework and used multiclass logarithmic loss as the evaluation metric. Finally, we selected the relatively low learning rate and moderate tree depth to improve generalization performance while mitigating overfitting.
We also employed the Random Forest Classifier as an ensemble-based nonlinear learning approach, that can capture complex variable interactions while reducing variance through bootstrap aggregation. The model utilized 500 Decision Trees with randomized feature selection at each split. We used this specification to stabilize predictive performance and reduce sensitivity to individual tree structures, thereby improving robustness relative to a single Decision Tree classifier.
We also used the Gradient Boosting Classifier to iteratively improve classification accuracy by sequentially correcting the residual errors generated by prior trees. Gradient Boosting effectively models nonlinearities and interaction effects while incrementally optimizing predictive performance and hence is very suitable for financial classification settings. The model employed controlled learning and randomization settings designed to maintain stability across repeated validation procedures.
The Kernelized Support Vector Machine (SVM) utilized a radial basis function (RBF) kernel to capture nonlinear decision boundaries among predictor variables and multiclass credit outlook categories. Prior research demonstrates RBF kernel’s effectiveness in high-dimensional classification problems characterized by nonlinear relationships. We estimated the SVM model using a regularization parameter of C = 1.0 and γ = “scale,” where gamma is automatically determined as a function of feature dimensionality and variance. Further, to facilitate multiclass probability predictions and ROC-AUC computations, we used probability estimation. Because SVM models are sensitive to differences in variable scale, we standardized all numerical variables prior to estimation.
Next, we implemented the k-Nearest Neighbor (kNN) classifier as a distance-based nonparametric learning approach that classifies observations according to the characteristics of neighboring firms within the feature space. We determined the optimal value of k using the elbow method applied exclusively within the training data. We evaluated multiple candidate values of k, and selected k = 7 that represented the point at which further increases in k generated only marginal improvements in classification performance while maintaining model stability and reducing sensitivity to noise. As with the SVM model, we standardized predictor variables because distance-based methods are highly sensitive to scale differences across features.
Finally, we evaluated all models using identical train–test partitions, preprocessing procedures, and validation structures to ensure comparability of results. Further, we assessed model performance using 10-fold cross-validation, repeated stratified cross-validation, and leave-one-out cross-validation (LOOCV). In addition, to perform pairwise model comparisons, we used both the Nadeau–Bengio corrected resampled t-test and the Dietterich 5×2 cross-validated paired t-test to account for potential dependence across validation folds and to provide a more rigorous statistical comparison framework.
5.2. Multinomial Logistic Regression Versus Nonlinear Models
For classification, there is a distinct and consistent difference between linear and nonlinear methods.
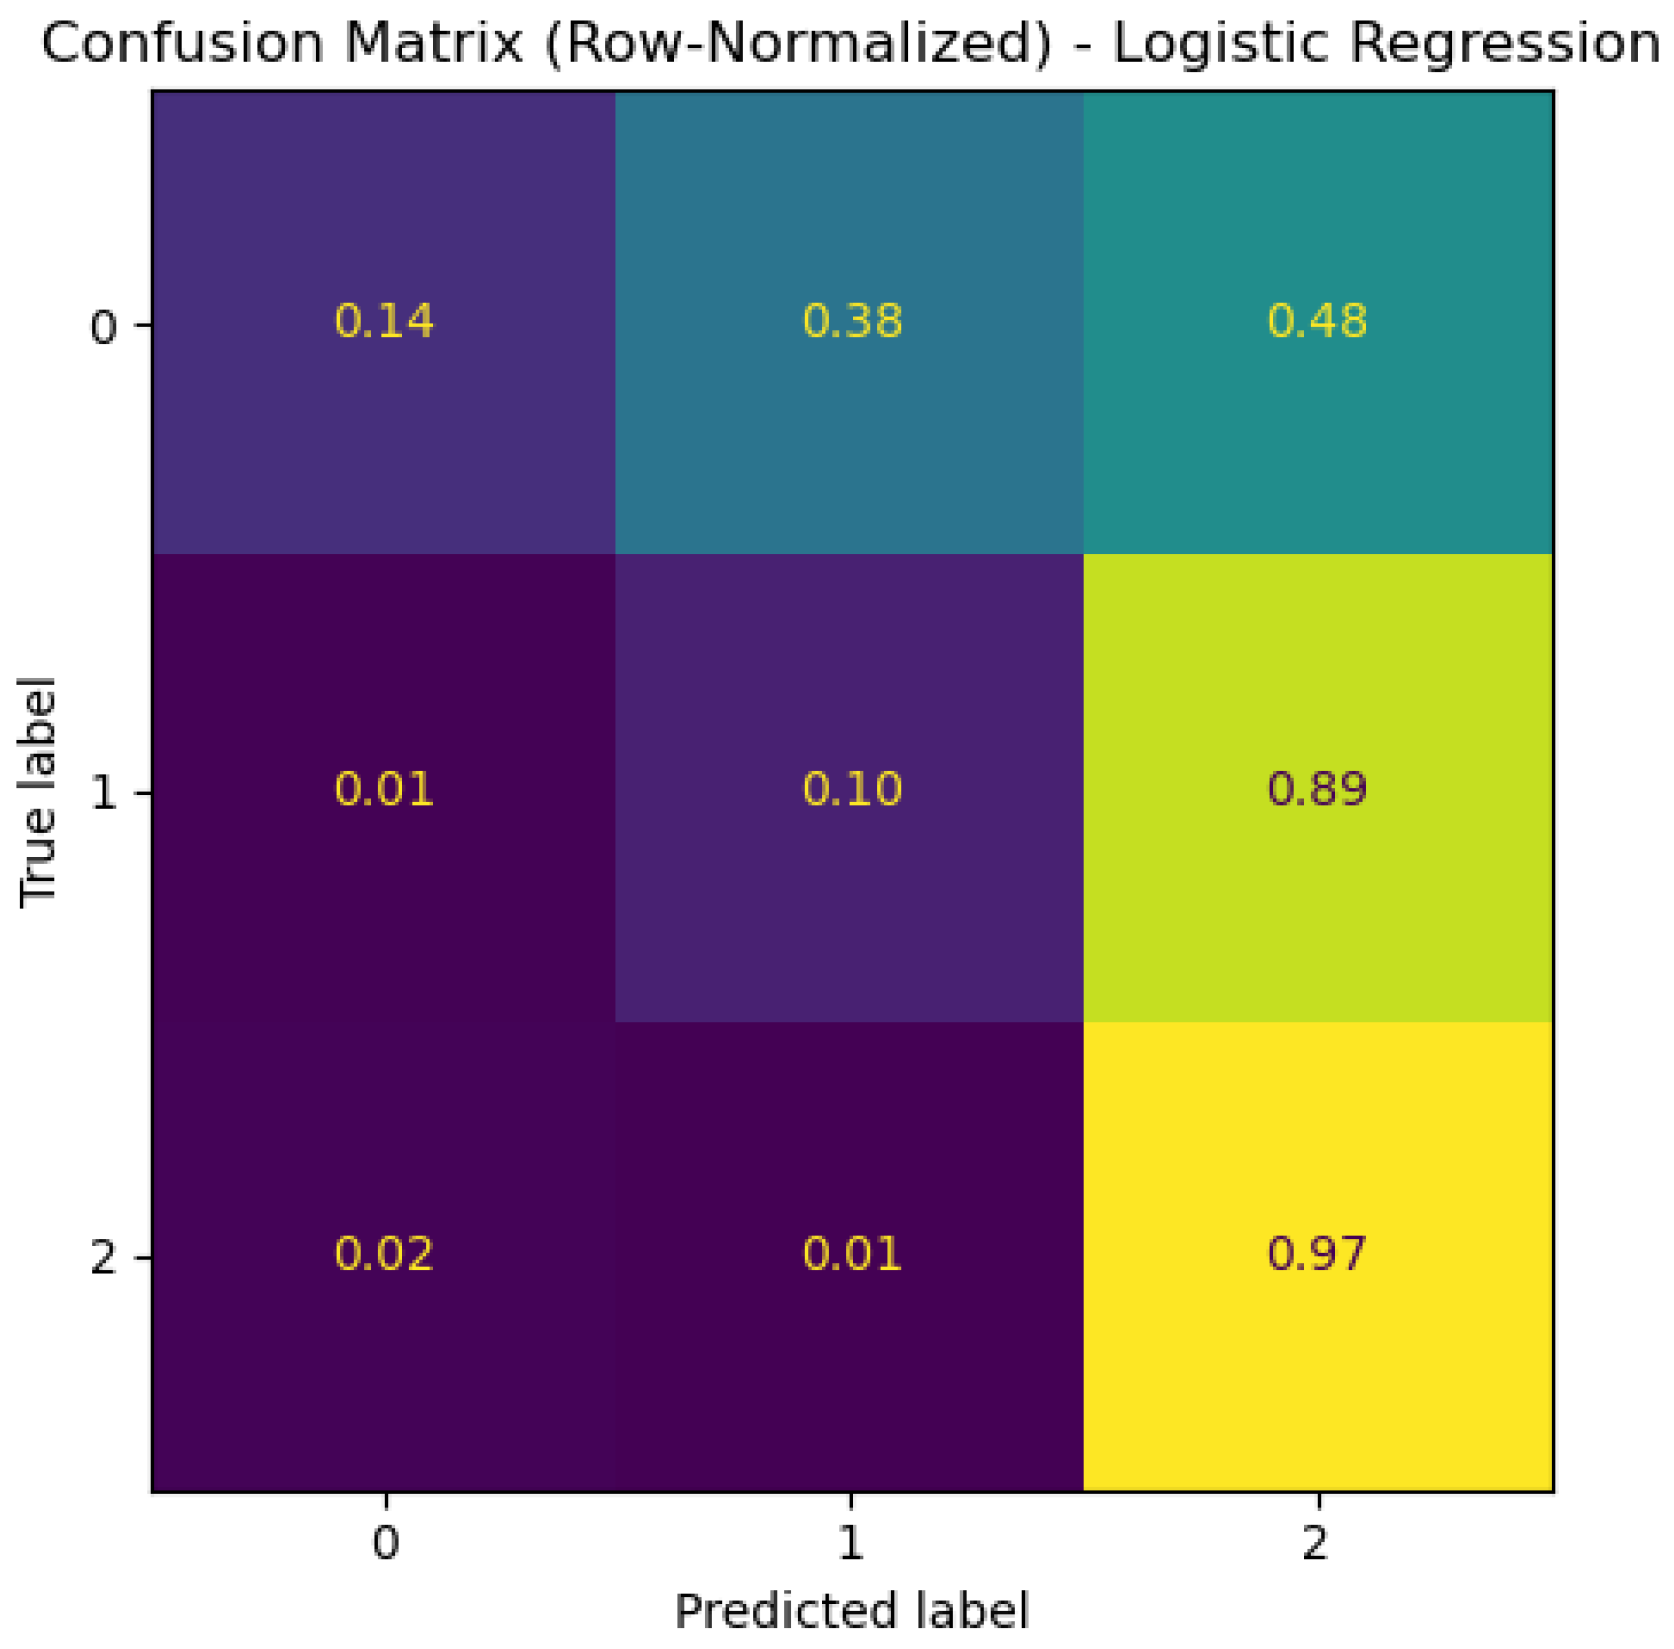
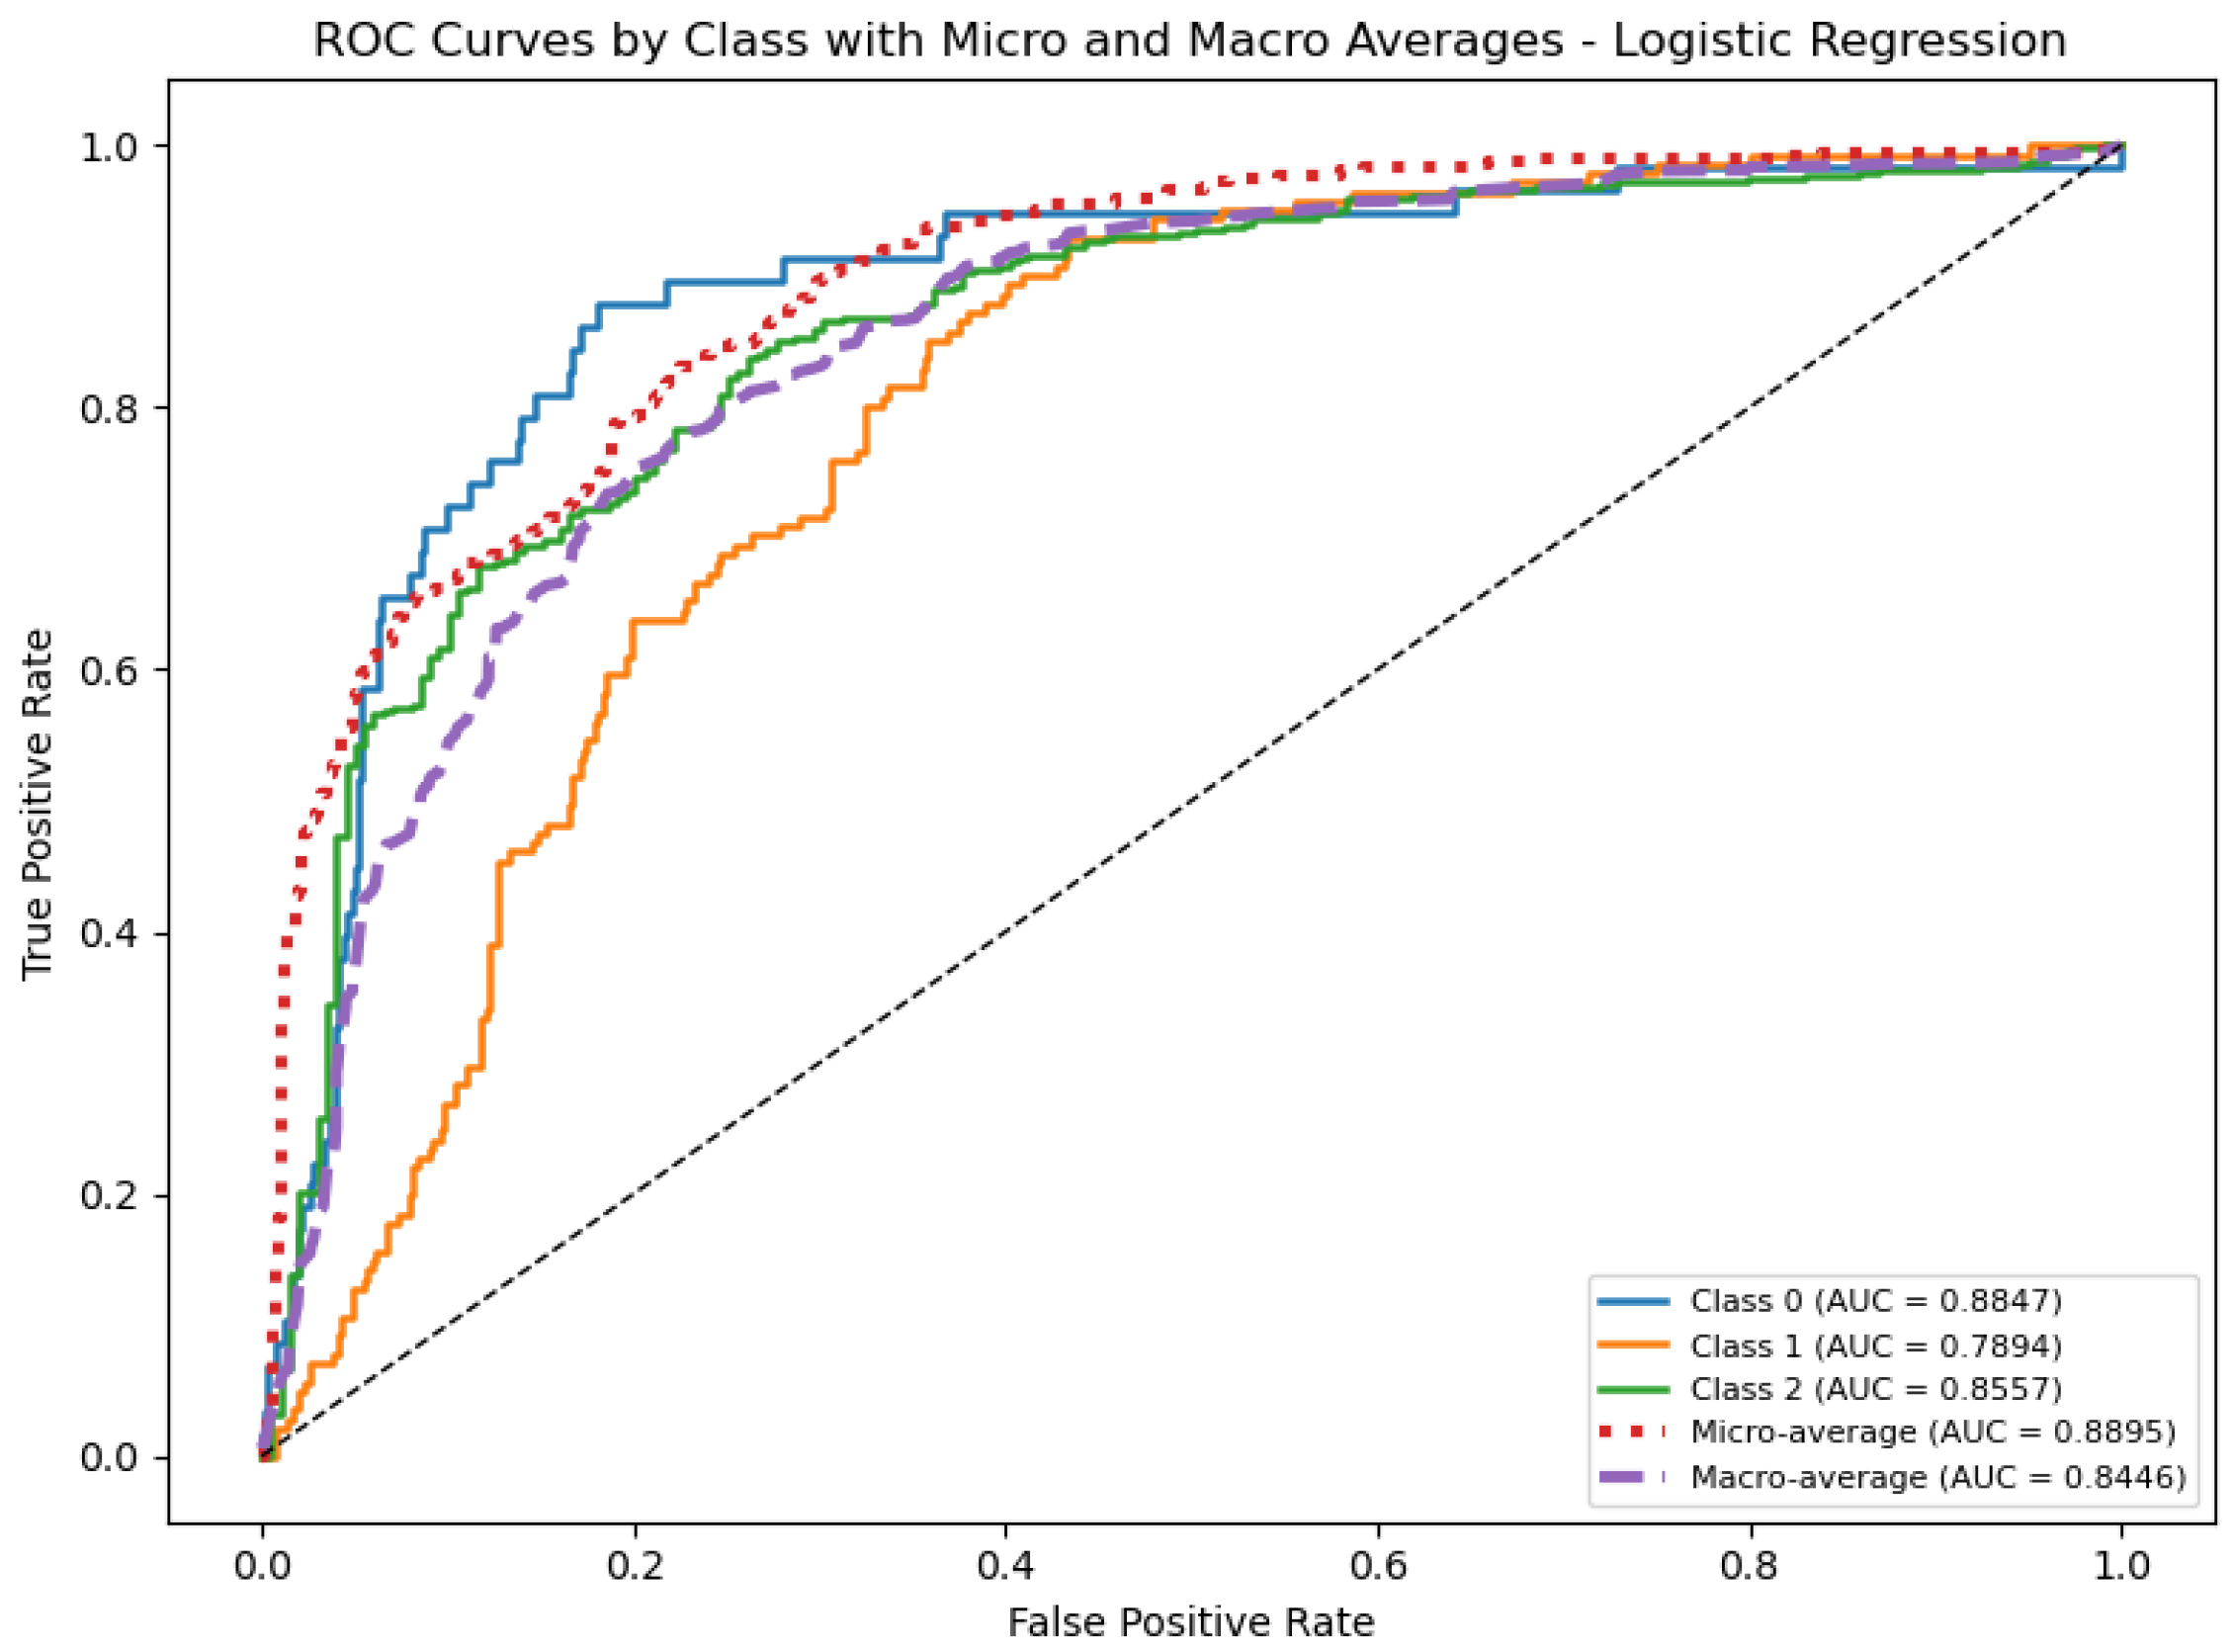
Figure 1 and
Figure 2 show results for the multinomial Logistic Regression baseline. This model has stable aggregate accuracy of about 69–70 percent. However, as this is an aggregate number it hides certain weaknesses. The model accurately classifies firms with positive outlooks but has significantly weaker ability to distinguish between negative and neutral outlooks. Errors are mostly near the decision boundary, with declining firms being generally misclassified as neutral. For credit risk purposes, this is a significant weakness as the model has poor ability to pick out financially distressed firms.
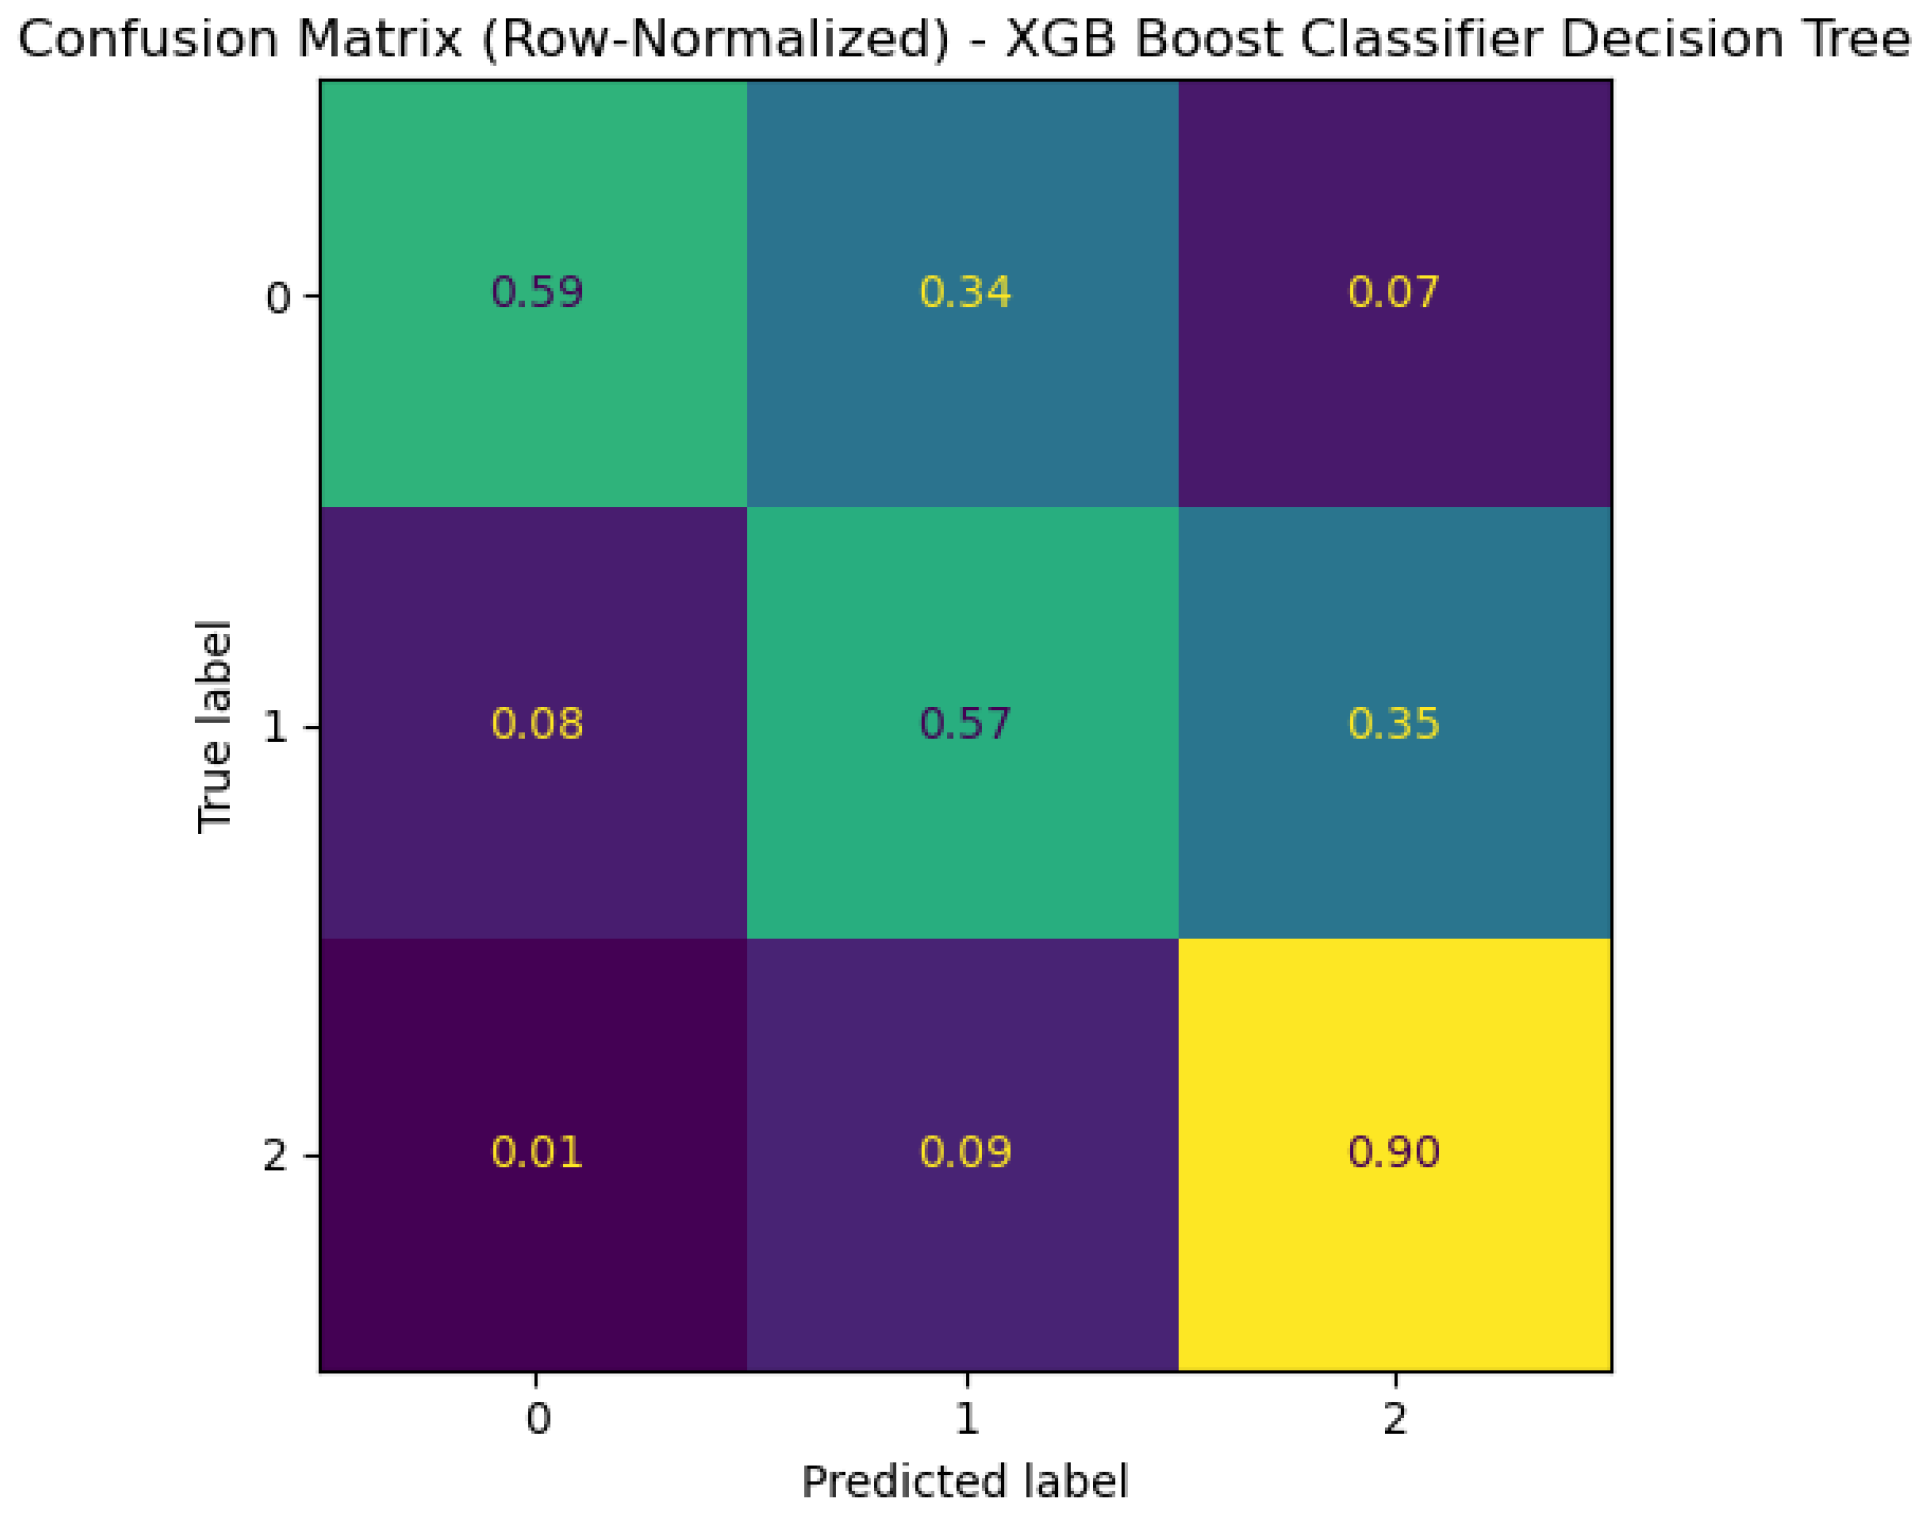
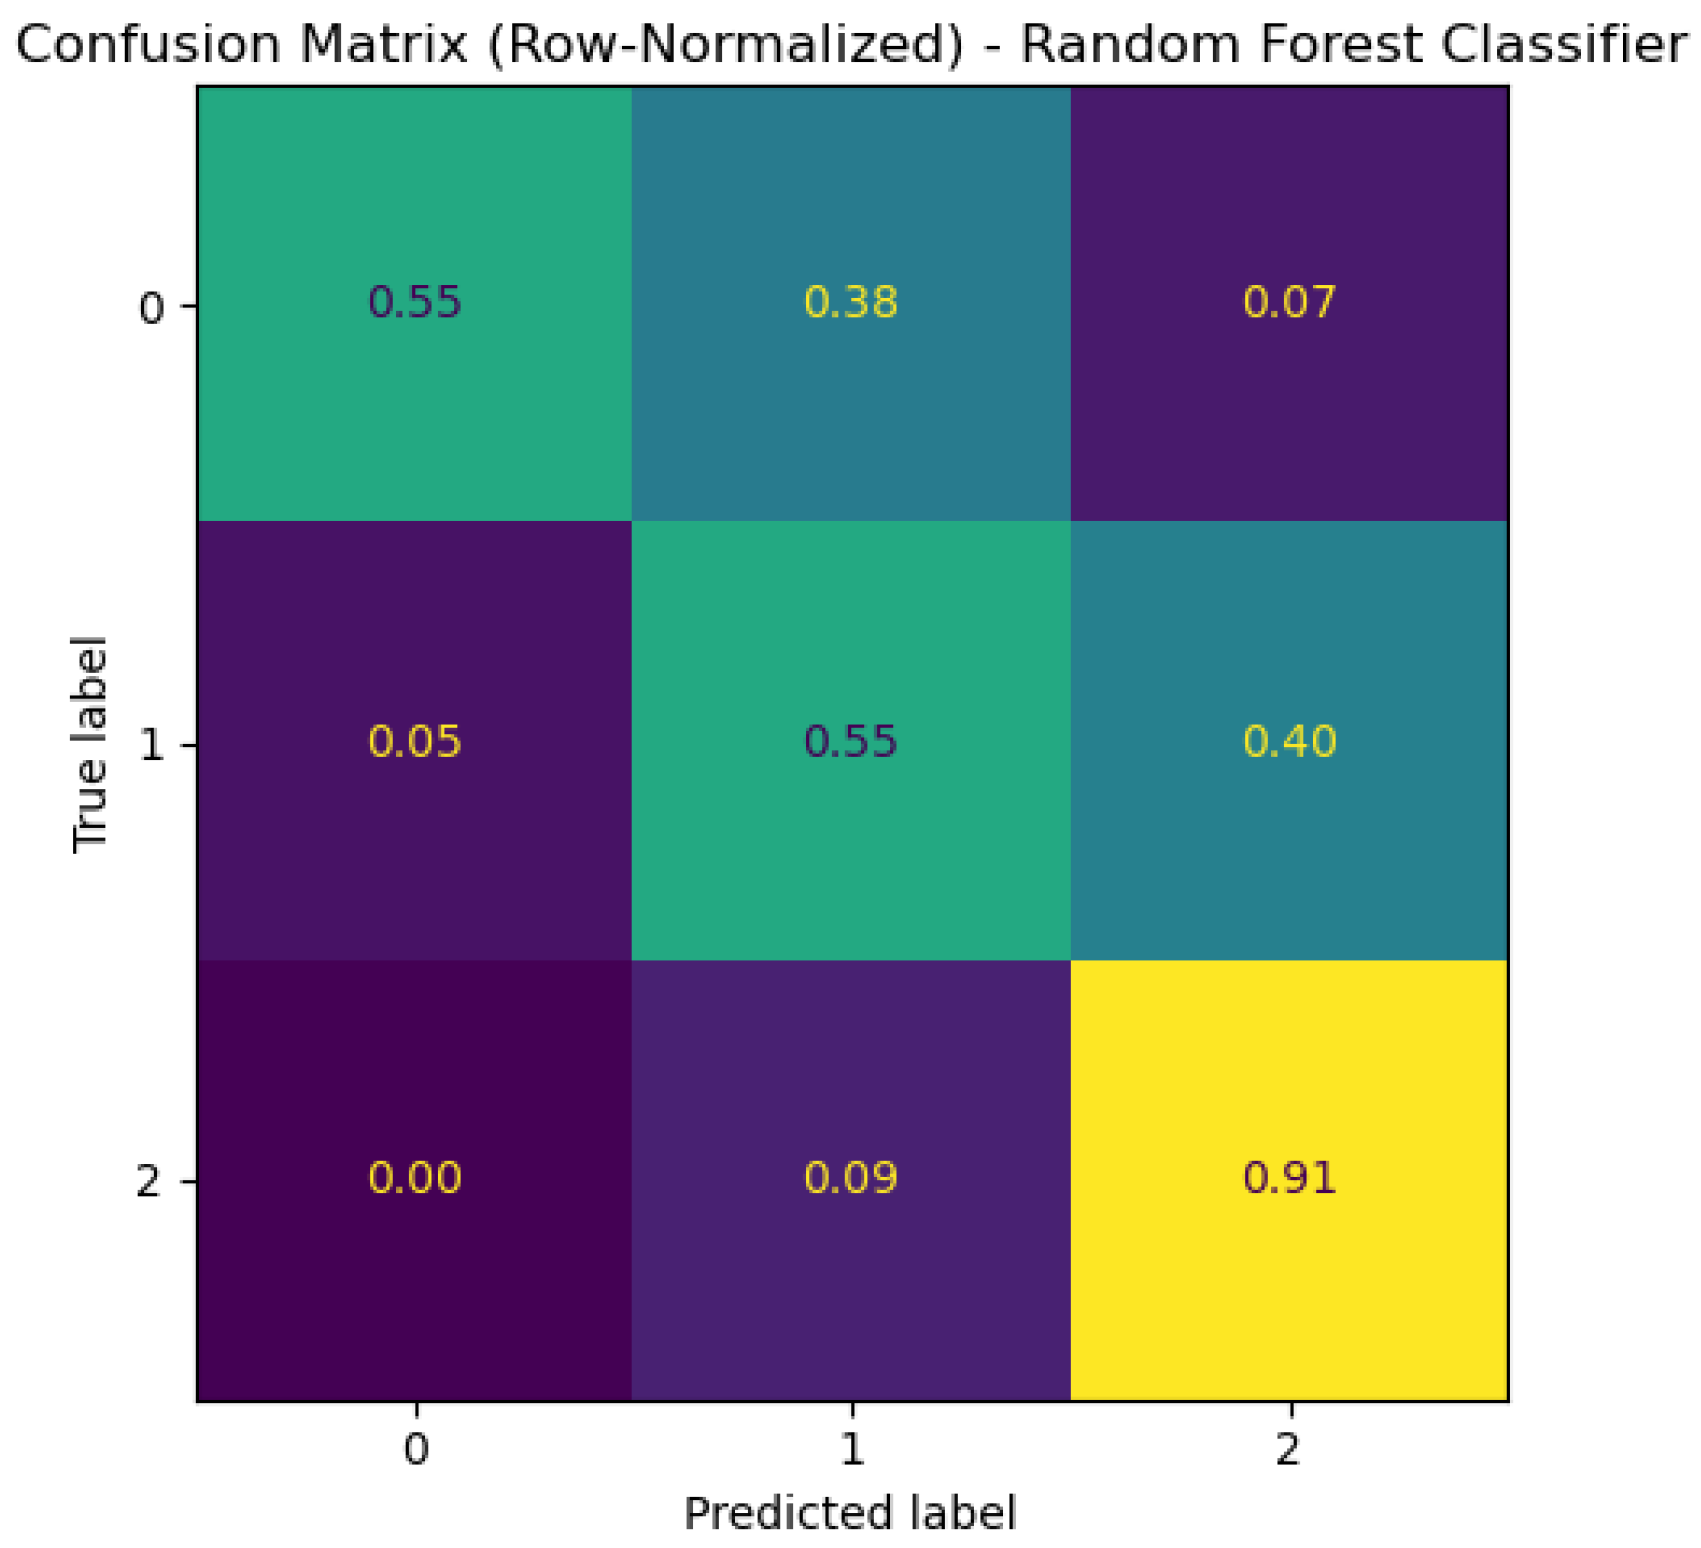
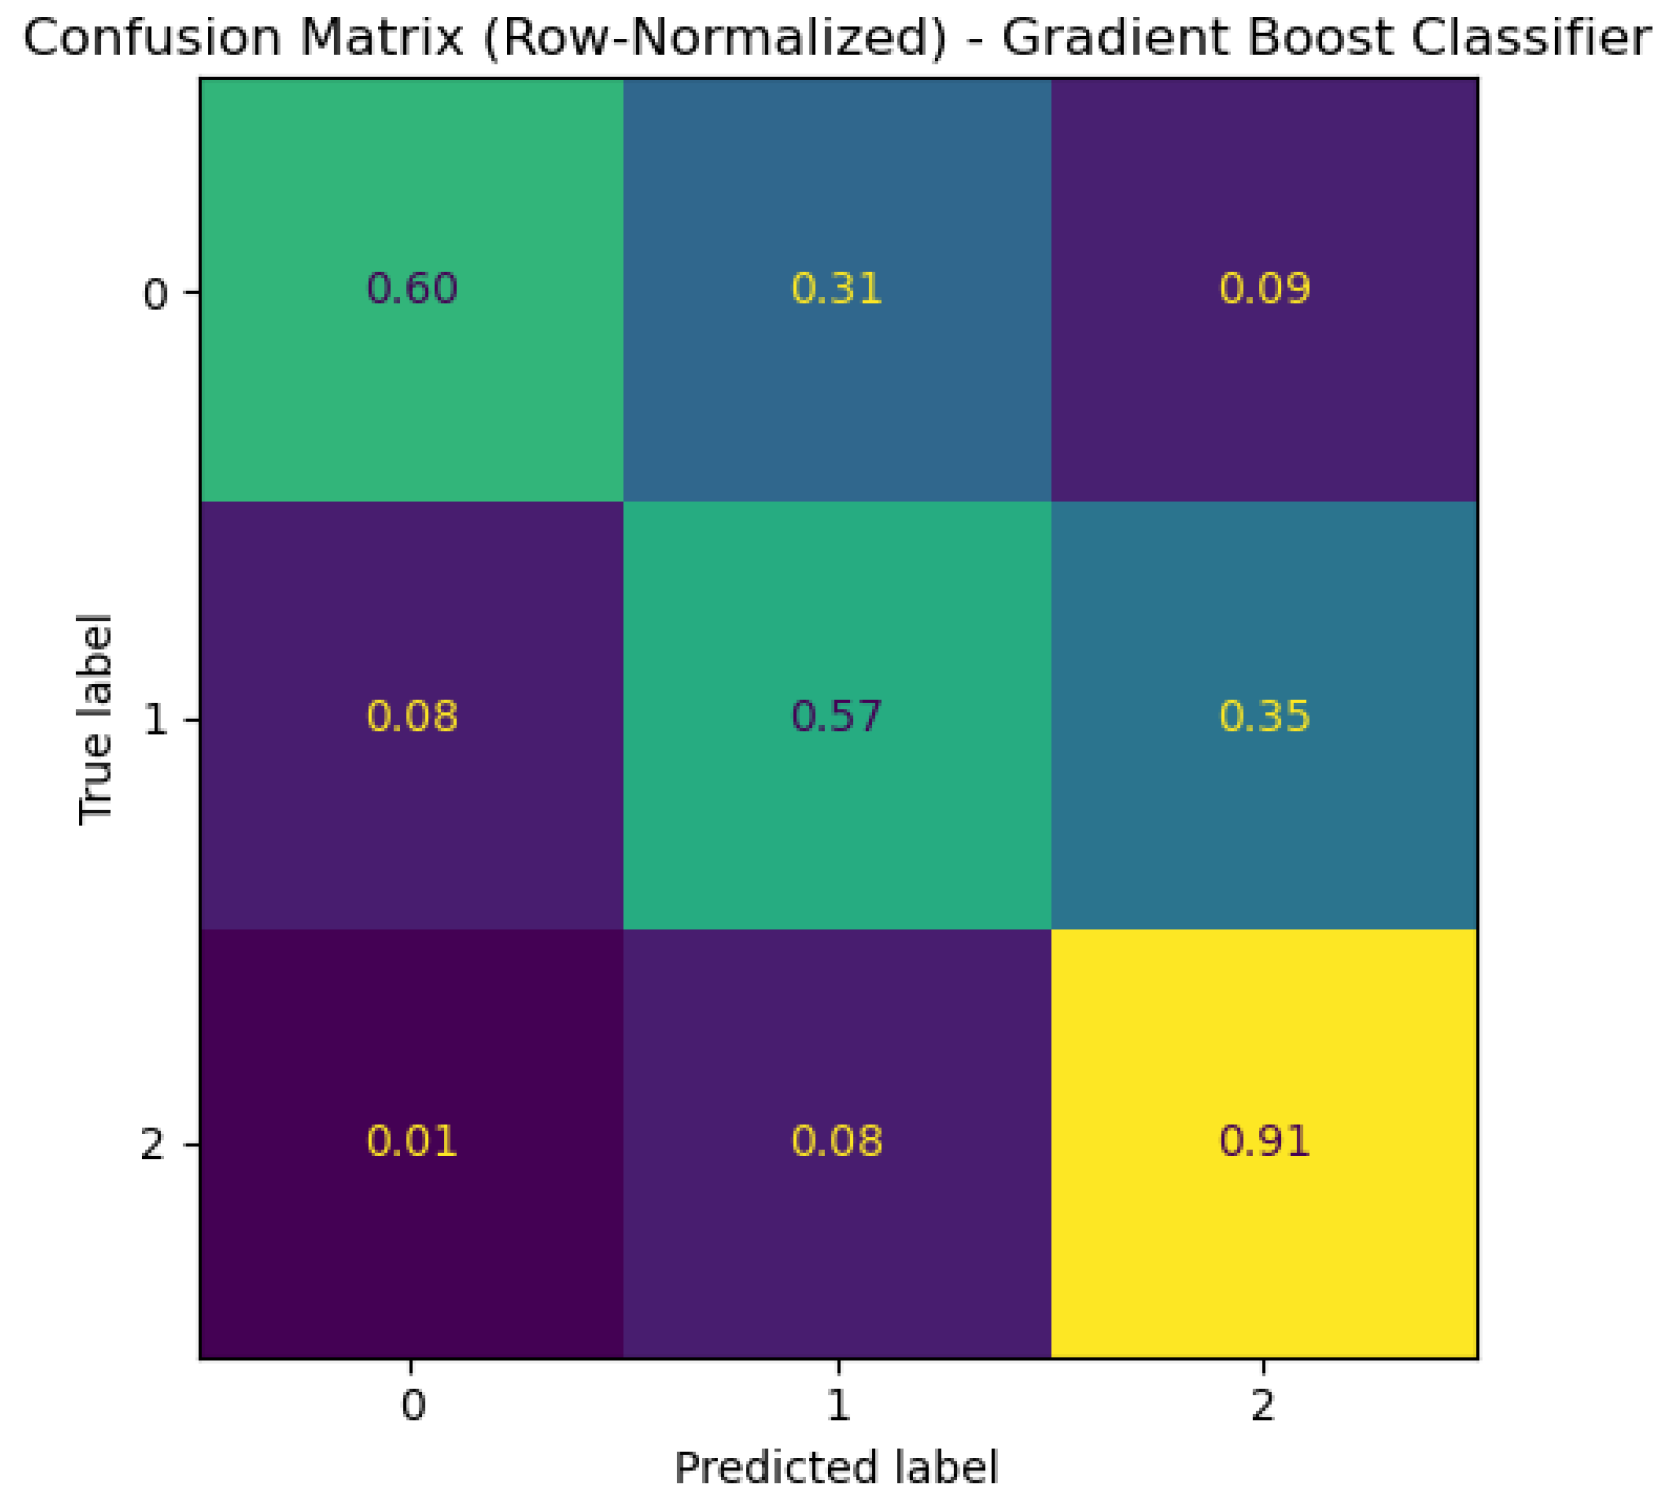
In contrast, the introduction of nonlinear classifiers produces a substantial and uniform improvement in predictive performance. As shown in
Figure 3,
Figure 4,
Figure 5,
Figure 6,
Figure 7,
Figure 8,
Figure 9,
Figure 10,
Figure 11 and
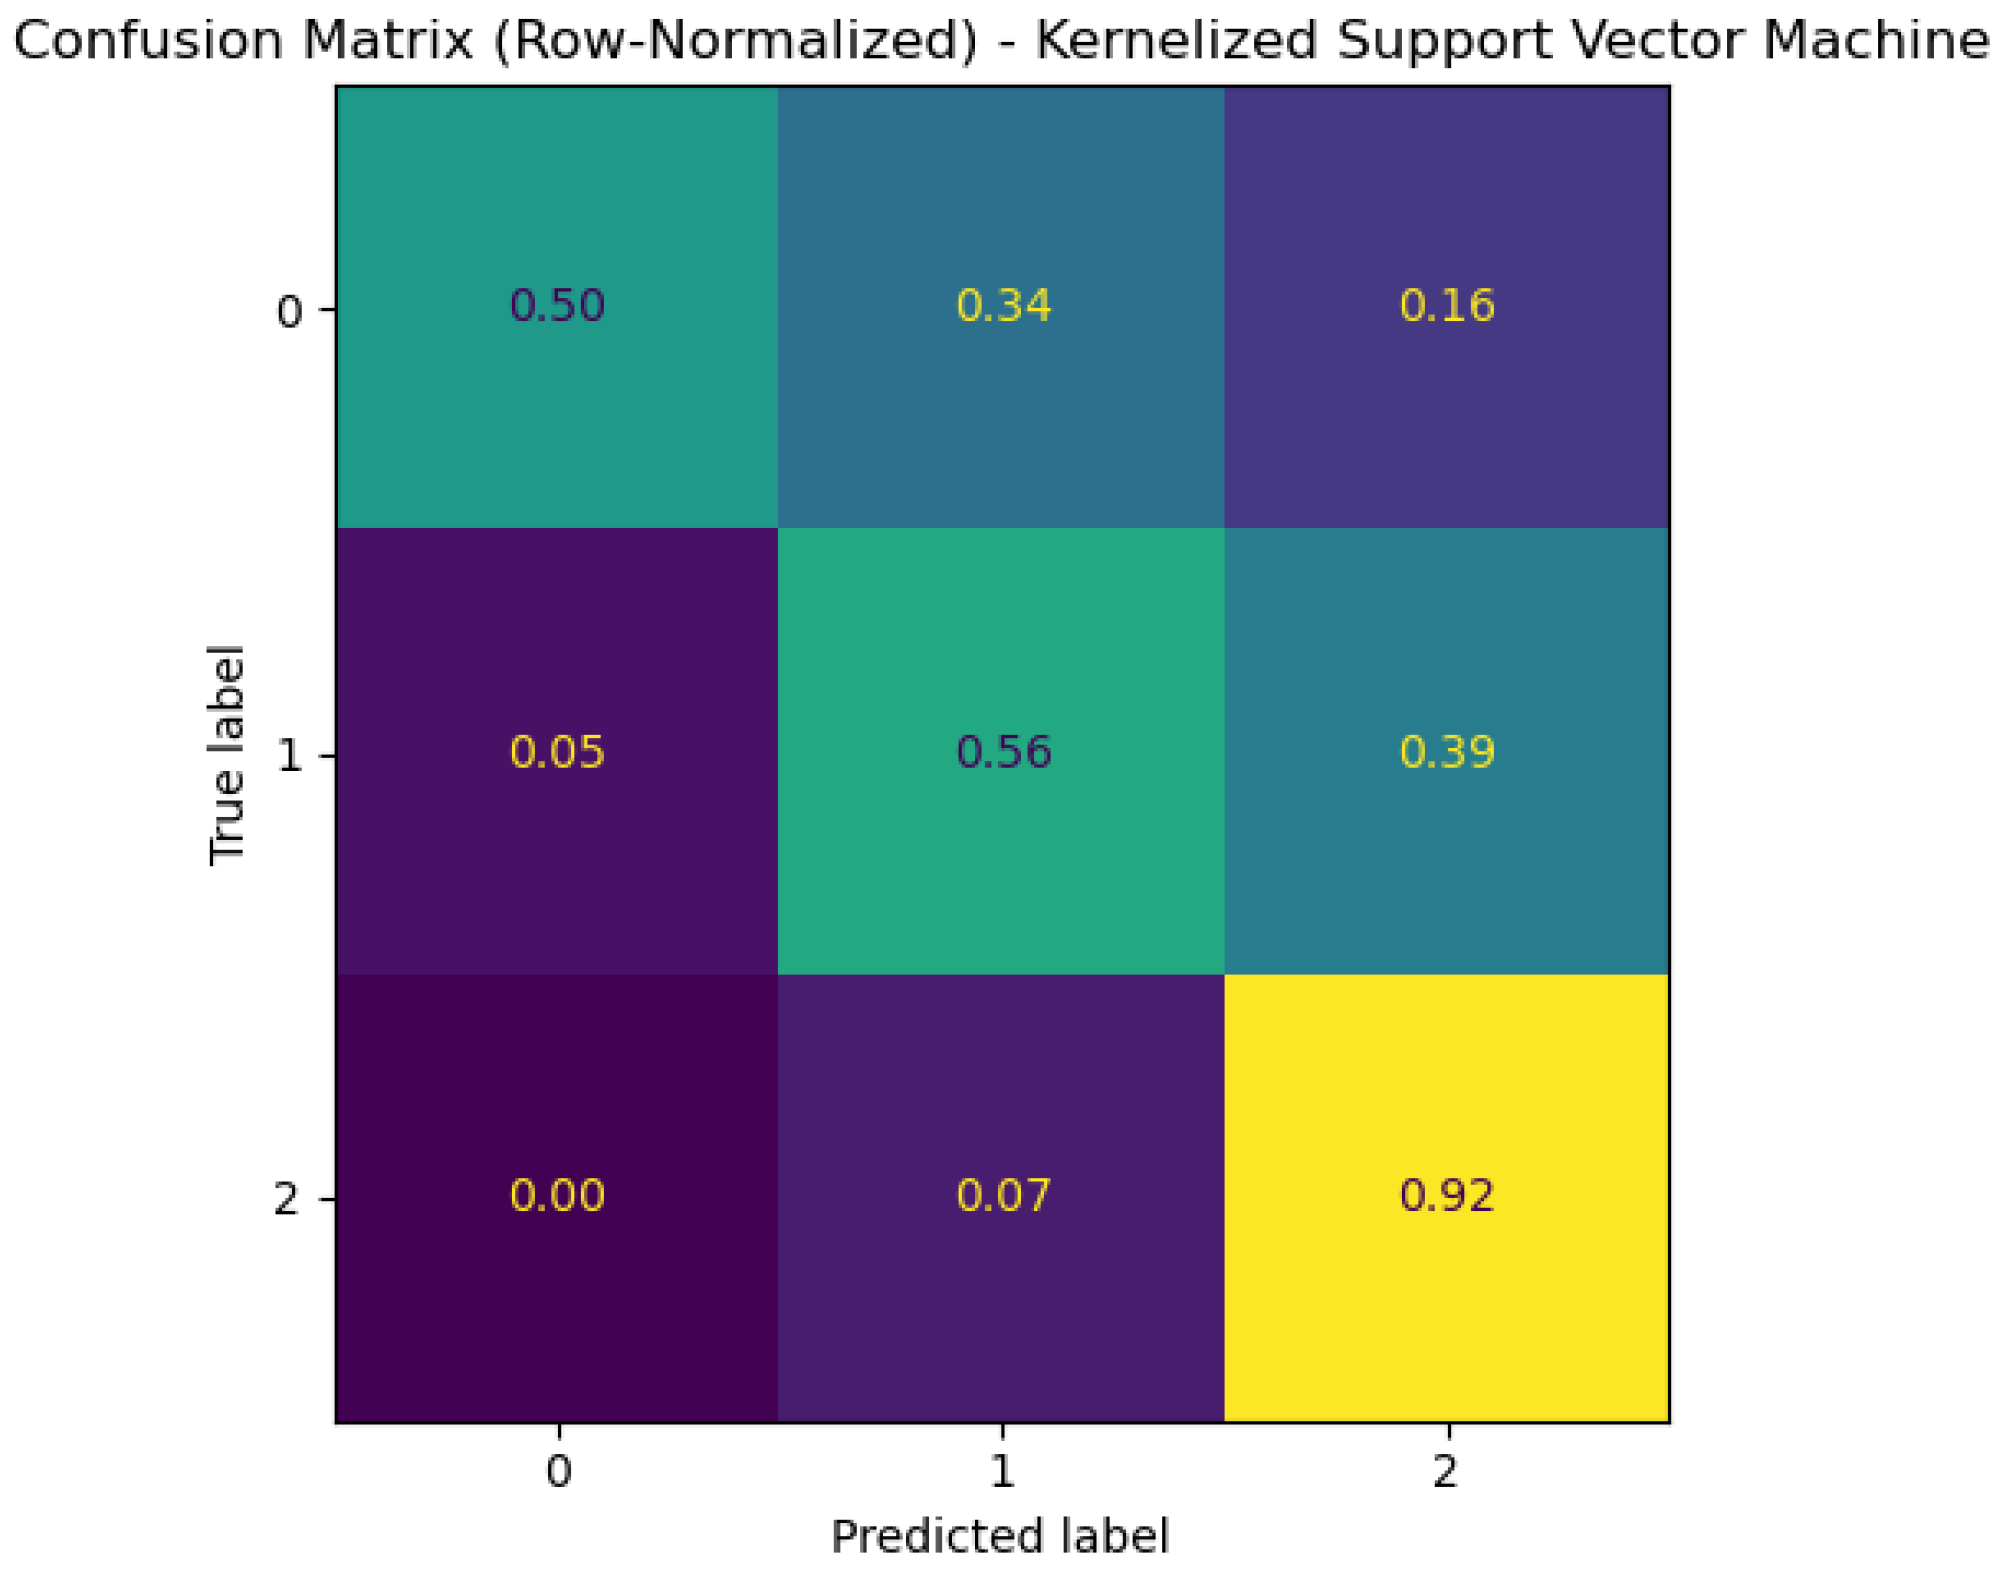
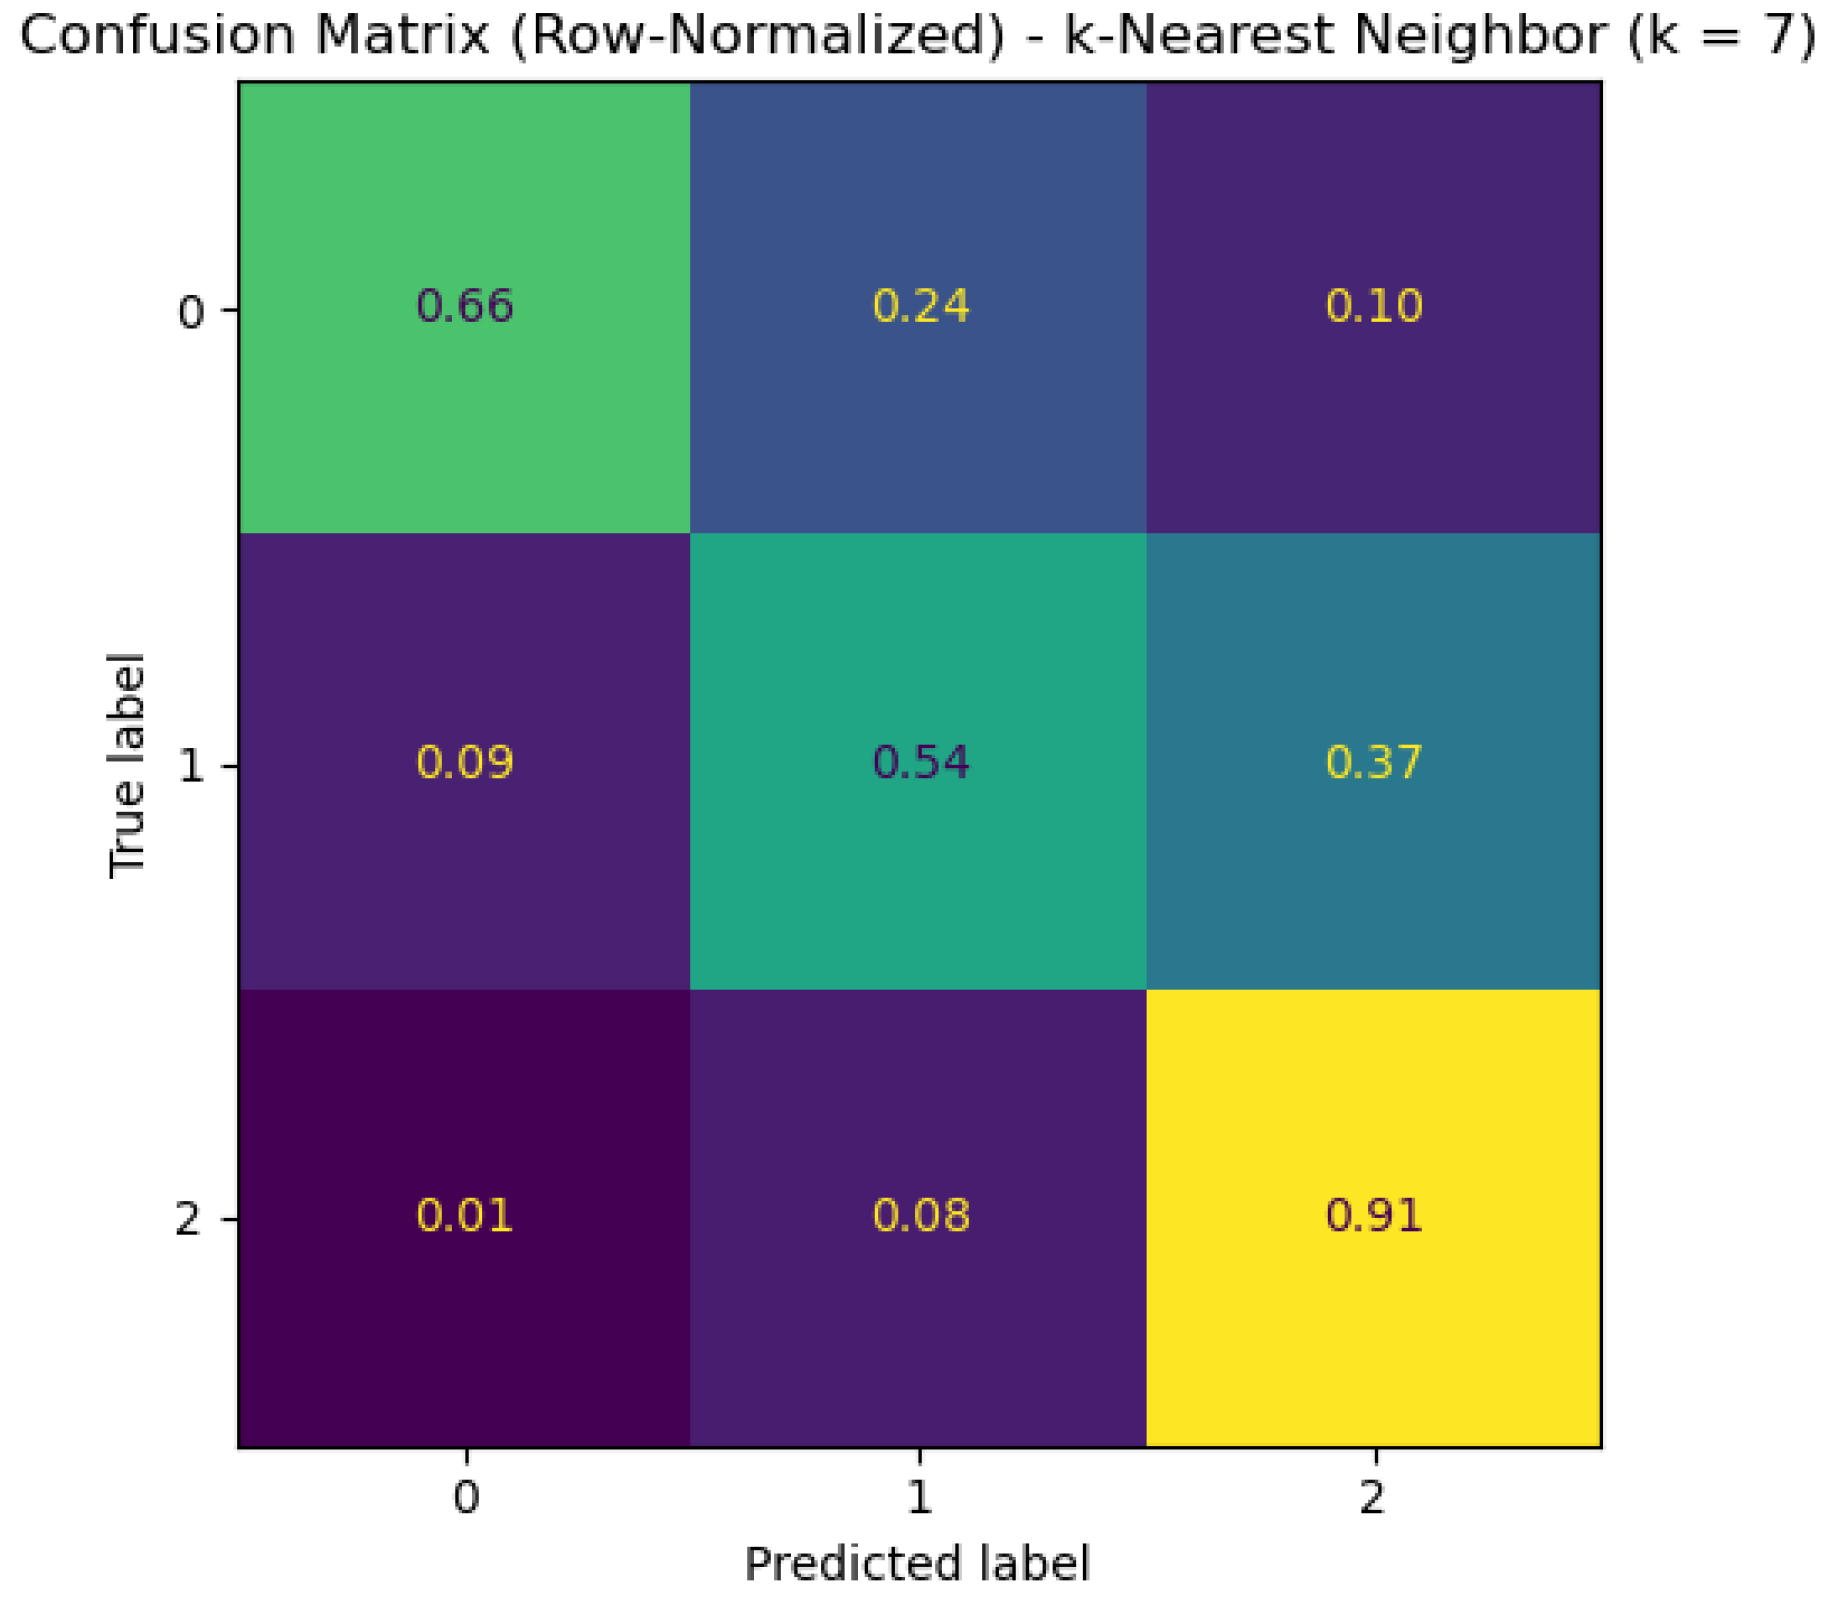
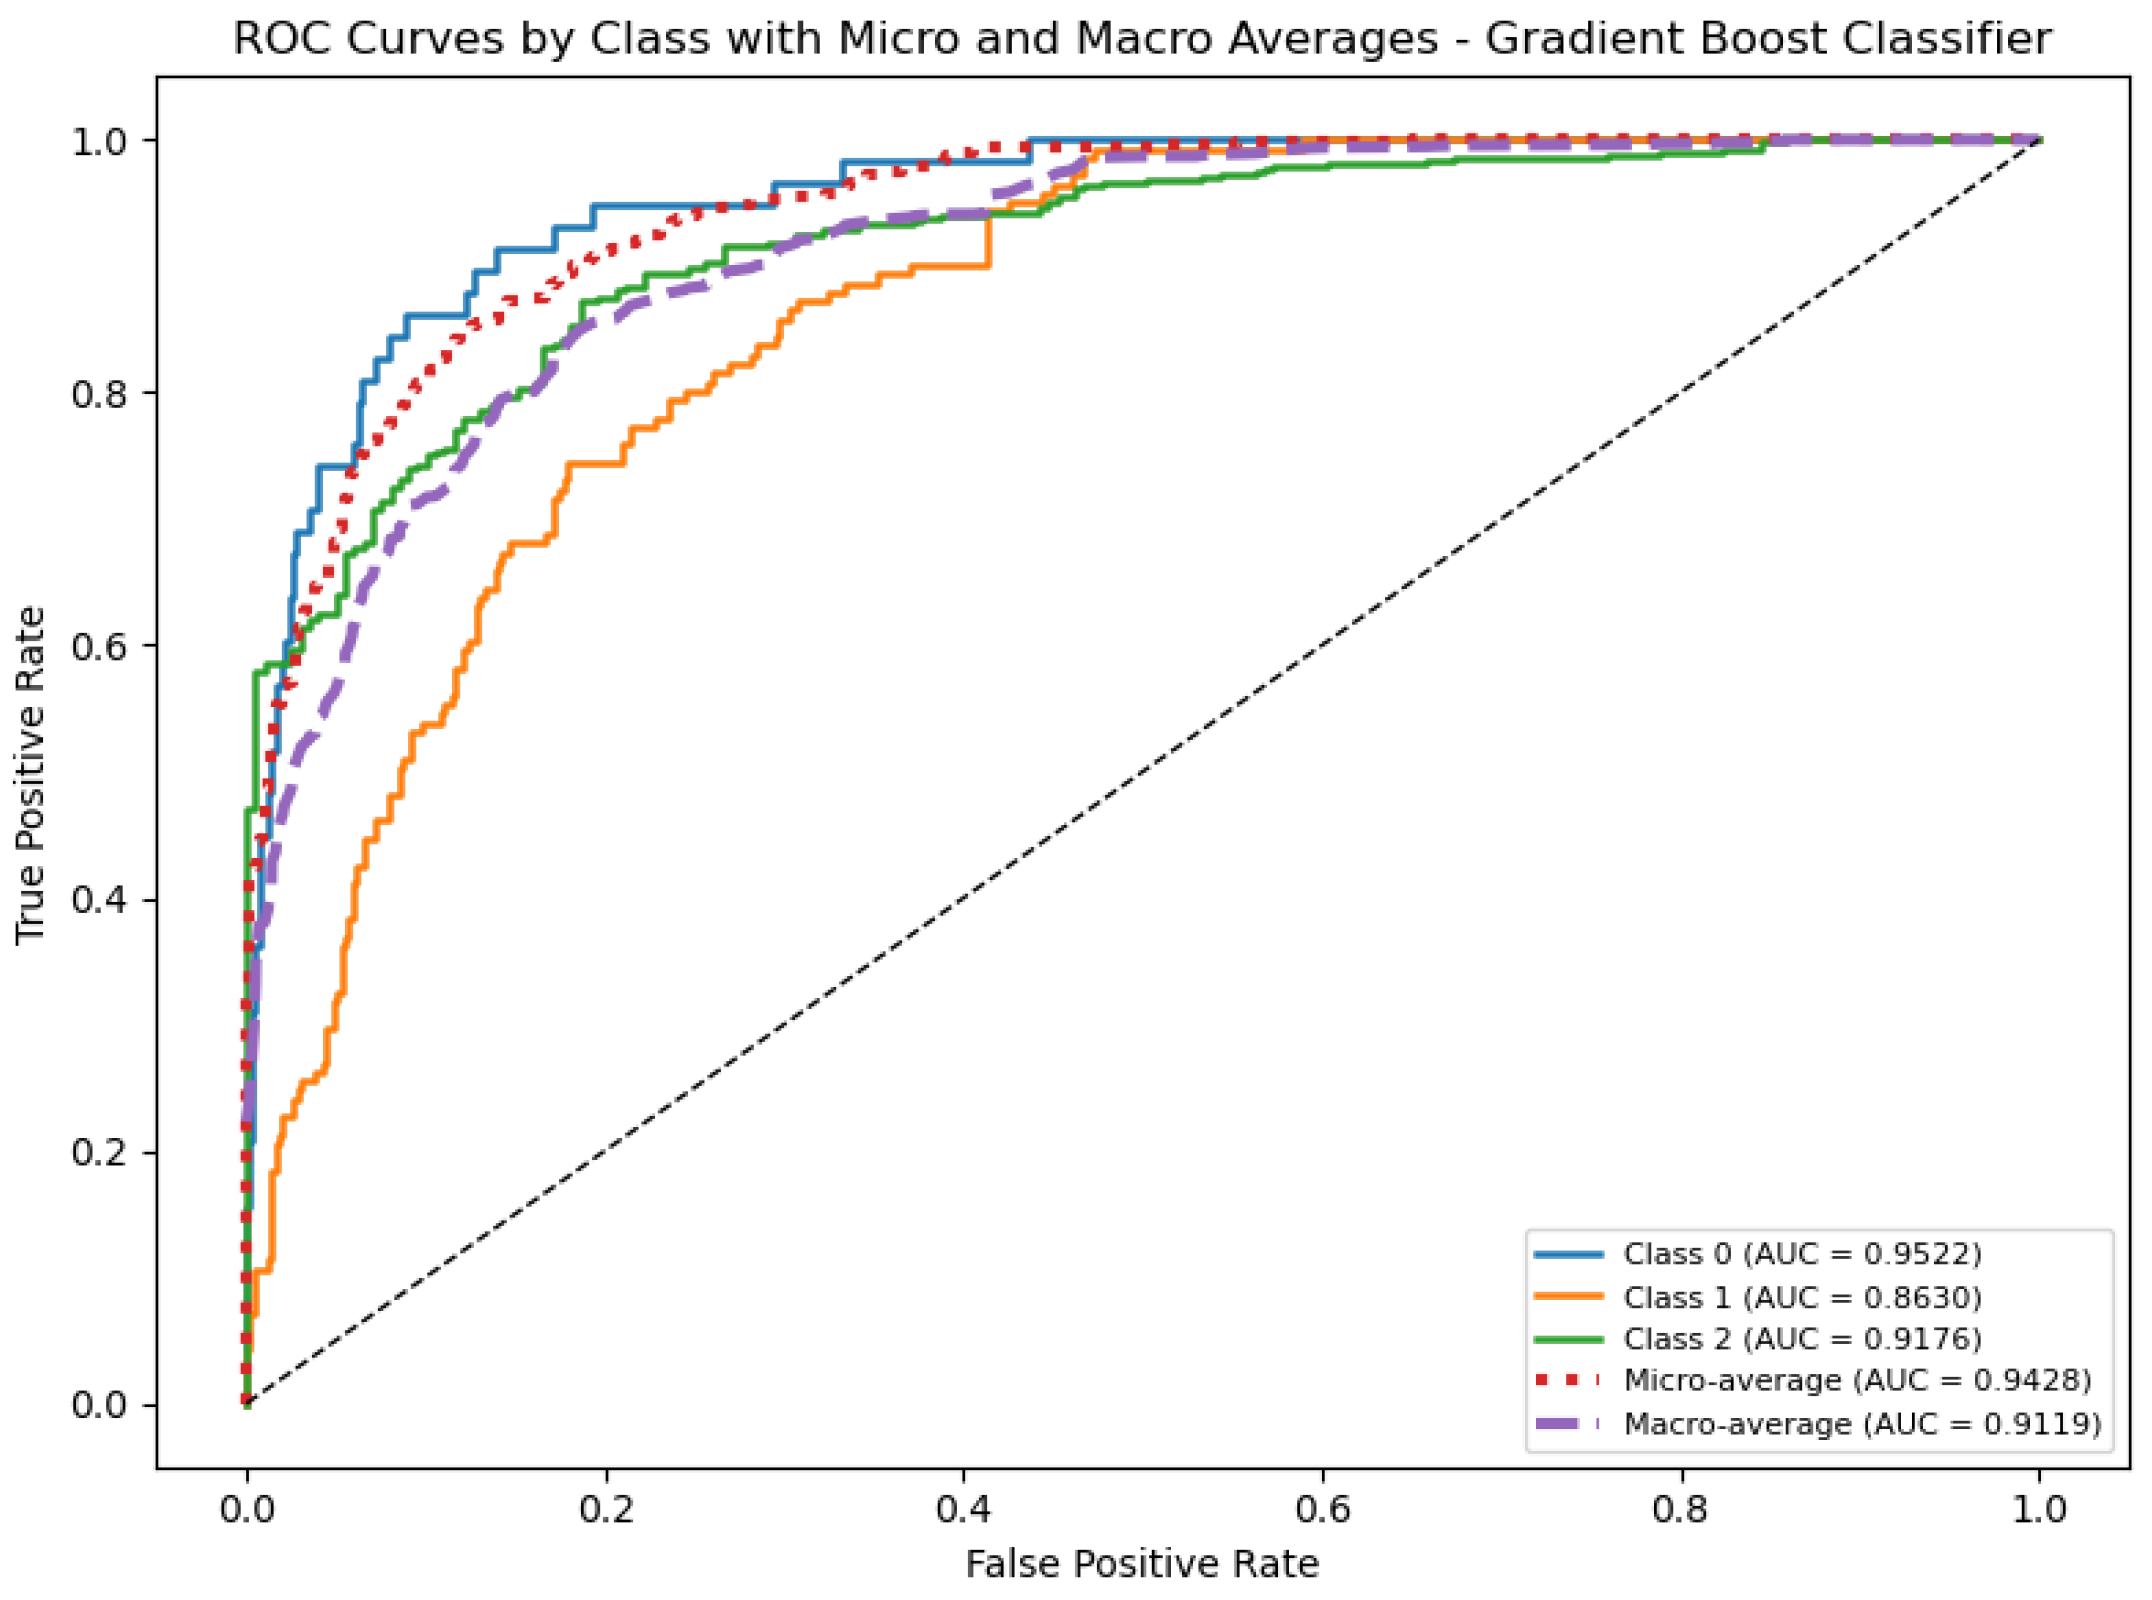
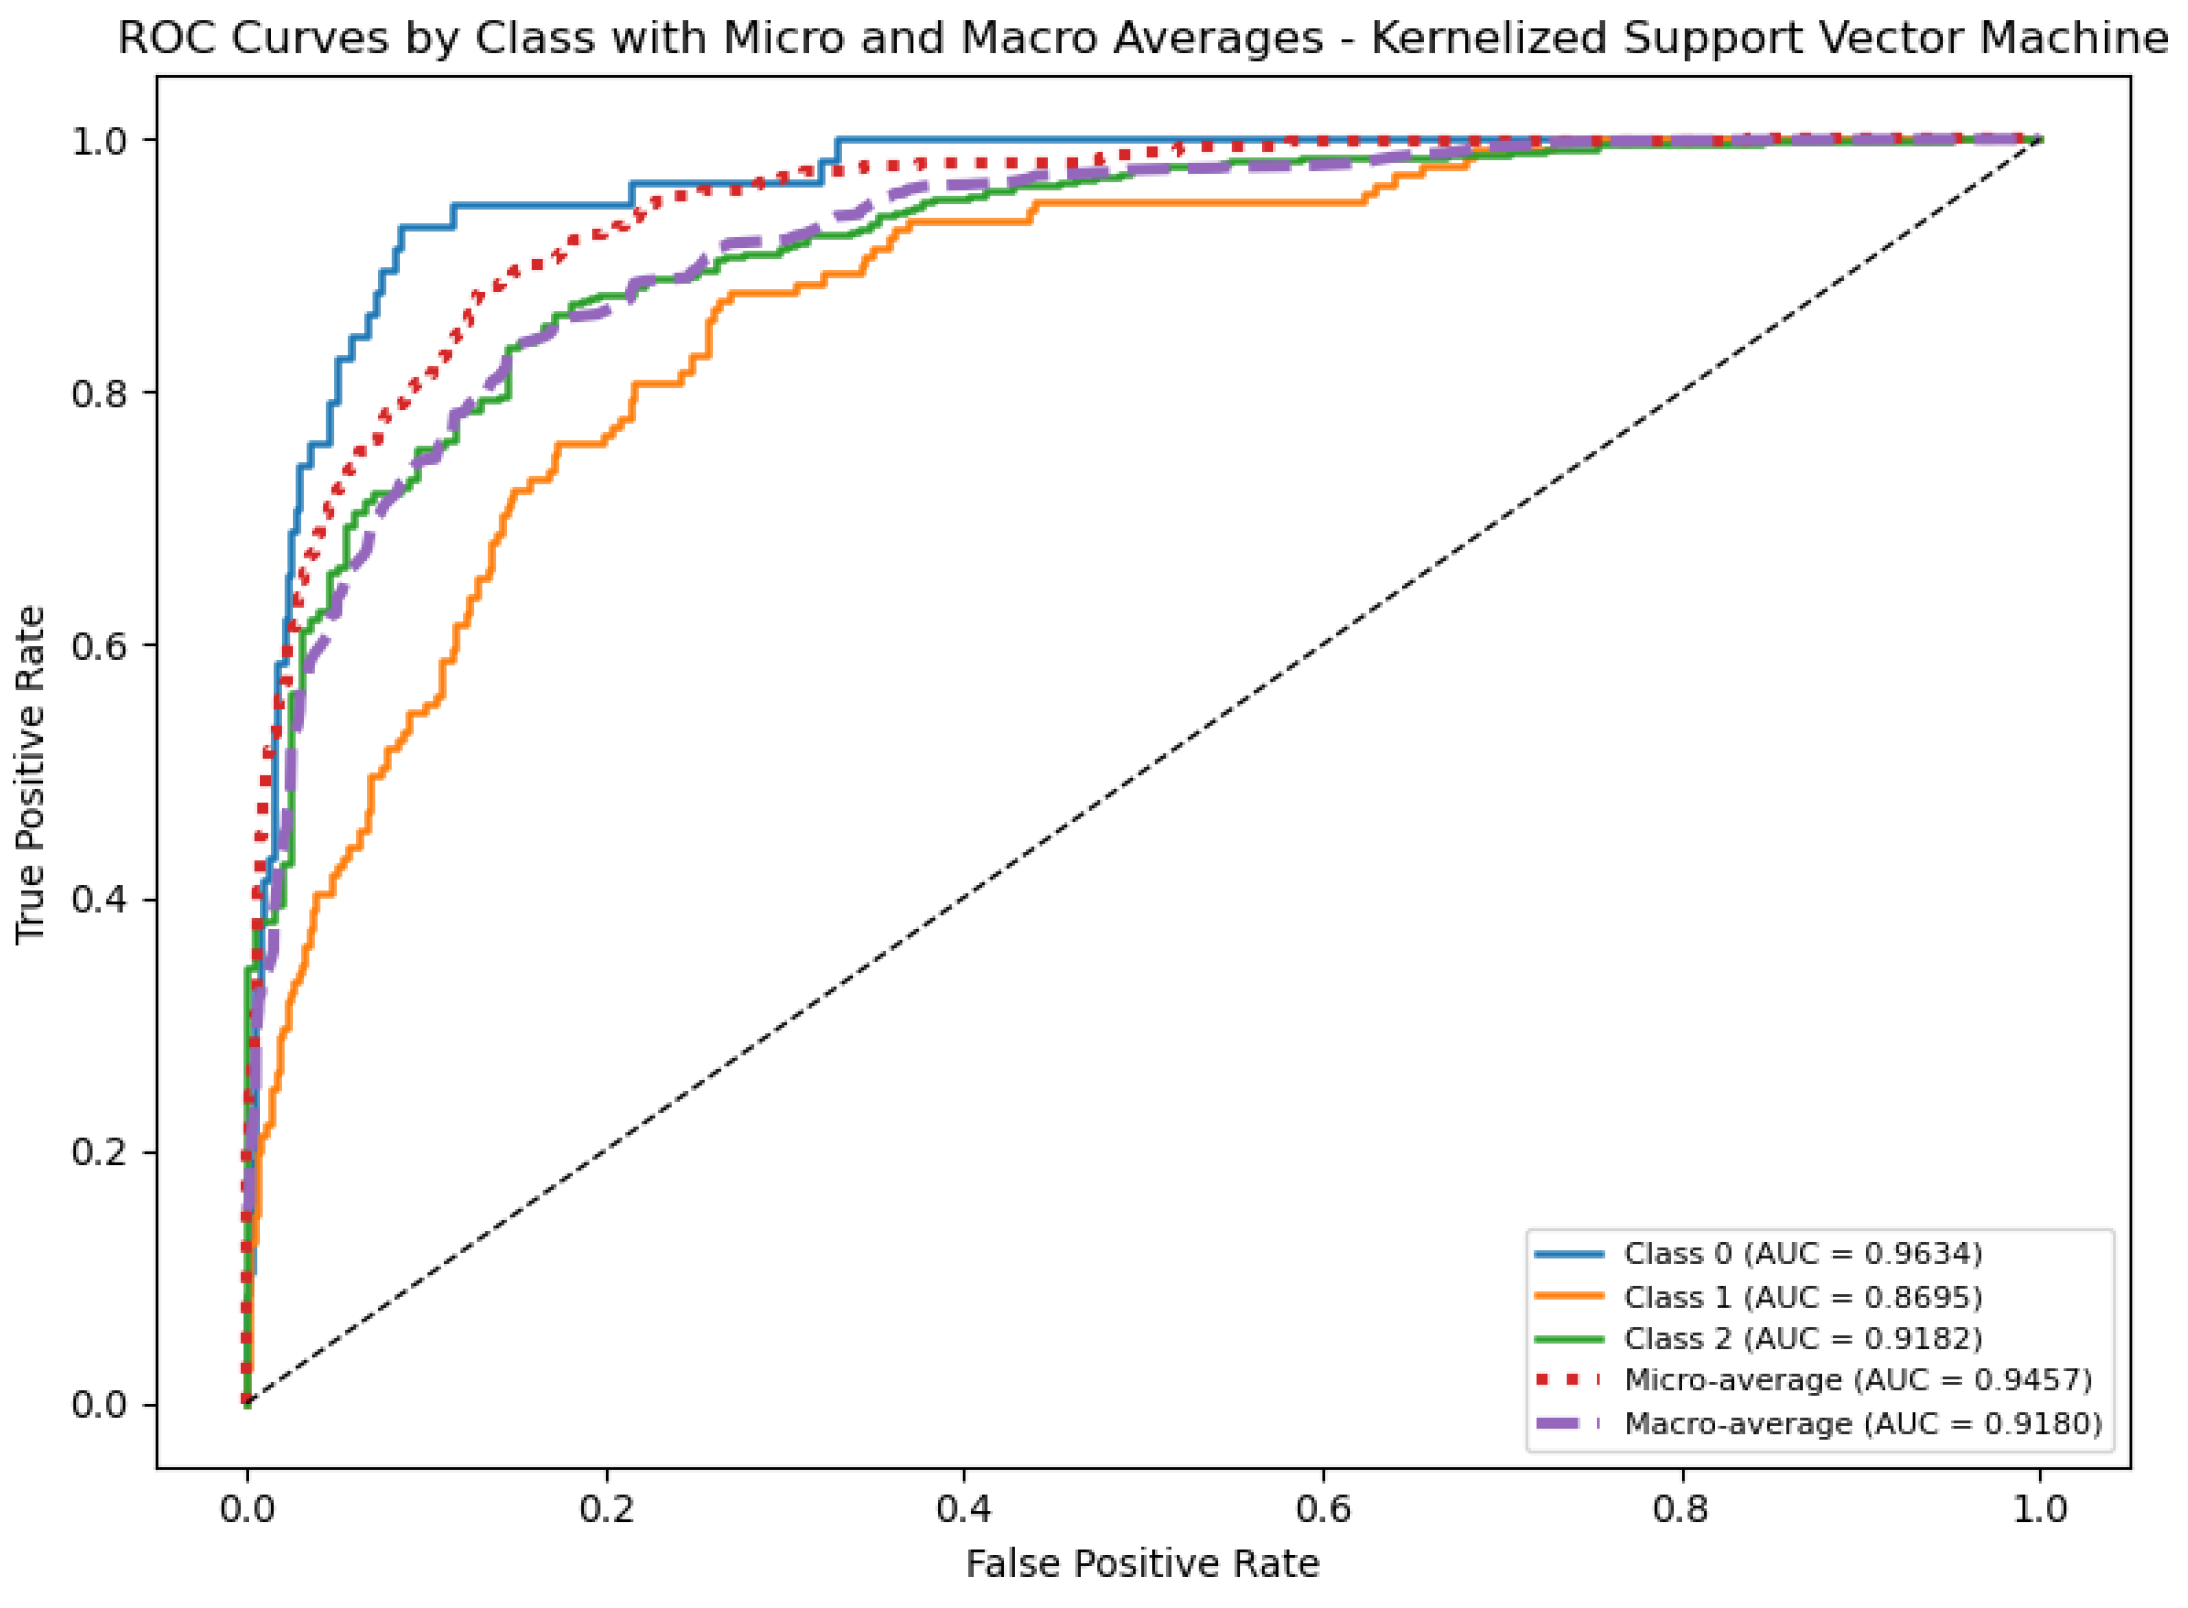
Figure 12, all nonlinear models, including XGBoost, Random Forest, Gradient Boosting, Kernelized Support Vector Machine, and K-Nearest Neighbors, achieve out-of-sample accuracy within a narrow range of approximately 79–81 percent. This represents an improvement of roughly ten percentage points relative to the linear benchmark.
These improvements are not limited to overall accuracy but are present when examining the form of the classification results themselves. Note how the confusion matrices in
Figure 3,
Figure 4,
Figure 5,
Figure 6 and
Figure 7 are dominated by their diagonals. That is, the predicted classifications largely match the actual classifications. Moreover, most errors are modest, as reflected in the pattern of misclassifications across the matrices. Errors are typically from one outlook category to another rather than from the extremes. For example, there are very few cases where an actual outlook is negative and the model predicts stable. This behavior is reassuring as credit transitions should occur gradually over time. The nonlinear models better capture these transitional dynamics.
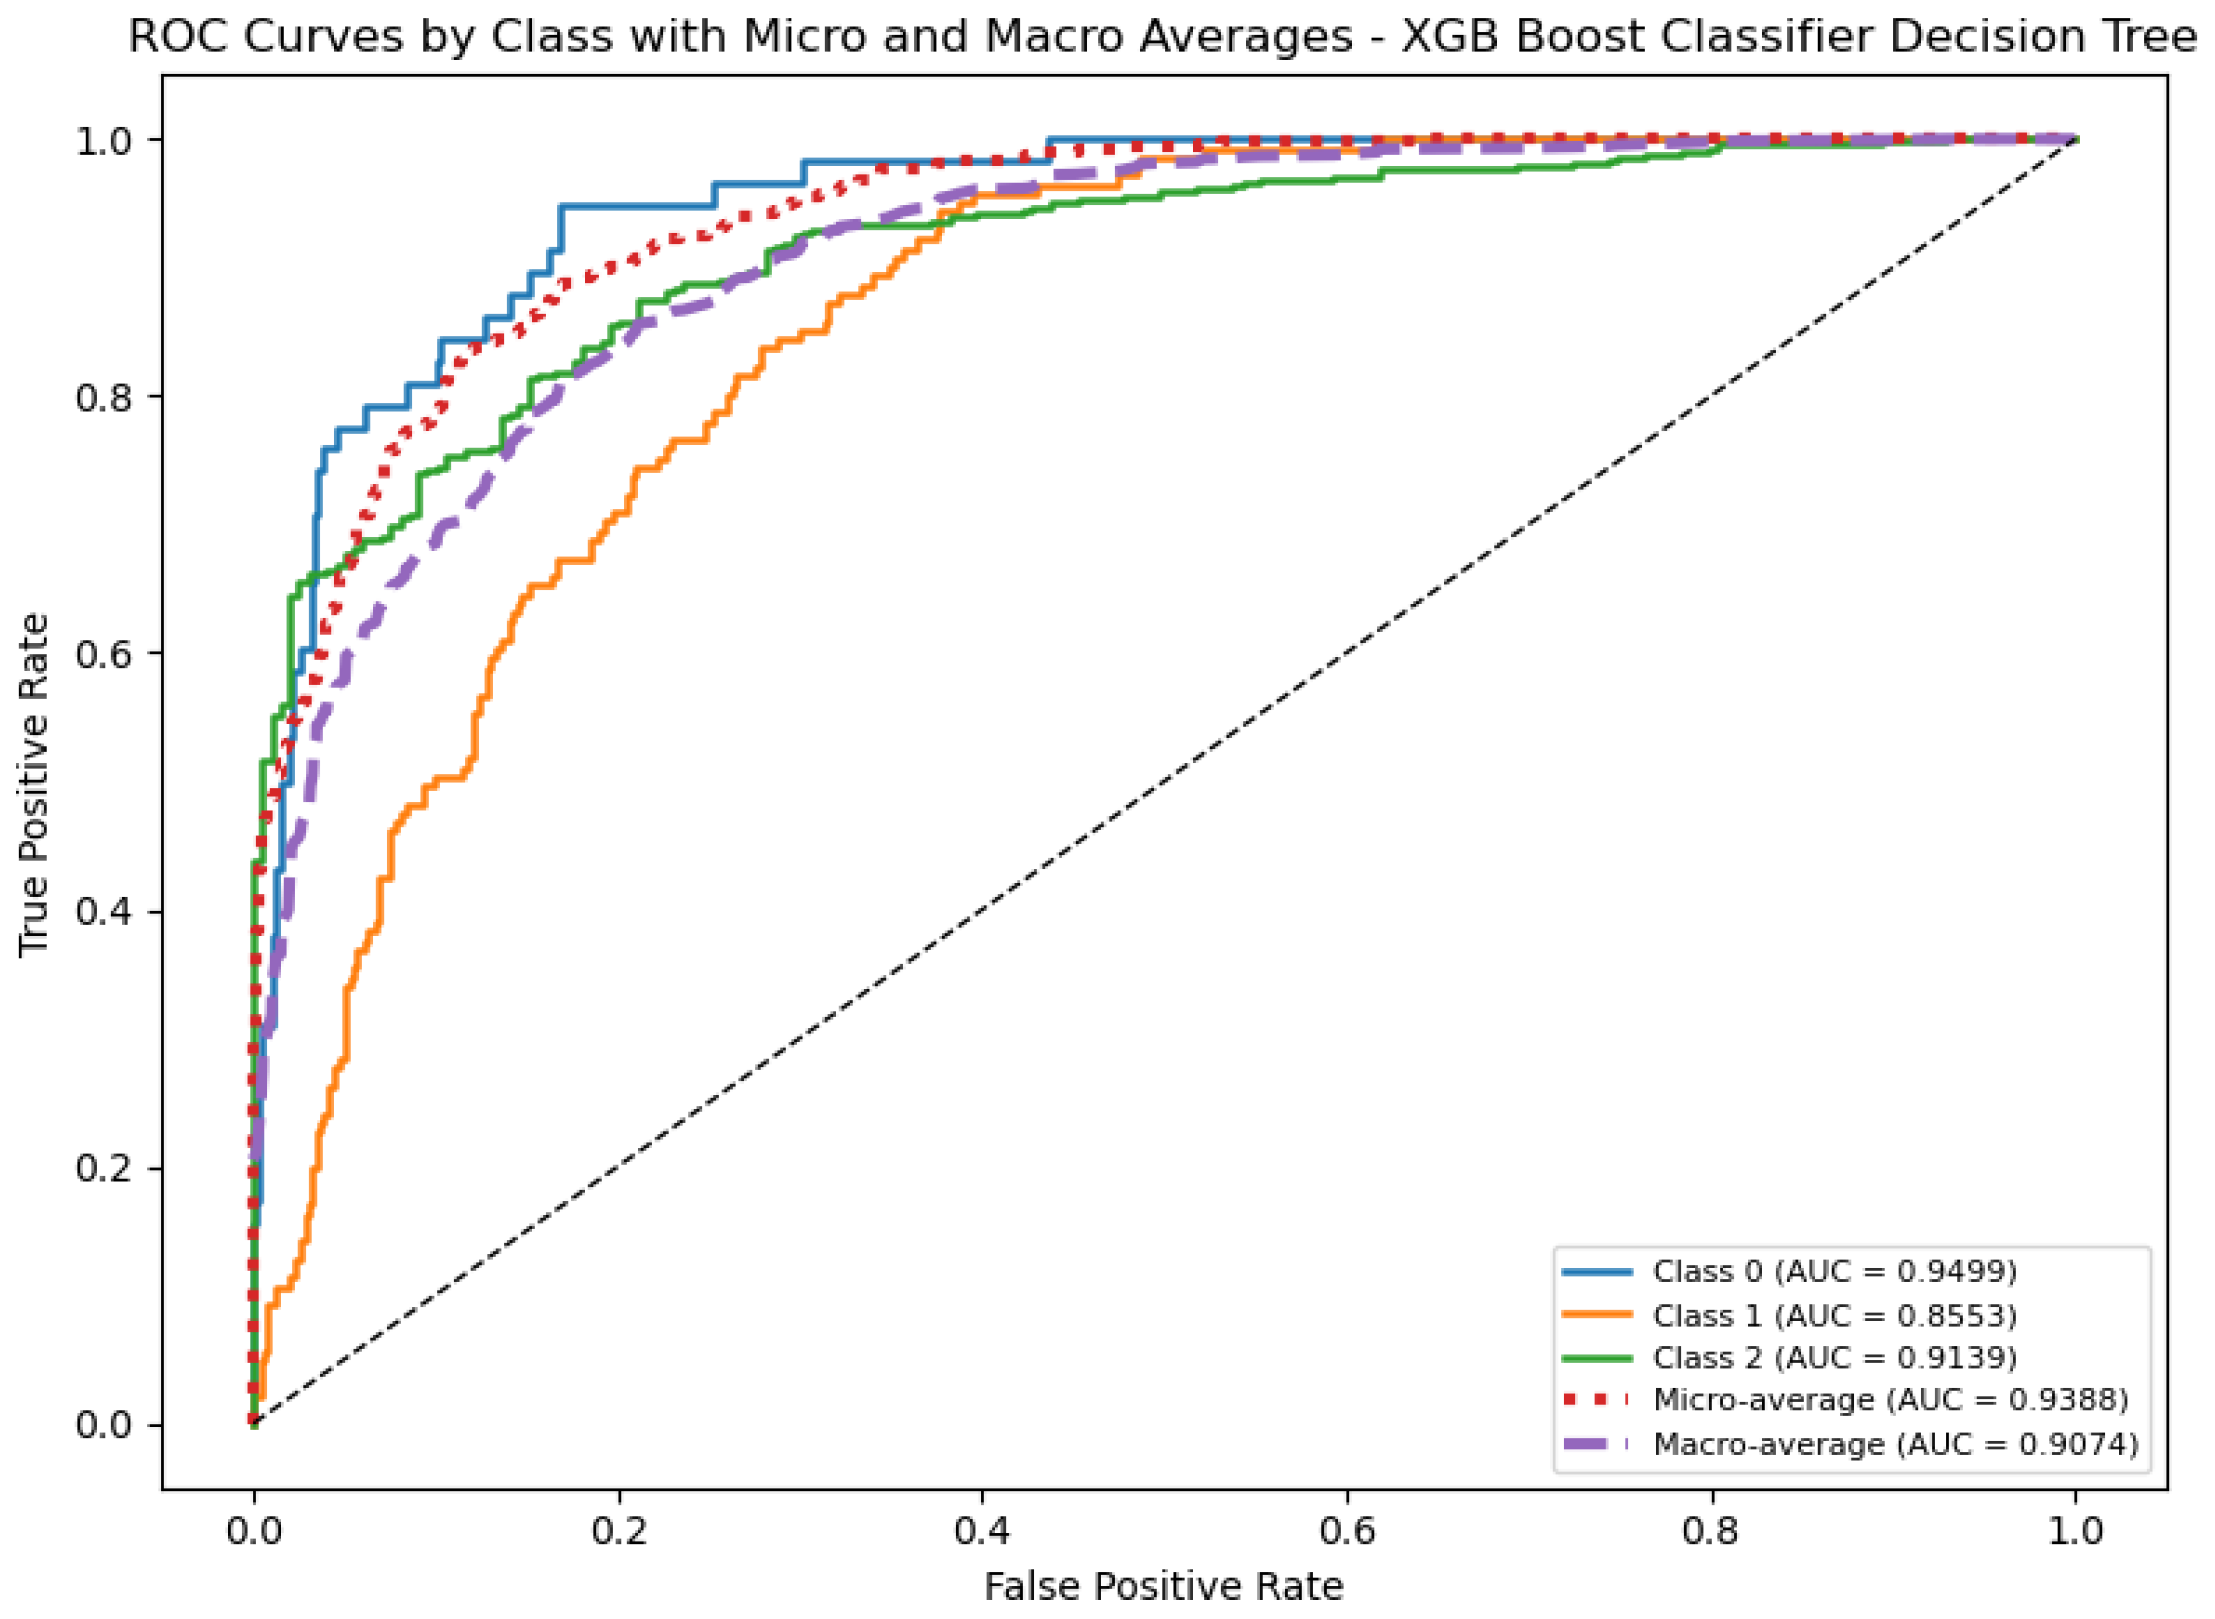
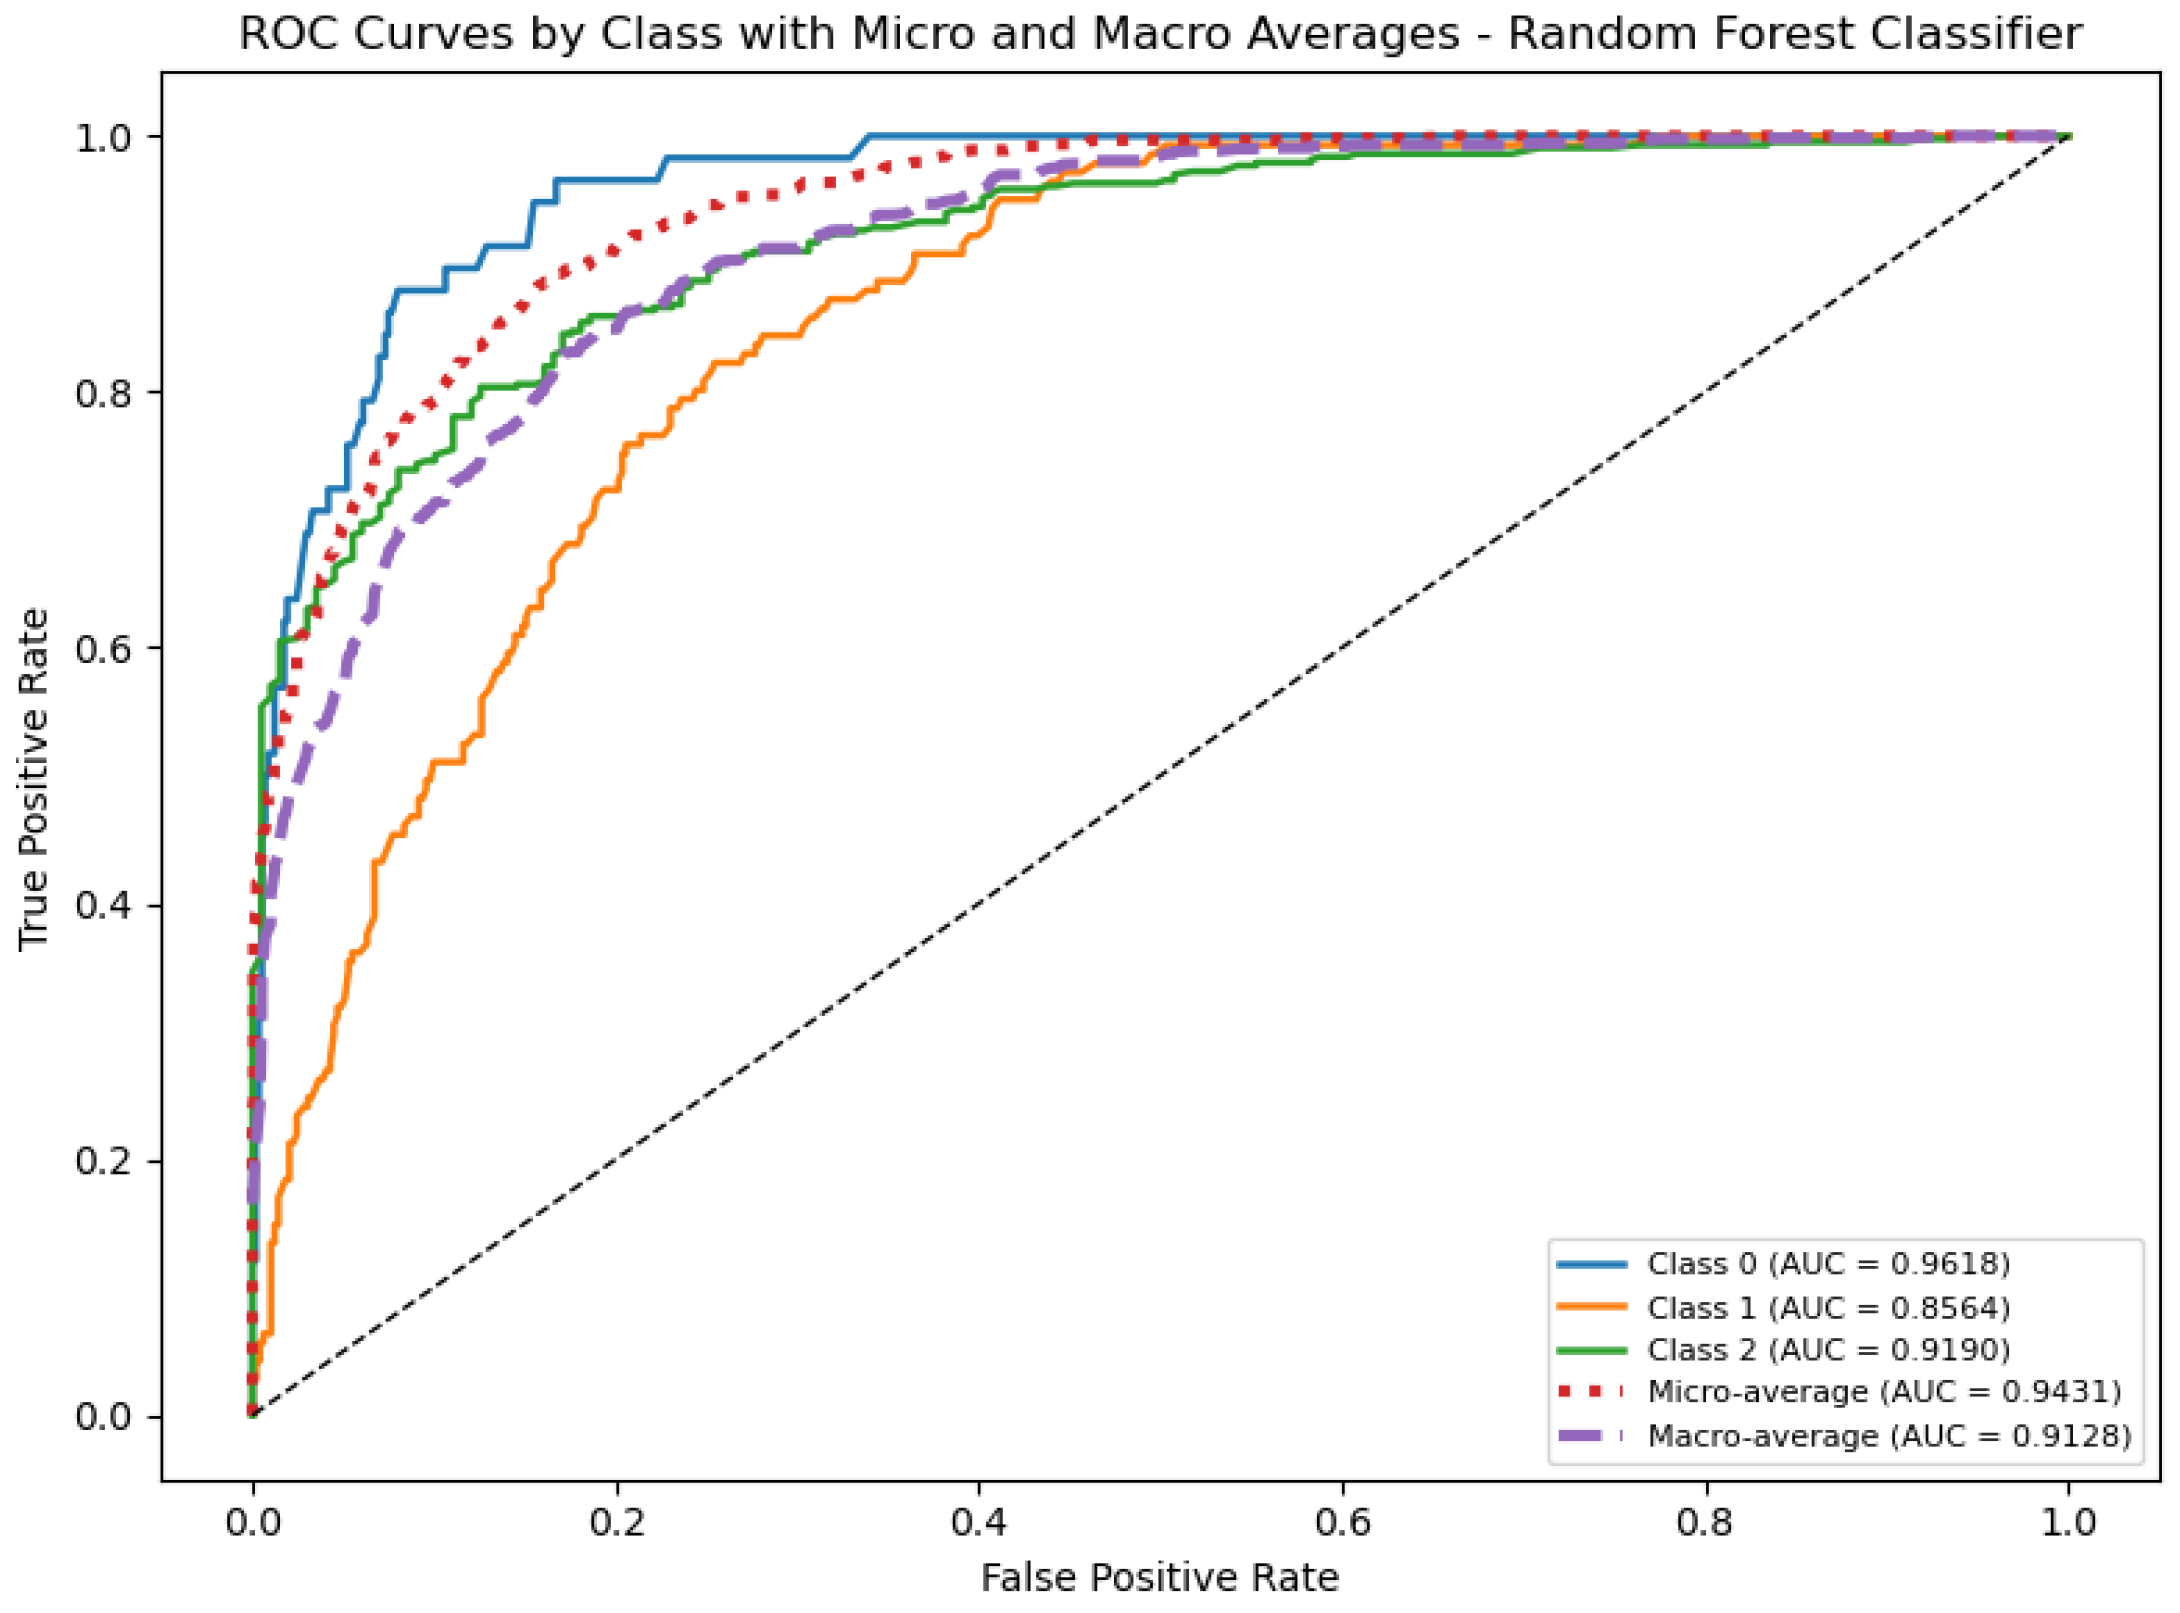
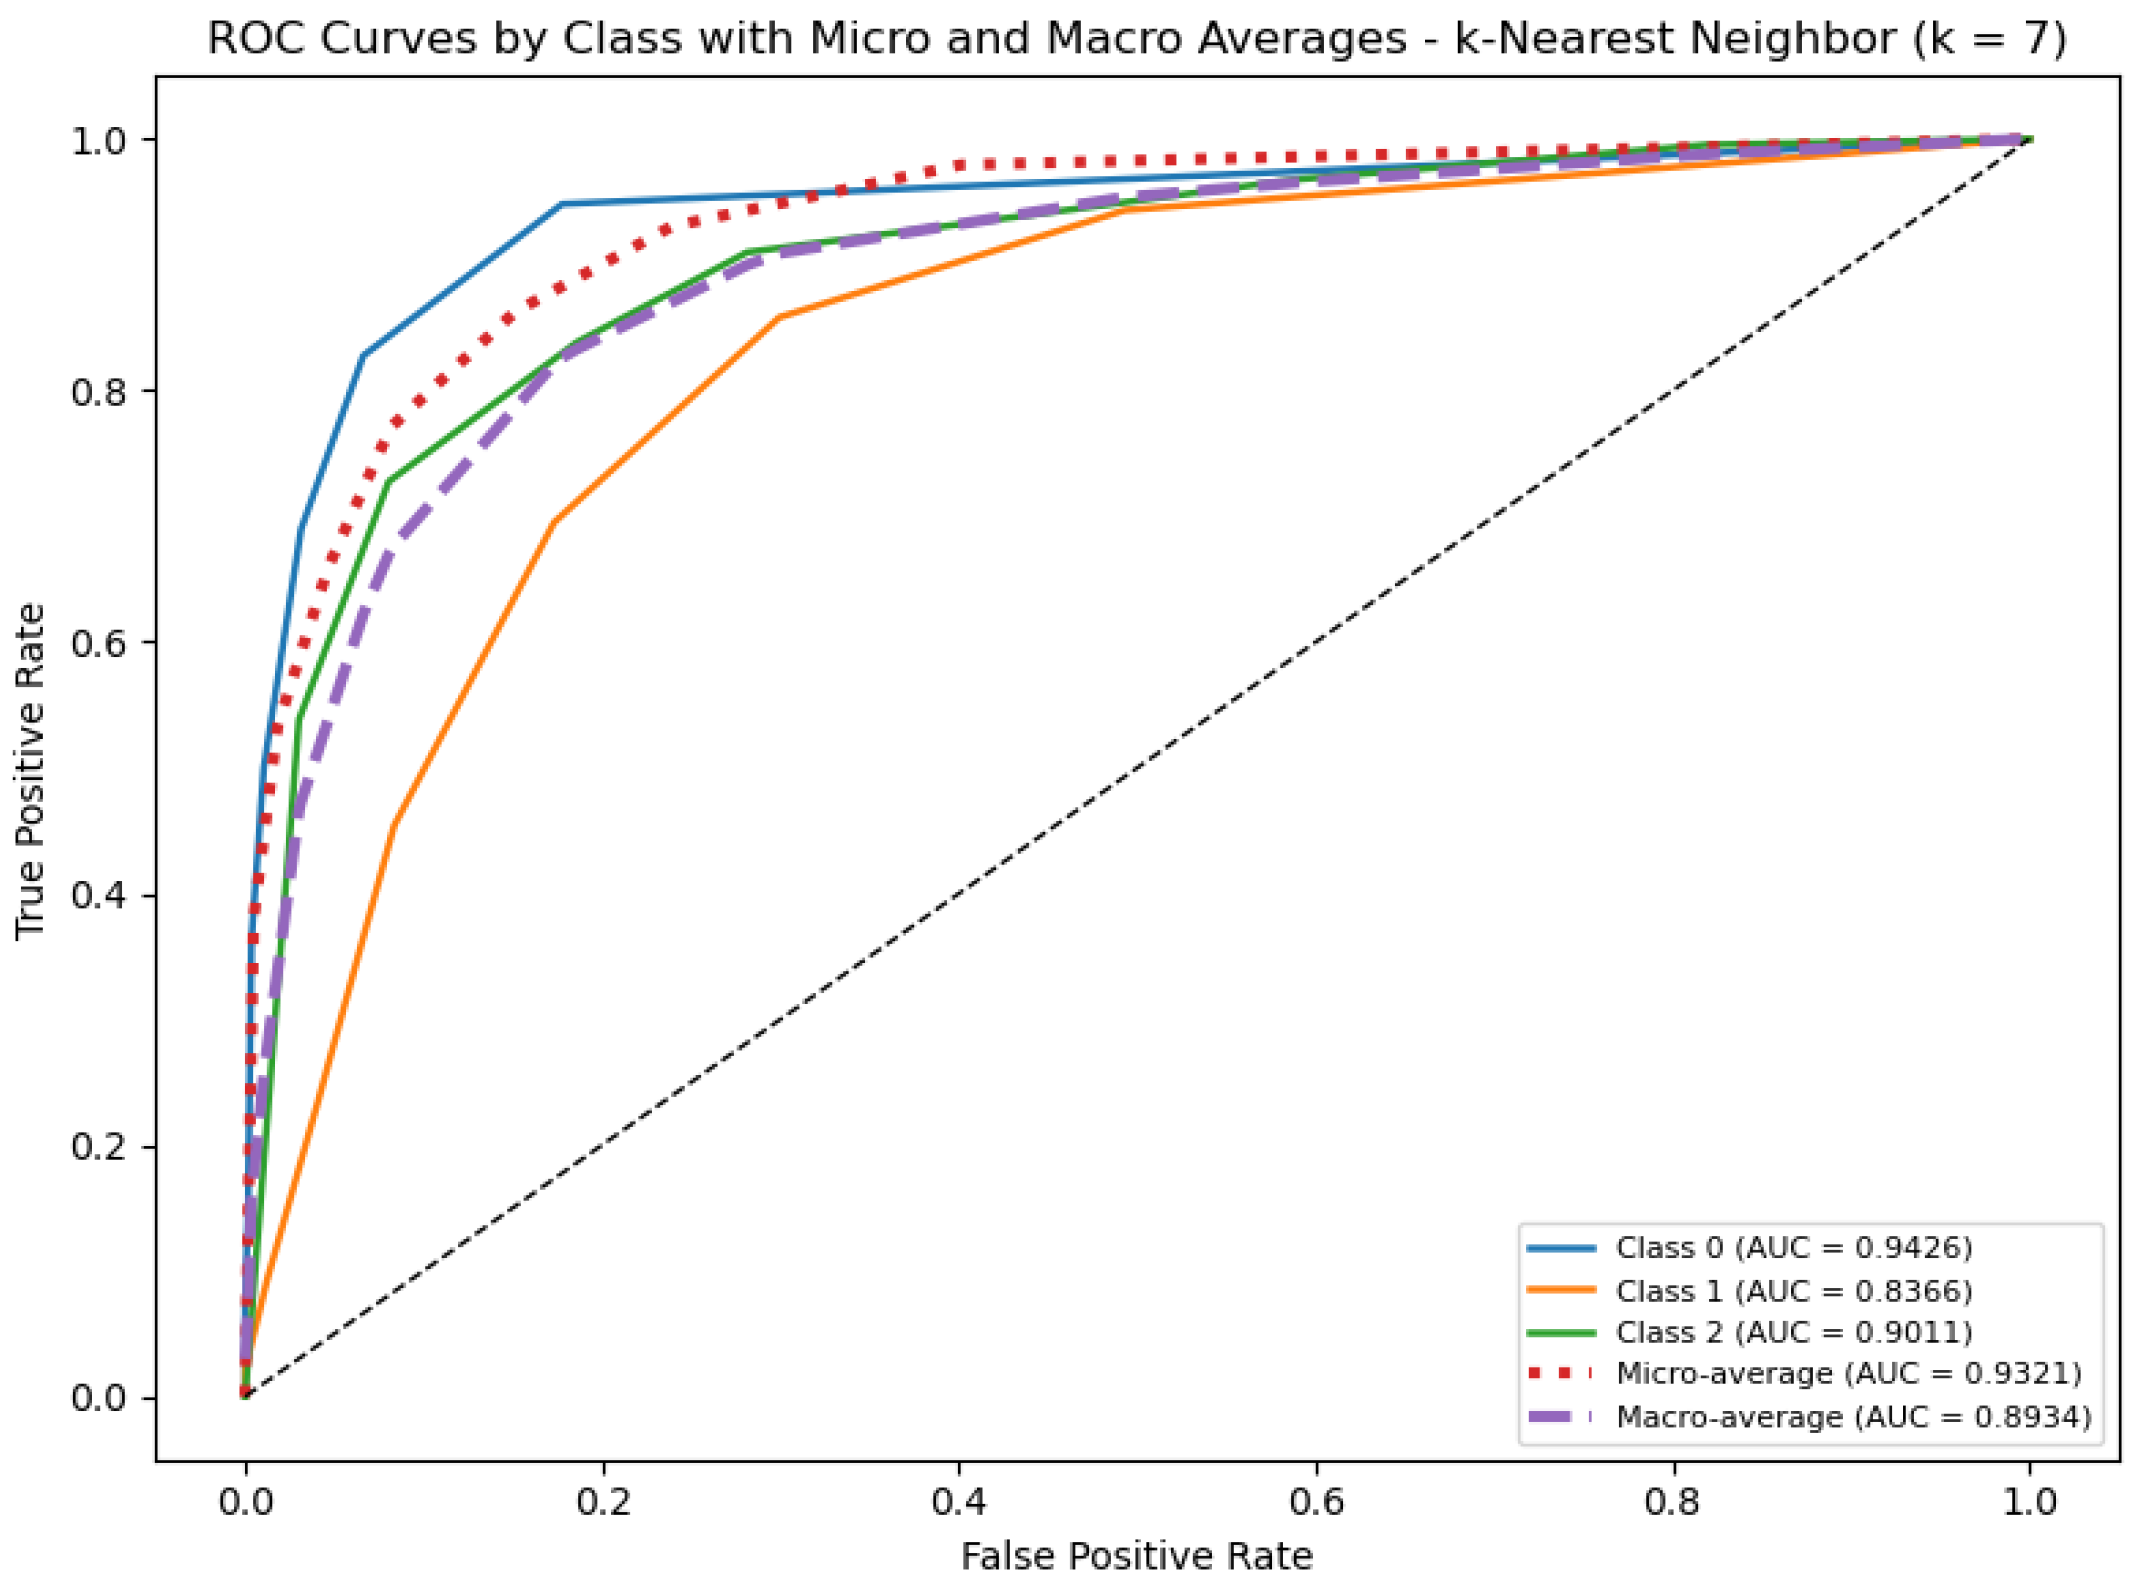
ROC curves in
Figure 8,
Figure 9,
Figure 10,
Figure 11 and
Figure 12 confirm this result. The nonlinear classifiers all have high discrimination performance with area under the ROC curve values typically above 0.90 for all classes. Micro and macro-average AUC values are very similar, suggesting that increases in performance are not due to gains in predicting only the majority class but are rather improvements across all classes of credit outlook. Most importantly, nonlinear classifiers dramatically increase the correct classification of firms in the negative outlook state, which has the largest economic value.
Empirically, these results suggest that corporate credit risk and credit outlook dynamics exhibit meaningful nonlinear and interaction-driven characteristics. The fact that nonlinear classifiers outperform the multinomial Logistic Regression benchmark reinforces H1 (Nonlinear Superiority Hypothesis) and suggests that linear functional forms are limited in their ability to characterize transitional credit dynamics.
Figure 3,
Figure 4,
Figure 5,
Figure 6,
Figure 7,
Figure 8,
Figure 9,
Figure 10,
Figure 11 and
Figure 12 show that all nonlinear models yield remarkably similar and economically sensible classification patterns.
5.3. Cross-Validation and Statistical Evidence
We perform cross-validation and statistical testing to demonstrate that the results are robust and generalize well across different samples.
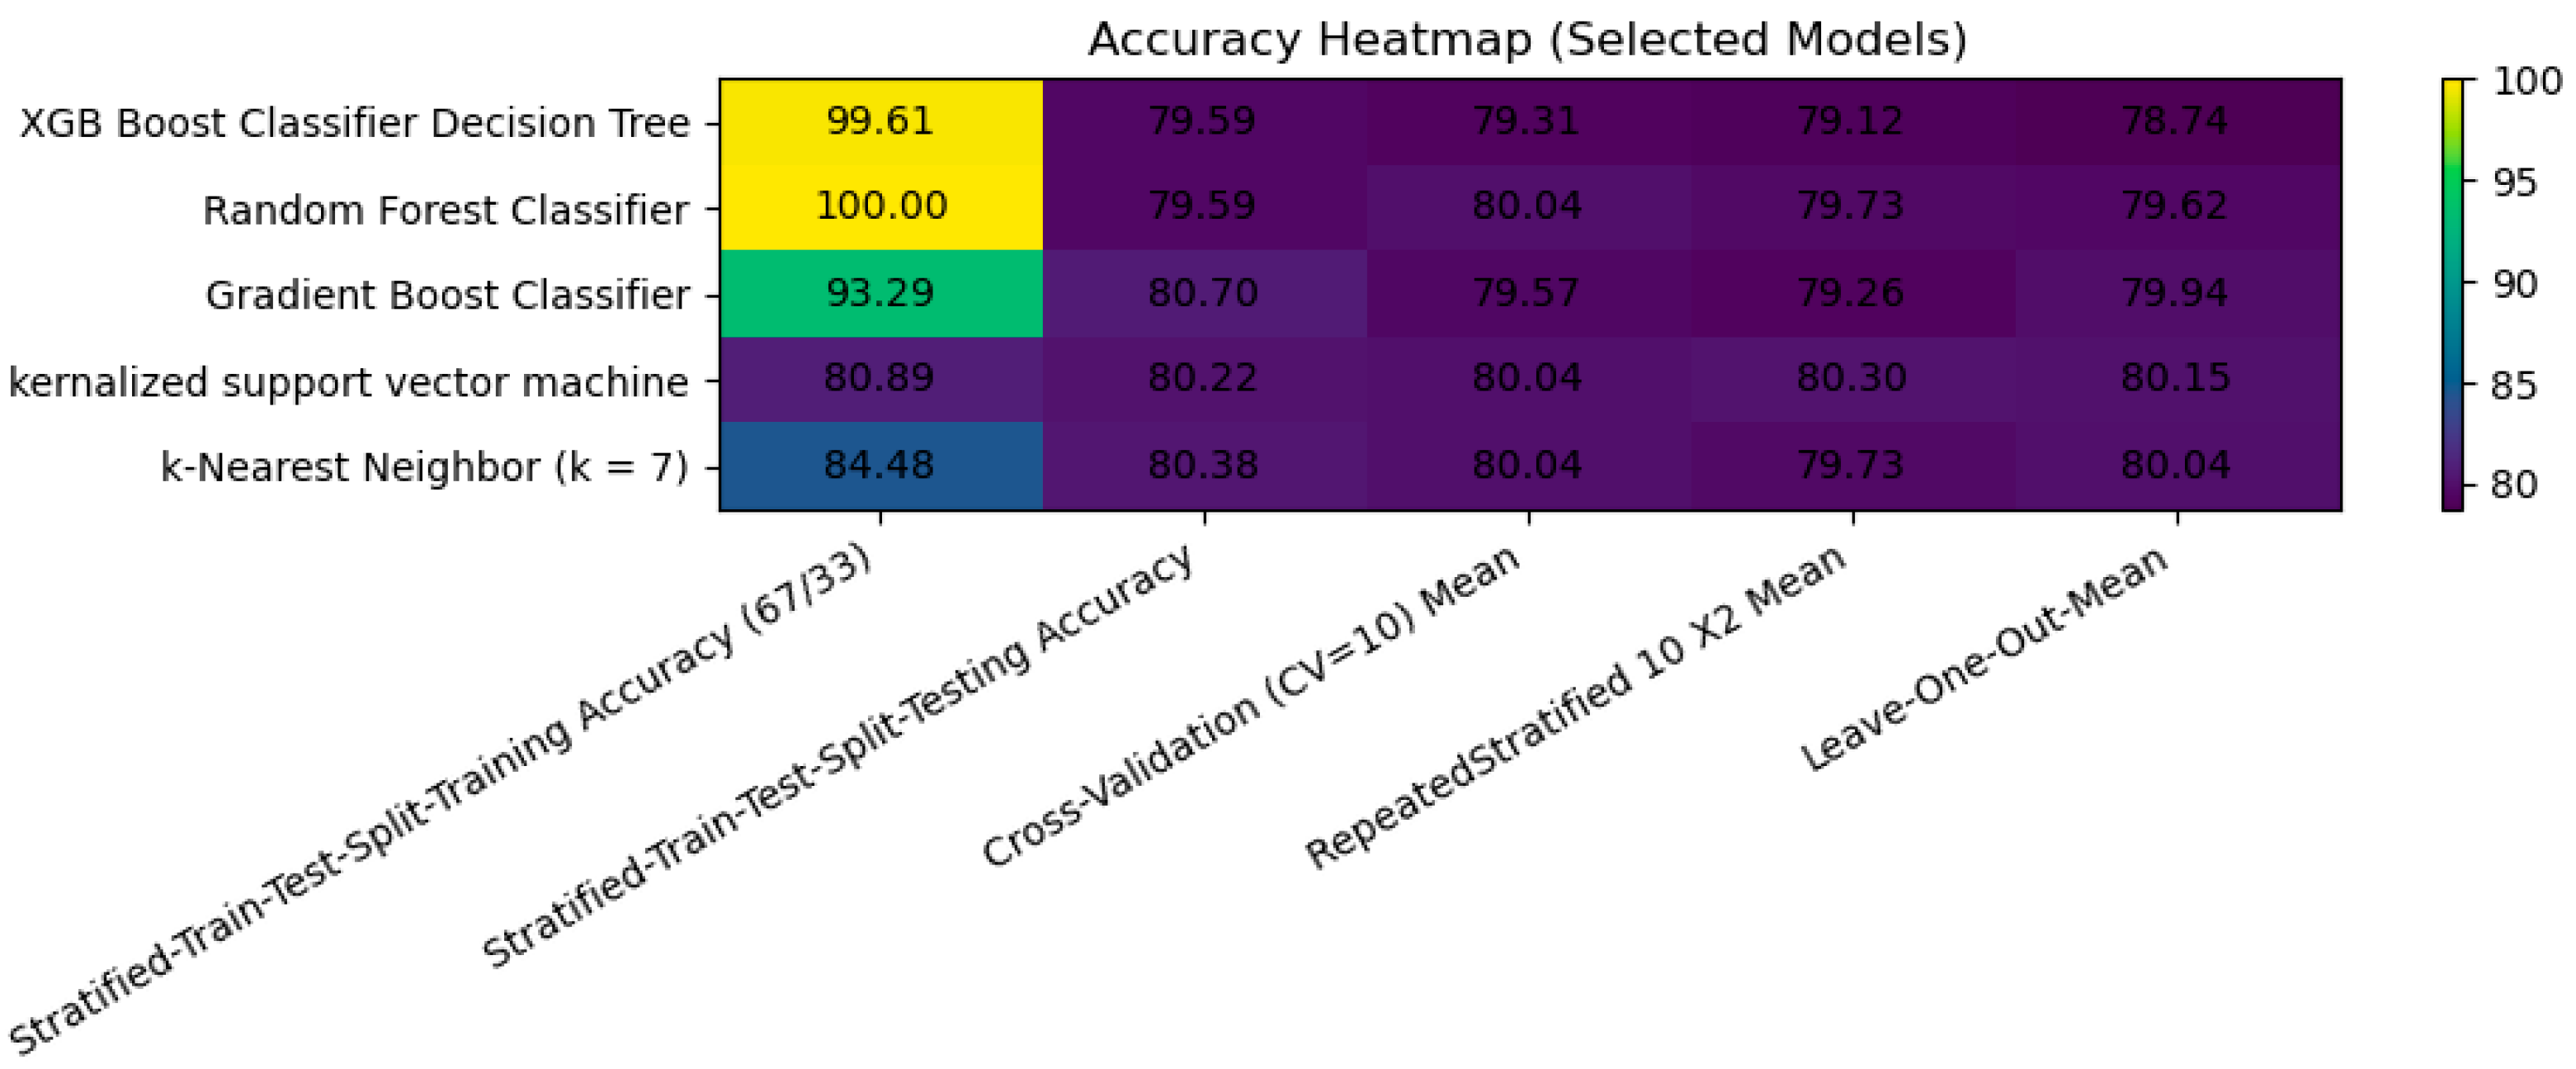
Table 2 shows classification accuracy on each of ten cross-validation folds for all models. We see two main results from this table. First, multinomial Logistic Regression achieves the lowest accuracy on every fold, with accuracy ranging from about 67–73 percent. Second, every nonlinear classifier exceeds the linear baseline on every fold, with accuracy ranging tightly from around 79–82 percent.
Importantly, performance variance between folds is low for all nonlinear models, demonstrating high stability and generalizability. None of the classifiers are sensitive to the data splits, implying that effects are not sample-specific. Furthermore, the accuracy variability between nonlinear classifiers is very low, with less than a 1% difference between models.
This observation is supported by comparing average performance in
Table 3. The results show that the nonlinear models perform substantially better than Logistic Regression, especially when class imbalance is considered.
Logistic Regression achieves a testing accuracy of 70.09%. However, when looking at balanced accuracy and negative-class recall (about 40.32% and 13.79% respectively), the results suggest the model does well on the dominating classes but fails to capture most of the negative-outlook instances. We cannot rely on Logistic Regression as the sole predictive model, because the model fails to detect the smallest, most important risk group (the negative class).
The nonlinear models perform much better. Test accuracy increases to around 79.59–80.70%. The 10-fold cross validation, repeated stratified validation and LOOCV also come in around 79–80%. This consistency indicates the results are not due to one favorable train–test split. Gradient Boosting yields the best testing accuracy of 80.70%. SVM, kNN and Random Forest also had good performance that was consistent across metrics.
The most important improvement is in class-sensitive performance. Negative-class recall increases from 13.79% under Logistic Regression to 50.00–65.52% across the nonlinear models. kNN achieves the best negative-class recall at 65.52%, followed by Gradient Boosting at 60.34% and XGBoost at 58.62%. This indicates that nonlinear models are much better at detecting financially weaker firms, which is especially important in credit outlook prediction.
Macro-F1 also improves substantially, from 40.05% for Logistic Regression to about 69–71% for the nonlinear models. This confirms that the improvement is not merely due to better performance in the majority class. kNN has the highest macro-F1 at 71.15%, closely followed by Gradient Boosting at 71.09%.
The AUC results further support the superiority of nonlinear models. Logistic Regression has a macro OvR (One versus rest) ROC AUC of 84.33%, while the nonlinear models range from 89.34% to 91.70%. The Kernelized SVM has the strongest ROC AUC performance at 91.70%, suggesting superior ranking ability across classes.
Overall, the results support the conclusion that nonlinear models provide more reliable and balanced credit outlook classification than Logistic Regression. However, the differences among the nonlinear models are relatively modest. Gradient Boosting performs best on testing accuracy, SVM performs best on ROC AUC, and kNN performs best on negative class recall and macro-F1. Therefore, the results suggest a “complexity plateau”: moving from a linear model to nonlinear models produces a substantial gain, but additional complexity among nonlinear classifiers yields smaller incremental benefits.
Our results lend credence to H1, that nonlinearities matter (the Nonlinear Superiority Hypothesis), as well as H4 that complexity stops mattering after that (the Complexity Plateau Hypothesis). Nonlinear decision boundaries account for significant increases in accuracy; however, model complexity beyond this point does not result in any meaningful improvements, both from a statistical standpoint and business impact standpoint. After accounting for nonlinearities, predictive performance appears to plateau across different machine learning models.
5.4. SHAP Analysis
To assess whether the improved predictive performance of nonlinear models reflects economically meaningful structure rather than purely statistical fit, SHAP-based interpretability analysis is applied to the Gradient Boosting Classifier, selected as a representative benchmark given the observed convergence in performance across nonlinear models.
Figure 13 shows the categorization heatmap, which shows that all outlook categories have balanced predictive performance. The errors are evenly spread out and mostly between neighboring states, which means that the model reflects transitional credit patterns without any bias.
Next, we use SHAP (SHapley Additive exPlanations) to interpret how each explanatory variable contributes to the prediction generated by a machine learning model. In our study, SHAP analysis explains which financial characteristics most strongly influence the classification of firms into different credit outlook categories and whether those characteristics increase or decrease the probability of belonging to a specific class.
The SHAP bar plots measure the average absolute contribution of each variable to the model’s predictions. Variables with larger mean absolute SHAP values exert a greater influence on classification outcomes. Across nearly all models in your analysis, the most influential variables are Current Excess Cash Flow Percentage, Return on Assets (ROA), Cash Generation Rate Percentage, Capital Productivity, and Capital Adequacy Percentage.
The consistency of these findings across Logistic Regression, Random Forest, Gradient Boosting, k-Nearest Neighbor, and Kernelized Support Vector Machine models suggests that the relationship between liquidity, profitability, and credit outlook is structurally stable rather than model-specific. Thus, different machine learning architectures converge on similar economic drivers of credit quality. Firms with stronger liquidity generation and profitability profiles are consistently associated with more favorable credit outlook classifications.
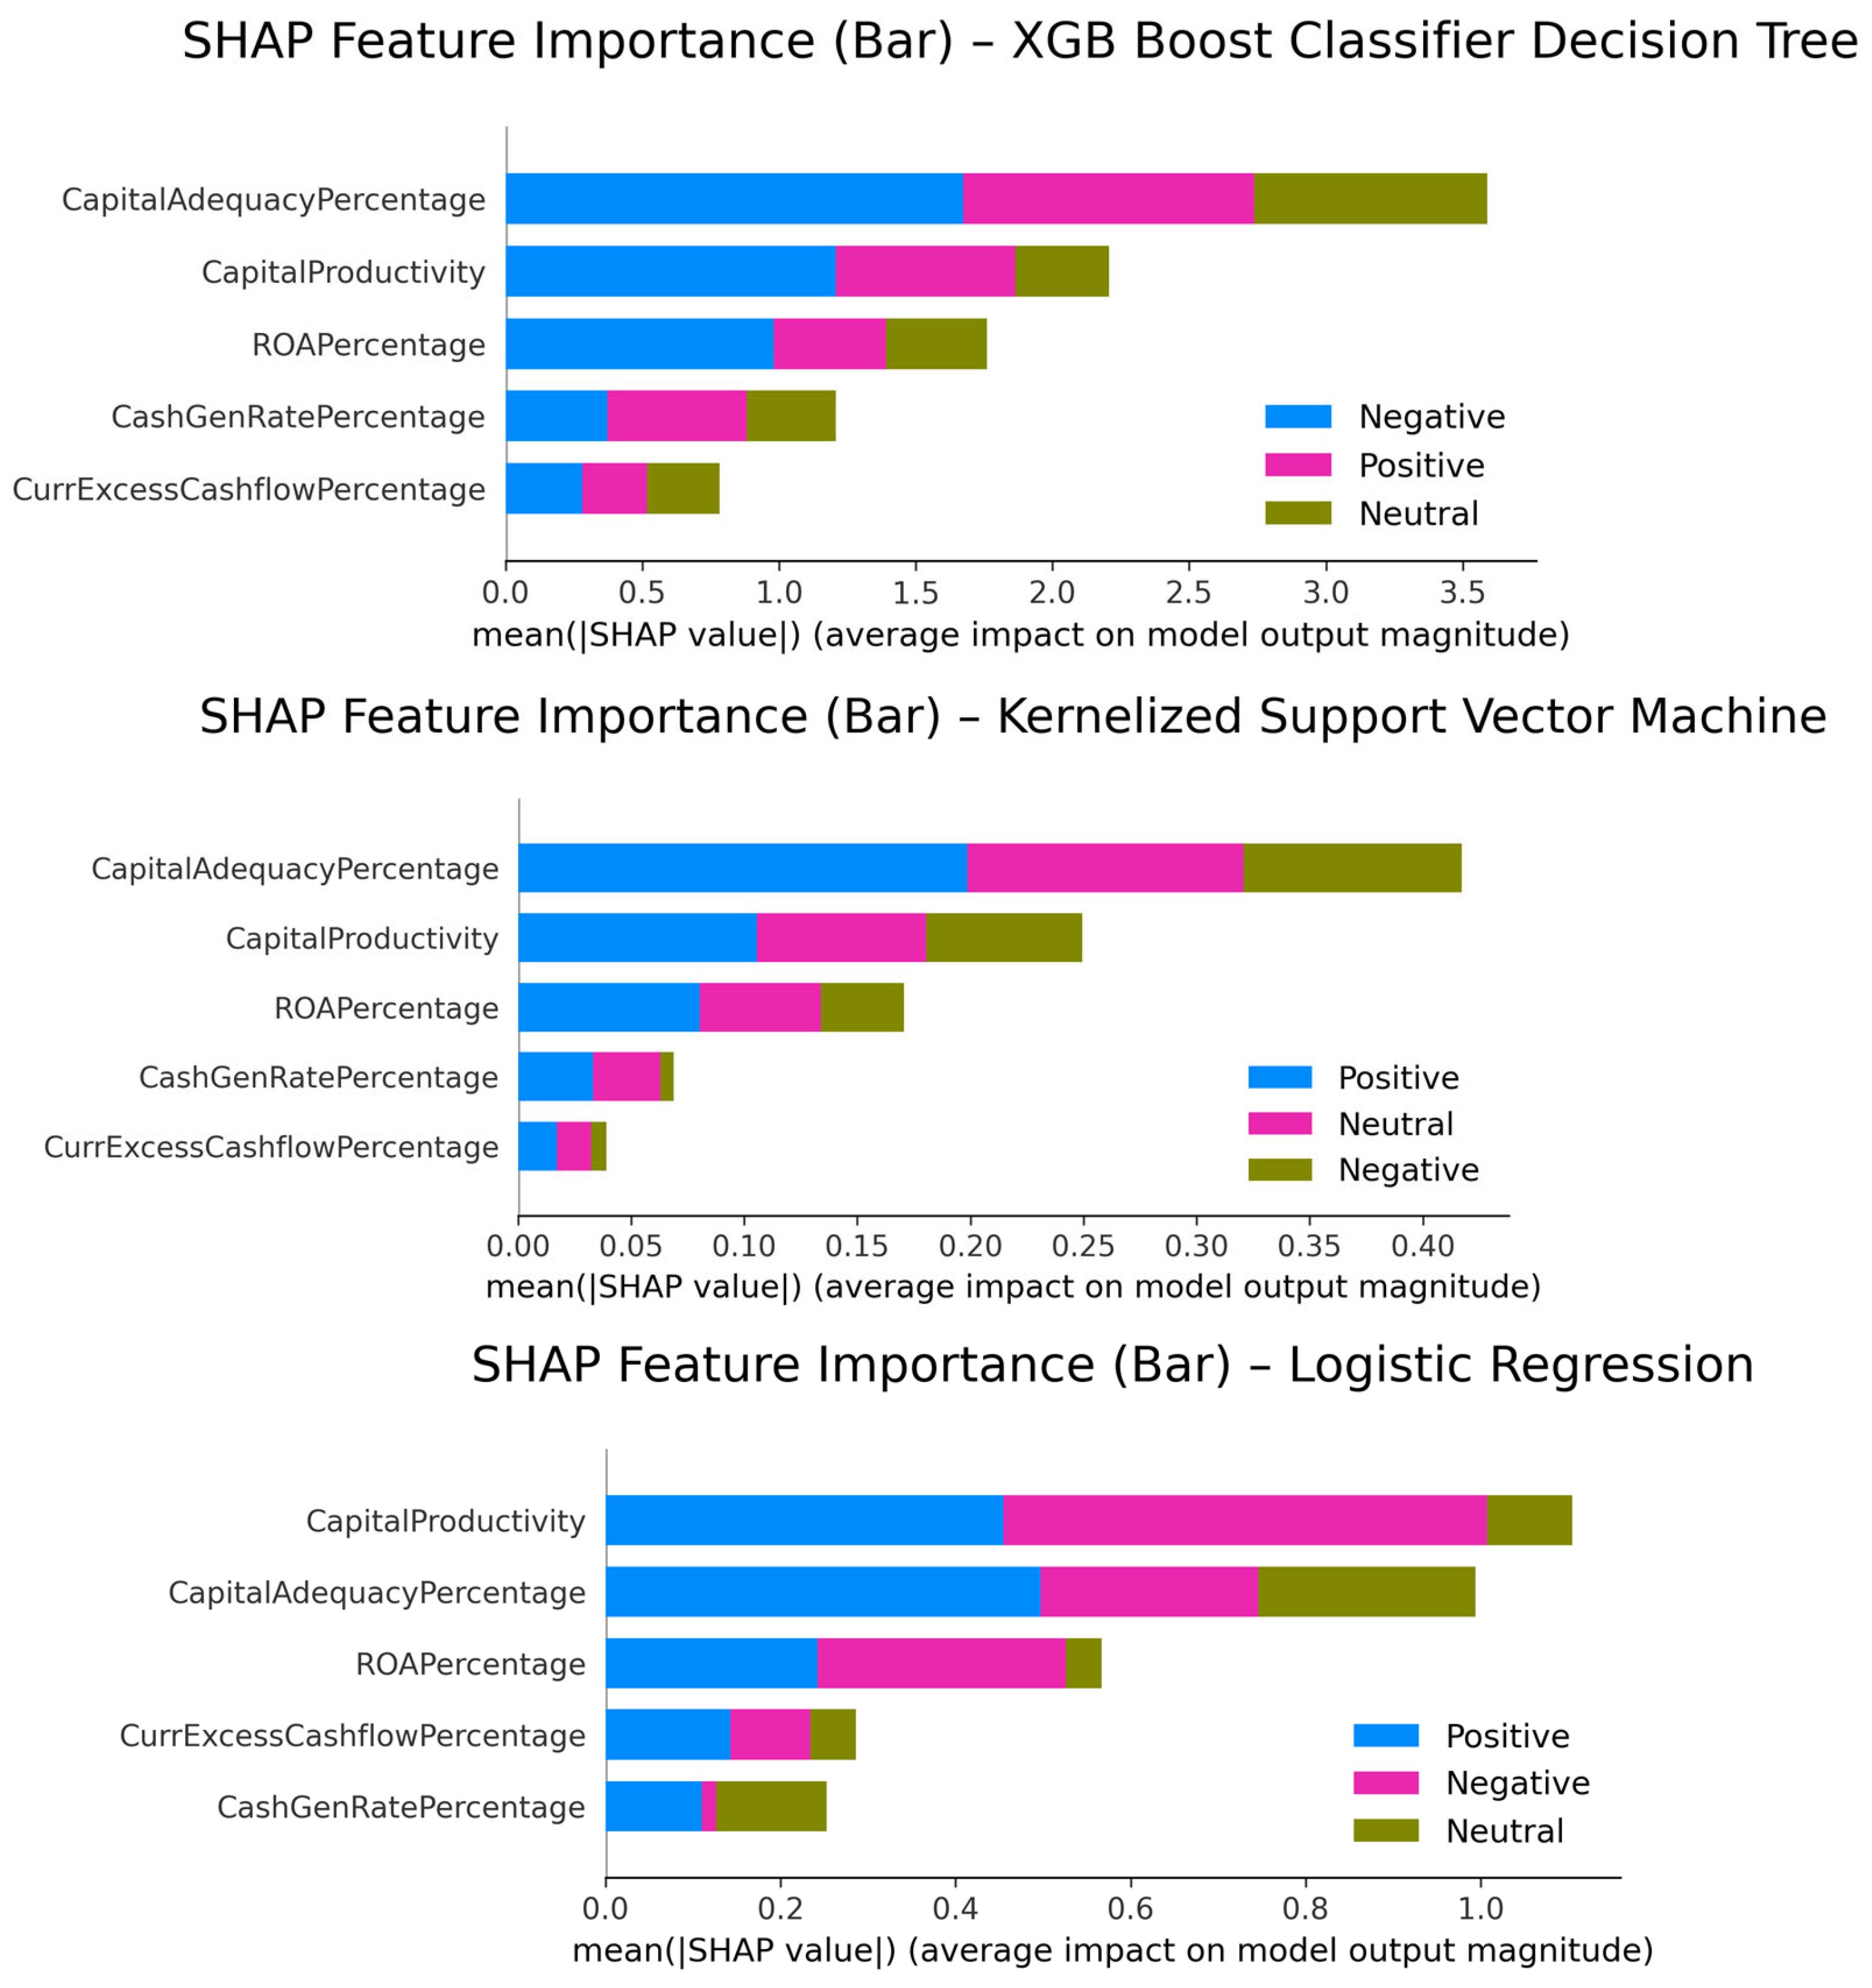
Figure 14 illustrates the SHAP dependency plot for the Gradient Boosting model, Kernelized Support Vector Machine, and Logistic Regression models.
The SHAP bar plot for the Gradient Boosting Classifier shows that Current Excess Cash Flow Percentage is the dominant predictor across the three outlook classes, followed by ROA and Cash Generation Rate Percentage. This finding indicates that the ability of firms to generate internal cash flows relative to liabilities is critically important in distinguishing between negative, neutral, and positive credit outlooks. From a credit risk perspective, this is economically intuitive because internally generated liquidity improves debt-servicing capacity and reduces refinancing pressure.
Similarly, the Kernelized Support Vector Machine model identifies Current Excess Cash Flow Percentage and Cash Generation Rate Percentage as the two most influential predictors. The recurrence of these liquidity-related measures across nonlinear models suggests that machine learning algorithms place substantial emphasis on a firm’s ability to sustain operating cash flows during periods of financial stress.
The Logistic Regression SHAP bar plot further reinforces these conclusions. In this model, Cash Generation Rate Percentage and Current Excess Cash Flow Percentage exhibit the highest explanatory power for Class 0 predictions. Because SHAP values are additive, higher absolute values imply stronger influence on the probability of classification into the specified outlook group. This indicates that deteriorating cash generation capacity materially shifts firms toward weaker credit outlook classifications.
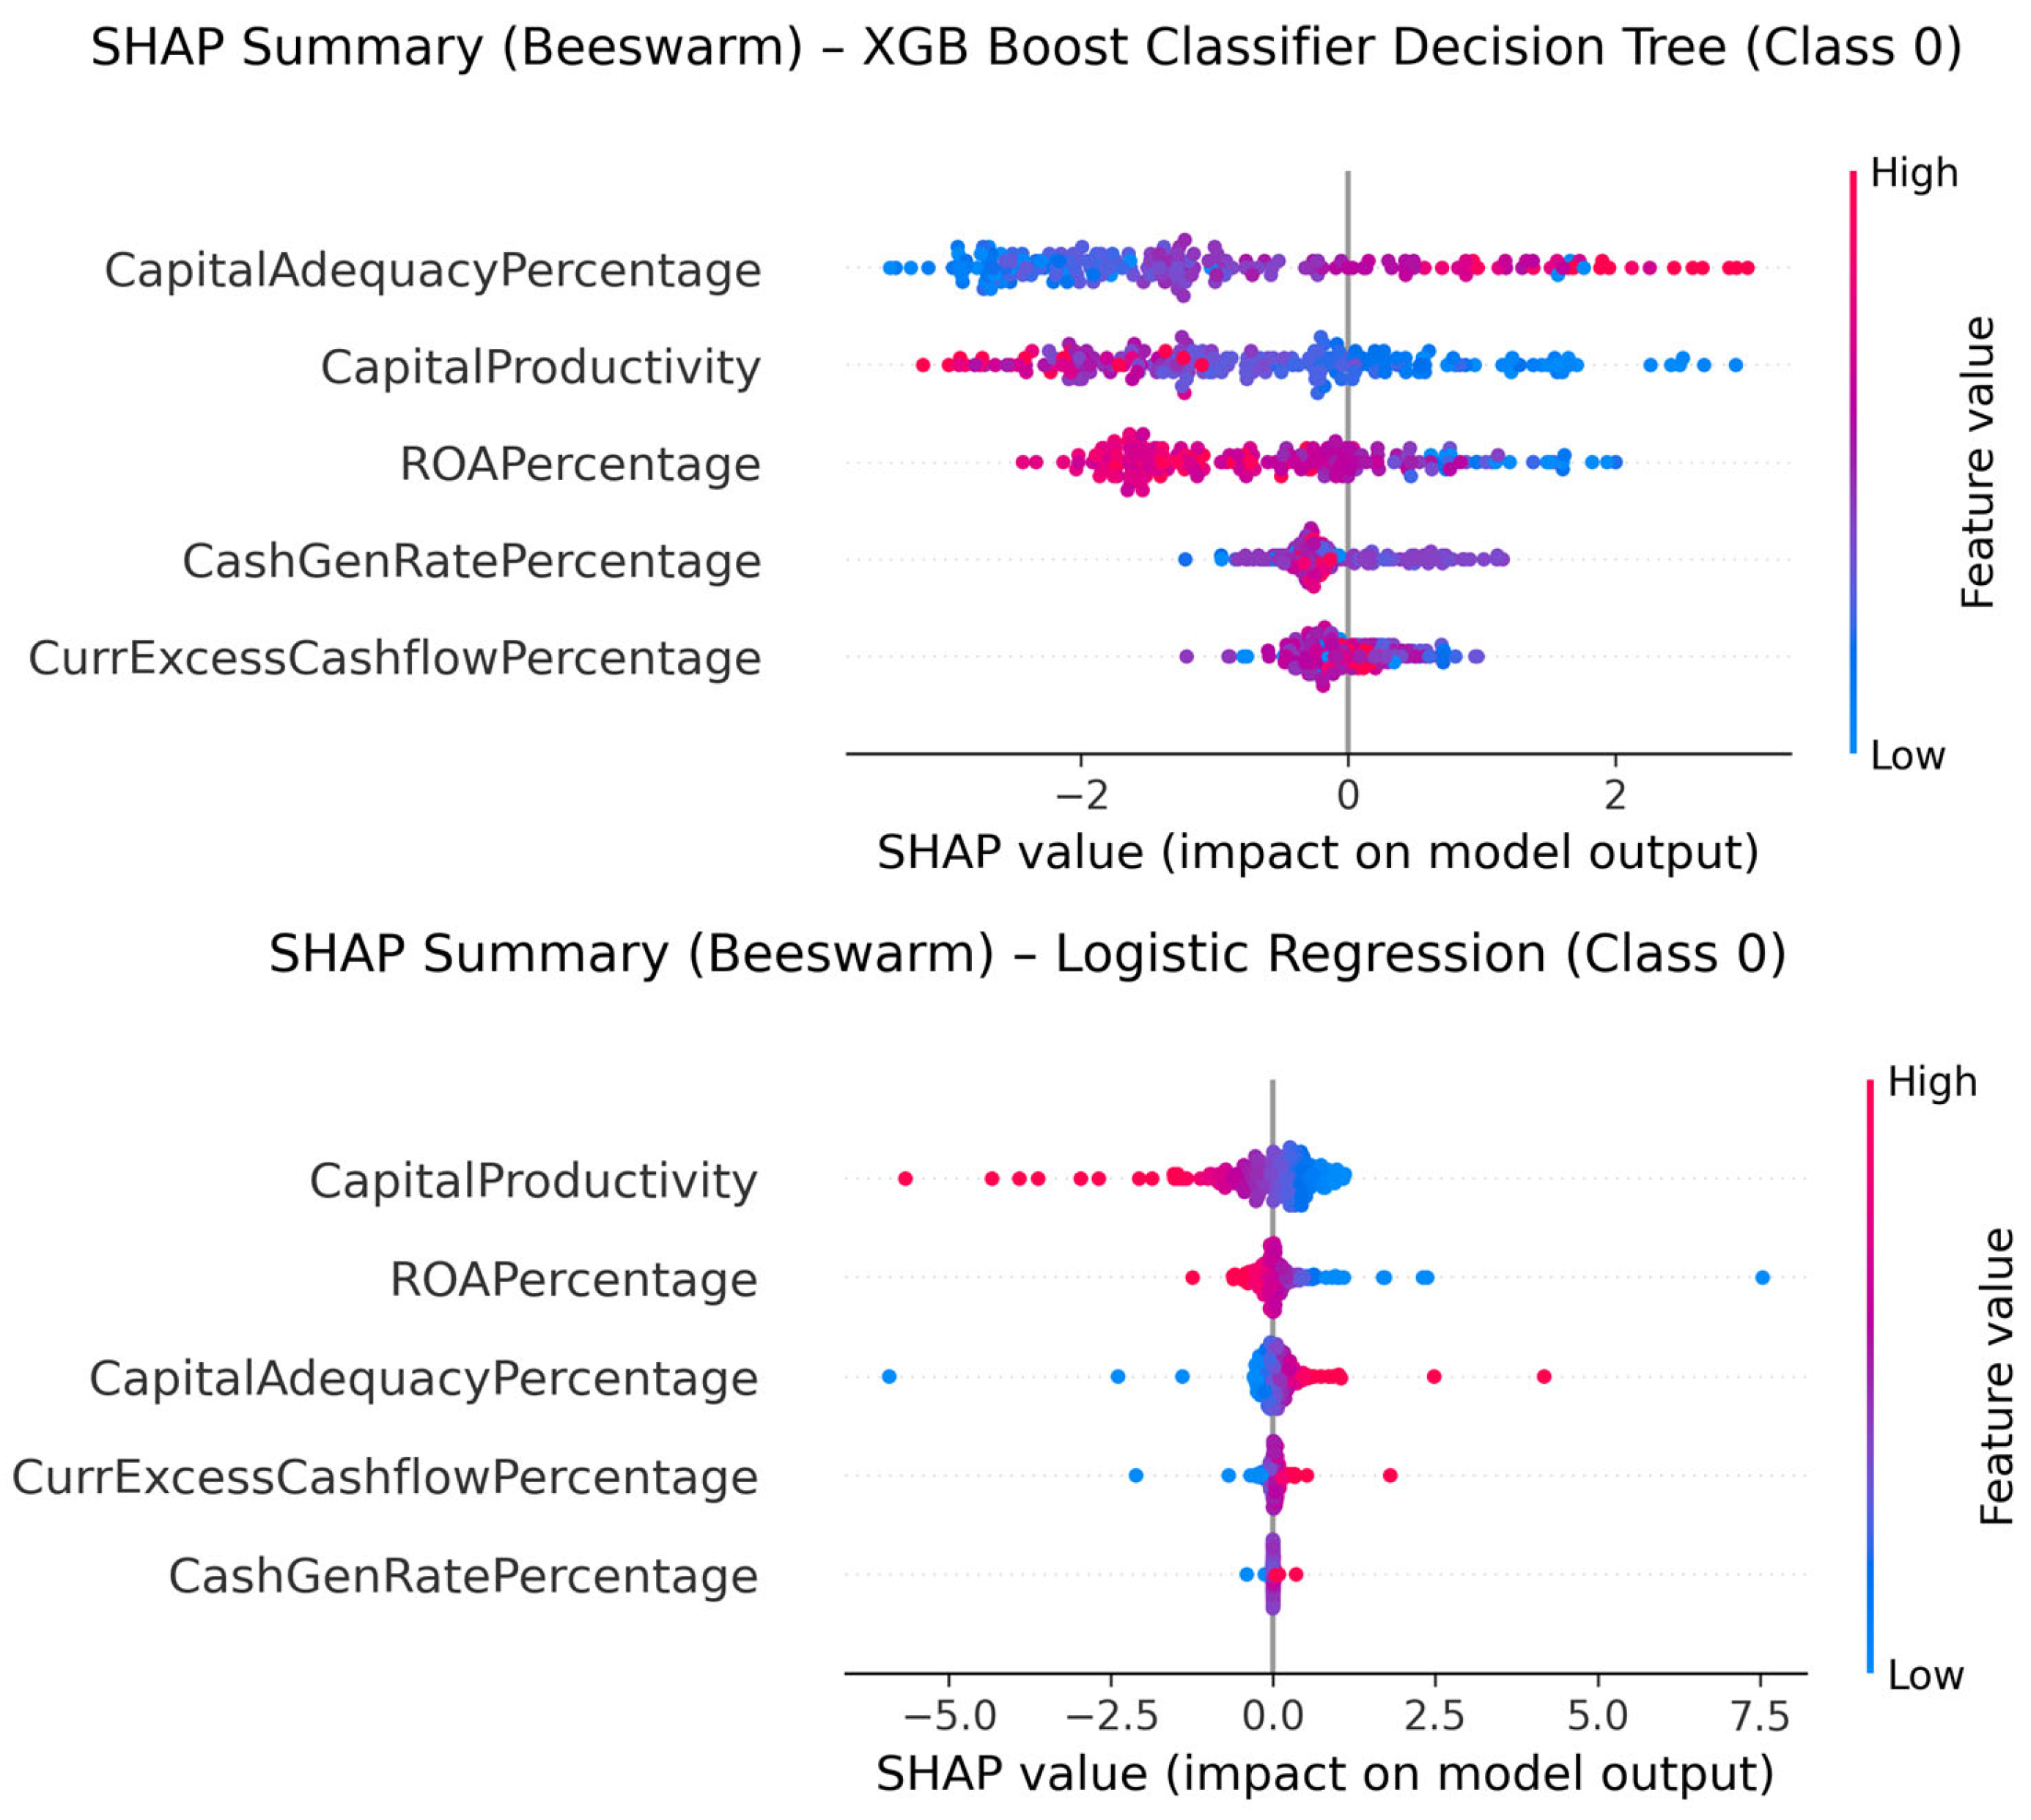
Figure 15 identifies liquidity-related variables, particularly excess cash flow, as the most influential determinants of credit outlook. The SHAP beeswarm plots provide deeper interpretive insight because they show not only variable importance but also the direction of influence.
Figure 15 illustrates the SHAP beeswarm plot for the Gradient Boosting models and k-Nearest Neighbor.
In the Logistic Regression beeswarm plot, higher values of Capital Productivity and ROA generally push SHAP values in directions associated with stronger classifications, while lower values contribute negatively. The distribution of points also suggests nonlinear threshold behavior. For example, firms with extremely weak ROA experience disproportionately negative SHAP effects, implying that the deterioration of profitability may accelerate credit deterioration once firms fall below certain performance thresholds.
The XGBoost beeswarm plot reveals even stronger nonlinearities. Capital Adequacy Percentage exhibits a wide SHAP dispersion, indicating that the marginal effect of Capital Adequacy varies substantially across firms. High Capital Adequacy values tend to shift predictions toward stronger outlook classes, whereas weak capital positions strongly increase the probability of adverse outlook classifications. The broad spread of SHAP values in XGBoost also demonstrates that tree-based ensemble models capture interaction effects and conditional relationships that are difficult to identify using traditional linear models.
Several important implications emerge from these SHAP results.
First, liquidity-related measures consistently dominate the classification process. This suggests that markets and rating-sensitive models place substantial weight on short-term financial resilience and internally generated funding capacity. Variables tied to liquidity appear more influential than purely accounting-based capital measures.
Second, the findings support the idea that profitability and cash flow stability jointly determine credit outlook transitions. ROA alone is important, but its predictive power becomes substantially stronger when combined with liquidity and cash-generation variables. This reinforces the interconnected nature of operating efficiency and solvency.
Third, the nonlinear SHAP distributions imply that financial deterioration does not affect firms symmetrically. Small declines in profitability or liquidity may have limited influence initially, but once firms cross certain thresholds the probability of adverse outlook classifications increases rapidly. This has important implications for early warning systems because it suggests that credit deterioration may accelerate once firms approach financially vulnerable regions.
Fourth, the consistency of SHAP rankings across models strengthens the robustness of the study. Even though the machine learning algorithms differ substantially in structure and complexity, they identify similar financial drivers. This enhances confidence that the results reflect economically meaningful relationships rather than statistical artifacts.
Finally, the SHAP analysis contributes practical value for portfolio managers, lenders, regulators, and corporate decision-makers. Credit analysts can use these findings to focus monitoring efforts on liquidity generation, excess cash flow capacity, and profitability sustainability. Managers seeking to improve credit outlooks may benefit more from strengthening operational cash generation and liquidity buffers than from relying solely on accounting-based improvements in capital ratios.
The SHAP dependence analysis provides exploratory evidence broadly consistent with H2 (Convex Deterioration Hypothesis) and H3 (Diminishing Marginal Strength Hypothesis). The dependence plots suggest that the marginal contribution of liquidity, profitability, and cash flow variables varies across financial states rather than remaining constant, indicating nonlinear and state-dependent relationships within the credit outlook classification process.
Deteriorating financial conditions appear to generate disproportionately negative impacts on predicted outlook classifications as firms approach weaker credit states, which is consistent with the convex deterioration dynamics implied by structural credit risk theory. Conversely, improvements in liquidity and cash flow measures appear to exhibit diminishing marginal contributions once firms reach sufficiently strong financial positions. These asymmetric patterns suggest that nonlinear classifiers are capturing economically meaningful threshold and interaction effects that are difficult to represent within traditional linear specifications. Accordingly, these results should be interpreted as theory-consistent, exploratory evidence on the functional form of credit deterioration, not as formal statistical proof of nonlinear threshold effects.
5.5. Comparisons Across Models
Table 4 shows pairwise comparisons of the classification accuracy between models based on the fold-level outcome of cross-validation. This accounts for the differences in performance on the same partitions of the data and therefore any difference is due to the models themselves and not sampling variability. We used Bonferroni and Holm corrections for multiple testing. In addition, we used Nadeau–Bengio corrected
t-test and Dietterich 5×2 CV tests to check statistical significance between different models.
We can draw two conclusions from these results in
Table 4 and
Table 5: first, nonlinear models predict slightly better than Logistic Regression does, and second, there is no statistically significant difference between the nonlinear models’ performance.
Logistic Regression had the lowest mean accuracy in 10-fold cross-validation, at about 69.80%. All the nonlinear models had mean accuracy between 79.31% and 80.04%, so their predictions were roughly 9.5 to 10.2 percentage points more accurate than Logistic Regression’s. Random Forest, Kernelized SVM, and kNN tied for best mean accuracy among the models we tested, at about 80.04%, but the differences between them were small.
The Nadeau–Bengio corrected t-tests strengthen the comparison because they adjust for the dependence among cross-validation folds. These tests show that every nonlinear model significantly outperforms Logistic Regression even after Bonferroni and Holm corrections. The corrected p-values for these comparisons are all below 0.001, meaning the improvement over Logistic Regression is statistically robust under this corrected 10-fold framework.
However, the same Nadeau–Bengio results show that the differences among XGBoost, Random Forest, Gradient Boosting, Kernelized SVM, and kNN are not statistically significant. Their adjusted p-values are all equal to 1.000 or clearly insignificant. Therefore, the results do not justify claiming that one nonlinear model is superior to the others.
The Dietterich 5×2 CV tests are even more conservative. They again show that Logistic Regression has lower performance than the nonlinear models, with average differences of about 8.6 to 9.6 percentage points. But after Bonferroni and Holm corrections, even these Logistic Regression versus nonlinear comparisons are not statistically significant. This does not mean the nonlinear models are worse; rather, it means the more conservative 5×2 CV test does not provide enough corrected statistical evidence to declare significance.
The evidence consistently shows that nonlinear models provide economically meaningful accuracy gains over Logistic Regression. The Nadeau–Bengio corrected tests indicate that these gains are statistically significant, while the more conservative Dietterich 5×2 CV tests support the same direction of improvement but not corrected statistical significance. Across nonlinear models, performance differences are small and statistically indistinguishable, suggesting a performance plateau among advanced classifiers.
When the full set of evaluation metrics is considered, the results provide a much clearer picture of model performance than accuracy alone. This is especially important because the negative outlook class represents only about 9.2% of the sample, making overall accuracy potentially misleading.
The first important finding is that Logistic Regression performs substantially worse once class imbalance is considered. Although Logistic Regression achieves a testing accuracy of approximately 70%, its balanced accuracy is much lower, indicating that the model performs poorly across minority classes. In particular, the negative-class recall is very weak, meaning the model frequently fails to identify firms in the negative outlook category. This suggests that Logistic Regression is biased toward the majority neutral and positive classes.
By contrast, all nonlinear models demonstrate materially stronger class-sensitive performance. Random Forest, Gradient Boosting, XGBoost, Kernelized SVM, and kNN all achieve testing accuracies near 79–80%, but, more importantly, they also produce substantially higher balanced accuracy, macro-F1, and negative-class recall values. This indicates that the nonlinear models improve prediction quality not only overall, but specifically for the minority distress category that is most economically important in credit outlook analysis.
Macro-level metrics are especially useful because they give more equal weight to all classes instead of letting the majority class dominate the evaluation. The nonlinear models consistently achieve stronger macro precision, macro recall, and macro F1-scores, showing that the improvement is broad-based across all outlook categories. The gains in macro-F1 are particularly important because they demonstrate simultaneous improvement in both precision and recall rather than merely increasing one at the expense of the other.
The ROC-AUC results reinforce these conclusions. Logistic Regression produces the weakest discrimination ability across classes, while the nonlinear models achieve substantially higher multiclass ROC-AUC measures. Kernelized SVM and Random Forest generate the strongest weighted one-vs-rest ROC-AUC values, exceeding 90%, indicating strong overall separability among negative, neutral, and positive outlook classes.
The precision-recall metrics further strengthen the interpretation. Because the negative class is relatively rare, PR-AUC provides a more informative measure than accuracy alone. The nonlinear models consistently achieve stronger average precision scores, suggesting superior capability in identifying financially distressed firms without generating excessive false positives.
The full metrics framework shows that the nonlinear models do not merely improve headline accuracy, they provide materially better minority-class detection, stronger multiclass discrimination, and more balanced predictive performance across all outlook categories. At the same time, the differences among the nonlinear models themselves remain relatively small, supporting the conclusion that the study identifies a nonlinear performance advantage over Logistic Regression, but only limited incremental gains among advanced nonlinear classifiers.
6. Practical Implications for Decision Makers
The empirical findings of this study yield several important implications for financial decision-making and risk management. These implications follow directly from three central results: (i) the superiority of nonlinear models over linear benchmarks, (ii) the presence of a complexity plateau across nonlinear classifiers, and (iii) the economic interpretability of model predictions as revealed by SHAP analysis.
First, the consistent superiority of nonlinear classifiers over multinomial Logistic Regression indicates that credit risk dynamics are essentially nonlinear and driven by interaction effects among financial factors. In practical terms, this means that institutions employing linear scoring models may systematically underestimate the chance of financial deterioration, particularly for enterprises close to distress thresholds. The integration of nonlinear modeling techniques can thus improve the detection of sensitive organizations and the early warning systems, with immediate applications in credit screening, loan underwriting and portfolio risk management.
Second, the observation that nonlinear classifiers have economically small and statistically negligible differences in performance has crucial consequences for model selection and governance. The gains in predicted accuracy achieved by adding non-linearity to the structure are considerable, although further increases in model complexity do not provide any meaningful additional gains. This shows that financial organizations do not necessarily have to implement highly complicated or computationally intensive models. Alternatively, they may be able to achieve similar performance using simpler nonlinear methods that are more transparent, stable, and easier to apply, an important factor in regulated situations in where model interpretability and auditability are paramount.
Third, the SHAP analysis shows that the model predictions are consistent with economically intuitive relationships, including a convex penalty for financial degradation and diminishing marginal advantages of surplus liquidity. The obvious consequences for risk assessment procedures are that typical linear scoring frameworks may underestimate downside risk and exaggerate the benefits of strong financial positions. Nonlinear and state-dependent interpretations of financial variables might improve stress testing and scenario analysis and capital allocation choices by better reflecting asymmetric risk dynamics.
Beyond credit outlook prediction, the findings of this study have broader relevance for financial risk management. The documented importance of nonlinear relationships and interaction effects extends to areas such as default prediction, credit scoring, portfolio optimization, and systemic risk monitoring. For example, early warning systems for financial distress, risk-based pricing models, and regulatory stress-testing frameworks may benefit from incorporating nonlinear modeling techniques that more accurately capture the underlying structure of financial risk. Moreover, the integration of explainable machine learning methods such as SHAP provides a pathway for combining predictive accuracy with economic interpretability, addressing a key barrier to the adoption of advanced analytics in practice.
Because the framework relies exclusively on accounting-based inputs, it provides a transparent and interpretable signal of credit quality that is independent of market pricing mechanisms. As such, it may serve as a useful supplementary tool alongside market-based measures such as credit spreads or agency ratings, particularly in settings where such measures are unavailable, thinly traded, or slow to incorporate changes in firm fundamentals.
7. Summary and Conclusions
We investigated whether model complexity improved classification of corporate financial distress when building a multiclass credit outlook model. We compared a parametric benchmark to various nonlinear classifiers within a unified framework for validation and inference. This allowed us to shed light on the importance of nonlinearity and model complexity in credit risk modeling.
The empirical results yielded three primary conclusions. First, nonlinear classifiers consistently and materially outperformed the multinomial Logistic Regression benchmark. The improvement in predictive accuracy—on the order of ten percentage points—was accompanied by a more balanced classification structure, particularly in identifying financially vulnerable firms. These findings indicated that corporate credit risk was inherently nonlinear and driven by interaction-sensitive dynamics that could not be adequately captured by linear specifications.
Second, while these improvements were real, the differences between nonlinear models were trivial in economic terms and statistically insignificant. Ensemble learners, kernel classifiers, and similarity-based predictors gave nearly identical results under all validation schemes. This likely reflected an upper-bound on performance: after accounting for nonlinear structure in the data, further improvements were subject to diminishing returns as model complexity increased. From a modeling standpoint, this meant that gains were being realized mostly from dropping the linearity assumption, rather than from using more elaborate models.
Third, we conducted interpretability analysis to show that our model made predictions based on economically sensible relationships. The SHAP-based interpretability analysis further indicated that liquidity, leverage, and profitability were important drivers of predicted credit outlook classifications. The observed SHAP patterns suggested that the effects of these variables were nonlinear and state-dependent, with financial deterioration appearing to exert disproportionately negative impacts near distress regions, while improvements in already-strong financial positions generated diminishing marginal effects. These findings were broadly consistent with the asymmetric dynamics predicted by structural credit risk theory and suggest that the nonlinear classifiers learned economically coherent relationships rather than merely exploiting statistical regularities.
These findings advanced the credit risk literature by elucidating the functional structure of corporate crisis dynamics and by redefining the role of machine learning in financial forecasting. The findings indicated that the significance of machine learning is not in augmenting model complexity, but in its capacity to identify nonlinear and interaction-driven correlations inside financial data.
The study contributes to the growing literature on machine learning in credit risk by demonstrating that the principal source of predictive improvement comes from the incorporation of nonlinear structure rather than from increasingly sophisticated algorithmic complexity. The findings further suggest that interpretable machine learning frameworks can provide economically coherent insights into transitional credit risk dynamics while maintaining strong out-of-sample predictive performance. In this sense, the results bridge predictive modeling and structural credit risk theory within a multiclass accounting-based credit outlook framework.
7.1. Limitations of the Study
Several limitations should be acknowledged. First, the outlook categories are constructed using accounting-based thresholds rather than externally observed rating-agency outlooks or market-implied credit measures. Although this framework provides a transparent and interpretable representation of firm fundamentals, future research could extend the analysis using agency ratings, CDS spreads, or bond-market indicators to further validate the economic relevance of the classification framework. Second, while SHAP analysis provides economically intuitive interpretability evidence, it remains fundamentally observational and should not be interpreted as establishing causal relationships among financial variables and credit outcomes.
7.2. Directions for Future Research
There were still some directions left for future work. Testing on other datasets, accounting for time-varying macroeconomic factors, or measuring against other methods of class imbalance treatment may yield further understanding of the complexity plateau’s robustness and breadth. Research might also be conducted into how these results fared in other financial forecasting scenarios with nonlinear relationships.