Article

Do Financial and Digital Inclusion Moderate Changes in Emitted Transport-Related CO2 in the SADC?


by
Simon Osiregbemhe Ilogho
* and
Heinz Eckart Klingelhöfer
Department of Finance & Investment, Tshwane University of Technology, Pretoria 0001, South Africa
*
Author to whom correspondence should be addressed.
J. Risk Financial Manag. 2026, 19(6), 388; https://doi.org/10.3390/jrfm19060388
Submission received: 3 March 2026 / Revised: 25 March 2026 / Accepted: 4 April 2026 / Published: 28 May 2026
(This article belongs to the Special Issue Energy and Sustainability Finance: Pathways to a Low-Carbon Economy)

Abstract

As mobility and transport activities declined during the COVID-19 lockdowns, transactions and operations became increasingly dependent on digitalisation. This shift reduced the need for carbon-emissions-intensive fossil-fuel-based transportation. Using a panel of thirteen (13) Southern African Development Community (SADC) countries over the period 2002–2021, the analysis captures financial inclusion through indicators of ATM density and commercial bank accessibility, while digital inclusion is measured using mobile phone subscriptions and internet penetration. On this basis, it investigates the effects of (a) financial and (b) digital inclusion, and (c) the moderation of financial and digital inclusion on transport-related carbon emissions. Employing the Panel Two-Stage Estimated Generalised Least Square (EGLS) analysis on data obtained from the World Bank database and Our World in Data, the findings reveal statistically significant outcomes. Increasing ATM accessibility, commercial bank branch accessibility and mobile phone subscription rates are associated with reduced transport-related emissions. In contrast, enhanced internet access does not contribute to transport-related carbon emissions. Moderation analyses further indicate that the interaction of the accessibility of ATMs or commercial bank branches with internet access do not lead to a further reduction in carbon emissions than the individual ones but might have a slightly opposing direction (that still do not annihilate the individual effects). Findings show that only the moderation of ATM accessibility and mobile subscriptions reduce transport-related carbon emissions further than the individual effects. Taking the economic development of most SADC countries in the last 20 years into account, the study recommends strategic investment in advanced digital innovations, particularly linked with mobile devices, to strengthen digital banking efficiency and improve customer service while supporting emission-reducing pathways.

1. Introduction

For almost a century, first-world economies experienced the first and second industrial revolutions, which were heavily dependent on the combustion of large volumes of fossil fuels (Daunton, 1995; Mohajan, 2019). Several sectors and industrial activities, including mining, energy, construction, textiles, iron production, and transportation industries, were extended or even newly established during this period in these economies (Freeman & Louçã, 2001; Clark, 2008; Ventura & Voth, 2015). These resulted in high levels of atmospheric carbon emissions; yet, the consequential and negative environmental impacts of their economic and infrastructural advancements (Sachs, 2011; William, 2012) were not considered until the 20th century, at the end of the second industrial revolution (Erdös, 2023).
Nowadays, these developed economies have changed focus towards sustainability by transitioning away from traditional industrial processes that are detrimental to society and the environment (Elg & Hånell, 2023). They invest more in emission reduction (Klingelhöfer, 2009; Bokpin, 2017), product innovations and resource reduction, moving towards a dependence on renewable energy sources and a circular economy. Moreover, emerging economies, recently, are challenged with driving industrialisation and economic advancement towards raising their standard of living without compromising on sustainability (Jayanti & Gowda, 2014; Meyer & Peng, 2016). The challenge for these emerging economies involves the balance between industrialisation, which involves increased industrial activities and, simultaneously, creating incentives for investments towards emission reduction (Klingelhöfer, 2009; Klingelhöfer, 2017; Huo et al., 2023).
Most emission-reduction efforts have been directed at production-based and consumption-based emissions (Wang et al., 2024). The former captures emissions traceable to the territory of goods consumed, while the latter is traceable to the territory of production regardless of the territory of final consumption (Ritchie & Roser, 2023). In addition, there are other emission source categories, such as activity-based emissions (including emissions from transportation) and domestic emissions (emissions from households), which have recently been discussed in Cheng et al. (2024) and Li (2024). Thus, each emission channel is an essential focus in the literature, especially transport-related emissions, which are manageable with reduced and regulated human activities.
Transportation has been both an essential need and threat in human history and development. Nowadays, a great part of the global transport and logistics industry still relies on the consumption of fossil fuel energy sources, which increases carbon emissions (Fan et al., 2023; Hoa et al., 2024; IEA, 2023), especially in Africa (Kwakwa et al., 2023). Nevertheless, since human activities and transportation declined during the lockdown periods of the COVID-19 pandemic, operations and processes became more dependent on digitalisation (Amankwah-Amoah et al., 2021; Hassani et al., 2021).
Globally, during the pandemic periods, digitalisation was a means to offset and manage what would have been a potential decline in productivity. Digitalisation also facilitated and maintained social connectivity and socio-economic empowerment with an increased online (internet and social media) presence and activities on digital platforms with teleconferences, meetings, and customer services, especially in Africa during the pandemic (Gwiza et al., 2024). The reliance on digitalisation during and after this period reduced the need for fossil fuel combustion via transportation. For instance, based on the World Bank’s WDI emission data (World Bank, 2024a), greenhouse gases emitted in most Southern African nations, like Angola, South Africa, Zambia, Botswana, Mozambique, Zimbabwe, Tanzania, Namibia, and Malawi, declined in 2020. Hence, while the focus on alternative renewable energy sources for transportation and industries to lower emissions may be a challenge for emerging economies, digitalisation and financial inclusion could indeed contribute to meeting emission reduction targets.
Since the pandemic, corporations, businesses, banks and other financial institutions, as well as individuals, have leveraged the digital medium for operations, productivity and their livelihood (Bellis et al., 2022; Santos et al., 2023). Likewise, banks and other financial institutions have met customers’ demands via their digitalised platforms in rendering financial services (Doran et al., 2022; Ionascu & Barbu, 2023; Khosa, 2024). In addition to traditional banks, the emergence of FinTech firms and neobanks, especially in Africa, has brought financial services to more people within marginalised communities. However, potential circumstances like the pandemic may still impact those who are financially but not digitally included, as it may affect their livelihood. Therefore, it is worth investigating the impact of digital and financial inclusion on transport-related emissions in the Southern Africa Development Community (SADC). Hence, our research questions are stated as follows:
  • What is the effect of financial inclusion on transport-related carbon emissions?
  • What is the effect of digital inclusion on transport-related carbon emissions?
  • What moderating effects do financial inclusion and digital inclusion have on transport-related carbon emissions?
From these questions, the study’s specific objectives are
  • To examine the effect of financial inclusion on transport-related carbon emissions.
  • To ascertain the effect of digital inclusion on transport-related carbon emissions.
  • To investigate the moderate effects of financial and digital inclusion on transport-related carbon emissions.
In doing so, this paper is expected to add to the emission reduction literature as previous studies, to the best of our search, have not examined the impact of financial and digital inclusion on transport-related carbon emissions. In addition, according to our knowledge, the interaction between financial inclusion and digital inclusion via moderation has not been tested yet; unlike in underdeveloped and emerging economies in Southern Africa, in most developed nations with advanced digital finance infrastructure, examinations of digital finance can be easily conducted because of the dominance of these infrastructures. Therefore, the test of moderation (between financial and digital inclusion) in this study provides further insights into the impact of both elements, especially in underdeveloped and emerging economies.
This paper is outlined in the following order: after discussing the impact of the inclusion of digital financial service and the reduction of carbon emissions in the literature, it presents the methods used to observe this examination and then the robust analysis of the data. Based on the findings, it concludes and makes policy-applicable recommendations.

2. Literature Review and Hypothesis Development

This section establishes the link between digital financial inclusion and greenhouse gas emissions based on prior literature. It also derives the hypothesis to be investigated and portrays existing facts with respect to digital inclusion and financial inclusion proxies in the Southern African Development Community.

2.1. Emission Reduction and Digital Financial Inclusion

Studies have established the connection between digital financial inclusion and greenhouse gas emissions in the past. Some of them, like Farzana et al. (2024) and Becha et al. (2025), show that technological advancements aid the use and acceptance of digital financial services, contributing to the decline in the need for traditional banking and, thereby, lowering physical mobility and energy consumption. Therefore, e.g., Farzana et al. (2024) and Becha et al. (2025) opine that digital financial inclusion reduces emissions.
On the other hand, there have been studies that see a detrimental effect on the environment as the activity-boosting influence of increased digital financial inclusion leads to more combustion of fossil fuels, emitting carbon into the atmosphere (T. H. Le et al., 2020; Zaidi et al., 2021; Fareed et al., 2022; Cheng et al., 2024; Li, 2024).
However, Fang et al. (2022) pointed out another perspective on increased digital financial inclusion by suggesting that increased access to financial services would boost access to credit that could encourage research and development on technological innovations aimed at improving access to alternative renewable energy sources and energy consumption efficiency. This argument, alongside other arguments, equally presents the literature with an established link between emissions and financial inclusion.
-
Such disparities in observations could be associated with differences in the employed methodology, location of examination and period of assessment. For instance, Li (2024) and Becha et al. (2025) had different results from the same location, China, based on distinct methodologies. H. Zheng and Li (2022) and Wang et al. (2024) depicted mixed outcomes in results, which can be associated with the difference in study locations (assessed populations) and the method of analysis: Wang et al. (2024), showed that different locations are associated with different results using the spatial econometric model. Similarly, H. Zheng and Li (2022), using a different method (quantile regression), indicated that digital financial inclusion led to a reduction in carbon emissions in places that already had low carbon emissions and an emissions increase in places with high carbon emissions.
Studies like H. Zheng and Li (2022), M. Yang et al. (2024) and F. Zheng et al. (2025) examined the effect of digital financial inclusion in China, but they did not get the same results. The difference in results can probably be attributed to the different methods of analysis and periods examined.
-
According to V. L. T. Le and Pham (2024), the impact of digital inclusion and financial inclusion on emissions varies based on the level of emissions and inclusion.
-
M. Yang et al. (2024) also examined digitalisation separately, employing spatial analysis on the depth and breadth of digital financial inclusion, while F. Zheng et al. (2025) examined China using a dual machine learning model. Both studies suggested that increased digital financial inclusion reduces carbon emissions, despite using different methods and year-periods. Similar results were obtained by Salman and Ismael (2023) in the long run by examining Egypt from 1990 to 2020, employing the STIRPAT and ARDL models.
-
Ozturk and Ullah (2022), Khan et al. (2023), Cheng et al. (2024) and Li (2024) observed that digital financial inclusion can increase energy consumption, and hence carbon emission.
Therefore, seeing all these inconclusive but informative contrary results, from the various methods, approaches, study locations and scopes, one can conclude that it is indeed important to examine the impact of digital financial inclusion. According to Li (2024), the emission-increasing influence of digital financial inclusion has a broad implication on other emerging countries. Therefore, one can derive a particular need to investigate this subject matter in the Southern African Development Countries (SADC) because most of the SADC nations fall within the emerging and developing economies bracket.

2.2. Research GAP

In the past literature, Desalegn et al. (2022), Tariq and Shahzad (2022), Coffie et al. (2025) and Thangaiyarkarasi and Vanitha (2025) had proxied digital financial inclusion by using recent financial service-based technologies like the mobile money Asongu (2018), point of sales (POS) and mobile applications. Other studies like Ahiase et al. (2024), Hussain et al. (2023) and V. L. T. Le and Pham (2024) have proxied finances by using more traditional financial service facilities like automated teller machines (ATMs) and commercial banks. V. L. T. Le and Pham (2024) approached their examination by assessing digital inclusion proxies (like mobile subscription) separately from financial inclusion proxies. These proxies for financial inclusion and digital inclusion are well suited to under-developing and emerging economies, as mobile phone subscriptions and these traditional financial inclusion facilities became common in these economies within the larger part of the examined period (2002 to 2021), while more sophisticated digital finance facilities and structures on the ground were still lacking in many of them (Ugur & Mitra, 2017; McBride & Stahl, 2010; Matthess & Kunkel, 2020; Chatterjee, 2020). However, there is a dearth in the literature when examining transport-related carbon emissions and the individual impact of financial and digital inclusion on these emissions. Hence, as research objectives (as mentioned already before), we attempt to explore these gaps by investigating the interactive influence of (a) financial and (b) digital inclusion as well as (c) the moderating effect of financial and digital inclusion on transport-related carbon emissions in the SADC, as a contribution to the literature.
In alignment with these objectives, the research hypotheses are highlighted in their null form as follows:
H01. 
Financial inclusion does not have significant effect on carbon emissions.
H02. 
Digital inclusion does not have significant effect on carbon emissions.
H03. 
Financial and digital inclusion moderation do not have significant effect on carbon emissions.

2.3. Stylised Facts

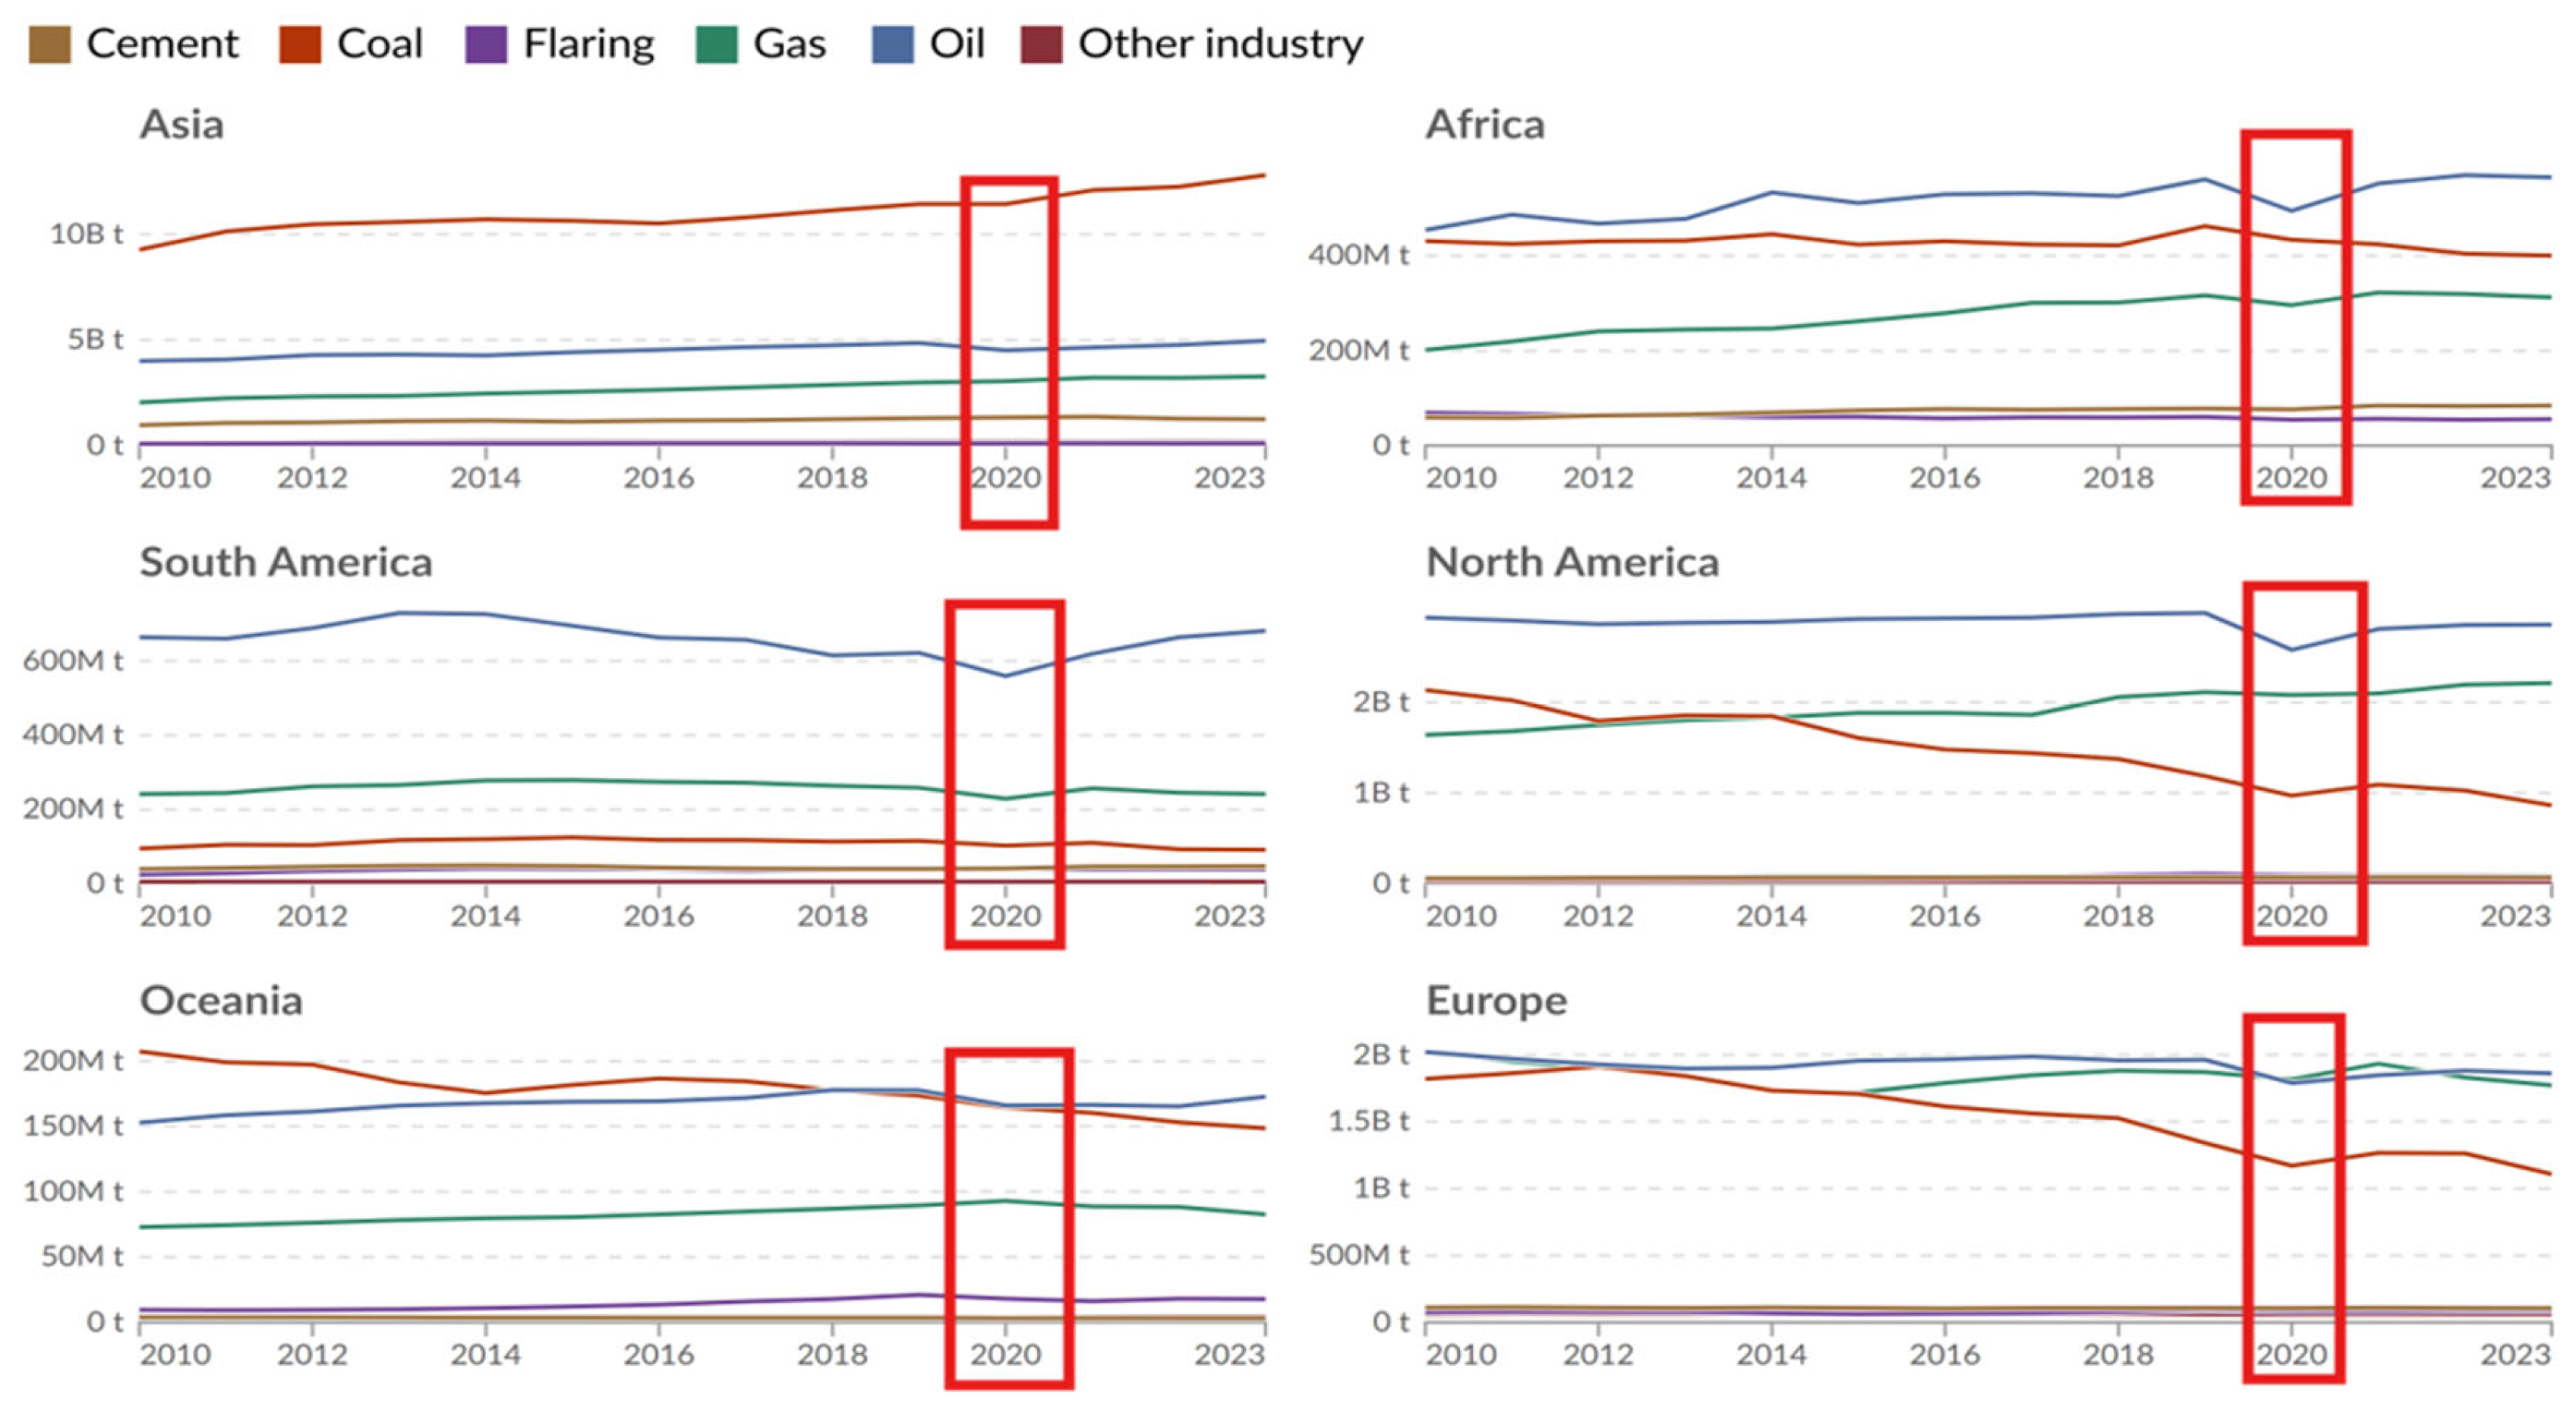
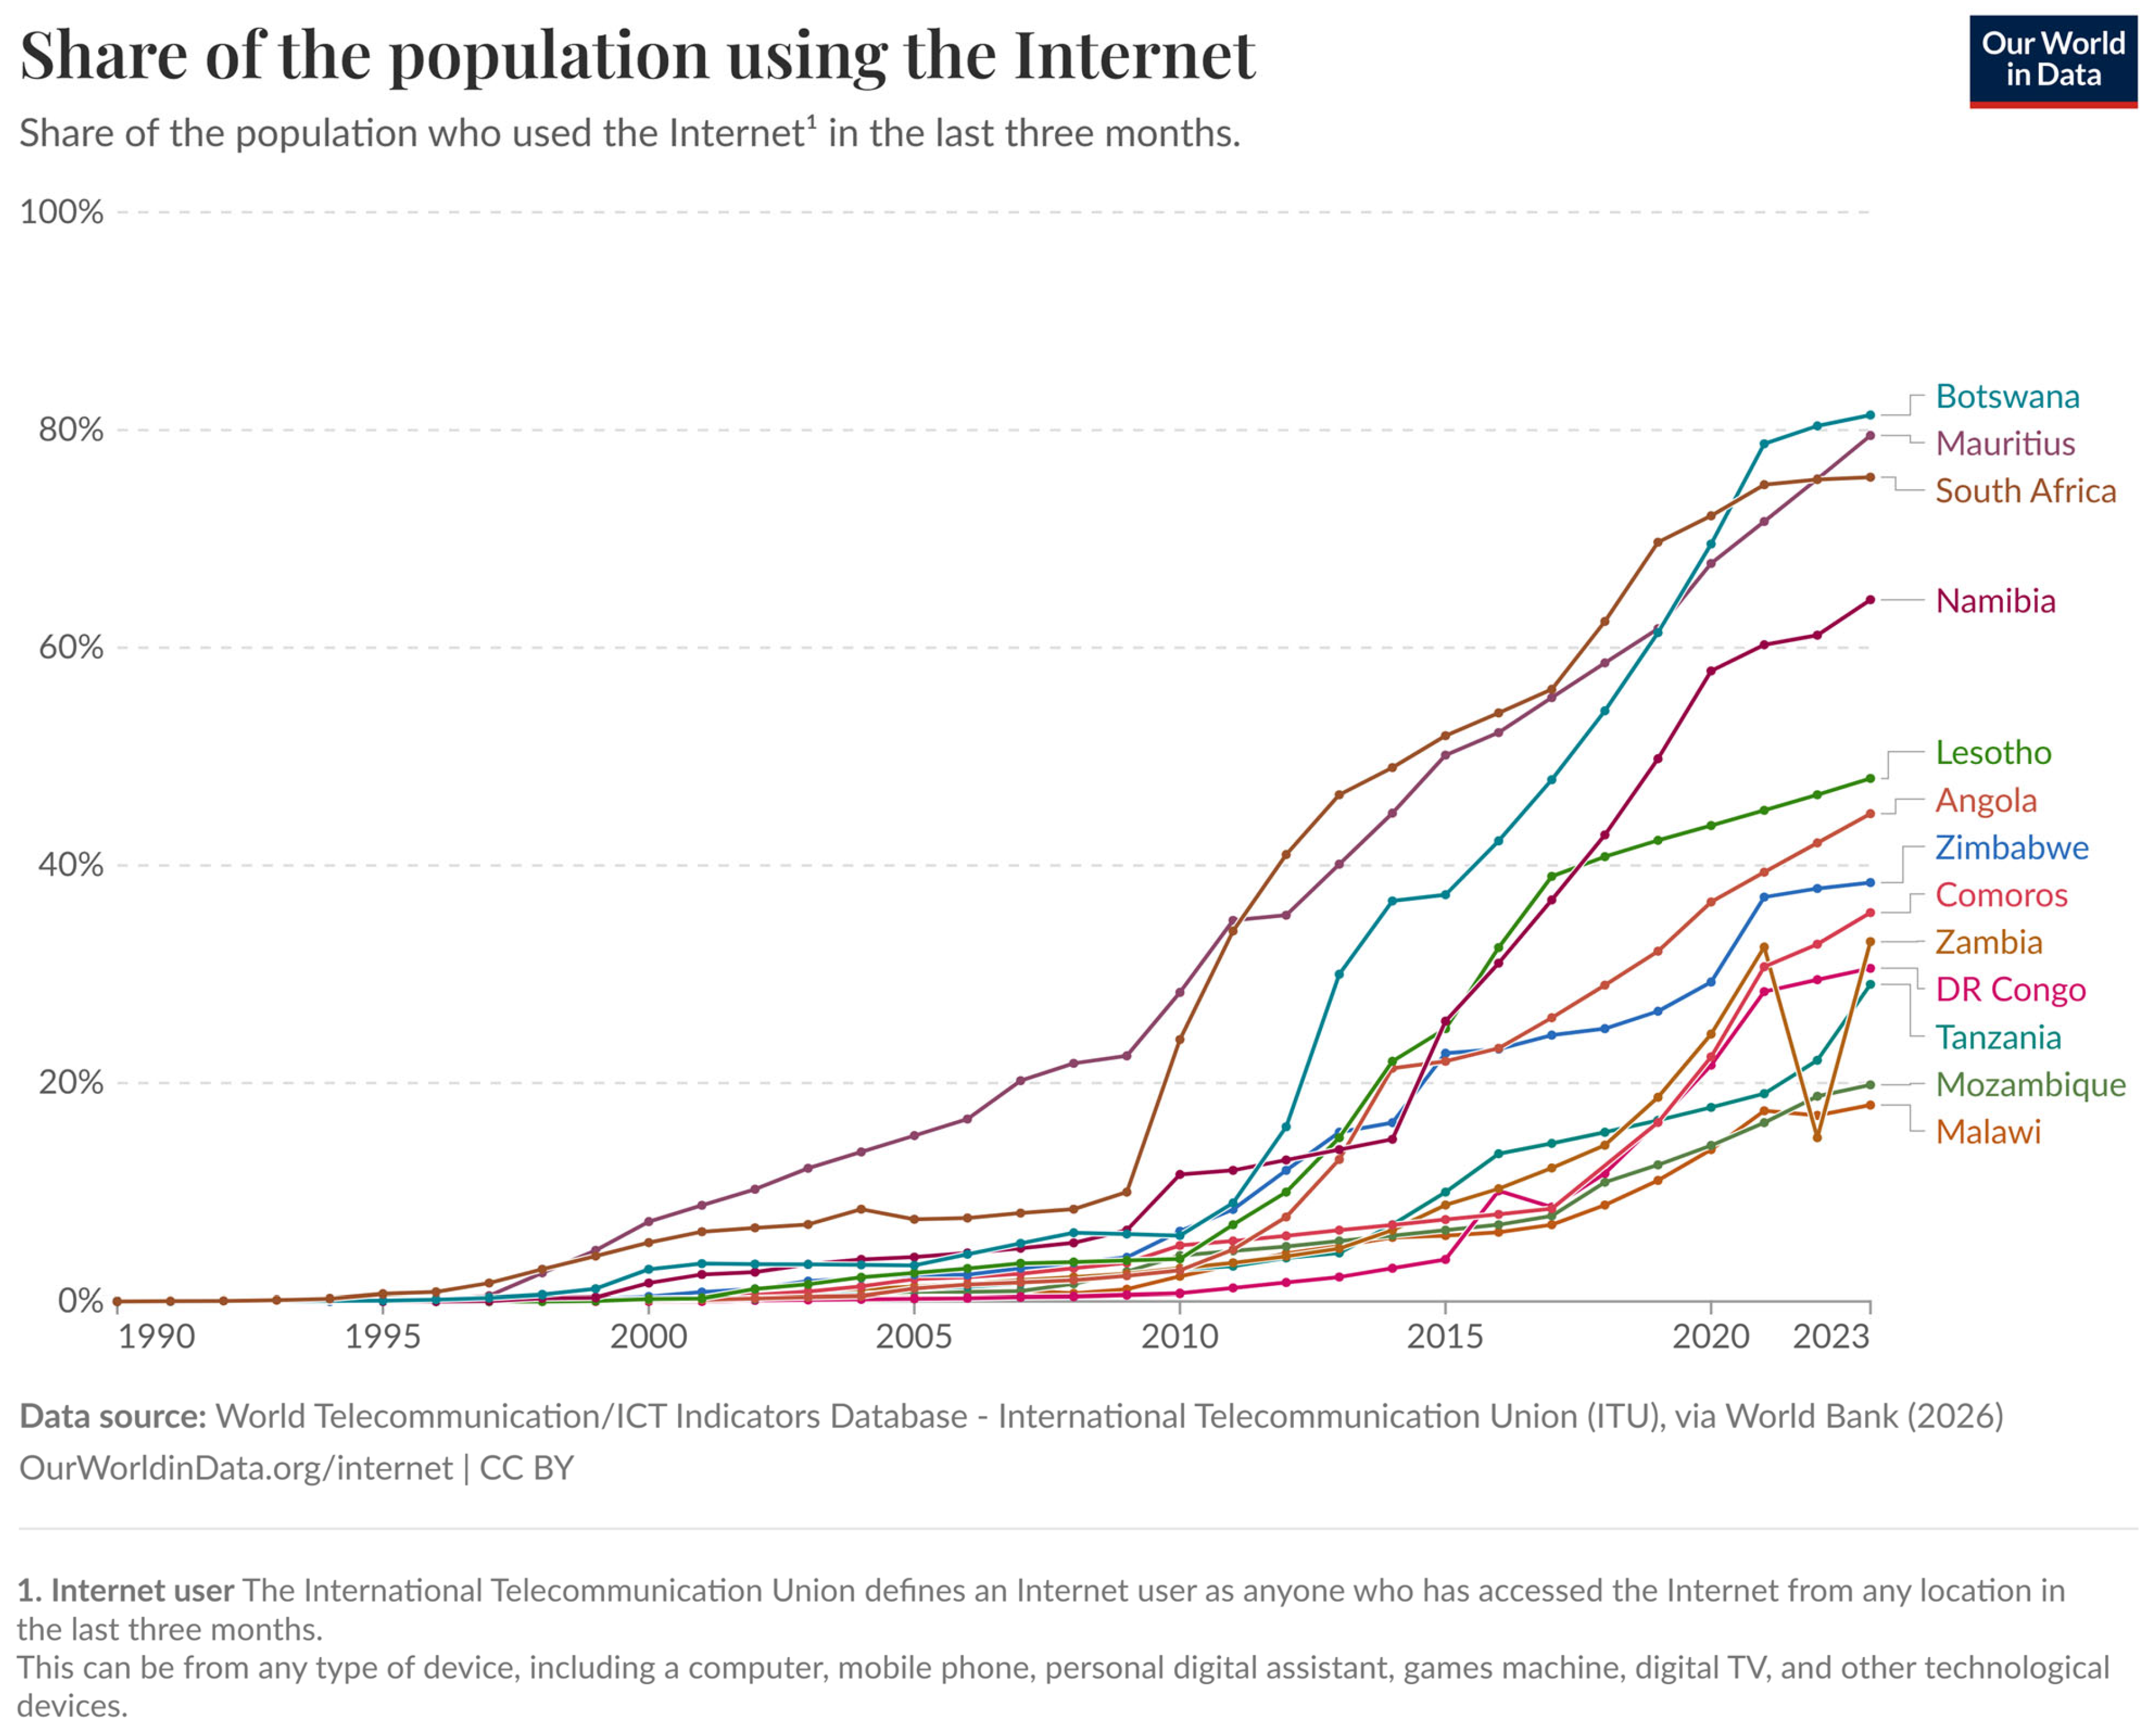
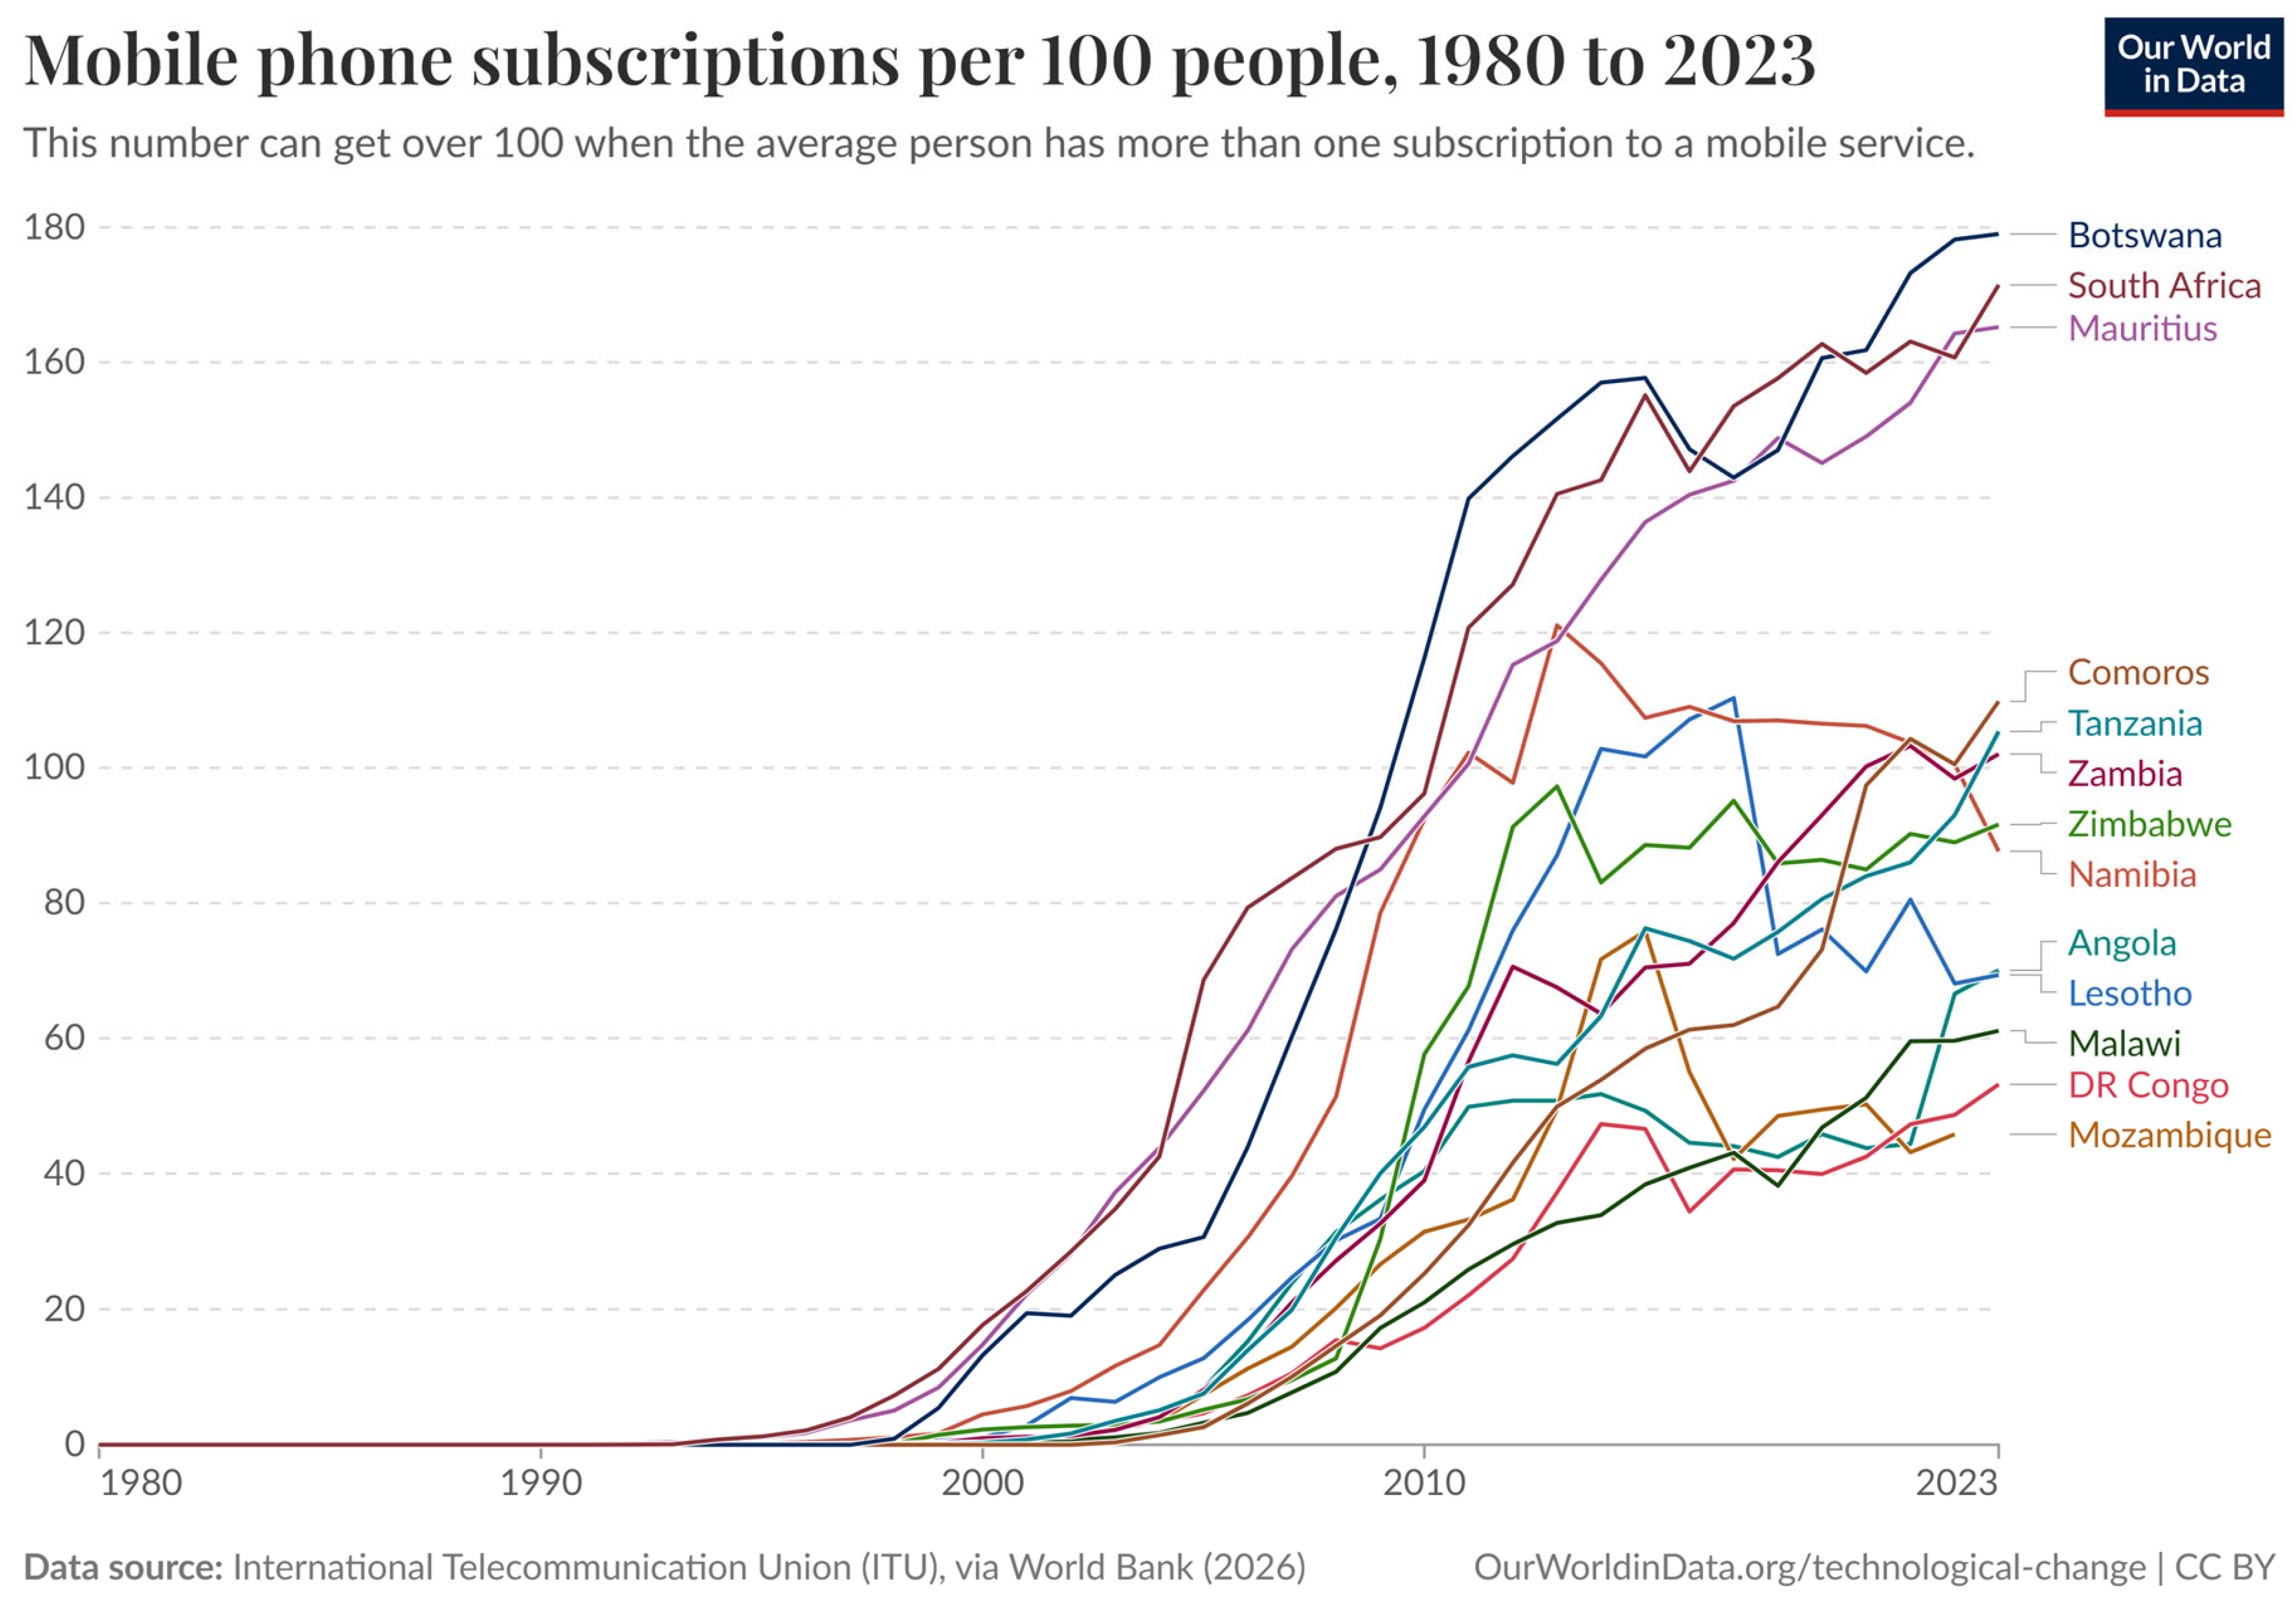
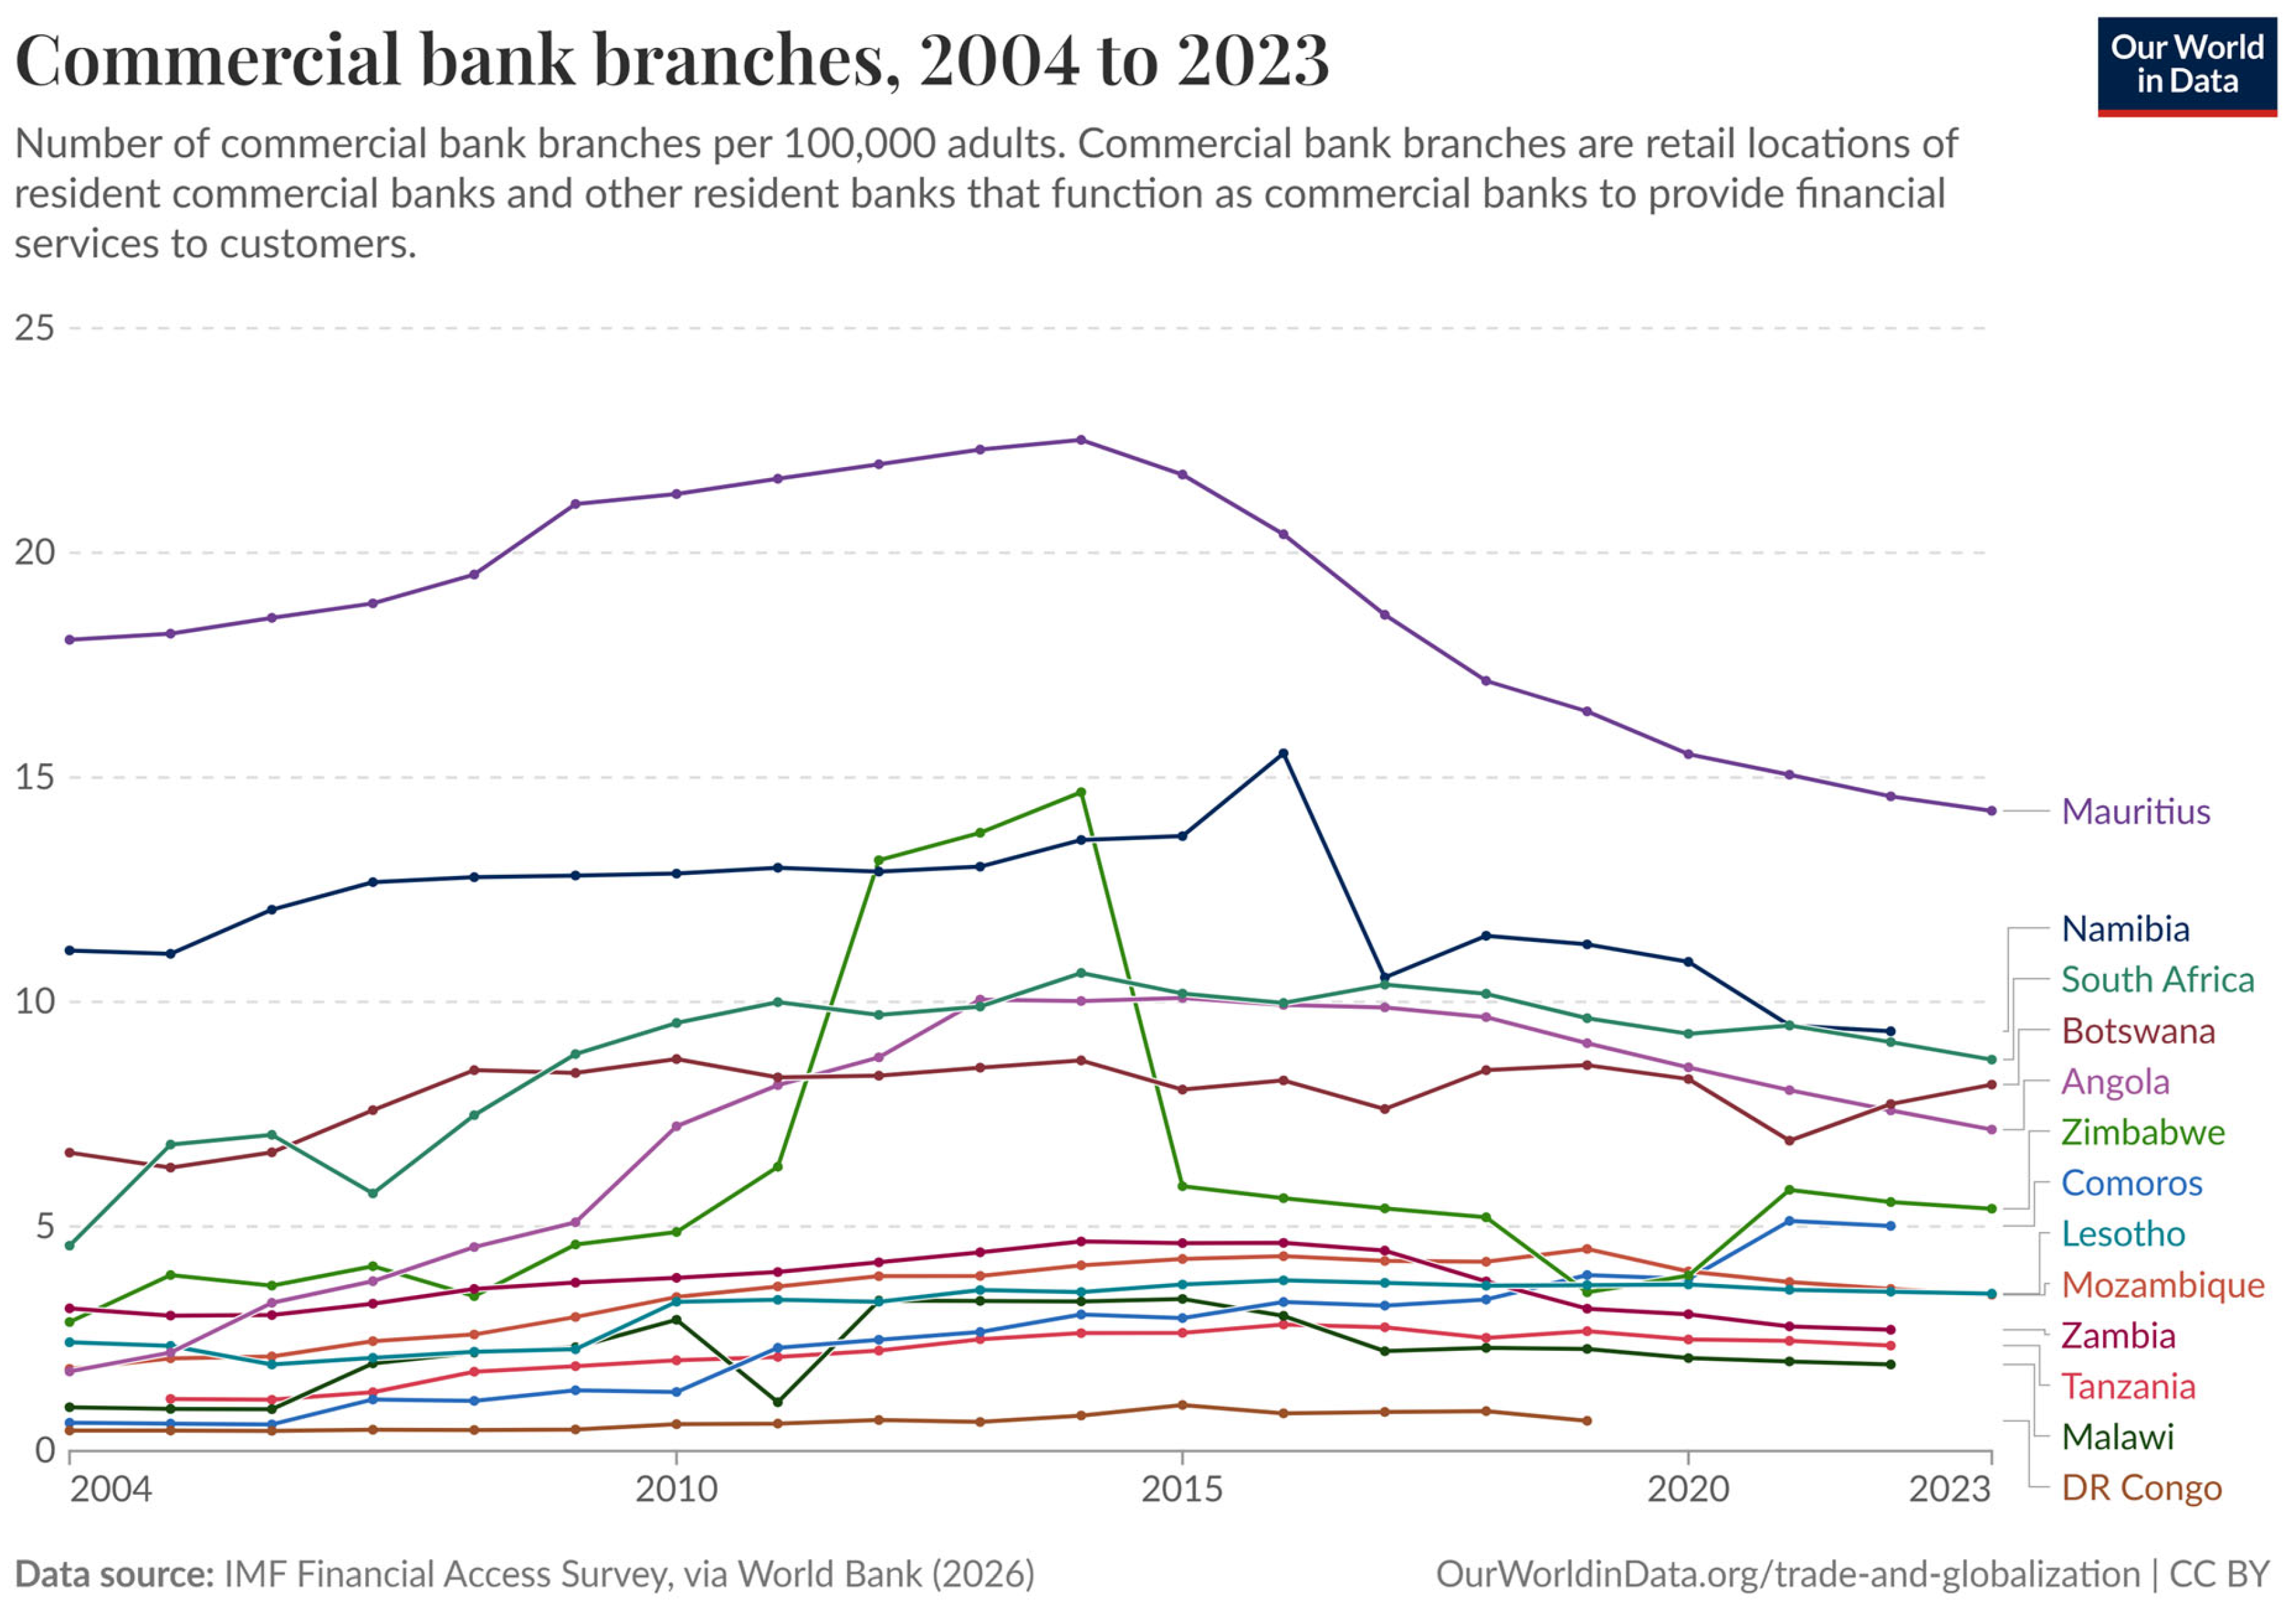
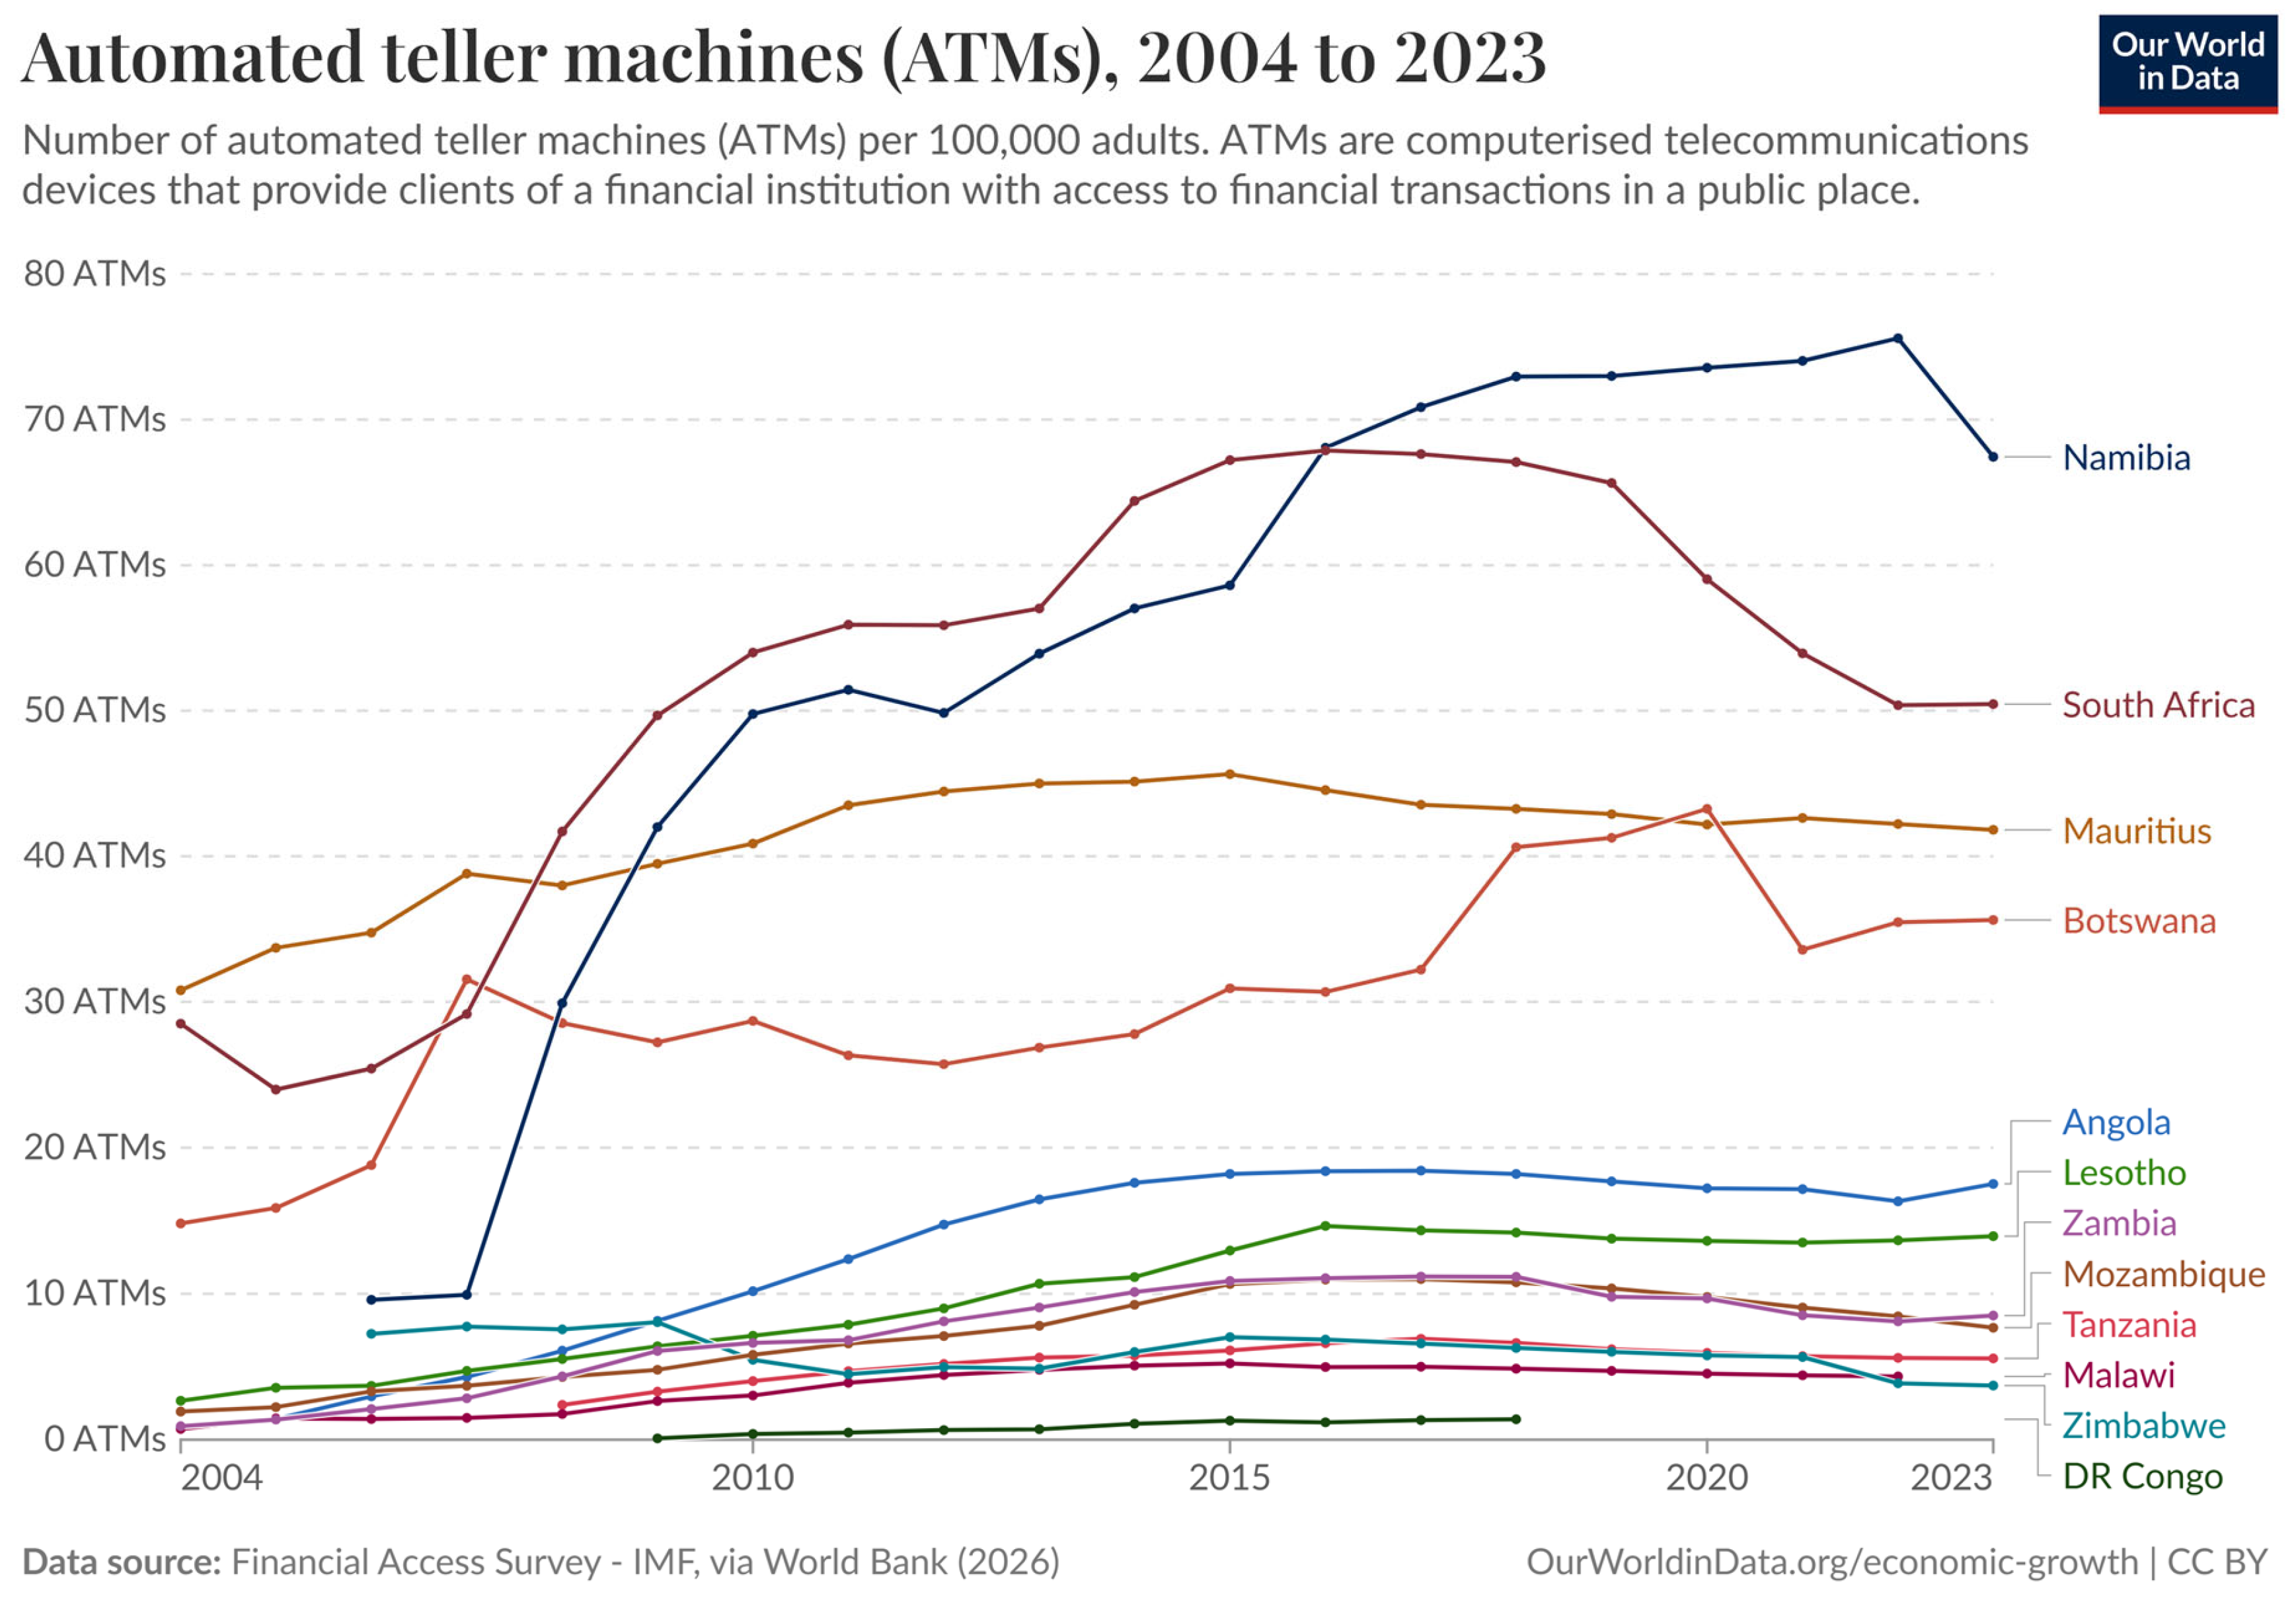
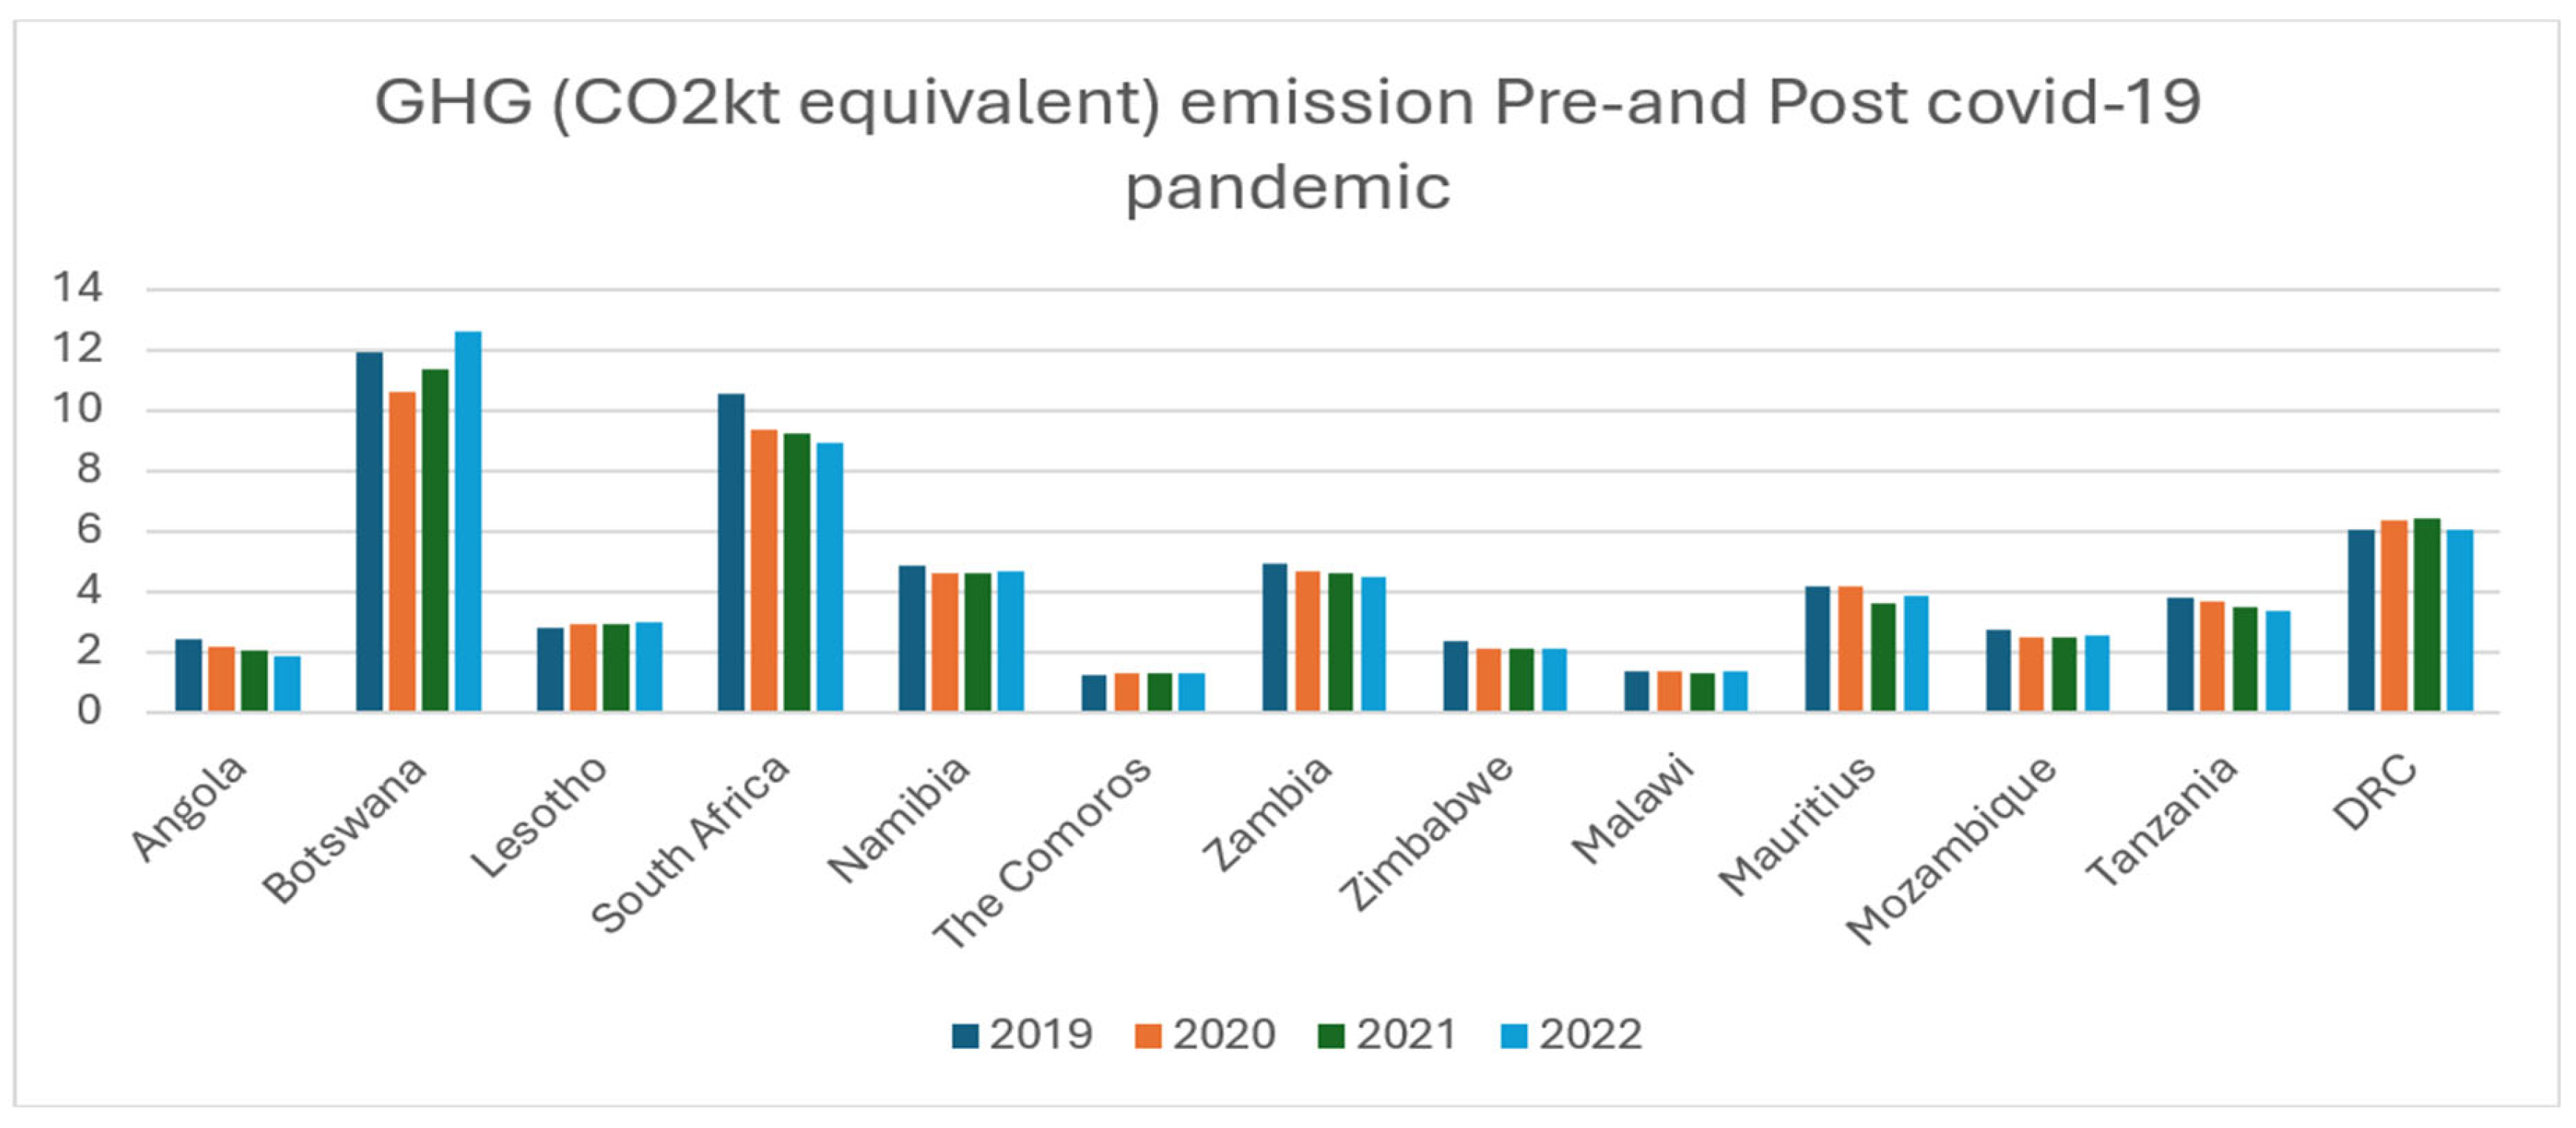
This section briefly captures the stylised facts of carbon emissions by fuel sources (Figure 1), greenhouse gas emissions (2019–2022 in Figure 2), percentage of people using the internet (Figure 3), mobile subscription (Figure 4), commercial bank accessibility (Figure 5) and ATM accessibility (Figure 6) in the SADC.
The major sources of CO2 emissions resulted from six categories, as can be seen from Figure 1. They are mostly related to fuel consumption in industrial, household and transport activities ranging from the production of cement (which is energy intensive, and thus needs a lot of fuel) to the use of gas, coal and oil which all are employed, e.g., in combustion processes, gas-flaring activities and other industry categories like mining Klingelhöfer (2009, 2017).
More specifically, Figure 1 depicts carbon emissions resulting from the consumption of various energy sources across six continents from 2010 to 2023 (Figure 1). It shows that the CO2 emitted varied during these years based on the sources. It is notable that the year 2020 had a dip in all of the continents represented, except for Asia (where, depending on the fuel, the dip is either hardly noticeable or even non-existent). Most of the fuel and industrial sources of emissions during this period declined due to reduced activity during the pandemic lockdown.
In addition to Asia, the red frames in Figure 1 point to a noticeable dip, particularly in the year 2020. This dip, which is particularly notable for transport-associated resources (oil, gas and coal), can be attributed to reduced business activities and transportation during the global lockdown in 2020. Due to reduced human activities (like transportation), the emission levels associated with the combustion of fossil-fuel-based energy (coal, gas, and oil) declined during this period.
Figure 2 specifically displays greenhouse gas emissions a year before COVID-19 was declared a pandemic and two years after the lockdown (until 2022). Again, it is noticeable that most of the countries had lesser emissions in 2020 compared to 2019, except Lesotho, Mauritius and the DRC.
Figure 3 shows the percentage of people using the internet within the 13 SADC countries from 1990 to 2020, and Figure 4 shows the mobile subscriptions (per 100 people) from 1960 to 2020. In both figures, one can see a huge rise in the 2000s in most of the examined nations. More specifically, internet use increased in some of these nations in 2020.
Figure 5 shows the trend in commercial bank branches, and Figure 6 shows the trend in ATMs available per 100,000 adults in the 13 Southern African (SADC) countries from 2004 to 2024.
After an initial rise due to development, the number of commercial bank branches per 100,000 adults first started to decline, with more ATMs available per 100,000 adults and more digitalisation, and then later also in the number of ATMs.
These stylised facts depicted in Figure 1, Figure 2, Figure 3, Figure 4, Figure 5 and Figure 6 reveal that, on average, mobile phone subscriptions and internet access (digital inclusion) in the SADC have been on the rise. However, commercial bank branch accessibility and ATM accessibility (financial inclusion) have had declines in most cases (within the examined SADC nations). Figure 1 and Figure 2 both suggest that the pandemic period (with restricted movements and digital dependence) may have influenced declines (dips) in greenhouse gas emissions. Therefore, this paper examines the impact of financial and digital inclusion on transport-related carbon emissions.

3. Research Methodology

3.1. Research Philosophy and Design

As the study collected secondary data and had to consider the quantitative nature of the data, the positivist philosophy was employed. Furthermore, a causal research design was adopted to explain the causal effect of the dependent variable (y) on the independent variables (x).

3.2. Population and Sample Size

To maintain population homogeneity, not the whole of Africa, but “just” the sub-Saharan Nations were used as the study population: Northern Africa is mostly categorised alongside the Middle East (as MENA) based on socio-economic similarities. The Southern African Development Community (SADC) region was chosen deliberately over other sub-Saharan African blocs because it was identified as having the highest average GDP per capita between 2022 ($3916.87) and 2024 ($4020.725) according to the World Bank (World Bank, 2024b). Since the data for 2022 were still incomplete in the WDI databases (World Bank, 2024a) and Our World in Data at the time of analysis, only the years 2002–2021, as the latest years with full data available, entered the examination. Furthermore, a criterion-based sampling method was used to determine the eventual sample of 13 out of the 16 SADC nations. Aside from the fact that the major industrial activities (mining and manufacturing) of the 13 countries contribute more to carbon emissions, this choice is motivated by the following reasons:
  • The consistency in the data available is not given for Eswatini.
  • Seychelles and Madagascar have unique geographical and socio-economic characteristics, and are geographically isolated.
  • Madagascar is a low-income agriculture-based economy (limited in manufacturing), which will be largely associated with CH4 and N2O emissions.
  • Seychelles is the only high-income nation in the SADC according to World Bank Income Classification (World Bank, 2024c) and has a tourism-dependent and service-dominated economy (but is limited in manufacturing).

3.3. Measurement of Variables and Data Collection

The variables used in this paper were measured using the proxies as depicted in Table 1. Data was collected from the World Bank database (World Bank, 2024a) and that of Our World in Data (n.d.). These sources were used based on their credibility and use in the scientific literature over the years.

3.4. Equations

The model to test the hypotheses H01 and H02 follows a simple linear specification. For the sake of separation of the independent from the control variables, the study used two different Greek letters to represent them (β, γ). FININC (financial inclusion) and DIGITINC (digital inclusion) are directly expressed by their proxies (ATMS and CBRANCH, and MBLSUB and INTACCS, respectively):
C O 2 t r p t i , t = α 0 + β 1 A T M S i , t + β 2 C B R A N C H i , t + β 3 M B L S U B i , t + β 4 I N T A C C S i , t + γ 1 G D P G R i , t + γ 2 U R B G R i , t + ε i , t
with
-
α 0   representing the constant;
-
β n   revealing the independent variable coefficients;
-
γ 1   standing for the coefficient of the control variable, and;
-
ε i , t being the error term, representing the difference between the statistical value and the observed value;
-
i , t representing cross-section (i) and time (t) in the adapted panel data regression model.
With respect to hypothesis H03, the adjusted model specification reveals the interacting combinations between financial inclusion (ATMS, CBRANCH) and digital inclusion (MBLSUB, INTACCS) variables. The two-by-two (2 × 2) combination produces four combinations: ATMS*MBLSUB, ATMS*INTACCS, CBRANCH*MBLSUB and CBRANCH*INTACCS (with the asterisk * indicating the mediation, not a multiplication). Their combinations imply the following in practical terms.
-
The combination of ATMS*MBLSUB indicates that persons have access to both a mobile phone subscription (MBLSUB: GSM and smartphone inclusive) and ATMs but may not access commercial bank branches (CBRANCH).
-
The ATMS*INTACCS combination represents those who have access to the internet (including data and Wi-Fi subscriptions) and ATMs, but not commercial bank branches (CBRANCH).
-
CBRANCH*MBLSUB represent those who have access to commercial bank branches and have mobile phones, but not ATMs.
-
CBRANCH*INTACCS represent those who have access to the internet and commercial bank branches but do not access ATMs.
The model specifications are as follows:
C O 2 t r p t i , t = α 0 + β 1 A T M S i , t + β 2 C B R A N C H i , t + β 3 M N L S U B i , t + β 4 I N T A C C S i , t   +   β 5 A T M S M B L S U B i , t   +   β 6 A T M S   I N T A C C S i , t +   β 7 C B R A N C H M B L S U B i , t   +   β 7 C B R A N C H   I N T A C C S i , t

3.5. Estimation Technique

The impact of digital financial inclusion on carbon emissions in Southern Africa was examined by employing the Panel Two-Stage EGLS (Cross-section Seemingly Unrelated Regression [SUR]) as a robust method because it accounts for issues of heteroskedasticity, autocorrelation, omitted variable bias, endogeneity (like GMM), multicollinearity and cross-section dependence, unlike methods like ordinary least square (Wooldridge, 2001). The Panel Two-Stage EGLS seems to be more appropriate than the GMM that was chosen by Ilogho and Klingelhöfer (2025), as it is ideal when the periods (20) are more than the countries (13) examined. The lagged versions of the independent variables were used for instrumental variables. The stationarity and variance inflation factor were used to examine the presence of unit root and multicollinearity, respectively.

4. Results and Findings

In this section of data analysis, the examination results and findings are highlighted.

4.1. Unit Root Test

Table 2 reveals the results of the unit root test for stationarity at level and first difference.
At level, only GDPGR was stationary. However, at first difference, all the variables are stationary except ATMS under LLC (but this is still stationary under the other three tests). This implies that there is no unit root, and the mean and variance do not change in the long term for all variables at first difference. Consequently, to ensure stationarity, the regression must be done in first difference for those variables that are stationary only at first difference.

4.2. Panel Regression Analysis

4.2.1. Two-Stage Least Square (2SLS) Analysis

Table 3 depicts the Panel Two-Stage Estimated Generalised Least Square analysis for objectives 1 and 2, which makes use of instrumental variables to account for endogeneity, just like a Generalised Method of Moment (GMM) which cannot be applied when the cross-section (i = 13) is less than the period (t = 20). It also depicts the two dynamic panel examination diagnostics with the multicollinearity (variance inflation factor) test and the cross-section dependence test.
The results from the centred VIF column in Table 3 show that all variable values are below 5, meaning that there are no serious multicollinearity issues in the regression model. Also, the cross-section dependence test shows that the Breusch–Pagan LM (0.99) and the Pesaran CD (0.57) tests reveal p-values above 0.05, indicating the absence of cross-section dependence in the panel data (the observations from the individual countries are not influencing each other).
The R-squared value is 73% and the adjusted R-squared value is 71% in Table 3. This value shows that 73% (and at least 71% with adjustment R-squared) of the variation in the result is explained by the model, which is acceptable. In social sciences and finance, R-square values around 70% are usually seen as a strong (though not very strong) relationship between predictor and outcome (Chin, 1998; Hair et al., 2011; Ahmad et al., 2024; Judijanto et al., 2024). It is more so here as most of the predictors appear to have highly statistically significant p-values. Furthermore, having also considered the adjusted R-squared value together with the R-squared value, the result is made even better as only predictors that really add to the model increase it, meaning it cannot be inflated by just adding more predictors.
The Durbin–Watson of 2.09 in Table 3 is within the expected and ideal range of 1.5 to 2.5, indicating a fit model and the absence of positive (when below 1) or negative autocorrelation (when above 3). Also, the F-Stat (34) is above 10 which indicates that the instrumental variables used in the Two-Stage EGLS is strong and not weak, validating the Two-Stage EGLS analysis.
The results in Table 3 show that Δ.CBRANCH (0.02), Δ.URBGR (0.00), Δ.MBLSUB (0.00) and GDPGR (0.00) are considered statistically significant, using the 0.05 (5%) threshold, while Δ.ATMS (0.07) is considered significant only in the 0.1 (10%) threshold, which is not as strong. Δ.INTACCS (0.28) is even statistically insignificant. Therefore, the following findings can be made on the impact of financial and digital inclusion:
-
With respect to the first objective of this paper (to examine the effect of financial inclusion on transport-related carbon emissions), one can see from the results of the coefficients that one more commercial bank branch per 100,000 adults from one year to the next significantly reduces transport-related carbon emissions in the examined SADC countries by 13,354.75 kilo-tonnes. In the same way, one more ATM per 100,000 adults from one year to the next reduces transport-related carbon emissions (but not highly significantly) in the examined SADC by 5140.77 kilo-tonnes.
-
Similarly, with respect to the second objective (to ascertain the effect of digital inclusion on transport-related carbon emissions), increasing mobile subscriptions per 100 persons by one in a one-year span reduces transport-related carbon emissions in the examined SADC countries by 1214.92 kilo-tonnes during this time.
-
An increase in the access to the internet by one percent in one year has a statistically insignificant impact on transport-related carbon emissions (with a p-value [0.28] above the 0.05 and 0.1 threshold).

4.2.2. Financial and Digital Inclusion Moderation

All the previous results from the analysis in Table 3 account for financial inclusion and digital inclusion separately, and not the combined impact of digital and financial inclusion. Therefore, the moderating influence of digital inclusion was examined by combining the digital inclusion proxies (Δ.INTACCS and Δ.MBLSUB) with the financial inclusion proxies (Δ.ATMS and Δ.CBRANCH). These variable proxies test whether digitalisation can enhance financial inclusion from one year to the next through the increased usage of mobile banking, internet banking, mobile money, bank applications and other possible digitalised financial activities like transfer, savings, bill payment and investment (Antwi & Kong, 2023).
The combination of all these proxies led to a total of four (2 × 2) combinations of moderation, namely Δ.ATMS*Δ.MBLSUB, Δ.ATMS*Δ.INTACCS, Δ.CBRANCH*Δ.MBLSUB and Δ.CBRANCH*Δ.INTACCS (see Table 4). Obviously, from a methodological point of view, it was necessary to also include the individual variables in the analysis. Amongst others, this is important to judge whether the sometimes-opposing direction of the moderation results reported in the following only weakens the individual effect (which is indeed the case) or whether it leads, even, to their annihilation or inversion (which is not supported by the data). Nevertheless, with respect to the interpretation of the individual variables, the values in Table 3 supersede those of Table 4, as the individual values from the moderation no longer have unique effects on their own, but have “a range of effects that vary according to the level of the moderating variable” (Aiken et al., 1991); compare further in (Baron & Kenny, 1986; Carte & Russell, 2003; Andersson et al., 2019; Memon et al., 2019). In particular, the results in the Table 3 analysis are less prone to multicollinearity effects as seen in the VIF results on the respective tables: although VIFs under 5 are already an indicator for no serious multicollinearity issues, the VIFs according to Table 3 are even lower than 2 which is much better.
The results from the individual proxies show that one more ATM or commercial bank branch per 100,000 adults from one year to the next (Δ.ATMS or Δ.CBANKBRCH respectively) lead to lower transport-related carbon emissions in this time span because of their negative coefficients (−14,207.3 and −138,698.2, respectively). The digital inclusion proxies show different results, with additional mobile subscription per 100 persons over one year (Δ.MBLSUB) leading to higher transport-related carbon emissions (23,914.5 coefficient) and increasing internet access (Δ.INTACCS) by one percent, leading to lower transport-related carbon emissions (−18,002.4 coefficient). The only difference between this result and that of the first examination is that Δ.INTACCS showed a negative coefficient with a significant p-value (0.00) and Δ.MBLSUB showed a positive coefficient.
However, with respect to these (in total: only slightly different) results, it should be noted that the individual proxy results as analysed in the previous section for objectives 1 and 2 tend to be more accurate and acceptable as predictors than the individual results also involved in the moderation; the individual ones from the moderation no longer have unique effects on their own (as also seen with their higher VIF in Table 4 compared to their VIF in Table 3) but have “a range of effects that vary according to the level of the moderating variable” (Aiken et al., 1991); compare further in (Baron & Kenny, 1986; Carte & Russell, 2003; Andersson et al., 2019; Memon et al., 2019). Therefore, Table 4 only reflects decisions to be taken on basis of the moderation but not with respect to these individual proxy results.
The results from the moderation of financial and digital inclusion proxies in Table 4 show that Δ.ATMS*Δ.MBLSUB (0.031), Δ.ATMS*Δ.INTACCS (0.000) and Δ.CBRANCH*Δ.INTACCS (0.000) are statistically significant combinations (below the 0.05 level) impacting transport-related carbon emissions from the previous to the current year; only Δ.CBRANCH*Δ.MLSUB (0.108) has statistically insignificant p-values even to the 0.1 threshold.
The moderation of changes in ATM or commercial bank branch accessibility with those in internet access leads to higher emissions, while the moderation of variations in ATM accessibility with mobile phone subscription variations leads to lower transport-related carbon emissions from one year to the next. In this context, it is remarkable to see that both the moderation combinations with internet access led to higher transport-related carbon emissions from one year to the next, although changes in internet access as individual proxies in the same one-year time span themselves had no statistically significant impact on emissions in the first examination (Table 3).
The results from the VIFs in Table 4 show that all the values under “Centered VIF” are below 5. This implies that there are no serious multicollinearity problems. Also, the cross-section dependence test shows that for the Breusch–Pagan LM (0.99) and the Pesaran CD (0.51) tests, the p-values are above 0.05, indicating the absence of cross-section dependence in the panel data (i.e., the observations from individual countries are not influencing each other). In addition, the R-squared value is 55% and adjusted R-squared value is 51% in Table 4 (0.51). This adjusted R-squared value indicates that the model explains 51% of the variation in outcomes of the dependent variable. While this is not regarded as strong, it is still acceptable. In addition, the Durbin–Watson value (2.23) indicates that the model is appropriate and robust enough for the examination, and is free of autocorrelation problems because it is within the acceptable range of 1.5 to 2.5. Also, the F-Stat (14) is above 10 which indicates that the instrumental variables used in the Two-Stage EGLS is strong and not weak, validating the Two-Stage EGLS analysis.

5. Discussion and Findings

We explain the variety of outcomes from the results in context. Table 3 shows the separate impacts of changes in financial inclusion and digital inclusion on transport-related carbon emissions in the SADC from one year to the next, while Table 4 depicts the outcomes of moderation between adjustments in financial and digital inclusion and their joint impact on transport-related carbon emissions in a time span of one year. For both analyses, the Panel Two-Stage EGLS analysis was employed because of its robust ability to account for key factors like autocorrelation, omitted variable bias, endogeneity, cross-section dependence, multicollinearity and heteroskedasticity issues.
The following discussions on the findings are outlined based on key headings: after starting with the discussion on the impact of financial inclusion proxies (ATMs and commercial banks) on transport-related carbon emissions, we continue with the discussion of digital inclusion proxies (mobile phone and internet access) and their impact on transport-related emissions, and conclude with the moderating impact of financial–digital inclusion on transport-related carbon emissions.

5.1. Impact of Financial Inclusion on Transport-Related Carbon Emissions (Hypothesis H01)

The results from the financial inclusion proxies suggested consistent results (Table 3). Higher ATM accessibility or a rise in the number of accessible commercial banks per 100,000 adults in the SADC region reduces transport-related carbon emissions from one year to the next. Therefore, adding one accessible ATM or one commercial bank branch per 100,000 adults in a one-year time span will lead to a 5140.77 kilo-tonnes or a 13,354.75 kilo-tonnes reduction in transport-related carbon emissions, respectively. This finding is dissimilar to Khan et al. (2023), T. H. Le et al. (2020) and Ogede et al. (2024), but similar to Dong et al. (2022), Z. Yang et al. (2022), Zhao et al. (2024) and Baskaya et al. (2022), as they also indicate that financial inclusion leads to reduced carbon emissions. However, even with respect to these latter four, this finding differs due to this paper’s focus on transport-related carbon emissions instead of just carbon emissions with respect to the analysis as some proxies were analysed as differenced. As expected, this implies that a higher number of ATMs or commercial bank branches in strategic places could lead to greater accessibility and proximity for essential bank services, thereby reducing the number and/or distance of necessary trips. From this perspective, it does not seem to be understandable that, actually, the number of commercial banks in the SADC has declined over the last few years (as visible from Figure 5), but this might be explained probably because of the increasing shift from traditional to digital banking.

5.2. Impact of Digital Inclusion on Transport-Related Carbon Emissions (Hypothesis H02)

5.2.1. Impact of Mobile Phone Subscriptions on Transport-Related Carbon Emissions

Increasing the number of mobile phone subscriptions per 100 people by one from one year to the next within the years of observation reduces transport-related carbon emissions by 1214.9 kilo-tonnes within the SADC.
This may be explained by the logic that essential transport-related activities like movement to workplaces or religious places, worshipping, meetings with friends or gatherings for information can be substituted by digital services. Hence, physical movement to access them becomes secondary.
This result is similar to that of V. L. T. Le and Pham (2024), which indicated that digital inclusion (mobile phone subscriptions) lead to lower carbon emissions. However, the provided explanation that digitalisation facilitates lesser paper-based processes (paper usage), which mitigates deforestation and carbon emission from paper production, already shows the difference in the results as the focus in V. L. T. Le and Pham (2024) was on overall carbon emissions, while here we focus on transport-related carbon emissions.

5.2.2. Impact of Internet Access on Transport-Related Carbon Emissions

Internet access (as the second digital inclusion proxy in this study) has statistically insignificant effects on curbing transport-related carbon emissions in the SADC. This perhaps slightly unexpected result may be understandable as, in a more practical sense, the internet is always accessed through the medium of digital devices (especially mobile devices) and as such it is not influential in isolation. In addition to that, some of the digital-enabled activities or services like digital conferencing and order logistics have already existed for decades before the commercial internet, e.g., landlines (Dutton et al., 1982; Light et al., 2000; Julsrud et al., 2012), and is not necessarily exclusive to mobile phones. However, this strand of argumentation that the internet may not be a factor individually, but together with other means, already gives an indication that it might have a moderating effect on the financial inclusion variables as this paper has indeed found out in the following examinations.

5.3. Moderating Impact of Financial–Digital Inclusion on Transport-Related Carbon Emissions (Hypothesis H03)

As already mentioned in the introduction to this study, the moderating impact of financial–digital inclusion on transport-related carbon emissions has, according to our knowledge, never been investigated before as—different from the examined SADC countries—developed economies already have the necessary infrastructure in place. However, for the 13 examined SADC countries in particular, where the infrastructure mostly has been in the stage of still being built up, this examination might provide further insight for future developments. And indeed, our moderation results suggest that two of the four combinations (year-to-year increases in ATM or commercial bank branch accessibility with internet access) lead to higher transport-related carbon emissions, while increased ATM accessibility with mobile subscriptions from one year to the next statistically significantly reduces them. However, it should be noted that even the opposite direction of the first two moderation effects is not big enough to annihilate the individual reducing effects of an increased number of ATMs or commercial bank branches on transport-related carbon emissions. The fourth combination of year-to-year changes in commercial bank branch accessibility and mobile subscriptions provides a moderating effect that is to be considered insignificant (as the p-value at 0.108 is slightly above the 10% threshold).
Taking the different approach and focus of our study into account, our study is (only) partially comparable to prior studies that examined financial and digital inclusion as a joint concept with digital financial inclusion:
-
Cheng et al. (2024), Li (2024), Khan et al. (2023) and Ozturk and Ullah (2022) showed that increased digital financial inclusion leads to higher carbon emissions. Obviously, their provided reasons of digital financial inclusion leading to higher carbon emissions (like higher consumption, particularly energy-consuming products, more foreign direct investment and higher industrialisation) may also involve transportation. Nevertheless, it is “just” one from a variety of possible and often much more energy-consuming reasons that leads to their result. Therefore, since none of these studies specifically examined transport-related carbon emissions, the moderation of financial inclusion and digital inclusion or referred to SADC nations, our study indeed offers a new and different perspective. Furthermore, since they talk about the isolated effects, while our results in this section refer to the moderation that goes into the opposite direction than the carbon emission-reducing individual effects (without being able to annihilate them), our results are also actually different in this respect.
-
V. L. T. Le and Pham (2024) examined financial inclusion separately from digital inclusion, showing that increased digital inclusion reduces carbon emissions, while higher financial inclusion has a non-linear relationship with carbon emissions (i.e., varies based on quantile levels of inclusion). Hence, at first sight, the influence of digital inclusion from V. L. T. Le and Pham (2024) appears to be similar to the mobile subscription result of our paper, but is different from the moderation results with regard to the impact of internet access on carbon emissions. However, taking into account the fact that the moderation effects cannot annihilate the individual effects, the results may still be comparable to a certain degree. Further divergences may be due to V. L. T. Le and Pham’s (2024) focus on overall carbon emissions, instead of transport-related carbon emissions.
Therefore, considering these different foci, our findings can neither really support nor contradict the just-cited ones. Instead, we found that changes in the moderation of financial and digital inclusion do not lead to a statistically significant further reduction in transport-related carbon emissions because it does not really seem to replace the need for transportation, as they are not mutually exclusive. However, since the opposing moderation effects do not annihilate the individual ones either, financial and digital inclusion can still reduce transport-related carbon emissions.
Nevertheless, it should be mentioned that Ilogho and Klingelhöfer (2025) received similar results, but by employing a different methodology (GMM) and fewer control varia-bles for their analysis.
Since, according to Figure 5 and Figure 6, the number of ATMs and bank branches per 100,000 adults recorded amongst the examined countries is still low in most of the examined countries and—because most sub-Saharan nations are still developing—the focus has probably been more on providing basic financial services physically, the advantages of mobile financial services are probably still not fully developed, particularly in underdeveloped areas, and as such long-distance transportation is still necessary. However, the provision of digital financial services through digital platforms may assist in reducing these needs in the future. In order to examine this further, future studies could explore a wider range of digital financial inclusion proxies, as this paper still focuses more on traditional inclusion proxies.

6. Conclusions, Significance of the Study, and Space for Future Research

6.1. Conclusions

The study examined the impact of financial and digital inclusion on transport-related carbon emissions in the SADC. It focused on accessibility measures for financial inclusion and employed the Generalised Method of Moments to analyse data obtained from the World Bank database and Our World in Data for 13 countries in the SADC from 2002 to 2021. Due to reasons of stationarity, the proxies for financial and digital inclusion used were examined in their first difference to ensure stationarity.
The findings from the paper show that the majority of the 13 examined nations in the SADC have recent perpetual declines in the number of ATMs and commercial bank branches that have been employed as accessibility proxies for traditional financial inclusion—probably resulting from a shift to digitalisation. However, both ATM and commercial bank branch accessibility reduce transport-related carbon emissions. Hence, while from an economical point of view, more ATMs or even entire commercial bank branches might not be beneficial, from an environmental point of view they make sense if one looks at them alone.
Unfortunately, all moderation combinations of financial inclusion (ATMs and commercial bank branches) with internet access lead to higher transport-related carbon emissions, while only the combination of ATMs accessibility and mobile subscriptions may indeed reduce transport-related carbon emissions in the SADC. Nevertheless, even the opposing effects of the moderation are still not strong enough to annihilate the individual effects, such that one can still state that, in total, both higher ATM and commercial bank branch accessibility reduce transport-related carbon emissions.
Taking our different focus (transport-related carbon emissions instead of the whole economy) and the specific region of our study (SADC), it is no wonder that our findings are not comparable to prior studies in the sense of confirming or contradicting their results. Instead, our results should be seen as an amendment to current knowledge by resulting from so far unexamined effects for an economically developing region under change.

6.2. Theoretical and Practical Significance

Based on the results of the study, it seems that financial and digital inclusion on their own are helpful in striving to reduce transport-related carbon emissions, while the moderating effect of both might go into the other direction, but are still not strong enough to annihilate the individual effects. Further taking into account the considerations made in the previous paragraph, that:
-
the financial inclusion proxies used for the examination are still quite traditional, and
-
ATM and bank branch accessibility are still poor in many of the sub-Saharan countries, the focus has probably been more on providing basic financial services physically than on maximising the advantages of mobile financial services,
one can come to an even more differentiated conclusion: in particular, many of the SADC countries have economically developed a lot over the last few years (World Bank, 2024c); hence, they no longer need to provide just basic services. Having reached comparatively higher income categories in the last 20 years (with most of them shifting from the lower- to middle-income category (World Bank, 2024c), they have gained the capacity to invest, such that they can also go the next step to offer more sophisticated financial services.
Therefore, when considering these aspects, the study indeed recommends investment in the improvement in digital innovations (in particular when they are linked with mobile devices) in financial institutions, at least in the emerging economies of the SADC. To facilitate this process more easily, traditional and microfinance banks in rural areas may partner with upcoming FinTech companies, while governments of similar economies may support the digitalisation process by providing the necessary infrastructure (Osuma et al., 2025) in remote areas and empowering financial institutions in penetrating marginalised communities digitally.

6.3. Limitations and Future Research

The study focused on SADC nations, most of them categorised as underdeveloped and emerging economies with less-digitalised financial services. Hence, the results can only mirror similar realities in similar economies.
Therefore, since the provision of further digital financial services through digital platforms may help reduce the need for physical services and transportation in the future, future studies could explore a wider range of digital financial inclusion proxies in developing and more-advanced economies as this paper has focused more on traditional inclusion proxies. However, on the basis of the highly aggregated data in this study, it might become difficult to identify and evaluate the (isolated or synergetic) influence of different FinTechs of more modern financial inclusion proxies in comparison with or in addition to traditional financial inclusion proxies.
Furthermore, future studies could also gather more data by covering more periods or they may focus on country-specific examinations. With respect to the employed methodology, a quantile regression analysis may offer further insight into the impact of financial and digital inclusion (at different quantiles) on carbon emissions. Another alternative approach may use Difference in Difference (DiD) to compare this same relationship pre-COVID-19 (pandemic) and post-COVID-19 as the lockdown in many countries led to much lower transport activities. However, taking into mind that countries learnt to adjust to these pandemic-related challenges in 2020/21 and that many employers indeed obtained experience, e.g., with working from home and the additional use of internet for exchange of opinions, e.g., in online meetings, the future benefits of such an examination might be limited.

Author Contributions

Conceptualization and methodology, S.O.I. and H.E.K.; software, S.O.I.; validation, S.O.I. and H.E.K.; formal analysis, S.O.I. and H.E.K.; investigation, S.O.I. and H.E.K.; resources, S.O.I.; data curation, S.O.I.; writing—original draft preparation, S.O.I. and H.E.K.; writing—review and editing, S.O.I. and H.E.K.; visualization, S.O.I.; supervision, H.E.K.; project administration, H.E.K. All authors have read and agreed to the published version of the manuscript.

Funding

This research received no external funding.

Institutional Review Board Statement

Not applicable.

Informed Consent Statement

Not applicable.

Data Availability Statement

The data employed in this study are publicly accessible via the World Bank databank website, and the link is provided to ensure transparency and reproducibility of the research findings. The dataset can be accessed and downloaded via the “Download Options” feature at the World Bank databank website, link: https://databank.worldbank.org/source/world-development-indicators (accessed on 3 April 2026). Additional supporting data was retrieved from https://ourworldindata.org/search (accessed on 3 April 2026).

Conflicts of Interest

The authors declare no conflict of interest.

References

  1. Ahiase, G., Andriana, D., Widyaningsih, A., Heryana, T., & Purnomo, B. S. (2024). Financial technology and sustainable development in ASEAN region: Role of income inequality. Jurnal Ekonomi Malaysia, 58(2), 2024. [Google Scholar] [CrossRef]
  2. Ahmad, E.-Y. B., Musa, I., & Magaji, S. (2024). Nexus between financial liberalisation and economic growth in Nigeria (1987–2022). African Journal of Accounting and Financial Research, 7(2), 16–33. [Google Scholar]
  3. Aiken, L. S., West, S. G., & Reno, R. R. (1991). Multiple regression: Testing and interpreting interactions. Sage. [Google Scholar]
  4. Amankwah-Amoah, J., Khan, Z., Wood, G., & Knight, G. (2021). COVID-19 and digitalization: The great acceleration. Journal of Business Research, 136, 602–611. [Google Scholar] [CrossRef] [PubMed]
  5. Andersson, U., Cuervo-Cazurra, A., & Nielsen, B. B. (2019). Explaining interaction effects within and across levels of analysis. In Research methods in international business (pp. 331–349). Springer International Publishing. [Google Scholar]
  6. Antwi, F., & Kong, Y. (2023). Investigating the impacts of digital finance technology on financial stability of the banking sector: New insights from developing market economies. Cogent Business & Management, 10(3), 2284738. [Google Scholar] [CrossRef]
  7. Asongu, S. A. (2018). Conditional determinants of mobile phones penetration and mobile banking in Sub-Saharan Africa. Journal of the Knowledge Economy, 9(1), 81–135. [Google Scholar] [CrossRef]
  8. Baron, R. M., & Kenny, D. A. (1986). The moderator–mediator variable distinction in social psychological research: Conceptual, strategic, and statistical considerations. Journal of Personality and Social Psychology, 51(6), 1173. [Google Scholar] [CrossRef]
  9. Baskaya, M. M., Samour, A., & Tursoy, T. (2022). The financial inclusion, renewable energy and CO2 emissions nexus in the BRICS nations: New evidence based on the method of moments quantile regression. Applied Ecology & Environmental Research, 20(3), 2577–2595. [Google Scholar]
  10. Becha, H., Kalai, M., Houldi, S., & Helali, K. (2025). Digital financial inclusion, environmental sustainability and regional economic growth in China: Insights from a panel threshold model. Economic Structure, 14, 4. [Google Scholar] [CrossRef]
  11. Bellis, P., Trabucchi, D., Buganza, T., & Verganti, R. (2022). How do human relationships change in the digital environment after COVID-19 pandemic? The road towards agility. European Journal of Innovation Management, 25(6), 821–849. [Google Scholar] [CrossRef]
  12. Bokpin, G. A. (2017). Foreign direct investment and environmental sustainability in Africa: The role of institutions and governance. Research in International Business and Finance, 39, 239–247. [Google Scholar] [CrossRef]
  13. Carte, T. A., & Russell, C. J. (2003). In pursuit of moderation: Nine common errors and their solutions. MIS Quarterly, 27(3), 479–501. [Google Scholar] [CrossRef]
  14. Chatterjee, A. (2020). Financial inclusion, information and communication technology diffusion, and economic growth: A panel data analysis. Information Technology for Development, 26(3), 607–635. [Google Scholar] [CrossRef]
  15. Cheng, Q., Zhao, Z., Zhong, S., & Xing, Y. (2024). Digital financial inclusion, resident consumption, and urban carbon emissions in China: A transaction cost perspective. Economic Analysis and Policy, 81, 1336–1352. [Google Scholar] [CrossRef]
  16. Chin, W. W. (1998). The partial least squares approach to structural equation modeling. In G. A. Marcoulides (Ed.), Modern methods for business research (pp. 295–336). Lawrence Erlbaum Associates. [Google Scholar]
  17. Clark, G. (2008). A farewell to alms: A brief economic history of the world. Princeton University Press. [Google Scholar]
  18. Coffie, C. P. K., Yeboah, F. K., Emuron, A. S. O., & Ahiabenu, K. (2025). FinTech and CO2 emission: Evidence from (top 7) mobile money economies in Africa. Journal of Financial Regulation and Compliance, 33(1), 87–108. [Google Scholar] [CrossRef]
  19. Daunton, M. J. (1995). Progress and poverty: An economic and social history of Britain 1700–1850. Oxford University Press. [Google Scholar]
  20. Desalegn, D. G., Tangl, A., & Farkas, M. (2022, August). Greening bank financial innovation for better financial performance: Evidence from Ethiopia. E-Work Capital. Available online: http://eworkcapital.com/greening-bank-financial-innovation-for-better-financial-performance-evidence-from-ethiopia/ (accessed on 25 June 2025).
  21. Dong, J., Dou, Y., Jiang, Q., & Zhao, J. (2022). Can financial inclusion facilitate carbon neutrality in China? The role of energy efficiency. Energy, 251, 123922. [Google Scholar] [CrossRef]
  22. Doran, N. M., Bădîrcea, R. M., & Manta, A. G. (2022). Digitization and financial performance of banking sectors facing COVID-19 challenges in Central and Eastern European Countries. Electronics, 11(21), 3483. [Google Scholar] [CrossRef]
  23. Dutton, W. H., Fulk, J., & Steinfield, C. (1982). Utilization of video conferencing. Telecommunications Policy, 6(3), 164–178. [Google Scholar] [CrossRef]
  24. Elg, U., & Hånell, S. M. (2023). Driving sustainability in emerging markets: The leading role of multinationals. Industrial Marketing Management, 114, 211–225. [Google Scholar] [CrossRef]
  25. Erdös, L. (2023). History of the environmental movement. In The Palgrave handbook of global sustainability (pp. 2181–2194). Springer International Publishing. [Google Scholar]
  26. Fan, J., Meng, X., Tian, J., Xing, C., Wang, C., & Wood, J. (2023). A review of transportation carbon emissions research using bibliometric analyses. Journal of Traffic and Transportation Engineering (English Edition), 10(5), 878–899. [Google Scholar] [CrossRef]
  27. Fang, W., Farooq, U., Liu, Z., Lan, J., & Iram, R. (2022). Measuring energy efficiency financing: A way forward for reducing energy poverty through financial inclusion in OECD. Environmental Science and Pollution Research, 29(47), 71923–71935. [Google Scholar] [CrossRef] [PubMed]
  28. Fareed, Z., Rehman, M. A., Adebayo, T. S., Wang, Y., Ahmad, M., & Shahzad, F. (2022). Financial inclusion and the environmental deterioration in Eurozone: The moderating role of innovation activity. Technology in Society, 69, 101961. [Google Scholar] [CrossRef]
  29. Farzana, N., Qamruzzaman, M., & Mindia, P. M. (2024). Interplay of digital financial inclusion, technological innovation, good governance, and carbon neutrality in the top 30 remittance-receiving countries: The significance of renewable energy integration. International Journal of Energy Economics and Policy, 14(4), 408–425. [Google Scholar] [CrossRef]
  30. Freeman, C., & Louçã, F. (2001). As time goes by: From the industrial revolutions to the information revolution. Oxford University Press. [Google Scholar]
  31. Gwiza, A., Jarbandhan, V. D., & Chitongo, L. (2024). Upscaling digitalisation in Africa’s post-COVID-19 recovery path: A comparative analysis. African Journal of Development Studies, 14(4), 353. [Google Scholar] [CrossRef]
  32. Hair, J. F., Ringle, C. M., & Sarstedt, M. (2011). PLS-SEM: Indeed a silver bullet. Journal of Marketing Theory and Practice, 19(2), 139–152. [Google Scholar] [CrossRef]
  33. Hassani, H., Huang, X., & Silva, E. (2021). The human digitalisation journey: Technology first at the expense of humans? Information, 12(7), 267. [Google Scholar] [CrossRef]
  34. Hoa, P. X., Xuan, V. N., & Thu, N. T. P. (2024). Factors affecting carbon dioxide emissions for sustainable development goals—New insights into six Asian developed countries. Heliyon, 10(21), e39943. [Google Scholar] [CrossRef]
  35. Huo, J., Meng, J., Zheng, H., Parikh, P., & Guan, D. (2023). Achieving decent living standards in emerging economies challenges national mitigation goals for CO2 emissions. Nature Communications, 14(1), 6342. [Google Scholar] [CrossRef] [PubMed]
  36. Hussain, S., Akbar, M., Gul, R., Shahzad, S. J. H., & Naifar, N. (2023). Relationship between financial inclusion and carbon emissions: International evidence. Heliyon, 9(6), e16472. [Google Scholar] [CrossRef]
  37. IEA. (2023). World energy investment 2023 (pp. 1–181). International Energy Agency. [Google Scholar]
  38. Ilogho, S. O., & Klingelhöfer, H. E. (2025, September 21–24). The moderating impact of digital and financial inclusion on transport-based carbon emissions in the SADC. [Conference presentation]. 18th International Business Conference, Dar es Salaam, Tanzania. [Google Scholar]
  39. Ionascu, A. E., & Barbu, C. A. (2023). Digital transformation in the banking sector: A pre-and post-COVID-19 analysis. Management Research and Practice, 15(3), 55–69. [Google Scholar]
  40. Jayanti, R. K., & Gowda, M. R. (2014). Sustainability dilemmas in emerging economies. IIMB Management Review, 26(2), 130–142. [Google Scholar] [CrossRef]
  41. Judijanto, L., Purwanti, A., & Wijayanti, I. O. (2024). Analysis of the impact of stakeholder engagement, social business model, and financial sustainability on the growth of social entrepreneurs. West Science Journal of Economic and Entrepreneurship, 2(3), 321–333. [Google Scholar] [CrossRef]
  42. Julsrud, T. E., Hjorthol, R., & Denstadli, J. M. (2012). Business meetings: Do new videoconferencing technologies change communication patterns? Journal of Transport Geography, 24, 396–403. [Google Scholar] [CrossRef]
  43. Khan, K., Luo, T., Ullah, S., & Rasheed, H. M. W. (2023). Does digital financial inclusion affect CO2 emissions? Evidences from 76 emerging markets and developing economies (EMDE’s). Journal of Cleaner Production, 420, 138313. [Google Scholar] [CrossRef]
  44. Khosa, M. G. (2024). Digitalisation in the banking sector: Effects on South Africa’s challenges of youth unemployment. University of Johannesburg. [Google Scholar]
  45. Klingelhöfer, H. E. (2009). Investments in EOP-technologies and emissions trading—Results from a linear programming approach and sensitivity analysis. European Journal of Operational Research, 196(1), 370–383. [Google Scholar] [CrossRef]
  46. Klingelhöfer, H. E. (2017). Unintended possible consequences of fuel input taxes for individual investments in greenhouse gas mitigation technologies and the resulting emissions. South African Journal of Economic and Management Sciences, 20(1), 1–11. [Google Scholar] [CrossRef]
  47. Kwakwa, P. A., Adjei-Mantey, K., & Adusah-Poku, F. (2023). The effect of transport services and ICTs on carbon dioxide emissions in South Africa. Environmental Science and Pollution Research, 30(4), 10457–10468. [Google Scholar] [CrossRef]
  48. Le, T. H., Le, H. C., & Taghizadeh-Hesary, F. (2020). Does financial inclusion impact CO2 emissions? Evidence from Asia. Finance Research Letters, 34, 101451. [Google Scholar] [CrossRef]
  49. Le, V. L. T., & Pham, K. D. (2024). The Impact of financial inclusion and digitalisation on CO2 emissions: A cross-country empirical analysis. Sustainability, 16(23), 10491. [Google Scholar] [CrossRef]
  50. Li, Y. (2024). How does digital financial inclusion affect households’ CO2? Micro-evidence from an emerging country. Journal of Economics and Business, 133, 106222. [Google Scholar] [CrossRef]
  51. Light, V., Light, P., & Wright, V. (2000). Seeing eye to eye: An evaluation of the use of video-conferencing to support collaboration. European Journal of Psychology of Education, 15(4), 467–478. [Google Scholar] [CrossRef]
  52. Matthess, M., & Kunkel, S. (2020). Structural change and digitalization in developing countries: Conceptually linking the two transformations. Technology in Society, 63, 101428. [Google Scholar] [CrossRef]
  53. McBride, N., & Stahl, B. C. (2010). Analysing a national information strategy: A critical approach. International Journal of Intercultural Information Management, 2(3), 232–262. [Google Scholar] [CrossRef]
  54. Memon, M. A., Cheah, J. H., Ramayah, T., Ting, H., Chuah, F., & Cham, T. H. (2019). Moderation analysis: Issues and guidelines. Journal of Applied Structural Equation Modeling, 3(1), 1–11. [Google Scholar] [CrossRef]
  55. Meyer, K. E., & Peng, M. W. (2016). Theoretical foundations of emerging economy business research. Journal of International Business Studies, 47, 3–22. [Google Scholar] [CrossRef]
  56. Mohajan, H. (2019). The first industrial revolution: Creation of a new global human era. Journal of Social Sciences and Humanities, 5(4), 377–387. [Google Scholar]
  57. Ogede, J. S., Oduola, M. O., & Tiamiyu, H. O. (2024). Income inequality and carbon dioxide (CO2) in sub-Saharan Africa countries: The moderating role of financial inclusion and institutional quality. Environment, Development and Sustainability, 26(7), 18385–18409. [Google Scholar] [CrossRef]
  58. Osuma, G., Nzimande, N., & Simon-Ilogho, B. (2025). Examining microfinance and financial inclusion nexus in poverty alleviation and sustainable development in Sub-Saharan Africa. Journal of Cleaner Production, 520, 146135. [Google Scholar] [CrossRef]
  59. Our World in Data. (n.d.). CO2 emissions from transport. Available online: https://ourworldindata.org/grapher/co2-emissions-transport (accessed on 21 January 2025).
  60. Our World in Data. (2026a). Automated teller machines (ATMs) (per 100,000 adults) [Dataset]. Available online: https://ourworldindata.org/grapher/automated-teller-machines-atms-per-100000-adults (accessed on 3 April 2026).
  61. Our World in Data. (2026b). Commercial bank branches (per 100,000 adults) [Dataset]. Available online: https://ourworldindata.org/grapher/number-of-commercial-bank-branches-per-100000-adults (accessed on 3 April 2026).
  62. Our World in Data. (2026c). Mobile cellular subscriptions (per 100 people) [Dataset]. Available online: https://ourworldindata.org/grapher/mobile-cellular-subscriptions-per-100-people (accessed on 3 April 2026).
  63. Our World in Data. (2026d). Share of individuals using the Internet (% of population) [Dataset]. Available online: https://ourworldindata.org/grapher/share-of-individuals-using-the-internet (accessed on 3 April 2026).
  64. Ozturk, I., & Ullah, S. (2022). Does digital financial inclusion matter for economic growth and environmental sustainability in OBRI economies? An empirical analysis. Resources, Conservation and Recycling, 185, 106489. [Google Scholar] [CrossRef]
  65. Ritchie, J., & Roser, M. (2023). CO2 emissions. (Our-World-in-Data). Available online: https://ourworldindata.org/co2-emissions (accessed on 21 January 2025).
  66. Sachs, J. (2011). The end of poverty: How we can make it happen in our lifetime. Penguin UK. [Google Scholar]
  67. Salman, D., & Ismael, D. (2023). The effects of digital financial inclusion on the green economy of Egypt. Journal of Economics and Development, 25(2), 120–133. [Google Scholar] [CrossRef]
  68. Santos, S. C., Liguori, E. W., & Garvey, E. (2023). How digitalisation reinvented entrepreneurial resilience during COVID-19. Technological Forecasting and Social Change, 189, 122398. [Google Scholar] [CrossRef]
  69. Tariq, S., & Shahzad, F. (2022). Does digital finance and financial inclusion STRENGTHEN environmental sustainability: Evidence from Asia. Pakistan Journal of Social Research, 4(04), 876–883. [Google Scholar] [CrossRef]
  70. Thangaiyarkarasi, N., & Vanitha, S. (2025). The impact of fintech and economic development on carbon emissions in mobile money economies. International Journal of Energy Economics and Policy, 15(4), 567–575. [Google Scholar] [CrossRef]
  71. Ugur, M., & Mitra, A. (2017). Technology adoption and employment in less developed countries: A mixed-method systematic review. World Development, 96, 1–18. [Google Scholar] [CrossRef]
  72. Ventura, J., & Voth, H. J. (2015). Debt into growth: How sovereign debt accelerated the first industrial revolution (No. w21280). National Bureau of Economic Research. [Google Scholar]
  73. Wang, J., Shan, Y., Xu, J., Li, R., Zhao, C., & Wang, S. (2024). Consumption-based emissions of African countries: An analysis of decoupling dynamics and drivers. Earth’s Future, 12(11), e2024EF005008. [Google Scholar] [CrossRef]
  74. William, R. (2012). The most powerful idea in the world: A story of steam, industry and invention. University of Chicago Press. [Google Scholar]
  75. Wooldridge, J. M. (2001). Applications of generalized method of moments estimation. Journal of Economic perspectives, 15(4), 87–100. [Google Scholar] [CrossRef]
  76. World Bank. (2024a). DataBank. Available online: https://databank.worldbank.org/ (accessed on 12 November 2024).
  77. World Bank. (2024b). Global Findex report. Available online: https://www.worldbank.org/en/publication/globalfindex/report (accessed on 21 January 2025).
  78. World Bank. (2024c). World Bank income groups. World Bank, “Income Classifications” [Original data]. Available online: https://ourworldindata.org/grapher/world-bank-income-groups (accessed on 29 May 2025).
  79. Yang, M., Zhang, F., Kassim, A. A., & Wang, P. (2024). Has digital financial inclusion curbed carbon emissions intensity? Considering technological innovation and green consumption in China. Journal of the Knowledge Economy, 15, 19127–19156. [Google Scholar] [CrossRef]
  80. Yang, Z., Yu, L., Liu, Y., Yin, Z., & Xiao, Z. (2022). Financial inclusion and carbon reduction: Evidence from Chinese counties. Frontiers in Environmental Science, 9, 793221. [Google Scholar] [CrossRef]
  81. Zaidi, S. A. H., Hussain, M., & Zaman, Q. U. (2021). Dynamic linkages between financial inclusion and carbon emissions: Evidence from selected OECD countries. Resources, Environment and Sustainability, 4, 100022. [Google Scholar] [CrossRef]
  82. Zhao, C., Taghizadeh-Hesary, F., Dong, K., & Dong, X. (2024). Breaking carbon lock-in: The role of green financial inclusion for China. Journal of Environmental Planning and Management, 67(3), 564–593. [Google Scholar] [CrossRef]
  83. Zheng, F., Chen, S., & Wang, X. (2025). How the impact and mechanisms of digital financial inclusion on agricultural carbon emission intensity: New evidence from a double machine learning model. Frontiers Environmental Science, 13, 1549623. [Google Scholar] [CrossRef]
  84. Zheng, H., & Li, X. (2022). The impact of digital financial inclusion on carbon dioxide emissions: Empirical evidence from Chinese provinces data. Energy Reports, 8, 9431–9440. [Google Scholar] [CrossRef]
Figure 1. CO2 emissions from different sources in six different continents from 2010 to 2023. Source: Our World in Data (Ritchie & Roser, 2023). Note: Red vertical rectangle boxes indicate possible deeps in emissions associated with the effect of COVID-19 lockdowns in 2020.
Jrfm 19 00388 g001
Figure 2. GHG emissions in the examined 13 SADC countries a year before the pandemic and two years after (2019–2022). Source: Own.
Jrfm 19 00388 g002
Figure 3. Share of people using the internet in the SADC. Source: Our World in Data (Our World in Data, 2026d).
Jrfm 19 00388 g003
Figure 4. Mobile subscription per 100 people in the SADC. Source: Our world in data (Our World in Data, 2026c).
Jrfm 19 00388 g004
Figure 5. Commercial bank branches available per 100,000 adults in the SADC. Source: Our World in Data (Our World in Data, 2026b).
Jrfm 19 00388 g005
Figure 6. ATMs available per 100,000 adults in the SADC. Source: Our World in Data (Our World in Data, 2026a).
Jrfm 19 00388 g006
Table 1. Variables, their measurements, abbreviations and data presentation (source: authors).
AbbreviationsVariablesMeasurement
FININCFinancial Inclusion (IV)
  • ATMs available per 100,000 adults (ATMS)
  • Commercial bank branch per 100,000 adults (CBRANCH)
CO2trptCarbon emissions for transport (DV)Total transport-related annual carbon emissions
DIGITINCDigital inclusion (CV)
  • Mobile subscription per 100 persons (MBLSUB)
  • Internet access (INTACCS) (percentage of the population that has access)
GDPGRGross Domestic Product growth (CV)Increase or decrease in a country’s GDP within a period (annual %)
URBGRUrban GrowthAnnual urban population growth (annual %)
Key: Independent variable (IV); dependent variable (DV); control variable (CV). Source: Authors’ computation.
Table 2. Panel unit root test for variables.
TestsTest @LevelTest @First Difference
MethodsLLCIPSADFPPLLCIPSADFPP
CO2trpt0.5620.9780.8590.7990.0000.0000.0000.000
MBLSUB0.1740.9990.9970.9990.0000.0000.0000.000
INTACCS1.0001.0001.0001.0000.00180.0120.0310.000
ATMS0.0000.2540.3100.6630.1950.0090.0230.000
CBRANCH0.2720.8480.9490.9260.0000.0000.0000.000
GDPGR0.0000.0000.0000.000N/AN/AN/AN/A
URBGR0.0120.2740.2310.0620.0000.0000.0000.000
Key: Levin, Lin & Chu (LLC), Im, Pesaran & Shin W-stat (IPS), Augmented Dickey–Fuller Chi-square (ADF), Phillips–Perron Chi-square (PP). Note: N/A indicates that first difference is not applicable. Source: Authors’ computation.
Table 3. Regression results for objectives one and two.
Δ.CO2trptPanel Two-Stage EGLS (Cross-Section SUR) Fixed EffectMulticollinearity
Independent Var.Coeff.Prob.ImpactDecisionCentred VIF
Δ.ATMS −5140.770.073NegativeReject1.086174
Δ.CBRANCH −13,354.750.020NegativeReject1.047561
Δ.MBLSUB−1214.950.000NegativeReject1.528741
Δ.INTACCS2358.640.286PositiveAccept1.096765
GDPGR40,210.370.000Positive 1.023596
Δ.URBGR−104,220.20.007Negative
R-Squared0.73
Adj. R-Squared0.71
F-Stat34.24
F-Stat (prob)0.0000
Sig.<0.05 <0.1
Durbin–Watson2.09
C-D testp-value
Breusch–Pagan LM0.99
Pesaran CD0.57
Key: The differenced variables represented by “Δ.” as prefix; C-D = cross-section dependence. Source: Authors’ computation.
Table 4. Panel regression results of moderation.
Δ.CO2trptPanel Two-Stage EGLS (Cross-Section SUR)Multicollin.
Indpt. VariableCoeff.Prob.ImpactDecisionCentred VIF
Δ.ATMS−14,207.350.098Negative 3.962599
Δ.CBANKBRCH−138,698.20.000Negative 4.991698
Δ.MBLSUB23,914.530.000Positive 2.695413
Δ.INTACCS−18,002.430.000Negative 2.456029
Δ.ATMS*Δ.MBLSUB−1529.820.031NegativeReject4.220759
Δ.ATMS*Δ.INTACCS6138.100.000PositiveReject1.897732
Δ.CBRANCH*Δ.MBLSUB3605.780.108Insignificant Accept2.813717
Δ.CBRANCH*Δ.INTACCS18,475.580.000PositiveReject3.714823
R-Squared0.55
Adj. R-Squared0.51
Durbin–Watson2.23
F-stat14.00
F-stat (prob)0000
Sig.<0.05 <0.1
C-D testp-value
Breusch–Pagan LM0.99
Pesaran CD0.51
Key: The differenced variables represented by “Δ.” as prefix. Source: Authors’ computation.
Disclaimer/Publisher’s Note: The statements, opinions and data contained in all publications are solely those of the individual author(s) and contributor(s) and not of MDPI and/or the editor(s). MDPI and/or the editor(s) disclaim responsibility for any injury to people or property resulting from any ideas, methods, instructions or products referred to in the content.