Article

Where Is the World Heading? Quantile Time-Frequency Connectedness Among Oil, Conventional and ESG Stock Returns

by
Naziha Kasraoui
1 and
Wael Hemrit
2,3,*
1
Faculty of Economic Sciences and Management of Tunis, University of Tunis El Manar, Tunis P.O. Box 248, Tunisia
2
College of Business, Imam Mohammad Ibn Saud Islamic University (IMSIU), Riyadh P.O. Box 5701, Saudi Arabia
3
GEF2A Lab, University of Tunis, Tunis P.O. Box 2000, Tunisia
*
Author to whom correspondence should be addressed.
J. Risk Financ. Manag. 2026, 19(2), 151; https://doi.org/10.3390/jrfm19020151
Submission received: 27 December 2025 / Revised: 10 February 2026 / Accepted: 11 February 2026 / Published: 18 February 2026
(This article belongs to the Section Sustainability and Finance)

Abstract

This study examines the interactive link between global oil, conventional and the Environmental, Social, and Governance (ESG) stock returns, focusing on their complex structure, nonlinearity, and the duration of uncertainty. We use Quantile-on-Quantile (QoQ) and Frequency-domain Quantile Vector Autoregression (FD-QVAR) methods to apprehend the differences in market states and investment horizon conditions. Based on the (QoQ) approach, we provide solid evidence of the decreasing dependence of crude oil returns on conventional and clean energy stock returns at lower quantile. Our results show that ESG stock markets display greater resilience during severe market downturns. Additionally, the (FD-QVAR) estimation results demonstrate that conventional assets are the primary source of short-term (high frequency) and long-term (low frequency) return shocks. The ESG investments can support international diversification amid persistent oil market declines. The findings provide valuable insights for ESG investors, policymakers, and regulators on risk assessment, hedging strategies, and the intrinsic resilience of sustainable finance.

1. Introduction

The energy transition has triggered rapid and significant transformations in the global financial system, largely driven by international climate agreements, mandatory disclosure frameworks, and stringent oversight of carbon emissions (Sirin & Yilmaz, 2024; Berrêdo et al., 2024). Climate fund incentives have lower greenhouse gas (GHG) emissions, highlighting the benefits of shifting from fossil fuels to green energy (Konstantakis et al., 2025; Yamini et al., 2025; G. Chen et al., 2023). As global demand for sustainable investment grows, sin stocks—tobacco, alcohol, and gambling—are increasingly vulnerable, whereas ESG investments appear to mitigate losses during periods of economic stress. Ghallabi et al. (2025), support this idea and confirm that investors increasingly recognize that ESG metrics play a significant role in financial performance, risk assessment, and long-term value creation. Recently, Arouri et al. (2025) suggested that ESG indices such as the S&P ESG Index illustrate the integration of ESG criteria into equity investments by offering diversified market exposure. There is evidence that ESG-based assessment of corporate sustainability is challenging, particularly amid oil market shocks. Despite its central role in energy and economic growth, oil’s environmental impact has pressured the carbon-intensive energy sector to adopt Corporate Social Responsibility (CSR) and transition to cleaner energy (Nautiyal et al., 2025). In addition, the oil market shocks are rapidly transmitted across markets, thereby affecting production costs and valuations in conventional equity markets (Fueki et al., 2018). Therefore, the global shift toward sustainability has underscored the growing interdependence between crude oil and ESG-themed assets. As a general perspective, the resilience of (ESG) stocks to the predictability of oil return can enhance portfolio diversification and help reduce overall risk exposure (Elsayed et al., 2024). An alternative perspective suggests that substantial inflows into passively managed ESG index funds, together with the persistent macroeconomic influence of the energy sector, may imply that perceived protective barriers weaken during periods of severe market stress or liquidity shocks. This leads to converging correlations and may facilitate the transmission of systemic risk (Bhattacherjee et al., 2024; Maraqa & Bein, 2020; Dutta et al., 2020). Therefore, the comprehensive analysis of the interactions between traditional, carbon-intensive commodity markets and contemporary financial instruments, especially those adhering to (ESG) criteria, is crucial.
Bearing in mind the above-mentioned aspects related to ESG assets, we aim to investigate the tissue of spillover and interconnectedness among oil prices, conventional (non-ESG) and the (ESG) stock market returns under exceptional market conditions. To fulfill this objective, we employ the advanced Quantile-on-Quantile (hereafter, QoQ) regression approach (Sim & Zhou, 2015) and the Frequency-Domain Quantile Vector Autoregression (hereafter, FD-QVAR) methodology (Chatziantoniou et al., 2022) over the period from October 2023 to May 2025. The current models that rely on average-based approaches do not account for two crucial aspects of financial interdependence—namely, nonlinearity and asymmetry (Diebold & Yilmaz, 2014). In general, financial markets display nonlinear and asymmetric behavior with respect to tail-risk tolerance (Cao et al., 2023; Z. Zhang & Chen, 2021; Liu, 2017). Therefore, standard models may fail to fully capture the convergence of tail risks and might not adequately account for shifts in market behavior during periods of stress or stability. The aforementioned methodologies have been widely used in both theoretical and empirical research in economics and finance to assess the varying dynamic hedging capabilities of financial assets, cryptocurrencies and commodities. The outcomes provide (i) crucial evidence for advanced institutional risk management techniques and portfolio development aimed at real-world decarbonization and resilience, and (ii) practical insights for policymakers and central banks assessing the sustainability of debt and equity markets under challenging energy market conditions. Considering these dynamics, it becomes evident that the future landscape of financial markets will be increasingly shaped by ESG principles. In conclusion, this study aims to address several key questions that remain unresolved in the existing literature. First, do spillover effects exist among oil, conventional equity, and ESG stock markets? Second, what are the nature and characteristics of these spillovers—are they transitory or persistent, and do they vary across different market conditions?
The findings of this research highlight that both stock market indices rely on common economic and financial mechanisms to drive their interdependence. Especially in the lower quantiles, the plots exhibit significant negative interactions suggesting a strong inverse relationship. The phenomenon is attributed to either flight-to-safety or demand-side shocks caused by economic contractions. Second, the curves at these extremes have a unique “inverted U-turn” shape, which highlights the intensification of this negative correlation during severe market distress. This negative correlation persists even at higher quantiles. Also, the Brent crude oil has a significant impact on the S&P 500 and ESG S&P 5000. In other words, the extreme market levels exhibit a major contrast, whereby Brent crude experiences more deflation. Both WTI and Brent crude exhibit similar qualitative impacts on the S&P 500 and ESG S&P 500, with Brent showing a stronger effect, especially at higher levels of the market distribution. Finally, the ESG index’s response patterns are akin to those of the traditional S&P 500, suggesting that short-term macroeconomic factors and oil price fluctuations tend to outweigh or correspond to ESG considerations.
While the substantial impact of oil price shocks on the sustainable economy is well-documented, research on the dynamic connectedness between oil shocks, conventional assets, and ESG stock returns remains limited (Tiwari et al., 2025). Existing studies have mostly examined the effects of oil price shocks on sustainable sectors in a general sense, with less attention given to how connectedness fluctuates across oil, conventional, and ESG stock market returns during both normal periods and times of extreme turbulence. Our research contributes to the literature in a number of ways. First, we examine whether ESG-aligned equities provide effective diversification or hedging against price swings in the oil market and how this relationship varies across investment horizons, particularly in the return distribution tails. Second, by providing a holistic perspective on dependence, we try to detect subtle conditional hedge strategies or symmetric contagion effects, particularly in joint crises (e.g., when both oil prices and equity returns are in low quantiles). In general, lower quantiles represent more extreme market conditions, corresponding to heightened risks often associated with bearish markets or periods of severe stress, such as financial crises or sudden, and sharp downturns (J. Chen et al., 2022). In view of this, we employ a (QoQ) connectedness approach. Third, we employed complementary econometric methods to (i) validate the robustness of the (QoQ) analysis and (ii) measure the differences in impact and magnitude across various indices. The advantages of this method are apparent and may be easily identified.
The paper’s remaining format is as follows: Section 2 reviews the relevant theoretical and empirical literature. In Section 3, the criteria for selecting data and the more advanced econometric approaches are elaborated. Section 4 provides a detailed analysis of the empirical findings, including (QoQ) surface plots and frequency-specific spillover indices. Section 5 provides a thorough analysis of findings. Finally, Section 6 concludes the paper.

2. Literature Review: Dissecting the Oil–Finance and ESG Nexus

2.1. The Oil–Finance Nexus and Market Spillovers

Paralleling the growing interest from industry, academic research has intensified since 2008, exploring the impact of the oil market on a range of sectors, including real estate, equities, bonds, and derivatives. Focusing on financial markets, the stock returns are affected by price shocks through three distinct mechanisms: (i) the supply-side inflation, (ii) the sharp rise in non-commodity costs (including supply chain disruption), and (iii) the demand-side fluctuations (such as: changes in consumer disposable income and investment outlook). In light of this, the recent literature has often employed Kilian’s (2009) method to break shocks down into oil-specific supply shock type, aggregate demand shock, and precautionary consumption stress (Fueki et al., 2018; Kang et al., 2014). This method suggests that the severity of an oil shock is dependent on its nature. Recent studies, particularly those employing Generalized Variance Decomposition (Diebold & Yilmaz, 2014), show that West Texas Intermediate (WTI) and Brent crude are the most influential oil benchmarks and major sources of shocks in global equity markets.
Historical events, such as the Gulf Wars, the subprime mortgage crisis in 2008, the oil crisis in 2014, and also the COVID-19 pandemic, led to the return transmission from oil shock to financial markets (Escribano et al., 2023; Antonakakis et al., 2023). The Russia–Ukraine war is another recent global event that has not only caused geopolitical instability and sanctions, but also amplified the oil market return and fundamentally affected the interconnectivity between oil price shocks and financial markets (Q. Zhang et al., 2024; Bagchi & Paul, 2023). Indeed, numerous studies show that the transmission of global crude oil prices to domestic prices is asymmetric and nonlinear (Long & Liang, 2018). More recently, Cui et al. (2025) suggested that the crude oil market strongly influences stocks, with bidirectional linkages shaped by economic conditions, monetary policy, investor sentiment, and geopolitics, making them central to asset pricing and risk transmission. Given the increasing unpredictability of uncertainty and environment policies, the standard Quantile Autoregression (QAR) approach is the most widely used in the literature, as return spillovers tend to intensify in the extreme tails of the distribution (Koenker & Xiao, 2006).
Although QAR is more flexible than earlier approaches, volatility persistence, leverage effects in energy markets, and panic-driven selling have created gaps in understanding how spillovers evolve under extreme conditions, resulting in an incomplete view of market behavior. Therefore, there is still a significant shortcoming as the majority of current literature has treated all stocks uniformly or exclusively on broad industrial sectors, with no differentiation between oil and stock markets based on their specific long-term sustainability credentials (Zarrouk & Ouafi, 2025; Awartani & Maghyereh, 2014). To address this, our study employs advanced methodologies such as (QoQ) regression asymmetric to explain relationships and dynamic changes across different market conditions.

2.2. The Rise of ESG Investing and Resilience

The stretched asset valuations, the rising public debt and geopolitical tensions left firms with limited time and capacity to respond, prompting interest in examining whether ESG investing was effective stock market crash (Hsu & Huang, 2024). According to a Deloitte (2022) report, companies that demonstrate strong ESG performance exhibit higher operational quality, lower litigation risk and greater capacity to manage climate transition risks, thereby driving value creation beyond the associated net financial costs. A combination of these features may allow decreasing the susceptibility to systemic risk spillover effects, such as volatility resulting from the conventional energy complex (Broadstock et al., 2020). Bhattacherjee et al. (2024) argue that sharp increases in oil prices trigger a substitution effect that favors ESG investments. This, in turn, shifts capital toward ESG assets leading to a negative correlation between oil prices and ESG-focused stocks. In addition, despite oil’s strategic role in global energy systems and renewable economic growth, oil price fluctuations can trigger contrasting effects on corporate ESG initiatives. Accordingly, the association between oil and ESG assets is shaped by theoretical channels suggesting that the ESG investments may offer protection against oil price fluctuations.
A substantial body of empirical research examines the resilience of ESG assets during periods of crisis, though the findings are nuanced and complex (X. Yang et al., 2025). At first, many researchers are focused on a flight-to-quality effect (Chau et al., 2025; Beloskar & Rao, 2022) and show that ESG funds generally outperformed their conventional counterparts during the severe dips in the COVID-19 epidemic. By employing the quantile VAR-based connectedness method, Banerjee et al. (2024) indicate that carbon risk and green energy instruments act as net shock receivers during various periods. However, this study does not consider oil-related spillover effects. Excluding this key driver of market volatility may underestimate tail dependence, misrepresent diversification benefits of green assets (such as ESG stocks), and overlook important cross-asset risk spillovers, during periods of market stress. Recently, de la Fuente et al. (2025) argued that the ESG premium can be viewed as a risk-absorbing buffer, with ESG engagement mitigating systematic risk. In 2022, some high-ESG optimized portfolios experienced underperformance amid the war in Ukraine. This is due to the mandatory divestment from energy majors, prompting renewed concerns about the strength and persistence of the decoupling effect, which may be undermined by forced portfolio reallocations. In the most recent study, Alofaysan et al. (2026) suggest that the spillover effect should be minimal if ESG assets are decoupled from traditional energy risks, particularly in low-quantile (crisis) regimes. Conversely, when macroeconomic contagion raises asset correlations, ESG criteria may fail to mitigate major commodity shocks (Covachev et al., 2025). Therefore, the strength of sustainable investing claims depends on examining how ESG stock returns respond conditionally to oil tail risks.

2.3. Advanced Methodology in Financial Market Connectedness

Capturing the complex, non-linear, and time-dependent dynamics of financial markets requires econometric methods that extend beyond simple mean-based correlation measures. With the advent of new technologies, researchers can now scrutinize risk transmission with unprecedented accuracy. Here, Sim and Zhou (2015) suggest that the (QoQ) approach is considered a significant methodological advancement over standard Quantile Regression (QAR). This approach models the conditional quantiles of the dependent variable by utilizing the entire distribution of the explanatory variables’ quantiles.
A kernel-based approach is utilized to accurately determine the changes in risk and return dynamics that occur at the same time, regardless of their magnitude or direction. This framework is particularly effective in capturing nuanced joint hedging and contagion effects, such as whether negative oil returns amplify the downside risk of ESG assets during periods of already weak performance. In addition, dynamic risk evaluation requires the consideration of time-varying fluctuations. The ability to distinguish between high-frequency and low-facial fluctuations is often due to speculative trading, liquidity imbalances, or short-term news, while the latter is usually caused by long-scale fundamental factors (such as the economic growth cycles, structural policy changes, or technological adoption). By incorporating these two potent concepts into the Frequency-QVAR (FQ-VAR) method, we can provide a robust foundation for this research (Baruník & Kley, 2019). Furthermore, we can rigorously test the nature of risk across different investor horizons. This allows us to determine whether oil’s fundamental and low frequency affect ESG returns is genuinely ‘balanced out’ or if the transmission is merely amplified by short-term speculative noise during periods of stress. To do this, we employ the market-state conditioning (quantiles) and time-horizon separation (frequencies). Our study extends the recent works of Malik and Umar (2024), Bhattacharjee et al. (2024), and Sharma and Rani (2025) who considered only the spillover between ESG stock returns and oil prices. Therefore, our explorations go beyond these works by encompassing also the conventional stock returns, thus conducting a more realistic comparative analysis. Finally, we use the (QoQ) method to (i) offer sufficient flexibility and (ii) capture three-dimensional (3D) visualizations of the key interactions, enabling a clearer and more rigorous assessment of how oil returns drive the observed outcomes. These methods provide more comprehensive visualizations of market reactions by depicting the intensity of interactions through a color-coded power spectrum.

3. Methodology

This section presents the methodology for analyzing spillover effects and connectedness among crude oil, the S&P 500, and S&P 500 ESG stock returns. The sequential steps of the analysis are summarized in Figure 1.

3.1. The Time Frequency Quantile VAR Method

It is important to note that the approaches of Diebold and Yilmaz (2014) and Ando et al. (2022) rely on conditional mean estimators. These estimators capture spillovers only under normal market conditions and fail to account for dynamic connectedness during extreme states. As a result, they tend to underestimate the true intensity of cross-market spillovers. To overcome these limitations, the (FQ-VAR) approach was proposed to capture the connectedness and spillover between the four variables: (i) the frequency and (ii) quantiles that reflect the expected shock transmission, (iii) the frequency–quantile level of integration within the network by incorporating multiple time horizons (short-run and long-run) and (iv) the negative extreme markets conditions (bearish markets). Our approach adopts the perspective of highly risk-averse investors, emphasizing a lower quantile (e.g., the fifth percentile) to capture the transmission of extreme negative shocks across markets. The International Energy Agency painted a bearish picture of the oil market, highlighting downward price pressures and a dramatic decline in returns during the period from 2023 to 2025. The interval is classified as a bear market period. During the study period, the global oil market entered a post-scarcity regime shaped by geopolitics and the COVID-19 pandemic, where conflicts and government interventions no longer consistently drive prices but instead amplify competition, fragmentation, and discounting (Benlagha & Hemrit, 2025). Under these conditions, the uncertainty has increasingly exerted downward pressure on the market. It seems that the weakening oil demand, ongoing supply-chain disruptions, and high inflationary pressures—exacerbated by recession fears—are the primary drivers of the bearish outlook on the market. A key advantage of this approach is its ability to realistically capture shock propagation. Our analysis will concentrate solely on the lower quantile (q = 0.05), which effectively reflects shock transmission during periods of financial stress (see Appendix A).

3.2. The Quantile on Quantile (QoQ) Approach

We conducted an in-depth investigation of the impact of oil price on stock returns, using the flexible (QoQ) approach. This method enables us to effectively capture the exogenous explanatory power of oil on stock returns, and the resulting estimates are well-suited to revealing the underlying intrinsic dynamics of the relationships among the variables considered. Lai et al. (2023) argue that the quantile-on-quantile (QoQ) method can capture the influence of the independent variable (oil) on different positions of the dependent variables (S&P 500 and S&P 500 ESG). In doing so, the modeling framework can be described as follows:
Q ~ y τ = a r g m i n α i ρ τ ( y i α )
where ρ τ ( y i α ) = ( τ 1 ) ( y i α ) i f   y i < α τ ( y i α ) i f   y i α .
Following Sim and Zhou (2015), the (QoQ) model is used to capture the impact of oil prices on the Stock returns across their quantiles. It can be described by the following regression equation:
S t o c k S & P 500 / E S G = β 1 O I L + β 2 S t o c k S & P 500 / E S G t 1 + ε t
This equation is converted to the QoQ form:
S t o c k S & P 500 / E S G = β θ O I L + α θ S t o c k S & P 500 / E S G t 1 + ε t
S t o c k S P 500 / E S G denotes the stationary stock returns of the S&P 500 and the S&P 500 ESG indices, oil refers to either the WTI or Brent index at time (t − 1), and β θ represents the unknown parameter capturing the explanatory power of oil at quantile θ . This study examines the influence of oil on stock returns under both bullish and bearish market conditions. Bullish markets correspond to low risk (upper quantiles), while bearish markets correspond to high-risk (lower quantiles). Therefore, it is necessary to estimate the relationship between the quantiles of oil returns and those of stock returns. Then, we use the first-order Taylor expansion of o i l (t) as follows:
β θ O I L t β θ O I L τ + β θ ; O I L τ O I L t O I L τ
By replacing β θ O I L τ and β θ ; O I L τ by β 0 θ , τ   a n d   β 1 θ , τ , the new specification is:
β θ O I L t β 0 θ , τ + β 1 θ , τ O I L t O I L τ
Then, the previous Formula (10) is equivalent to:
S t o c k S & P 500 / E S G = β 0 θ , τ + β 1 θ , τ O I L t O I L τ + α θ S t o c k S & P 500 / E S G t 1 + ε t
The above equation represents the θ conditional quantile of S t o c k S & P 500 / E S G and α θ   β 0 θ , τ is the intercept and β 1 θ , τ is the estimated coefficient reflecting the impact of τ quantile OILt on θ quantile of S t o c k S & P 500 / E S G . By minimizing the local linear estimates of β 0 θ , τ + β 1 θ , τ , we obtain the following equation:
Min β 0 , β 1 i = 1 n ρ θ S t o c k S & P 500 / E S G β 0 β 1 O I L t O I L τ α θ S t o c k S & P 500 / E S G t 1 K F n o i l t h
We define ρ θ = u(θ − I(u < 0)), where ρ θ is the loss function of the θ conditional quantile; I is the indicator function. Due to its simplicity and computational efficiency, this paper uses the Gaussian kernel to weight the observed values. Here, K(.) denotes the kernel function used to weight values adjacent to O I L t , and h is the bandwidth parameter. The weight assigned is inversely related to the distance between the empirical distributions of OILt and OILτ; that is, values farther from the target observation receive lower weights, while closer values receive higher weights, as shown in Equation (8).
F n O I L t = 1 n k = 1 I O I L k < O I L t
In the QoQ approach, bandwidth selection is critical. As noted by Sharif et al. (2019), a wider bandwidth may distort estimates, while a smaller one increases prediction uncertainty. Therefore, a balanced bandwidth is necessary. Following Sim and Zhou (2015), this study adopts a bandwidth of h = 0.05 for capturing the underlying patterns in the data without overfitting or oversmoothing.

4. Empirical Results

4.1. Data Description

We use daily data for two oil price benchmarks, WTI and Brent, as well as for the conventional S&P 500 and the S&P 500 ESG indices. The dataset covers the period from October 2023 to May 2025, encompassing the full timeframe of the ongoing Israel–Palestine conflict. Other important economic and geopolitical events occurring during the study period include the United States’ withdrawal from the Paris Agreement under the Trump administration, as well as the outbreak of the Russia–Ukraine war. These events represent significant sources of geopolitical and policy uncertainty, both of which had notable impacts on global financial markets, investor sentiment, and risk transmission dynamics (Alofaysan et al., 2026; Konstantakis et al., 2025; Arouri et al., 2025). All data were obtained from the U.S. Energy Information Administration (EIA) and the Investing.com website. Table 1 presents a detailed description of the main variables considered in the analysis. Further, all the time series were transformed into their log returns by using the formula: log(st/st − 1)*100.
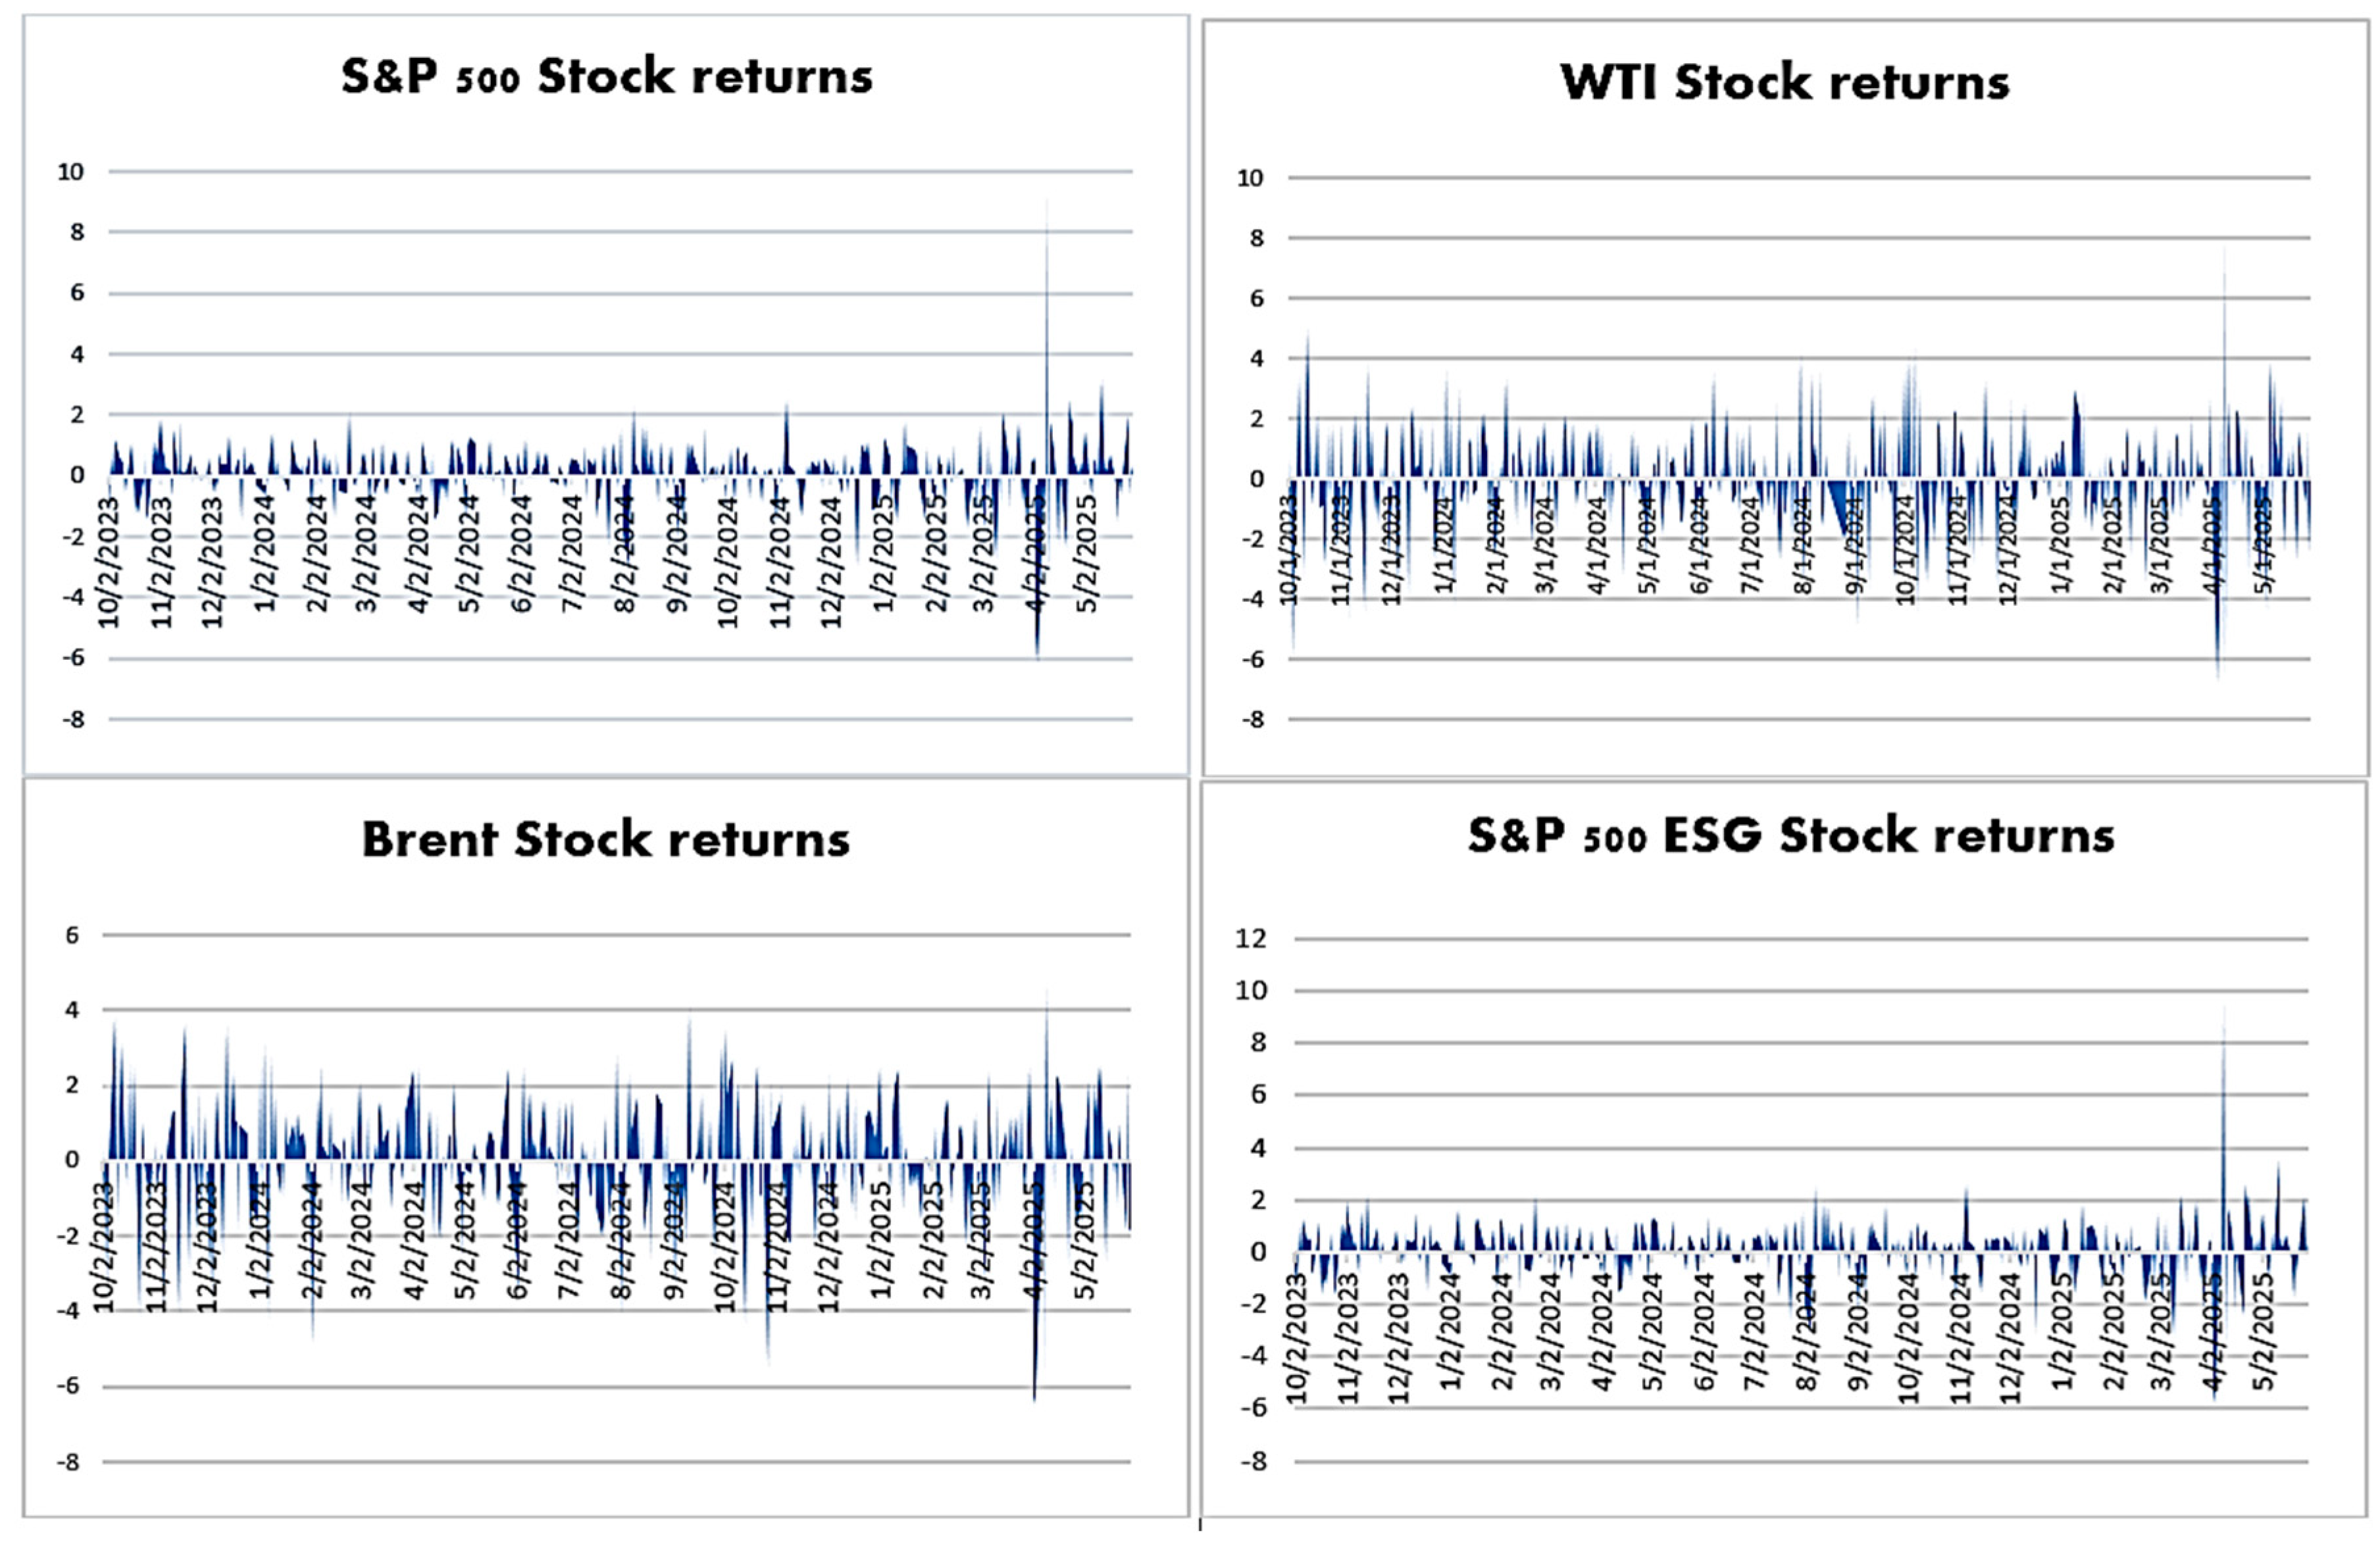
The time paths of the series are plotted in Figure 2. It is worth noting that all the stock returns exhibited a sequence of abrupt changes over the whole sample period proving the existence of a continuum of short-lived intrinsic adjustments. Both crude oil and stock returns exhibit a generally stable trend, punctuated by periods of booms and busts.
Although the overall volatility of these stock market returns was generally low, a notable spike in abnormal return volatility occurred around mid-2025. This spike reflected a normalization of global equity volatility following the April 2025 tariff shock. Moreover, the modest rise in volatility was attributed to interest rate fluctuations and geopolitical tensions (Özdurak & Yantur, 2025). Similarly, though less pronounced, Brent oil returns exhibited volatility spikes during the period of retaliatory strikes by Israel in response to an Iranian attack, reflecting increased risk aversion and shifts in market sentiment.
From Table 2, the descriptive statistics show that both crude oil returns have higher variance than the stock returns. The average S&P 500 and S&P 500 ESG (Brent and WTI) stock returns are positive (negative), indicating a stock market boom and global decrease in oil prices, respectively. Additionally, the elevated variance indicates that oil prices undergo more frequent and larger fluctuations than stock markets, positioning them as a major source of risk within the global financial system. We find negative values for the skewness indicating that all data are skewed left. Further, both stock returns series are non-normally distributed, as the Jarque–Bera (J.B) test rejects the null hypothesis of normality at the 1% level of statistical significance.

4.2. Results for the Static Frequency Connectedness

In this section, we first present the results of estimating our model by the (FQ-VAR) method. Next, we investigate the dynamic connectedness relationships that exist between crude oil, conventional and ESG stocks returns using the (QoQ) connectedness method (Ando et al., 2022). The numerical results are reported in Table 3 (Panel A, B and C), which presents the static connectedness matrix for BRENT, WTI, S&P 500, and S&P 500 ESG stock returns at the median quantile (τ = 0.5), reflecting normal market conditions. The NET row highlights the level of net spillovers, while the TCI value quantifies the overall strength of total spillovers within the system. The total, short-run and long-run static connectedness results are presented from top to bottom, with all values expressed in percentages. The estimates were obtained by considering a VAR model with one lag, and the dynamic connectedness is encircled by considering a rolling window process with a window length equal to 50.
According to the estimation results shown in Table 3 (Panel A), it is worth noting that Brent returns exert a slightly stronger impact on the S&P 500 (20.06%) than on the S&P 500 ESG (19.94%), whereas oil returns have a relatively more pronounced effect on the S&P 500 ESG (21.9%) compared with the S&P 500 (21.54%). Based on the total connectedness estimates, we find that both the S&P 500 and the S&P 500 ESG stock returns appear more sensitive to WTI shocks than to Brent shocks. Furthermore, intermarket shocks account for the lowest fraction of variations in returns across all instruments. This is reflected in the values along the diagonal in Table 3—Panel A. Overall, the four indices exhibit strong integration, with total connectedness reaching 72.39%.
Turning to the short-term connectedness estimates, (Panel-B), a homogeneous pattern of behavior is observed. The magnitude of shocks transmitted from WTI returns to both S&P 500 indices is slightly higher (approximately 15%), whereas shocks originating from Brent returns amount to 13.54% for the S&P 500 and 13.09% for the S&P 500 ESG index. The two oil return measures appear to have opposite effects on S&P 500 stock returns, with WTI exerting a stronger influence on the conventional S&P 500 than on the S&P 500 ESG index. Overall, the total return connectedness index (TCI) is moderate (51.5%). The high cTCI values indicate elevated market risk, and vice versa (Hemrit et al., 2023). Panel C of Table 3 illustrates long-term relationships, indicating that the total connectedness is roughly 20.9%. The driving forces of the system remain relatively stable in the long-term horizon. This finding corroborates those of Boubaker and Jouini (2014). Furthermore, we show that the spillover magnitudes are nearly identical for each oil return; WTI returns impact the S&P 500 and S&P 500 ESG similarly, with shock amplitudes of 6.51% and 6.53%, respectively. The effects of Brent returns are also very similar, slightly higher for the S&P 500 ESG stock return, reaching 6.85%. Additionally, the S&P 500 appears to be the most resilient to the long-term spillover effects of oil shocks, particularly during periods of weak or partial market integration (TCI = 20.89).
From the Panel A of Table 3, we show that 72.39% of the forecast error variance in the examined markets stems from interconnected financial relationships, highlighting the degree of transmission within the network. This result is consistent with the results reported by Chancharat and Sinlapates (2023) and Escribano et al. (2023), suggesting that the variables in the system exhibit substantial interactions that should be considered by policymakers and international investors seeking portfolio diversification. With respect to shock transmitters and receivers, the static connectedness analysis at the 0.5 quantile supports the study’s assumptions, indicating that stock market shocks act as the main driving forces of the system. Identifying the channels through which S&P 500 can exert significant effects on oil related shocks is critically important. This is consistent with the observation of Husain et al. (2019) on the dominant impact of stock returns on oil markets. This effect may be attributable to the transmission mechanism of information mainly proceeding from the US stock market to the oil market, and the relatively weak influence of exogenous BRENT and WTI markets on the stock markets. Having the highest positive net spillover of 11.26%, S&P 500 command the strongest influence, followed by net spillover value of S&P 500 ESG (7.69%). The two oil shocks show similar but unidentical fluctuations in the stock return spillover effects. The strength of the ESG stock markets is further revealed through the net spillover statuses and receives substantially less than they transmit. Overall, the correlation between the S&P 500 ESG and other assets tends to be stronger under normal market conditions, whereas it weakens during periods of stress, when the variables reach their extreme low or high values. These findings indicate that including ESG equities in a diversification strategy does not mitigate systemic, market-wide risks impacting the entire market. This is consistent with Wang et al. (2024). Under normal conditions, market shocks stemming from earnings announcements, policy decisions, or geopolitical events can transmit across multiple markets within a matter of days. Thus, financial markets rapidly assimilate new information, with spillover effects materializing in other markets within five trading days.
In the short run, BRENT related shocks influence negatively other S&P 500 ESG stocks returns by at least 13.09%, indicating that ESG firms depend on oil due to the robustness of the channels through which oil market dynamics affect the operations of these firms covered in the indices. Thus, ESG-focused firms, owing to their lower carbon exposure, may display stronger inverse comovement with oil markets, particularly during periods of systemic stress. The findings are consistent with the past literature that prove that ESG stock markets often observe stronger connectedness in the short run (e.g., Nautiyal et al., 2025), but they contradict those reported in Y. Chen and Lin (2022). This suggests that the ESG assets remain vulnerable to idiosyncratic disruptions originating from the oil sector and often respond asymmetrically to extreme market movements. Simultaneously, they receive the smallest share of shocks from oil markets, accounting for just 9.28% of shocks originating from oil and conventional stock returns. These findings specify that the short-term consequences of oil risk shocks are analogous to those of total connectedness.
Over extended periods, the S&P 500 ESG index appears more exposed to external market return (24.01%), reinforcing its relatively dependent position within oil and global financial markets. In contrast, conventional stock returns continue to dominate the long-run shock transmission, with the S&P 500 (23.86%) exhibiting the highest “TO” values, thereby confirming its long-term systemic importance as a key source of return spillovers, as consistent with evidence from the literature (Mensi et al., 2023; Aromi & Clements, 2019). In contrast, Brent (18.17%) and WTI (19.12%) report the lowest TO values, suggesting that its effect on long-term shock transmission is relatively limited. Conversely, the fact that both stock market returns act as net transmitters, exhibiting positive net connectedness, indicates that these markets primarily transmit contagion effects and external shocks rather than being influenced by them. Despite this, they could offer rooms of diversifications for investors aiming to protect their long-term investments against the expected downside risk. Therefore, combining both conventional and ESG stocks could serve as an effective hedging strategy to mitigate downside shock transmission over the long run. This finding further supports and expands upon Singh (2020), who emphasizes the potential of stock assets, including ESG stocks, as hedging instruments, reflecting investors’ focus on long-term sustainability rather than short-term gains. Overall, we can see that the short-term connectedness is about thrice the long-term one.

4.3. Results for the Dynamic Frequency Connectedness

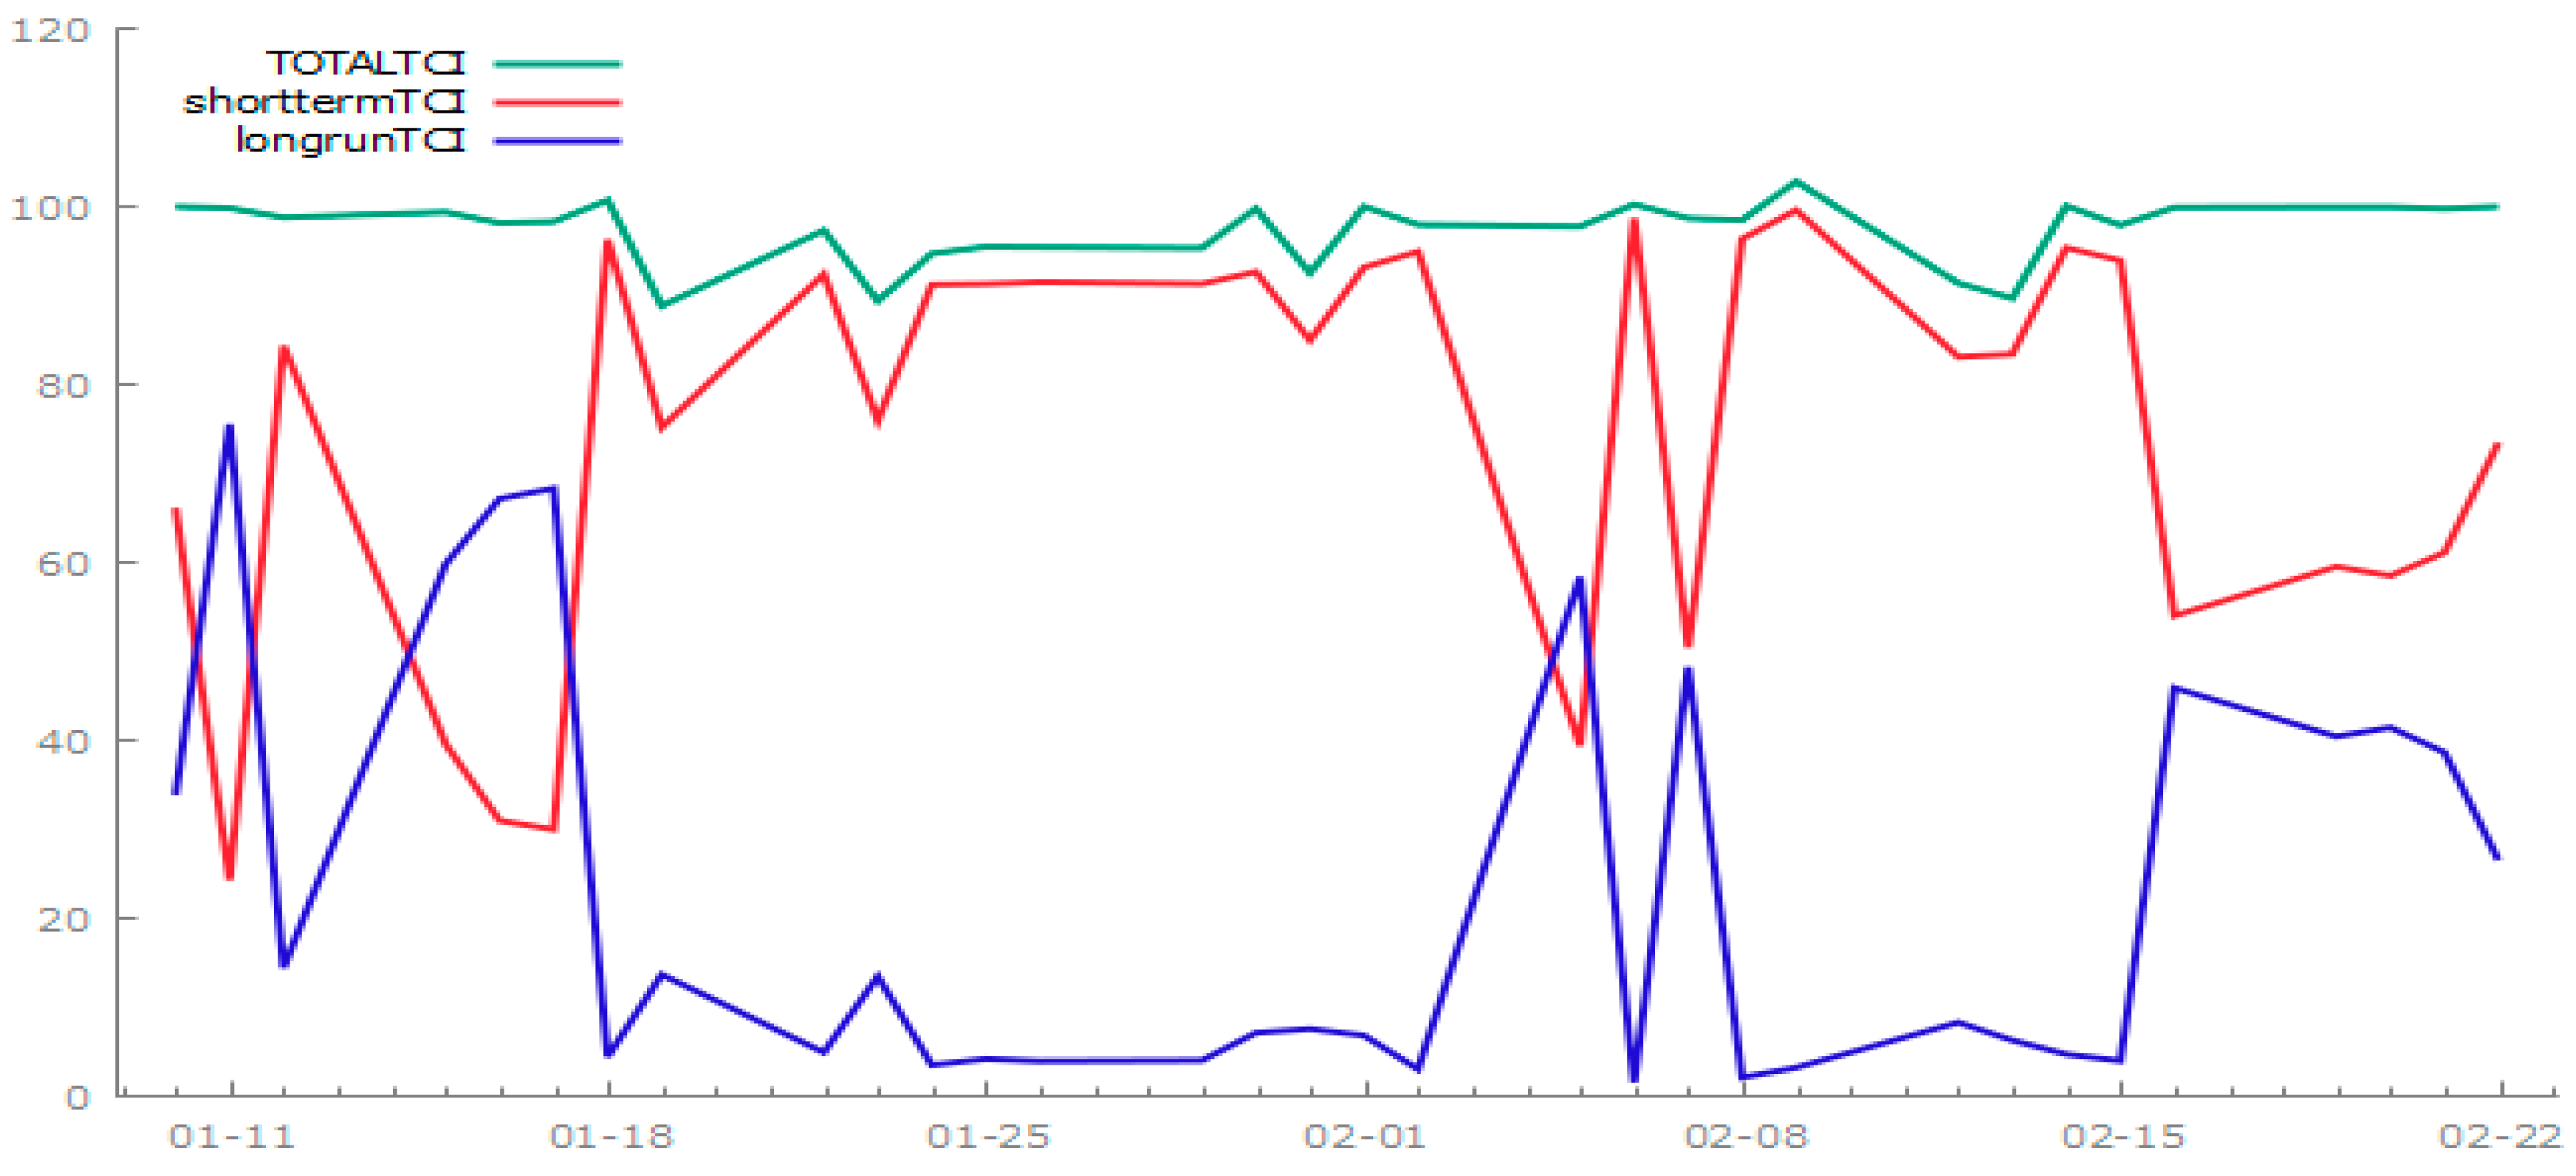
Figure 3 illustrates the three-dimensional dynamic connectedness at the lower quantile (q = 0.05) to capture the temporal and frequency-based behavior of the market under bearish conditions.
As illustrated in Figure 3, the magnitude of the discrepancy is substantially greater across both short- and long-term horizons. Over the sample period, the connectedness displays recurrent boom–bust cycles, marked by frequent short-term fluctuations. The sequence of observed peaks and troughs reflects the ongoing intrinsic adjustments underlying oil as well as both conventional and ESG stock returns.
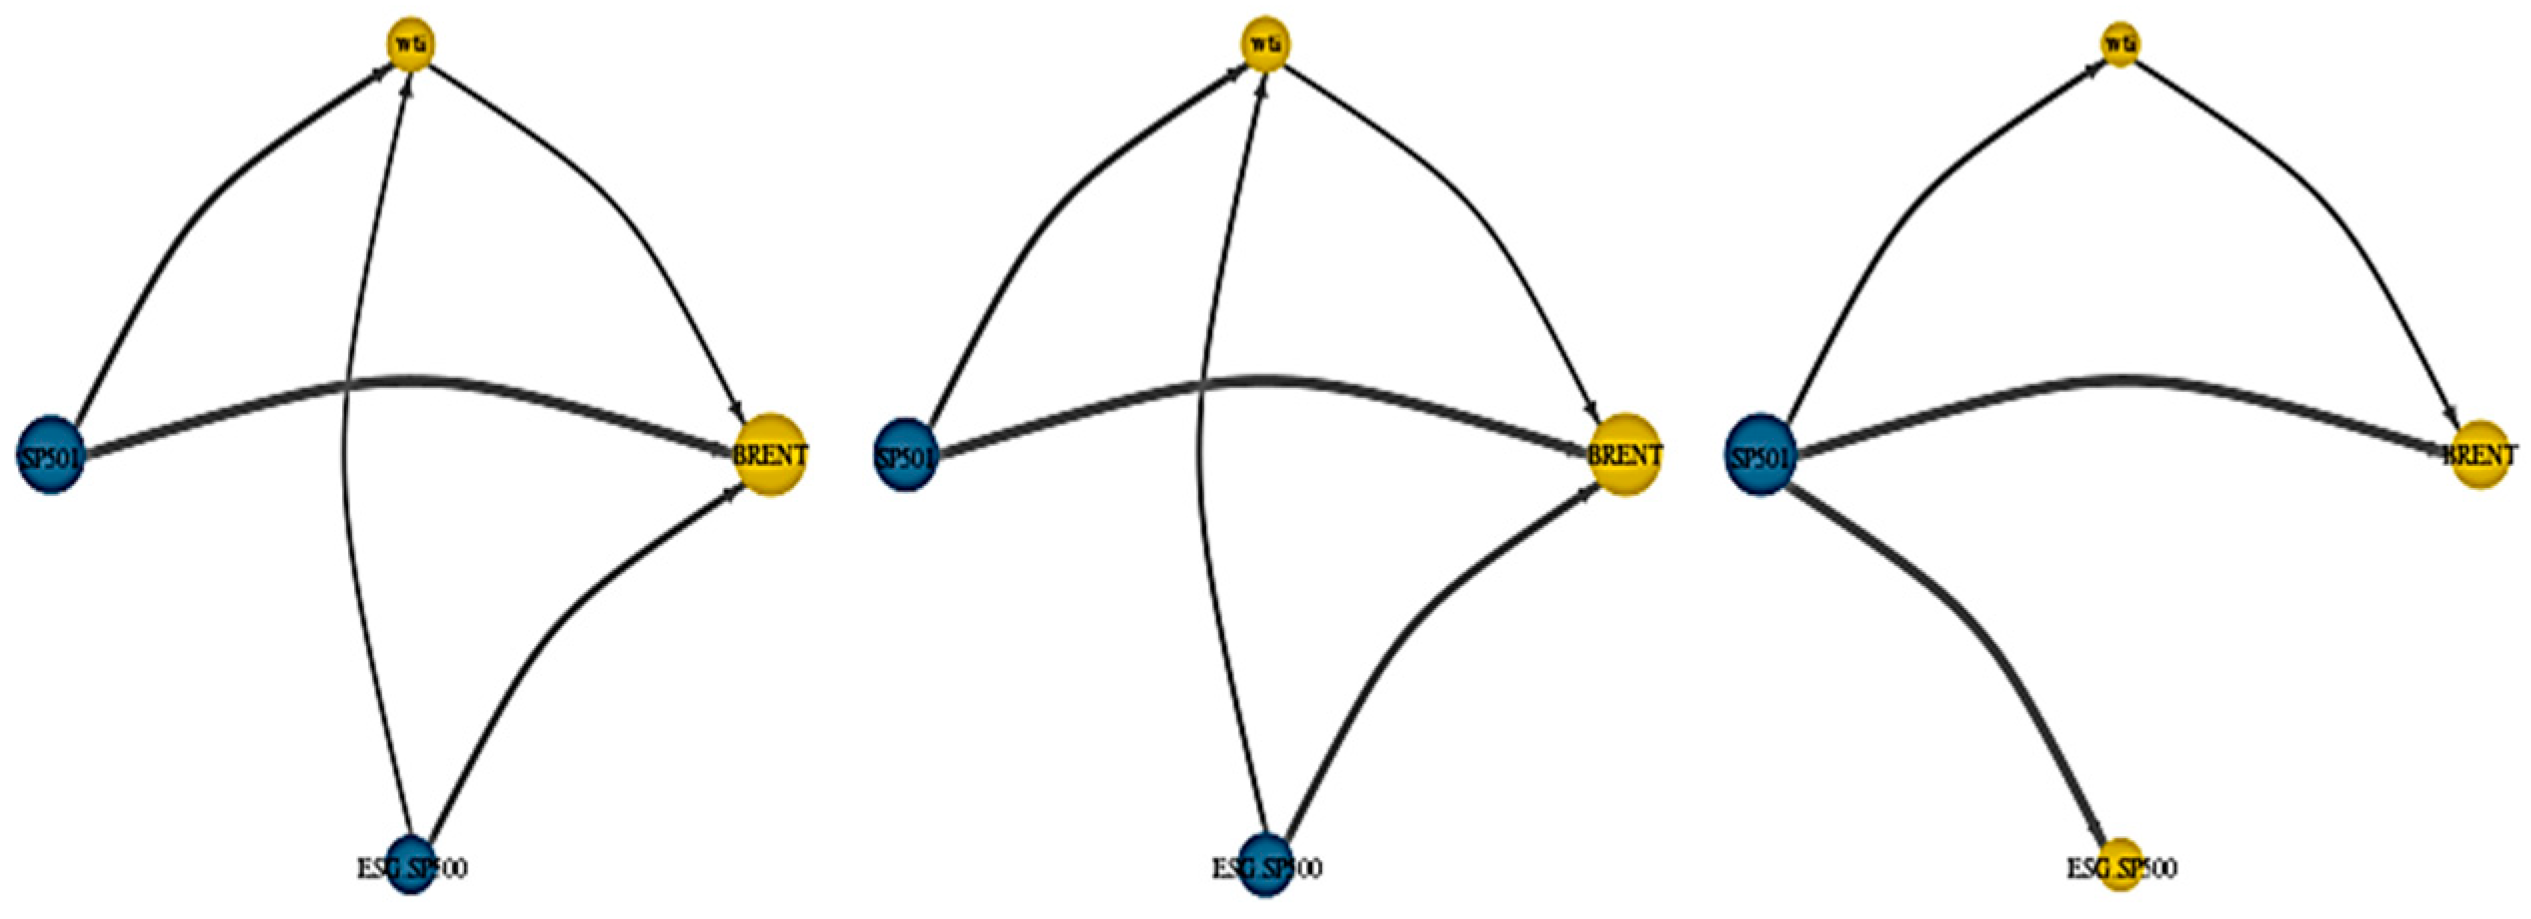
The market integration increased sharply at the beginning of October 2023, with long-run dynamics (green curves) indicating amplitudes exceeding 60%. This suggests that oil and stock prices reacted swiftly to the ongoing escalation of the Israeli–Palestinian conflict, with heightened sensitivity throughout the period. Moreover, the responses of oil and stock returns are more pronounced over short horizons, indicating that these markets rapidly adjust to abrupt shocks during periods of heightened stress. The higher short-term amplitudes of dynamic connectedness likely reflect the behavior of short-term investors, whose panic-driven responses contribute to persistent market overreactions. The network architecture is presented in Figure 4, illustrating the complex interactions among the variables under consideration.
The extreme left and central networks, which reflect overall and short-term interactions, are broadly similar, indicating that no substantial changes occur in the short run, as crude oil and stock returns exhibit homogeneous responses. In contrast, the long-run network indicates a subtle shift in the nature of inter-market relationships, as neither Brent nor WTI exert a statistically significant influence on the S&P 500 ESG index. This result highlights the long-run resilience of the S&P 500 ESG to oil price shocks and lends support to the hypothesis that spillover magnitudes attenuate over time and across frequency domains.

4.4. Results for the Quantile-on-Quantile (QoQ) Method

To further investigate the interrelationships among oil returns, the S&P 500, and the S&P 500 ESG returns, we employ a three-dimensional (QoQ) framework that explains a detailed graphical representation of interactions across different quantiles (Bossman et al., 2022). This method is flexible and powerful in capturing the explanatory power of the oil shocks on the S&P 500 and S&P 500 ESG stock returns.
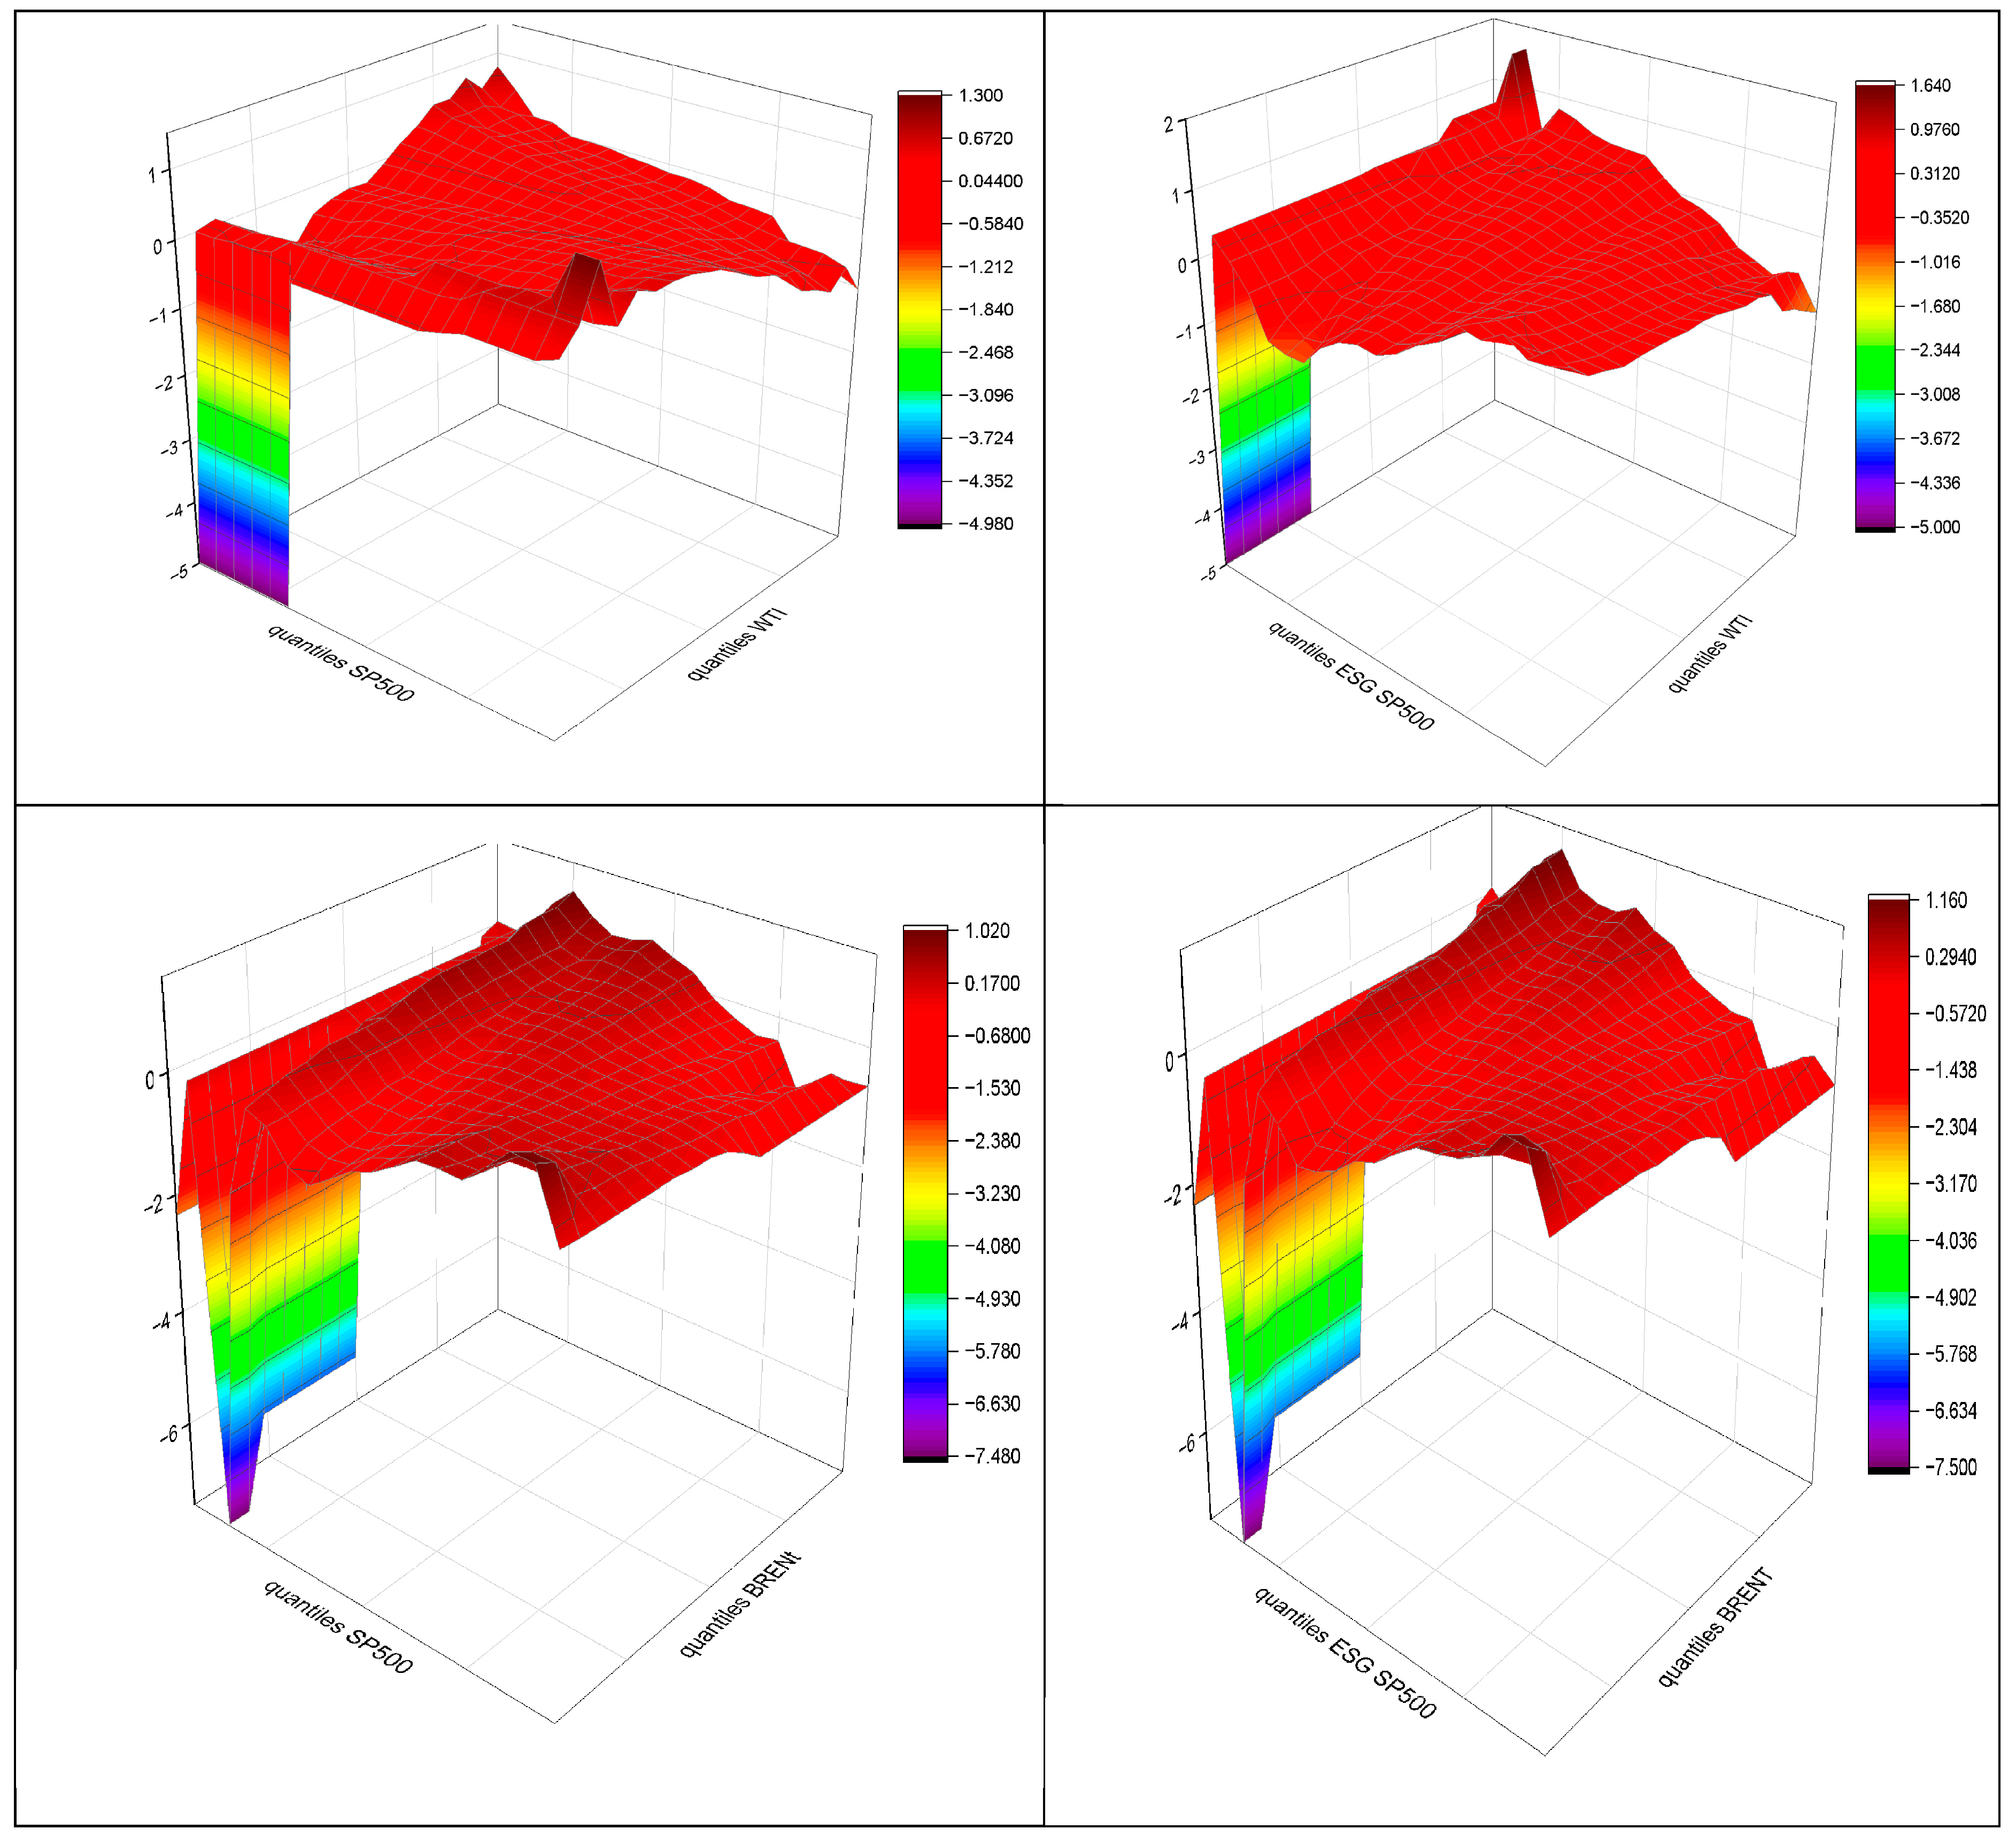
Figure 5 presents a detailed three-dimensional depiction of the impact of WTI and Brent crude oil fluctuations on the conventional S&P 500 (left panel) and the S&P 500 ESG (right panel). The upper and lower plots illustrate the intercept term, specifically the estimate of β 0 θ , τ . Since β 0 θ , τ depends on both θ and τ, its value varies across different quantiles of oil prices and changes in the global stock and ESG markets. In the figure, the Z-axis represents the estimated intercept β 0 θ , τ , the ΔS&P 500 ESG and ΔS&P 500 axes correspond to the θ quantiles of the respective markets, and the OIL axis (WTI or Brent) represents the τ quantiles of global oil prices. Low OIL quantiles indicate low-risk conditions, while high quantiles reflect high-risk states. Similarly, low ΔS&P 500 ESG (or ΔS&P 500) quantiles suggest weak market co-movement, whereas high quantiles indicate strong connectedness. A notable feature across both plots is the similarity in how the two indices respond to oil price fluctuations. Although the S&P 500 and S&P 500 ESG differ in terms of their underlying investment criteria and constituent composition, the similarity in their responses to oil price fluctuations suggests that their linkages to oil markets are largely governed by shared economic and financial mechanisms, such as macroeconomic shocks, investor sentiment, and market liquidity, which influence both conventional and ESG-focused equities in comparable ways. This result is similar to the finding reported by (Tiwari et al., 2025). At a fundamental level, the connection between oil and equity markets are driven by shared mechanisms, irrespective of the investment strategies that define each stock index (Zarrouk & Ouafi, 2025).
Examining the lower quantile of the distributions, which corresponds to period of bearish market sentiment or severe market downturns, the analysis reveals significant negative interactions. Visually, these interactions appear as pronounced “spikes” in the lower corners of the 3D plots, supported by the color spectrum, where dark red indicates strong negative associations. Ivanovski and Hailemariam (2022) suggest that, in times of market distress or economic contraction, crude oil prices and equity markets tend to move in opposite directions. The inverse correlation can be attributed to (i) a “flight-to-safety” effect, in which investors move capital from riskier assets to safer ones such as oil (Chau et al., 2025), and (ii) demand-side shocks, geopolitical risks, and macroeconomic uncertainty, which dampen demand for oil and therefore reduce its price (T. Yang et al., 2023). The text highlights that the two curves sharply decline at the extreme lower quantiles, forming inverted U-shaped patterns. This form is a manifestation of an intensification of the negative correlation as market conditions become more severe and distressed. Examining the higher quantiles of the distribution, which are typically associated with favorable market conditions or economic growth, the analysis reveals a persistently strong negative correlation. The 3D plots visually represent this relationship via downward-sloping curves, with distinct purple peaks appearing in the lower-left quadrant of some plots, underscoring strong negative associations.
The study’s findings are surprising due to robust market conditions. Even when stock markets exhibit stable up-and-down movements, there are extreme scenarios in which WTI oil prices show a strong negative correlation with the conventional stock market returns. The high oil prices can undermine corporate profitability and investor confidence, while aggressive economic measures aimed at curbing inflation driven by rising energy costs may further reinforce this inverse relationship. This also encompasses the impact of Brent crude oil prices, which generally follow a pattern similar to WTI. However, a notable difference is observed as the Brent market shows relatively greater deflation compared to WTI at the extreme ends of the distribution. Brent’s heightened sensitivity across the statistical distribution indicates a stronger capacity to influence market sentiment—both fear and optimism—during periods of market instability or exceptional economic growth.
Despite the amplified negative responses at the distributional extremes, the overall effect of Brent oil on the S&P 500 and S&P 500 ESG closely parallels those observed for WTI across all quantiles. The presence of prominent red areas in various regions of the Brent-related data may signal significant positive effects in certain market segments, as yellow-to-red hues represent favorable relationships. However, these red areas may represent prominent segments within the broader 3D landscape, and their underlying effect—particularly at the extreme quantiles—remains strongly negative, consistent with the WTI results. The consistency between WTI and Brent effects highlights that the mechanisms through which global oil prices influence stock markets are generally applicable to both major crude benchmarks, even though the magnitude and nature of their impacts may differ.

5. Further Analysis

A direct comparison of the visualizations indicates that WTI and Brent crude oil returns exert similar qualitative effects on both the S&P 500 and S&P 500 ESG indices. The main difference lies in the magnitude of these effects, with Brent crude appearing to have a stronger impact, especially at the upper extremes of the market distribution. Owing to Brent’s broader global representation and its central role in determining international oil prices, the large effects may carry more significant economic and psychological implications during periods of crisis or economic expansion. Moreover, positive correlations are consistently observed, particularly during bearish markets when oil and stock markets move in opposite directions, indicating that crude oil can serve as a hedge against stock market downturns. Conversely, the inverse correlation suggests that oil prices may rise when equities underperform, while declining oil prices can coincide with stock market recovery or gains. Despite the S&P 500 ESG’s focus on sustainability, its response patterns closely resemble those of the traditional S&P 500.
Consequently, immediate market reactions driven by macroeconomic factors and significant oil price shocks often dominate or align with ESG investment behavior. Current research suggests that the perceived distinctions between ESG and conventional assets may diminish during periods of heightened systemic risk, as both are influenced by the same macroeconomic factors (e.g., Kölbel et al., 2020). Importantly, the robust conclusions derived from the detailed (QoQ) analysis are supported by complementary econometric methods, such as QVAR analyses (not detailed here but referenced as corroborating evidence). The observed quantitative differences in impact magnitude between WTI and Brent further nuance this understanding.

6. Conclusions and Policy Implications

This study utilizes advanced frequency- and quantile-based econometric techniques to investigate the financial linkages among oil, conventional, and ESG equity returns through a multidimensional analysis. Our analysis reveals that financial linkages are highly dynamic, nonlinear, and shaped by both market structure and investment horizons. The (QoQ) estimates reveal an asymmetric tail dependence. These findings are further supported by the Frequency-QVAR analysis. The transmission of oil shocks into the ESG sector is largely driven by financial contagion, leading to short-term, high-frequency fluctuations. Therefore, ESG assets can be considered as the most effectively diversified in the low-frequency domain through long-term decoupling.
Our results provide evidence that the structural shift away from fossil fuel dependence, inherent in ESG mandates, reduces vulnerability to fundamental and sustained oil market fluctuations. Furthermore, ESG returns demonstrate greater resilience and are more easily leveraged, making them valuable assets for portfolio managers and investors. However, despite these benefits, this instrument offers only partial protection against short-term market panics, which can temporarily link ESG assets to the broader market through high frequency spillovers. For this reason, investing in ESG stock markets requires a strategic, long-term approach to fully capture their fundamental decoupling benefits. The results underscore the importance of regulators and policymakers maintaining macroprudential oversight of the emerging sustainable finance sector.
The resilience of ESG assets differs across asset classes; however, frequent interactions during crises suggest that liquidity and market structure risks remain systemic. Regulators must develop strategies to reduce the spillover of macroeconomic shocks originating from the conventional market, thereby safeguarding the stability and credibility of sustainable finance. Furthermore, these findings can inform regulators in designing incentives for companies to enhance their ESG performance, as improved ESG practices appear to reduce long-term vulnerability to disruptions in oil markets. While ESG stock markets are not entirely immune to extreme events, they exhibit notable resilience, showing lower spillover coefficients in the extreme negative quantiles (crisis periods) compared to conventional assets. Incorporating ESG stocks alongside traditional commodities such as oil may enhance portfolio risk management, improve risk-adjusted returns, and support investors who aim to balance financial performance with sustainability objectives. Further, they appear to act as a hedge against severe oil-driven systemic crises. Future research could incorporate geopolitical risk factors into the Frequency-QVAR model to more accurately isolate the non-economic drivers influencing the oil market’s sensitivity across different regimes.

Author Contributions

Conceptualization, N.K. and W.H.; methodology, W.H.; software, W.H.; validation, N.K.; formal analysis, N.K.; investigation, N.K. and W.H.; resources, N.K.; data curation, N.K.; writing—original draft preparation, W.H.; writing—review and editing, W.H.; visualization, N.K.; supervision, N.K. and W.H.; project administration, N.K. and W.H. All authors have read and agreed to the published version of the manuscript.

Funding

This research received no external funding.

Institutional Review Board Statement

Not applicable.

Informed Consent Statement

Not applicable.

Data Availability Statement

The data of all variables are extracted from DataStream.

Conflicts of Interest

There are no conflicts of interest to declare.

Appendix A

Formally, the frequency response function is as follows: ψ e i ω = h = 0 e i ω ψ h where ( i ) represents the imaginary unit and ω is the frequency. The spectral density of the variable x t at a specific frequency is written as the Fourier transform of the representation of infinite order Quantile Vector Moving Average QVMA ( ) following Wold’s theorem:
S x ω = h = E x i x t h e i ω h = ψ e i ω h t Ψ e + i ω h
The spectral density denoted as S x ω is a combination of the frequency response function and the generalized forecast error variance decomposition which is standardized according to Equation (A2)
θ i j ω = τ i j 1 h = 0 Ψ h e i ω h τ ) i j 2 h = 0 Π Ψ h ( e i ω h τ Ψ τ e i ω h ) i j
θ ~ i j ω = θ i j ω k = 1 N θ i j ω
The interconnectedness is captured by consolidating the measures, with a specific range (d = (a,b): a,b π , π , a < b which is given by:
θ ~ i j d = a b θ ~ i j ω d ω .
The frequency connectedness is derived following Diebold and Yilmaz (2014), who provide the spillover effects over particular frequency intervals (referred to as d):
T O d i = i = 1 , i 1 N θ ~ j i d ,   F R O M d i = i = 1 , i 1 N θ ~ i j d N E T d i = T O d i F R O M d i   a n d   T C I d i = N 1 i = 1 N T O d i = N 1 i = 1 N F R O M d i
where TO, FROM and NET reflect the spillovers to other elements, from other elements and the net directional spillover respectively, while TCI stands for the total connectedness.

References

  1. Alofaysan, H., Si Mohammed, K., Alanzi, E., Benammar, R., & Hassan, F. A. (2026). Assessing the impact of renewable energy firms on ESG-related uncertainty: Evidence from Germany’s low-carbon transition. Journal of Environmental Management, 397, 128215. [Google Scholar] [CrossRef] [Scilit] [PubMed]
  2. Ando, T., Greenwood-Nimmo, M., & Shin, Y. (2022). Quantile connectedness: Modelling tail behaviour in the topology of financial networks. Management Science, 68(4), 2377–3174. [Google Scholar] [CrossRef] [Scilit]
  3. Antonakakis, N., Cunado, J., Filis, G., Gabauer, D., & de Gracia, F. P. (2023). Dynamic connectedness among the implied volatilities of oil prices and financial assets: New evidence of the COVID-19 pandemic. International Review of Economics & Finance, 83, 114–123. [Google Scholar] [CrossRef] [Scilit]
  4. Aromi, D., & Clements, A. (2019). Spillovers between the oil sector and the S&P500: The impact of information flow about crude oil. Energy Economics, 81, 187–196. [Google Scholar] [CrossRef] [Scilit]
  5. Arouri, M., Mhadhbi, M., & Shahrour, M. H. (2025). Dynamic connectedness and hedging effectiveness between green bonds, ESG indices, and traditional assets. European Financial Management, 31(5), 1704–1719. [Google Scholar] [CrossRef] [Scilit]
  6. Awartani, B., & Maghyereh, A. I. (2014). Dynamic spillovers between oil and stock markets in the Gulf Cooperation Council Countries. Energy Economics, 36, 28–42. [Google Scholar] [CrossRef] [Scilit]
  7. Bagchi, B., & Paul, B. (2023). Effects of crude oil price shocks on stock markets and currency exchange rates in the context of Russia-Ukraine conflict: Evidence from G7 countries. Journal of Financial Risk and Management, 16(2), 64. [Google Scholar] [CrossRef] [Scilit]
  8. Banerjee, A. K., Boubaker, S., & Al-Nassar, N. S. (2024). Climate policy initiatives, green finance, and carbon risk interconnectedness. Finance Research Letters, 67, 105776. [Google Scholar] [CrossRef] [Scilit]
  9. Baruník, J., & Kley, T. (2019). Quantile coherency: A general measure for dependence between cyclical economic variables. The Econometrics Journal, Royal Economic Society, 22(2), 131–152. [Google Scholar] [CrossRef] [Scilit]
  10. Beloskar, V. D., & Rao, S. V. D. N. (2022). Did ESG save the day? Evidence from India during the COVID-19 crisis. Asia Pacific Financial Markets, 30, 73–107. [Google Scholar] [CrossRef] [Scilit]
  11. Benlagha, N., & Hemrit, W. (2025). Responses of stock market volatility to COVID-19 government interventions: Evidence from Asian emerging stock markets. Review of Behavioral Finance, 17(2), 342–364. [Google Scholar] [CrossRef] [Scilit]
  12. Berrêdo, P. D., dos Santos, O. M., Abdo, H., da Silva Macedo, H. Á., & Losekann, L. D. (2024). Energy transition: Assessing oil companies’ compliance with their disclosed environmental strategic positioning. Corporate Social Responsibility and Environmental Management, 31(4), 3517–3534. [Google Scholar] [CrossRef] [Scilit]
  13. Bhattacharjee, A., Nandy, M., & Lodh, S. (2024). COVID-19 and persistence in the stock market: A study on a leading emerging market. International Journal of Disclosure and Governance, 22, 520–531. [Google Scholar] [CrossRef] [Scilit]
  14. Bhattacherjee, P., Sibanjan, M., Elie, B., & Jung Bum, W. (2024). ESG, clean energy, and petroleum futures markets: Asymmetric return connectedness and hedging effectiveness. International Review of Economics and Finance, 94, 103375. [Google Scholar] [CrossRef] [Scilit]
  15. Bossman, A., Gubareva, M., & Teplova, T. (2022). Economic policy uncertainty, geopolitical risk, market sentiment, and regional stocks: Asymmetric analyses of the EU sectors. Eurasian Economic Review, 13, 321–372. [Google Scholar] [CrossRef] [Scilit]
  16. Boubaker, S., & Jouini, J. (2014). Linkages between emerging and developed equity markets: Empirical evidence in the PMG framework. The North American Journal of Economics and Finance, 29, 322–335. [Google Scholar] [CrossRef] [Scilit]
  17. Broadstock, D., Chan, K., Cheng, L. T. W., & Wang, X. W. (2020). The role of ESG performance during times of financial crisis: Evidence from COVID-19 in China. Finance Research Letters, 38, 101716. [Google Scholar] [CrossRef] [Scilit]
  18. Cao, L., Sun, R., Ma, T., & Liu, C. (2023). On asymmetric correlations and their applications in financial markets. Journal of financial Risk Financial Management, 16(3), 187. [Google Scholar] [CrossRef] [Scilit]
  19. Chancharat, S., & Sinlapates, P. (2023). Dependences and dynamic spillovers across the crude oil and stock markets throughout the COVID-19 pandemic and Russia-Ukraine conflict: Evidence from the ASEAN+6. Finance Research Letters, 57, 104249. [Google Scholar] [CrossRef] [Scilit]
  20. Chatziantoniou, I., Abakah, E. J. A., Gabauer, D., & Tiwari, A. K. (2022). Quantile time–frequency price connectedness between green bond, green equity, sustainable investments and clean energy markets. Journal of Cleaner Production, 361, 132088. [Google Scholar] [CrossRef] [Scilit]
  21. Chau, L., Anh, L., & Duc, V. (2025). Valuing ESG: How financial markets respond to corporate sustainability. International Business Review, 34(3), 102418. [Google Scholar] [CrossRef] [Scilit]
  22. Chen, G., Fang, S., Chen, Q., & Zhang, Y. (2023). Risk spillovers and network connectedness between clean energy stocks, green bonds, and other financial assets: Evidence from China. Energies, 16(20), 7077. [Google Scholar] [CrossRef] [Scilit]
  23. Chen, J., Liang, Z., Ding, Q., & Liu, Z. (2022). Quantile connectedness between energy, metal, and carbon markets. International Review of Financial Analysis, 83, 102282. [Google Scholar] [CrossRef] [Scilit]
  24. Chen, Y., & Lin, B. (2022). Quantifying the extreme spillovers on worldwide ESG leaders’ equity. International Review of Financial Analysis, 84, 102425. [Google Scholar] [CrossRef] [Scilit]
  25. Covachev, S., Martel, J., & Brito-Ramos, S. (2025). Are ESG factors truly unique? The North American Journal of Economics and Finance, 77, 102386. [Google Scholar] [CrossRef] [Scilit]
  26. Cui, J., Maghyereh, A., & Ziadat, S. (2025). Crude oil, forex, and stock markets: Unveiling the higher-order moment and cross-moment risk spillovers in times of turmoil. Humanities and Social Sciences Communications, 12, 1158. [Google Scholar] [CrossRef] [Scilit]
  27. de la Fuente, G., Ortiz, M., & Velasco, P. (2025). Business diversification and ESG engagement: Riding tandem to risk reduction and value creation? Journal of Business Research, 200, 115676. [Google Scholar] [CrossRef] [Scilit]
  28. Deloitte. (2022). Does a company’s ESG score have a measurable impact on its market value? Swiss Financial Market Supervisory Authority. [Google Scholar]
  29. Diebold, F. X., & Yilmaz, K. (2014). On the network topology of variance decompositions: Measuring the connectedness of financial firms. Journal of Econometrics, 182(1), 119–134. [Google Scholar] [CrossRef] [Scilit]
  30. Dutta, A., Jana, R. K., & Das, D. (2020). Do green investments react to oil price shocks? Implications for sustainable development. Journal of Cleaner Production, 266(1), 121956. [Google Scholar] [CrossRef] [Scilit]
  31. Elsayed, A. H., Khalfaoui, R., Nasreen, S., & Gabauer, D. (2024). The impact of oil shocks on green, clean, and socially responsible markets. Energy Economics, 136, 107729. [Google Scholar] [CrossRef] [Scilit]
  32. Escribano, A., Koczar, M. W., Jareño, F., & Esparcia, C. (2023). Shock transmission between crude oil prices and stock markets. Resources Policy, 83, 103754. [Google Scholar] [CrossRef] [Scilit]
  33. Fueki, T., Higashi, H., Higashio, N., Nakajima, J., Ohyama, J. S., & Tamanyu, Y. (2018). Identifying oil price shocks and their consequences: The role of expectations in the crude oil market (BIS Working Papers No 725). BIS. [Google Scholar]
  34. Ghallabi, F., Souissi, B., Du, A. M., & Ali, S. (2025). ESG stock markets and clean energy prices prediction: Insights from advanced machine learning. International Review of Financial Analysis, 97, 103889. [Google Scholar] [CrossRef] [Scilit]
  35. Hemrit, W., Benlagha, N., Ben Arous, R., & Ben Arab, M. (2023). Exploring the time-frequency connectedness among non-fungible tokens and developed stock markets. Intelligent Systems in Accounting, Finance and Management, 30(4), 192–207. [Google Scholar] [CrossRef] [Scilit]
  36. Hsu, T.-J., & Huang, A. Y. (2024). On the resilience of US ESG stocks: Evidences from the COVID-19 market crashes. Economics Letters, 235, 111532. [Google Scholar] [CrossRef] [Scilit]
  37. Husain, S., Tiwari, A. K., Sohag, K., & Shahbaz, M. (2019). Connectedness among crude oil prices, stock index and metal prices: An application of network approach in the USA. Resources Policy, 62, 57–65. [Google Scholar] [CrossRef] [Scilit]
  38. Ivanovski, K., & Hailemariam, A. (2022). Time-varying geopolitical risk and oil prices. International Review of Economics & Finance, 77, 206–221. [Google Scholar] [CrossRef] [Scilit]
  39. Kang, W., Ratti, R. A., & Yoon, K. H. (2014). The impact of oil price shocks on U.S. bond market returns. Energy Economics, 44, 248–258. [Google Scholar] [CrossRef] [Scilit]
  40. Kilian, L. (2009). Not all oil price shocks are alike: Disentangling demand and supply shocks in the crude oil market. American Economic Review, 99(3), 1053–1069. [Google Scholar] [CrossRef] [Scilit]
  41. Koenker, R., & Xiao, Z. (2006). Quantile autoregression. Journal of the American Statistical Association, 101, 980–990. [Google Scholar] [CrossRef] [Scilit]
  42. Konstantakis, K. N., Koulmas, P., Michaelides, P. G., Porcher, T., & Prelorentzos, A.-G. N. (2025). Green bonds & clean energy in sustainable finance: Evidence from DCC-GARCH connectedness. International Review of Financial Analysis, 103, 104168. [Google Scholar] [CrossRef] [Scilit]
  43. Kölbel, J. F., Heeb, F., Paetzold, F., & Busch, T. (2020). Can sustainable investing save the world? Reviewing the mechanisms of investor impact. Organization & Environment, 33(4), 554–574. [Google Scholar] [CrossRef] [Scilit]
  44. Lai, F., Li, S., Lv, L., & Zhu, S. (2023). Do global geopolitical risks affect connectedness of global stock market contagion network? Evidence from quantile-on-quantile regression. Frontiers in Physics, 11, 1124092. [Google Scholar] [CrossRef] [Scilit]
  45. Liu, X. (2017). Measuring systemic risk with regime switching in tails. Economic Modelling, 67, 55–72. [Google Scholar] [CrossRef] [Scilit]
  46. Long, S., & Liang, J. (2018). Asymmetric and nonlinear pass-through of global crude oil price to China’s PPI and CPI inflation. Economic Research-Ekonomska Istraživanja, 31(1), 240–251. [Google Scholar] [CrossRef] [Scilit]
  47. Malik, F., & Umar, Z. (2024). Quantile connectedness of oil price shocks with socially responsible investments. The North American Journal of Economics and Finance, 70, 102066. [Google Scholar] [CrossRef] [Scilit]
  48. Maraqa, B., & Bein, M. (2020). Dynamic interrelationship and volatility spillover among sustainability stock markets, major European conventional indices, and international crude oil. Sustainability, 12(9), 3908. [Google Scholar] [CrossRef] [Scilit]
  49. Mensi, W., Aslan, A., Vo, X. V., & Kang, S. H. (2023). Time-frequency spillovers and connectedness between precious metals, oil futures and financial markets: Hedge and safe haven implications. International Review of Economics & Finance, 83, 219–232. [Google Scholar] [CrossRef] [Scilit]
  50. Nautiyal, N., Rehman, M. U., & Vo, X. V. (2025). Oil futures and ESG performance: Analyzing the balance between sustainability and asymmetry. Sustainable Futures, 10, 101146. [Google Scholar] [CrossRef] [Scilit]
  51. Özdurak, C., & Yantur, P. (2025). The US reciprocal tariff announcement: An analysis of market reactions. Journal of Risk Financial Management, 18(10), 565. [Google Scholar] [CrossRef] [Scilit]
  52. Sharif, A., Afshan, S., & Qureshi, M. A. (2019). Idolization and ramification between globalization and ecological footprints: Evidence from quantile-on-quantile approach. Environmental Science and Pollution Research International, 26(11), 11191–11211. [Google Scholar] [CrossRef] [Scilit]
  53. Sharma, C., & Rani, P. (2025). Dynamic Interconnectedness of ESG indices and crude oil prices: A wavelet coherence approach in Asia-Pacific markets. Australian Economic Paper, 26(23), 289–298. [Google Scholar] [CrossRef] [Scilit]
  54. Sim, N., & Zhou, H. (2015). Oil prices, US stock return, and the dependence between their quantiles. Journal of Banking & Finance, 55, 1–8. [Google Scholar] [CrossRef] [Scilit]
  55. Singh, A. (2020). COVID-19 and safer investment bets. Finance Research Letters, 36, 101729. [Google Scholar] [CrossRef] [Scilit] [PubMed]
  56. Sirin, S. M., & Yilmaz, B. N. (2024). Energy transition and non-energy firms’ financial performance: Do markets value capability-based energy transition strategies? Energy Economics, 136, 107658. [Google Scholar] [CrossRef] [Scilit]
  57. Tiwari, A. K., Dam, M. M., Altıntaş, H., & Bekun, F. V. (2025). The dynamic connectedness between oil price shocks and emerging market economies stock markets: Evidence from new approaches. Energy Economics, 141, 108101. [Google Scholar] [CrossRef] [Scilit]
  58. Wang, Y., Ali, S., & Ayaz, M. (2024). Equity markets and ESG dynamics: Assessing spillovers and portfolio strategies through time-varying parameters. Energy Economics, 134, 107548. [Google Scholar] [CrossRef] [Scilit]
  59. Yamini, E., Khazaei, H., Soltani, M., Alfraidi, W., & Kyriakopoulos, G. L. (2025). Emerging technologies in renewable energy: Risk analysis and major investment strategies. Sustainable Futures, 9, 100736. [Google Scholar] [CrossRef] [Scilit]
  60. Yang, T., Zhou, F., Du, M., Du, Q., & Zhou, S. (2023). Fluctuation in the global oil market, stock market volatility, and economic policy uncertainty: A study of the US and China. The Quarterly Review of Economics and Finance, 87, 377–387. [Google Scholar] [CrossRef] [Scilit]
  61. Yang, X., Hassan, A. F. S., & Karbhari, Y. (2025). Can good ESG performance help companies resist external shocks? Investment Analysts Journal, 54(4), 586–610. [Google Scholar] [CrossRef] [Scilit]
  62. Zarrouk, H., & Ouafi, M. K. (2025). Oil prices, sustainability initiatives, and stock market dynamics: Insights from the MSCI UAE index. Journal of Risk Financial Management, 18(6), 314. [Google Scholar] [CrossRef] [Scilit]
  63. Zhang, Q., Hu, Y., Jiao, J., & Wang, S. (2024). The impact of Russia–Ukraine war on crude oil prices: An EMC framework. Humanities and Social Sciences Communications, 11, 8. [Google Scholar] [CrossRef] [Scilit]
  64. Zhang, Z., & Chen, Y. (2021). Tail risk early warning system for capital markets based on machine learning algorithms. Computational Economics, 60, 901–923. [Google Scholar] [CrossRef] [Scilit]
Figure 1. Steps for conducting empirical research.
Jrfm 19 00151 g001
Figure 2. Time series plots (stock returns).
Jrfm 19 00151 g002
Figure 3. The dynamic connectedness (lower quantile—q = 0.05).
Jrfm 19 00151 g003
Figure 4. The network connectedness between crude oil and stock returns. Note: Network visualization of net pairwise directional connectedness. Note: Blue (yellow) denotes the net transmitter (receiver) of risk contagion (τ = 0.05).
Jrfm 19 00151 g004
Figure 5. The (QoQ) between oil and stock returns. Note. Each 3D surface plot illustrates the relationship between the quantiles of each asset (stock) return (horizontal axis) and the quantiles of the respective variable (depth axis), with the vertical axis representing the estimated QoQ coefficient. These visualizations highlight the heterogeneity in the dependence structure across the distribution of the variables considered.
Jrfm 19 00151 g005
Table 1. Definitions and data sources.
AcronymVariableSource
WTIWest Texas Intermediate oil pricehttps://www.eia.gov (accessed on 15 September 2025).
BRENTBrent oil, or Brent Crude, is a light, sweet crude blend extracted from the North Sea. It serves as a key global benchmark, particularly for oil from Europe, Africa, and the Middle East destined for western markets, and is valued for its ease of refining and transport.https://www.eia.gov (accessed on 15 September 2025).
S&P 500 ESGThe S&P 500 Scored & Screened Index, formerly the S&P 500 ESG Index, is a broad, market-capitalization-weighted index that tracks the performance of S&P 500 companies meeting specific ESG criteria. It screens companies according to their compliance with Environmental, Social, and Governance (ESG) criteria, taking into account both industry exclusions and ESG performance scores. The index seeks to preserve industry weights comparable to the S&P 500 while emphasizing improved ESG performance.https://www.investing.com/indices/s-p-500-esg (accessed on 15 September 2025).
S&P 500The S&P 500 is widely regarded as the best single gauge of large-cap U.S. equities. The index includes 500 leading companies and covers approximately 80% of available market capitalizationhttps://fr.investing.com/indices/us-spx-500 (accessed on 15 September 2025).
Table 2. Descriptive statistics.
BRENTWTIS&P 500ESG.S&P 500
Mean−0.435−0.4870.3980.36
Variance15.17915.3664.884.826
Skewness−0.565 **−0.294−0.851 ***−0.806 ***
Ex.Kurtosis0.512−0.224.191 ***3.767 ***
JB5.129 *1.31468.192 ***55.968 ***
ERS−1.229−2.072 **−0.959−0.908
Q(10)8.7236.8161.641.735
Q2(10)8.6796.3136.0255.37
Note. *, ** and *** indicate significance at the 10%, 5% and 1% level, respectively.
Table 3. The static frequency connectedness.
BRENTWTIS&P 500S&P 500 ESGFROM
Panel A: Total connectedness
BRENT24.824.7825.5224.8975.2
WTI20.7927.2426.8125.1672.76
S&P 50020.0621.5429.5828.8270.42
S&P 500 ESG19.9421.929.3428.8271.18
TO60.7868.2281.6878.87289.55
Inc.Own85.5995.46111.26107.69cTCI/TCI
Net−14.41−4.5411.267.6996.52/72.39
BRENTWTIS&P 500S&P 500 ESGFROM
Panel B: Short-term connectedness
BRENT18.4518.818.5718.2355.61
WTI15.9721.920.4519.1855.61
S&P 50013.5415.0119.2119.0447.6
S&P 500 ESG13.0915.2818.818.6747.17
TO42.6149.157.8256.45205.98
Inc.Own61.0671.0177.0375.13cTCI/TCI
Net−13−6.5110.229.2868.66/51.50
BRENTWTIS&P 500S&P 500 ESGFROM
Panel C: Long-term connectedness
BRENT6.355.986.956.6619.59
WTI4.815.346.365.9717.15
S&P 5006.516.5310.379.7822.82
S&P 500 ESG6.856.6110.5510.1524.01
TO18.1719.1223.8622.4283.57
Inc.Own24.5324.4534.2332.56cTCI/TCI
Net−1.411.971.04−1.5927.86/20.89
Notes: The short-term horizon is defined as up to 6 weeks (capturing dynamics from 1 to 6 weeks), whereas the long-run horizon extends from 6 weeks to infinity. Each column represents the shock spillovers transmitted from a given index to all other indices listed in the rows.
Disclaimer/Publisher’s Note: The statements, opinions and data contained in all publications are solely those of the individual author(s) and contributor(s) and not of MDPI and/or the editor(s). MDPI and/or the editor(s) disclaim responsibility for any injury to people or property resulting from any ideas, methods, instructions or products referred to in the content.