Article

Enforcing Good Deeds: Investment Efficiency of Indian Firms Going Through CSR Law

1
School of Innovation, Design and Technology, Wellington Institute of Technology, Lower Hutt 5012, New Zealand
2
School of Accountancy, Economics and Finance, Massey University, Auckland 0632, New Zealand
3
School of Accountancy, Economics and Finance, Massey University, Palmerston North 4442, New Zealand
4
School of Accountancy, Economics and Finance, Massey University, Wellington 6140, New Zealand
*
Author to whom correspondence should be addressed.
J. Risk Financ. Manag. 2026, 19(1), 61; https://doi.org/10.3390/jrfm19010061
Submission received: 12 December 2025 / Revised: 6 January 2026 / Accepted: 6 January 2026 / Published: 13 January 2026
(This article belongs to the Special Issue Corporate Finance and ESG: Shaping the Future of Sustainable Business)

Abstract

With the enactment of the 2013 government mandate, Indian corporations meeting specific criteria no longer have the discretion to forgo CSR expenditures. Previous studies have reported negative capital market reactions to this regulatory intervention. In contrast, our study offers a long-term perspective on the impact of the CSR law on firms’ investment efficiency. Using a difference-in-differences framework, this study examines publicly listed Indian firms from 2011 to 2018, capturing a clean pre- and post-mandate window that isolates the structural impact of the CSR law while excluding confounding and shocks such as the COVID-19 crisis. Thus, the paper focuses on identifying the long-term institutional and structural effects of CSR rather than short-term cyclical fluctuations. We find that the CSR law leads to an increase in the investment efficiency of affected firms, driven primarily by reductions in agency conflicts and information asymmetry. This effect is more pronounced among firms with a strong presence of active monitoring groups, such as Hindu-owned promoters and institutional investors. Improved efficiency is also profound among firms located in areas with a lower Human Development Index (HDI) and Gender Diversity Index (GDI). Our findings demonstrate the positive impact of mandatory CSR law on capitalism and present insights for policymakers for regulators as ESG and CSR mandates are increasingly debated and adopted.

1. Introduction

Should companies be socially responsible, and if so, how should they implement such responsibility? Under a voluntary corporate social responsibility (CSR) regime, firms often face the following dilemma: while engaging in socially responsible activities may enhance reputation and stakeholder trust, these efforts do not always translate into measurable financial returns. Milton Friedman, one of the most influential advocates of free-market capitalism, views CSR as a source of conflict between stakeholders and managers, asserting that businesses should focus solely on profit maximization to safeguard shareholders’ interests—“one firm, one hat” (Friedman, 1970). In contrast, modern scholars like Alex Edmans (Edmans, 2023) argue that companies prioritizing social responsibility can do well financially, generating sustainable, long-term value, while contemporary empirical studies document positive links between CSR, firm performance, and capital allocation efficiency (Albuquerque et al., 2019). When CSR practices are widely adopted and internalized as corporate norms, they expand society’s overall welfare, demonstrating that what benefits society can also benefit business. However, with both schools of thought supported by substantial empirical evidence, many firms struggle to take a clear stance on CSR. This uncertainty often results in hesitation, leading some businesses either to neglect genuine CSR initiatives or to engage superficially in greenwashing.
An alternative approach to address the above dilemma is to mandate CSR. By introducing a structured “social tax” through compulsory CSR expenditure requirements, policymakers effectively remove the burden from corporate managers regarding whether and how to engage in socially responsible activities. This raises a fundamental question: Does mandatory CSR conflict with capitalist principles? However, this approach raises another important question: Does mandating CSR come at the expense of the principles of capitalism? India provides a unique setting to address this question empirically, as it was one of the first countries to introduce a mandatory CSR law. In this study, we investigate the effect of the mandatory Indian CSR Law on a firm’s investment efficiency. Specifically, S-135 of the Companies Act (2013) mandates that firms meeting certain thresholds (as discussed in Section 3.2) engage in prescribed CSR activities by spending at least 2% of their net profits (Dharmapala & Khanna, 2018).
Existing studies by Manchiraju and Rajgopal (2017) and Dharmapala and Khanna (2018) highlight negative short-run effects of the CSR law on firm value. We revisit this debate from a longer-term perspective by examining its impact on investment efficiency rather than short-term market reactions. Compliance with the law requires structured procedures, including the creation of a CSR committee, which strengthens governance and accountability. Enhanced monitoring, particularly in firms with active ownership structures or vigilant investors, reduces agency problems and contributes to more efficient investment planning. Another important aspect of the CSR law is its mandatory disclosure requirements. Firms meeting the CSR thresholds must publicly report their CSR activities, thereby increasing transparency. Several studies have shown that corporate disclosure reduces information asymmetry and agency costs, improving investment efficiency (Biddle et al., 2009; McNichols & Stubben, 2008). Thus, we hypothesize that CSR law improves the investment efficiency of affected Indian firms by reducing agency problems and information asymmetry issues.
Using a difference-in-differences (DID) research design, we examine all publicly listed Indian firms from 2011 to 2018, comparing investment efficiency changes among firms affected by mandatory CSR spending with comparable firms that do not meet the thresholds of compulsory CSR spending. Using the pre-pandemic period as a benchmark, our study illustrates how CSR mandates affect investment efficiency under relatively stable and comparable economic conditions. The research seeks to identify long-term institutional and structural effects of CSR rather than short-term cyclical effects. The mechanisms through which CSR regulation affects investment efficiency, information asymmetry, and agency costs are long-term firm fundamentals. It is crucial to establish these foundational effects before assessing whether subsequent shocks will alter them. Further, extending the sample beyond 2018 would introduce major confounding events—most notably the COVID-19 pandemic (2020–2022)—that would fundamentally disrupt investment behavior, capital allocation, and corporate priorities. As a result, it would be difficult to isolate the impact of the CSR law from pandemic-related shocks, policy interventions, and emergency corporate responses. Nonetheless, the findings remain relevant to even more recent contexts as India’s CSR regime has largely remained unchanged in its core structure, and many emerging economies are actively debating or implementing ESG and CSR regulations. Consequently, these findings offer valuable insights into the long-run implications of compulsory CSR in terms of firm behavior, governance, and capital allocation, thus facilitating both academic research and policy design in the current regulatory environment.
Our findings indicate that, following the CSR law, firms required to implement CSR mandates exhibit significantly better investment efficiency compared to other similar unaffected firms (matched on characteristics relevant to investment efficiency). These improvements in investment efficiency are consistent with previous research that highlights the promoting role of CSR activities on investment efficiency (Cheng et al., 2014; Stein, 2003; El Ghoul et al., 2011; Samet & Jarboui, 2017). This reflects that CSR-affected firms may enhance resource allocation, maximize returns, and foster sustainable growth.
We investigate how the relationship between investment efficiency and the CSR law varies in different sub-samples. If the improvement in investment efficiency arises from reduced agency problems, this relationship should depend on how effectively stakeholders are willing and able to monitor managerial responses to CSR law compliance. In India, Hindu undivided families (HUFs) provide a unique cultural aspect. A HUF consists of lineal descendants of a common ancestor, including sons, daughters, spouses, and grandchildren, and allows joint family ownership of property. We also expect institutional owners to play a strong monitoring role in Indian firms. Our sub-sample analysis shows that HUF firms and firms with institutional investors experience improvement in investment efficiency after the CSR law. Our findings are broadly consistent with the prior literature, highlighting the promoter’s alignment effect (Chrisman et al., 2007; Zellweger et al., 2010) and institutional investors leading to better corporate governance (Bushee et al., 2014; Gillan & Starks, 2003). Further, we perform a subsample test to examine how mandatory CSR spending affects investment efficiency across different business types, including corporate groups, private firms, government subsidiaries, and foreign companies. Our findings indicate that privately owned firms experience improvements in investment efficiency following the CSR law. Lastly, we investigate the effects of firm location on the relationship between investment efficiency and CSR law. We find that Indian companies located in low-human development and low-gender-development regions increase their CSR spending and disclosures post the CSR law than their counterparts, which leads to improvements in investment efficiency.
Our study contributes to the literature in two significant ways. First, we advance the debate on the government’s role in mandating CSR. Mandated CSR is especially relevant in economies with weak corporate accountability, but governments rarely adopt it due to its unpopularity. India’s CSR law provides a unique context to explore this question. Existing studies, such as Manchiraju and Rajgopal (2017), report a 4.1% average drop in stock prices for firms affected by the law, suggesting that mandated CSR may conflict with traditional capitalist views (Friedman, 1970). In contrast, our findings demonstrate that mandatory CSR can yield positive outcomes, such as improved investment efficiency, particularly in emerging economies, justifying government intervention. Second, we highlight the indirect benefits of CSR activities. Although CSR initiatives may initially appear to have negative net present value, compliance with CSR law reduces market frictions and ultimately enhances firm value by improving investment efficiency. Our results show that firms facing significant agency issues or information asymmetry benefit most from improved investment efficiency, challenging the notion that mandatory CSR is inherently detrimental to capitalism.

2. Background of Section 135 of Indian Companies Act (2013)1

While India is one of the fastest-growing major economies in the world, it also faces profound socioeconomic challenges, such as significant wealth inequality, infrastructure gaps, and diverse development needs across its vast population. In order to eliminate these social disparities, the Government of India became a global pioneer by mandating corporate social responsibility. In 2013, the government implemented Section 135 of the Companies Act to ensure that social benefits from economic liberalization are shared more equitably with the communities (Dharmapala & Khanna, 2018). As a result, corporations have become crucial partners in nation-building rather than merely profit-driven organizations.
To the best of our knowledge, the Government of India is among the first (if not only) to require companies to allocate a percentage of their profits to socially responsible activities. The Government of India introduced Section 135 in the Companies Act of 2013 as a legal requirement for companies to engage in CSR activities in their business operations to encourage meaningful contributions to communities. Section 135 of the Companies Act 2013 lays out the approach to CSR in two broad steps—first, by identifying which firms are subject to Section 135, and second, by defining their obligations. CSR law has been a significant change in Indian corporate governance as it forces companies to take on CSR practices as a compulsory part of their business strategy based on specific fixed criteria. It has been a significant change in Indian corporate governance as it forces companies to incorporate CSR practices into their business strategy based on certain fixed criteria. It has been a significant change in Indian corporate governance as it forces companies to incorporate CSR practices into their business strategy based on certain fixed criteria. According to the Indian Companies Act, 2013, Section 135, companies with (1) a net worth of INR (Indian Rupees) 5 billion or more, or (2) sales of INR 10 billion or more, or (3) a net profit of INR 50 million are required to spend 2% of their average net profit, calculated over three years, on corporate social responsibility activities of the following years. Schedule VII of the Companies Act 2013 describes the activities that the companies can undertake to accomplish their CSR projects/programs. Importantly, affected Indian companies must set up a CSR committee whose primary function is to develop an annual sustainability plan and recommend it to the board.After a fiscal year has ended, if the company has unspent funds unrelated to ongoing projects, it must transfer them to the Government CSR Fund within six months. This transfer ensures that idle funds are redirected into social projects, which prevents idle funds from accumulating. Regarding the timeline, from 1 April 2014, the CSR law became effective, which means it first became applicable in the fiscal year ending March 2015 (Roy et al., 2022).

3. Literature Review and Hypothesis

3.1. Background on CSR Legality and Its Potential Link to Investment Efficiency

As mentioned in the introduction, CSR is an interesting enigma to the worldwide business sector. While most agree with the need for corporations to be responsible for society, whether CSR activities ultimately hurt or harm capitalistic ventures is still largely controversial. Critics argue that CSR imposes costs and creates agency conflicts. According to Friedman (1970), CSR diverts management’s attention from shareholder interests. Further, Preston and O’Bannon (1997) perceive it as excessive overinvestment, which can drain company resources (Vance, 1975), and CSR issues are often framed as agency issues (Bénabou & Tirole, 2010).
Despite this debate, CSR has been extensively re-conceptualized in recent years to include broader sustainability priorities and stakeholder capitalism. While Aguinis and Glavas (2019) emphasize the importance of long-term value creation for firms and societal stakeholders. According to Kim et al. (2015), CSR strategy is now embedded into core business models, indicating a shift from peripheral “good deeds” to strategic corporate imperatives. As a result, CSR is no longer a monolithic construct, but a dynamic set of practices shaped by institutional, regulatory, and market forces.
Globally, regulators in most countries still limit themselves to only mandating CSR disclosures. In other words, most of the world is still on the “voluntary CSR regime”. This is perhaps due to the controversial and complex nature of CSR values. The exception to the world is India. India’s approach to CSR is notably rigorous compared to many other countries, and it has one of the best-known mandatory CSR laws in the world. However, studies on the impact of India’s CSR Law on the business community still need to be more extensive in the literature. Importantly, far less attention has been paid to how mandatory CSR affects firms’ internal decision-making processes, as well as long-term outcomes such as investment efficiency, governance, and capital allocation. This gap in the literature has been highlighted by recent empirical studies (Ioannou & Serafeim, 2019; Liang & Chen, 2024).
We predict that firms that are subject to more stringent government control are less likely to engage in irresponsible investment activities, and mandatory CSR disclosure should strengthen monitoring, reduce agency problems, lower information asymmetry, and improve investment decisions. Furthermore, recent research in finance and business ethics suggests that compulsory CSR regimes can enhance firms’ ability to undertake profitable projects by disciplining management behavior and encouraging long-term investment (Attig et al., 2016; Benlemlih & Bitar, 2018). Makosa et al. (2020) emphasize that government support is essential for effective CSR disclosure. As discussed in Section 2, India’s CSR law elevates firms’ planning and disclosure processes, which should enhance investment efficiency. Thus, affected firms are expected to allocate capital more effectively than non-mandated peers. Based on the above discussion, we propose the following hypothesis:
H1. 
After the CSR Law 2013, Indian firms that meet the criteria and are mandated to spend on CSR activities experience improved investment efficiency.

3.2. Mechanisms Tests How the CSR Law Improves the Investment Efficiency of Affected Firms

3.2.1. Financial Reporting Quality and Investment Efficiency

Reiterating further from the previous section, we argue that additional protocols surrounding disclosure requirements under the CSR law significantly improve the information environment for Indian companies. In the same vein as Cho et al. (2013), CSR performance helps investors by reducing information asymmetry, and regulatory intervention addresses the adverse selection problem faced by less-informed investors. Attig et al. (2012) and Lopatta et al. (2016) provide evidence supporting the role of CSR in improving firms’ information quality. In their study, Bushman et al. (2001) state that firms with higher levels of information disclosure are better at allocating capital, improving credit allocation efficiency, and improving investment performance. According to the existing CSR literature, CSR disclosures improve transparency while reducing information asymmetry (Dhaliwal et al., 2011; Orlitzky et al., 2003). Under mandatory CSR laws, when firms must disclose all CSR-related information (Ioannou & Serafeim, 2019), overall information asymmetry should be reduced.
More specifically, mandatory disclosures, such as financial reporting, positively affect the information environment, providing firms more access to external resources (Dhaliwal et al., 2011; F. Chen et al., 2011; Goss & Roberts, 2011). A study by Biddle et al. (2009) for publicly traded firms and a study by F. Chen et al. (2011) for privately held firms from emerging markets investigated how FRQ affects investment efficiency and found that companies with high FRQ make more investments, while companies with low FRQs decrease their investment levels. Bushman and Smith (2001) and McNichols (2002) argue that high-quality financial information reduces information asymmetry and assists managers with identifying profitable and unprofitable investment opportunities. Managers also use financial information to monitor investment decisions (Bushman & Smith, 2001). FRQ alleviates investment–cash flow sensitivity, while earnings management causes overinvestment as it distorts managers’ information significantly when managers increase discretionary accruals positively (McNichols & Stubben, 2008; Biddle et al., 2009). Based on the above discussion, we postulate that after the implementation of the CSR law, there is greater transparency and lower information asymmetry, leading to higher investment efficiency for firms in the treatment group. Thus, we propose the following hypothesis:
H2. 
Indian CSR Law improves affected firms’ information environment and therefore enhances their investment efficiency.

3.2.2. CSR Performance, Agency Costs, and Investment Efficiency

According to the Indian CSR Law, affected companies must also provide detailed information regarding their CSR policy, initiatives, and expenditures to outsiders (Dharmapala & Khanna, 2018). Plus, several provisions in the CSR law may act as external governance mechanisms and reduce issues associated with the mismanagement of CSR funds (Ferrell et al., 2016). Consequently, firms are more likely to allocate their resources efficiently, improving investment efficiency and further mitigating agency conflicts. In addition, previous studies show that conflicts between minority and controlling shareholders significantly affect firms’ investment decisions (Jensen, 1986; Jiang et al., 2010, p. 20; Luo et al., 2015; Myers & Majluf, 1984). The agency issue occurs when a company’s management or controlling shareholders exploit its resources for their benefit against the interests of other shareholders, including minority stakeholders (Denis & McConnell, 2003; Djankov et al., 2008; Gillan, 2006; Hermalin, 2005; Jensen & Meckling, 1976; Shleifer & Vishny, 1997).
Conflict resolution theory suggests that CSR investments and spending may minimize stakeholder group conflicts, enhancing shareholder value (Jensen, 2001; Scherer et al., 2006). A study by Andrén and Jankensgård (2015) suggests that investment–cash flow sensitivity increases during periods of abundance, indicating that free cash flow is related to agency problems. Thus, the lack of free cash flow in CSR spending prevents managers from pursuing unprofitable projects (Jensen, 1986). Harjoto and Jo (2011) assert that firms use governance mechanisms and CSR to resolve conflicts between managers and non-investing stakeholders, which may enhance the value of their firms. According to Eccles et al. (2014), companies with high sustainability levels implement rigorous stakeholder engagement processes, which curb short-term opportunism. In sum, we conjecture that compulsory CSR spending and protocols surrounding it promote/facilitate effective monitoring by interested parties outside the firm. In turn, reducing agency issues leads to less deviation from optimal investment decisions (e.g., improvements in investment efficiency) among firms affected by the Indian CSR Law. We propose the following hypothesis:
H3. 
Indian CSR Law reduces affected firms’ agency problem and therefore enhances their investment efficiency.

4. Data and Methodology

4.1. Sample and Data

We obtain data from the Prowess database maintained by the Centre for Monitoring the Indian Economy (CMIE). Prowess provides data on companies listed on the National Stock Exchange of India Ltd., New Delhi, India (NSE) and the Bombay Stock Exchange (BSE), Bombay, India. The prowess database is a mainstream database for research in Indian firms (Manchiraju & Rajgopal, 2017; Dharmapala & Khanna, 2018; Roy et al., 2022). The study uses a sample of all publicly listed non-financial companies in India for the period 2011–2018 that have data available for our analysis. The study examines the long-term institutional effects of mandatory CSR on investment efficiency under relatively stable and comparable economic conditions by examining this pre-pandemic period. A sample beyond 2018 would introduce major confounding factors, most notably COVID-19, that could obscure the causal impact of the CSR mandate. Nonetheless, India’s CSR framework is largely unchanged, and mandatory ESG regulations are increasingly debated globally; the findings remain relevant to more recent contexts.
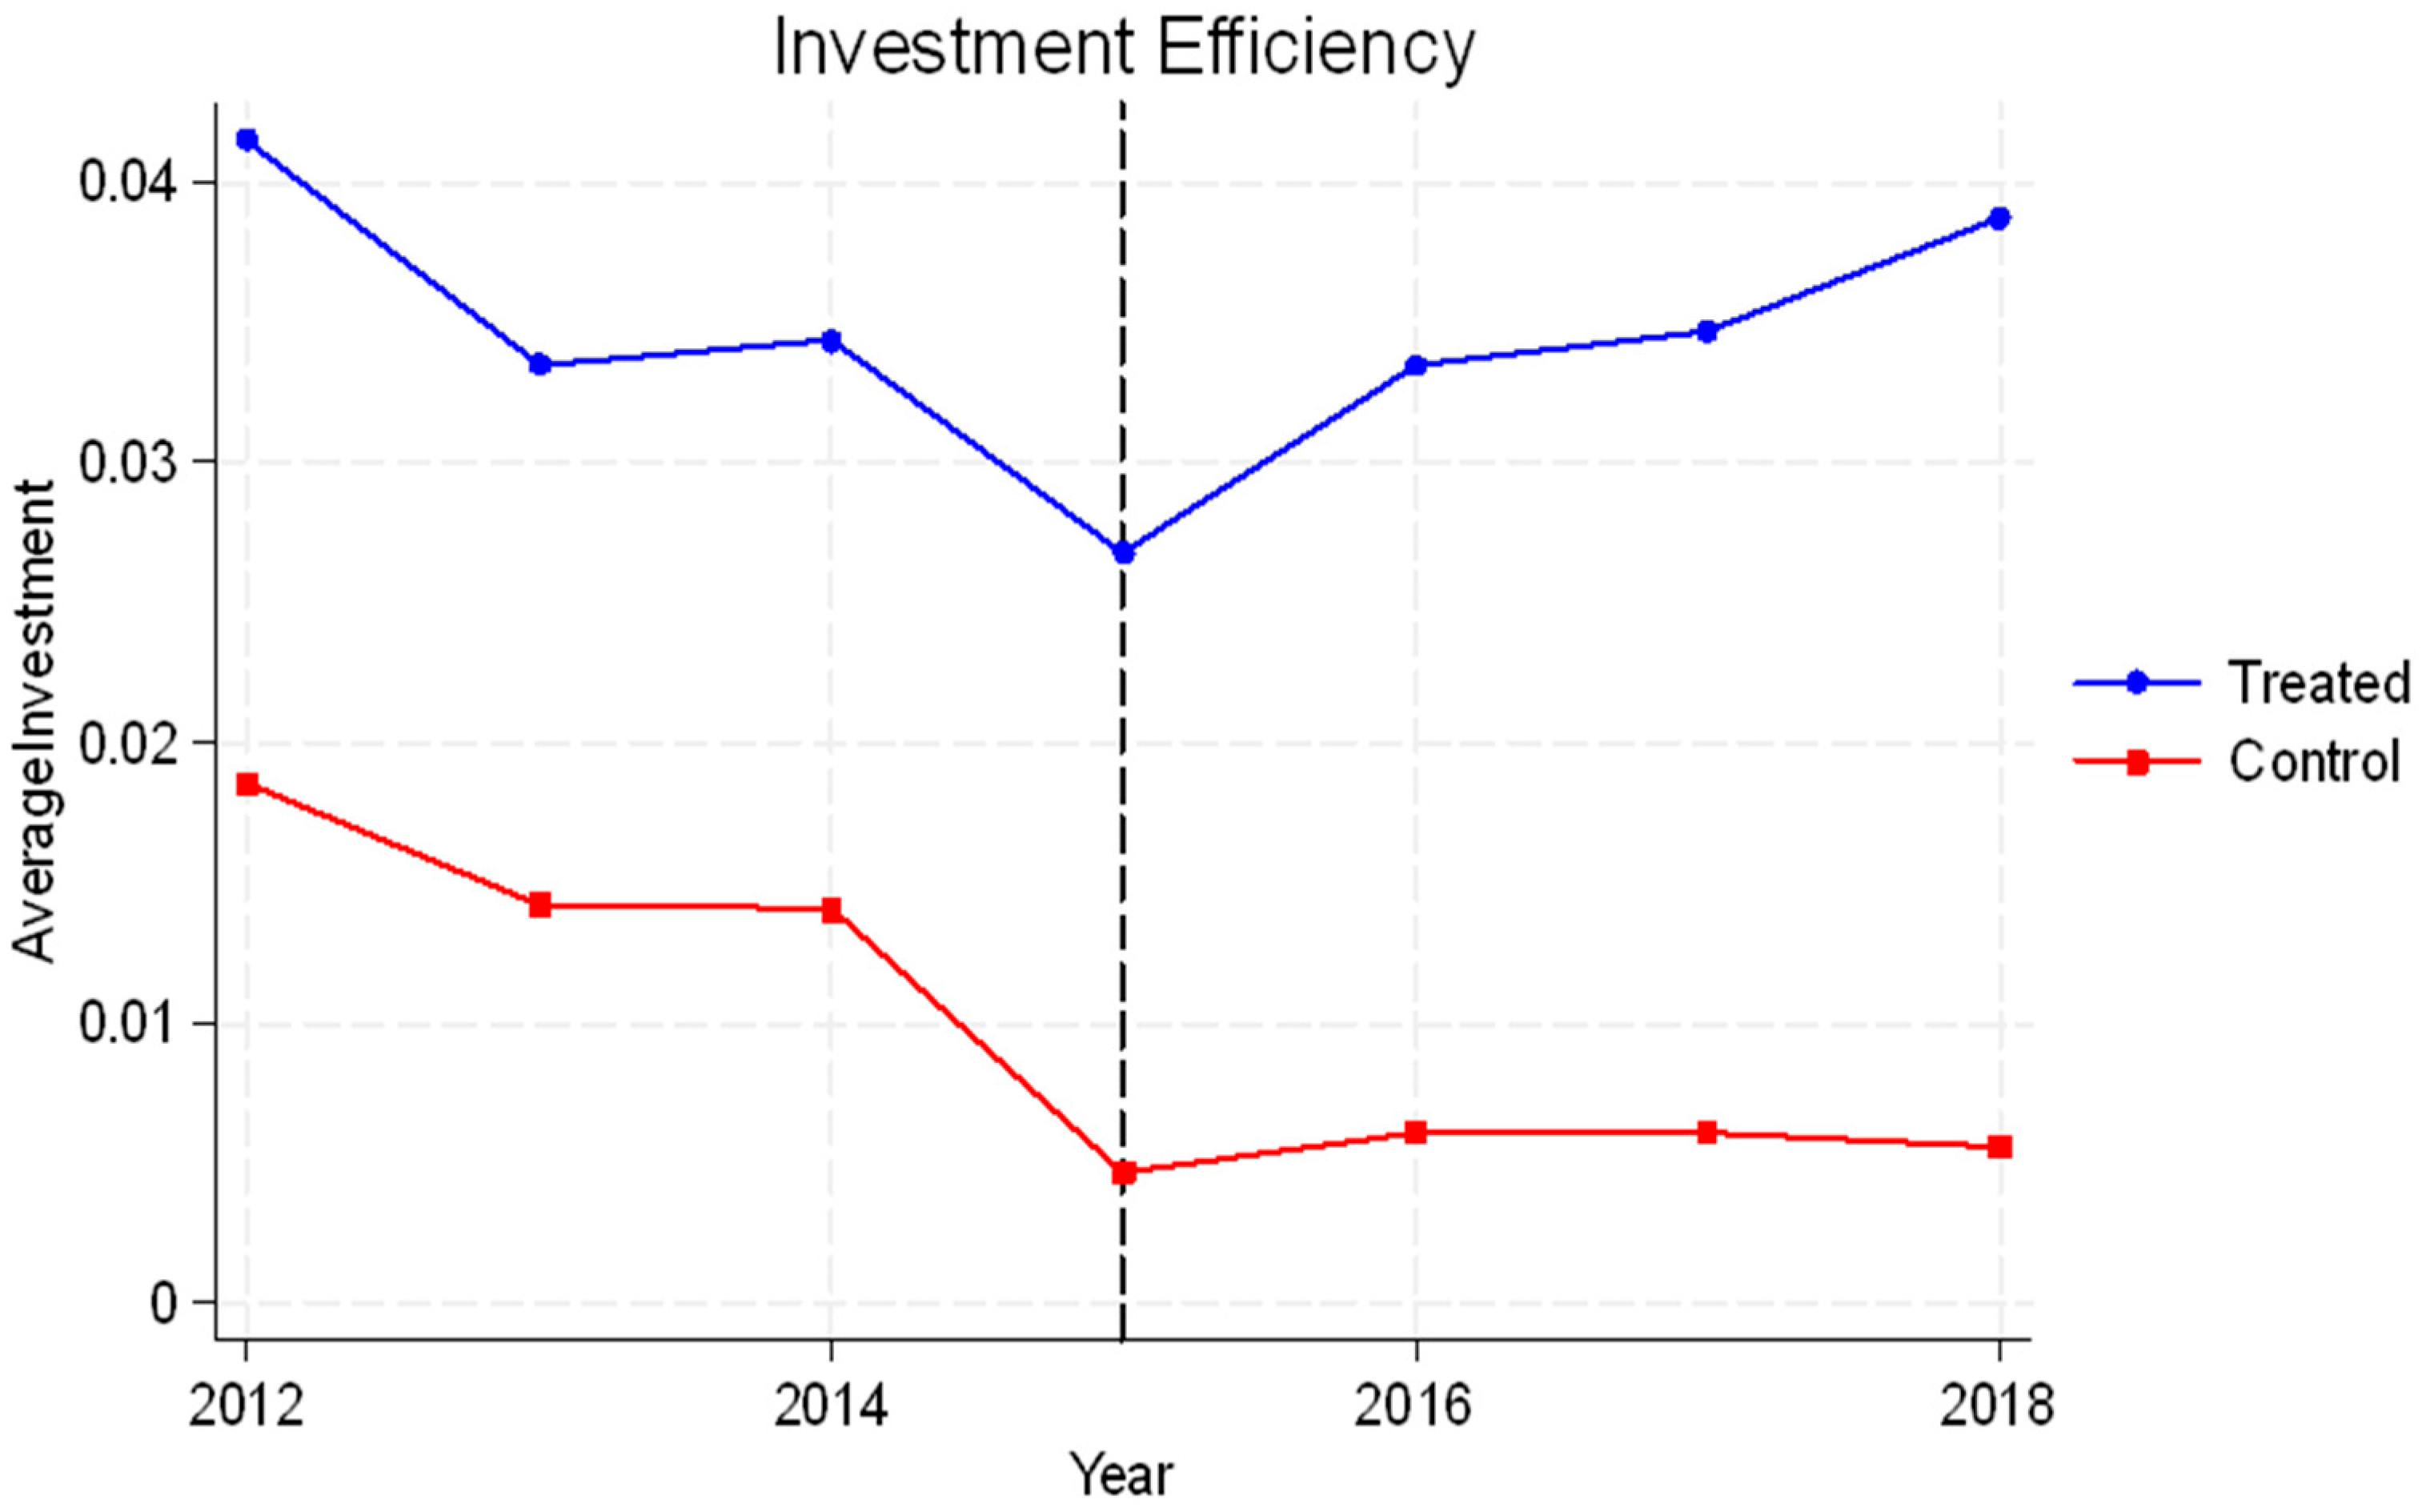
Following the previous literature, like Ho et al. (2023), all continuous variables are winsorized at 1% on both tails. A detailed description of all variables is given in Appendix A (Table A1). To test the parallel trend assumption, we provide a simple visual account of how investment efficiency changes after the CSR is implemented (see Figure A1 in Appendix B). The graph supports the parallel trends assumption, suggesting that in the absence of CSR law, both groups exhibit a similar pattern in investment efficiency. The Figure A1 in Appendix B distinguishes between CSR-affected and non-affected firms, with the vertical line marking the timing of the policy change. Investment efficiency exhibits a relative improvement for firms subject to the CSR law compared to their non-affected counterparts.

4.2. Model Specification

The main objective of our research is to examine the causal impact of India’s Corporate Social Responsibility (CSR) Law 2013 (e.g., the exogenous regulatory shock on CSR activities and compliance) on affected firms’ investment inefficiency. We use the difference-in-differences (DID) model controlling for firm and year-fixed effects (Bertrand & Schoar, 2003) to study how the new CSR law affects corporate investment efficiency.
A b s i n v i n e f f i , t = b 0 + b 1 P o s t i , t   ×   T r e a t i , t   +   b 2 P o s t t   +   b 3 T r e a t i , t   +   b 4 c o n t r o l s i , t + F i r m + Y e a r + e t
where A b s i n v i n e f f proxies for investment inefficiency. We measure investment inefficiency based on deviation from the expected level of long-term investment opportunities (e.g., the expected capital expenditure based on firm characteristics and relevant variables); the details are discussed in the following Section 4.3. Post × Treat is our main variable of interest. It is the Interaction term between Post and Treat. T r e a t is a dummy variable that has a value of one for firms in the treatment group, while zero for firms outside the CSR law threshold (control group firms). In line with Dharmapala and Khanna (2018) and Manchiraju and Rajgopal (2017), we categorize firms into the treatment group if they meet any of the three thresholds as outlined in the Indian CSR Law 2013 (as described in Section 2). Firms in the control group include all the firms unaffected by the CSR law in a particular year. In other words, these firms are comparable to treatment firms regarding investment efficiency but do not meet the three thresholds described by the law (Roy et al., 2022). P o s t is assigned a value of one for the four years after the implementation of the CSR law (FY 2015–2018) and zero for the four years before the enactment of the CSR law (FY 2011–2014).
Drawing on the prior literature, in this study, we include a wide range of control variables to isolate the impact of CSR law on investment efficiency (Biddle et al., 2009; S. Chen et al., 2011; Gomariz & Ballesta, 2014; McLean et al., 2012; Gu et al., 2021). Natural logarithm of the company’s total assets at the end of the year measures firm size (Size). Leverage (Lev) is the ratio of total debt to total assets. Tangibility (Tangibility) is calculated as the ratio of tangible fixed assets to total assets. Return on assets (Roa) is the net profit to total assets ratio. A firm’s growth (Growth) is the annual revenue growth rate. Operating net cash flow (Cashflow) is the ratio of cash flow to total assets. Further, we control for firm and year-fixed effects that may impact investment efficiency in the model and use robust standard errors.

4.3. Key Dependent Variables

In our model, a firm’s investment efficiency is the dependent variable. In the broadest sense, a company’s investment efficiency is its ability to undertake all projects with a positive net present value (Gomariz & Ballesta, 2014). Previous studies, such as those by F. Chen et al. (2011), McLean et al. (2012), and Gomariz and Ballesta (2014), measure firm investment efficiency as the deviation between its actual and expected investment expenditures. Following the standard of the literature (Biddle et al., 2009; F. Chen et al., 2011), we construct two measures of investment inefficiency using models (2) and (3). The investment level of a firm i in the following year is estimated as a function of growth opportunities in the current year (measured by sales growth) as
i n v e s t i , t = b 0 + b 1 g r o w t h i , t 1 + e i , t
where i n v e s t i , t represents the level of investment of firm i during year t. This proxy for investment is measured by the sum of yearly growth in property, plants, and equipment, plus growth in inventory, plus research and development (R&D) expenditure, divided by the lagged book value of assets (F. Chen et al., 2011 and McLean et al., 2012). g r o w t h is the annual rate of change in sales of firm i from t − 1 to year t.
The company-specific investment model predicts the level of investment based on growth opportunities (measured by sales growth). Deviations from the model, as reflected in the error terms of the investment model, thus represent investment inefficiencies. Therefore, residuals from the regression model represent deviations from the expected investment levels. We use the absolute values of these residuals as our first main proxy for firm investment inefficiency, denoted as A b s i n v i n e f f 1 . We construct our second measure of investment inefficiency following Biddle et al. (2009) and F. Chen et al. (2011):
i n v e s t i , t = b 0 + b 1 g r o w t h i , t 1   +   b 2 N E G i , t 1   +   b 3 g r o w t h i , t 1 N E G i , t 1 + e i , t
where NEG is a dummy variable that equals 1 if g r o w t h is above zero and 0 otherwise. The definition of g r o w t h is the same as model (2). After controlling for fixed effects across years and firms, the inefficient investment level of a firm is determined by the absolute value of the model residuals. When the residual is positive (negative), the firm invests more (less) than expected, considering growth opportunities (measured by sales g r o w t h ). Hence, a higher absolute value of the residuals indicates investment inefficiency. We use the absolute values of these residuals as our second main proxy for firm investment inefficiency, denoted as A b s i n v i n e f f 2 . Considering that our main hypothesis is that CSR spending reduces investment inefficiency and improves investment efficiency, we expect b1 to be statistically significant and negative. A negative association between CSR and A b s i n v i n e f f indicates that CSR reduces investment inefficiency and increases investment efficiency.

5. Results

5.1. Multivariate Analysis

We conduct formal multivariate analysis by running a regression model (1). Table 1 reports the results from the baseline regression.
The coefficients of the variable of interest Post × Treat are shown in columns 1 and 2, and are −0.0158 and −0.160. Both coefficients are significant at the 1% level, suggesting that CSR law has a negative effect on investment inefficiency. The results support Hypothesis 1 in that after the CSR law, for the firms in the treatment group (e.g., firms affected by the Indian CSR Law), investment efficiency increases. Further, it leads to more efficient capital allocation (Waddock & Graves, 1997) and lower investment cash flow sensitivity (Attig et al., 2012). Our main findings also support the recent view in business ethics that compulsory CSR spending plays an important role in improving firms’ ability to undertake profitable projects and improving investment efficiency (Attig et al., 2016; Benlemlih & Bitar, 2018). Specifically, our results provide the first empirical evidence highlighting the positive side of the Indian CSR Law 2013. Importantly, these findings link the impact of CSR mandate on the long-term fundamentals within the affected firms themselves. This is largely ignored in the literature. Table A2 provides descriptive statistics of all variables.
However, what mechanisms allow CSR law to improve affected firms’ investment efficiency in India? We explore that in the next section. We propose two possible channels that allow CSR activities to boost investment efficiency, including improvements in firms’ agency and information asymmetry environment through CSR disclosure (Huang et al., 2023; Poursoleyman et al., 2022).

5.2. Channel Test: Financial Reporting Quality

This section investigates how the CSR law impacts firm investment efficiency through a two-stage mechanism test. We use a two-step regression approach following Y. Chen et al. (2018). First, we examine the relationship between CSR law enforcement and financial reporting quality. Second, we examine the relationship between the quality of financial reporting and investment efficiency. We expect a positive correlation in the first-step regression and a negative correlation in the second-step regression if financial reporting increases investment efficiency. McNichols and Stubben’s (2008) model, we calculate financial reporting quality as the following regression:
Δ A R i t = b 0 + b 1 Δ R e v i t + e i t
where ΔAR represents the annual change in accounts receivable, and ΔRev is the annual change in revenues, each scaled by lagged total assets. Thus, a higher amount indicates better financial reporting quality. The absolute residual of the discretionary revenue model, as presented in McNichols and Stubben (2008), is multiplied by 1 to obtain absolute values. This methodology assumes that accruals are estimates of future cash flows, and earnings will be more indicative of future cash flows when estimation error is lower. We present the results in Table 2.
Table 2 shows the first-step and second-step regression results and indicates that financial reporting quality increases in the firms in the treatment group after the CSR law. The coefficients of Post × Treat are significantly positive at 0.0154. The second-step mechanism test in Table 2 demonstrates that FRQ (financial reporting quality) increases firm-level investment efficiency in accordance with the previous literature (Wang et al., 2016). The magnitudes of the regression coefficients for residuals for the two investment inefficiency measures are −0.024 and −0.023, respectively, and statistically significant as shown in columns 2 and 3. Overall, our findings confirm Hypothesis H2, which states that the CSR law increases investment efficiency through financial reporting quality.
The results reiterate that compulsory disclosures for firms under the CSR law lead to higher levels of information disclosure (Ioannou & Serafeim, 2019) and reduce information asymmetry (Dhaliwal et al., 2011; Lopatta et al., 2016; Orlitzky et al., 2003). Firms with higher levels of information disclosure are better at allocating capital, improving credit allocation efficiency, and investment performance (Bushman & Smith, 2001; McNichols & Stubben, 2008). Thus, our findings also contribute to the growing body of literature that studies the relationship between financial reporting quality and investment efficiency (Bens & Monahan, 2004; Biddle et al., 2009; Bushman et al., 2001; Hope & Thomas, 2008; McNichols & Stubben, 2008).

5.3. Channel Test: Agency Costs

Next, we conduct the two-stage mechanism test using agency cost as the channel (Table 3). Following prior studies, we employ two common proxies for agency costs: operating expenses to sales and sales to assets (Hoang et al., 2019; Ang et al., 2000; Kontuš, 2021; McKnight & Weir, 2009). The operating expense ratio—operational expenses divided by total sales—captures agency costs arising from managerial inefficiency or discretionary spending (Imelda & Patricia, 2018; Singh & Davidson, 2003). Agency problems intensify when firms generate excess free cash flow, fostering managerial empire-building (Jensen, 1986).
We also use the asset utilization ratio—total sales divided by total assets—as an inverse proxy for agency costs, reflecting managers’ ability to use assets efficiently (Ang et al., 2000; Kontuš, 2021; McKnight & Weir, 2009). Higher values indicate efficient asset use and stronger cash generation, while lower values signal poor investment decisions, weak effort, or unproductive expenditures and thus higher agency costs (Ang et al., 2000). Results are reported in Table 3.
Panel A presents the first- and second-stage regression results using operating expenses to sales as the agency-cost proxy. In the first stage, the Post × Treat coefficient is significantly negative (−0.003), indicating that agency costs decline for treated firms after the CSR law. In the second stage, columns (2) and (3) show a negative relation between agency costs and investment inefficiency, suggesting that mandatory CSR requirements compel managers to allocate resources more carefully, restrain operating costs (including executive perks), and thereby enhance investment efficiency.
Panel B reports results using the sales-to-assets ratio as the second agency-cost proxy. Because this ratio is inversely related to agency costs, the significantly positive Post × Treat coefficient (0.265) in column (1) again indicates reduced agency costs and more efficient asset use following the CSR law. Columns (2) and (3) show significantly negative coefficients for investment-inefficiency measures, confirming that lower agency costs correspond to higher investment efficiency. These findings align with agency theory (Jensen, 1986; Jensen & Meckling, 1976): compulsory CSR spending increases accountability, encourages efficient asset utilization, and mitigates agency problems (Grossman & Hart, 1982; Hoang et al., 2019). Overall, agency costs decline after the CSR law, improving investment efficiency and supporting Hypothesis 3.

5.4. Promotor Characteristics

So, what types of Indian firms benefit more from improved investment efficiency induced by compliance with the Indian CSR Law 2013? To the extent that the improvements are derived from reduced agency problems (e.g., through more active monitoring) and milder information asymmetry issues, certain types of companies with characteristics attached to these features should be able to enjoy more substantial improvements in investment efficiency (in response to the CSR law) than other groups. This section examines promoter holdings’ impact on companies’ investment efficiencies after the CSR mandate. We separate our sample into two categories based on the promoter holdings—HUF and non-HUF. HUF consists of Indian firms, which have 50% or more than 50% of promoters as HUF, while the rest are non-HUF firms. The results are presented in Panel A of Table 4.
In columns (1) and (2), the coefficient of the Post × Treat is higher in firms with higher HUF promoter holdings than in those with non-HUF promoter holdings. This difference suggests that the CSR law has a more substantial positive impact on enhancing the investment efficiency of HUF-owned firms. In contrast to non-HUF firms, HUFs’ familial governance (Anderson & Reeb, 2003; Poutziouris et al., 2015), stewardship, and long-term orientation optimize their response to CSR mandates, resulting in greater investment efficiency and performance (Davis et al., 2010; Anderson & Reeb, 2003; Ward, 2004). Studies have shown that family involvement in top management fosters a unique organizational identity and aligns family members’ interests with those of the organization (Chrisman et al., 2007; Zellweger et al., 2010). Family executives, seen as stewards, emphasize long-term performance and generational continuity, reducing agency problems and maximizing their specialized knowledge and skills (Anderson & Reeb, 2003; Davis et al., 1997; Morck et al., 2005).

5.5. Institutional Holdings

Next, we conduct a sub-sample analysis on non-promotor institutional holdings. Literature suggests that firms with institutional ownership have a better information environment and superior transparency (Buchuk et al., 2014; Liu & Tian, 2012; Qian & Yeung, 2015). They provide more effective and active monitoring activities that help reduce agency problems. We find an increase in investment efficiencies in institutional non-promotor categories after the CSR law in treatment firms. By having a higher percentage of institutional ownership, companies perform better as there is a more stringent monitoring process and better corporate governance (Bushee et al., 2014; Gillan & Starks, 2003). The results in Table 5 support the hypothesis that institutional intervention can facilitate efficient and appropriate investment decisions by the managerial party as the investment decision maker. When institutions act as investors, there is better control over leverage decisions and tunneling activities (Buchuk et al., 2014; Liu & Tian, 2012; Qian & Yeung, 2015), leading to investment efficiency (Ali et al., 2007).

5.6. Types of Ownership

Our subsequent analysis is motivated by varied firm ownership. Specifically, we divide our dataset into four sub-samples based on ownership status—Group, Private, Foreign, and Government, as defined in the Prowess database. The Prowess dataset determines ownership by the primary shareholder or controlling interest. For example, firms with a significant shareholding by a single family or business conglomerate are classified as “Groups,” while firms with foreign institutional or corporate ownership are classified as “Foreign.” Similarly, “Private” and “Government” firms are those owned privately and by the Government. The results of the subsample analysis are presented in Table 6.
We find a significant positive relationship between the CSR law and investment efficiency for privately owned public firms. These firms, which already operate under stronger governance and disclosure structures, respond to CSR requirements by reinforcing ethical conduct and transparency, thereby improving resource allocation and investment decisions. The CSR law thus complements existing governance mechanisms and enhances investment efficiency.
By contrast, government, foreign, and group firms do not exhibit the same efficiency gains. Consistent with prior literature, group firms often face expropriation risks when controlling shareholders’ cash flow rights exceed voting rights, leading to overinvestment and inefficiency (Johnson et al., 2000; Jiang et al., 2010; Lemmon & Lins, 2003). Similarly, government-owned firms show no significant impact of the CSR law on investment efficiency, likely due to weak monitoring incentives, greater information asymmetry, and poor governance structures, which hinder effective resource allocation (Shleifer & Vishny, 1997; S. Chen et al., 2011).

5.7. States Across India

Do companies in all regions of India enjoy the improvement of investment efficiency in response to CSR laws equally across the country? For example, companies in the poorer CSR practice region before the law may be forced to join in the CSR movement more so than businesses in already active CSR regions. To examine this, we take the median values of the indices and create four sub-samples: high and low human development sub-samples and high and low gender development samples.
Qamruzzaman et al. (2021) find that higher human development correlates with financial innovation and development. We therefore expect high-HDI states to have stronger institutions and lower information asymmetry, enabling banks to assess borrowers and projects more effectively and allocate credit more efficiently, supporting higher investment efficiency even without CSR law intervention. Thus, mandatory CSR should have a larger marginal effect in low-HDI states.
Similarly, the CSR law is likely to be more impactful in low-GDI regions, where gender inequality in health, education, and economic opportunity is more severe. CSR initiatives can help address these disparities, promote women’s development, and strengthen firms’ reputation and social capital, potentially improving competitiveness. We report the results in Table 7. The results show that firms in the low HDI subsample experience greater improvement in investment efficiencies following the CSR Law. We find no relation between CSR law and investment efficiencies in firms within high HDI states. Findings from high HDI and low HDI suggest that advanced CSR practices may already exist for companies in high HDI states, so the new CSR law may not significantly affect investment efficiency. On the contrary, after the CSR law, CSR initiatives in low HDI states can address more critical and impactful needs, improving efficiency. Further, our results indicate that firms in low GDI states receive higher investment efficiencies after the CSR law. This indicates that CSR initiatives in these regions are likely to reduce gender disparities and promote inclusive growth, further enhancing resource allocation and effectiveness.

5.8. Effect of CSR Law on Overinvesting Firms

As an extension and an alternative setting of our research, we separately investigate the impact of CSR law on over- and underinvesting firms. An underinvestment occurs when firms invest below their optimal investment level, while an overinvestment occurs when firms invest above their optimal levels (Gomariz & Ballesta, 2014). We create a dummy variable Over to classify the sample into underinvestment and overinvestment scenarios based on model (1). A positive model residual means that actual investment is higher than expected, representing overinvestment; the dummy variable Over equals 1. Alternatively, a negative residual indicates that the firm is under-investing, indicating an under-investment. The dummy variable is 0 in this case. We are especially concerned about “overinvesting” firms because they deploy resources over what is optimal, potentially reducing firm value and wasting capital. The impact of CSR law on such firms is important because CSR mandates often require additional resource allocation, which might exacerbate inefficiencies in firms already prone to overinvesting.
Results in Table 8 show that overinvesting firms have significant coefficients of −0.110 and −0.117 for Post × Treat × Over. This indicates that the CSR law improves investment efficiency by reducing overinvestment in the firms. Overinvesting firms often allocate resources to unproductive projects, potentially due to managerial overconfidence, misaligned incentives, or agency problems. CSR law may enforce a discipline mechanism by redirecting such excess resources toward socially beneficial activities, which reduces the scope for overinvestment and improves investment efficiency. In contrast, underinvesting firms may lack the resources, risk appetite, or incentives to invest optimally. The additional obligations imposed by CSR law could further strain their limited resources, leaving them unable to correct their underinvestment issues. As such, while CSR law helps curb excesses in overinvesting firms, it may not directly address the fundamental barriers faced by underinvesting firms, such as financial constraints or risk aversion, which are more structural. This divergence highlights the selective efficiency of CSR law in addressing investment inefficiencies.

5.9. Propensity Score Matching (PSM)

In the last step, we re-estimate our main model using an alternative propensity score-matched sample. Researchers have extensively used propensity score matching to establish causal inferences in CSR research (Prior et al., 2008). Rosenbaum and Rubin (1985) first used this framework to study causal effects in observational studies. We estimate propensity scores using a logit model and kernel density matching. Matching of firms is performed on all covariates included in the baseline regression. Results are presented in Table 9. The propensity score matching method shows results similar to the baseline regression. The estimated coefficients Post × Treat are −0.004 and −0.002, respectively, and are significant. These findings further support the main hypotheses of this paper that investment efficiency increases in affected firms after the CSR law. In Panel B, we report the PSM balance test results, which compare the kernel density distributions of the treatment and control groups before and after matching to support our PSM test validity. Before matching, the probability distributions of the control and treatment groups significantly differ. After matching, there is a substantial reduction in the difference, and the percentage bias of the covariates of the samples decreases significantly.

6. Discussion

In this study, we provide robust empirical evidence that the Indian CSR Law significantly impacts corporate investment efficiency through mandatory CSR spending. The findings contribute to the debate in business ethics and finance regarding whether compulsory social spending drains corporate resources or enhances value. The findings of our study support the view that high-quality CSR engagement enhances a company’s ability to undertake profitable projects (Attig et al., 2016; Benlemlih & Bitar, 2018). In contrast to some of the literature, we highlight the role mandatory regimes play in strengthening long-term fundamentals of affected firms, a dimension often overlooked in prior studies. Information asymmetry and agency conflicts serve as the primary channels through which this efficiency is achieved. These findings are consistent with those of Biddle et al. (2009) and McNichols and Stubben (2008), demonstrating that mandatory CSR disclosures enhance financial reporting quality. The increased transparency facilitates greater credit allocation precision by reducing the information gap between managers and providers of capital, further mitigating the agency conflicts. Our study makes both theoretical and policy contributions to the CSR literature.

6.1. Theoretical Contribution

This study contributes to theory development by extending existing CSR and agency frameworks to mandated CSR in emerging markets. According to Homer and Lim (2024), this study focuses on explaining why mandatory CSR produces different economic outcomes under different institutional conditions, rather than mechanically applying theories developed in voluntary CSR settings. First, the study shows how mandatory CSR could enhance governance by refining agency theory. In contrast to traditional predictions, the findings show that legally mandated CSR reduces information asymmetry and agency conflicts, enhancing investment efficiency. Additionally, we demonstrate that the mandate effectively disciplines managers by constraining unproductive operating costs and executive perks, which redirects resources toward efficient investment, thereby linking our results to agency theory (Jensen, 1986).
Second, the study advances CSR theory by explicitly distinguishing between voluntary and mandatory CSR regimes. Using India’s mandatory CSR framework as a case study, this study argues that legal compulsion, coupled with disclosure requirements and monitoring structures, better allocates capital. It thus provides a theoretical basis for explaining when CSR expenditures increase firm efficiency rather than detract from it.
Finally, the study identifies institution-specific mechanisms that moderate the relationship between CSR and investment efficiency in line with Homer and Lim’s context-sensitive approach to theory development (Homer & Lim, 2024). There is cross-sectional variation in the effectiveness of mandatory CSR due to unique ownership structures in India, such as HUF promoters, institutional investor monitoring, and regional development heterogeneity. The results of our study relate to HUF-owned firms within a mandatory framework, extending Stewardship Theory (Davis et al., 1997). It is evident that HUF-owned firms and firms with a higher institutional ownership support agency and stewardship perspectives, while regional variation based on human and gender development indices highlights the role of institutions. These findings represent bounded theoretical extensions rather than claims to universal applicability.
Overall, this study provides contextually grounded refinement to CSR and agency theories by suggesting that mandatory CSR can enhance investment efficiency when embedded in effective governance and institutional frameworks. The paper advances theory by clarifying how CSR mandates align social objectives with shareholder value and contributes to theory development in CSR and investment efficiency by refining how those theories relate to the local context.

6.2. Policy Recommendations

In terms of practical and policy recommendations, these results suggest that CSR should be repositioned as a strategic asset instead of simply a compliance expense. To improve reporting quality and reduce the hurdles to capital allocation, management should take advantage of the increased disclosure requirements to overhaul internal auditing processes. The mandate is particularly useful for firms prone to overinvesting so as to avoid capital wastage on negative-NPV projects, using CSR compliance as a proxy for superior governance and reduced agency risk. HUF-led and institutionally backed firms can further signal their stewardship and transparency to international investors. Regulators should encourage firms to integrate CSR reporting with financial reporting standards to enhance the information environment and maximize the efficiency benefits of CSR mandates. It is essential for disclosure guidelines and enforcement mechanisms to be clear in order for these benefits to be realized.
Furthermore, mandatory CSR at the governmental level can generate economic and social benefits, particularly in settings with weak governance structures. In addition to CSR mandates, policymakers should implement policies that enhance transparency, investor protection, and enforcement quality. Moreover, targeted CSR policies have been found to improve both social outcomes and firm efficiency in regions with lower human and gender development. The findings from this study provide valuable insights for other emerging economies considering mandatory CSR measures.
Finally, the Indian government and international regulators should recognize that CSR mandates are most useful in regions with institutional voids, such as low-HDI and low-GDI states. These areas tend to experience the greatest gains in investment efficiency and inclusive growth, so policymakers should consider “regional weighting” or specific incentives to encourage CSR spending. Companies should establish a formal link between CSR committees and investment planning so that social obligations and capital budgeting are mutually reinforcing. The results offer important insights for policymakers designing CSR and ESG regulations, particularly in emerging economies where voluntary participation remains limited, and governance mechanisms vary widely.

7. Conclusions

Has the global corporate sector acted responsibly toward society? Given that most countries still follow a voluntary CSR regime, this remains a highly debatable question. With the widening wealth gap in societies, resentment towards capitalism is particularly surging among younger generations (Milner, 2021). At the same time, it is challenging (or even unpopular) for governments to mandate CSR and turn it into law, as its economic aspects still need to be clarified and debated. India pioneered the mandate of corporate social responsibility (CSR) through its 2013 legislation, providing a valuable empirical context to examine this important question. However, research on the economic impact of the Indian CSR Law on the corporate sector remains limited. The few existing studies suggest potential downsides to the mandate, indicating that the Indian capital market may devalue firms subject to compulsory CSR requirements.
Our study alternatively highlights the positive side of Indian CSR Law from the perspective of investment efficiency. Through difference-in-differences methodology, our results support the previous research findings and suggest that firms under the CSR mandate have higher investment efficiency (Cheng et al., 2014; Stein, 2003; El Ghoul et al., 2011; Samet & Jarboui, 2017). Second, our paper demonstrates that firms in the treatment group affected by the CSR law are associated with less information asymmetry (Dhaliwal et al., 2011) and less agency conflict (Krüger, 2015), leading to investment efficiency (Benlemlih & Bitar, 2018; Bushee et al., 2014). Additionally, based on promoter holdings, a centralized decision-making structure within the family can facilitate the efficient and effective execution of CSR initiatives by HUF-owned companies (Zellweger et al., 2010). In addition, familial bonds can contribute to more concerted efforts within HUFs as they act as stewards to improve the performance of the company, thus enhancing investment efficiency (Davis et al., 1997; Le Breton-Miller & Miller, 2009; Ward, 2004). Furthermore, institutional investors offer more than just financial support; they also offer strategic guidance, mentorship, and corporate governance (Bushee et al., 2014; Gillan & Starks, 2003, leading to an increase in investment efficiency. Similar to Kim et al. (2015) our findings indicate that CSR has become increasingly integrated into firms’ core business models rather than being treated as a peripheral activity. The findings offer novel evidence from India that can help governments design CSR regulations that balance the interests of businesses, society, and investors.
Future research could examine the effects of CSR regulation by using extended sample periods. For example, to maintain internal validity, the COVID-19 period was intentionally excluded from this study. However, the pandemic represents an important avenue for future research. It would be of interest to examine whether the efficiency-enhancing effects of mandatory corporate social responsibility documented here persist, weaken, or strengthen during periods of systemic crisis. Moreover, it would be interesting to examine whether the same effect can be found in other countries that also adopt mandatory CSR expenditures.
Overall, this research contributes to a broader debate regarding the economic impact of mandatory CSR. The study reinforces the view that mandatory CSR laws can enhance investment efficiency and provides valuable guidance for policymakers worldwide, especially in countries where voluntary CSR participation remains limited.


Author Contributions

Conceptualization, J.F., U.W., and W.H.; methodology, S.K.P.; software, S.K.P.; validation, J.F., U.W., W.H., and S.K.P.; formal analysis, S.K.P.; investigation, S.K.P.; writing—original draft preparation, S.K.P., J.F., U.W., and W.H.; writing—review and editing, S.K.P., J.F., U.W., and W.H.; visualization, S.K.P.; supervision, J.F., W.H., and U.W. All authors have read and agreed to the published version of the manuscript.

Funding

This research received no external funding.

Institutional Review Board Statement

Not applicable.

Informed Consent Statement

Not applicable.

Data Availability Statement

Data will be made available on request.

Conflicts of Interest

The authors declare no conflicts of interest.

Appendix A

Table A1. Description of Variables.
VariablesDescription
Absinvineff1Investment inefficiency is measured as the residual from a simple investment model (Biddle et al., 2009) that predicts the level of investment based on growth opportunities (measured by sales growth). Deviations from the model, as reflected in the error terms of the investment model (3), represent the investment inefficiency.
Absinvineff2Absinvineff2 is an alternative dependent variable. Deviations from the model, as reflected in the error terms of the investment model (4), represent the investment inefficiency.
Post P o s t is assigned a value of one for the four years after the implementation of the CSR law (FY 2015–2018; post) and zero for the four years before the enactment of the CSR law (FY 2011–2014).
Treat T r e a t is a dummy variable that has a value of one for firms in the treatment group, while the value is zero for firms outside the CSR law threshold (control group firms).
Post × TreatInteraction term between Post and Treat
Firm size (Size)Natural logarithm of the company’s total assets at the end of the year.
Leverage (Lev)The ratio of total debt to total assets.
Tangibility (Tangibility)The ratio of tangible fixed assets to total assets.
Return on assets (Roa)The ratio of net profit and total assets.
Firm’s growth (Growth)Annual revenue growth rate for firm i from t to t − 1.
Return on equity (Roe)The ratio of net income to shareholders’ equity.
Operating net cash flow (Cashflow) The ratio of cash flow to total assets.
Financial reporting quality (FRQ) The absolute residual of the discretionary revenue model, as presented in McNichols and Stubben (2008), is multiplied by 1 to obtain absolute values.
Operating expenses to sales (Opexptosales) Total operational expenses divided by total sales.
Sales to total assets (Salestoassets) Total sales divided by total assets.
Hindu undivided family (HUF) Dummy = 1 if HUF promoters have 50% or more holding.
Non-Hindu undivided family (Non-HUF) Dummy = 1 if HUF promoters have less than 50% holding.
Non-promoter institutions Proportion of shares pledged by institutions as non-promoters.
OwnershipDummy = 1 if there is ownership based on each type of ownership—group, private, government, and foreign.
Human Development Index (HDI) Two sub-samples, high and low, on the median values of HDI.
Gender Development Index (GDI) Two sub-samples, high and low, on the median values of GDI.
Overinvestment
(Post × Treat × Over)
The dummy variable takes the value of 1 for overinvestment scenarios (positive residuals) and is 0 otherwise.
Note: Variable definitions and controls are based on the prior literature examining investment efficiency and corporate policies. Specifically, the selection and construction of control variables follow Biddle et al. (2009), S. Chen et al. (2011), Gomariz and Ballesta (2014), McLean et al. (2012), and Gu et al. (2021).
Table A2 provides descriptive statistics for the regression variables. The primary measures of investment inefficiency, Absinvineff1 and Absinvineff1, have an average value of 0.008 and a median of 0.01. The firm size (Size) has a mean of 7.34 and a median of 7.18, with a standard deviation of 2.11. There is a considerable variation in the size of firms within the sample, ranging from −0.51 to 15.64. The average range of leverage (Lev) is 0.69, indicating that firms have considerable debt in their capital structures. Based on return on assets (Roa), we can see a minimum value of −0.86 indicating financial underperformance, while a maximum value of 0.49 means relatively profitable. During the sample period, sales growth (Growth) has a minimum value of −0.99 and a maximum value of 172.44, indicating that a few firms experienced exceptionally high sales growth. These summary statistics indicate substantial variation among firms and are consistent with the previous literature (Gu et al., 2021).
Table A3 shows the Pearson pair-wise correlation coefficients. Absinvineff1 and Absinvineff1 show modest positive correlations with the sizes of the firms (r = 0.130 and r = 0.126), suggesting that larger firms may experience higher levels of investment inefficiency. Both investment inefficiency measures are weakly negatively correlated with leverage (Lev) at r = −0.055 and r = −0.052, suggesting that more highly leveraged firms are marginally less likely to deviate from optimal investment, perhaps due to tighter financial constraints or increased creditors’ monitoring. There is a weak positive correlation between the Cashflow variable and investment inefficiency, which supports the notion that firms with greater internal resources may be more likely to deviate from their investment plans due to agency problems or overconfidence. The figures are consistent with prior research (Gomariz & Ballesta, 2014). In summary, the correlations provide preliminary support for further multivariate analysis.
As shown in Table A4, the Variance Inflation Factor (VIF) for all variables is 1.98, falling below the commonly accepted threshold level of 4. This indicates that there is no significant multicollinearity present in the data.
Table A2. Summary statistics.
VariablesObservationsMeanMedianStd. Dev.MinMax
Absinvineff120,8780.0080.010.253−2.350.33
Absinvineff120,8780.0080.010.25−2.360.34
Size20,8787.347.182.110.5115.63
Lev20,8780.690.571.070.0017.18
Roa20,8780.050.060.12−0.860.49
Cashflow20,8780.040.040.12−0.860.53
Tangibility20,8780.260.220.2100.90
Growth20,8782.610.0518.30−0.99172.43
Table A3. Pearson correlation matrix.
Absinvineff1Absinvineff1Size Lev Roa Cashflow Tangibility Growth
Absinvineff11.000
Absinvineff10.9991.000
Size 0.1300.1261.000
Lev −0.055−0.052−0.1191.000
Roa 0.0750.0650.155−0.2101.000
Cashflow 0.0410.0380.144−0.0330.3071.000
Tangibility 0.0740.0730.0340.107−0.0700.1651.000
Growth 0.0280.0310.048−0.0050.015−0.010−0.0221
Table A4. Variation Inflation Factor.
VIF1/VIF
Size1.160.862276
Lev1.070.936934
Roa1.060.941938
Cashflow1.060.942398
Tangibility1.030.974685
Growth10.99609
Mean VIF1.08
Note: Table A1 reports the summary statistics. Table A2 shows the correlation matrix of the main variables. This table shows the Variance Inflation Factor (VIF).

Appendix B

Parallel Trend Test

Identification based on DID relies on the parallel trend assumption, which states that the treatment group, absent the reform, would have followed the same time trend as the control group. We plot firms’ investment levels from 2011 to 2018, covering both the pre-CSR and post-CSR periods. To provide a visual account of how firm investment efficiency evolves around the enactment of the mandatory CSR law, we present Figure A1. The figure plots the trends in investment efficiency for treated firms (those covered under the CSR law) and control firms (those exempt from it) over the sample period. The vertical line marks the year 2015, representing the implementation of the CSR policy. Before 2015, both groups displayed broadly similar patterns in investment efficiency, supporting the parallel trends assumption. After 2015, a divergence is observed, with treated firms showing a distinct change in investment efficiency compared to control firms, indicating a potential impact of the CSR mandate.
Figure A1. Pattern in “invested efficiency” for CSR-impacted (treatment group) and non-impacted (control group) firms. Note: This figure presents the trends in investment efficiency for treated and control firms from 2011 to 2018. The vertical line denotes 2015, the year of the CSR law implementation. The figure provides a visual validation of the parallel trend assumption underlying the difference-in-differences design. Before 2015, both groups displayed comparable movements in investment efficiency, supporting the plausibility of parallel trends. Post-implementation, a noticeable divergence appears, with treated firms exhibiting distinct changes relative to control firms, indicative of the potential impact of the CSR mandate.
Jrfm 19 00061 g0a1

Note

1
[India Briefing] S-135 is a unique CSR regulation and prescribes the firm a minimum expenditure on CSR related activites and to disclose all CSR related information. For details see https://www.india-briefing.com/news/corporate-social-responsibility-india-5511 (accessed on 5 January 2026).

References

  1. Aguinis, H., & Glavas, A. (2019). On corporate social responsibility, sensemaking, and the search for meaningfulness through work. Journal of Management, 45(3), 1057–1086. [Google Scholar] [CrossRef] [Scilit]
  2. Albuquerque, R., Koskinen, Y., & Zhang, C. (2019). Corporate social responsibility and firm risk: Theory and empirical evidence. Management Science, 65(10), 4451–4469. [Google Scholar] [CrossRef] [Scilit]
  3. Ali, A., Chen, T. Y., & Radhakrishnan, S. (2007). Corporate disclosures by family firms. Journal of Accounting and Economics, 44, 238–286. [Google Scholar] [CrossRef] [Scilit]
  4. Anderson, R. C., & Reeb, D. M. (2003). Founding-family ownership and firm performance: Evidence from the S&P 500. The Journal of Finance, 58(3), 1301–1328. [Google Scholar]
  5. Andrén, N., & Jankensgård, H. (2015). Wall of cash: The investment-cash flow sensitivity when capital becomes abundant. Journal of Banking & Finance, 50, 204–213. [Google Scholar] [CrossRef] [Scilit]
  6. Ang, J. S., Cole, R. A., & Lin, J. W. (2000). Agency costs and ownership structure. The Journal of Finance, 55(1), 81–106. [Google Scholar] [CrossRef] [Scilit]
  7. Attig, N., Boubakri, N., El Ghoul, S., & Guedhami, O. (2016). Firm internationalization and corporate social responsibility. Journal of Business Ethics, 134(2), 171–197. [Google Scholar] [CrossRef] [Scilit]
  8. Attig, N., Cleary, S., El Ghoul, S., & Guedhami, O. (2012). Institutional investment horizon and investment–cash flow sensitivity. Journal of Banking & Finance, 36(4), 1164–1180. [Google Scholar] [CrossRef] [Scilit]
  9. Benlemlih, M., & Bitar, M. (2018). Corporate social responsibility and investment efficiency. Journal of Business Ethics, 148, 647–671. [Google Scholar] [CrossRef] [Scilit]
  10. Bens, D. A., & Monahan, S. J. (2004). Disclosure quality and the excess value of diversification. Journal of Accounting Research, 42(4), 691–730. [Google Scholar] [CrossRef] [Scilit]
  11. Bertrand, M., & Schoar, A. (2003). Managing with style: The effect of managers on firm policies. The Quarterly Journal of Economics, 118(4), 1169–1208. [Google Scholar] [CrossRef] [Scilit]
  12. Bénabou, R., & Tirole, J. (2010). Individual and corporate social responsibility. Economica, 77(305), 1–19. [Google Scholar] [CrossRef] [Scilit]
  13. Biddle, G. C., Hilary, G., & Verdi, R. S. (2009). How does financial reporting quality relate to investment efficiency? Journal of Accounting and Economics, 48(2–3), 112–131. [Google Scholar] [CrossRef] [Scilit]
  14. Buchuk, D., Larrain, B., Muñoz, F., & Urzúa, I. F. (2014). The internal capital markets of business groups: Evidence from intra-group loans. Journal of Financial Economics, 112(2), 190–212. [Google Scholar] [CrossRef] [Scilit]
  15. Bushee, B. J., Carter, M. E., & Gerakos, J. J. (2014). Institutional investor preferences for corporate governance mechanisms. Journal of Management Accounting Research, 26(2), 123–149. [Google Scholar] [CrossRef] [Scilit]
  16. Bushman, R. M., Piotroski, J. D., & Smith, A. J. (2001). Capital allocation and timely accounting recognition of economic losses. Journal of Business Finance & Accounting, 38(1–2), 1–33. [Google Scholar] [CrossRef] [Scilit]
  17. Bushman, R. M., & Smith, A. J. (2001). Financial accounting information and corporate governance. Journal of Accounting and Economics, 32(1–3), 237–333. [Google Scholar] [CrossRef] [Scilit]
  18. Chen, F., Hope, O.-K., Li, Q., & Wang, X. (2011). Financial reporting quality and investment efficiency of private firms in emerging markets. The Accounting Review, 86(4), 1255–1288. [Google Scholar] [CrossRef] [Scilit]
  19. Chen, S., Sun, Z., Tang, S., & Wu, D. (2011). Government intervention and investment efficiency: Evidence from China. Journal of Corporate Finance, 17(2), 259–271. [Google Scholar] [CrossRef] [Scilit]
  20. Chen, Y., Xie, Y., You, H., & Zhang, Y. (2018). Does crackdown on corruption reduce stock price crash risk? Evidence from China. Finance, 51, 125–141. [Google Scholar] [CrossRef] [Scilit]
  21. Cheng, B., Ioannou, I., & Serafeim, G. (2014). Corporate social responsibility and access to finance. Strategic Management Journal, 35(1), 1–23. [Google Scholar] [CrossRef] [Scilit]
  22. Cho, S. Y., Lee, C., & Pfeiffer, R. J. (2013). Corporate social responsibility performance and information asymmetry. Journal of Accounting and Public Policy, 32(1), 71–83. [Google Scholar] [CrossRef] [Scilit]
  23. Chrisman, J. J., Chua, J. H., Kellermanns, F. W., & Chang, E. P. C. (2007). Are family managers agents or stewards? An exploratory study in privately held family firms. Journal of Business Research, 60(10), 1030–1038. [Google Scholar] [CrossRef] [Scilit]
  24. Davis, J. H., Allen, M. R., & Hayes, H. D. (2010). Is blood thicker than water? A study of stewardship perceptions in family business. Entrepreneurship Theory and Practice, 34(6), 1093–1116. [Google Scholar] [CrossRef] [Scilit]
  25. Davis, J. H., Schoorman, F. D., & Donaldson, L. (1997). Toward a stewardship theory of management. Academy of Management Review, 22(1), 20–47. [Google Scholar] [CrossRef] [Scilit]
  26. Denis, D. K., & McConnell, J. J. (2003). International corporate governance. The Journal of Financial and Quantitative Analysis, 38(1), 1–36. [Google Scholar] [CrossRef] [Scilit]
  27. Dhaliwal, D. S., Li, O. Z., Tsang, A., & Yang, Y. G. (2011). Voluntary nonfinancial disclosure and the cost of equity capital: The initiation of corporate social responsibility reporting. The Accounting Review, 86(1), 59–100. [Google Scholar] [CrossRef] [Scilit]
  28. Dharmapala, D., & Khanna, V. (2018). The impact of mandated corporate social responsibility: Evidence from India’s Companies Act of 2013. International Review of Law and Economics, 56, 92–104. [Google Scholar] [CrossRef] [Scilit]
  29. Djankov, S., La Porta, R., Lopez-de-Silanes, F., & Shleifer, A. (2008). The law and economics of self-dealing. Journal of Financial Economics, 88(3), 430–465. [Google Scholar] [CrossRef] [Scilit]
  30. Eccles, R. G., Ioannou, I., & Serafeim, G. (2014). The impact of corporate sustainability on organizational processes and performance. Management Science, 60(11), 2835–2857. [Google Scholar] [CrossRef] [Scilit]
  31. Edmans, A. (2023). The end of ESG. Financial Management, 52(1), 3–17. [Google Scholar] [CrossRef] [Scilit]
  32. El Ghoul, S., Guedhami, O., Kwok, C. C. Y., & Mishra, D. R. (2011). Does corporate social responsibility affect the cost of capital? Journal of Banking & Finance, 35(9), 2388–2406. [Google Scholar] [CrossRef] [Scilit]
  33. Ferrell, A., Liang, H., & Renneboog, L. (2016). Socially responsible firms. Journal of Financial Economics, 122(3), 585–606. [Google Scholar] [CrossRef] [Scilit]
  34. Friedman, M. (1970, September 13). The social responsibility of business is to increase its profits. New York Times Magazine. 122–126.
  35. Gillan, S. L. (2006). Recent developments in corporate governance: An overview. Journal of Corporate Finance, 12(3), 381–402. [Google Scholar] [CrossRef] [Scilit]
  36. Gillan, S. L., & Starks, L. T. (2003). Corporate governance, corporate ownership, and the role of institutional investors: A global perspective. SSRN Electronic Journal. [Google Scholar] [CrossRef] [Scilit]
  37. Gomariz, F. C., & Ballesta, J. P. S. (2014). Financial reporting quality, debt maturity and investment efficiency. Journal of Banking & Finance, 40, 494–506. [Google Scholar] [CrossRef] [Scilit]
  38. Goss, A., & Roberts, G. S. (2011). The impact of corporate social responsibility on the cost of bank loans. Journal of Banking & Finance, 35, 1794–1810. [Google Scholar] [CrossRef] [Scilit]
  39. Grossman, S. J., & Hart, O. D. (1982). Corporate financial structure and managerial incentives. In The economics of information and uncertainty (pp. 107–140). University of Chicago Press. [Google Scholar]
  40. Gu, Y., Ho, K.-C., Yan, C., & Gozgor, G. (2021). Public environmental concern, CEO turnover, and green investment: Evidence from a quasi-natural experiment in China. Energy Economics, 100, 105379. [Google Scholar] [CrossRef] [Scilit]
  41. Harjoto, M. A., & Jo, H. (2011). Corporate governance and CSR nexus. Journal of Business Ethics, 100(1), 45–67. [Google Scholar] [CrossRef] [Scilit]
  42. Hermalin, B. E. (2005). Trends in corporate governance. The Journal of Finance, 60(5), 2351–2384. [Google Scholar] [CrossRef] [Scilit]
  43. Ho, K.-C., Yan, C., Mao, Z., & An, J. (2023). Corporate sustainability policies and corporate investment efficiency: Evidence from the quasi-natural experiment in China. Energy Economics, 127, 107050. [Google Scholar] [CrossRef] [Scilit]
  44. Hoang, L. D., Tuan, T. M., Nha, P. V. T., & Phuong, T. T. (2019). Impact of agency costs on firm performance: Evidence from Vietnam. Organizations and Markets in Emerging Economies, 10(2), 294–309. [Google Scholar] [CrossRef] [Scilit]
  45. Homer, S. T., & Lim, W. M. (2024). Theory development in a globalized world: Bridging “doing as the romans do” with “understanding why the romans do it”. Global Business and Organizational Excellence, 43(3), 127–138. [Google Scholar] [CrossRef] [Scilit]
  46. Hope, O. K., & Thomas, W. B. (2008). Managerial empire building and firm disclosure. Journal of Accounting Research, 46(3), 591–626. [Google Scholar] [CrossRef] [Scilit]
  47. Huang, F., Chen, M., & Liu, R. (2023). The nature of corporate social responsibility disclosure and investment efficiency: Evidence from China. Frontiers in Environmental Science, 11, 1028745. [Google Scholar] [CrossRef] [Scilit]
  48. Imelda, E., & Patricia, D. A. (2018, November 8–9). Capital structure, corporate governance, and agency costs. The 7th International Conference on Entrepreneurship and Business Management (pp. 203–207), Jakarta, Indonesia. [Google Scholar] [CrossRef] [Scilit]
  49. Ioannou, I., & Serafeim, G. (2019). The consequences of mandatory corporate sustainability reporting. In A. McWilliams, D. E. Rupp, D. S. Siegel, G. K. Stahl, & D. A. Waldman (Eds.), The Oxford handbook of corporate social responsibility (pp. 451–489). Oxford University Press. [Google Scholar] [CrossRef] [Scilit]
  50. Jensen, M. C. (1986). Agency costs of free cash flow, corporate finance, and takeovers. The American Economic Review, 76(2), 323–329. [Google Scholar]
  51. Jensen, M. C. (2001). Value maximization, stakeholder theory, and the corporate objective function. Journal of Applied Corporate Finance, 14(3), 8–21. [Google Scholar] [CrossRef] [Scilit]
  52. Jensen, M. C., & Meckling, W. H. (1976). Theory of the firm: Managerial behavior, agency costs and ownership structure. Journal of Financial Economics, 3(4), 305–360. [Google Scholar] [CrossRef] [Scilit]
  53. Jiang, G., Lee, C. M. C., & Yue, H. (2010). Tunneling through intercorporate loans: The China experience. Journal of Financial Economics, 98(1), 1–20. [Google Scholar] [CrossRef] [Scilit]
  54. Johnson, S., La Porta, R., Lopez-de-Silanes, F., & Shleifer, A. (2000). Tunneling. American Economic Review, 90(2), 22–27. [Google Scholar] [CrossRef] [Scilit]
  55. Kim, S., Tam, L., & Kim, J.-N. (2015). Reconceptualizing corporate social responsibility (CSR) as corporate public responsibility (CPR). In A. Stachowicz-Stanusch (Ed.), Corporate social performance (1st ed., pp. 373–388). Emerald Publishing Limited. [Google Scholar] [CrossRef] [Scilit]
  56. Kontuš, E. (2021). Agency costs, capital structure and corporate performance: A survey of Croatian, Slovenian and Czech listed companies. Ekonomski Vjesnik, 34(1), 73–85. [Google Scholar] [CrossRef] [Scilit]
  57. Krüger, P. (2015). Corporate goodness and shareholder wealth. Journal of Financial Economics, 115(2), 304–329. [Google Scholar] [CrossRef] [Scilit]
  58. Le Breton-Miller, I., & Miller, D. (2009). Agency vs. stewardship in public family firms: A social embeddedness reconciliation. Entrepreneurship Theory and Practice, 33(6), 1169–1191. [Google Scholar] [CrossRef] [Scilit]
  59. Lemmon, M. L., & Lins, K. V. (2003). Ownership structure, corporate governance, and firm value: Evidence from the East Asian financial crisis. The Journal of Finance, 58(4), 1445–1468. [Google Scholar] [CrossRef] [Scilit]
  60. Liang, X., & Chen, X. C. (2024). Mandatory corporate social responsibility disclosure and financial constraints: Evidence from China. International Review of Economics & Finance, 89, 954–974. [Google Scholar] [CrossRef] [Scilit]
  61. Liu, Q., & Tian, G. (2012). Controlling shareholder, expropriations and firm’s leverage decision: Evidence from Chinese non-tradable share reform. Journal of Corporate Finance, 18(4), 782–803. [Google Scholar] [CrossRef] [Scilit]
  62. Lopatta, K., Buchholz, F., & Kaspereit, T. (2016). Asymmetric information and corporate social responsibility. Business & Society, 55(3), 458–488. [Google Scholar] [CrossRef] [Scilit]
  63. Luo, Q., Li, H., & Zhang, B. (2015). Financing constraints and the cost of equity: Evidence on the moral hazard of the controlling shareholder. International Review of Economics & Finance, 36, 99–106. [Google Scholar] [CrossRef] [Scilit]
  64. Makosa, L., Yang, J., Sitsha, L., & Jachi, M. (2020). Mandatory CSR disclosure and firm investment behavior: Evidence from a quasi-natural experiment in China. Journal of Corporate Accounting & Finance, 31(4), 33–47. [Google Scholar] [CrossRef] [Scilit]
  65. Manchiraju, H., & Rajgopal, S. (2017). Does corporate social responsibility (CSR) create shareholder value? Evidence from the Indian Companies Act 2013. Journal of Accounting Research, 55(5), 1257–1300. [Google Scholar] [CrossRef] [Scilit]
  66. McKnight, P. J., & Weir, C. (2009). Agency costs, corporate governance mechanisms and ownership structure in large UK publicly quoted companies: A panel data analysis. The Quarterly Review of Economics and Finance, 49(2), 139–158. [Google Scholar] [CrossRef] [Scilit]
  67. McLean, R. D., Zhang, T., & Zhao, M. (2012). Why does the law matter? Investor protection and its effects on investment, finance, and growth. Journal of Finance, 67(1), 313–350. [Google Scholar] [CrossRef] [Scilit]
  68. McNichols, M. F. (2002). Discussion of the quality of accruals and earnings: The role of accrual estimation errors. The Accounting Review, 77(Suppl. S1), 61–69. [Google Scholar] [CrossRef] [Scilit]
  69. McNichols, M. F., & Stubben, S. R. (2008). Does earnings management affect firms’ investment decisions? The Accounting Review, 83(6), 1571–1603. [Google Scholar] [CrossRef] [Scilit]
  70. Milner, H. V. (2021). Is global capitalism compatible with democracy? Inequality, insecurity, and interdependence. International Studies Quarterly, 65(4), 1097–1110. [Google Scholar] [CrossRef] [Scilit]
  71. Morck, R., Wolfenzon, D., & Yeung, B. (2005). Corporate governance, economic entrenchment, and growth. Journal of Economic Literature, 43(3), 655–720. [Google Scholar] [CrossRef] [Scilit]
  72. Myers, S. C., & Majluf, N. S. (1984). Corporate financing and investment decisions when firms have information that investors do not have. Journal of Financial Economics, 13(2), 187–221. [Google Scholar] [CrossRef] [Scilit]
  73. Orlitzky, M., Schmidt, F. L., & Rynes, S. L. (2003). Corporate social and financial performance: A meta-analysis. Organization Studies, 24(3), 403–441. [Google Scholar] [CrossRef] [Scilit]
  74. Poursoleyman, E., Mansourfar, G., Homayoun, S., & Rezaee, Z. (2022). Business sustainability performance and corporate financial performance: The mediating role of optimal investment. Managerial Finance, 48(2), 348–369. [Google Scholar] [CrossRef] [Scilit]
  75. Poutziouris, P., Savva, C. S., & Hadjielias, E. (2015). Family involvement and firm performance: Evidence from UK listed firms. Journal of Family Business Strategy, 6(1), 14–32. [Google Scholar] [CrossRef] [Scilit]
  76. Preston, L. E., & O’Bannon, D. P. (1997). The corporate social-financial performance relationship: A typology and analysis. Business & Society, 36(4), 419–429. [Google Scholar] [CrossRef] [Scilit]
  77. Prior, D., Surroca, J., & Tribó, J. A. (2008). Are socially responsible managers really ethical? Exploring the relationship between earnings management and corporate social responsibility. Corporate Governance: An International Review, 16(3), 160–177. [Google Scholar] [CrossRef] [Scilit]
  78. Qamruzzaman, M., Jianguo, W., Jahan, S., & Yingjun, Z. (2021). Financial innovation, human capital development, and economic growth of selected South Asian countries: An application of ARDL approach. International Journal of Finance & Economics, 26(3), 4032–4053. [Google Scholar] [CrossRef] [Scilit]
  79. Qian, M., & Yeung, B. Y. (2015). Bank financing and corporate governance. Journal of Corporate Finance, 32, 258–270. [Google Scholar] [CrossRef] [Scilit]
  80. Rosenbaum, P. R., & Rubin, D. B. (1985). Constructing a control group using multivariate matched sampling methods that incorporate the propensity score. The American Statistician, 39(1), 33–38. [Google Scholar] [CrossRef] [Scilit]
  81. Roy, P. P., Rao, S., & Zhu, M. (2022). Mandatory CSR expenditure and stock market liquidity. Journal of Corporate Finance, 72, 102158. [Google Scholar] [CrossRef] [Scilit]
  82. Samet, M., & Jarboui, A. (2017). How does corporate social responsibility contribute to investment efficiency? Journal of Multinational Financial Management, 40, 33–46. [Google Scholar] [CrossRef] [Scilit]
  83. Scherer, A. G., Palazzo, G., & Baumann, D. (2006). Global rules and private actors: Toward a new role of the transnational corporation in global governance. Business Ethics Quarterly, 16(4), 505–532. [Google Scholar] [CrossRef] [Scilit]
  84. Shleifer, A., & Vishny, R. W. (1997). A survey of corporate governance. The Journal of Finance, 52(2), 737–783. [Google Scholar] [CrossRef]
  85. Singh, M., & Davidson, W. N., III. (2003). Agency costs, ownership structure, and corporate governance mechanisms. Journal of Banking & Finance, 27(5), 793–816. [Google Scholar] [CrossRef] [Scilit]
  86. Stein, J. C. (2003). Agency, information and corporate investment. In Handbook of the economics of finance (Vol. 1, pp. 111–165). Elsevier. [Google Scholar] [CrossRef] [Scilit]
  87. Vance, S. (1975). Are socially responsible firms good investment risks? Management Review, 64, 18–24. [Google Scholar]
  88. Waddock, S. A., & Graves, S. B. (1997). The corporate social performance-financial performance link. Strategic Management Journal, 18(4), 303–319. [Google Scholar] [CrossRef]
  89. Wang, Q., Dou, J., & Jia, S. (2016). A meta-analytic review of corporate social responsibility and corporate financial performance: The moderating effect of contextual factors. Business & Society, 55(8), 1083–1121. [Google Scholar] [CrossRef] [Scilit]
  90. Ward, J. L. (2004). Perpetuating the family business: 50 lessons learned from long-lasting, successful families in business. Macmillan. [Google Scholar]
  91. Zellweger, T. M., Eddleston, K. A., & Kellermanns, F. W. (2010). Exploring the concept of familiness: Introducing family firm identity. Journal of Family Business Strategy, 1(1), 54–63. [Google Scholar] [CrossRef] [Scilit]
Table 1. Baseline results.
(1)(2)
VariablesAbsinvineff1Absinvineff2
Post × Treat−0.0158 ***−0.0160 ***
(0.0061)(0.0061)
Size0.0488 ***0.0477 ***
(0.0037)(0.0037)
Lev−0.0074−0.0073
(0.0059)(0.0059)
Roa0.0709 **0.0603 **
(0.0295)(0.0295)
Cashflow−0.0314−0.0315
(0.0270)(0.0270)
Tangibility0.2927 ***0.2934 ***
(0.0204)(0.0204)
Growth0.00030.0004 *
(0.0002)(0.0002)
Constant−0.4153 ***−0.4093 ***
(0.0294)(0.0294)
Observations20,87820,878
R-squared0.04250.0416
Number of id43144314
Firm Fixed EffectsYesYes
Year Fixed EffectsYesYes
Note: This table reports how CSR law impacts investment efficiencies. Control variables include firm size (Size), leverage (Lev), return on assets (Roa), cashflow (Cashflow), tangibility (Tangibility), and sales growth (Growth). We also control for firm and year fixed effects and employ robust standard errors in the regressions. *, **, and *** indicate the level of statistical significance at 10%, 5%, and 1%, respectively.
Table 2. Mechanism test—financial reporting quality channel.
First Stage ResultSecond Stage Result
(1) (2)(3)
VariablesFRQ Absinvineff1Absinvineff2
Post × Treat0.0412 ***FRQ−0.0359 **−0.0358 **
(0.00930) (0.0150)(0.0149)
Size−0.161 ***Size0.0420 ***0.0408 ***
(0.0094) (0.0038)(0.0038)
Lev0.0278 **Lev−0.0074−0.0071
(0.0116) (0.0066)(0.0066)
Roa0.0171Roa0.04580.0344
(0.0438) (0.0285)(0.0284)
Growth−0.0056 ***Cashflow−0.0168−0.0177
(0.0006) (0.0240)(0.0240)
Tangibility0.299 ***0.300 ***
(0.0200)(0.0200)
Growth0.00010.0001
(0.0003)(0.0003)
Constant1.321 ***Constant−0.0359 **−0.0358 **
(0.0713) (0.0150)(0.0149)
Observations20,482Observations19,83519,835
R-squared0.221R-squared0.0470.046
Number of id4261Number of id41544154
Firm Fixed EffectsYesFirm Fixed EffectsYesYes
Year Fixed EffectsYesYear Fixed EffectsYesYes
Note: This table reports the results of testing the financial reporting channel in which CSR law impacts investment efficiencies. Panel A presents the first stage results of testing how CSR law impacts financial reporting (FRQ) and includes the firm size (Size), leverage (Lev), return on assets (Roa), return on equity (Roe), and sales growth (Growth) as control variables. Panel B provides the second stage results of testing how financial reporting impacts investment efficiencies. Control variables include firm size (Size), leverage (Lev), return on assets (Roa), cashflow (Cashflow), tangibility (Tangibility), and sales growth (Growth). We also control for firm and year fixed effects and employ robust standard errors in the regressions. ** and *** indicate the level of statistical significance at 5%, and 1%, respectively.
Table 3. Mechanism test—agency cost channel.
Panel A. Operating Expenses to Sales as Agency Costs
First Stage ResultSecond Stage Result
(1) (2)(3)
VariablesOpexptosales Absinvineff1Absinvineff2
Post × Treat−0.101 ***Opexptosales−0.0258 ***−0.0308 ***
(0.0126) (0.0071)(0.0071)
LogSales−0.100 ***Size0.0456 ***0.0441 ***
(0.0126) (0.0036)(0.0036)
Lev0.133 ***Lev−0.0058−0.0053
(0.0054) (0.0056)(0.0056)
Roa0.0866 ***Roa0.0612 **0.0500 *
(0.0136) (0.0288)(0.0288)
Cashflow−0.244 ***Cashflow−0.0272−0.0264
(0.0608) (0.0270)(0.0270)
Tangibility0.289 ***0.289 ***
(0.0205)(0.0205)
Growth0.00030.0004 *
(0.0002)(0.0002)
Constant0.0515Constant−0.366 ***−0.352 ***
(0.0380) (0.0318)(0.0318)
Observations25,234Observations20,87820,878
R-squared0.184R-squared0.0440.043
Numberofid4599Numberofid43144314
Firm Fixed EffectsYesFirm Fixed EffectsYesYes
Year Fixed EffectsYesYear Fixed EffectsYesYes
Panel B. Sales to Assets as Agency Costs
First Stage ResultSecond Stage Result
(1) (2)(3)
VariablesSalestoassets Absinvineff1Absinvineff2
Post × Treat0.0336 ***Salestoassets−0.0324 ***−0.0380 ***
(0.0126) (0.0076)(0.0076)
Size−0.0632 ***Size0.0452 ***0.0436 ***
(0.0090) (0.0036)(0.0036)
Lev−0.0031Lev−0.0071−0.0069
(0.0056) (0.0058)(0.0058)
Roa0.795 ***Roa0.0864 ***0.0796 ***
(0.0498) (0.0296)(0.0296)
Growth0.0019 ***Cashflow−0.0236−0.0223
(0.0002) (0.0269)(0.0268)
Tangibility0.288 ***0.288 ***
(0.0205)(0.0206)
Growth0.00030.0004 **
(0.0002)(0.0002)
Constant1.347 ***Constant−0.358 ***−0.344 ***
(0.0680) (0.0310)(0.0311)
Observations25,237Observations20,87820,878
R-squared0.085R-squared0.0440.044
Numberofid4599Numberofid43144314
Firm Fixed EffectsYesFirm Fixed EffectsYesYes
Year Fixed EffectsYesYear Fixed EffectsYesYes
Note for Panel A: This table reports the results of testing the agency costs and the operating expenses to sales (Opexptosales) channel, in which CSR law impacts investment efficiencies. Panel A presents the first stage results of testing how CSR law impacts agency costs. We include the natural logarithm of sales (LogSales), leverage (Lev), return on assets (Roa), and annual growth in sales (Growth) as control variables. Second-stage results show how agency costs impact investment efficiencies. Control variables include firm size (Size), leverage (Lev), return on assets (Roa), cashflow (Cashflow), tangibility (Tangibility), and sales growth (Growth). We also control for firm and year fixed effects and employ robust standard errors in the regressions. We report robust standard error in parentheses. *, ** and *** indicate the level of statistical significance at 10%, 5%, and 1%, respectively. Note for Panel B: This table reports the results of testing the agency cost channel (sales to assets) in which CSR law impacts investment efficiencies.
Table 4. HUF and Non-HUF promoter holding.
(1)(2)(3)(4)
HUF Non-HUF
VariablesAbsinvineff1Absinvineff2Absinvineff1Absinvineff2
Post × Treat−0.0183 **−0.0189 **−0.0158 ***−0.0160 ***
(0.0074)(0.0074)(0.0060)(0.006)
Size0.0489 ***0.0477 ***0.0488 ***0.0477 ***
(0.0046)(0.0046)(0.00371)(0.0037)
Lev−0.0070−0.0070−0.0074−0.0072
(0.0047)(0.0047)(0.0058)(0.0058)
Roa0.0695 **0.0592 *0.0709 **0.0603 **
(0.0305)(0.0304)(0.0295)(0.0295)
Cashflow−0.0162−0.0162−0.0314−0.0315
(0.0300)(0.0299)(0.0270)(0.0270)
Tangibility0.285 ***0.286 ***0.293 ***0.293 ***
(0.0230)(0.0230)(0.0204)(0.0204)
Growth0.00030.00040.00030.0004 *
(0.0002)(0.0002)(0.0002)(0.0002)
Constant−0.420 ***−0.413 ***−0.415 ***−0.409 ***
(0.0371)(0.0370)(0.0294)(0.0294)
Observations13,22413,22420,87820,878
R-squared0.0420.0410.0420.042
Numberofid2894289443144314
Firm Fixed EffectsYesYesYesYes
Year Fixed EffectsYesYesYesYes
Note: This table reports the results for four different sets of subsample analyses on our baseline regression. The first analysis in Panel A splits our main sample into HUF and non-HUF firms. We include the same set of control variables as in the baseline model. We also control for firm and year fixed effects and employ robust standard errors in all regressions. *, **, and *** indicate the level of statistical significance at 10%, 5%, and 1%, respectively.
Table 5. Institutional investors.
(1)(2)
VariablesAbsinvineff1Absinvineff2
Post × Treat−0.0147 *−0.0144 *
(0.0085)(0.0086)
Size0.0483 ***0.0470 ***
(0.0051)(0.0051)
Lev−0.0135−0.0132
(0.0093)(0.0094)
Roa0.0802 *0.0701
(0.0454)(0.0455)
Cashflow−0.0710 *−0.0715 *
(0.0406)(0.0406)
Tangibility0.287 ***0.288 ***
(0.0289)(0.0289)
Growth−0.0000.000
(0.0003)(0.0003)
Constant−0.401 ***−0.394 ***
(0.0397)(0.0397)
Observations11,45811,458
R-squared0.0420.041
Number of id23992399
Firm Fixed EffectsYesYes
Year Fixed EffectsYesYes
Note: This table reports the results for institutional investors as non-promoters on our baseline regression. We include the same set of control variables as in the baseline model. We also control for firm and year fixed effects and employ robust standard errors in all regressions. * and *** indicate the level of statistical significance at 10% and 1%, respectively.
Table 6. Ownership characteristics.
(1)(2)(3)(4)(5)(6)(7)(8)
Group Private Government Foreign
VariablesAbsinvineff1 Absinvineff2 Absinvineff1 Absinvineff2 Absinvineff1f1 Absinvineff2 Absinvineff1 Absinvineff2
Post × Treat−0.010 −0.010 −0.021 ***−0.023 ***−0.029−0.025 0.059 0.0618
(0.009)(0.009)(0.007)(0.007)(0.019)(0.019)(0.071)(0.073)
Size 0.055 ***0.055 ***0.058 ***0.057 ***0.044 0.041 0.02960.028
(0.009)(0.009)(0.005)(0.005)(0.033)(0.032)(0.022)(0.021)
Lev−0.008 −0.008−0.007 −0.007 −0.0093−0.004 0.100 ***0.100 ***
(0.009)(0.009)(0.009)(0.009)(0.028)(0.028)(0.025)(0.025)
Roa−0.035 −0.047 0.118 ***0.108 ***0.186 **0.185 **−0.280 −0.292
(0.035)(0.035)(0.041)(0.041)(0.081)(0.082)(0.329)(0.331)
Cashflow0.0490.049 −0.065 **−0.064 **−0.005 −0.008 −0.090 −0.104
(0.058)(0.058)(0.032)(0.032)(0.078)(0.077)(0.082) (0.085)
Tangibility0.256 ***0.256 ***0.335 ***0.336 ***0.143 0.153 0.286 **0.292 **
(0.039)(0.039)(0.030)(0.030)(0.121)(0.120)(0.110)(0.112)
Growth0.0000.0000.000 0.000 0.001 ***0.001 ***0.002 ***0.002 ***
(0.000)(0.000)(0.000)(0.000)(0.000)(0.000)(0.000)(0.000)
Constant−0.499 ***−0.497 ***−0.467 ***−0.460 ***−0.357−0.344 −0.404 *−0.392
(0.080)(0.079)(0.040)(0.040)(0.256)(0.252)(0.242)(0.239)
Observations6335633513,41913,419675675449449
R-squared0.050 0.0490.037 0.0360.1670.171 0.294 0.302
Number of id1376137629792979163163 102102
Firm Fixed EffectsYesYes YesYes YesYes YesYes
Year Fixed EffectsYesYesYesYesYesYesYesYes
Note: This table reports the results for two different sets of subsample analyses on our baseline regression. We split our main sample based on ownership status into four sub-samples- group companies, private companies, foreign companies, and government companies. We include the same set of control variables as in the baseline model. We also control for firm and year fixed effects and employ robust standard errors in all regressions. *, **, and *** indicate the level of statistical significance at 10%, 5%, and 1%, respectively.
Table 7. Firms located in different Indian states.
(1)(2)(3)(4)(5)(6)(7)(8)
High HDILow HDIHigh GDILow GDI
VariablesAbsinvineff1 Absinvineff2Absinvineff1Absinvineff2 Absinvineff1 Absinvineff2 Absinvineff1 Absinvineff2
Post × Treat−0.015 −0.015 −0.017 ** −0.016 * −0.014 −0.015−0.018 ** −0.017 **
(0.010) (0.010) (0.009) (0.009) (0.011) (0.011) (0.008) (0.008)
Size 0.053 *** 0.051 *** 0.044 *** 0.042 *** 0.058 *** 0.056 *** 0.046 *** 0.045 ***
(0.006) (0.006) (0.005) (0.005) (0.007) (0.007) (0.005) (0.005)
Lev−0.007 −0.008−0.005 −0.005 −0.007 −0.007 −0.003−0.003
(0.011) (0.011) (0.004) (0.004) (0.013) (0.013) (0.004) (0.004)
Roa0.062 0.0527 0.098 ** 0.0871 ** 0.0780.0680.088 ** 0.077 *
(0.048) (0.048) (0.043) (0.043) (0.052) (0.052) (0.041) (0.041)
Cashflow−0.063−0.064 −0.032 −0.032 −0.044 −0.045 −0.040 −0.039
(0.044) (0.045) (0.038) (0.038) (0.048) (0.048) (0.031) (0.036)
Tangibility0.303 *** 0.304 *** 0.292 *** 0.292 *** 0.305 *** 0.307 *** 0.292 *** 0.292 ***
(0.032) (0.032) (0.030) (0.030) (0.036) (0.036) (0.027) (0.027)
Growth0.0000..0000.007 ** 0.008 * 0.000 0.000 0.006 ** 0.007 **
(0.000) (0.000) (0.000) (0.000) (0.000) (0.000) (0.000) (0.000)
Constant −0.448 *** −0.441 *** −0.378 *** −0.371 *** −0.485 *** −0.478 *** −0.398 *** −0.392 ***
(0.051) (0.051) (0.040) (0.040) (0.059) (0.059) (0.040) (0.040)
Observations 9108 9108 8782 8782 7728 7728 10,162 10,162
R-squared 0.043 0.041 0.044 0.043 0.046 0.044 0.044 0.043
Number of id 1940 1940 1849 1849 1940 1940 2148 2148
Firm Fixed Effects Yes Yes Yes Yes Yes Yes Yes Yes
Year Fixed Effects Yes Yes Yes Yes Yes Yes Yes Yes
Note: This table reports the results for two different sets of subsample analyses on our baseline regression. The first analysis in Panel A splits our main sample into firms with high and low Human Development Index values. The second analysis, as reported in Panel B, separately examines firms with high and low Gender Diversity Index values. We include the same set of control variables as in the baseline model. We also control for firm and year fixed effects and employ robust standard errors in all regressions. *, **, and *** indicate the level of statistical significance at 10%, 5%, and 1%, respectively.
Table 8. Effect of CSR law on overinvesting firms.
(1)(2)
VariablesAbsinvineff1Absinvineff2
Post × Treat × Over−0.110 ***−0.107 ***
(0.0073)(0.0073)
Size0.0363 ***0.0348 ***
(0.0031)(0.0031)
Lev−0.00351−0.0032
(0.0053)(0.0053)
Roa0.01750.0060
(0.0268)(0.0268)
Cashflow−0.0191−0.0189
(0.0244)(0.0244)
Tangibility0.212 ***0.211 ***
(0.0180)(0.0180)
Growth0.0000.000
(0.0002)(0.0002)
Constant−0.421 ***−0.414 ***
(0.0261)(0.0260)
Observations20,87820,878
R-squared0.2010.206
Number of id43144314
Firm Fixed EffectsYesYes
Year Fixed EffectsYesYes
Note: This table reports the results of how CSR law impacts investment efficiencies in the firms that are over-investing. We create a dummy to classify the firms into over- and underinvesting. The dummy variable takes the value of 1 for overinvestment scenarios (positive residuals) and 0 otherwise. Control variables include firm size (Size), leverage (Lev), return on assets (Roa), cash flow (Cashflow), Tangibility (Tangibility), and sales growth (Growth). We also control for firm and year fixed effects and employ robust standard errors in the regressions. *** indicate the level of statistical significance at 1%.
Table 9. Propensity score matching.
Panel A. Propensity Score MatchingPanel B. PSM Balance Test
(1)(2)Mean Matched Firmst-Test
VariablesAbsinvineff1Absinvineff2VariablesTreatControl%biastp > |t|
Post × Treat−0.015 **−0.016 **
(0.006)(0.0067)
Size0.0488 ***0.0477 ***Size7.3460.20.20.140.890
(0.002)(0.002)
Lev−0.007 **−0.007 **Lev0.70.6801.91.560.120
(0.003)(0.0034)
Roa0.070 ***0.0603 ***Roa0.04820.049−0.9−0.680.499
(0.019)(0.019)
Cashflow−0.031 **−0.031 **Cashflow0.04250.0420.20.180.859
(0.016)(0.016)
Tangibility0.293 ***0.293 ***Tangibility0.2590.25710.880.378
(0.017)(0.017)
Growth0.0003 ***0.004 ***Growth1.58611.3581.61.470.141
(0.000)(0.000)
Constant−0.415 ***−0.409 ***
(0.0200)(0.0200)
Observations20,87820,878
No of id43144314
R-squared0.0420.042
Firm Fixed EffectsYes Yes
Year Fixed EffectsYesYes
Note: This table reports the results of propensity score matching. In Panel A, we use the baseline regression. We include the same set of control variables as in the baseline model. We also control for firm and year fixed effects and employ robust standard errors in all regressions. Panel B reports the likelihood model for both the matched and unmatched Treat and control groups using PSM with kernel density. ** and *** indicate the level of statistical significance at 5%, and 1%, respectively.
Disclaimer/Publisher’s Note: The statements, opinions and data contained in all publications are solely those of the individual author(s) and contributor(s) and not of MDPI and/or the editor(s). MDPI and/or the editor(s) disclaim responsibility for any injury to people or property resulting from any ideas, methods, instructions or products referred to in the content.