1. Introduction
In the constantly changing world of financial research, volatility is considered a major issue in financial markets and has a significant influence on financial and economic research, especially during times of crisis. The term volatility is directly related to uncertainty: it is primarily associated with risk assessment and is highly considered a potential proxy of risk in financial models. Both financial institutions and investors always strive to understand the risk associated with investment, and volatility has a prominent role in the assessment of risk in investment, especially in portfolio management. Furthermore, it is a key component of modern portfolio theory, aiding in the prediction of expected returns from a portfolio of diversified assets. Furthermore, understanding volatility is essential for strategic asset allocation within investment portfolios, enabling investors to balance expected returns against their risk tolerance. The assessment of return volatility in financial assets remains a core focus in contemporary financial research. However, accurately predicting market volatility continues to be a major challenge. Numerous models and techniques have been developed to address this issue, including the GJR-GARCH model (
Emenike, 2010;
Ma et al., 2020;
Monfared & Enke, 2014), the multifractal model of asset returns (MMAR) (
Günay, 2016;
Lux, 2008), and the integrated GARCH (IGARCH) model (
Bentes, 2015;
Rashid et al., 2011), among others (
Chen & Chang, 2022;
Endri et al., 2021;
Khan et al., 2023;
Kumar & Khanna, 2018). However, their effectiveness varies across different stock markets. This discrepancy contributes to the complexities that researchers and financial analysts encounter in their attempts to forecast market returns and volatilities.
The COVID-19 outbreak has affected the global economy extremely (
Ahmad et al., 2021a;
Brada et al., 2021;
Gajewski & Kutan, 2023;
Gur et al., 2023;
İlbasmış, 2023;
Kartal et al., 2022;
Setiawan et al., 2022). Financial markets have also shown unparalleled behavior during the COVID-19 period (
Adekoya et al., 2022;
Ahmad et al., 2021b;
W. M. Ahmed, 2022;
Fernandez-Perez et al., 2021;
Khan et al., 2023;
Naeem et al., 2023;
Yousaf & Ali, 2020), underscoring the importance of precise volatility modeling. The GARCH model’s flexibility in adapting to fluctuating volatility patterns emerged as an invaluable asset during this tumultuous period.
Boubaker et al. (
2023a) examined volatility spillovers across financial markets—including stocks, bonds, forex, oil, gold, and Bitcoin—in response to extreme events such as the COVID-19 pandemic, energy shocks, and inflation using a quantile VAR model. Their study confirmed the asymmetric impact of crises, particularly those stemming from the COVID-19 pandemic and energy shocks, including the Russia–Ukraine conflict.
Various researchers have studied financial markets’ responses to the COVID-19 outbreak (
Fang et al., 2023;
Lei et al., 2023;
Naveed et al., 2023;
Xie et al., 2023). For instance,
Yousef (
2020) examined the influence of COVID-19 on the volatility of major G7 markets indices through the application of GARCH and GJR-GARCH models. The findings indicated that each index reached its lowest value in March 2020, Moreover, the outcomes of the regression analysis showed that the increase in new cases daily had significant influences on the volatility of stock markets. Similarly,
Khan et al. (
2023) validated the presence of volatility during COVID-19 across financial markets. Moreover, empirical evidence shows that the GCC stock markets responded significantly to the COVID-19 pandemic (
Abuzayed & Al-Fayoumi, 2021;
Alkhatib et al., 2022;
Bahrini & Filfilan, 2020). Furthermore, geopolitical events, exemplified by the Russia and Ukraine War, introduced additional layers of uncertainty into financial markets. The conflict of Russia–Ukraine has considerably affected the recovery of the global economy from the COVID-19 pandemic. The conflict has introduced heightened uncertainty, affecting investor sentiment and market stability. Trade disruptions and supply chain uncertainties are translating into market volatility, influencing stock prices. Investors are navigating additional risks due to geopolitical tensions, potentially leading to reduced confidence and cautious trading. Overall, this conflict is compounding the challenges of the post-pandemic stock market recovery, underscoring the need to closely monitor its impact on market dynamics.
Umar et al. (
2022) studied financial markets in term of geopolitical risks.
Umar et al. (
2022) adopted a unique approach known as TVP-VAR for assessing the interconnectedness of financial markets. The findings showed that the conflict has significantly affected short- and long-term volatility connectedness. Furthermore, results also highlighted that Russian bonds and European equities are primary sources of net shock transmission. Additionally, the Russia and Ukraine conflict influences investor sentiment within the GCC. The heightened uncertainty has prompted cautious trading practices and a general aversion to risk among investors, thereby influencing the overall dynamics of tfhe market (
Ulrichsen, 2022).
Despite the critical importance of understanding market volatility during crises, regional markets such as those in the Gulf Cooperation Council (GCC) have received comparatively limited attention. These markets are distinct due to their heavy reliance on oil revenues and unique economic structures, which influence their responses to global economic and geopolitical shocks. Examining the behavior of GCC markets during major crises—such as the COVID-19 pandemic and the Russia–Ukraine conflict—offers valuable insights into their volatility dynamics and asymmetric responses, thereby contributing to the broader literature on regional market resilience. In this context,
Eleuch et al. (
2025) analyzed the role of financial assets as diversifiers, hedges, and safe havens using data from G7, BRIC, and GCC countries. Their findings confirm gold as a reliable safe haven, while resilience varies among other commodities such as oil and wheat. Notably, G7 and BRIC indices demonstrated strong safe-haven performance, whereas the clean energy index offered limited protection. Complementing this,
Saif-Alyousfi (
2025) investigated the impact of the COVID-19 pandemic on foreign direct investment (FDI) across 18 Arab economies, employing detailed econometric analysis to assess the pandemic’s broader economic consequences. The findings revealed a sharp contraction across both FDI inflows and outflows, primarily attributed to economic turbulence and heightened uncertainty caused by rising infection rates. Government policies, including widespread lockdowns and fiscal stimulus measures, played a decisive role in influencing investment dynamics. However, the effects of these interventions varied significantly across sectors and economic environments, underscoring the diverse challenges. Furthermore,
Younis et al. (
2025) discovered that the GCC markets were less interconnected during oil disputes and the Russia–Ukraine conflict, but became more interconnected during the COVID-19 crisis. Moreover,
Younis et al. (
2025) suggested that Oman, Kuwait, gold, and Qatar are the primary recipients of spillovers, while the United Arab Emirates (UAE), Saudi Arabia, and West Texas Intermediate act as key risk spillover transmitters during the Israel–Palestine conflict. Moreover, in the Russia–Ukraine war, BTC and the UAE emerge as significant transmitters, whereas Kuwait and Qatar are the most affected spillover recipients. Furthermore,
Boubaker et al. (
2023b) investigated the market reaction of the global banking industry to the Russia–Ukraine war using event study methodology and regression analyses. The results indicated that bank stock prices had dropped significantly during the war, with an average decline of 1.5% and a sharper 4% drop in Europe. Moreover, the study also highlighted that bank equities showed a greater decline than the broader stock market, with a net market return decrease of 1.4%.
Boubaker et al. (
2022) examined the influence of the Russia–Ukraine conflict on global markets using an event-study methodology. The results showed that conflict resulted in negative cumulative abnormal returns, though the effects varied across markets.
Our research makes a significant contribution to the existing literature in several ways. First, it examines the volatility behavior of GCC stock markets during the COVID-19 pandemic and the Russia–Ukraine crisis, offering valuable insights into the effectiveness of these markets in capturing volatility patterns and underlying risk dynamics. The study provides a comprehensive assessment of how GCC stock markets responded to these unprecedented global events. Second, we employed the exponential GARCH (E-GARCH) model to analyze daily stock market data, allowing for a more nuanced understanding of asymmetries and persistence in volatility. This methodological approach serves as a foundation for uncovering the complex nature of volatility in the GCC markets during crisis periods. Third, the study enriches the literature by presenting empirical evidence on the resilience and responsiveness of GCC stock markets to external shocks, highlighting the distinct volatility effects triggered by both crises. Furthermore, the findings offer practical implications for global investors and policymakers by providing strategic insights to support effective decision-making and enhance market stability during periods of extreme uncertainty. Although previous studies have assessed market volatility in GCC countries during either the COVID-19 pandemic or the Russia–Ukraine conflict, our study is among the first to conduct a parallel and time-segmented analysis of both crises using a E-GARCH model and consistent data structure. This approach allowed us to identify how different types of external shocks—health-related versus geopolitical—impact GCC markets differently. By comparing crisis-specific volatility behavior and asymmetry across individual GCC countries, we contribute to a more significant understanding of regional financial resilience.
Our paper is organized as follows.
Section 2 is the literature review.
Section 3 describes the materials and methods used.
Section 4 presents a discussion of the results. Finally,
Section 5 presents a conclusion, implications, and limitations.
2. Literature Review
The literature shows that the assessment of the impact of both COVID-19 and the Russia–Ukraine crisis on the GCC markets is crucial for unraveling the complex interactions between these global events and their influence on regional financial dynamics. Therefore, the objective of our research was to analyze the volatility patterns of the GCC markets within the context of two distinct, but consequential crises: the COVID-19 pandemic and the Russia–Ukraine conflict. Furthermore, financial crises, whether arising from pandemics or geopolitical conflicts, present complex challenges that necessitate advanced modeling methodologies. The GARCH model, renowned for its aptitude in capturing volatility clustering, abrupt shifts in market sentiment, and asymmetric responses to market shocks, emerges as a potent analytical instrument. Through its comprehensive framework, the GARCH model facilitates insights into the evolving risk perceptions of investors, offering a nuanced comprehension of market dynamics during periods of crisis.
The evaluation of volatility modeling has witnessed a transformative progression from the conventional GARCH model to the more sophisticated EGARCH (exponential GARCH) model. This evolution can be traced through the pioneering contributions of researchers in the literature. Various studies have investigated the volatility behavior of financial returns in the stock markets.
Bonga (
2019) investigated the volatility patterns in the stock market of Zimbabwe. The findings of that study indicated that the EGARCH(1,1) model is the optimal specification, as confirmed by both the Akaike information criterion (AIC) and the Schwarz information criterion (SIC). Importantly, the model reveals a significant presence of asymmetry in stock market volatility. The results further demonstrate that positive and negative shocks have differential effects on stock market returns. While both types of news contribute to increased return volatility, the magnitude of their impacts varies, underscoring the asymmetric nature of market responses to information. Similarly,
Lin (
2018) studied SSE Composite Index volatility behavior using GARCH-type models for volatility modeling. China’s stock market, categorized as an emerging market, has exhibited a pronounced degree of volatility right from its inception, frequently experiencing pronounced and abrupt fluctuations. The research findings
Lin (
2018) highlighted that the SSE Composite Index displays significant attributes of time-varying patterns and clustering. The stock market series distribution demonstrates leptokurtosis behavior, coupled with evident ARCH and GARCH effects. Moreover, the results show that the EGARCH(1,1) model is the superior performer compared to the GARCH(1,1) (symmetric) and TARCH(1,1) models.
Dana (
2016) studied the volatility behavior of Jordan market by utilizing stock price data from 1 January 2005 to 31 December 2014. To achieve this objective,
Dana (
2016) employed the ARCH, GARCH, and EGARCH models, enabling an exploration into the patterns of stock return volatility within the Jordan stock market. The findings highlight that the symmetric ARCH and GARCH models aptly capture the characteristics inherent to the ASE context. Moreover, these models yield additional substantiation for the existence of volatility clustering and leptokurtic tendencies.
Batten et al. (
2023) examine the impact of market volatility, as measured by the VIX, on global banks during the Global Financial Crisis (GFC), the COVID-19 pandemic, and the Russia–Ukraine War using a DCC-GARCH model. Their findings reveal notable symmetric causality between volatility and negative bank returns during the GFC. In contrast, they observed strong asymmetry in volatility effects during the COVID-19 crisis, along with heightened downside risk, with the highest value at risk (VaR) recorded during the GFC. Asian banks showed greater resilience, while European banks were most influenced by COVID-19 and the war. Building on prior studies that analyzed financial market efficiency and volatility during the COVID-19 pandemic (
Khan et al., 2023;
Molina-Muñoz et al., 2025;
Wang et al., 2025), network analysis and spillover dynamics in emerging markets and extreme value behaviors in financial markets (
Khan et al., 2021), this study uniquely examines the asymmetric volatility and persistence of GCC stock markets across two distinct global crises using the E-GARCH model.
4. Results
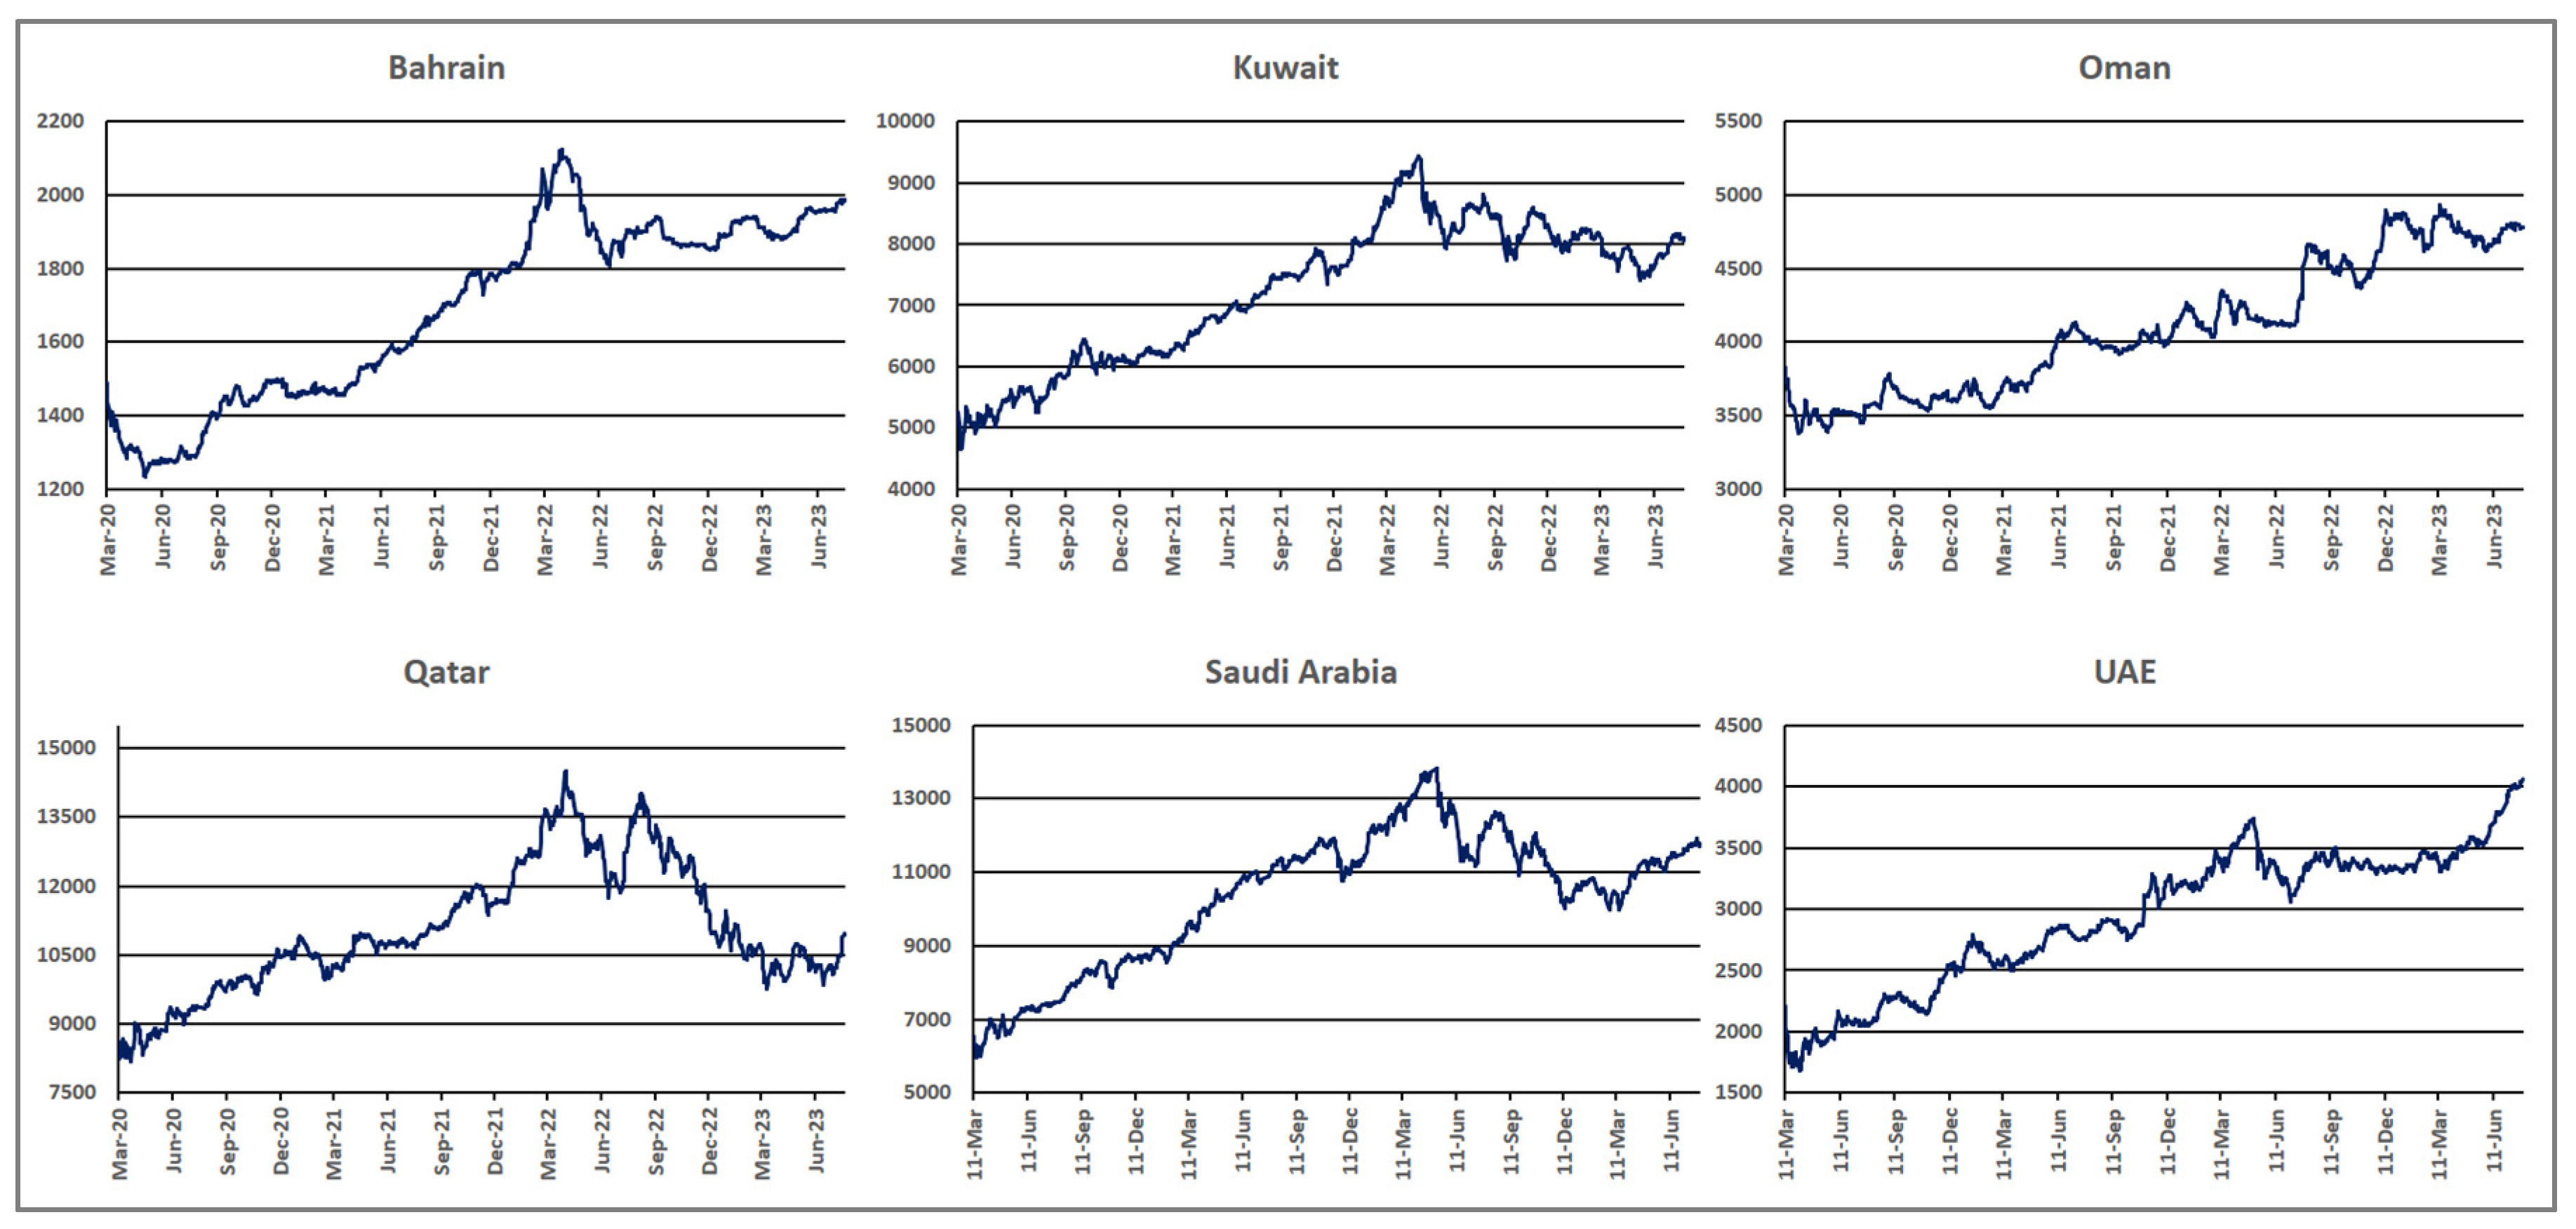
Figure 1 indicates the price trends of all six financial stock markets from 11 March 2020 to 31 July 2023, covering both crises (COVID-19 and Russia–Ukraine). GCC stock prices have experienced declining behavior during the Russia–Ukraine crisis. As shown in
Figure 1, it can be observed Qatar stock prices dropped significantly below 10,000 during the Russia–Ukraine crisis. Moreover, the Bahrain stock market also showed a declining trend in the early stages of the Russia–Ukraine crisis.
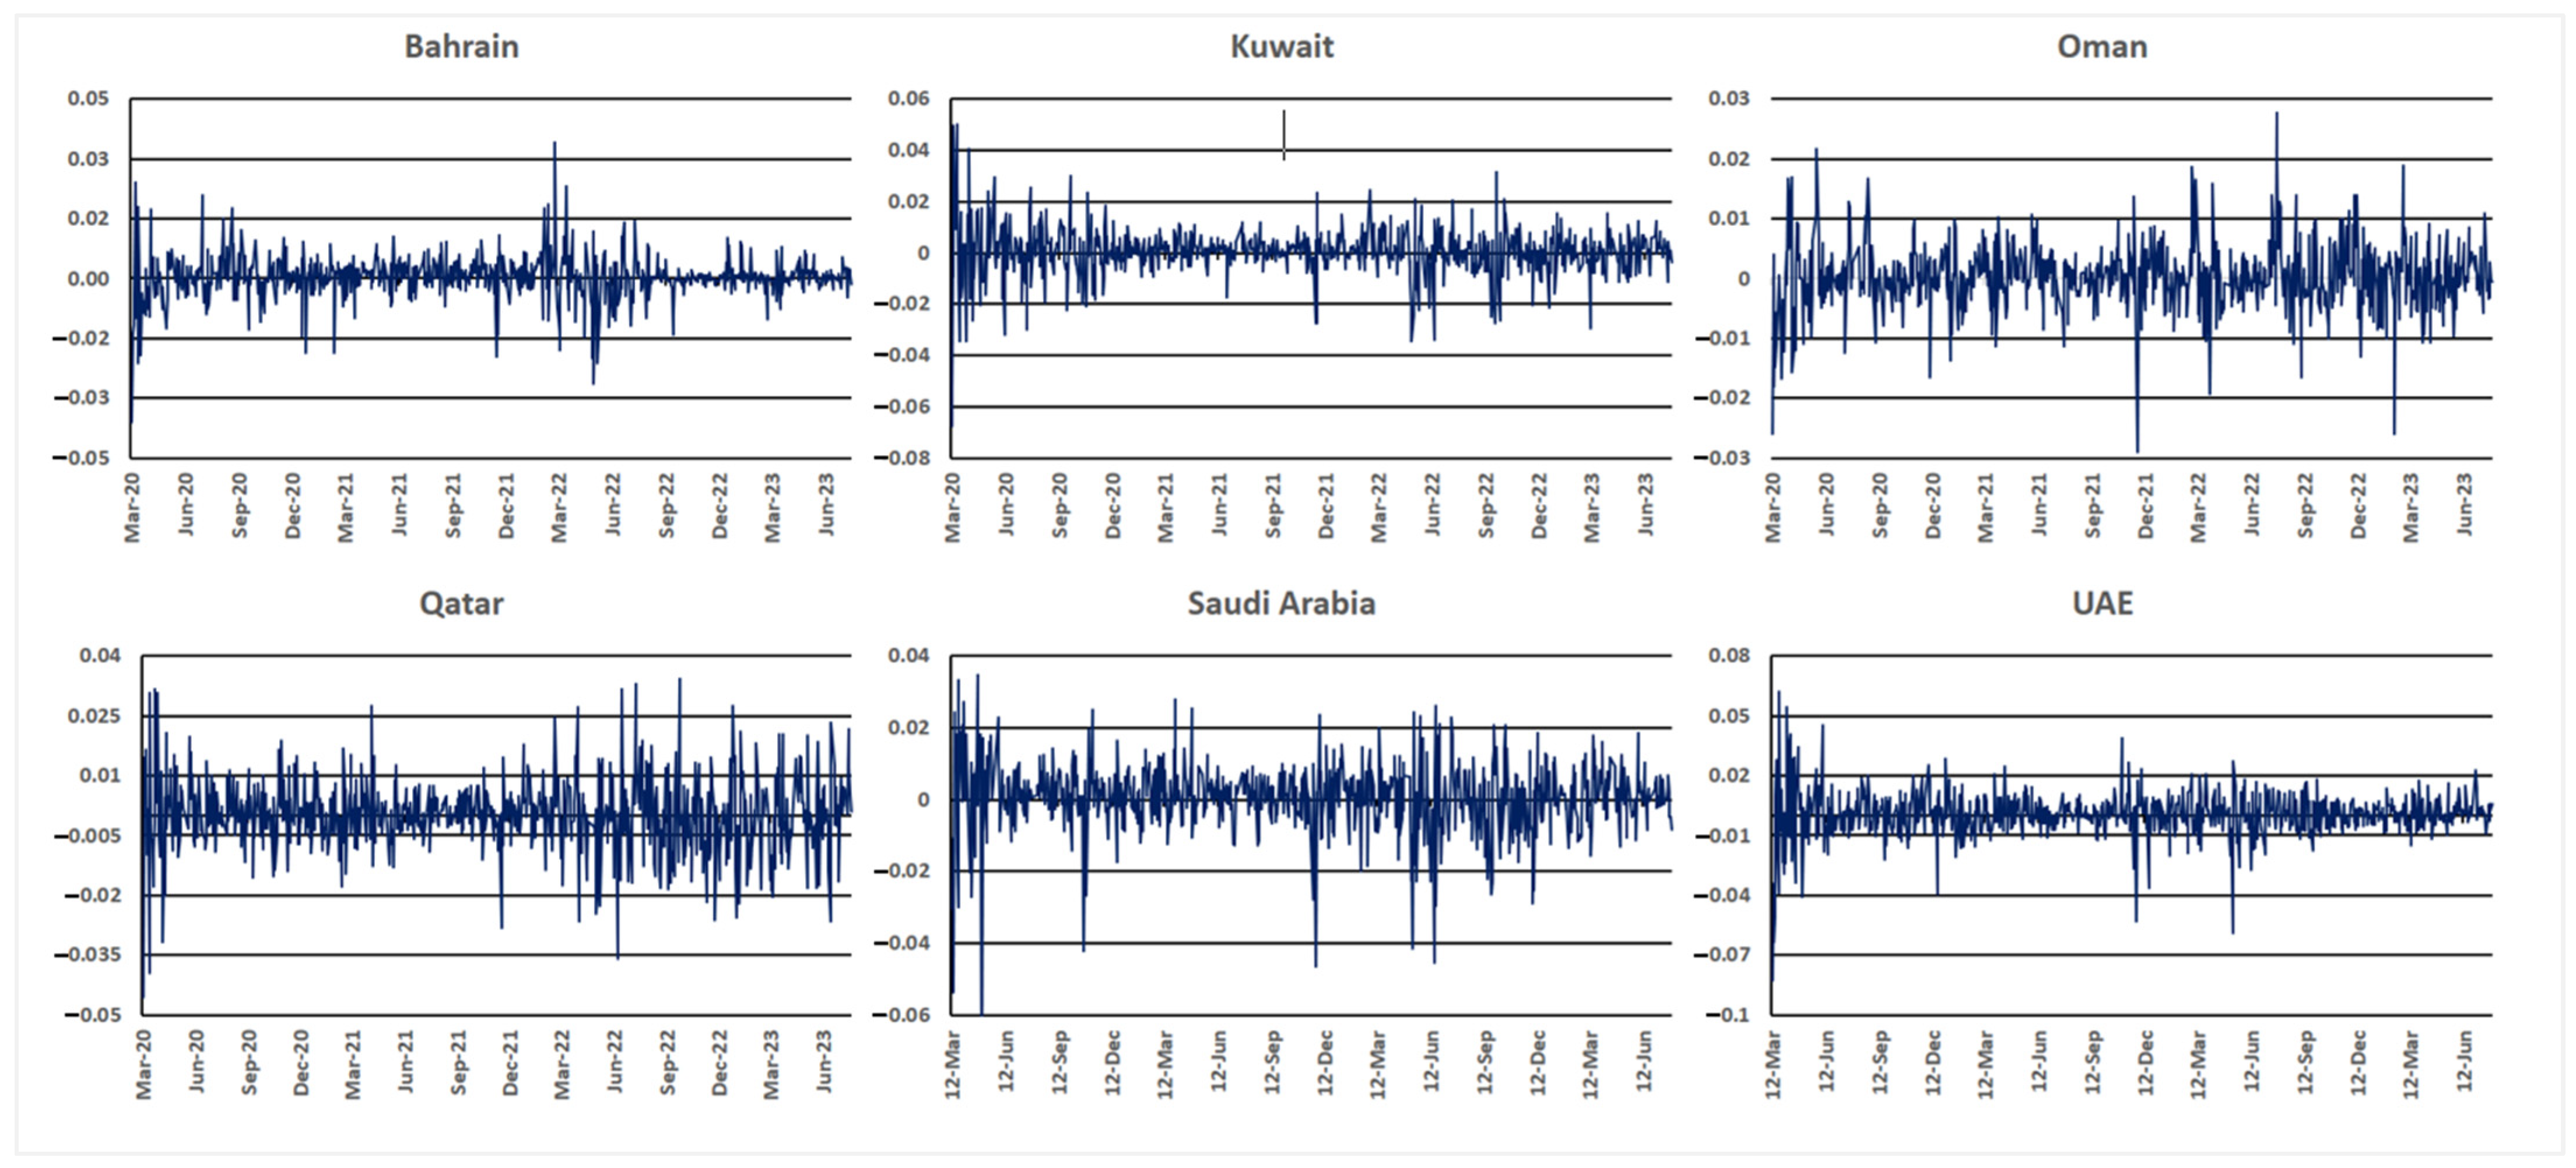
Figure 2 shows the financial return fluctuations of all six GCC stock markets during the crises. The financial returns of GCC stock show a high level of fluctuation over the crisis period, especially on the Oman, Qatar, and Saudi Arabia stock markets. Higher levels of fluctuation have been reported in the financial returns at the early stage of the pandemic. Moreover, the UAE stock market experienced a sharp decline, with returns dropping by as much as 8% at the onset of the COVID-19 pandemic. Qatar’s stock market has been highly volatile during both crisis periods compared to the other GCC stock markets due to the constantly high level of return fluctuations over time.
Table 1 provides a summary of GCC stock market returns. As shown in
Table 1, the average return of all GCC stock markets was positive during the pandemic, indicating minor growth in the overall financial stock market. Furthermore, Saudi Arabia’s stock market exhibited the highest mean return during the COVID-19 pandemic, 0.00133, followed by the Kuwait stock market (0.0009). However, during the Russia–Ukraine conflict, the Kuwait and Saudi Arabia stock markets exhibited negative mean returns of −0.00009 and −0.0020, respectively. Conversely, the highest mean returns were recorded in the UAE (0.00055), followed by the Oman stock market (0.00047) during the same period. Qatar exhibited a negative financial return during the Russia–Ukraine crisis, with a value of −0.00043. Additionally, the standard deviation parameter was used for the measurement of depression in the financial series of stock market returns.
The findings show that GCC stock markets underwent a significant level of volatility during both crisis periods. For instance, the Bahrain stock market showed a standard deviation of 0.005531, indicating moderate volatility in the COVID-19 pandemic. Moreover, Kuwait experienced relatively high volatility, with a standard deviation of 0.009754 during the COVID-19 pandemic. However, the volatility of the GCC stock markets was comparatively higher during the Russia–Ukraine conflict than during the COVID-19 pandemic. The Qatar stock market showed a high level of volatility behavior in the Russia–Ukraine conflict, with a standard deviation of 0.010, which was approximately two times higher than the COVID-19 pandemic period. Kuwait’s stock market also showed significantly high volatility during the Russia–Ukraine crisis, with a standard deviation of 0.008.
Furthermore, the tail behavior of the financial data was measured by the kurtosis value and the skewness parameter adopted to identify asymmetric behavior in the financial time series of the stock market. The kurtosis value of GCC stock market returns has been greater than 3, exhibiting negative skewness with a slight left skew in returns during the COVID-19 pandemic, which suggests fat tail behavior in stock market return distribution. Moreover,
Table 2 presents the Jarque–Bera test results for GCC stock market returns, used to assess the normality of the data by examining skewness and kurtosis. Its results help determine the suitability of parametric tests for GCC stock market returns. Additionally,
Table 3 presents the results of the augmented Dickey–Fuller test, applied to GCC stock market returns to assess the statistical characteristics of the data.
Table 4 presents the volatility patterns of GCC stock markets during the COVID-19 pandemic. E-GARCH is a statistical model employed for examining and gaining insights into the fluctuation levels within financial markets, especially during economic instability such as during the COVID-19 pandemic. These models assume that the variability of a time series at a given point in time is influenced by its past values, typically represented by lagged observations of the dependent variable. When the gamma coefficient holds a positive and statistically significant value, it implies that prior conditional variances exert a positive influence on the current conditional variance. In simpler terms, this signifies the presence of a certain level of continuity in the volatility of the time series.
Furthermore, the results revealed that GCC stock markets experienced substantial volatility persistence throughout the COVID-19 crisis. Additionally, the GARCH parameter assesses how previous volatility affects present volatility. In all GCC stock markets, there is compelling statistical evidence showing significantly positive GARCH parameters. This indicates that previous volatility has a substantial impact on current volatility, indicating a phenomenon of volatility clustering. As indicated in
Table 4, the Qatar stock market exhibited the highest degree of volatility persistence during the COVID-19 pandemic (
β = 0.981) followed by the UAE stock market (
β = 0.980), with a significance level of 1%. Moreover, Bahrain also exhibited significant volatility persistence during the pandemic, with a
β value of 0.899. Furthermore, the Qatar and Saudi Arabia stock markets exhibited a statistically significant negative ARCH effect at the 1% level during the COVID-19 pandemic. Additionally, the results also confirm the existence of asymmetric behavior during the pandemic, indicating a strong leverage effect. The highest leverage effect was identified in Bahrain stock returns (
γ = 0.344) followed by the Kuwait stock market (
γ = 0.313), at a significance level of 1%. Previous research on the effect of global crises on financial markets has laid the groundwork for understanding the dynamics observed in stock markets throughout the COVID-19 pandemic and the Russia–Ukraine conflict (
Karamti & Jeribi, 2023;
Khan et al., 2021;
Lei et al., 2023). The nature of both crises coupled with the uncertainties surrounding the economic ramifications led to heightened investor anxiety and rapid shifts in market sentiment. Moreover,
Bahrini and Filfilan (
2020) confirmed the significant impact of the COVID-19 pandemic on GCC stock market returns, highlighting a notable decline in financial performance. Similarly,
Abuzayed and Al-Fayoumi (
2021) found that the GCC markets experienced heightened symmetric risk spillovers during the pandemic. Our findings are consistent with these global observations. The varying levels of volatility across GCC countries—especially the pronounced volatility persistence in Qatar and the UAE—reflect the increased uncertainty and economic disruptions triggered by the COVID-19 crisis.
The volatility patterns of GCC stock markets during the Russia–Ukraine conflict are presented in
Table 5. GCC markets exhibit negative conditional volatility at a significance level of 1%, suggesting a decreasing trend in the volatility of GCC stock markets during the Russia–Ukraine conflict. GCC stock markets (except Oman) have experienced a negative ARCH effect during the Russia and Ukraine crisis. Oman has experienced a potential ARCH effect (
) at a significance level of 1% in the Russia–Ukraine crisis, indicating that the previous squared return shocks in the Oman stock market increased future volatility. Moreover, Qatar and Saudi Arabia stock markets exhibited a negative ARCH effect with values of −0184 and −0.189, respectively, at a statistical significance level of 1%. However, Bahrain’s stock market exhibited a negative ARCH effect during the Russia–Ukraine crisis, although this effect was not statistically significant.
The findings also demonstrate a significant persistence of volatility in GCC stock markets during the Russia–Ukraine conflict at a statistical significance level of 1%. The highest volatility persistence was in the Oman stock market (
) during the Russia–Ukraine conflict, followed by the Bahrain stock market (
). Moreover, the Kuwait stock market showed the lowest volatility persistence among the GCC stock markets, with a
value of 0.911. The EGARCH model has been considered the most efficient method for asymmetric behavior assessment in stock market return series. The findings of the study are that the Bahrain, Saudi Arabia, and UAE stock markets showed significantly positive asymmetric behavior, with a statistical significance of 1% during the Russia–Ukraine conflict. The highest asymmetric behavior was observed in the Bahrain stock market, with a
value of 0.50. The results also indicate that the Oman market exhibited significantly negative asymmetric behavior during the Russia–Ukraine crisis. In contrast, Kuwait and Qatar showed asymmetric behavior that was not statistically significant. The geopolitical events have also had significant influence on the financial markets, highlighting the role of uncertainty and geopolitical risk in shaping market behavior. Previous research also confirms the significant effect of the Russia–Ukraine conflict on financial markets (
S. Ahmed et al., 2023;
Alam et al., 2022;
Beraich et al., 2022;
Gaio et al., 2022;
Oyadeyi et al., 2023). Furthermore, our study identifies the distinct impact of the Russia–Ukraine crisis on GCC stock markets, with Oman exhibiting the highest volatility persistence and Kuwait registering the lowest. This is consistent with the notion that geopolitical events can elicit diverse responses across different markets. The findings contribute to the growing body of literature on the interconnectedness of global markets and the transmission of shocks across borders.
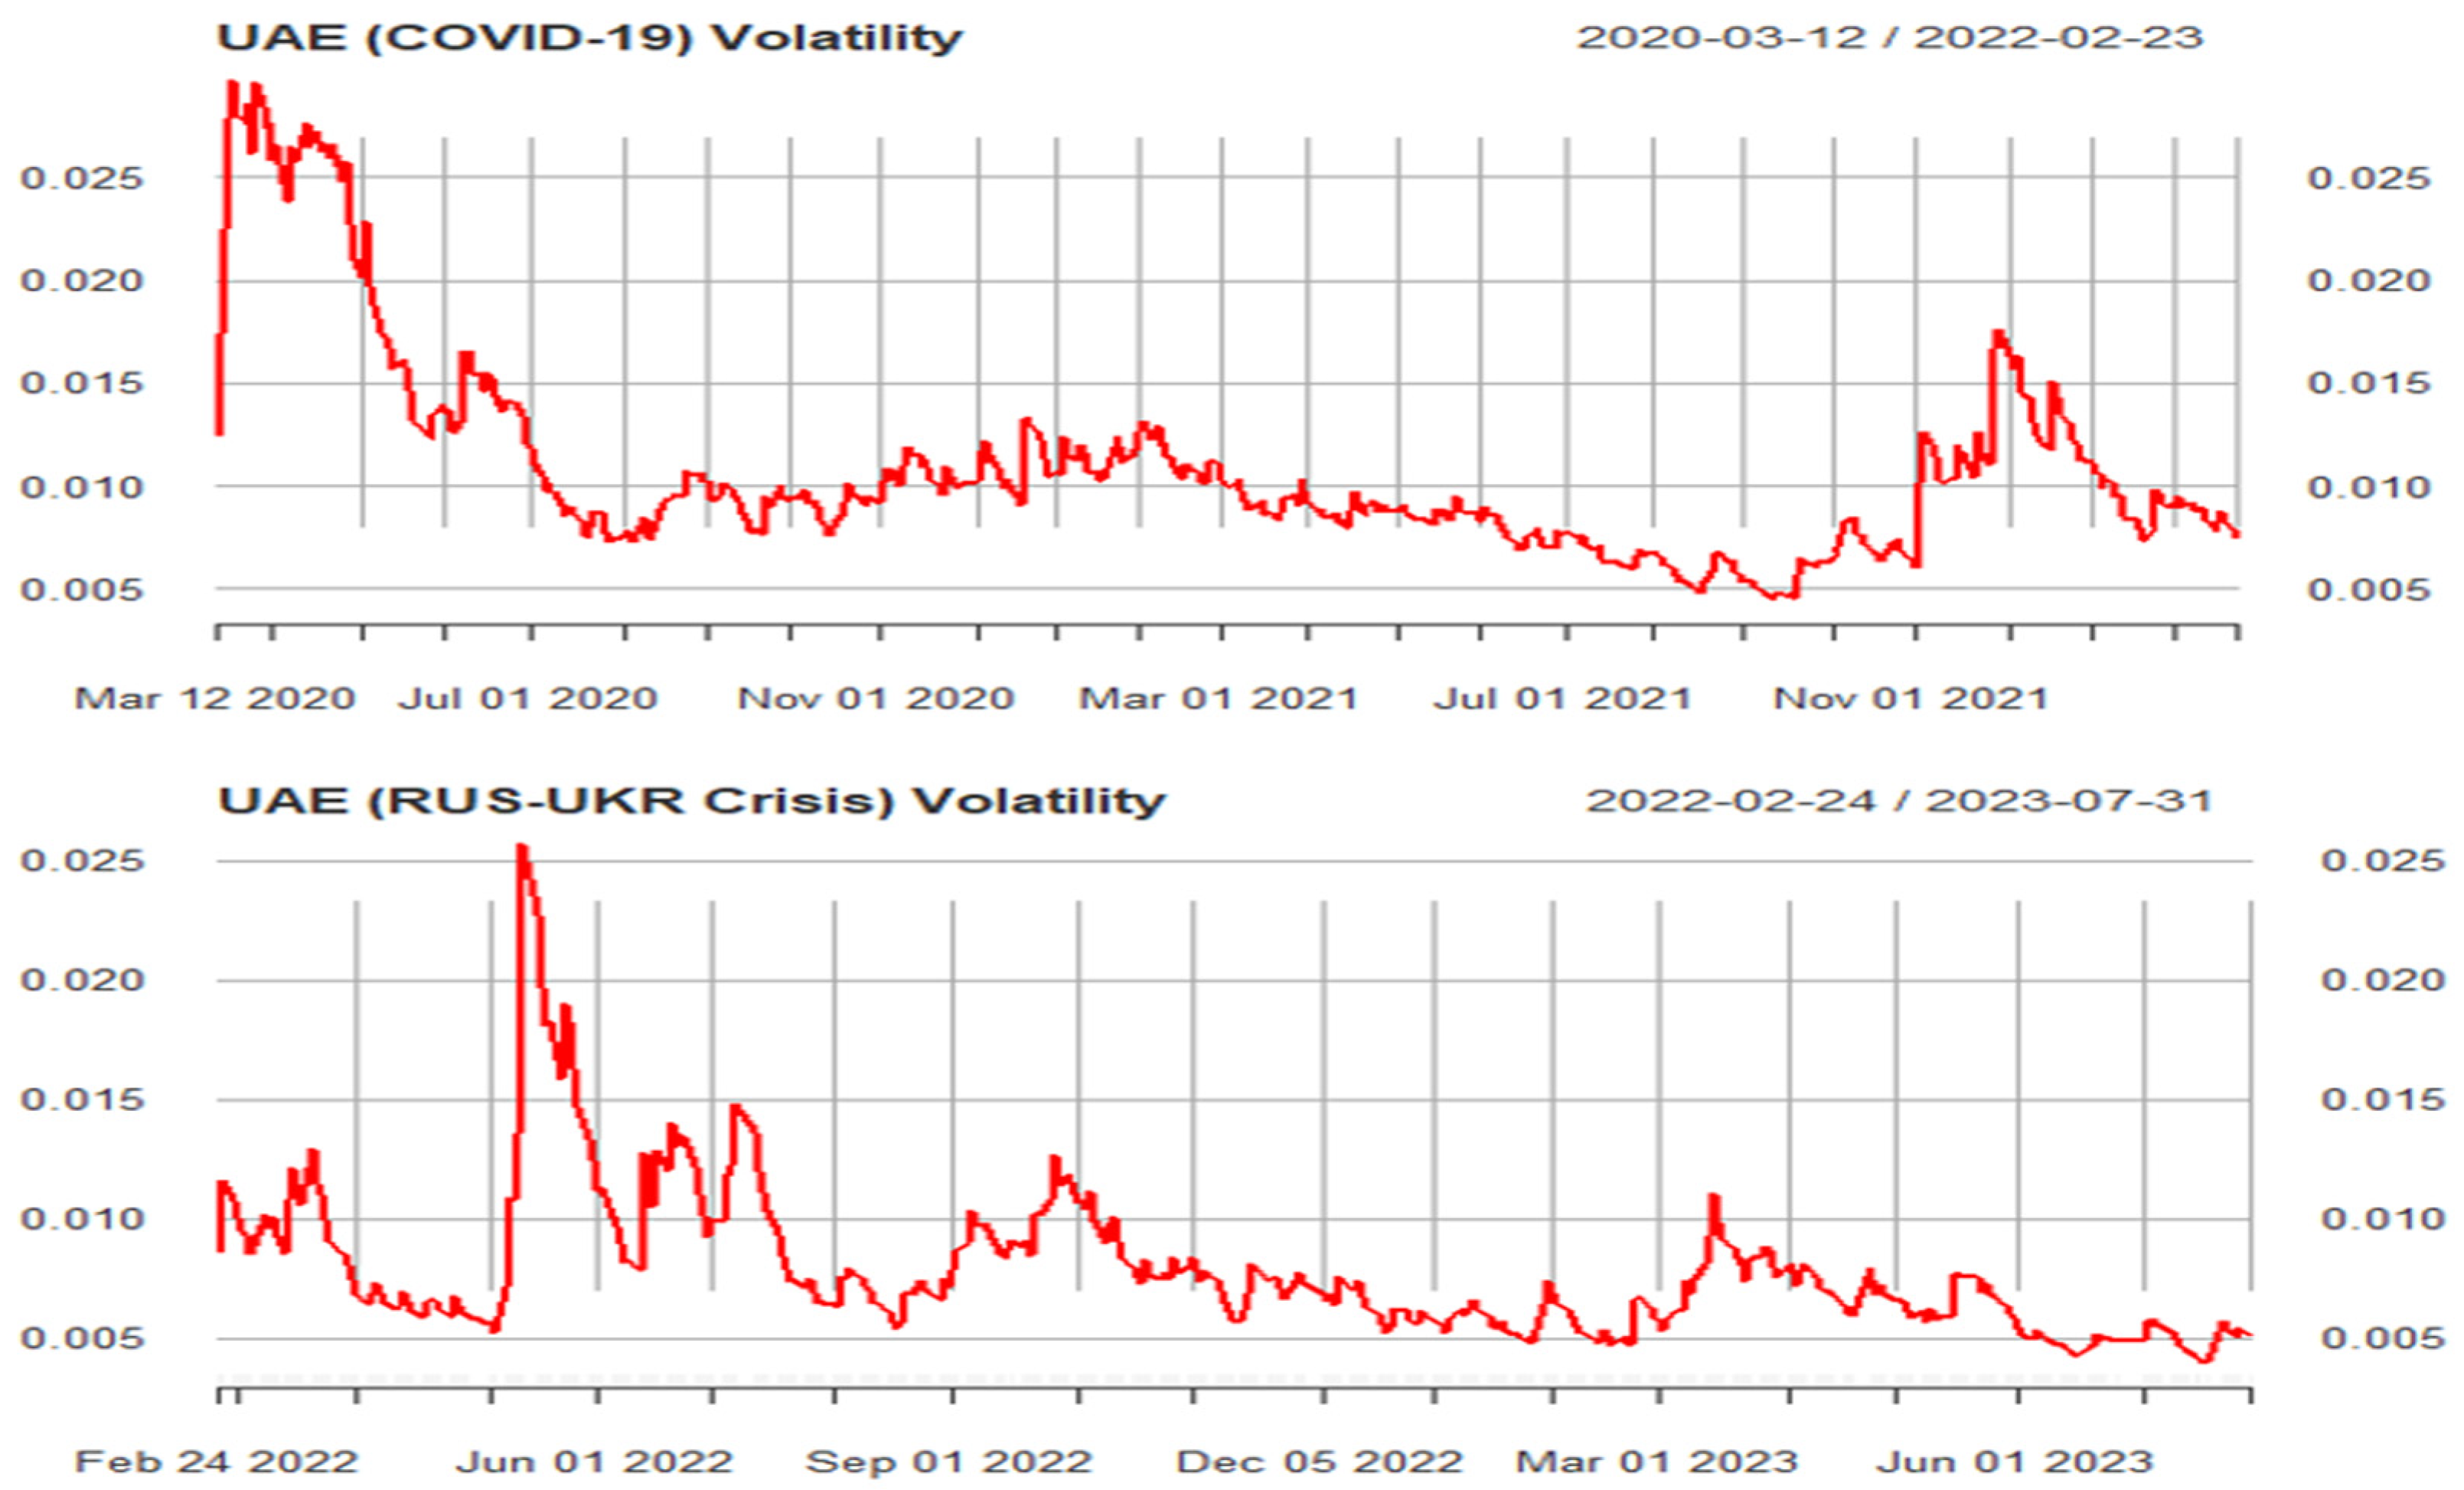
Moreover,
Figure 3,
Figure 4,
Figure 5,
Figure 6,
Figure 7 and
Figure 8 show the estimated volatility based on the EGARCH model during both crisis periods. It can be observed that the volatility pattern of stock markets was significantly different in both crisis periods. For instance,
Figure 3 illustrates the Bahrain market’s volatility trends estimated using the EGARCH model. The Bahrain stock market experienced notable volatility shocks during the crisis periods, with the most pronounced spike occurring at the onset of the COVID-19 pandemic. Moreover, the overall volatility results show that the Bahrain stock market experienced a high volatility shock in the Russia–Ukraine crisis compared to COVID-19. As shown in the
Figure 3, the highest volatility shocks occurred in the first two months in the Bahrain market in the Russia and Ukraine crisis. Additionally, volatility shocks in Bahrain stock market returns were significantly low in December 2022.
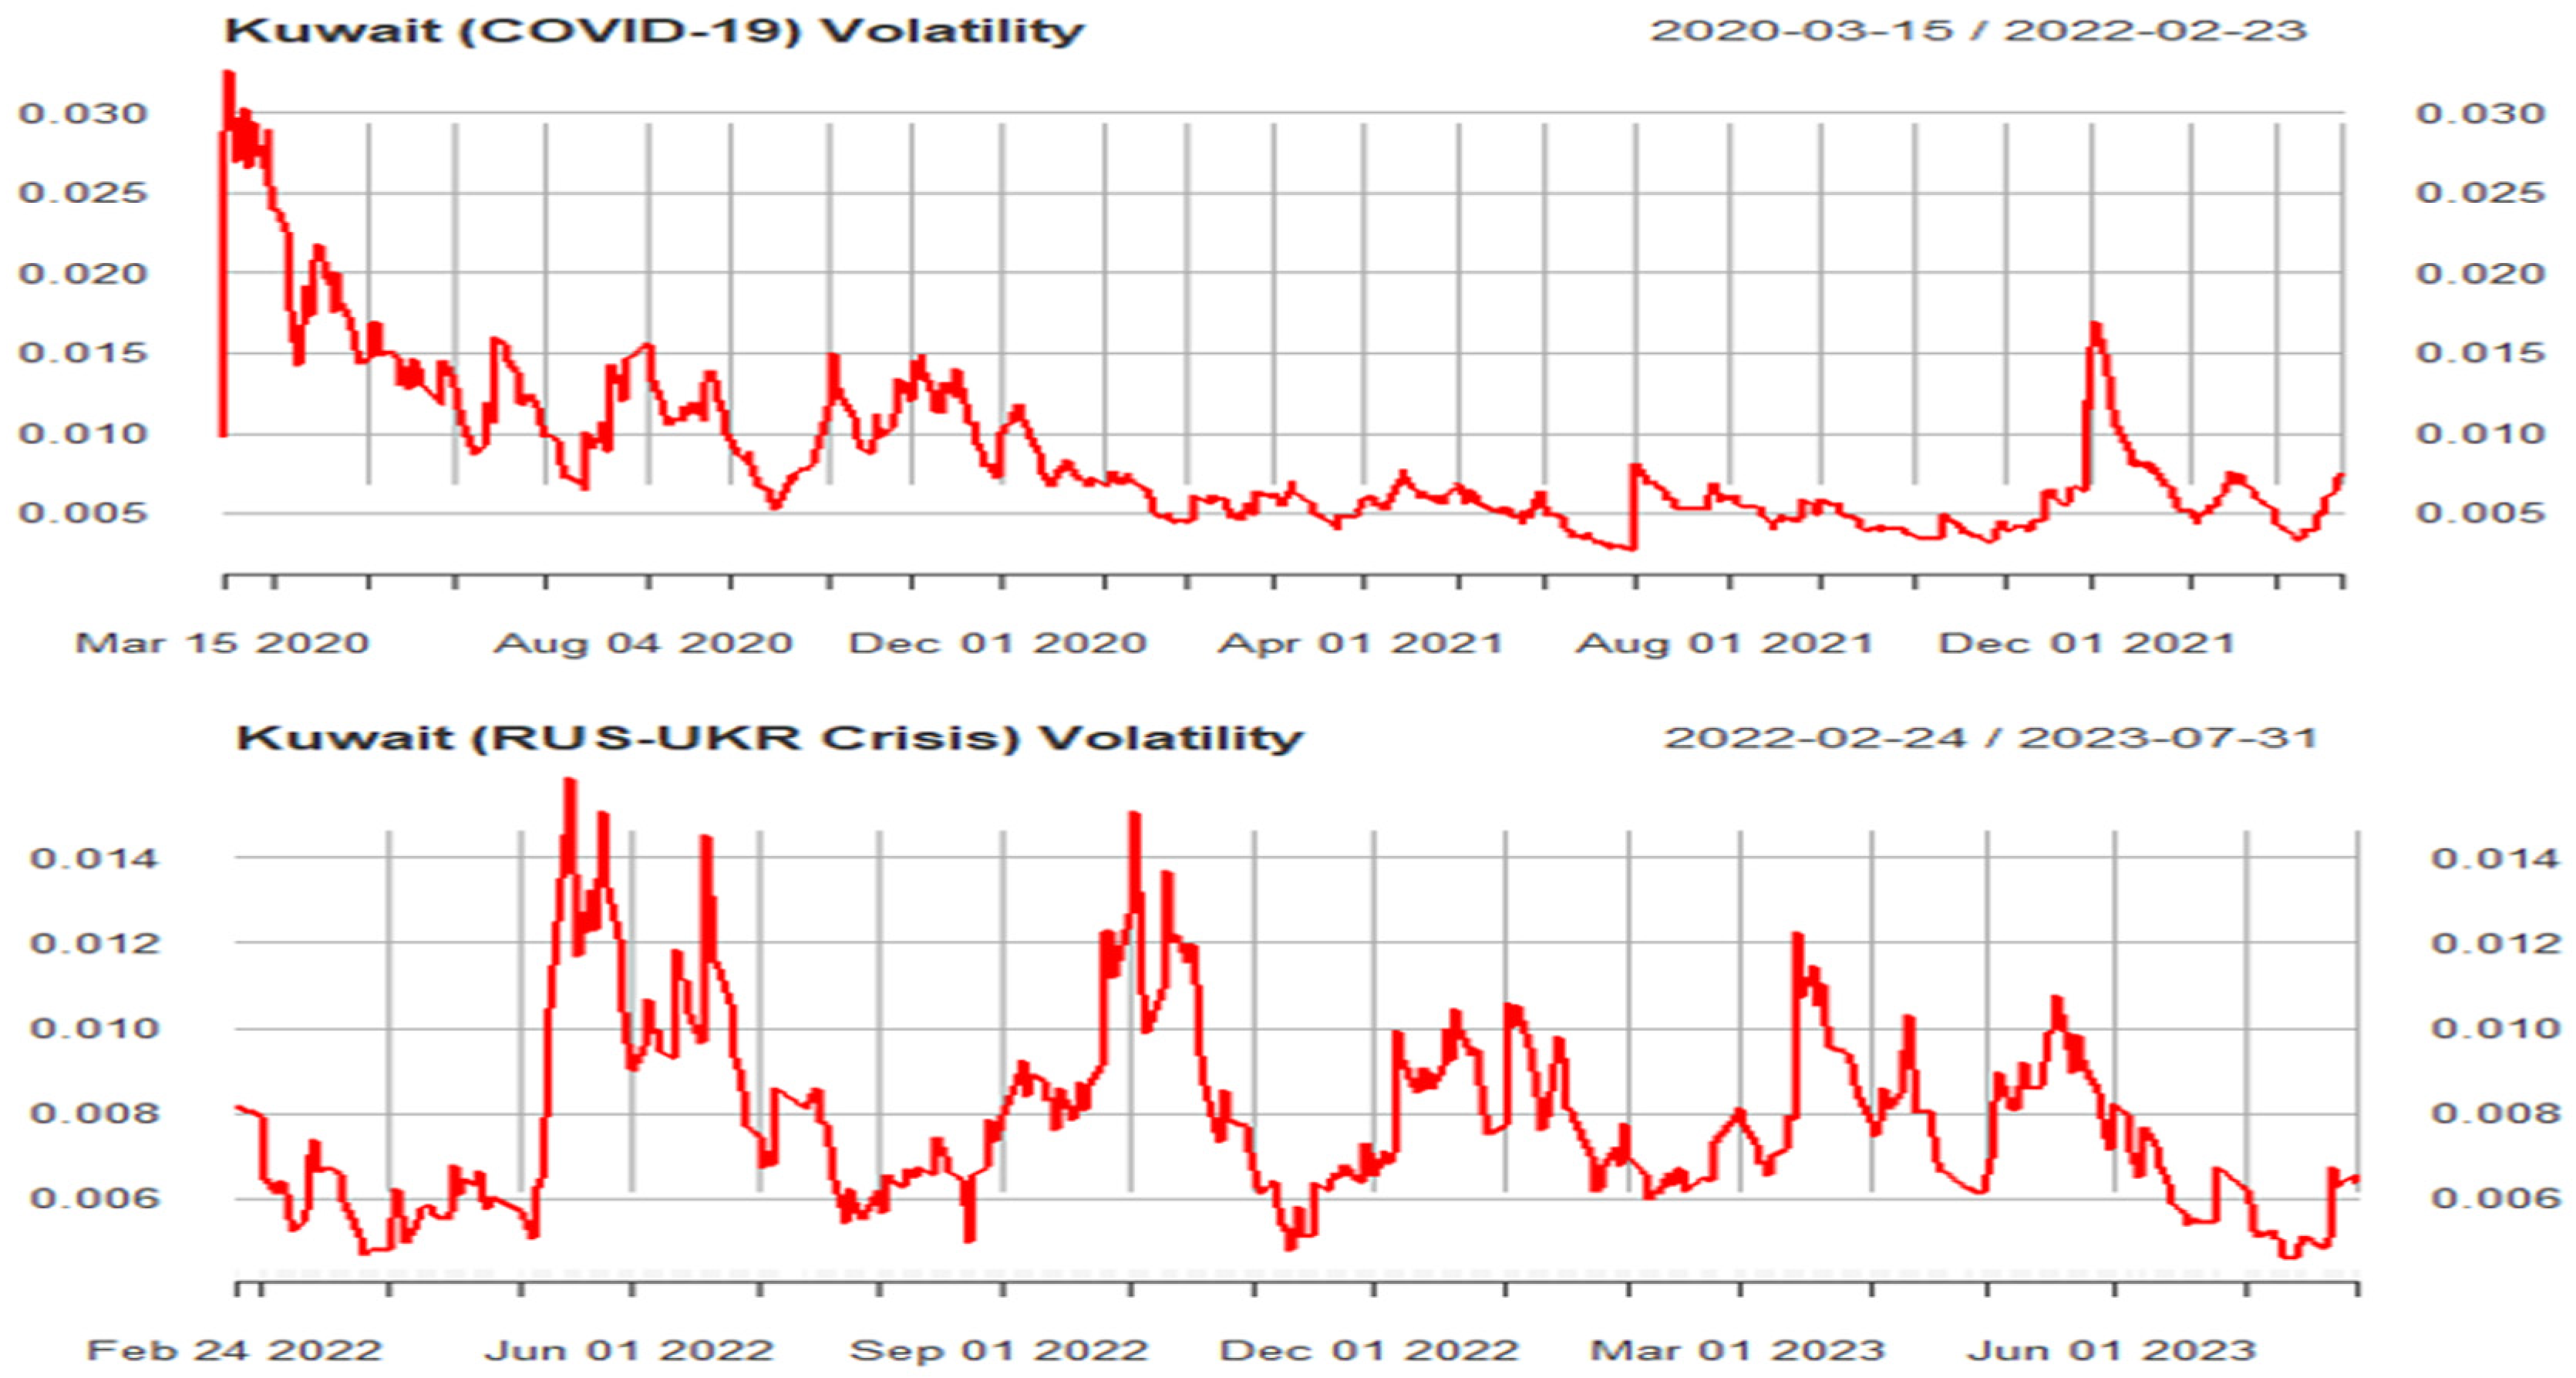
Figure 4 illustrates the fluctuations in Kuwait’s stock market during the COVID-19 pandemic and the Russia–Ukraine conflict. As shown in
Figure 4, the volatility shocks were significantly higher during the first quarter of the COVID-19 pandemic in comparison to the Russia–Ukraine conflict period. The Kuwait stock market experienced its highest volatility shock—approximately 0.03—during the COVID-19 pandemic. Moreover, the potential change is highlighted in the Kuwait stock market during the Russia and Ukraine crisis, varying from 0.006 to 0.014. The highest volatility shocks were in June and October 2022.
Figure 4.
Kuwait stock market volatility behavior.
Figure 4.
Kuwait stock market volatility behavior.
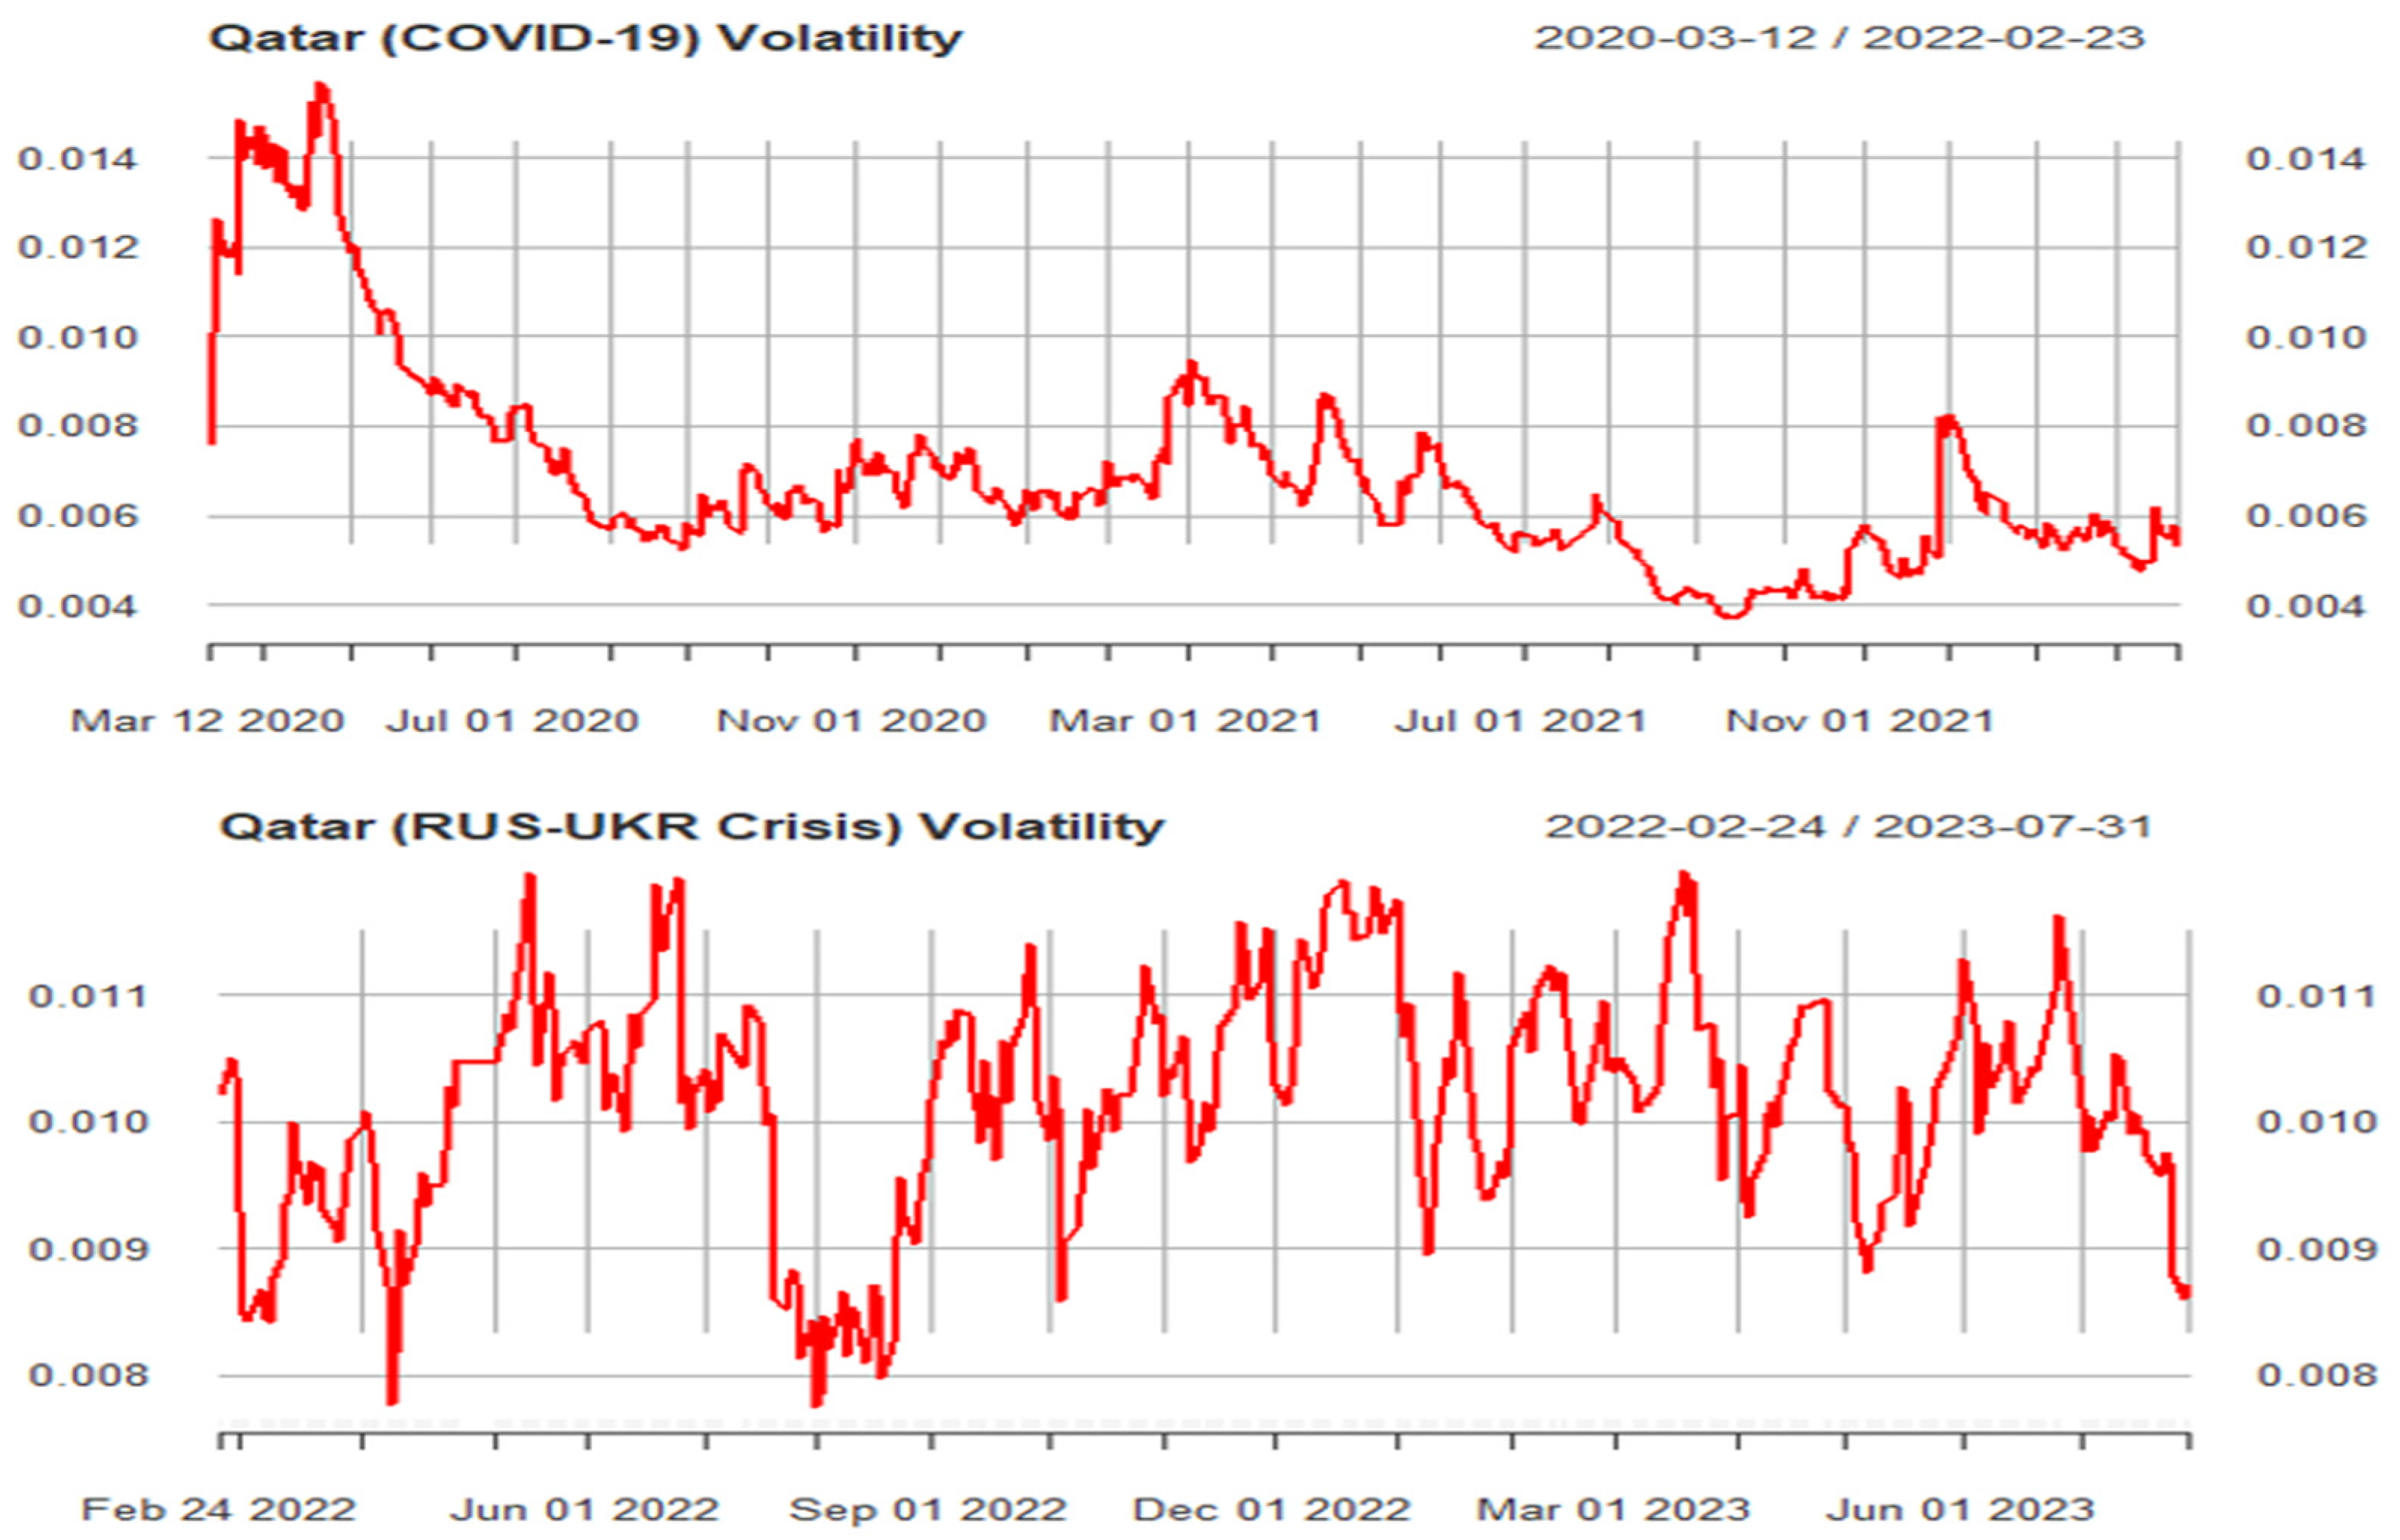
The overall analysis confirmed that the volatility pattern has changed during the Russia and Ukraine crisis. Regarding COVID-19, the highest volatility shocks occurred at the beginning of the COVID-19 pandemic. However, the volatility shocks were significantly higher during the Russia and Ukraine crisis compared to COVID-19. For instance, the Qatar stock market experienced a higher volatility shock during the Russia–Ukraine conflict, as shown in
Figure 6. Moreover, E-GARCH findings for the markets during the Russia–Ukraine crisis reveal distinct patterns reflective of the geopolitical turmoil’s impact. The negative
ω values across all stock markets underscore the typical trend of volatility diminishing over time, possibly due to efforts to stabilize markets. The strong GARCH effect, supported by positive
β values, emphasizes volatility clustering, where periods of high volatility are followed by prolonged turbulence. The positive
γ values for select stock markets imply that past volatility strongly influenced current market conditions. Overall, the E-GARCH model effectively captures the complex interplay between geopolitical events and market dynamics, offering valuable insights for managing risks during the crisis.
The Akaike information criterion (AIC) is a widely used metric for model selection, where lower values indicate a better fit compared to alternative models. During the COVID-19 period, as shown in
Table 4, the lowest AIC values were observed for Oman (−7.9829) and Bahrain (−7.9464), suggesting that the EGARCH models for these markets effectively captured the volatility dynamics throughout the pandemic. Similarly, in the Russia–Ukraine crisis period presented in
Table 5, Bahrain again recorded the lowest AIC value (−8.5547), underscoring the robustness of the EGARCH model in capturing volatility persistence and asymmetry. These findings confirm the suitability of the EGARCH(1,1) framework for modeling crisis-induced volatility across various GCC market environments.
The distinct responses of each GCC stock market during the two crises can be attributed to several factors. For instance, countries like Oman and Saudi Arabia, which are heavily dependent on oil exports, experienced stronger stock market reactions due to fluctuations in oil prices during global crises, explaining Oman’s heightened volatility during the Russia–Ukraine conflict. Conversely, the UAE and Qatar, with their more diversified economies and larger international investor bases, showed greater sensitivity to global events such as the COVID-19 pandemic.
Another important factor is the composition of investors in these markets. In Saudi Arabia, a large proportion of individual investors—who may respond more emotionally to news—can contribute to greater price volatility. In contrast, Kuwait’s market is dominated more by institutional investors, who typically adopt a more cautious and strategic approach, thereby helping to mitigate volatility. Additionally, government policy responses played a crucial role. For instance, the UAE implemented swift financial support measures during the COVID-19 pandemic, which contributed to stabilizing its stock market. Overall, variations in economic structure, investor behavior, and government interventions collectively explain the diverse reactions observed across GCC markets during both crises.
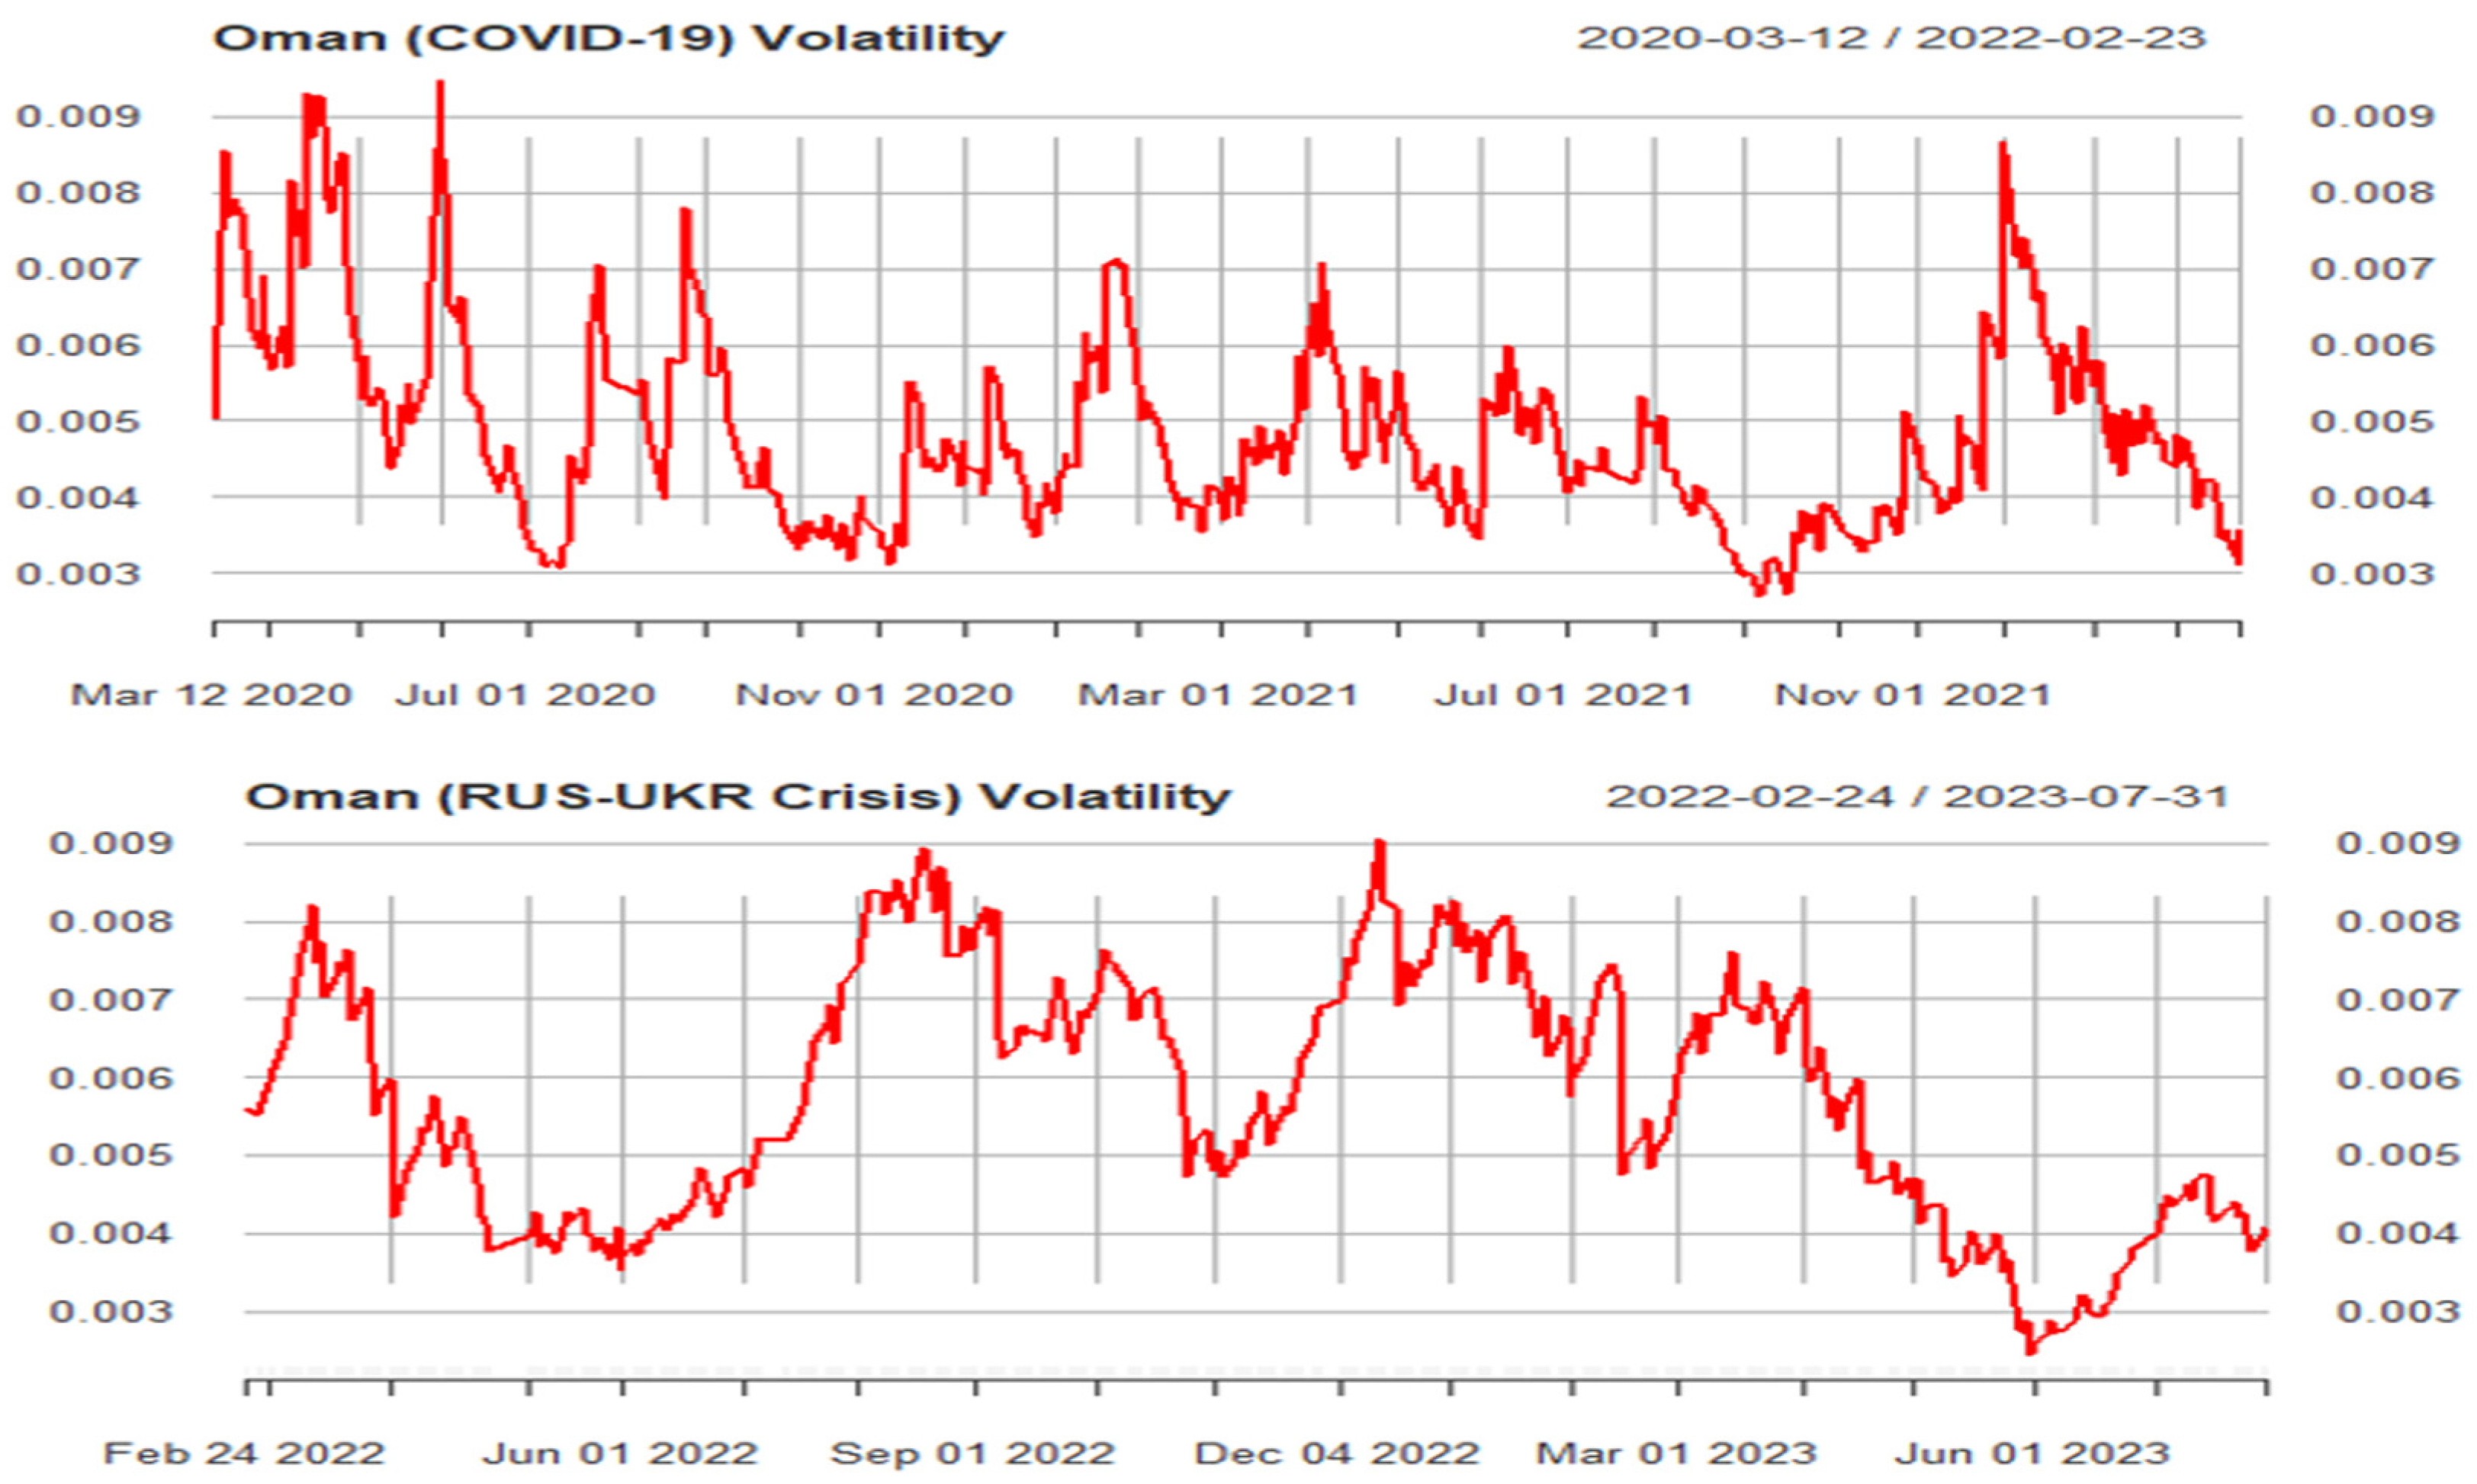
Figure 5.
Oman stock market volatility behavior.
Figure 5.
Oman stock market volatility behavior.
Figure 6.
Qatar stock market volatility behavior.
Figure 6.
Qatar stock market volatility behavior.
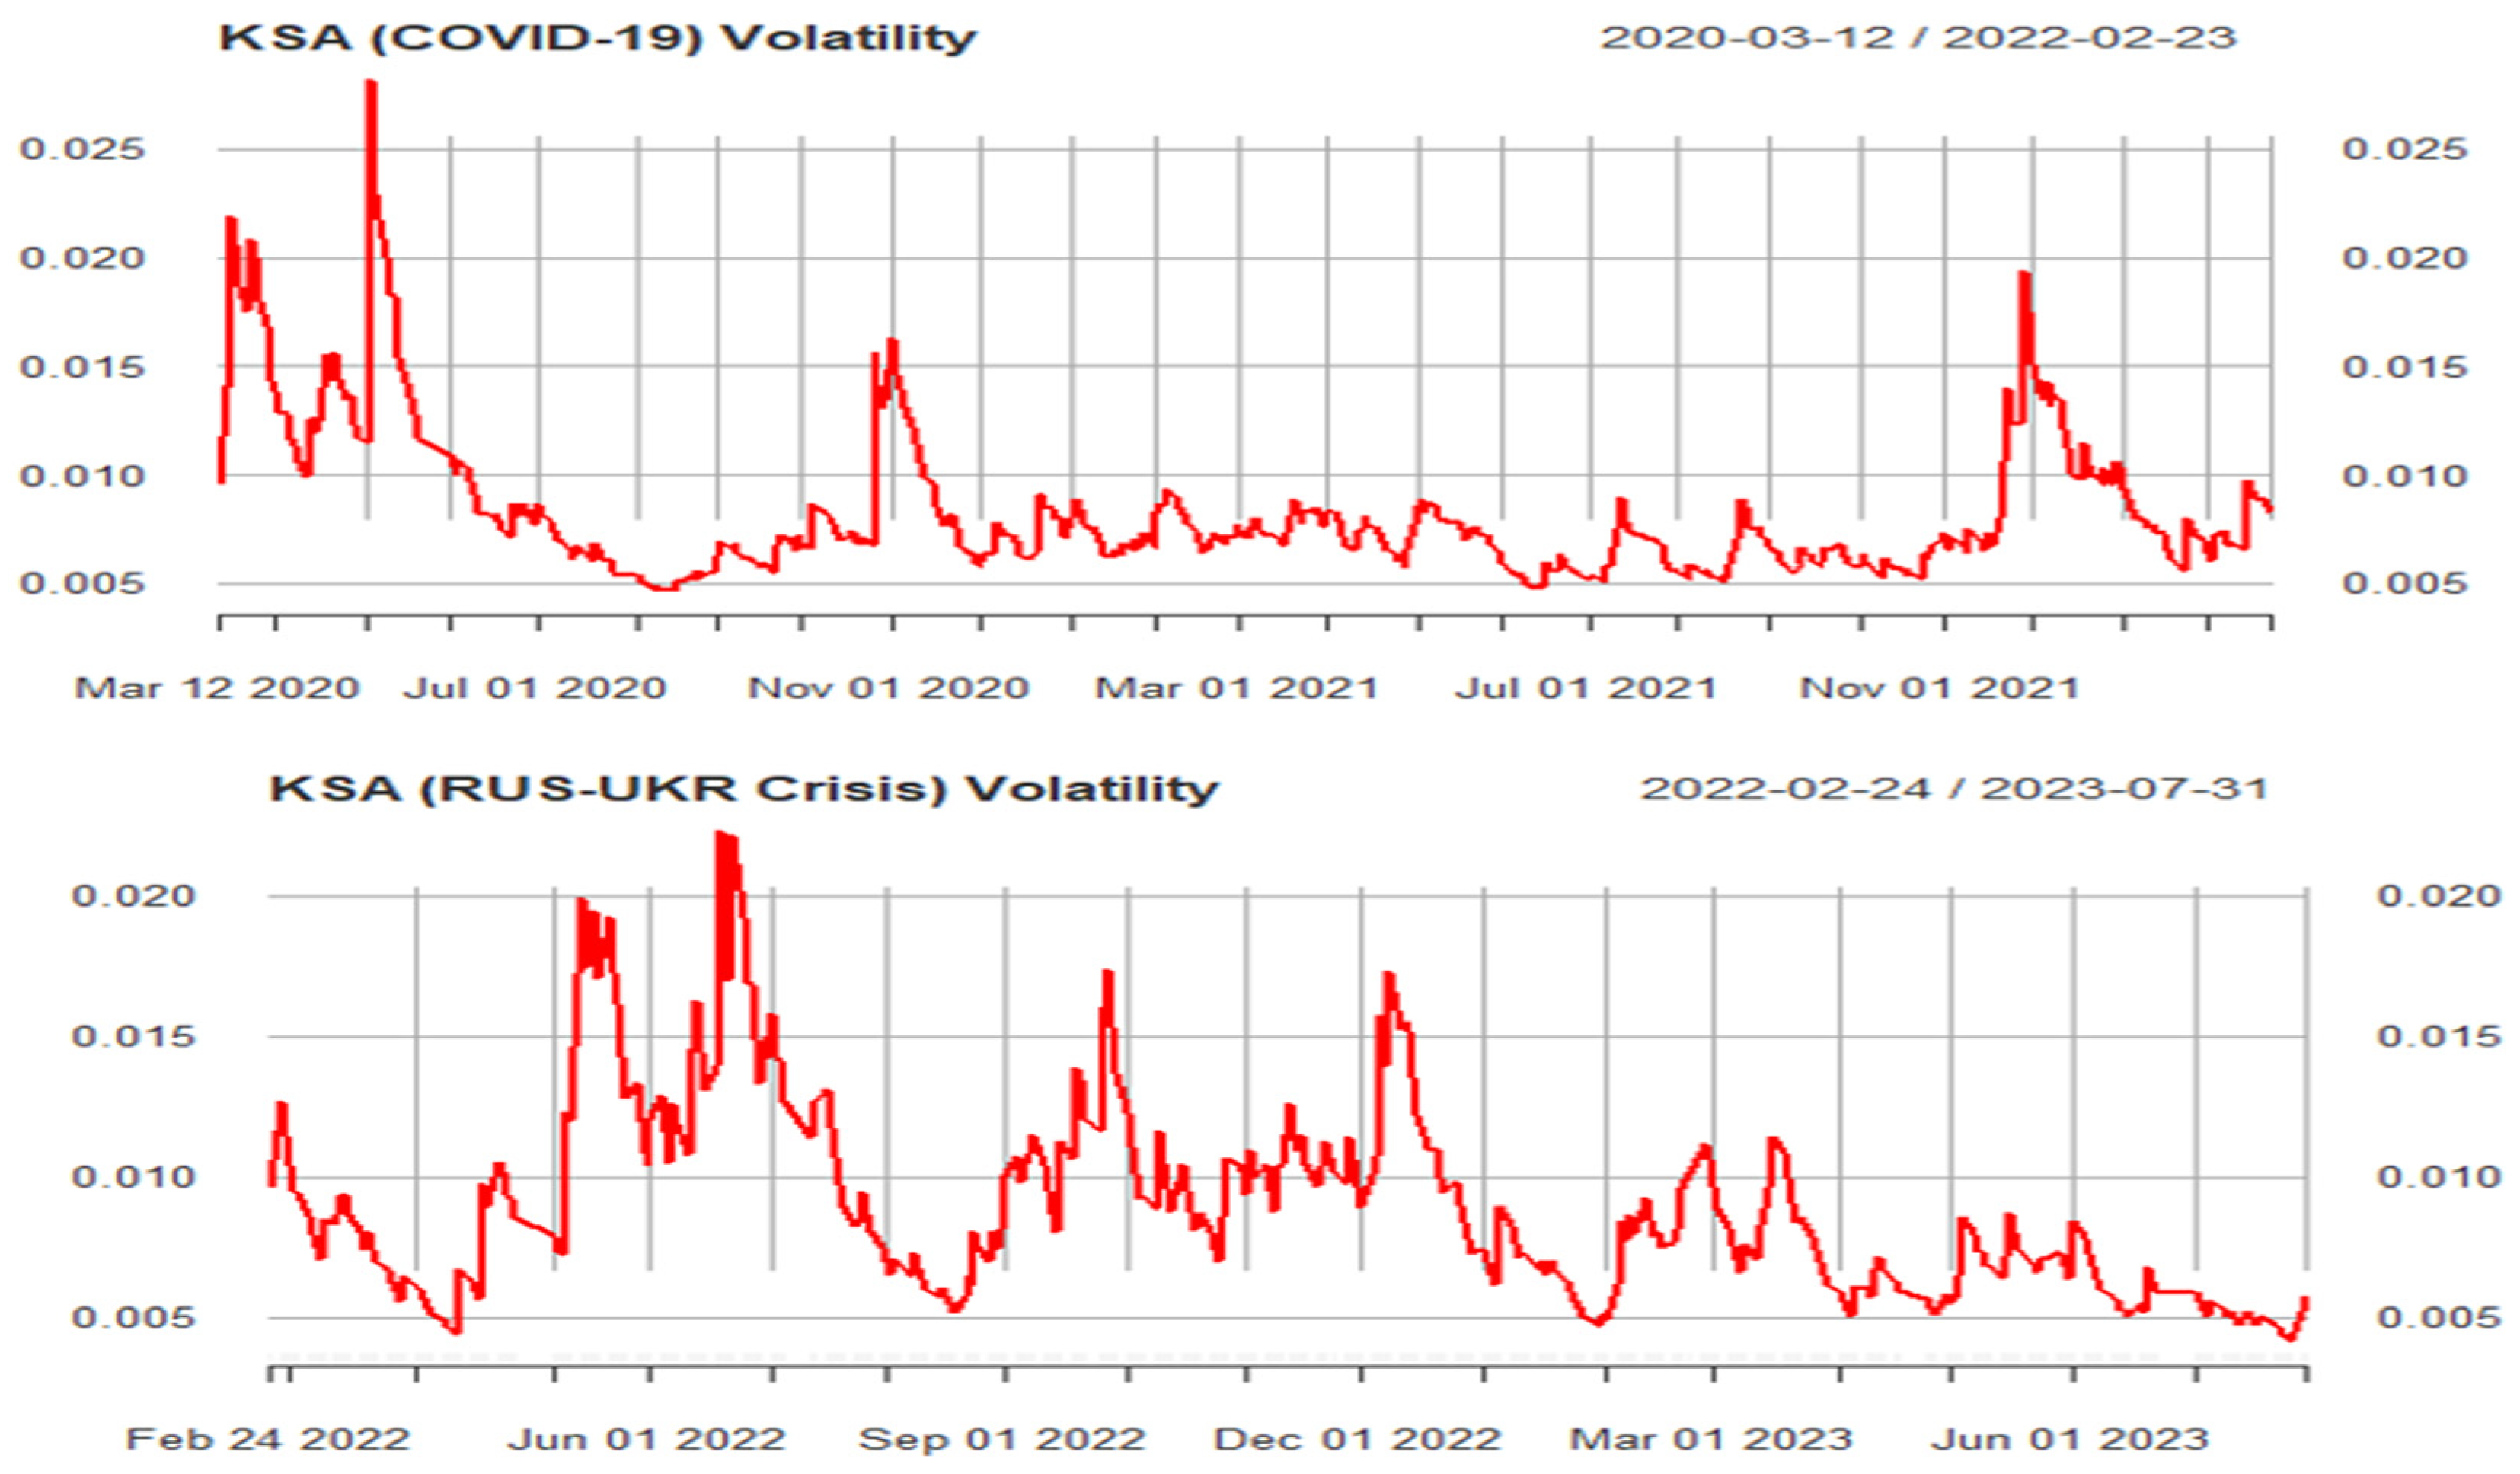
Figure 7.
Saudi Arabia (KSA) stock market volatility behavior.
Figure 7.
Saudi Arabia (KSA) stock market volatility behavior.
Figure 8.
UAE stock market volatility behavior.
Figure 8.
UAE stock market volatility behavior.
5. Discussion and Conclusions
Global crises such as pandemic and war have triggered various challenges for global economies. Financial markets across the world have experienced potential losses resulting from such crises. Therefore, this study aimed to investigate the volatility behavior of the GCC stock markets during two critical and transformative periods (COVID-19 pandemic and Russia–Ukraine conflict). In order to accomplish this objective, we used the GARCH model to capture the volatility patterns across financial returns of GCC stock markets by adopting daily frequency data from 11 March 2020 to 31 July 2023. Our study not only aimed to uncover volatility dynamics but also aspired to provide a comparative analysis of GCC stock market behavior throughout these two pivotal events.
The results provide significant insight regarding the volatility patterns in GCC stock markets during these challenging global events. The study reveals that GCC stock markets exhibited a diverse spectrum of volatility patterns during the COVID-19 pandemic. Such behavior in stock market volatility is aligned with global trends, where uncertainty regarding the pandemic’s economic and business ramifications resulted in heightened market fluctuations. For instance, the Qatar stock market exhibited the highest level of volatility persistence during the COVID-19 pandemic, followed by the UAE stock market. Additionally, the Bahrain stock market showed the highest asymmetric behavior during the pandemic.
Furthermore, the results reveal a distinct pattern of volatility across financial returns of GCC stock markets. The evidence indicates that the Russia and Ukraine war had a strong influence on GCC stock markets, the effects of which were marked by unique characteristics. The E-GARCH model allowed us to disentangle the drivers behind this volatility, aiding our understanding of how regional markets respond to geopolitical tensions on the international stage. The results revealed that the highest volatility persistence has been in the Oman stock market, while Kuwait shows the lowest volatility persistence of all markets during the Russia and Ukraine Crisis.
An overall analysis of this study shows that both crises undeniably influenced market volatility, and their nature and scope differed significantly. The COVID-19 pandemic unleashed a broader and more sustained wave of market turbulence, affecting a wide spectrum of sectors and assets. Conversely, the Russia and Ukraine crisis, primarily a geopolitical event, exerted a more focused influence, primarily affecting specific markets. The ARCH effect was highly significant in all stock markets except Bahrain during the Russia and Ukraine crisis. However, during the pandemic, only Qatar and Saudi Arabia showed a significant ARCH effect among all stock markets, indicating previous squared returns have a potential influence on volatility.
The study highlights the importance of effective financial regulations and strategic investment planning to maintain stability in GCC stock markets during crises. Policymakers should closely monitor market trends to detect early signs of instability and apply measures such as temporary trading halts and liquidity support to control extreme fluctuations. Strengthening financial policies and improving cooperation among GCC nations can enhance market resilience and overall stability. This study provides significant insights to financial investors and equity fund managers for adaptive financial strategies and enhanced risk management practices in the GCC region. The insights derived from this study can have a pivotal part in shaping government policies and regulatory measures that bolster market stability during times of crisis. Moreover, this study raises intriguing future directions for researchers. For instance, subsequent investigations could delve deeper into the specific sectors and assets most susceptible to the shocks of these crises. Moreover, external factors, such as oil prices and global economic conditions, in play a potential role in molding GCC market volatility. Therefore, studying the influence of such factors on the stock market will provide significant insights in the future. Moreover, in this study, we incorporated only the E-GARCH model to study market volatility behavior across GCC stock markets in the crisis. This study adds value by comparing two major global crises side by side and highlighting how individual GCC countries responded differently to each event. Rather than treating the GCC as a single unit, our results show important variations in market behavior. These insights provide a deeper understanding of financial resilience in the region and add a new perspective to the existing literature. Our study was limited to GCC stock market indices; however, future research should explore how specific sectors within each market respond to crises. Our research can also be extended to other financial markets such as cryptocurrency, exchange rates, and commodities with advanced models such as DCC-GARCH and Copula. Our study focused specifically on volatility dynamics during two major global crises. Future research could extend this analysis by including stable (non-crisis) periods. Furthermore, due to the extended length of the event windows, other global or regional developments such as oil price fluctuations, policy changes, or geopolitical events may have influenced market volatility. While these factors were beyond the scope of this study, future research could examine their potential impact.


