Abstract
This research investigates the liability management of Thai life insurers in a prolonged low-interest rate environment. It examines the impact of interest rate changes on life insurance products, solvency, and profitability. The study identifies a significant shift in product portfolios toward non-interest-sensitive products, which helps mitigate financial risk and enhance solvency. The solvency of Thai life insurers is influenced by their return on assets, with higher risk exposures requiring more capital, potentially lowering solvency levels. However, the proportion of risky investment assets is not significantly related to the solvency position in the Thai market. The market index return is a significant predictor of stock returns for Thai life insurers, while changes in interest rate sensitivity are not statistically significant between low-rate and normal periods. The average solvency level under Thailand’s regulatory regime is also not statistically different between normal and prolonged low-interest rate situations. This study contributes to the understanding of liability management practices among life insurers in Thailand and provides insights into the challenges and strategies for maintaining solvency and profitability in a low-interest rate environment.
1. Introduction
Over the past few decades, interest rates have declined in various markets worldwide (Del Negro et al., 2019; Hartley et al., 2016; Holsboer, 2000; LePan, 2019; Reyna et al., 2021). For instance, in 2011, the long-term benchmark yield of the German 10-year government bond fell for the first time to 3.92%, below the 4% technical interest rate provision required by European regulators (Kablau & Weiß, 2014; see also World Government Bonds, 2023). Berdin and Gründl (2015) described these low interest rates as “a threat to the stability of the life insurance industry” (p. 385; see also Grosen & Jørgensen, 2000). Eventually, the German 10-year bond yield even turned negative in 2019. The life insurance business is particularly vulnerable to changes in long-term rates due to its contractual obligations to policyholders (Holsboer, 2000).
In Thailand, since 2000, the historical average yield of Thai government bonds has been 3.64% per annum. As of December 2023, the yield reached a record low of 1.09% per annum in February 2020. For the purposes of this study, the period from 2015—when yields consistently fell below the long-term average of 3.64%—is defined as the “low rate” period. The year 2015 is selected as the cut-off point due to the sustained decline since then, during which yields never recovered to the historical average. The period prior to 2015 is designated as the “normal” period. Figure 1 and Table 1 present the historical Thai government bond yields from January 2000 to December 2023, with January 2015 marked as the cut-off point, as interest rates have not reached the historical average since that time.
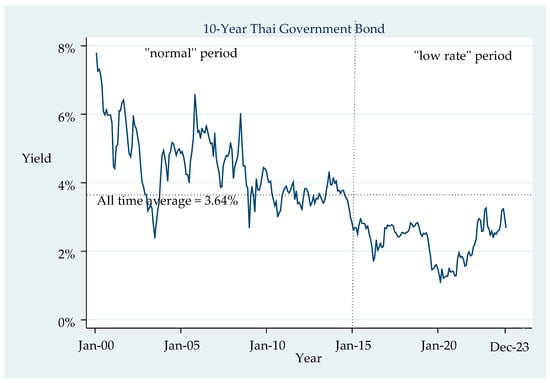
Figure 1.
Historical Thai interest rates: data extracted from ThaiBMA (Thai Bond Market Association, 2023).

Table 1.
Descriptive statistics of historical Thai interest rates: data extracted from ThaiBMA (Thai Bond Market Association, 2023).
Thailand is considered an aged society and one of the fastest-aging nations in the world (Population of Thailand, 2023; World Health Organization, 2023). With this demographic shift toward a super-aged society, life insurance, and a comprehensive healthcare system will become increasingly essential over the long term. As of 2022, all Thai life insurers collectively held total assets worth 4,021 billion baht (Thai Life Assurance Association, 2023). With an annual growth rate of 13% over the past 20 years, the insurance industry plays a vital role in Thailand’s financial economy (Connelly & Limpaphayom, 2004).
Life insurers are liability-driven financial institutions with path-dependent liability cash flows, owing to the embedded options and interest rate guarantees (Albrecher et al., 2018). Life insurance products such as variable annuities, single premium endowments, single premium life, and annuities have a saving element as a key feature that makes them sensitive to interest rate changes (Nieder, 2016). This study examines interest rate movements and their implications for life insurance products. Key findings and insights into the liability management practices of Thai life insurers are presented. The remainder of this paper is organized as follows: Section 2 reviews the literature on the rationale for liability management in life insurers; Section 3 outlines the research methodology; Section 4 presents the data analysis and results; finally, Section 5 and Section 6 discuss the findings and conclude the study.
2. Literature Review and Rationale of the Study
Different types of businesses experience different impacts from interest rate movements. Non-life insurance (i.e., property and casualty insurance) is less sensitive to interest rate variations, as these products are short-tail liabilities (Reyna et al., 2021). In addition, non-life insurers may adjust their product prices upon renewal. An adjustable renewal premium allows non-life insurers to charge a reasonable fee in line with the interest rate environment, thus reducing interest rate risk (Berends et al., 2013). In contrast to the life insurance business, life products are vulnerable to changes in long-term rates due to their contractual obligations to policyholders (Holsboer, 2000).
As the Thai life insurance industry has been driven by multi-distribution channels and various life insurance products (Asvatanakul, 2011), life insurers face many challenges in complying with the Office of Insurance Commission (OIC) requirements. Life insurers, thus, executed several actions to rectify the regulator’s concerns, such as placing a penalty on mis-selling for the agency distribution, setting up a vulnerable customer segment guidance for bancassurance salespersons, and implementing a do-not-call list for telemarketing channels. Apart from that, with the COVID-19 pandemic, which caused massive claims and insolvency of several non-life insurers in Thailand, life insurers are aware of the risks of mispricing and financial distress to the insurers. In addition, life insurers need to consider the interest rate effects on their products’ profitability and linkage to their financial results (Suwanmalai & Zaby, 2022).
Life insurers manage their liability portfolios through adjustments in their life insurance product mix (Bohnert et al., 2015; see also Henebry & Diamond, 1998; Ozdagli & Wang, 2019), management of interest rate risk on guaranteed products, and solvency management.
In terms of product mix, during prolonged low-interest-rate environments, many life insurers shift their new product portfolios toward non-guaranteed or non-interest-sensitive products (Focarelli, 2015), as they are unable to profitably offer saving-oriented products (Hartley et al., 2016). Reyna et al. (2021) highlighted that insurers must take specific measures to restore their profit margins after a sustained “low rate” period. Paetzmann (2011) emphasized the need for adjustments in the product mix of insurers’ portfolios to move away from guaranteed interest rate products and reduce the explicit and implicit impacts of guaranteed interest rates. Consequently, it is anticipated that the mean volume of non-interest-sensitive new business will be higher during a “low rate” period than during a “normal” period (Hypothesis 1).
Matching asset and liability durations under an asset-liability management (ALM) framework helps insurers limit their exposure to interest rate risk (Berends et al., 2013). In response to declining interest rates, life insurers typically make long-term investments to extend asset duration and narrow the duration gap with their liabilities (Paetzmann, 2011). ALM monitoring is routinely used to assess and mitigate interest rate risk by lengthening asset durations (Holsboer, 2000). To manage the interest rate risk associated with life insurance products, insurers primarily invest in fixed-income markets (i.e., government and corporate bonds) to hedge against future benefit payments owed to policyholders (Hartley et al., 2016). As investment returns are a primary source of profitability for insurers, particularly for products with guaranteed, interest-sensitive features (Reyna et al., 2021), it is expected that the return on assets will be positively correlated with the proportion of interest-sensitive products (Hypothesis 2).
In Thailand, life insurers have historically offered guaranteed returns on the savings components of both endowment and certain whole-life products. Traditional insurance agents have predominantly sold these interest-sensitive products, which accounted for a substantial 65% of total premiums. In other Asian markets, such as Taiwan, bancassurance (selling life insurance products through banks) has expanded rapidly, overtaking traditional agency channels (Chen, 2015). Although bancassurance has also grown in Thailand, as of year-end 2022, agency distribution remains the leading channel, generating 51% of total premiums (see Figure 2) compared to a 39% share for bancassurance (Thai Life Assurance Association, 2023). Given the importance of the agency channel in distributing saving-oriented products, it is worth analyzing whether life insurers can rely on this primary distribution channel to support a shift in product strategy. This observation leads to Hypothesis 3: the agency channel is positively correlated with the proportion of interest-sensitive products.
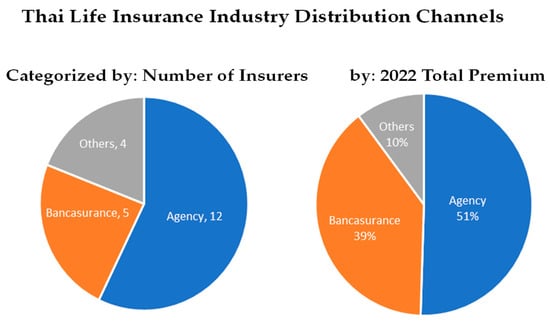
Figure 2.
Distribution channels of life insurance in Thailand: data extracted from TLAA (Thai Life Assurance Association, 2023).
Kablau and Weiß (2014) analyzed the impact of a low-interest rate environment on the solvency of German life insurers using scenario analysis. Although their study considered the Solvency I regime, all baseline, mild, and severe stress scenarios illustrated net investment returns under those conditions and identified the coverage ratio required to meet insurers’ own fund requirements. Their findings suggest that the average solvency level is lower during a “low rate” period. In addition, capital efficiency improves significantly when insurers shift their business portfolios toward products without minimum guaranteed interest rates (Wieland, 2017). The protracted low-interest rate environment compels life insurers to adjust their business mix toward non-interest-rate-sensitive products and reduce their reliance on investment income (Focarelli, 2015). Accordingly, solvency positions tend to decrease as the proportion of interest-sensitive new business increases (Hypothesis 4).
Low interest rates negatively affect insurance companies’ profitability by reducing investment returns from their asset portfolios (Eling & Holder, 2013a; see also Eling & Holder, 2013b; Greene & Segal, 2004). To counter this, insurers generally seek alternative sources to maintain profitability and meet guaranteed liabilities (see also Brown & Galitz, 1982; Reyna et al., 2021). Some insurers focus on improving operational efficiency to offset revenue compression when investment yields decline (Holsboer, 2000). Notably, during Japan’s protracted low-interest rate period from 1997 to 2001, seven mid-sized life insurers declared insolvency due to drastic profitability losses from high-guaranteed interest rates on their in-force business (Berdin & Gründl, 2015). Based on these observations, it is expected that the average solvency level in the Thai life insurance market will also be lower during “low rate” periods (Hypothesis 5). In addition, insurers’ profitability levels should be positively correlated with their solvency levels (Hypothesis 6).
Empirical evidence from Niedrig (2015) indicates that changes in long-term interest rates influence insurers’ optimal investment portfolios by prompting a shift toward riskier asset classes in search of higher yields. In Germany, for example, life insurers have increasingly allocated assets to more illiquid investments, such as infrastructure bonds, to enhance returns (Nieder, 2016). While these riskier investments may enhance investment income and help insurers fulfill their obligations to policyholders (Kablau & Weiß, 2014), they also elevate required capital levels due to higher risk exposures. Consequently, it is anticipated that the proportion of risky investment assets will be negatively correlated with insurers’ solvency positions (Hypothesis 7), as the increase in required capital outweighs the additional return from riskier investments in the short term. This relationship arises from both the substantial capital requirements associated with riskier asset classes and the prevalence of high-guarantee life insurance products (Nieder, 2016; see also Kling et al., 2007).
To assess insurers’ exposure to interest rate risk, Berends et al. (2013) analyzed the sensitivity of US life insurance companies to interest rate movements, comparing the period before the financial crisis (August 2002 to July 2007) with the low-interest rate period (August 2007 to December 2012) using data from SNL Financial, a leading provider of industry-focused financial and market data. They examined the relationship between changes in interest rates and insurers’ stock prices. Before the financial crisis, the stock prices of publicly traded life insurance companies showed no correlation with benchmark 10-year government bond yields. However, after the crisis, stock returns became negatively correlated with bond yields (Berends et al., 2013). A similar relationship is expected in the Thai market, where product portfolios are dominated by “ordinary” endowment products, which are relatively interest-sensitive. Moreover, interest rate risk remains high for insurers that have not fully hedged against declining rates (Berends et al., 2013). Therefore, it is anticipated that Thai life insurers’ stock returns will negatively correlate with 10-year government bond yields during “low rate” periods (Hypothesis 8).
Additionally, the stock prices of large life insurers tend to fluctuate more than those of smaller insurers because large firms typically have a greater proportion of interest-rate-sensitive products in their portfolios (Berends et al., 2013). Due to the heightened volatility of large insurers’ stock returns during “low rate” periods, it is anticipated that the proportion of interest-sensitive products will be higher for large life insurers than for mid- and small-sized firms (Hypothesis 9).
3. Methodology
3.1. Research Design
This study adopts a multivariate design, analyzing two or more measures per observation using Stata/SE 15.0. Parametric procedures will be applied as the data are ratio-scaled.
Secondary data will be sourced from four primary repositories:
- Thai Bond Market Association
Monthly 10-year government bond yields from 2000 to 2022 will serve as a benchmark for long-term interest rates in Thailand. This data will be used to identify “normal” and “low rate” periods to analyze the effects of a prolonged low-interest rate environment.
- 2.
- The Thai Life Assurance Association (TLAA)
Industry annual statistics from 2000 to 2020, disaggregated by the insurer, including market share (first-year premiums and total premiums), new business policy volumes, invested asset values, operating expenses, balance sheets, and profit and loss statements.
- 3.
- Office of Insurance Commission (OIC) and Publicly Available Insurer Data
Capital adequacy and risk-based capital (RBC) results will be manually collected from the insurer websites and the OIC.
- 4.
- Stock Exchange of Thailand (SET) via Bloomberg
Stock price data for publicly listed insurers will be collected from Bloomberg, covering individual companies from their IPO date.
This timeframe captures the impact of the Thai market’s interest rate decline beginning in August 2019.
A robustness check will be performed using the Hausman test (Hausman, 1978) to choose between fixed and random effects models for the panel datasets. By using the Hausman Test, potential model misspecification from biased coefficients and error terms can be revealed (Hausman, 1978).
3.2. Variable Measurement
The following outlines the measurements for all variables used for hypotheses testing:
- “Low rate” period: Defined as a period when long-term interest rates fall sharply (Hartley et al., 2016). For this study, the Thai market period from 2015 onward qualifies, as average yields have remained below the historical average of 3.64%.
- “Normal” period: Refers to the timeframe prior to 2015, when long-term interest rates consistently exceeded the 3.64% average.
- Proportion of interest-sensitive new business: Calculated as the volume of new business sales from interest-sensitive products divided by total new business sales. A higher value reflects a greater resilience on interest-sensitive products (Thai Life Assurance Association, 2023).
- New business sales volume: The total of new business premiums, comprising both first-year and single premiums (Thai Life Assurance Association, 2023).
- Solvency: Measured as the total capital available divided by the total risk charges, expressed as a capital adequacy ratio under the RBC framework. In Thailand (under RBC2 QIS2), the minimum required ratio is 100%, with a supervisory intervention level at 140% (Office of Insurance Commission, 2022).
- Proportion of risky invested assets: The value of investments in higher-risk asset classes (e.g., equity, derivatives, property) divided by total invested assets. The risk level is determined by the asset class composition of each insurer (Berends et al., 2013).
- Profitability: Measured using return on assets (ROA), which accounts for both investment returns and insurance operations. A ratio is used to neutralize potential scale effects from differing company sizes (Eling & Holder, 2013a).
- Dominated agency distribution channel: Identified when an insurer generates a higher proportion of total premiums through the agent channel relative to other distribution channels (Thai Life Assurance Association, 2023).
3.3. Data Analysis
Three empirical models are estimated to evaluate the liability management strategies of Thai life insurers. Multiple regression techniques are applied to analyze the time series data and test the hypotheses.
Following Hartley et al. (2016), the observation period is divided into “low rate” and “normal” periods. In their study, Hartley et al. (2016) classified interest rates into the following categories: between 2002 and mid-June 2007; a “normal” period—small changes in interest rates—did not affect insurers’ stock returns in the US and UK, as rates remained within their historical range. However, after the 2007–2008 financial crisis, long-term interest rates dropped sharply, settled at historically low levels, and have remained low since (Hartley et al., 2016). During these “low rate” periods, life insurers shifted their new business mix toward non-interest rate sensitive products, reduced reliance on investment income (Focarelli, 2015), and increasingly transferred investment risk to policyholders (Nieder, 2016; Reyna et al., 2021).
For the Thai market, the period from 2015 onward—when yields were below the historical average of 3.64%—is classified as a “low rate” period, while the pre-2015 period is considered “normal.”
Managing interest rate risk is a crucial component of liability management. When interest rates decline, life insurers typically increase long-term investments to better align asset durations with liabilities under an ALM framework (Paetzmann, 2011). In a prolonged low-interest rate environment, insurers adjust their product portfolios toward non-interest-sensitive or non-guaranteed products to reduce guaranteed returns and transfer investment risk to policyholders (Focarelli, 2015). Consequently, this study measures the proportion of interest-sensitive (IS) new business as a dependent variable to assess shifts in product mix, as performed by Wieland (2017).
The variable LowRate is incorporated to capture shifts in product portfolios under different interest rate conditions. Additionally, the model examines the potential effects of firm size, distribution channel strategy, investment risk profile, solvency position, and profitability on liability management. The first model is specified as follows:
where
ISi,t = β0 + β1LowRatet + β2LargeSizei,t + β3Agencyi,t + β4Riskyi,t + β5RBCi,t + β6ROAi,t + εi t
- IS: proportion of interest-sensitive new business for company i in year t
- LowRatet = 1 during the “low rate” period, 0 otherwise
- LargeSizei,t = 1 for life insurers with total assets ≥ 90,000 million baht; 0 for others
- Agencyi,t = 1 if the company’s dominant distribution channel is through agents; 0 otherwise
- Riskyi,t = proportion of risky investments for company i in year t
- RBCi,t = capital adequacy ratio of company i in year t
- ROAi,t = return on total assets for company i in year t
(Focarelli, 2015; Hartley et al., 2016; Nieder, 2016; Reyna et al., 2021).
The second equation uses solvency, measured by RBC, as the dependent variable to identify the relationship between interest rates and life insurers’ solvency, following a similar approach to the Tobit regression by Reyna et al. (2021). Life insurers may struggle to fully match the interest rate sensitivity of their assets and liabilities when interest rates fluctuate (Berends et al., 2013). Berends et al. (2013) emphasized that both banks and life insurers face comparable interest rate risks, with larger firms typically being more sensitive to such changes than smaller ones. Given the varied sizes of Thai life insurers, LargeSize is incorporated to explore any potential relationship between firm size and capital adequacy.
Additionally, this model investigates the correlation between asset risk (Risky), ROA, and capital adequacy (RBC). Under the RBC framework, insurers must balance asset returns with higher capital requirements for riskier assets (Berends et al., 2013). The following regression models are specified:
where
RBCi,t = β0 + β1LowRatet + β2LargeSizei,t + β3Riskyi,t + β4ROAi,t + εi t
RBCi,t = β0* + β1LowRatet + β2LargeSizei,t + β3Riskyi,t + β4ROAi,t + β4*LowRatet XROAt + εt
- RBCi,t = capital adequacy ratio (based on Thailand’s RBC framework) of company i in year t
- LowRatet = 1 for the “low rate” period; 0 for the “normal” period
- LargeSizei,t = 1 for large life insurers (total assets ≥ 90,000 million baht); 0 otherwise
- Riskyi,t = proportion of risky investments for company i in year t
- ROAi,t= return on total assets of company i in year t.
- LowRatetXROAt = interaction term capturing whether the effect of returns on solvency is amplified during the “low rate” period (Berends et al., 2013; Reyna et al., 2021).
To measure insurers’ exposure to interest rate risk, Berends et al. (2013) analyzed the sensitivity of US life insurers to interest rate changes, comparing periods before the financial crisis (August 2002–July 2007) and during the subsequent low-interest rate period (August 2007–December 2012) by examining the correlation between interest rate changes and the stock returns of Thai life insurers:
where
yi,t = β0 + β1BondYieldt + β2SET_It + εt
yi,t = β0* + β1*BondYieldt + β2*LowRatetXBondYieldt + β3*SET_It + β4*LowRatet XSET_It + εt
- yi,t = monthly stock return of insurer i
- LowRatet = 1 for the “low rate” period; 0 for the “normal” period
- BondYieldt = change in the 10-year government bond yield at the end of month t (i.e., Yield(t) – Yield(t − 1))
- SET_It = average monthly SET market index return, where stock return = (stock price(t)/stock price(t − 1) – 1)
- LowRatetXBondYieldt = interaction term to test whether bond yield effects on stock returns differ during the “low rate” period
- LowRatet XSET_It = interaction term to test whether the effect of SET market index returns on stock returns changes during the “low rate” period (Berends et al., 2013; Hartley et al., 2016).
4. Results
4.1. Descriptive Statistics
As of now, 22 life insurance companies are still operating in Thailand. This panel dataset comprises annual data from 2000 to 2020 for 25 life insurers. Three companies—Thai Cardif, Tanachart Life, and SCB Life—are no longer active, but their data are retained for the sample period.
Table 2 presents descriptive statistics for all variables (both dependent and independent) used in the panel dataset. Table 2(a) provides an overview of the data, while Table 2(b) breaks it down into “normal” and “low rate” periods. For each variable, the number of observations, standard deviation, and minimum and maximum values are reported. Table 2(c) presents the public life insurance companies listed on the SET. Table 2(d) summarizes descriptive statistics for the monthly stock returns of actively traded life insurers in the SET from January 2000 to December 2022.
Table 2.
Descriptive statistics data summary. (a) This table summarizes the descriptive statistics for the dependent and independent variables outlined in Section 3. It presents an overview of 525 firm-year observations from January 2000 to December 2020. (b) This panel further breaks down the 525 firm-year observations into “normal” and “low rate” periods. Data from 2000 to 2014 are classified as the “normal” period, and data from 2015 onward as the “low rate” period. (c) Public life insurance companies listed on the SET (Stock Exchange of Thailand, 2023). (d) Descriptive statistics for the monthly stock returns of actively traded life insurers in the SET from January 2000 to December 2022.
4.2. Two-Sample T-Test
T-Test, a statistical test for the means of two groups, was employed in this study to identify whether the mean difference between the two groups is statistically significant (Singh & Sharma, 2024). For a two-sample t-test on liability management with an observable shift in life insurance product mix, Table 3(a) shows that the mean volume of non-interest-sensitive new business is statistically higher during “low rate” periods at a 5% significance level for the Thai market. The prolonged low-interest rate environment has required several life insurers to shift their business mix toward non-interest-rate-sensitive products, as emphasized by Focarelli (2015), to reduce reliance on investment income.
Table 3.
Two-sample t-test. (a) This table presents the t-test result for H0: mean [variable] is higher during the “low rate” period, using a sample of 525 firm-years in the Thai life insurance market from 2000 to 2020. (b) This table presents the t-test result of H0: mean [variable] is higher for LargeSize, using a sample of 525 firm-years in the Thai life insurance market from 2000 to 2020.
Additionally, large Thai life insurers have a higher mean proportion of interest-sensitive (IS) products compared to mid- and small-size insurers, as shown in Table 3(b). This result supports the prior conclusion by Berends et al. (2013) that stock prices of large life insurers fluctuate more than those of small insurers because large insurers hold a greater proportion of interest-rate-sensitive products in their portfolios.
In contrast, under the Thai RBC regime, Table 3(a) shows that the average solvency level of life insurers is not statistically different between “normal” and prolonged low-interest-rate periods.
4.3. Panel Regressions
Life insurers manage liability portfolios by considering interest rate risk associated with guaranteed products. In the Thai market, the proportion of interest-sensitive products is statistically significant in increasing the return on assets of life insurers. Accordingly, the prolonged low-interest-rate environment requires life insurers to shift their business mix toward non-interest-rate-sensitive products to reduce reliance on investment income (Focarelli, 2015).
Panel regression analysis was performed on a cross-sectional dataset by grouping into two dimensions of time and specific characteristic values of the i objects—company i in this study (Y. Guo et al., 2022; X. Guo et al., 2016). For capital adequacy and solvency management, four potential factors were examined for the dependent variable RBC: the solvency level of company i in year t. Only ROA was found to influence the solvency level of Thai life insurers. Niedrig (2015) reported that changes in long-term interest rates affect insurers’ optimal risk portfolios by prompting them to add riskier asset classes in pursuit of higher yields. Similarly, in Germany, life insurers increased allocations to more illiquid investments, such as infrastructure bonds, to improve yields (Nieder, 2016). As risk exposure increases, the required capital rises, potentially lowering the solvency position.
In contrast, although Thai life insurers have increased risk-taking to enhance investment returns and meet policyholder obligations (Kablau & Weiß, 2014), the proportion of risky investment assets (risky) is not related to solvency levels (RBC) in the Thai market. This may be due to the insurers’ ability to balance asset allocations against capital risk charges.
For stock return analysis, only the market index return (SET_I) significantly explains stock returns at the 1% level in an aggregated portfolio of all six insurers. Changes in interest rate sensitivity were not statistically significant between “low rate” and “normal” periods. This result is not surprising for the Thai market, given data limitations, as most Thai life insurers are non-listed companies. Additionally, no moderation effects were observed in the “low rate” environment. Please refer to Table 4; Table 5 for the output summary.
Table 4.
Multivariate regression of stock returns of Thai life insurers.
Table 5.
Multivariate regression of stock returns of Thai life insurers with moderation effect.
5. Discussion
Life insurers manage their liabilities portfolios by adjusting their product mix, managing interest rate risk on guaranteed products, and maintaining solvency. During prolonged periods of low interest rates, insurers typically shift their product portfolios toward less investment return-dependent or non-guaranteed products (Focarelli, 2015), as offering savings-oriented products profitably becomes difficult (Hartley et al., 2016). As interest rate risk tends to be higher for life insurers in a “low rate” environment, as previously observed in the US market (Hartley et al., 2016), it is expected that the Thai insurance market would exhibit different performance outcomes in “normal” and “low rate” periods. When interest rates fluctuate, policyholders exercise available options—surrendering annuities with low guaranteed rates when market rates rise, or increasing contributions when rates fall. The combined effect of guaranteed returns and policyholder behavior is thus a crucial determinant of insurers’ interest rate sensitivity (Hartley et al., 2016).
Although the Thai life insurance market relies mainly on agency distribution, there is no evidence that agency-led insurers issue a significantly higher proportion of interest-sensitive products compared to bancassurance-led or other insurers. Additionally, Thai life insurers’ ROA tends to rise with improved solvency, as some insurers focus on strengthening capital adequacy to offset revenue compression caused by declining investment yields (Holsboer, 2000). However, no significant interaction effect is observed between solvency and ROA during the “low rate” period. Notably, large Thai life insurers maintain a higher average proportion of interest-sensitive products than their mid- and small-sized counterparts.
Globally, life insurers typically match long-term liabilities with long-term government or corporate bonds in “normal” periods and shift to riskier asset classes in “low rate” environments (Hartley et al., 2016). In contrast, the proportion of risky investment assets held by Thai life insurers does not correlate with their solvency levels.
Consistent with global trends, the mean volume of non-interest-sensitive new business in Thailand is statistically higher during the “low rate” period (Focarelli, 2015). Regarding solvency, the average level under Thailand’s regulatory regime shows no significant difference between “normal” and prolonged low-interest rate periods. Furthermore, the proportion of risky assets is not significantly related to Thai insurers’ solvency positions. Under a risk-based capital regime, insurers are expected to balance asset and capital allocations to manage higher risk charges associated with riskier assets (Berends et al., 2013).
The stock return analysis reveals no correlation between interest rate changes and the stock returns of Thai life insurers. The result was potentially caused by thin trading from a few publicly traded life insurers in the market and their restricted trading histories. It may omit some relevant outcomes as the stock of life insurers may not be sufficiently liquid, or some neglected factors may not be incorporated.
This study offers two key contributions to life insurance liability management. First, it quantifies the relationships among potential drivers of liability management during prolonged low-interest rate periods, showing that insurers actively manage their product mix, investment strategies, and capital adequacy. Second, extending insights from Wieland (2017), the findings suggest opportunities for future research to focus on capital efficiency and the enhancement of RBC and Own Risk and Solvency Assessment (ORSA) frameworks, not just for financial soundness but also for solvency analysis. This research will incorporate new variables related to RBC and ORSA—such as regulatory solvency measures and the product mix of interest- and non-interest-sensitive products—to better explain these relationships.
The second contribution is its extension of existing research to the Asian market, where the impact of prolonged low interest rates on life insurers’ financial positions and solvency has received limited attention. Previous studies have analyzed the effects of low interest rates on the solvency of German life insurers through scenario analyses (Kablau & Weiß, 2014; see also Kablau & Wedow, 2012) and highlighted that products sold with guarantees generate substantial capital requirements under Solvency II (Nieder, 2016). This research aims to explore whether the situation in Thailand mirrors these global patterns and whether the Thai market can serve as a representative case for the broader Asian market.
Although this study builds upon the existing literature, it introduces a new dataset covering the Thai life insurance market from 2001 to 2020, providing novel insights specific to this context. It also addresses how the impact of prolonged low interest rates in Thailand may differ from that observed in other countries.
Furthermore, this research investigates regulatory solvency and factors influencing life insurers’ financial stability and profitability. It examines the relationship between various product types and market interest rate movements. Some insurers focus on increasing operational efficiency to compensate for revenue compression caused by declining investment yields (Holsboer, 2000). Capital efficiency, often measured by the present value of future profits relative to solvency capital requirements for interest rate risk, is expected to improve when insurers shift their new business portfolios to products without minimum guaranteed interest rates (Wieland, 2017). Therefore, this study also aims to understand the solvency positions of Thai life insurers and potential shifts in product mixes during prolonged low-interest rate periods, as no prior research has explored this area.
6. Conclusions
This study examined the liability management practices of Thai life insurers in response to prolonged low-interest rate environments, focusing on changes in product mix, interest rate risk management, and regulatory solvency. Using data from 2001 to 2020, the research explored how insurers adapted their strategies and whether these adjustments mirrored patterns observed in global markets. The findings suggest that, similar to international insurers, Thai life insurers shifted their new business portfolios toward non-interest-sensitive products during low-interest rate periods to mitigate profitability pressures from declining investment returns.
However, unlike trends reported in other markets, the proportion of risky investment assets held by Thai life insurers showed no significant relationship with solvency positions. Additionally, no notable difference was observed in average solvency levels between normal and prolonged low-interest rate periods under Thailand’s regulatory framework. Large insurers maintained a higher proportion of interest-sensitive products compared to their smaller counterparts, though distribution channel differences did not significantly influence product type proportions.
These insights contribute to the limited literature on the Asian insurance market’s response to sustained low interest rates and offer practical implications for policymakers and insurers navigating similar economic conditions.
For future research, scholars could extend the analysis to the non-life insurance sector and compare it with life insurance. This would help uncover the often-overlooked short-term liability management practices associated with non-life products, providing a more comprehensive view of the insurance industry. Moreover, while this study does not address efficiency improvements in response to a “low rate” environment, future studies could explore this dimension. Lastly, results may vary if other risk factors—such as policyholder behavior, management decisions, or board-level interventions—are incorporated into the analysis.
Author Contributions
Conceptualization, W.S. and S.Z.; methodology, W.S. and S.Z.; software, W.S. and S.Z.; validation, W.S. and S.Z.; formal analysis, W.S. and S.Z.; writing—original draft preparation, W.S. and S.Z.; writing—review and editing, S.Z.; visualization, W.S. and S.Z.; supervision, S.Z.; project administration, S.Z. All authors have read and agreed to the published version of the manuscript.
Funding
This research received no external funding.
Institutional Review Board Statement
Not applicable.
Informed Consent Statement
Not applicable.
Data Availability Statement
Data are available in a publicly accessible repository.
Conflicts of Interest
The authors declare no conflicts of interest.
Abbreviations
The following abbreviations are used in this manuscript:
| ALM | Asset-liability management |
| RBC | Risk-based capital |
| SET | Stock Exchange of Thailand |
| ROA | Return on assets |
| NIS | Non-interest-sensitive |
| IS | interest-sensitive |
| ORSA | Own risk and solvency assessment |
References
- Albrecher, H., Bauer, D., Embrechts, P., Filipović, D., Koch-Medina, P., Korn, R., Loisel, S., Pelsser, A., Schiller, F., Schmeiser, H., & Wagner, J. (2018). Asset-liability management for long-term insurance business. European Actuarial Journal, 8, 9–25. [Google Scholar] [CrossRef]
- Asvatanakul, J. (2011). An overview of the insurance industry in Thailand. The Journal of Risk Management and Insurance, 15(1), 1–10. [Google Scholar]
- Berdin, E., & Gründl, H. (2015). The effects of a low interest rate environment on life insurers. The Geneva Papers on Risk and Insurance-Issues and Practice, 40(3), 385–415. [Google Scholar] [CrossRef]
- Berends, K., McMenamin, R., Plestis, T., & Rosen, R. J. (2013). The sensitivity of life insurance firms to interest rate changes. Economic Perspectives, 37(2), 47–78. [Google Scholar]
- Bohnert, A., Gatzert, N., & Jørgensen, P. L. (2015). On the management of life insurance company risk by strategic choice of product mix, investment strategy and surplus appropriation schemes. Insurance: Mathematics and Economics, 60, 83–97. [Google Scholar] [CrossRef]
- Brown, Z. M., & Galitz, L. (1982). Inflation and interest rates a research study using the ASIR model. Geneva Papers on Risk and Insurance, 7(25), 290–320. [Google Scholar] [CrossRef]
- Chen, T. J. (2015). Bancassurance and operational performance of life insurers in Taiwan. Academy of Management Proceedings, 2015(1), 11496. [Google Scholar] [CrossRef]
- Connelly, J. T., & Limpaphayom, P. (2004). Board characteristics and firm performance: Evidence from the life insurance industry in Thailand. Chulalongkorn Journal of Economics, 16(2), 101–124. [Google Scholar]
- Del Negro, M., Giannone, D., Giannoni, M. P., & Tambalotti, A. (2019). Global trends in interest rates. Journal of International Economics, 118, 248–262. [Google Scholar] [CrossRef]
- Eling, M., & Holder, S. (2013a). Maximum technical interest rates in life insurance in Europe and the United States: An overview and comparison. The Geneva Papers on Risk and Insurance-Issues and Practice, 38(2), 354–375. [Google Scholar] [CrossRef]
- Eling, M., & Holder, S. (2013b). The value of interest rate guarantees in participating life insurance contracts: Status quo and alternative product design. Insurance: Mathematics and Economics, 53(3), 491–503. [Google Scholar] [CrossRef][Green Version]
- Focarelli, D. (2015). ALM with ultra-low interest rates–(life) insurance perspective. Available online: https://www.suerf.org/wp-content/uploads/2015/03/l_1f0e3dad99908345f7439f8ffabdffc4_1475_suerf.pdf (accessed on 17 July 2025).
- Greene, W. H., & Segal, D. (2004). Profitability and efficiency in the US life insurance industry. Journal of Productivity Analysis, 21(3), 229–247. [Google Scholar] [CrossRef]
- Grosen, A., & Jørgensen, P. L. (2000). Fair valuation of life insurance liabilities: The impact of interest rate guarantees, surrender options, and bonus policies. Insurance: Mathematics and Economics, 26(1), 37–57. [Google Scholar] [CrossRef]
- Guo, X., Ren, D., & Shi, J. (2016). Carbon emissions, logistics volume, and GDP in China: Empirical analysis based on panel data model. Environmental Science and Pollution Research, 23, 24758–24767. [Google Scholar] [CrossRef] [PubMed]
- Guo, Y., Li, B., Duan, T., Yao, N., Wang, H., Yang, Y., & Liu, S. (2022). A panel regression analysis for the COVID-19 epidemic in the United States. PLoS ONE, 17(8), e0273344. [Google Scholar] [CrossRef] [PubMed]
- Hartley, D., Paulson, A., & Rosen, R. J. (2016). Measuring interest rate risk in the life insurance sector. In The economics, regulation, and systemic risk of insurance markets (pp. 124–153). Oxford Academic. [Google Scholar]
- Hausman, J. A. (1978). Specification tests in econometrics. Econometrica: Journal of the Econometric Society, 46(6), 1251–1271. [Google Scholar] [CrossRef]
- Henebry, K. L., & Diamond, J. M. (1998). Life insurance company investment portfolio composition and investment regulation. Journal of Insurance Issues, 21(2), 183–203. [Google Scholar]
- Holsboer, J. H. (2000). The impact of low interest rates on insurers. The Geneva Papers on Risk and Insurance: Issues and Practice, 25(1), 38–58. [Google Scholar] [CrossRef]
- Kablau, A., & Wedow, M. (2012). Gauging the impact of a low interest rate environment on German life insurers. Applied Economics Quarterly, 58(4), 279–298. [Google Scholar] [CrossRef]
- Kablau, A., & Weiß, M. (2014). How is the low-interest-rate environment affecting the solvency of German life insurers? Available online: https://www.bundesbank.de/en/publications/reports/financial-stability-reviews/list-of-references-768388 (accessed on 18 May 2022).
- Kling, A., Richter, A., & Ruß, J. (2007). The impact of surplus distribution on the risk exposure of with profit life insurance policies including interest rate guarantees. Journal of Risk and Insurance, 74(3), 571–589. [Google Scholar] [CrossRef]
- LePan, N. (2019). The history of interest rates over 670 years. Available online: https://www.visualcapitalist.com/the-history-of-interest-rates-over-670-years/ (accessed on 17 July 2025).
- Nieder, D. (2016). The impact of the low interest rate environment on life insurance companies. Reinsurance News, 87, 16–21. [Google Scholar]
- Niedrig, T. (2015). Optimal asset allocation for interconnected life insurers in the low interest rate environment under solvency regulation. Journal of Insurance Issues, 38(1), 31–71. [Google Scholar] [CrossRef][Green Version]
- Office of Insurance Commission. (2022). OIC RBC. Available online: https://www.oic.or.th/en/industry/company/supervision/313/917 (accessed on 6 August 2022).
- Ozdagli, A. K., & Wang, Z. K. (2019). Interest rates and insurance company investment behavior. Available online: https://ssrn.com/abstract=3479663 (accessed on 17 July 2025).
- Paetzmann, K. (2011). Discontinued German life insurance portfolios: Rules-in-use, interest rate risk, and Solvency II. Journal of Financial Regulation and Compliance, 19(2), 117–138. [Google Scholar] [CrossRef]
- Population of Thailand. (2023). Population by age. Available online: https://www.populationof.net/thailand/ (accessed on 21 November 2023).
- Reyna, A. M., Fuentes, H. J., & Núñez, J. A. (2021). Response of Mexican life and non-life insurers to the low interest rate environment. The Geneva Papers on Risk and Insurance-Issues and Practice, 47, 409–433. [Google Scholar] [CrossRef] [PubMed]
- Singh, A., & Sharma, H. K. (2024). Modified Total Interpretive Structural Modeling (M-TISM) for the Insurance Sector. Journal of Insurance Issues, 47(2), 210–242. [Google Scholar]
- Stock Exchange of Thailand. (2023). Stock Exchange of Thailand SET—INSUR (FINCIAL) index. Available online: https://www.set.or.th/th/market/index/set/fincial/insur (accessed on 16 April 2023).
- Suwanmalai, W., & Zaby, S. (2022). How do life insurers respond to a prolonged low interest rate environment? A literature review. Risks, 10(8), 155. [Google Scholar] [CrossRef]
- Thai Bond Market Association. (2023). 10-year government bond yields. Available online: https://www.thaibma.or.th/EN/Market/YieldCurve/Government.aspx (accessed on 1 March 2023).
- Thai Life Assurance Association. (2023). New business report. Available online: https://www.tlaa.org/page_statistics_new (accessed on 16 April 2023).
- Wieland, J. (2017). Runoff or redesign? Alternative guarantees and new business strategies for participating life insurance. European Actuarial Journal, 7(1), 29–50. [Google Scholar] [CrossRef]
- World Government Bonds. (2023). Germany 10-year bond—Historical data. Available online: https://www.worldgovernmentbonds.com/bond-historical-data/germany/10-years (accessed on 12 February 2023).
- World Health Organization. (2023). Thailand’s leadership and innovations towards healthy ageing. Available online: https://www.who.int/southeastasia/news/feature-stories/detail/thailand (accessed on 17 July 2025).
Disclaimer/Publisher’s Note: The statements, opinions and data contained in all publications are solely those of the individual author(s) and contributor(s) and not of MDPI and/or the editor(s). MDPI and/or the editor(s) disclaim responsibility for any injury to people or property resulting from any ideas, methods, instructions or products referred to in the content. |
© 2025 by the authors. Licensee MDPI, Basel, Switzerland. This article is an open access article distributed under the terms and conditions of the Creative Commons Attribution (CC BY) license (https://creativecommons.org/licenses/by/4.0/).