Abstract
The maritime sector faces urgent decarbonisation pressures due to regulatory instruments, such as the International Maritime Organization’s (IMO) Carbon Intensity Indicator (CII), which mandates reductions in greenhouse gas emissions per transport work. This paper investigates the challenge of identifying CII-compliant strategies that are also financially viable for UK shipowners. To address this, operational and technical data from UK-flagged vessels over 5000 GT are analysed using a capital budgeting framework. This includes scenario-based evaluation of speed reduction, payload limitation, and retrofitting with dual-fuel LNG and methanol engines. The analysis integrates carbon taxation, and pilot fuel use to assess impacts on emissions and profitability. The findings reveal that while the short-term operational measures examined offer modest gains, long-term compliance and financial performance are best achieved through targeted retrofitting supported by carbon taxes and favourable market conditions. The study provides actionable insights for shipowners and policymakers seeking to align commercial viability with regulatory obligations under the evolving CII framework.
1. Introduction
The shipping industry, which facilitates over 80% of global trade (UNCTAD, 2021), is currently facing increasing pressure to reduce its carbon footprint while maintaining profitability. Shipowners, who are at the heart of this transition, must navigate a complex landscape of regulatory requirements, technological advancements, and economic challenges. The International Maritime Organisation (IMO) has set ambitious targets to reduce greenhouse gas (GHG) emissions from international shipping, including a 40% reduction in carbon intensity by 2030 compared to 2008 levels, and a 70% reduction by 2040, with the ultimate goal of achieving net-zero emissions by or around 2050 (IMO, 2023b). To meet these targets, the IMO has introduced new regulations, such as the Carbon Intensity Indicator (CII) and the Energy Efficiency Existing Ship Index (EEXI), which came into effect in January 2023. These regulations require shipowners to improve the operational (e.g., speed reduction) and technical efficiency (e.g., use of alternative fuels) of their fleets, with non-compliance potentially leading to financial penalties and operational restrictions.
For shipowners, the challenge is twofold: they must ensure regulatory compliance while also maintaining profitability. This dual objective requires a careful assessment of the costs and benefits of various decarbonisation strategies, including operational measures, like speed reduction and payload adjustments, as well as technical interventions, such as engine retrofitting for alternative fuels. The decisions shipowners make today will have long-term implications for their fleets. This is especially important as the industry transitions towards a low-carbon future. This paper contributes to existing knowledge by integrating technical and economic assessments of decarbonisation strategies under the CII framework, offering a fleet-level analysis across bulkers, container ships, and tankers—an underexplored area in the literature. Unlike prior studies that assess compliance strategies in isolation, this research models their financial viability under varying charter rates and carbon taxation, reflecting real market conditions. It further advances understanding by accounting for pilot fuel emissions in dual-fuel retrofits and by bridging the gap between short-term operational adjustments and long-term retrofit investments. By aligning regulatory compliance with commercial feasibility, the study provides a strategic framework that informs both academic debate and policy design.
From a shipowner’s perspective, the primary concern is balancing the need to comply with increasingly stringent environmental regulations with the imperative to maintain financial viability. The introduction of the CII and EEXI regulations has added a new layer of complexity to this challenge. The CII requires shipowners to monitor and report their vessels’ carbon intensity annually, with ratings ranging from A (best) to E (worst). Ships that consistently receive a D or E rating must develop corrective action plans, which could involve costly operational changes or technical upgrades. For shipowners, the key question is how to achieve compliance in a way that minimises costs and maximises returns on investment.
Speed reduction is a swift and cost-effective strategy, also known as “slow steaming”. By reducing a ship’s speed, fuel consumption and CO2 emissions can be significantly lowered, as fuel consumption is proportional to the cube of the ship’s speed (Barrass, 2004). This approach has been widely adopted in the industry, particularly during periods of high fuel prices, as it offers a straightforward way to reduce operational costs. However, speed reduction also has downsides: it increases voyage duration, which can lead to higher operational costs and reduced revenue, particularly for time-chartered vessels. Another operational measure that shipowners can consider is payload reduction. By carrying less cargo, a ship’s fuel consumption and emissions can be reduced, which may help improve its CII rating. However, this strategy comes with significant trade-offs, as it directly impacts revenue. For shipowners, the decision to reduce payload must be carefully weighed against the potential benefits of improved CII compliance. In some cases, the savings from reduced fuel consumption may offset the loss of revenue, but this depends on factors, such as freight rates, fuel prices, and the specific operational profile of the vessel.
While operational measures offer short-term solutions, shipowners must also consider longer-term strategies, such as transitioning to alternative fuels or retrofitting existing vessels to improve their energy efficiency. Liquefied natural gas (LNG) and methanol are two of the most promising alternative fuels currently available, offering significant reductions in CO2 emissions compared to conventional marine fuels. However, the adoption of these fuels requires substantial upfront investment, particularly for retrofitting existing vessels. For example, retrofitting a bulker to use LNG can cost around USD 101 per deadweight tonne (DWT), while retrofitting a container ship can cost up to USD 4000 per twenty-foot equivalent unit (TEU) (SEA-LNG, 2023; Shipuniverse, 2024).
From a shipowner’s perspective, the decision to invest in engine retrofitting must be based on a thorough cost–benefit analysis. While these technologies offer the potential for long-term emissions reductions and improved CII ratings, they also come with significant financial risks (L. Yu et al., 2021b). The availability of alternative fuels is still limited, and the infrastructure for their production, storage, and distribution is underdeveloped. Additionally, alternative fuels often require pilot fuels, which can offset the emissions reductions gained from lower-carbon fuels. For example, grey methanol and LNG engines typically require 3% pilot fuel, which can increase CO2 emissions and reduce the overall effectiveness of these fuels in achieving CII compliance.
In addition to operational and technical measures, shipowners must also consider the potential impact of market-based measures (MBMs), such as carbon taxation, on their business decisions. A carbon tax would impose a fee on CO2 emissions from ships, creating a financial incentive for shipowners to reduce their emissions. Proponents argue that a carbon tax could help bridge the cost gap between conventional and low-carbon fuels, making alternative fuels more economically viable and accelerating the transition to greener shipping (ITF, 2022). From a shipowner’s perspective, the introduction of a carbon tax could have significant implications for profitability. On the one hand, it could increase the cost of using conventional fuels, making alternative fuels more attractive. On the other hand, it could lead to higher operational costs, particularly for shipowners who are unable to transition to lower-carbon technologies.
Despite the growing body of scientific literature on maritime decarbonisation, there are several notable gaps that are particularly relevant to shipowners. First, while several studies have examined the impact of individual measures, such as speed reduction or alternative fuels, there is a lack of comprehensive analyses that evaluate the effects of these measures on CII compliance on fleet level. Second, there is limited research on the economic feasibility at the fleet level of different decarbonisation strategies from a shipowner’s perspective, particularly in the context of the current regulatory framework. Third, the role of pilot fuels in the use of commercially available alternative fuels has been overlooked in literature, despite its potential impact on CII ratings and operational costs.
The debate surrounding maritime decarbonisation is complex, with competing views on the most effective strategies for reducing emissions while maintaining economic viability. This study reconciles this debate by providing a holistic assessment of the various decarbonisation strategies available to shipowners. By evaluating the impact of different measures on CII compliance and considering the economic implications of each option, the study offers a balanced perspective on the trade-offs involved in maritime decarbonisation. The findings highlight the limitations of short-term compliance strategies and emphasise the need for integrated regulatory approaches that align industry economics with sustainability objectives.
The remaining sections are structured as follows. Section 2 includes the literature review. Section 3 presents the current CII regulatory framework governing the decarbonisation of the shipping industry to investigate how and to what extent shipowners are affected and includes the results of operational carbon emissions of UK ships, for which data were available, up to 2030, according to the CII metric as defined by IMO, assuming a business as usual (BaU) scenario. In Section 4, the measures for improving the CII ratings are investigated and results are presented for speed reduction, the use of currently available fuels namely liquified natural gas (LNG), grey methanol, hydrotreated vegetable oil (HVO), and very low sulphur fuel oil (VLSFO). I also examine the economic feasibility of retrofitting ships with methanol and LNG dual-fuel (DF) engines to improve the CO2 footprint, taking into consideration the pilot fuel required. The financial metrics used include the net present value (NPV), the internal rate of return (IRR), the return on investment (ROI), and the payback period. A sensitivity analysis of the NPV is performed to evaluate changes relating to time charter (TC) rate and carbon tax, as well as discount rate. Furthermore, a formula is developed to assess the economic implications of payload reduction and predict its impact on CII. Section 5 concludes and presents policy recommendations.
2. Literature Review
While recent research has extensively examined carbon abatement strategies in shipping, several limitations remain unaddressed that are critical from a shipowner’s perspective under the evolving IMO Carbon Intensity Indicator (CII) framework. For instance, Gao et al. (2023) employed a system dynamics approach to explore decarbonisation scenarios, primarily focusing on long-term projections without delving into the short- to medium-term CII compliance implications. Similarly, Kim et al. (2024) proposed operational pathways to improve CII but did not analyse the economic feasibility or retrofitting investments at the fleet level. Furthermore, Mi et al. (2024) provided a comprehensive bibliometric mapping of green shipping research but did not engage with the operational and financial realities that shipowners face when applying these solutions across different vessel types.
There is also a growing debate surrounding the practical application of current regulatory instruments, such as the CII, and the feasibility of integrating market-based mechanisms, like carbon taxation. While Baresic et al. (2024) argue for the early adoption of zero-emission fuels, this view assumes broad availability of such fuels and infrastructure, which may not be economically or logistically viable in the short term. Kavussanos et al. (2025) highlight how vessel fixture decisions across contract durations are shaped by market uncertainty and freight rate dynamics. While their study focuses on chartering behaviour, it underscores the broader market sensitivities shipowners face—reinforcing the relevance of aligning decarbonisation strategies, like CII compliance, with evolving commercial and regulatory environments. Pangalos (2023) highlights the need for financial innovation to support sustainability in shipping, and Moutzouris et al. (2025) examine scrubber investments under fuel price and freight rate uncertainty, supporting this study’s argument that decarbonisation strategies—such as engine retrofitting—must be evaluated within dynamic market and policy contexts.
This paper contributes to the sustainable shipping literature through an analysis on fleet level using a techno-economic framework that comprehensively evaluates operational and technical compliance options under the CII metric, while also integrating a financial assessment that includes NPV, IRR, and payback periods. Unlike prior studies that focus on single vessel types or specific routes (e.g., Hua et al., 2024; Q. Zhang et al., 2024), this research leverages data from the UK fleet comprising bulkers, container ships, and tankers to examine retrofit feasibility, fuel choice, and carbon pricing impacts at scale. Notably, this study fills the following key research gaps:
- Policy-compliance nexus: By assessing the effectiveness of compliance strategies, like speed and payload reduction, as well as engine retrofits, under the CII scheme, this study contributes empirical insights into the policy–performance link currently absent from the literature.
- Fleet-level economic feasibility: This paper uniquely evaluates the cost-effectiveness of retrofitting with LNG and grey methanol engines across multiple ship types, offering granular insights for fleet-wide decisions.
- Pilot fuel impact: The study quantifies the influence of pilot fuel on CII performance—an often overlooked yet significant factor in determining the actual emissions benefits of low-carbon alternatives.
- Market-based measures integration: By modelling CO2 taxes in conjunction with CII scores, the paper offers a realistic scenario analysis that reflects how financial levers could accelerate or hinder technology adoption.
Through this multidimensional approach, the study contributes to both the academic discourse and industry practice, offering a balanced, data-driven framework to guide shipowners navigating the decarbonisation imperative. It bridges fragmented perspectives in the literature and proposes actionable pathways for sustainable and financially viable compliance under evolving regulatory regimes.
This comprehensive review of the literature on maritime transport and its related emissions reveals a notable concentration on studies, such as optimising speed and exploring alternative fuels. Furthermore, there has been a significant exploration of economic challenges aimed at emission abatement. However, to the best of my knowledge, there is a lack of emphasis on evaluating the results of these studies in relation to policy measures and CII compliance. Furthermore, effective policy instruments play a crucial role in driving the adoption of improved solutions for climate change mitigation, and the IMO faces challenges (Bach & Hansen, 2023) that should be addressed in view of the upcoming CII revision.
Reducing ship speed, commonly referred to as slow steaming, is an effective strategy for lowering fuel consumption and GHG emissions through combined speed-routing scenarios. This approach is well-documented in the maritime shipping literature (Degiuli et al., 2021; Mallidis et al., 2018; Pelić et al., 2023; Stopford, 2008; Taskar & Andersen, 2020), with extensive research on the economic implications of speed reduction (Chang & Wang, 2014; Corbett et al., 2009) and optimal speed analysis for specific ship types (Tan et al., 2022; Doudnikoff & Lacoste, 2014). However, there is limited analysis on the effect of speed on CII, as emphasised by Hua et al. (2024). Furthermore, several papers assess the impact of policy measures on maritime transport, namely the analysis of Solakivi et al. (2022) on the cost competitiveness of alternative marine fuels and that of Bouman et al. (2017) reviewing the potential in shipping of various GHG reduction measures. However, by focusing on a single vessel type in terms of technological specifications, none of the existing articles examined the effect of various measures on CII at the fleet level including various ship types.
In relation to retrofitting marine dual-fuel (DF) engines to accommodate lower-carbon fuels, several studies have focused on the technical aspects of these retrofits (Dierickx et al., 2021; Marchitto et al., 2024), often examining their environmental impact in tandem (Lim et al., 2024). Research has also explored the cost-effectiveness of such retrofitting solutions (Ge & Wang, 2017; Perčić et al., 2021; J. Zhang et al., 2024). However, the existing literature overlooks the policy implications in managerial decisions required for achieving CII compliance in the short term. This study aims to address this gap, while also accounting for the required pilot fuel in the case of engine retrofitting—a factor often overlooked or considered negligible in existing studies.
In addition, the market-based measures (MBMs) proposed (Faber et al., 2009; Mundaca et al., 2021) recommend the use of a carbon levy to bridge the cost difference between fuels with low emissions and conventional marine fuels, thus encouraging a more rapid transition to greener fuels. The shipping literature includes the assessment of MBMs on the fleet level, namely the paper of Zhu et al. (2018), who discuss the influence of maritime emissions trading systems on carbon emissions, and Marrero and Martínez-López (2023) assessing the effectiveness of EU decarbonisation measures in short-sea shipping. Furthermore, existing research predominantly examines emissions from single ships (H. Yu et al., 2021a; Taskar et al., 2023; Zis et al., 2020), or a fleet of same type of vessels (Q. Zhang et al., 2024), leaving a significant gap in comparative analyses that explore a combination of different measures, which could assist shipowners in complying with the new IMO CII measure. Grigoriadis et al. (2024) assess the environmental performance of various ship classes but do not examine the CII rating. Carbon tax scheme analyses show that their introduction to shipping could accelerated the uptake of alternative fuel sources (Li & Yang, 2024). Although the CII was not originally designed to be implemented alongside a CO2 tax, the analysis demonstrates that this combination can be beneficial from a policy perspective, as it encourages managerial practices that more effectively align with the IMO’s decarbonisation targets. It is worth noting that several proposals have been submitted to the IMO since 2021, with the latest one submitted in December 2024 (ICS, 2024). Among these, the International Chamber of Shipping, representing over 90% of the global merchant fleet, proposed the implementation of an annual carbon tax starting in 2027.
In the context of current research on carbon emissions reduction in shipping, particularly concerning fuels, there exist areas that remain unaddressed and warrant further exploration to provide more relevant and contemporary insights. First, prior studies have focused on e-methanol, ammonia, and hydrogen—fuels with significant potential but unlikely to be widely available in substantial quantities before 2030. Second, the consumption of pilot fuel is not accounted for in existing analyses. Third, the literature focuses on emissions from individual vessels operating on specific routes, with a notable lack of comparative studies across diverse ship types and routes.
This study takes a holistic approach to assessing the impact of technologies on society, providing a robust methodological framework for analysing the techno-economic options available to shipowners for achieving CII compliance while maintaining profitability. Using data from the UK shipping fleet, it evaluates operational measures (i.e., speed reduction, payload adjustments) and technical interventions (i.e., engine retrofitting for alternative fuels) on CII ratings, alongside financial incentives, like CO2, taxation to accelerate decarbonisation. By analysing the technical and operational data from Clarksons SIN of UK ships over 5000 GT, I quantify the effects of policy measures and examine compliance strategies. While decarbonisation pathways differ between international and domestic shipping (Nuttall et al., 2021), the measures assessed have global applicability. More specifically, the originality of this research lies in its techno-economic analysis of carbon emissions across various ship types from 2023 onwards, evaluating CII performance until 2030 and assessing mitigation strategies. It introduces a novel framework for achieving CII compliance, first assessing existing ship types, and then applying speed reduction to gauge its impact. Additional measures, such as engine retrofitting, are systematically analysed, factoring in economic feasibility and potential CO2 taxation to bridge the cost gap between conventional and low-emission fuels. For cases where speed reduction or retrofitting is impractical, the study explores payload reduction as a last-resort compliance measure, assessing the potential of fuel savings in offsetting revenue losses. The sensitivity analyses of NPV conducted to assess the impact of TC rates, carbon tax, and discount rates, offer a nuanced perspective on the financial challenges shipowners face in making profitable decarbonisation decisions. Through this structured methodology, the research provides insights for policymakers and industry stakeholders towards sustainable maritime practices. The results and discussions are presented within the respective sections for each measure examined.
3. Data and Methodology for the Evaluation of CII
3.1. The CII Calculation
The CII calculation (IMO, 2022a) is based on the tank-to-wake (TtW) CO2 calculation methodology, which does not consider emissions from fuel production and transportation. IMO is expected to assess the effectiveness of CII implementation by 1 January 2026, potentially incorporating a well-to-wake (WtW) approach (IMO, 2023a).
The annual operational CII is calculated using the formula presented in Equation (1). The relevant correction factors for ships travelling through the Arctic zone have been disregarded. However, there are implications of the CII regulation for ships sailing in ice-covered waters (Tran et al., 2023).
The attained CII is obtained as follows:
where the terms are defined as follows:
FCj is the total mass (grams) of the consumed fuel oil of type j per year;
CFj is the fuel oil mass (grams) to CO2 conversion factor for the fuel type used;
C is the ship’s capacity (DWT or GT);
Dt is the total distance travelled in nautical miles (NM).
The attained CII is then compared to the required CII of Equation (2) to obtain the CII rating, as follows:
where Equation (3) is as follows:
where parameters α and c are obtained from median regression analysis of data gathered by the IMO in 2019, with their values varying based on ship type (i.e., α = 1984 and c = 0.489 for container ships), (IMO, 2022b).
CIIREF of Equation (3) is described by the IMO as being based on the capacity of different ship types exceeding 5000 GT and engaging in international operations. The value of the reduction factor (Z) from the year 2023 takes the value of 5 and is increased by 2 each year to become 11 in 2026 (IMO, 2021). IMO has not yet produced the Z values for the period 2027–2030; therefore, assuming the same increase of 2 per year, Z becomes 19 in 2030.
The value given by the ratio of the attained CII over the required CII, is then compared to the four boundaries to produce the CII rating (A, B, C, D, or E). More specifically, the boundaries are called the superior, lower, upper, and inferior boundaries, and depend on ship type (for instance for container ships, superior boundary = 0.83, lower boundary = 0.94, upper boundary = 1.07, and inferior boundary = 1.19) (IMO, 2022c).
It is worth noting that the primary responsibility for CII compliance lies with shipowners, unless otherwise specified in contractual agreements with charterers. At the same time, the complexity of shipping operations can have a significant impact on a vessel’s CII rating. Therefore, cooperation between shipowners and charterers is important for establishing a commonly agreed operational plan.
3.2. CII Ratings and Outlook
A calculator tool is developed, which is used to determine the CII class based on the methodology described in Section 3.1 for three of the main shipping sectors, namely the bulkers, tankers, and container ships presented next. To estimate the classification for 2026 and 2030, it is assumed that the ships continue operating under their existing voyage patterns.
Tanker ships, which have a median age of 6.5 years, are expected to be compliant with CII requirements up to 2030. The tanker ships’ CII ratings are shown in Figure 1.
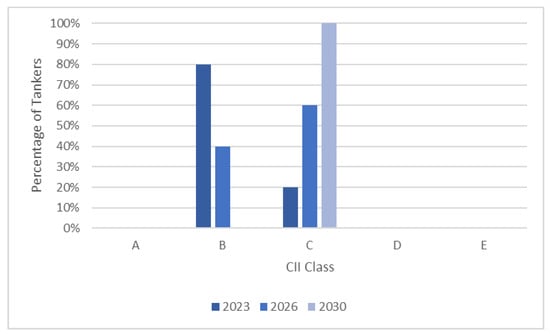
Figure 1.
Tankers’ CII class for the years 2023, 2026, and 2030.
Ships in the bulkers category show a relatively high dispersion of deadweight tonnage (DWT), ranging from 30,124 to 297,980 DWT. The CII rating for the bulker sector is also examined for the years 2023–2030, as shown in Figure 2. Bulkers have a median age of 15 years, and most have compliant CII class ratings, but at least 30% are expected to be non-compliant in 2030 with 22% in Class D. For those ships, the CII rating is calculated for LNG, methanol, and other alternative fuels in Section 4.2. Given the significant CII rating improvement, they are selected for further analysis of DF methanol and LNG engine retrofits, with their economic feasibility examined in in Section 4.3.2 and Section 4.3.3.

Figure 2.
Bulkers’ CII class for the years 2023, 2026, and 2030.
The containers, with twenty-foot equivalent unit (TEU) values ranging between 1068 and 8452, face greater challenges compared to bulkers and tankers. Over 60% of the container ships examined are projected to fall into Class D and E by 2030, as illustrated in Figure 3. This is partly due to their significantly higher CO2 emissions per nautical mile, based on the data used. With 33% of these ships having a median age of 17 years and at least 10 years of remaining economic life, they are considered for engine retrofits, to ensure operational viability until at least 2030, as detailed in Section 4.3.2 and Section 4.3.3.
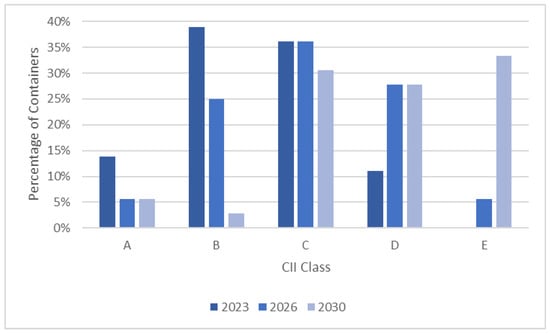
Figure 3.
Container ships’ CII class for the years 2023, 2026, and 2030.
In conclusion, the results for tankers indicate a modern fleet with lower emissions. In contrast, bulkers and container ships require updates through operational and technical carbon abatement measures to meet decarbonisation targets.
4. Measures for Improving the CII Rating
Shipowners and charterers can achieve CII-compliant ratings (A to C) through operational measures, such as voyage optimisation, payload reduction (examined in Section 4.4), and speed reduction, which is discussed next.
4.1. Speed Reduction
By reducing ship speed, I demonstrate that it is possible to improve the CII rating, as lower speeds lead to reduced CO2 emissions. These findings align with the results of Zhao et al. (2023). Fuel consumption is proportional to the cube of sailing velocity (Barrass, 2004). Since CO2 emissions are proportional to fuel consumption, they are also estimated to be proportional to the cube of the average sailing velocity for each ship type.
An analysis of the speed reduction required for the examined ship types to achieve at least a CII Class C rating by 2030 is presented in Figure 4.

Figure 4.
The percentage of speed reduction required for ships to achieve at least CII Class C in 2030 for tankers, bulkers, and container ships compared to the speed baseline for 2023.
It is important to note that reducing speed by, for example, 5% and 10%, results in a respective increase of 5% and 11% in the number of days required to cover the same distance. To mitigate this issue without disrupting the supply chain, it is essential to reduce port turnaround times (Argüello et al., 2022) and minimise waiting periods for accessing ports or canals.
According to our study, while speed reduction leads to lower income per unit of time, it also provides economic benefits through reduced fuel consumption and, consequently, lower fuel costs. Assuming a VLSFO fuel price of USD 650 per ton, Table 1 presents the average daily economic gains from fuel savings versus speed reduction for the vessel categories under study.

Table 1.
Average daily economic benefit from speed reduction at the 5% and 10% levels.
Speed reduction must account for key constraints, such as port infrastructure availability and time charter contracts, which may limit the ability to select optimal speeds and undermine the cost-effectiveness of speed reduction strategies.
4.2. CII Performance with Currently Available Fuels
The CII rating performance of the ships under consideration is examined up to 2026, ceteris paribus, for various currently available bunker fuels using the parameter values shown in Table 2. Specifically, these fuels include LNG, grey methanol, VLSFO, and HVO.
Table 2.
Specific energy SE and CO2 emissions coefficient Cf per fuel type (IMO, 2016, 2023a; EMSA, 2023).
For methanol and LNG combustion, a minimum pilot fuel requirement of 3% (Methanol Institute, 2023; MAN, 2021) of conventional fuel is necessary, and the associated CO2 emissions are included in our calculations.
The CO2 emitted by the new fuel is calculated by the following Equation (4):
which in the case of methanol and LNG with a minimum of 3% pilot fuel becomes the following Equation (5):
where the terms are defined as follows:
is the VLSFO-type total amount of fuel consumed in tons during the sailing time.
is the specific energy of VLSFO.
is the specific energy of the new fuel.
is the CO2 emissions coefficient of the new fuel.
CfVLSFO is the CO2 emissions coefficient of VLSFO fuel.
Accordingly, the new value of CII is obtained by the following Equation (6):
The results obtained for each category are summarised in Figure 5 for 2026.
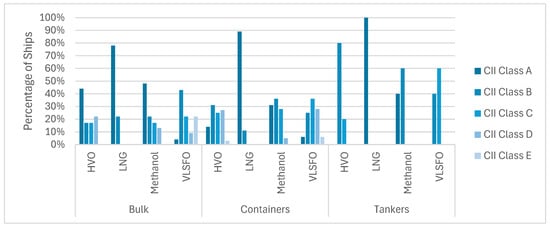
Figure 5.
CII class in 2026 of bulkers, container ships, and tankers using HVO, LNG, methanol, and VLSFO marine fuels.
LNG and grey methanol demonstrate the most significant improvements in CII ratings for all ship types in 2026. Further analysis of CII rating forecasts for 2030, focusing on bulkers and container ships, is presented in Figure 6 and Figure 7, respectively, given that tankers are expected to attain Class C, as shown in Figure 1.
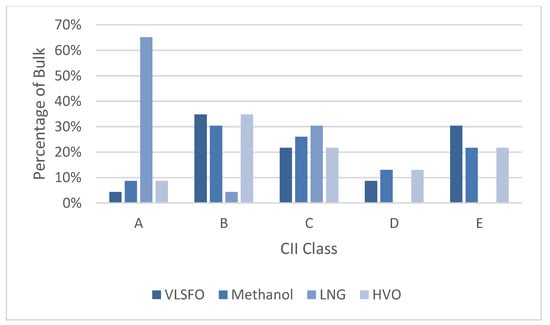
Figure 6.
CII class of bulkers in 2030 using LFO, methanol, LNG, and HVO marine fuels.
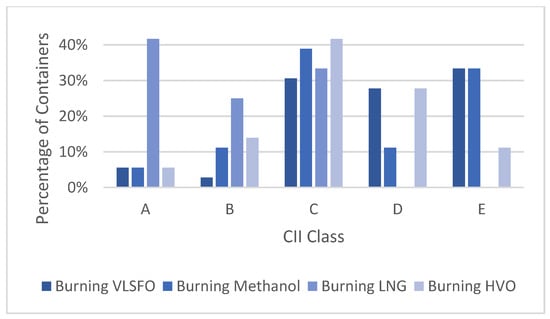
Figure 7.
CII class of container ships in 2030 using VLSFO, methanol, LNG, and HVO marine fuels.
The CII classification in the case of grey methanol and LNG, as shown in Figure 6 and Figure 7, is performed with 3% of the pilot fuel.
It is worth noting that for methanol, a pilot fuel requirement of 3 to 5% conventional fuel is necessary (Methanol Institute, 2023), though this can reach up to 10% in certain types of DF engines according to Lloyd’s Register (2023). For LNG, pilot fuel consumption ranges from 2.5% for 4-stroke medium speed DF engines to 4.7% for 2-stroke slow speed DF engines (MAN, 2021; Sphera, 2021; ICCT, 2020; ABS, 2022). However, depending on the load factor of the DF engine, the pilot fuel requirement for LNG can increase to 7% when the load factor reaches 85% of the maximum continuous rating (Elkafas et al., 2021).
The effect of increasing pilot fuel from 3% to 5% and 7% on the CII class are shown in Figure 8 and Figure 9 for bulkers and in Figure 10 and Figure 11 for container ships, for methanol and LNG, respectively.
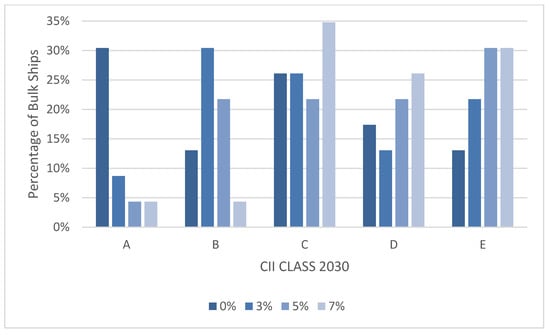
Figure 8.
The effect of pilot fuel for methanol on CII class of bulkers in 2030.

Figure 9.
The effect of pilot fuel for LNG on CII class of bulkers in 2030.
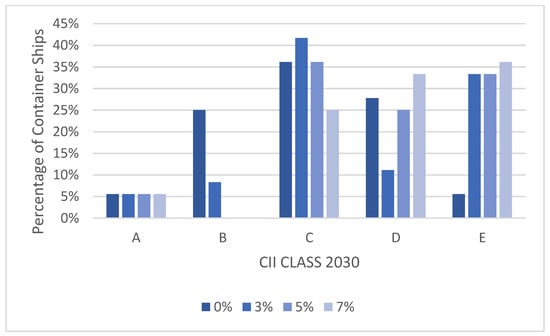
Figure 10.
The effect of pilot fuel for Methanol on CII Class of Container ships in 2030.

Figure 11.
The effect of pilot fuel for LNG on CII Class of Container ships in 2030.
As shown in Figure 8, even a 3% pilot fuel requirement for grey methanol cannot be considered negligible in CII classification calculations. For example, the percentage of ships in Class A decreases from 31% to 19%, while the percentage of non-compliant ships (i.e., Classes D and E) increases from 30% to 35%.
The results presented in Figure 9, show that, unlike methanol, LNG CII classification results are less affected by pilot fuel requirements.
As shown in Figure 10, pilot fuel significantly impacts CII classification when burning grey methanol in containers. Specifically, a 3% pilot fuel requirement reduces the percentage of ships in Class B from 25% to 8%, while increasing the percentage of non-compliant ships (i.e., Classes D and E) from 33% to 45%.
Similarly, Figure 11 shows that a 3% pilot fuel requirement for container ships burning LNG adversely affects the percentage of ships in Class A, decreasing it from 53% to 42%, while increasing the percentage of ships in Class C from 9% to 33%.
As expected, pilot fuel negatively impacts CII classification, with the effect being more pronounced for grey methanol due to its lower specific energy (19.9 MJ/kg) compared to LNG (48 MJ/kg). Engine manufacturers are exploring strategies to reduce pilot fuel requirements, aiming to improve combustion efficiency, lower costs, and reduce carbon emissions. However, the use of pilot fuel will remain necessary for existing dual-fuel (DF) engines. Considering a 3% pilot fuel requirement, the ships that are projected to be in CII Classes D and E, as shown in Figure 6 and Figure 7 for bulkers and container ships, respectively, are evaluated for DF engine retrofits. This assessment examines the feasibility of the investment and the potential improvement in CII ratings. The TC rates used in the calculations are provided in Table 3.
Table 3.
TC rate values for bulkers and container ships.
4.3. DF Methanol and LNG Engines Retrofit Analysis
The rationale for assessing retrofits of conventional ships with either DF LNG or methanol engines lies in their high technology readiness level (TRL) compared to other alternative fuel marine engines. Additionally, both LNG and methanol are approved for onboard use, as they comply with the IMO International Code of Safety for Ships. Existing data from already retrofitted ships indicate that the retrofitting costs for the propulsion and the fuel storage system in the case of LNG are estimated at USD 101/DWT for Bulkers (SEA-LNG, 2023) and at USD 4000/TUE for Containers (Shipuniverse, 2024).
Furthermore, LNG usage onboard requires a special energy storage system to keep LNG in its liquid state. For container ships, this necessitates allocating a volume equivalent to 2% of the TEU for the installation of a suitable gas storage system. On the other hand, methanol retrofits require an engine cost of USD 320/kW. Additionally, existing storage tanks can accommodate methanol with only minor modifications, at a cost of USD 110/kW for both ship types (Wang & Wright, 2021; Sustainable ships, 2023).
A key factor of the economic analysis of engine retrofit is the market for LNG and grey methanol. The bunker fuel used by ships is usually priced based on long-term contracts, which could also be combined with fuel hedging derivatives. The average prices per metric tonne (MT) of marine fuel over the past two years, used in the financial analysis in the following sections, are as follows: 660 USD/MT for VLSFO, 610 USD/MT for LNG, and 300 USD/MT for grey methanol, which are used as the baseline fuel costs and reflect 2023–2024 averages from Rotterdam bunker price data (Rotterdam Bunker Prices, 2024).
4.3.1. Methodology of the Economic Analysis of Engine Retrofitting
The model evaluates the profitability of the retrofitting using the discounted cash flow technique, which calculates the net present value (NPV) by subtracting the initial investment from the projected future cash flows, as shown by Equation (7). The estimation of these future cash flows considers the following comparative costs: (a) alternative fuel consumption, including pilot fuel, (b) TC rate increases, and (c) the implementation of a CO2 tax. Additionally, CAPEX is solely allocated to the retrofit cost.
The NPV of the investment is the total value of all future cash flows, discounted at the discount rate. It is calculated by discounting expected future cash flows generated by the investment as follows:
where the terms are defined as follows:
N is the economic lifespan in periods (years);
r is the discount rate;
CFt is the expected cash flow generated in year t;
CAPEX is the total cost of the retrofit.
The annual cash flows (CFs) generated by the engine retrofitting, assuming that the retrofitting cost is covered entirely by the shipowner at t = 0, without borrowing, and the retrofitted system maintenance cost will be the same as for the conventional engine, is described by the following Equation (8):
CFt = fuel cost difference + CO2 tax difference + TC rates difference
In business decision making, investors focus on investments with a positive NPV, as it is the most reliable financial metric for assessing investment profitability. To evaluate the engine retrofit investments using the NPV method, the period of investment N (also the ships’ remaining economic lifespan) is 10 years, and is 11% (Pomaska & Acciaro, 2022) to reflect the level of risk associated with such investments.
The IRR is a metric for estimating a project’s annual discount rate that makes the NPV equal to zero and is derived through the following Equation (9):
When comparing investment options with similar characteristics, as in this case, the investment with the highest IRR is the most favourable. Additionally, the payback period assesses how long it takes to recoup the initial investment. The payback period is calculated as the number of years required for the cumulative forecasted cash flow to equal the initial outlay, providing a comparative measure of the time needed to recover retrofit costs. Furthermore, the ROI metric, which measures the profitability of an investment relative to its cost, facilitates the comparative evaluation. The ROI is calculated as the net comparative return of the retrofit (i.e., total cash flows of the retrofit minus total cash flows of the conventional engine) divided by the capital cost of the investment.
4.3.2. Analysis of DF Methanol Engine Retrofit
The economic analysis of methanol retrofitting for both types of ships, of different operational profiles, routes, and TC rates, was performed according to the assumptions presented in Table 4 with the addition of 3% VLSFO as pilot fuel. The results are presented in Table 5.
Table 4.
Parameters of the economic analysis of retrofitting for grey methanol.
Table 5.
NPV sensitivity to TC rate increase and CO2 tax for retrofit burning grey Methanol (USDm).
As shown in Figure 12, for the retrofit cost for the ships, displayed in the axis on the left in order of increasing DWT and TEU for the bulkers and the container ships, respectively, the methanol retrofit cost increases as the respective capacity of the ships increases, which is also proportional to the engine power. In the case of Container Ship 5, due to it having the highest engine power compared to the other six containerships, the retrofit cost is also the highest. Furthermore, the axis on the right shows the value of the annual cash flows (CFs) of Equation (8) for each of the ships, assuming a 20% TC rate increase, which also shows an increasing trend. Note that, in this case, no CO2 tax has been included in the calculations. In addition, the container ships’ CFs are at a much lower level compared to those of the bulk ships, which is mainly attributed to the lower on average TC rate of container ships compared to that of the bulkers.

Figure 12.
Retrofit cost for methanol and cash flows for bulkers and container ships.
From Table 5, it is evident that a DF methanol engine retrofit is worthwhile for bulkers, with a 20% TC rate increase, while for containers, it is not worth undertaking, as a 48% TC rate increase would be required to obtain a positive NPV. It is also apparent that despite the different operational profiles and routes, the TC rates shown in Table 3 play a very important role in the calculation of NPV values, given that they are proportional to the DWT and TEU for bulks and containers, respectively.
The profitability of the DF methanol engine retrofit for bulkers is evaluated using the financial parameters defined in Section 4.3, the values of which are shown in Figure 13. The corresponding IRR values are well above the baseline of 11%, the payback period for the investment averages 4.7 years, and the ROI exceeds 20% for all DWT, which is higher compared to the 9.38% marine transportation industry average ROI of the last 12 months (CSIMARKET, 2025).
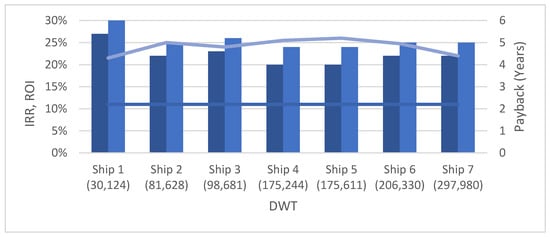
Figure 13.
IRR, ROI, and payback of DF methanol engine retrofit investment for bulkers with 20% TC rate increase.
A sensitivity analysis of the price of methanol showed that the NPV is positive for a price of methanol less than approximately 52%, 54%, and 56% of the price of VLSFO, for all bulkers, for USD 0/t CO2 tax, USD 60/t CO2 tax and USD 120/t CO2 tax levels, respectively. This is because the specific energy of methanol is 20 GJ/MT in comparison to 40 GJ/MT for VLSFO, which implies that two times more methanol is required to replace a specific VLSFO amount of fuel. The impact of CO2 tax on payback reveals that, for bulkers, the payback period decreases from an average of 4.7 years without tax to 4.4 years with a USD 60/t CO2 tax, and further to 4.2 years with a USD 120/t CO2 tax.
The sensitivity analysis performed on the discount rate for the bulkers retrofitted for methanol shows, according to Figure 14, that the NPV remains positive for all bulkers for a discount rate up to 20%, with only Ship 5 becoming negative at that level of the discount rate. This figure shows that investing in the methanol DF engine dual-fuel engine is a profitable option, even for higher cost of capital requirements in comparison to the 11% considered as the baseline in this study.
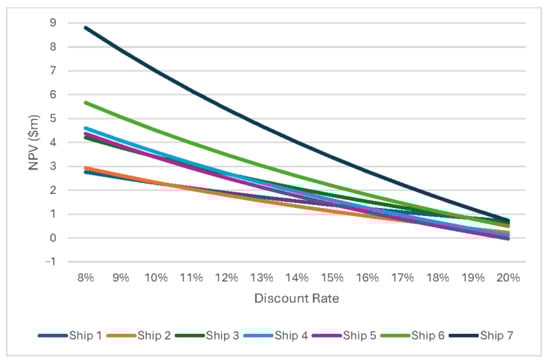
Figure 14.
NPV sensitivity analysis of the discount rate for methanol per bulker with a TC rate increase of 20%.
4.3.3. Analysis of LNG DF Engine Retrofit
The results of the economic analysis of LNG retrofitting performed according to the assumptions presented in Table 6 and the NPV results are presented in Table 7.
Table 6.
Parameters of the economic analysis of retrofitting for LNG.
Table 7.
NPV sensitivity to TC rate increase and CO2 tax for retrofits burning LNG (USDm).
The LNG retrofit cost for container ships is higher on average to that of bulkers, as shown in Figure 15, whereas assuming a 30% increase in TC rate, the annual CFs of container ships are marginally higher, which explains the lower profitability of the LNG retrofit for container ships compared to bulkers, as shown in Figure 16.

Figure 15.
Retrofit cost for LNG and CFs for bulks and containers.
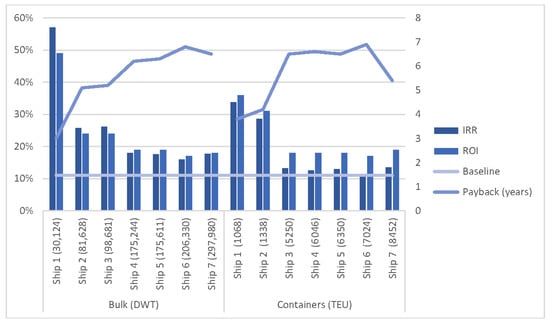
Figure 16.
IRR, ROI, and payback of DF LNG engine retrofit investment for bulkers and container ships with TC rate increase 30%.
According to the assumptions presented in Table 6, the NPV for all ships is positive when the TC rate reaches 30%. For bulkers, the average payback period for the investment is 5.6 years, as shown in Figure 16.
For container ships, the corresponding IRR values are above the defined baseline of 11%, with an average payback period of 5.8 years over the 10-year period, as shown in the results presented in Figure 16.
The sensitivity analysis performed on the discount rate for the bulker ships retrofitted for LNG shows, according to Figure 17, that the NPV remains positive for all bulkers for a discount rate up to 20%.
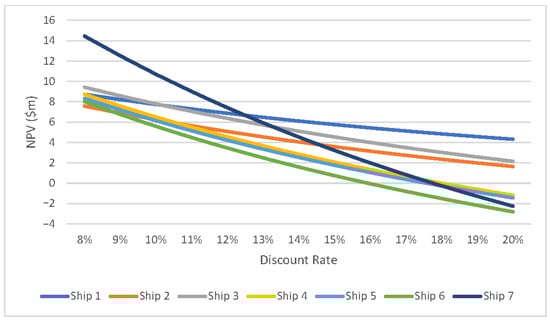
Figure 17.
NPV sensitivity analysis of the discount rate for LNG per bulker with a TC rate increase of 30%.
The sensitivity analysis of NPV with respect to changes in the discount rate for the container ships retrofitted with LNG DF engines shows, according to Figure 18, that as the discount rate increases the NPV remains positive for all container ships for a discount rate up to 11%, whereas the NPV for Ship 1 (1068 TEU) and Ship 2 (1338 TEU), which have the lowest TEU capacity, remains positive up to 20%.
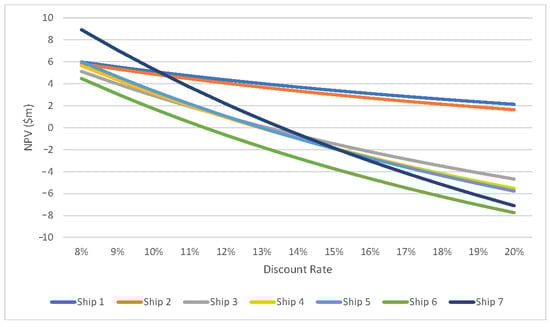
Figure 18.
NPV sensitivity analysis of the discount rate for LNG per container ship with a TC rate increase of 30%.
A sensitivity analysis of the price of LNG shows that the NPV is positive for a price of LNG less than 109%, 118%, and 133% of VLSFO for bulk and 106%, 115%, and 124% for container ships, for USD 0 CO2/t tax, USD 60 CO2/t tax, and USD 120 CO2/t tax, respectively. The results of the sensitivity of the LNG price can largely be attributed to the relatively small difference between the conversion factors of the fuels.
The impact of a CO2 tax on payback is also investigated in the case of the LNG retrofit. For bulkers, the average payback time decreases from 4.9 years without tax to 4.4 years with a USD 60/t CO2 tax and to 4.1 years with a USD 120/t CO2 tax. For container ships, the average payback time decreases from 5.8 years without tax to 5 years with a USD 60/t CO2 tax and to 4.5 years with a USD 120/t CO2 tax.
4.4. Payload Reduction
The payload choice is influenced by freight rates, the distance travelled, fuel costs, and the cargo’s value (Adland et al., 2018).
In this section, I investigate the economic aspects of payload reduction in relation to improving the CII rating according to the CII paradox discussed in Section 3.1. To this end, I derive Equation (16), which relates payload to fuel consumption.
For the diesel engine, the fuel oil consumption (FOC) can be calculated using the following Equation (10):
where the terms are defined as follows:
P: the engine power in kW;
SFOC: the specific fuel oil consumption in gr/kWh, the value of which remains practically constant when the engine power varies between 60 and 90% of full power (Bui et al., 2022);
H: the time duration that the engine runs at power P.
In naval engineering, the engine power, P, is given by Equation (11), which relates a ship’s required power, P, to its speed, v, and its displacement Δ, with m as a constant (Barrass, 2004). Equation (11) is as follows:
The ship’s displacement Δ = (LSW + DWT), where LSW is the light ship weight, which is the ship’s weight when empty, while DWT is the sum of cargo, fuel, lubricating oil, fresh water, ballast, water, provisions, and crew. Thus, DWT = CDWT + C, where CDWT is the cargo DWT and C represents the rest of the contributors, taking into consideration that the cargo of a fully loaded ship at the start of a journey contributes more than 90% to the total DWT (Tupper, 2013).
The deadweight coefficient, CDW, is used, as defined by Barrass (2004), which has a value of 0.7 for bulkers and 0.6 for container ships, as in the following Equation (12):
Therefore, and , which, by substitution in Equation (11), gives the engine power as a function of the cargo deadweight, CDWT, as in the following Equation (13):
Accordingly for a full load, Equation (14) is as follows:
By dividing Equation (13) by Equation (14), the following Equation (15) is established:
The term is much less than 1 and is not taken into consideration, whereas is the ratio X of the cargo to the DWT of the ship and varies as 0 ≤ X ≤ 1.
Given that fuel oil consumption, FOC, is proportional to the power according to Equation (10) the formula which relates the fuel consumption, FX, at reduced cargo (payload) to the fuel consumption, F(fl), under full payload is:
As evident from Equation (16), a decrease in X leads to a reduction in both fuel consumption and CO2 emissions. Therefore, assuming a payload reduction of 30% (i.e., the ships carry 70% of the full load) and 40% (i.e., the ships carry 60% of the full load) the results obtained for bulkers are summarised in Figure 19.
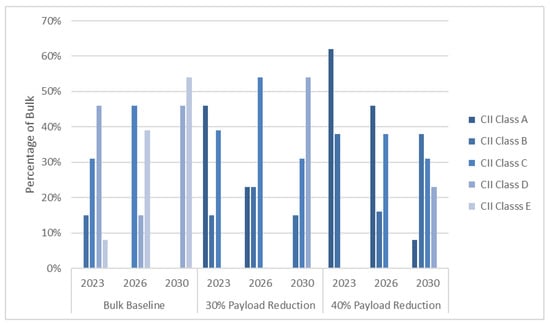
Figure 19.
CII class of bulkers for baseline, 30%, and 40% payload reduction.
The results presented in Figure 19 show that payload reduction improves the CII class of bulkers. A 40% payload reduction ensures that 77% of ships remain CII compliant up to 2030. It is important to emphasize that maximising daily profit requires balancing revenue against fuel costs and potential CO2 tax. In our analysis, the profit gained from reduced fuel consumption due to a lower payload offsets the decrease in the TC rate, thereby preventing economic losses. The allowable TC rate reduction percentage quoted in Figure 20 refers to the maximum allowable reduction in the daily TC rate by 30% and 40%, respectively, compared to the assumed baseline TC rates presented in Table 3.
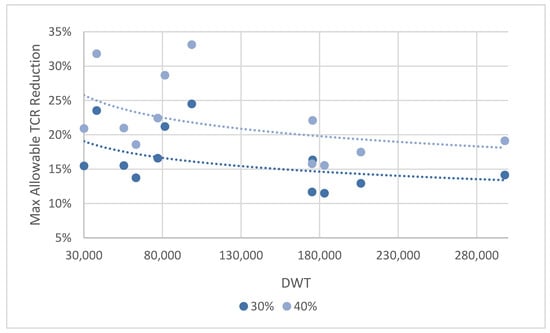
Figure 20.
Maximum TC rate reduction for bulkers for 30% and 40% payload reduction.
According to Figure 20 the maximum allowable TC rate reduction becomes significant (i.e., up to 30%) for ships with DWT less than 100,000 in the case of 40% payload reduction. However, tax imposition makes payload reduction unprofitable. For Containers, assuming a payload reduction of 30% and of 40% the results of the impact of the payload reduction on the expected CII class are presented in Figure 21.
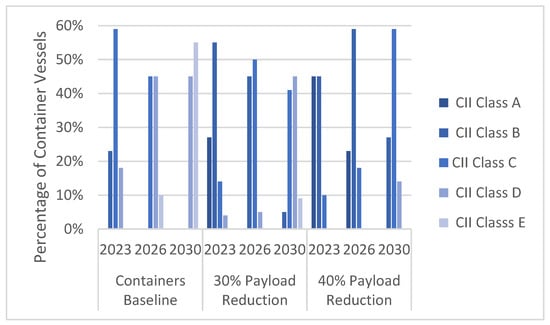
Figure 21.
CII Class of Container ships for baseline, 30% and 40% payload reduction.
The results presented in Figure 21 show that payload reduction improves CII Class of Containers. A 40% payload reduction ensures that 86% of Containers remain CII compliant up to 2030. For Containers the maximum allowable TC rate percentage reduction to prevent economic losses, based on TC rates shown in Table 3, is presented in Figure 22 for 30% and 40% payload reduction.
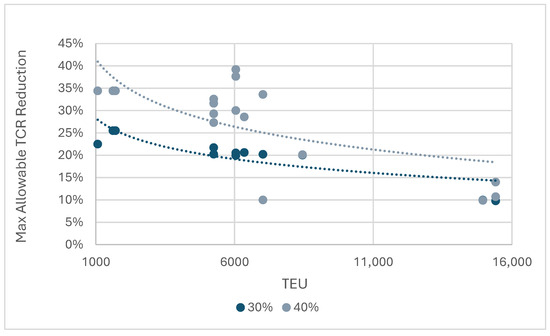
Figure 22.
Maximum TC rate reduction for container ships for a 30% and 40% payload reduction.
According to Figure 22, the maximum allowable TC rate reduction becomes significant (i.e., up to 35%) for ships with less than 7000 TEU in the case of a 40% payload reduction. However, tax imposition makes payload reduction unprofitable.
In conclusion, the investigation of payload reduction on CII class demonstrates that most ships in both categories can achieve operational compliance until the end of their economic life, provided the maximum allowable reduction in TC rate is maintained to prevent economic losses. However, the imposition of a CO2 tax at USD 60 and USD 120 per tonne of CO2 renders this measure highly unprofitable.
4.5. Discussion of Measures for Improving the CII Rating
The preceding sections present individual strategies—speed reduction, alternative fuels, engine retrofitting, and payload reduction—for improving a vessel’s Carbon Intensity Indicator (CII) rating. While each measure offers technical and economic benefits, their isolated application does not fully capture the decision-making complexity shipowners face in real-world scenarios. This section synthesises these findings, evaluates interdependencies among strategies, and provides a cohesive interpretation of the implications.
Speed reduction has been shown to yield immediate reductions in fuel consumption and emissions, with the benefit of low capital expenditure. However, this comes at the cost of longer voyage times, which may reduce profitability, especially under time charter agreements. Despite this, its flexibility makes it a viable short-term compliance strategy for ships nearing the end of their economic life, or for those operating in less time-sensitive routes. Operational coordination between shipowners and charterers is critical to balance CII improvement with contractual performance obligations.
Alternative fuels, notably LNG and grey methanol, present significant advantages in improving CII ratings—particularly when deployed across larger fleets. Methanol, due to its lower specific energy, requires more volume and pilot fuel, resulting in a slightly diminished CII benefit compared to LNG, especially for container ships. Nevertheless, its lower cost enhances its attractiveness if time charter rates increase sufficiently. LNG retrofits offer a more stable CII performance and are relatively less sensitive to pilot fuel emissions, making them a preferred solution for bulkers.
Engine retrofitting emerges as a long-term decarbonisation pathway with strong economic viability when supported by policy instruments, like CO2 taxation. The NPV and IRR results suggest that retrofits become especially profitable under moderate carbon tax scenarios and higher charter rates. However, the decision to retrofit depends heavily on vessel age, remaining lifespan, and route predictability. For many mid-aged vessels, retrofitting represents a future-proof investment, offering both regulatory compliance and improved fleet value.
Payload reduction functions as a last-resort strategy. It directly improves CII by reducing vessel displacement and, thus, fuel consumption. However, the economic trade-offs—due to reduced cargo revenue—make it unsustainable unless offset by high fuel prices or avoided carbon costs. It may serve as a bridging measure for older ships awaiting retrofit or operational reassignment, but is unlikely to be effective without precise commercial and regulatory alignment. The strategic flow across measures is described in the following three points:
- For vessels approaching obsolescence, speed reduction and payload adjustment provide interim compliance.
- For mid-life vessels with stable employment and technical flexibility, retrofitting with LNG or methanol engines offers the most promising returns, especially under scenarios with rising carbon taxes.
- For long-term planning, a phased strategy, beginning with speed reduction and progressing toward fuel-switching and retrofit, can balance operational, environmental, and financial goals.
Importantly, the interplay between technical feasibility and economic incentives underscores the need for adaptive strategies. As shown, even technically effective solutions may fall short economically unless supported by external mechanisms, such as carbon levies or enhanced time charter rates.
The analysis clearly reveals that no single strategy is universally optimal. Instead, the most effective approach requires a tailored combination of measures, aligned with vessel characteristics, contract conditions, market forecasts, and regulatory evolution. This integrated understanding forms the core contribution of this study—providing shipowners and policymakers with a data-driven framework for adaptive, profitable, and sustainable CII compliance planning.
5. Conclusions and Policy Implications
This study evaluates measures for short-term Carbon Intensity Indicator (CII) compliance in the maritime industry, aligned with the International Maritime Organisation’s (IMO) recently introduced regulations aimed at reducing environmental pollution. By addressing three critical research areas, I contribute to the broader discourse on technological innovation. First, I forecast the development and impact of state-of-the-art maritime technologies, such as alternative fuels and retrofitting solutions. Second, I provide insights into managerial decision making at organisational and industrial levels, enabling stakeholders to harness the innovation potential of these technologies. Third, I evaluate the multifaceted effects of technological advancements, including their economic, environmental, and operational implications. By bridging these areas, this research offers a comprehensive assessment to inform policymakers, businesses, and the public about the benefits, risks, and trade-offs of deploying technological innovations for sustainable maritime operations.
The methodological advancements in this study are noteworthy. First, the model developed for CII calculations, particularly for alternative fuels, like grey methanol and LNG, introduces a novel approach by accounting for the non-negligible amount of pilot fuel required. The results demonstrate that pilot fuel negatively impacts CII classification, with the effect being more pronounced for grey methanol due to its lower specific energy (19.9 MJ/kg) compared to LNG (48 MJ/kg). This finding suggests that shipowners considering DF engine retrofits would benefit from selecting engines that do not require pilot fuel, once such technologies become commercially available.
This study focuses on retrofitting existing ships rather than constructing new vessels. A key insight is that, without policy interventions, shipowners face significant limitations in achieving CII compliance due to high uncertainty surrounding the dominance of green fuels. Incentives, such as incorporating the social cost of CO2 emissions—for example, through a carbon tax—should align with ambitious emissions reduction goals and recent policy developments. Demand for retrofitting technologies is expected to rise due to new EU-level policies, such as the inclusion of ships over 5000 GT in the EU Emissions Trading System (ETS) directive, which began in early 2023, and anticipated IMO directives. To this end, a carbon tax is modelled at moderate yet progressively increasing levels of USD 60 and USD 120 per tonne of CO2. The analysis reveals two key benefits of this policy. Firstly, it incentivises the adoption of lower-carbon fuels, improving CII ratings; secondly it enables shipowners to make profitable retrofit investments while reducing environmental externalities, facilitating a more effective transition to net-zero emissions.
Decarbonising the shipping industry is more likely to accelerate with greater certainty about alternative fuel options. Businesses in this sector must allocate resources to adopt operational and technical measures to reduce CO2 emissions. Despite the associated costs, profitability is achievable through a balanced approach involving all key stakeholders, as demonstrated in this study. The CII compliance measures examined—speed reduction, engine retrofits for alternative fuels, and payload reduction—provide valuable insights into the practical techno-economic options available to shipowners to meet IMO emissions reduction requirements. While the economic results depend on the assumptions for each measure, they highlight the potential improvements in CII ratings offered by each option.
A key finding from the speed reduction analysis is that gradual improvements in CII class are achieved at 5% and 10% speed reduction levels, ceteris paribus, for all ship types studied. Economically, speed reduction reduces fuel consumption and costs, but the corresponding increase in voyage duration may adversely impact TC rates. Addressing this issue requires collaboration between shipowners and charterers to establish mutually agreed operational plans.
Determining the optimal choice among available alternative fuels is critical for achieving CII compliance. Analysis of expected CII ratings for widely available marine fuels identifies LNG and grey methanol as the leading options for improving ratings across all ship types. LNG is optimal for bulkers, while grey methanol is preferable for container ships, provided TC rates increase by at least 20% to offset retrofitting costs and DF engines’ requirement of 3% pilot fuel. Sensitivity analysis of the NPV with respect to the discount rate reveals that LNG retrofits are more sensitive to discount rate changes due to higher cash flows compared to methanol retrofits.
Payload reduction represents a last resort measure for shipowners to keep older ships operational until 2030. Results indicate that reducing payload by 30% and 40% leads to bunker cost reductions of 15% and 20% for bulkers and 12% and 17% for container ships, respectively. These reductions can justify corresponding TC rate adjustments based on ship capacity. However, the imposition of a CO2 tax renders this measure unprofitable.
From a policy perspective, the current CII calculation method poses strategic challenges, as shipowners must weigh the trade-offs between operational and technical compliance measures under conditions of financial and regulatory uncertainty. Operational strategies, such as speed reduction, may offer immediate compliance but often conflict with the commercial expectations of charterers, particularly under TC agreements that prioritise punctuality and cargo throughput. These measures may also lead to inefficient fleet utilisation and, paradoxically, an increase in total emissions across more vessel-days. On the other hand, technical measures, such as engine retrofitting or fuel switching—while potentially more effective in improving CII ratings over the long term—entail substantial capital expenditures and extended payback horizons. These investments are highly sensitive to fluctuating fuel prices, uncertain carbon pricing mechanisms, and unpredictable TC rate trajectories.
Fundamentally, the shipping market operates on the principles of supply and demand, where the available fleet capacity and cargo volumes dynamically influence TC rates. When supply exceeds demand, TC rates typically fall, compressing shipowners’ margins and reducing their ability to invest in costly decarbonisation measures. Conversely, tight markets with limited available tonnage push TC rates upward, potentially providing greater financial flexibility to support technical investments. However, this relationship is further complicated by the demand-side pressure from charterers who may prioritise emissions performance as part of their own sustainability commitments, potentially driving a premium for “greener” tonnage. Thus, TC rates do not merely reflect vessel availability but increasingly incorporate environmental performance factors, making the interplay between supply, demand, and regulatory compliance a critical determinant of charter market dynamics.
In this context, shipowners face considerable financial risks, including asset devaluation if regulatory conditions shift unfavourably or if retrofitted vessels fail to command a premium in the charter market. Furthermore, the absence of long-term policy clarity—particularly on global carbon taxation and fuel availability—compounds the difficulty of making investment decisions with confidence. As demonstrated in our techno-economic analysis, profitability of retrofitting varies widely across vessel types and market scenarios, reinforcing the importance of aligning CII compliance strategies with contractual flexibility, market positioning, and anticipated regulatory evolution. These interdependencies highlight that strategic decarbonisation is not simply a matter of technical optimisation, but of navigating financial exposure in a fragmented and volatile policy environment.
In conclusion, the current CII calculation method poses challenges, as shipowners must either adopt operational measures that may increase overall emissions or pursue technical measures that, under current economic and policy uncertainties, may not always be profitable. Moving forward, revising the CII to account for the actual mass of cargo transported would enhance its robustness. Additionally, a carbon levy could increase the revenue potential of retrofits for lower- and zero-carbon fuels compared to conventional options, thereby encouraging such investments and supporting an equitable transition.
Funding
This research received no external funding.
Institutional Review Board Statement
Not applicable.
Informed Consent Statement
Not applicable.
Data Availability Statement
The data presented in this study are available from the corresponding author on request, due to confidentiality restrictions.
Acknowledgments
I would like to thank the two anonymous referees, the constructive comments of whom have helped to improve the paper.
Conflicts of Interest
The author declares no conflicts of interest.
References
- ABS. (2022). Sustainability whitepaper LNG as marine fuel. American Bureau of Shipping. Available online: https://ww2.eagle.org/content/dam/eagle/advisories-and-debriefs/sustainability-whitepaper-lng-as-marine-fuel.pdf (accessed on 5 October 2023).
- Adland, R. H., Jia, H., & Strandenes, S. P. (2018). The determinants of vessel capacity utilization: The case of Brazilian iron ore exports. Transportation Research Part A: Policy and Practice, 110, 191–201. [Google Scholar] [CrossRef]
- Argüello, G., Krabbe, N., Langlet, D., Hassellöv, I. M., Martinson, C., & Helmstad, A. (2022). Regulation of ships at anchor: Safety and environmental implications. Marine Policy, 140, 105052. [Google Scholar] [CrossRef]
- Bach, H., & Hansen, T. (2023). IMO off course for decarbonisation of shipping? Three challenges for stricter policy. Marine Policy, 147, 105379. [Google Scholar] [CrossRef]
- Baresic, D., Rehmatulla, N., & Smith, T. (2024). Identifying locations for early adoption of zero emission fuels for shipping—The UK as a case study. Journal of Marine Science and Engineering, 12, 1517. [Google Scholar] [CrossRef]
- Barrass, C. (2004). Ship design and performance for masters and mates. Elsevier. ISBN 0 7506 6000 7. [Google Scholar]
- Bouman, E. A., Lindstad, E., Rialland, A. I., & Strømman, A. H. (2017). State-of-the-art technologies, measures, and potential for reducing GHG emissions from shipping—A review. Transportation Research Part D: Transport and Environment, 52, 408–421. [Google Scholar] [CrossRef]
- Bui, K., Perera, L., & Emblemsvåg, J. (2022). Life-cycle cost analysis of an innovative marine dual-fuel engine under uncertainties. Journal of Cleaner Production, 380, 134847. [Google Scholar] [CrossRef]
- Chang, C. C., & Wang, C. M. (2014). Evaluating the effects of speed reduce for shipping costs and CO2 emission. Transportation Research Part D: Transport and Environment, 31, 110–115. [Google Scholar] [CrossRef]
- Corbett, J. J., Wang, H., & Winebrake, J. J. (2009). The effectiveness and costs of speed reductions on emissions from international shipping. Transportation Research Part D: Transport and Environment, 14(8), 593–598. [Google Scholar] [CrossRef]
- CSIMARKET. (2025). Marine transportation industry return on investment statistics. Available online: https://csimarket.com/Industry/industry_ManagementEffectiveness.php?ind=1105 (accessed on 14 February 2025).
- Degiuli, N., Martić, I., Farkas, A., & Gospić, I. (2021). The impact of slow steaming on reducing CO2 emissions in the Mediterranean Sea. Energy Reports, 7, 8131–8141. [Google Scholar] [CrossRef]
- Dierickx, J., Verbiest, J., Janvier, T., Peeters, J., Sileghem, L., & Verhelst, S. (2021). Retrofitting a high-speed marine engine to dual-fuel methanol-diesel operation: A comparison of multiple and single point methanol port injection. Fuel Communications, 7, 100010. [Google Scholar] [CrossRef]
- Doudnikoff, M., & Lacoste, R. (2014). Effect of a speed reduction of containerships in response to higher energy costs in Sulphur Emission Control Areas. Transportation Research Part D: Transport and Environment, 28, 51–61. [Google Scholar] [CrossRef]
- Elkafas, A. G., Khalil, M., Shouman, M. R., & Elgohary, M. M. (2021). Environmental protection and energy efficiency improvement by using natural gas fuel in maritime transportation. Environmental Science and Pollution Research International, 28(43), 60585–60596. [Google Scholar] [CrossRef]
- EMSA. (2023). Potential of ammonia as fuel in shipping. European Maritime Safety Agency. Available online: https://www.emsa.europa.eu/newsroom/latest-news/item/4833-potential-of-ammonia-as-fuel-inshipping.html#:~:text=Among%20the%20broad%20spectrum%20of,wake%20basis%20and%20in%20some (accessed on 15 September 2024).
- Faber, J., Markowska, A., Nelissen, D., Davidson, M., Eyring, V., Cionni, I., Selstad, E., Kågeson, P., Lee, D., Buhaug, Ø., & Lindtsad, H. (2009). Technical support for European action to reducing greenhouse gas emissions from international maritime transport. Available online: https://hdl.handle.net/11245/1.401570 (accessed on 22 November 2023).
- Gao, X., Zhu, A., & Yu, Q. (2023). Exploring the carbon abatement strategies in shipping using system dynamics approach. Sustainability, 15, 13907. [Google Scholar] [CrossRef]
- Ge, J., & Wang, X. (2017). Techno-economic study of LNG diesel power (dual fuel) ship. WMU Journal of Maritime Affairs, 16, 233–245. [Google Scholar] [CrossRef]
- Grigoriadis, A., Mamarikas, S., & N Ntziachristos, L. (2024). Quantitative impact of decarbonization options on air pollutants from different ship types. Transportation Research Part D: Transport and Environment, 133, 104316. [Google Scholar] [CrossRef]
- HandyBulk. (2024). Ship charter rates. Available online: https://www.handybulk.com/ship-charter-rates/ (accessed on 21 May 2024).
- Hua, R., Yin, J., Wang, S., Han, Y., & Wang, X. (2024). Speed optimization for maximizing the ship’s economic benefits considering the Carbon Intensity Indicator (CII). Ocean Engineering, 293, 116712. [Google Scholar] [CrossRef]
- ICCT. (2020). The climate implications of using LNG as a marine fuel. Available online: https://theicct.org/sites/default/files/publications/Climate_implications_LNG_marinefuel_01282020.pdf (accessed on 21 May 2024).
- ICS. (2024). Further consideration of the development of the basket of candidate mid-term ghg reduction measure(s), using annex 1 to document MEPC 82/wp.9 as the basis. Available online: https://www.ics-shipping.org/wp-content/uploads/2025/01/ISWG-GHG-18_2_5-Consolidation-of-the-proposals-for-an-economic-element-of-the-mid-term-measures-based-on-a-GHG-levy_contribution-as-at-9-Jan.pdf (accessed on 10 January 2025).
- IMO. (2016). MEPC.281(70). Amendments of the 2014 guidelines on the method of calculation of the attained energy efficiency design index (EEDI) for new ships. Available online: https://wwwcdn.imo.org/localresources/en/KnowledgeCentre/IndexofIMOResolutions/MEPCDocuments/MEPC.281(70).pdf (accessed on 15 September 2024).
- IMO. (2021). Resolution MEPC.338(76). Guidelines on the operational carbon intensity reduction factors relative to reference lines. Available online: https://wwwcdn.imo.org/localresources/en/OurWork/Environment/Documents/Air%20pollution/MEPC.338(76).pdf (accessed on 21 May 2024).
- IMO. (2022a). Resolution MEPC.352(78). Guidelines on operational carbon intensity indicators and the calculation methods. Available online: https://wwwcdn.imo.org/localresources/en/KnowledgeCentre/IndexofIMOResolutions/MEPCDocuments/MEPC.352(78).pdf (accessed on 21 May 2024).
- IMO. (2022b). Resolution MEPC.353(78). Guidelines on the reference lines for use with operational carbon intensity indicators. Available online: https://wwwcdn.imo.org/localresources/en/KnowledgeCentre/IndexofIMOResolutions/MEPCDocuments/MEPC.353(78).pdf (accessed on 21 May 2024).
- IMO. (2022c). Resolution MEPC.354(78). Guidelines on the operational carbon intensity Rating of ships. Available online: https://wwwcdn.imo.org/localresources/en/KnowledgeCentre/IndexofIMOResolutions/MEPCDocuments/MEPC.354(78).pdf (accessed on 21 May 2024).
- IMO. (2023a). MEPC.376(80). Guidelines on life cycle GHG intensity of marine fuels. Available online: https://wwwcdn.imo.org/localresources/en/OurWork/Environment/Documents/annex/MEPC%2080/Annex%2014.pdf (accessed on 19 September 2024).
- IMO. (2023b). MEPC.377(80). Report of the marine environment protection committee on its eightieth session. MEPC 80/17. Annex 15. 2023 IMO strategy on reduction of GHG emissions from ships. IMO. Available online: https://wwwcdn.imo.org/localresources/en/OurWork/Environment/Documents/annex/MEPC%2080/Annex%2015.pdf (accessed on 21 May 2024).
- ITF. (2022). Carbon pricing in shipping. In ternational transport forum policy papers, No. 110. OECD Publishing. Available online: https://www.itf-oecd.org/sites/default/files/docs/carbon-pricing-shipping.pdf (accessed on 20 May 2024).
- Kavussanos, M. G., Moysiadou, S. A., & Tsouknidis, D. A. (2025). Determinants of vessels’ fixtures allocation over contracts of different duration and global economic uncertainty. Maritime Policy & Management, 1–22. [Google Scholar] [CrossRef]
- Kim, M., Lee, J. Y., An, S., & Hwang, D. J. (2024). Proposals on effective implementation of the carbon intensity indication of ships. Journal of Marine Science and Engineering, 12, 1906. [Google Scholar] [CrossRef]
- Li, D. C., & Yang, H. L. (2024). Economic feasibility of LNG-fuelled river ships: Carbon tax schemes perspective. Transportation Research Part D: Transport and Environment, 132, 104235. [Google Scholar] [CrossRef]
- Lim, H. K., Heo, J., Choe, S. B., Kim, J. S., Jang, J., & Oh, D. (2024). Sustainable retrofitting for shipping: Assessing LNG dual fuel impact on global warming potential through life cycle assessment. Results in Engineering, 23, 102484. [Google Scholar] [CrossRef]
- Lloyd’s List. (2024). Boxship charter rates and periods continue to rise as Red Sea events drive up demand. Available online: https://www.lloydslist.com/LL1147946/Boxship-charter-rates-and-periods-continue-to-rise-as-Red-Sea-events-drive-up-demand (accessed on 21 May 2024).
- Lloyd’s Register. (2023). Available online: https://www.lr.org/en/knowledge/research-reports/2023/fuel-for-thought-methanol-report/ (accessed on 21 May 2024).
- Mallidis, I., Iakovou, E., Dekker, R., & Vlachos, D. (2018). The impact of slow steaming on the carriers’ and shippers’ costs: The case of a global logistics network. Transportation Research Part E: Logistics and Transportation Review, 111, 18–39. [Google Scholar] [CrossRef]
- MAN. (2021). Marine engine programme, MAN energy solutions. Available online: http://www.hd-marineengine.com/pdf/STXHI%20MAN-ES%20Engine%20Program%202021.pdf (accessed on 5 November 2023).
- Marchitto, L., De Simio, L., Iannaccone, S., Pennino, V., & Altieri, N. (2024). Retrofit of a marine engine to dual-fuel methane–diesel: Experimental analysis of performance and exhaust emission with continuous and phased methane injection systems. Energies, 17(17), 4304. [Google Scholar] [CrossRef]
- Marrero, A., & Martínez-López, A. (2023). Decarbonization of short sea shipping in European Union: Impact of market and goal based measures. Journal of Cleaner Production, 421, 138481. [Google Scholar] [CrossRef]
- Methanol Institute. (2023). Marine methanol: Future-proof shipping fuel. Available online: https://www.methanol.org/wp-content/uploads/2023/05/Marine_Methanol_Report_Methanol_Institute_May_2023.pdf (accessed on 7 November 2023).
- Mi, J. J., Wang, Y., Zhang, N., Zhang, C., & Ge, J. (2024). A bibliometric analysis of green shipping: Research progress and challenges for sustainable maritime transport. Journal of Marine Science and Engineering, 12, 1787. [Google Scholar] [CrossRef]
- Moutzouris, I., Marchese, M., Papapostolou, N. C., Efstathiou, A., & Shi, Y. (2025). Green investment under market uncertainty: Scrubber installation in shipping. Available online: https://ssrn.com/abstract=5130549 (accessed on 2 July 2025).
- Mundaca, G., Strand, J., & Young, I. R. (2021). Carbon pricing of international transport fuels: Impacts on carbon emissions and trade activity. Journal of Environmental Economics and Management, 110, 102517. [Google Scholar] [CrossRef]
- Nuttall, P., Newell, A., Rojon, I., Milligan, B., & Irvin, A. (2021). Pacific Island domestic shipping emissions abatement measures and technology transition pathways for selected ship types. Marine Policy, 132, 104704. [Google Scholar] [CrossRef]
- Pangalos, G. (2023). Financing for a sustainable dry bulk shipping industry: What are the potential routes for financial innovation in sustainability and alternative energy in the dry bulk shipping industry? Journal of Risk and Financial Management, 16, 101. [Google Scholar] [CrossRef]
- Pelić, V., Bukovac, O., Radonja, R., & Degiuli, N. (2023). The impact of slow steaming on fuel consumption and CO2 emissions of a container ship. Journal of Marine Science and Engineering, 11(3), 675. [Google Scholar] [CrossRef]
- Perčić, M., Vladimir, N., & Fan, A. (2021). Techno-economic assessment of alternative marine fuels for inland shipping in Croatia. Renewable and Sustainable Energy Reviews, 148, 111363. [Google Scholar] [CrossRef]
- Pomaska, L., & Acciaro, M. (2022). Bridging the maritime-hydrogen cost-gap: Real options analysis of policy alternatives. Transportation Research Part D: Transport and Environment, 107, 103283. [Google Scholar] [CrossRef]
- Rotterdam, & Bunker Prices. (2024). Available online: https://shipandbunker.com/prices/emea/new/nl-rtm-rotterdam (accessed on 27 December 2024).
- SEA-LNG. (2023). LNG as a marine fuel: The retrofit investment opportunity. SEA-LNG.ORG. Available online: https://sea-lng.org/wp-content/uploads/2022/08/VLCC_Retrofit_Investment_Case_Study.pdf (accessed on 23 October 2024).
- Shipuniverse. (2024). The economics of converting existing ships to LNG. Available online: https://www.shipuniverse.com/the-economics-of-converting-existing-ships-to-lng/ (accessed on 15 September 2024).
- Solakivi, T., Paimander, A., & Ojala, L. (2022). Cost competitiveness of alternative maritime fuels in the new regulatory framework. Transportation Research Part D: Transport and Environment, 113, 103500. [Google Scholar] [CrossRef]
- Sphera. (2021). 2nd life cycle ghg emission study on the use of LNG as marine fuel. Available online: https://safety4sea.com/wp-content/uploads/2021/04/SEA-LNG-SGMF-2nd-GHG-Analysis-of-LNG-2021_04.pdf (accessed on 21 May 2024).
- Stopford, M. (2008). Maritime economics 3e. Routledge. [Google Scholar]
- Sustainable ships. (2023). A techno-economic assessment for the use of methanol as marine fuel. Available online: https://www.sustainable-ships.org/stories/2023/methanol-marine-fuel (accessed on 15 September 2024).
- Tan, R., Psaraftis, H. N., & Wang, D. Z. (2022). The speed limit debate: Optimal speed concepts revisited under a multi-fuel regime. Transportation Research Part D: Transport and Environment, 111, 103445. [Google Scholar] [CrossRef]
- Taskar, B., & Andersen, P. (2020). Benefit of speed reduction for ships in different weather conditions. Transportation Research Part D: Transport and Environment, 85, 102337. [Google Scholar] [CrossRef]
- Taskar, B., Sasmal, K., & Yiew, L. J. (2023). A case study for the assessment of fuel savings using speed optimization. Ocean Engineering, 274, 113990. [Google Scholar] [CrossRef]
- Tran, T. T., Browne, T., Veitch, B., Musharraf, M., & Peters, D. (2023). Route optimization for vessels in ice: Investigating operational implications of the carbon intensity indicator regulation. Marine Policy, 158, 105858. [Google Scholar] [CrossRef]
- Tupper, E. C. (2013). Introduction to naval architecture (5th ed.). Butterworth-Heinemann. [Google Scholar]
- United Nations Conference for Trade and Development (UNCTAD). (2021). Review of maritime transport. UNCTAD. [Google Scholar]
- Wang, Y., & Wright, L. A. (2021). A comparative review of alternative fuels for the maritime sector: Economic, technology, and policy challenges for clean energy implementation. World, 2(4), 456–481. [Google Scholar] [CrossRef]
- Yu, H., Fang, Z., Fu, X., Liu, J., & Chen, J. (2021). Literature review on emission control-based ship voyage optimization. Transportation Research Part D: Transport and Environment, 93, 102768. [Google Scholar] [CrossRef]
- Yu, L., Chen, C., Niu, Z., Gao, Y., Yang, H., & Xue, Z. (2021). Risk aversion, cooperative membership and the adoption of green control techniques: Evidence from China. Journal of Cleaner Production, 279, 123288. [Google Scholar] [CrossRef]
- Zhang, J., Zhang, Z., & Liu, D. (2024). Comparative study of different alternative fuel options for shipowners based on carbon intensity index model under the background of green shipping development. Journal of Marine Science and Engineering, 12, 2044. [Google Scholar] [CrossRef]
- Zhang, Q., Guan, H., Chen, S., & Wan, Z. (2024). Towards decarbonization: How EEXI and CII regulations affect container liner fleet deployment. Transportation Research Part D: Transport and Environment, 133, 104277. [Google Scholar] [CrossRef]
- Zhao, Y., Chen, Y., Fagerholt, K., Lindstad, E., & Zhou, J. (2023). Pathways towards carbon reduction through technology transition in liner shipping. Maritime Policy & Management, 52, 417–439. [Google Scholar] [CrossRef]
- Zhu, M., Yuen, K. F., Ge, J. W., & Li, K. X. (2018). Impact of maritime emissions trading system on fleet deployment and mitigation of CO2 emission. Transportation Research Part D: Transport and Environment, 62, 474–488. [Google Scholar] [CrossRef]
- Zis, T. P. V., Psaraftis, H. N., Tillig, F., & Ringsberg, J. W. (2020). Decarbonizing maritime transport: A Ro-Pax case study. Research in Transportation Business & Management, 37, 100565. [Google Scholar] [CrossRef]
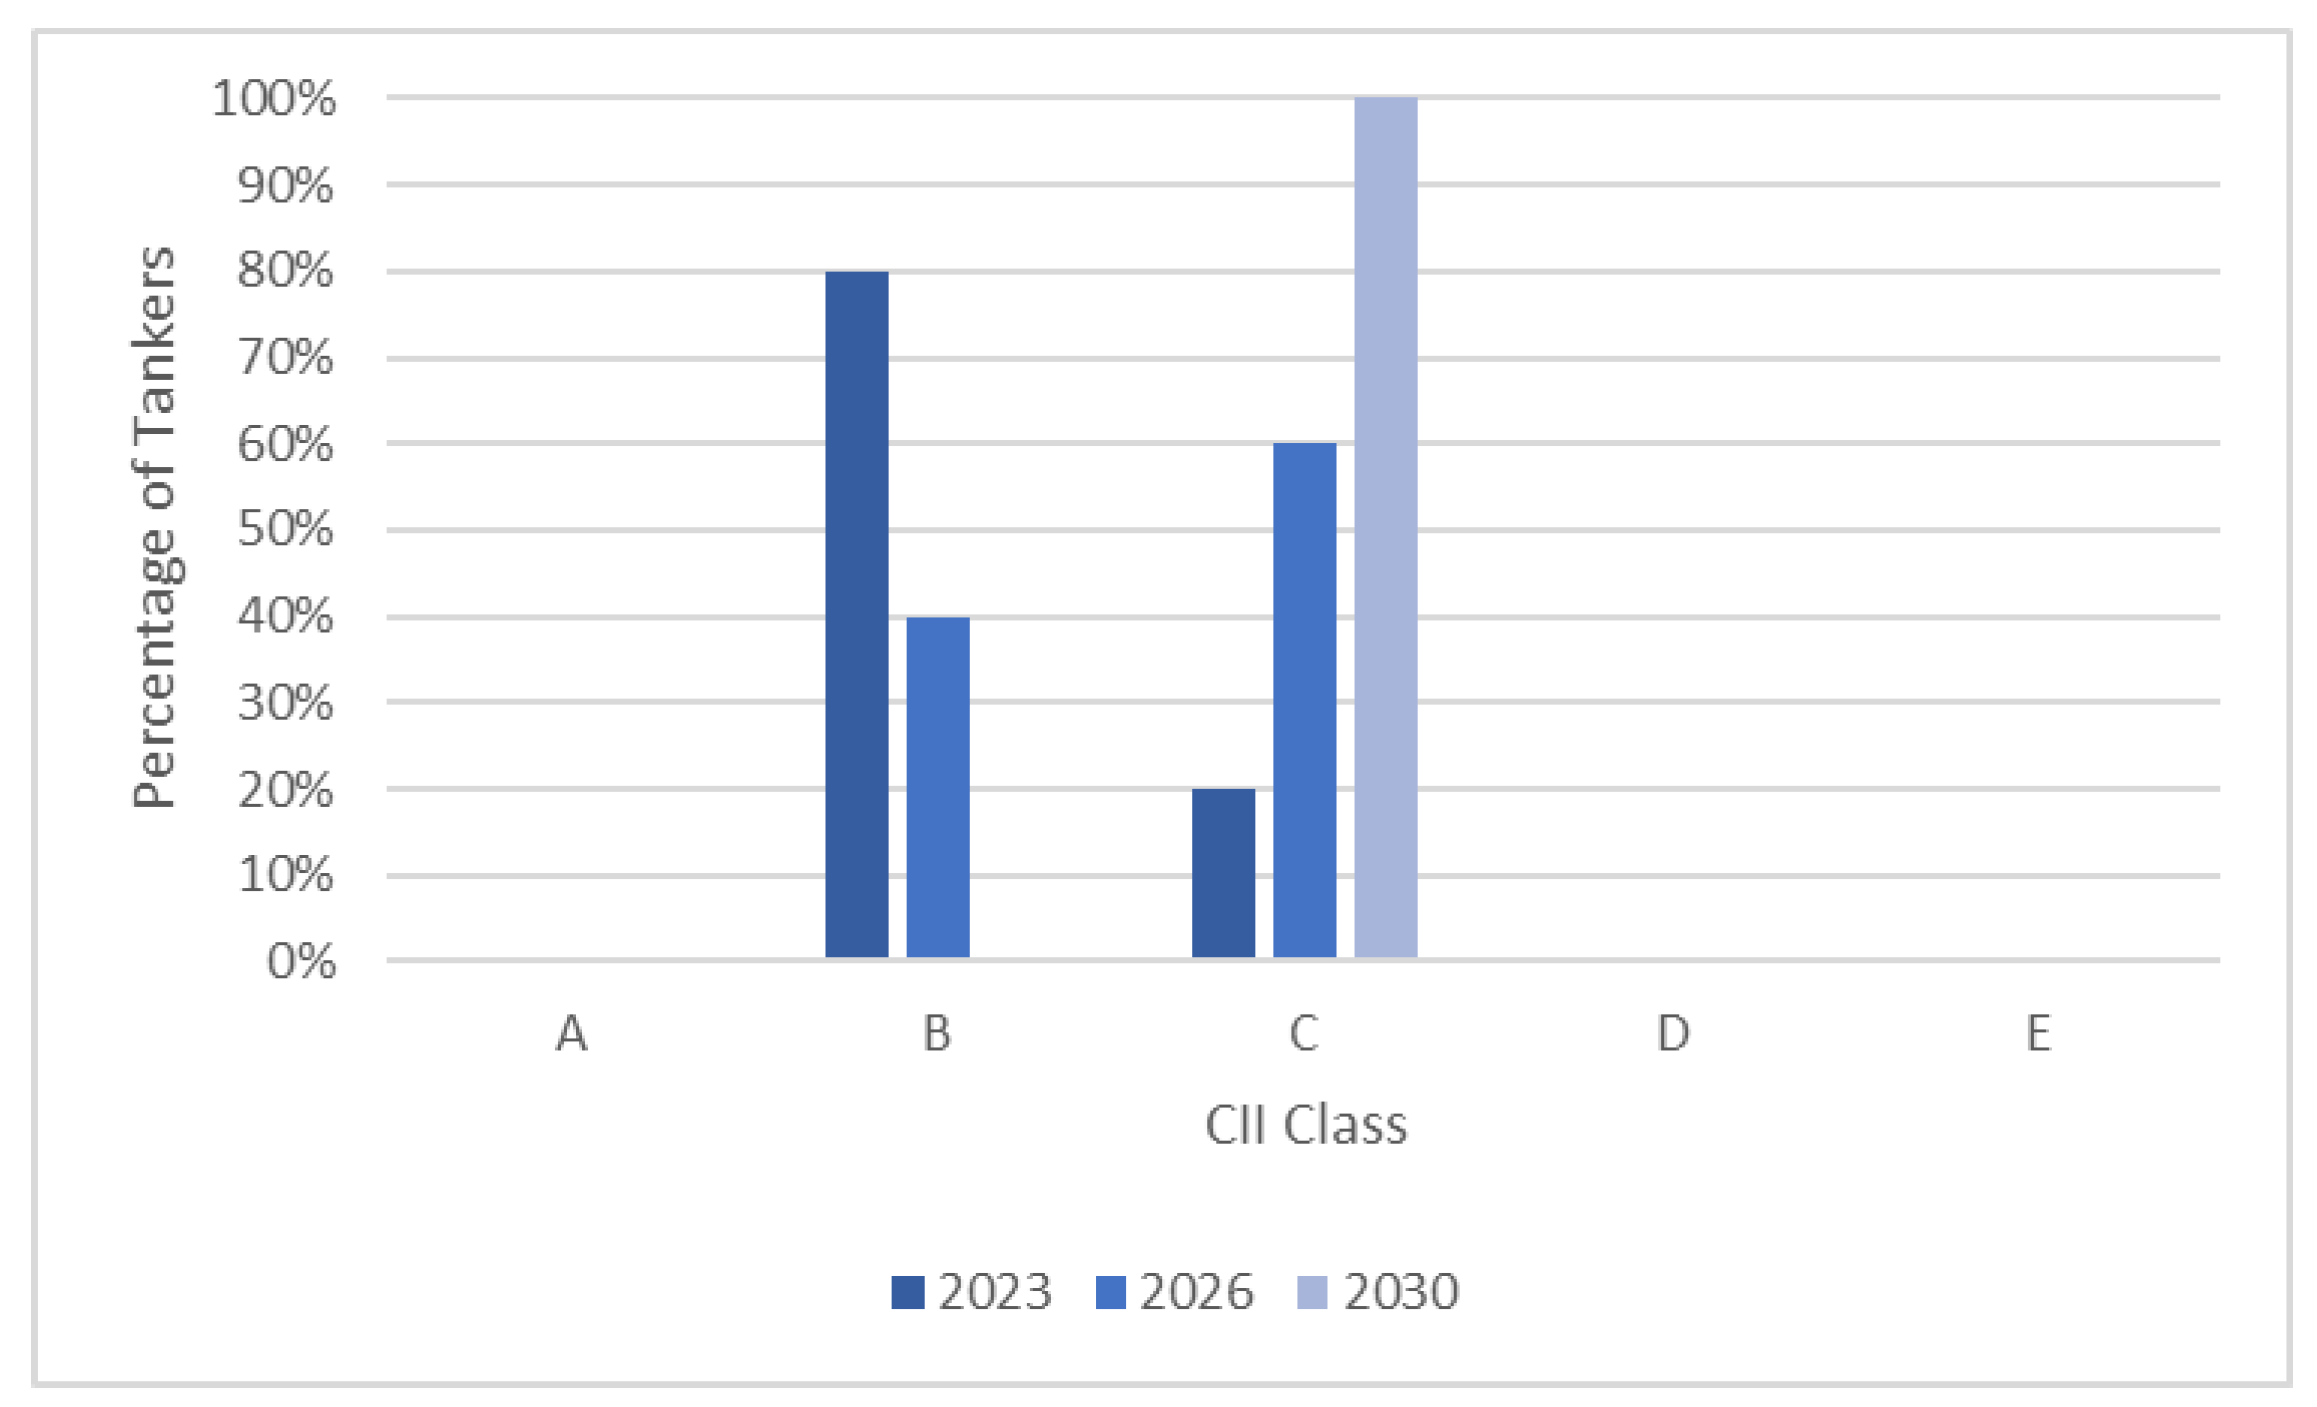
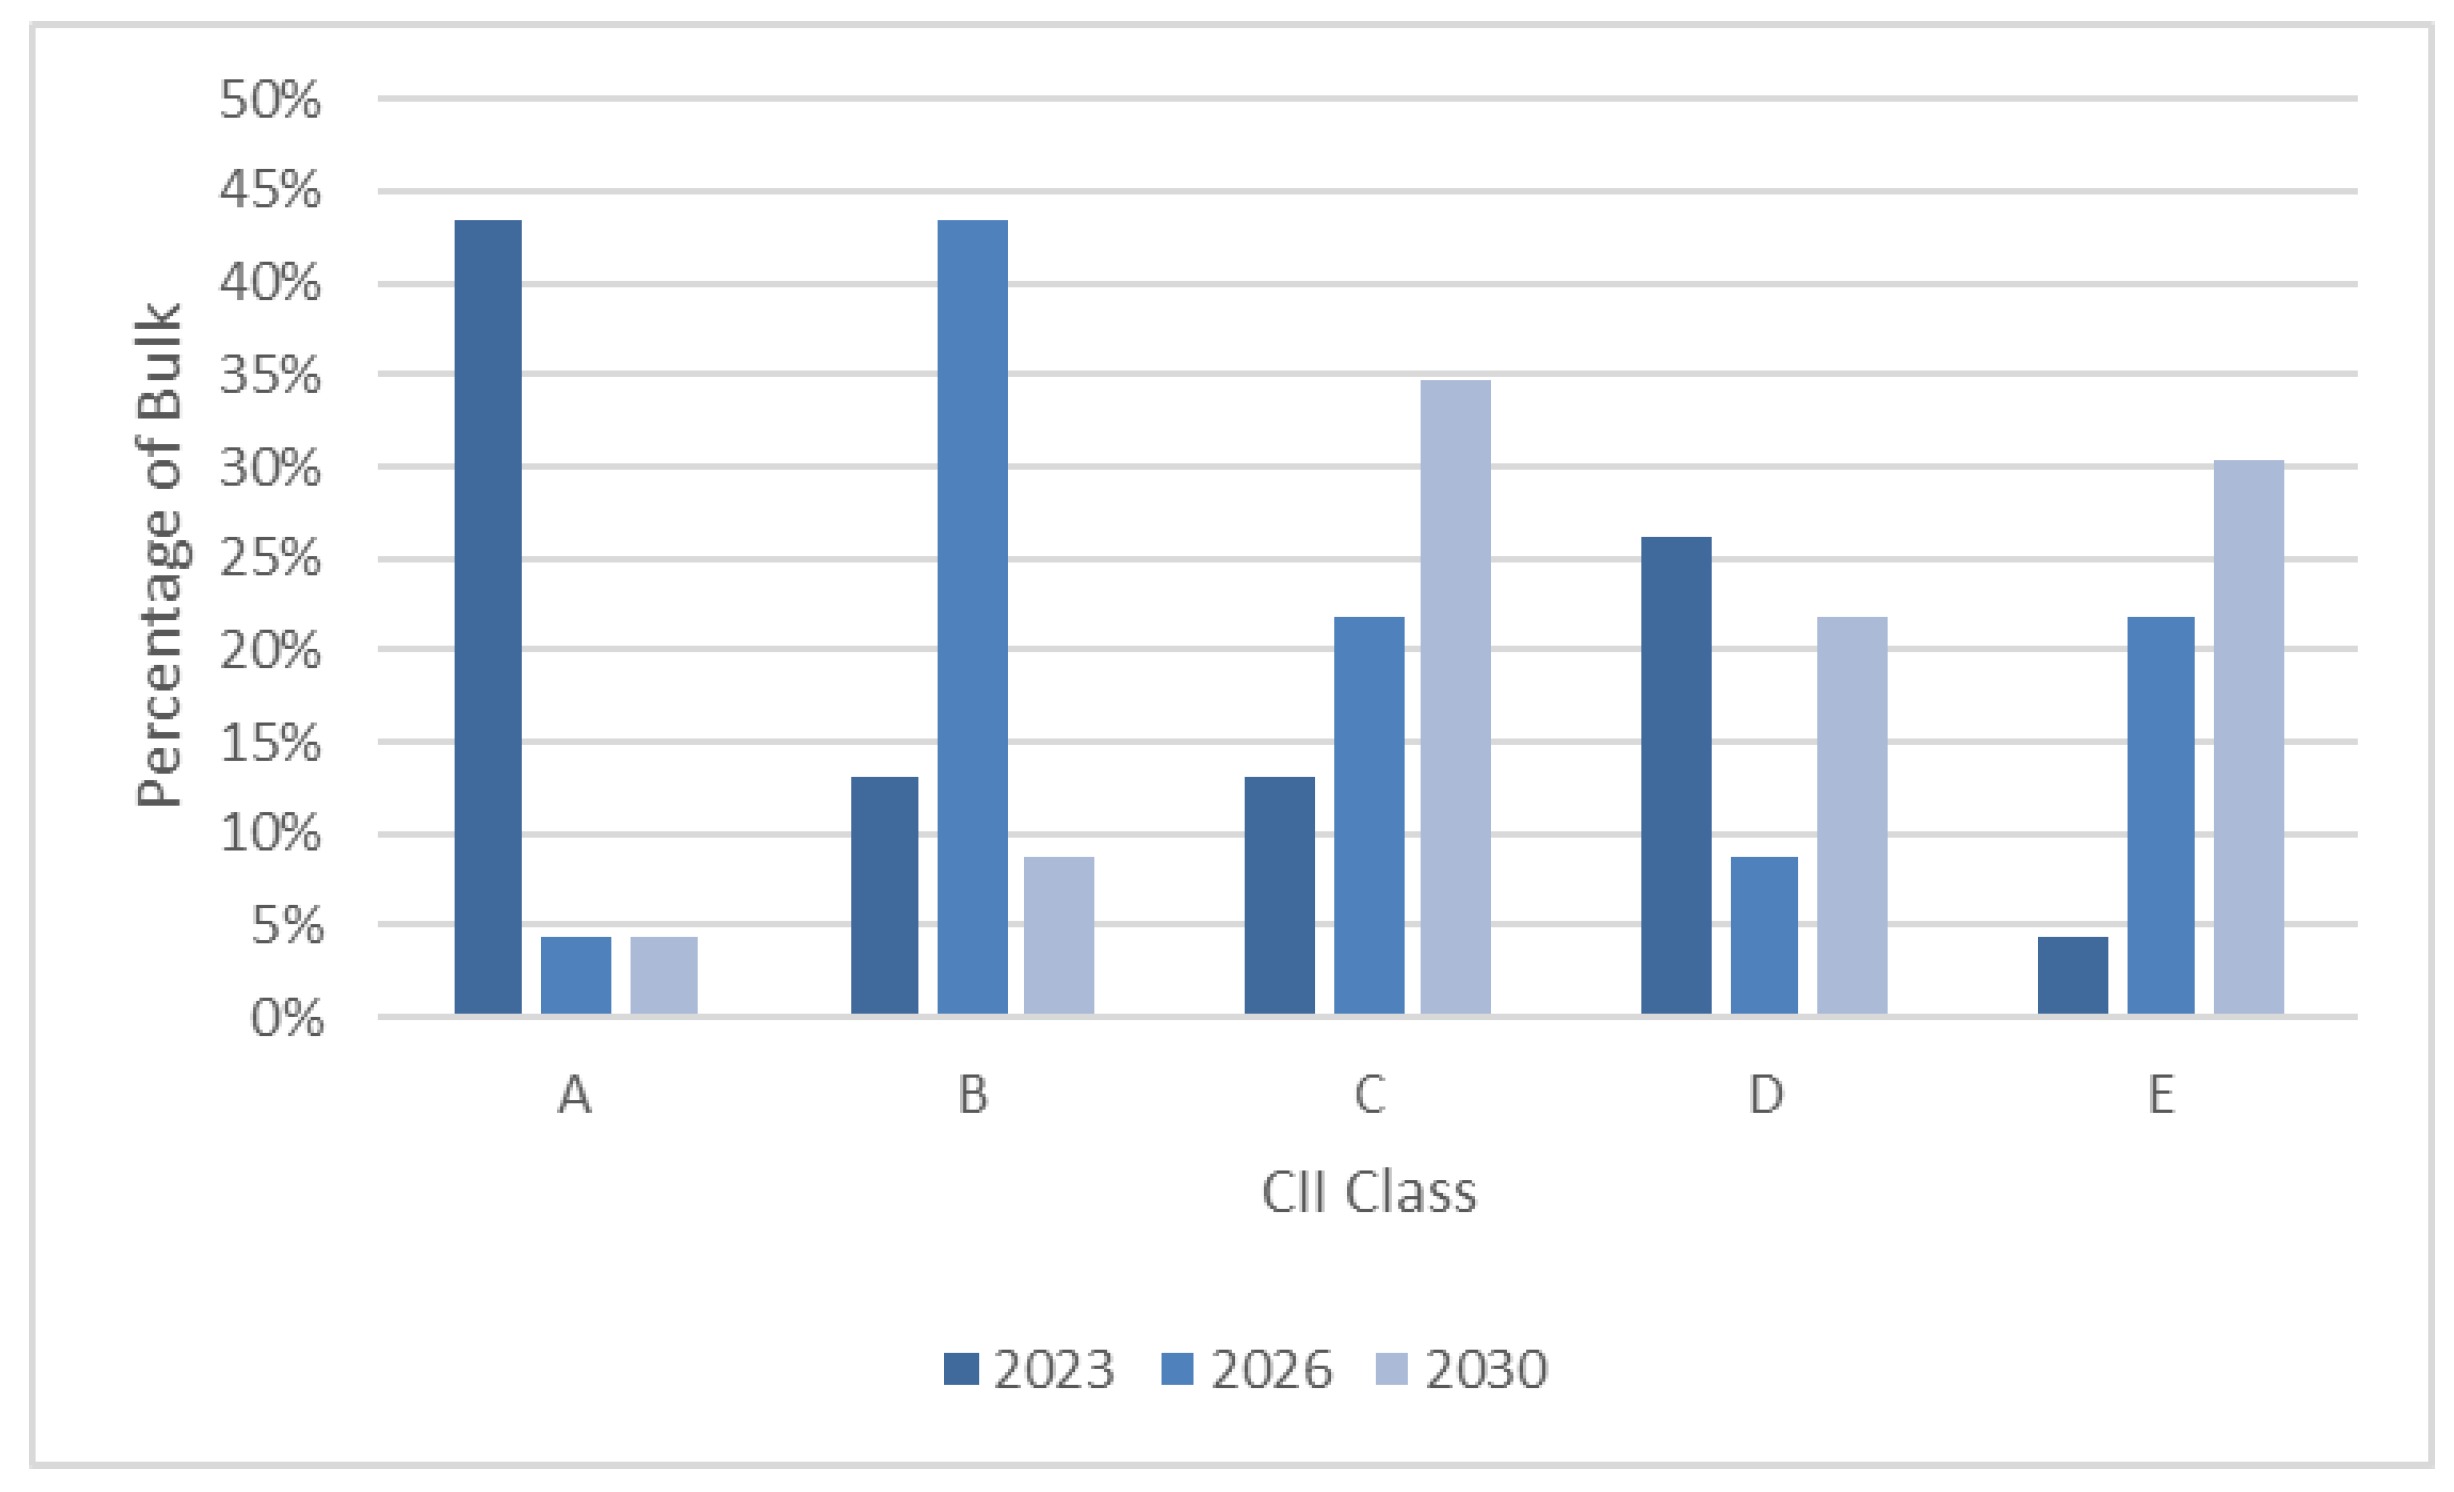

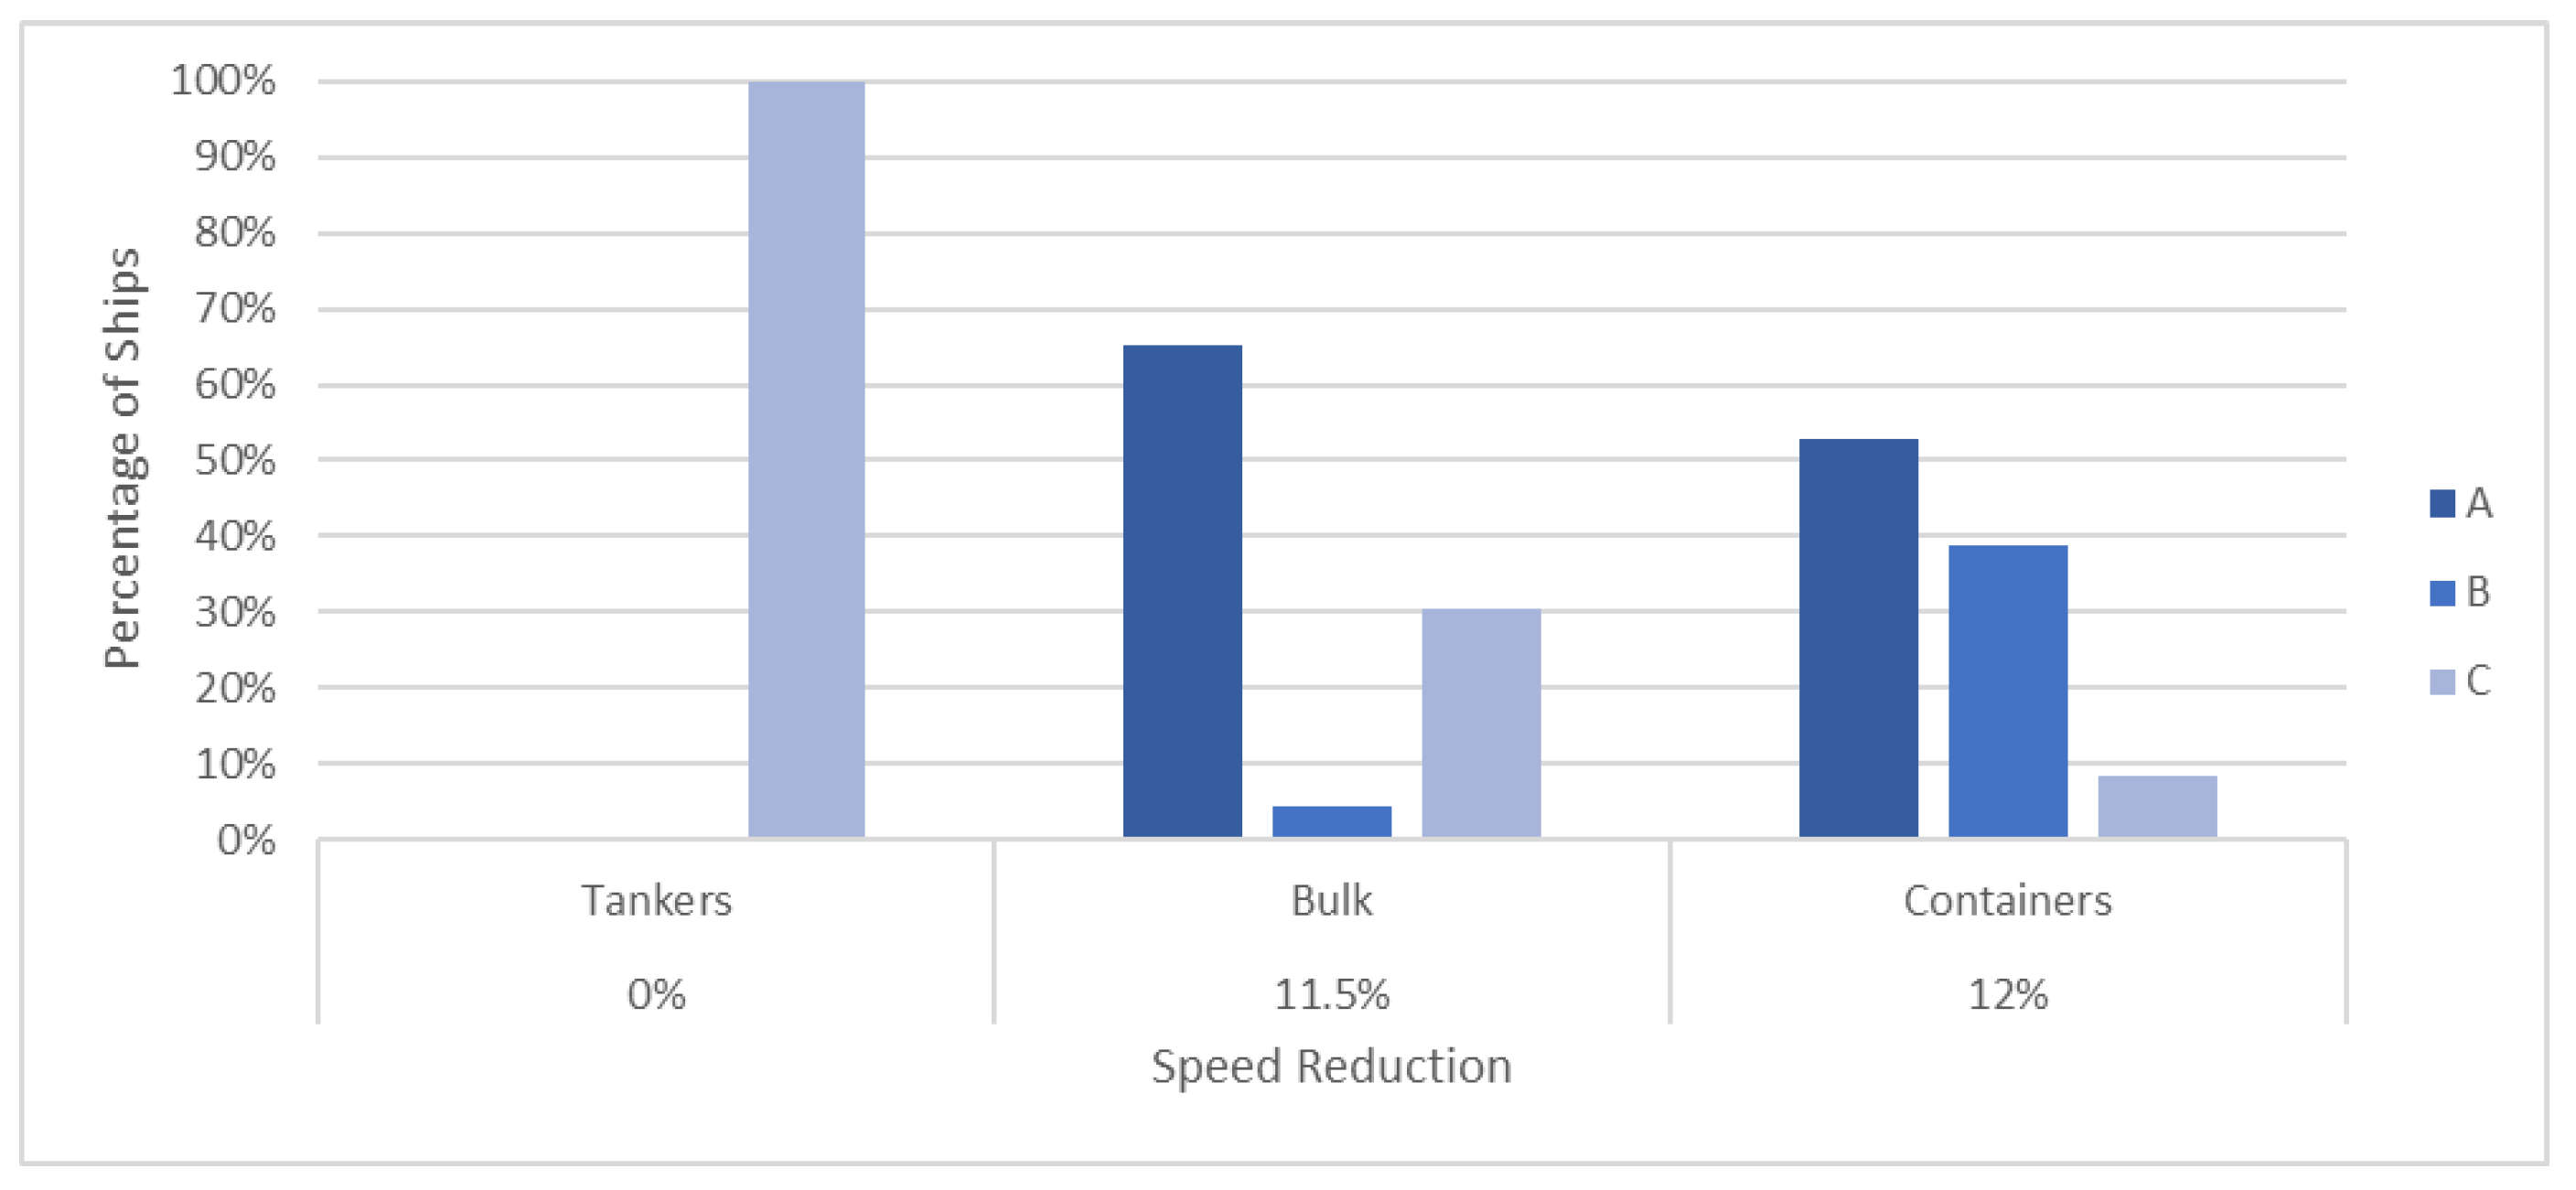
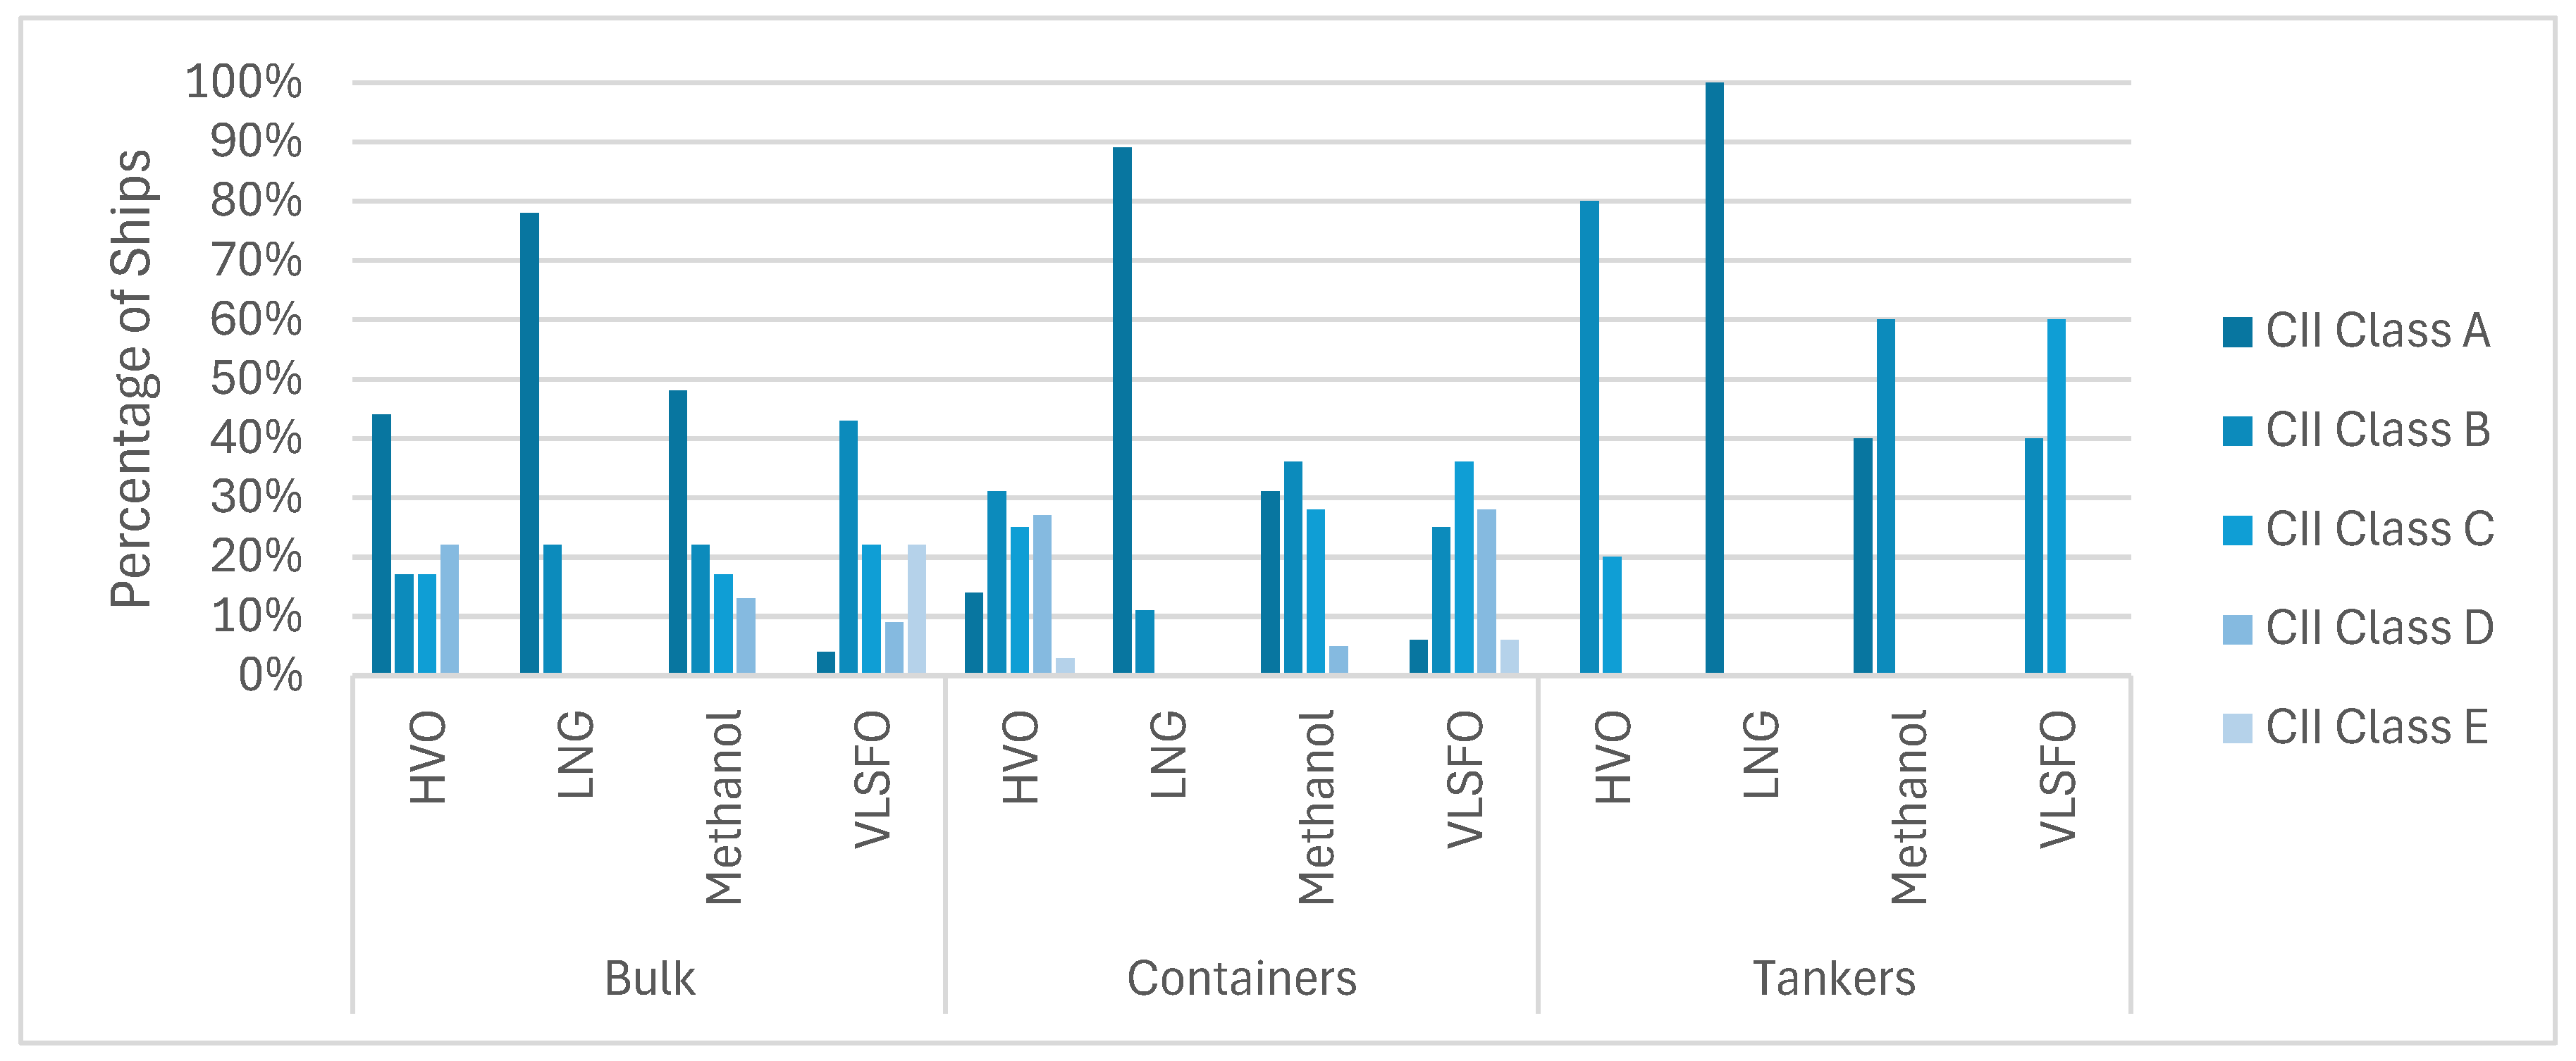


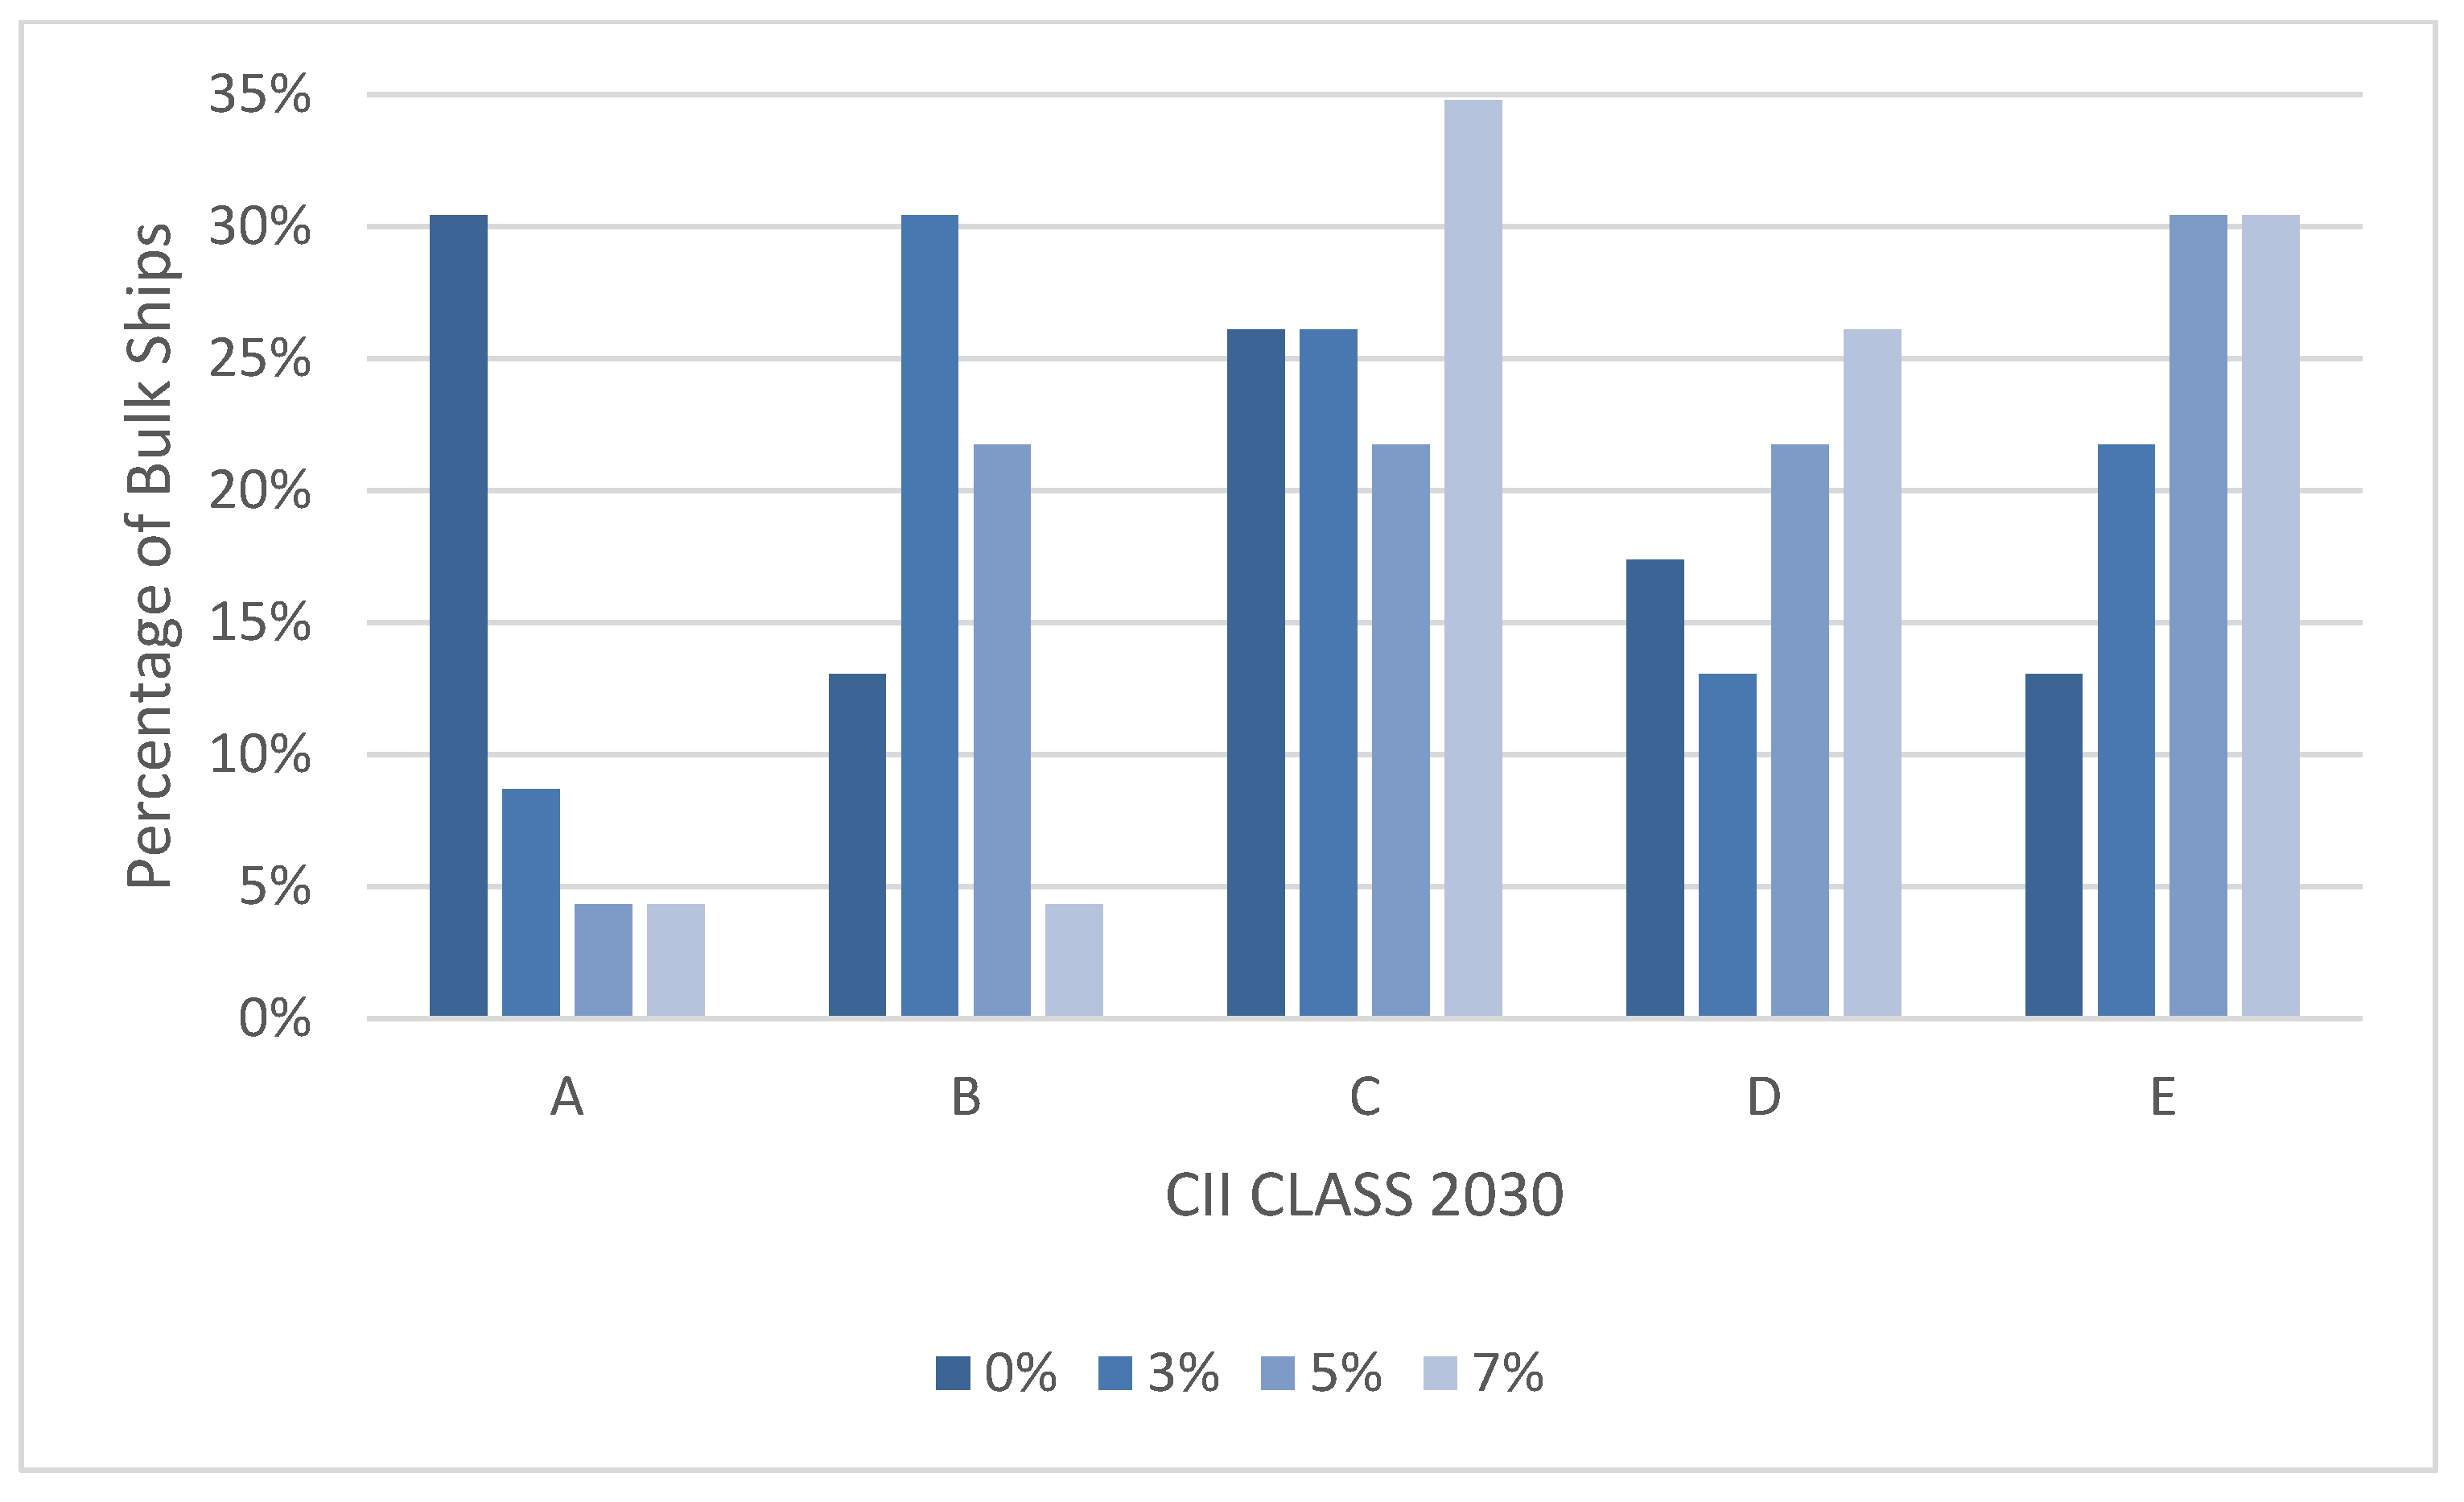
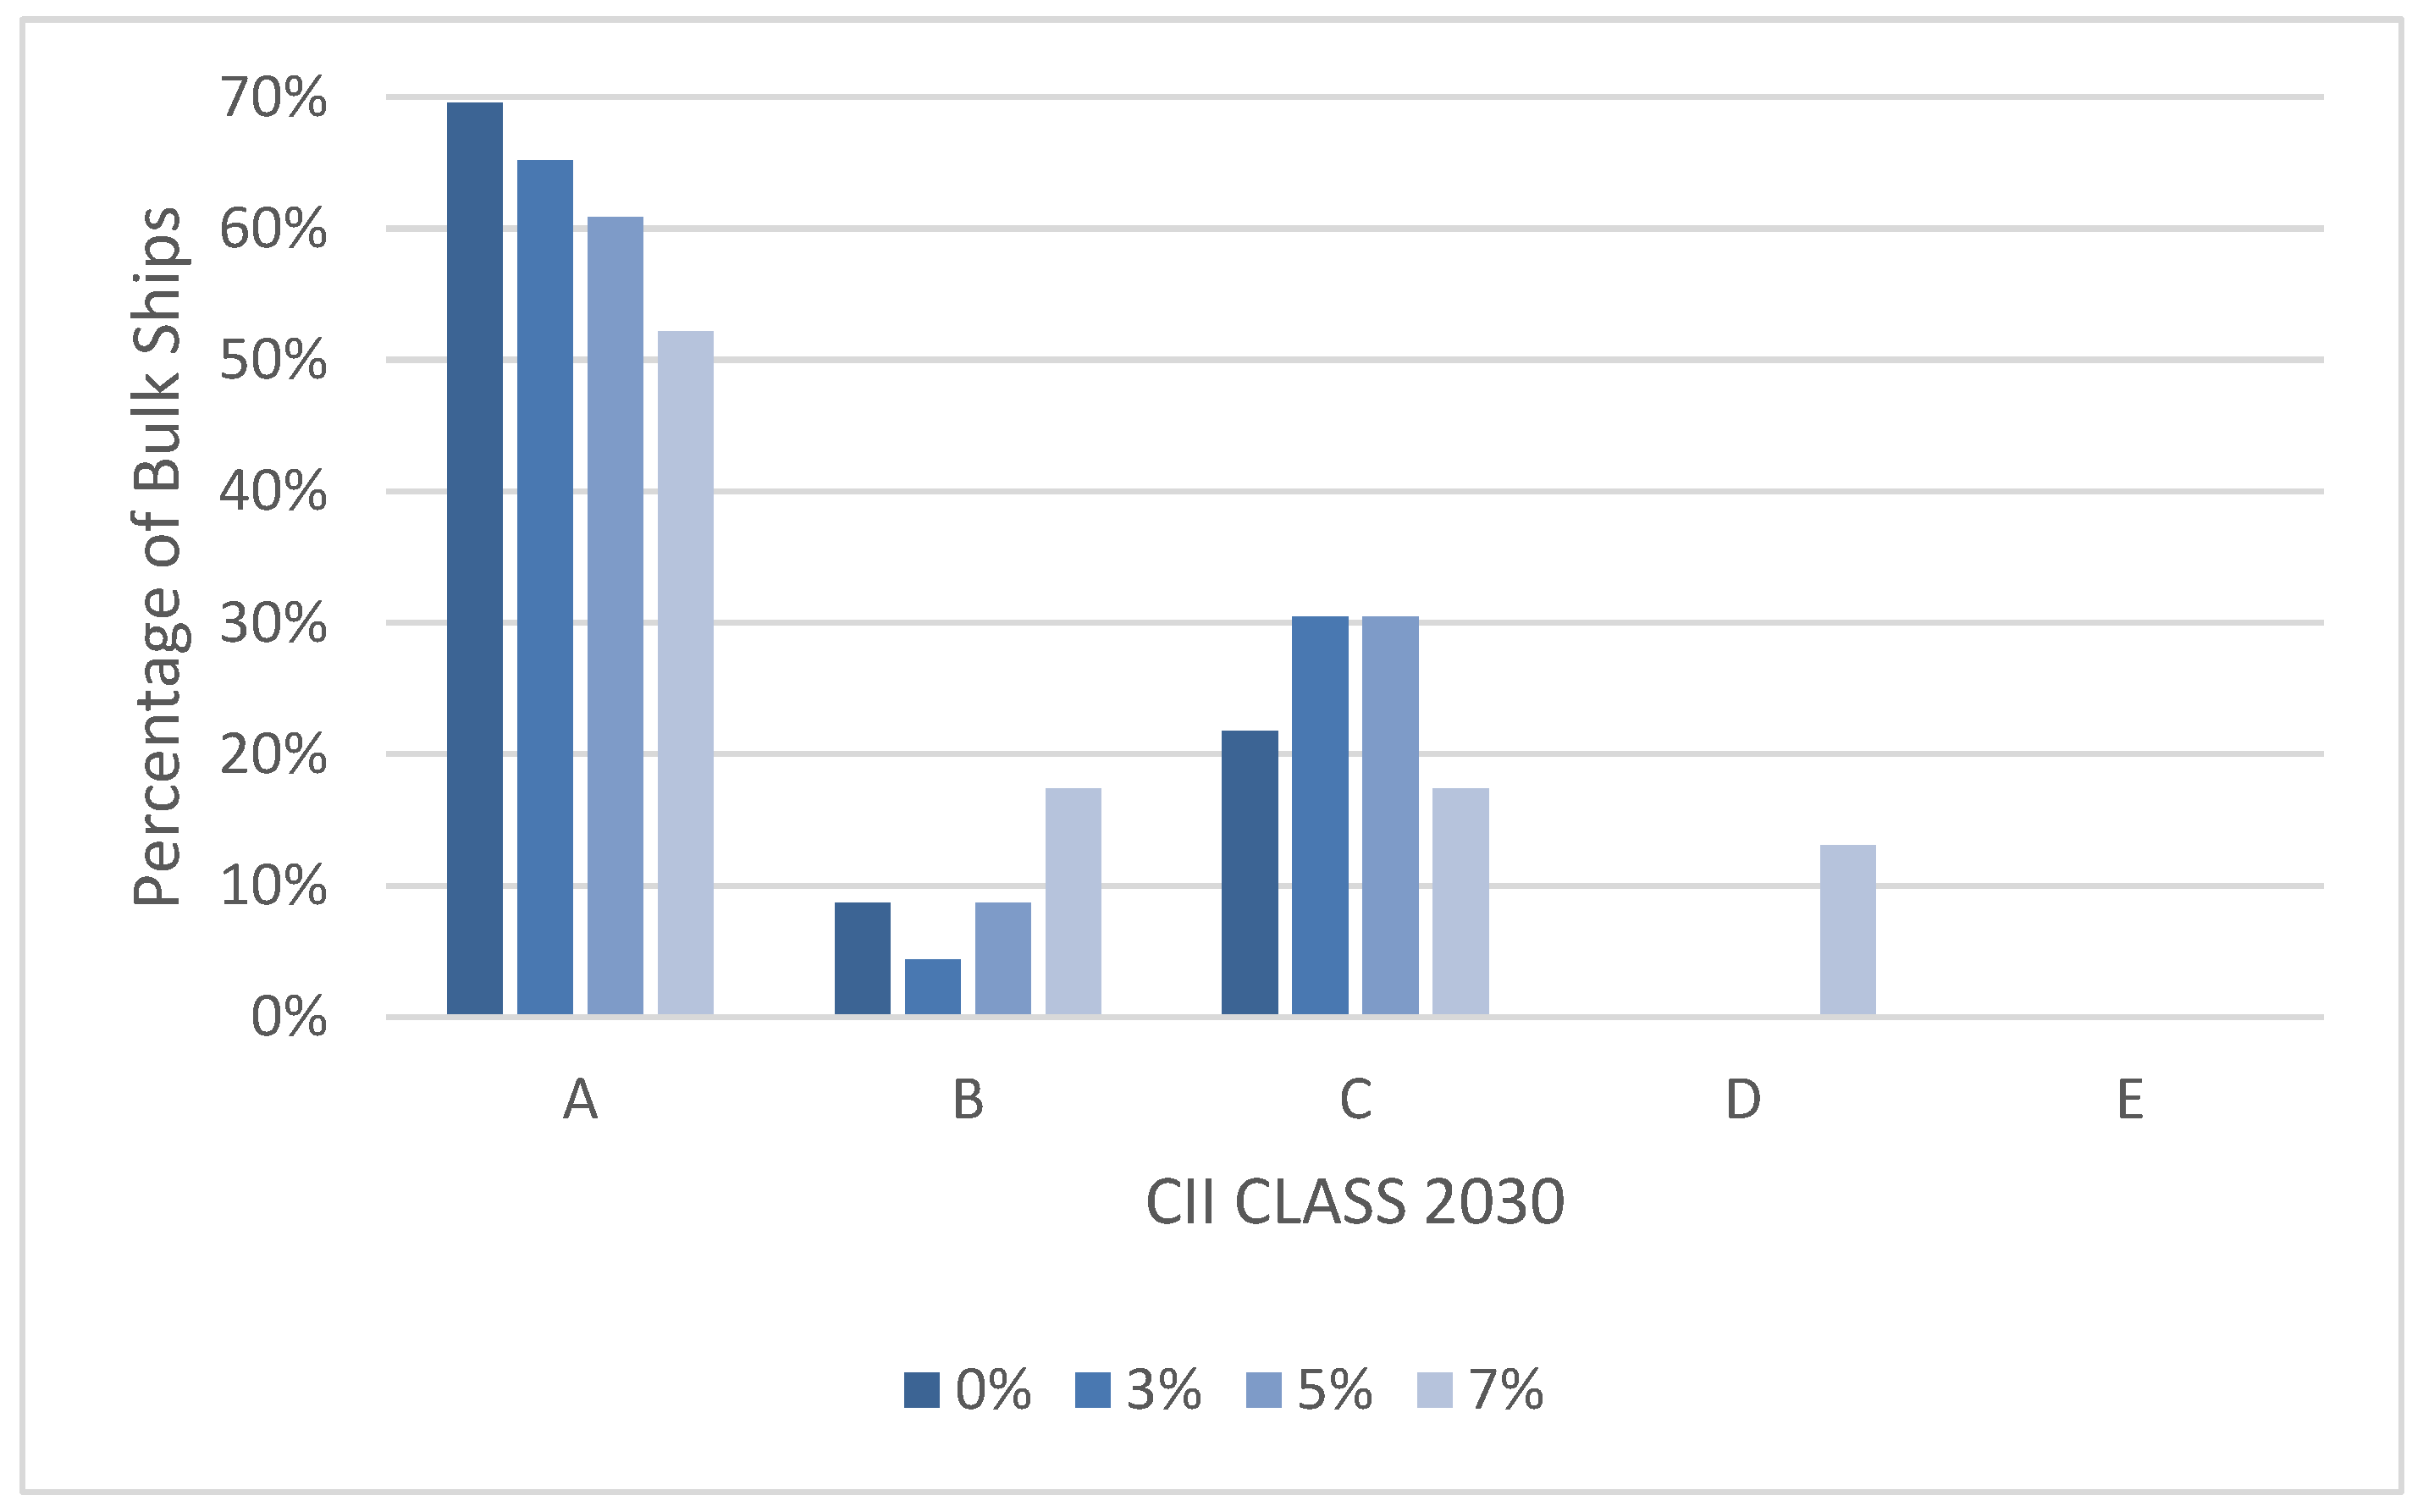
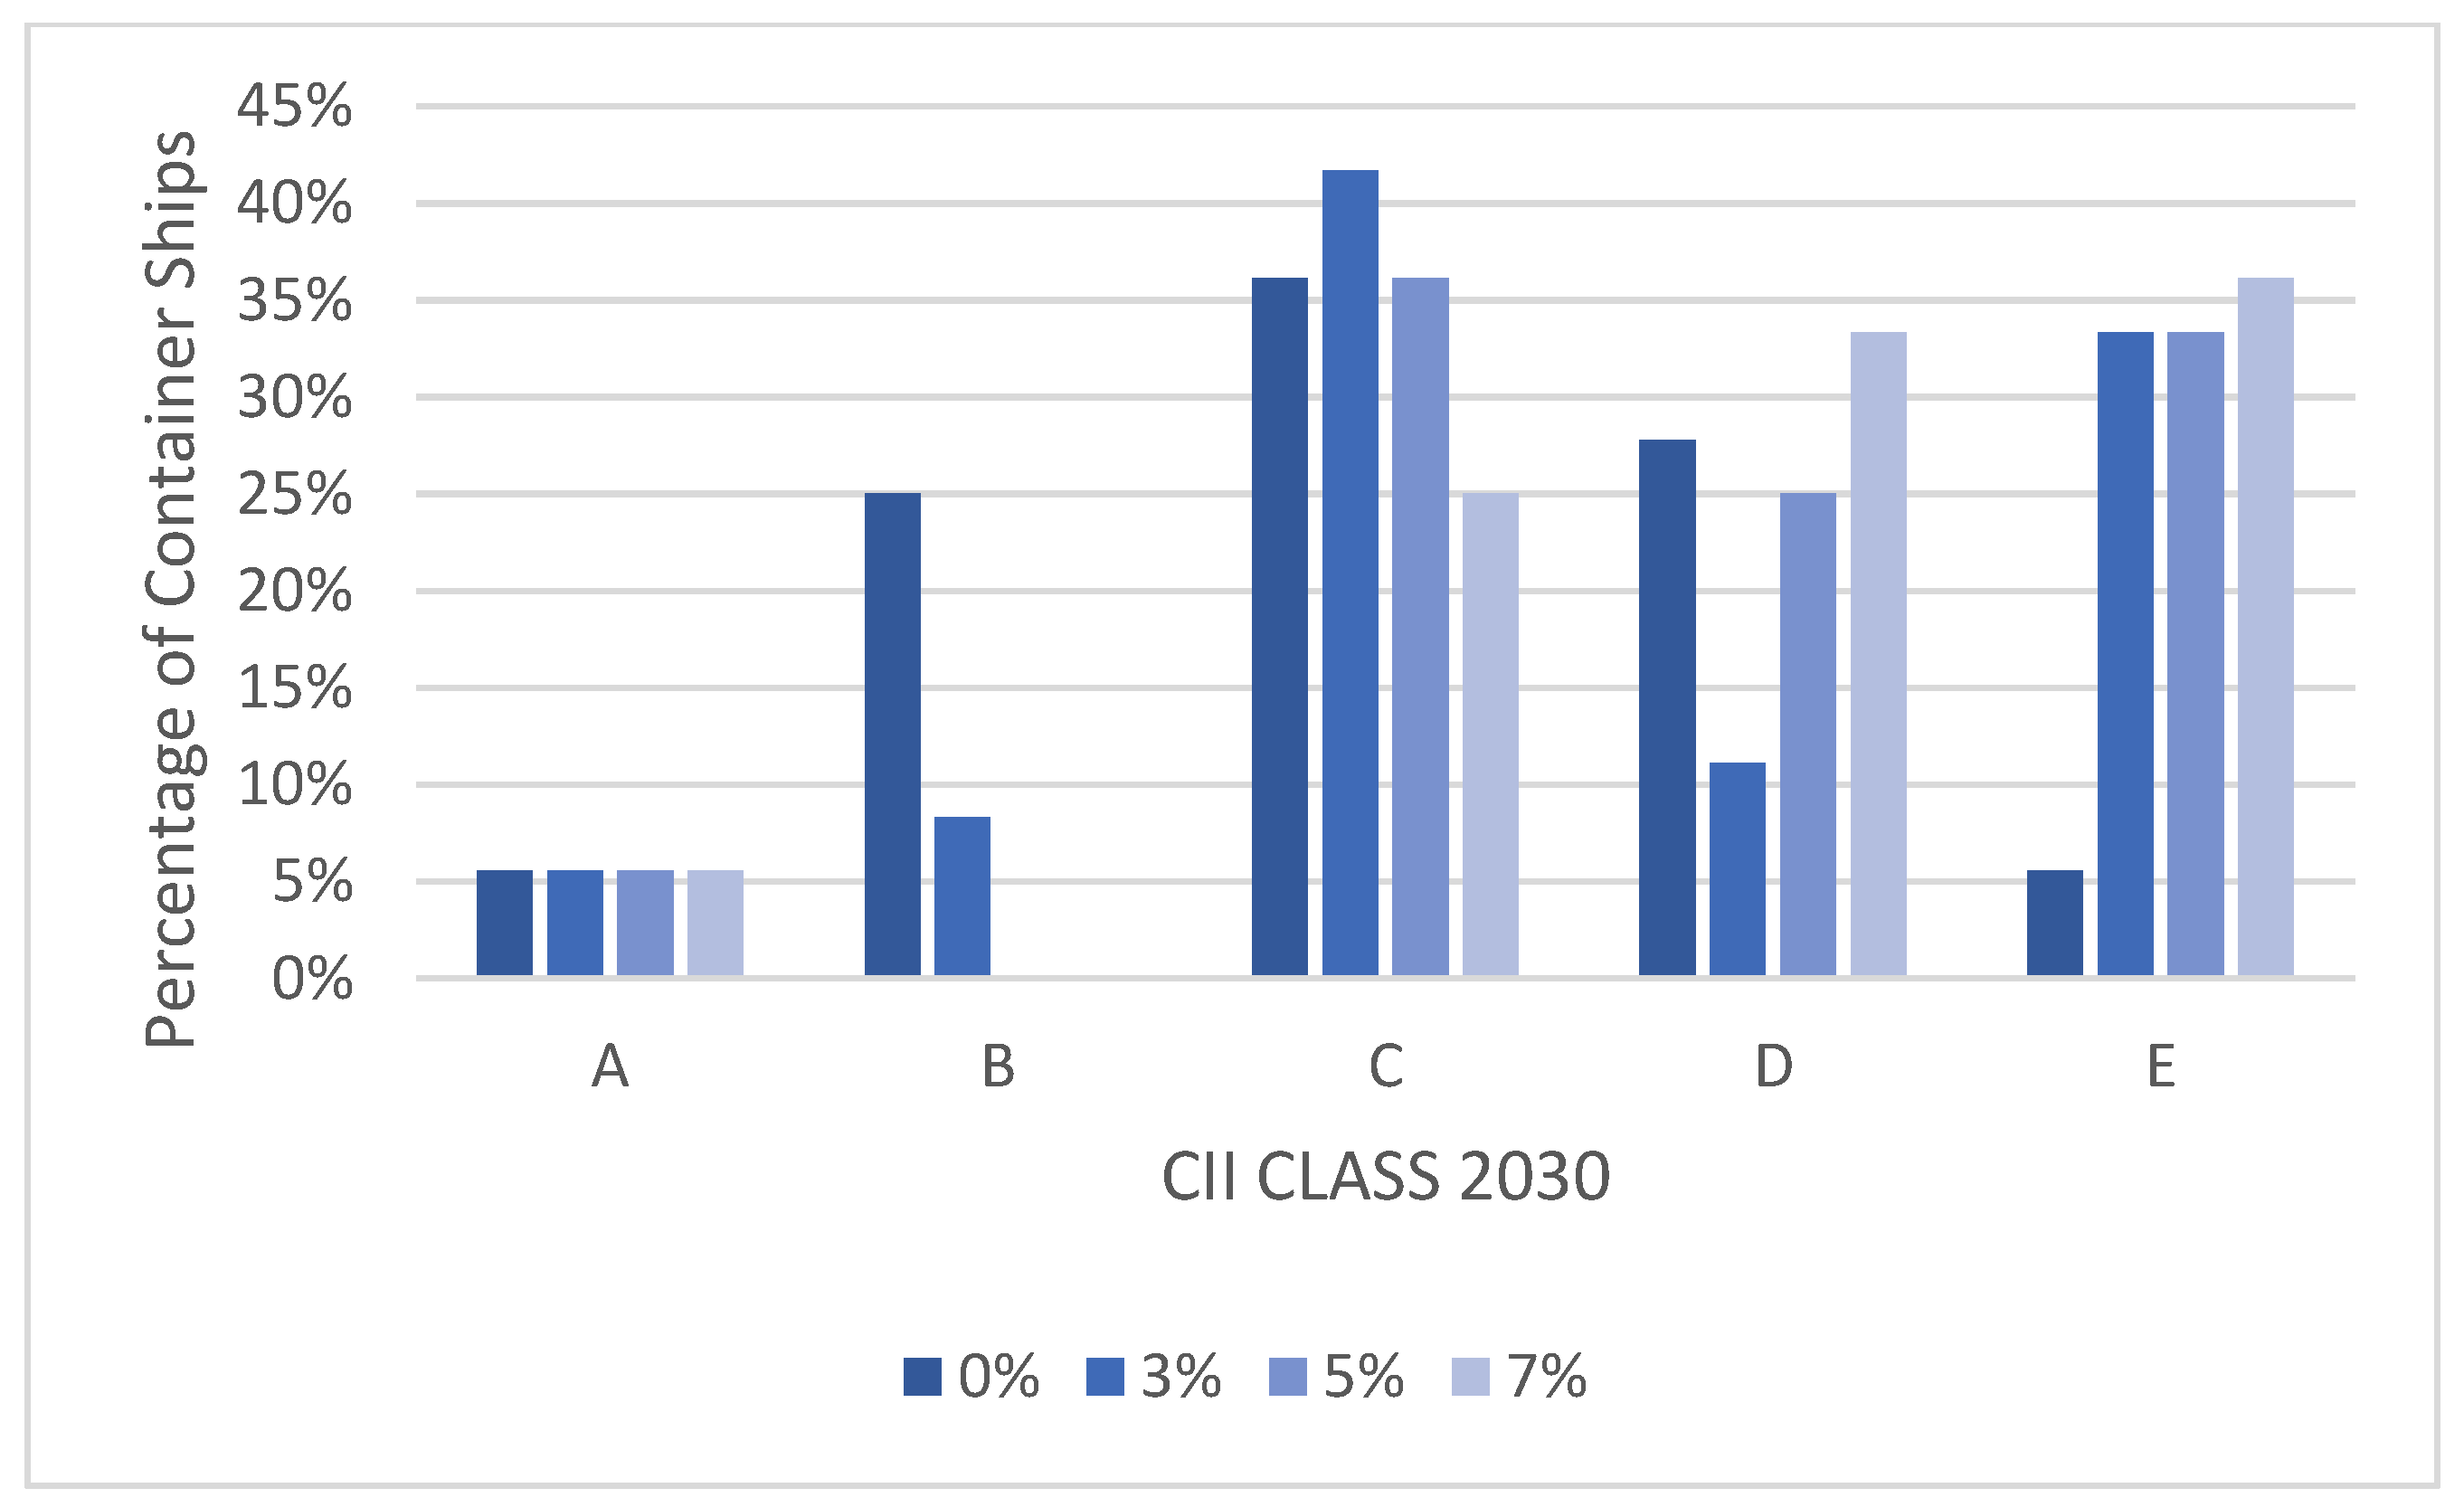
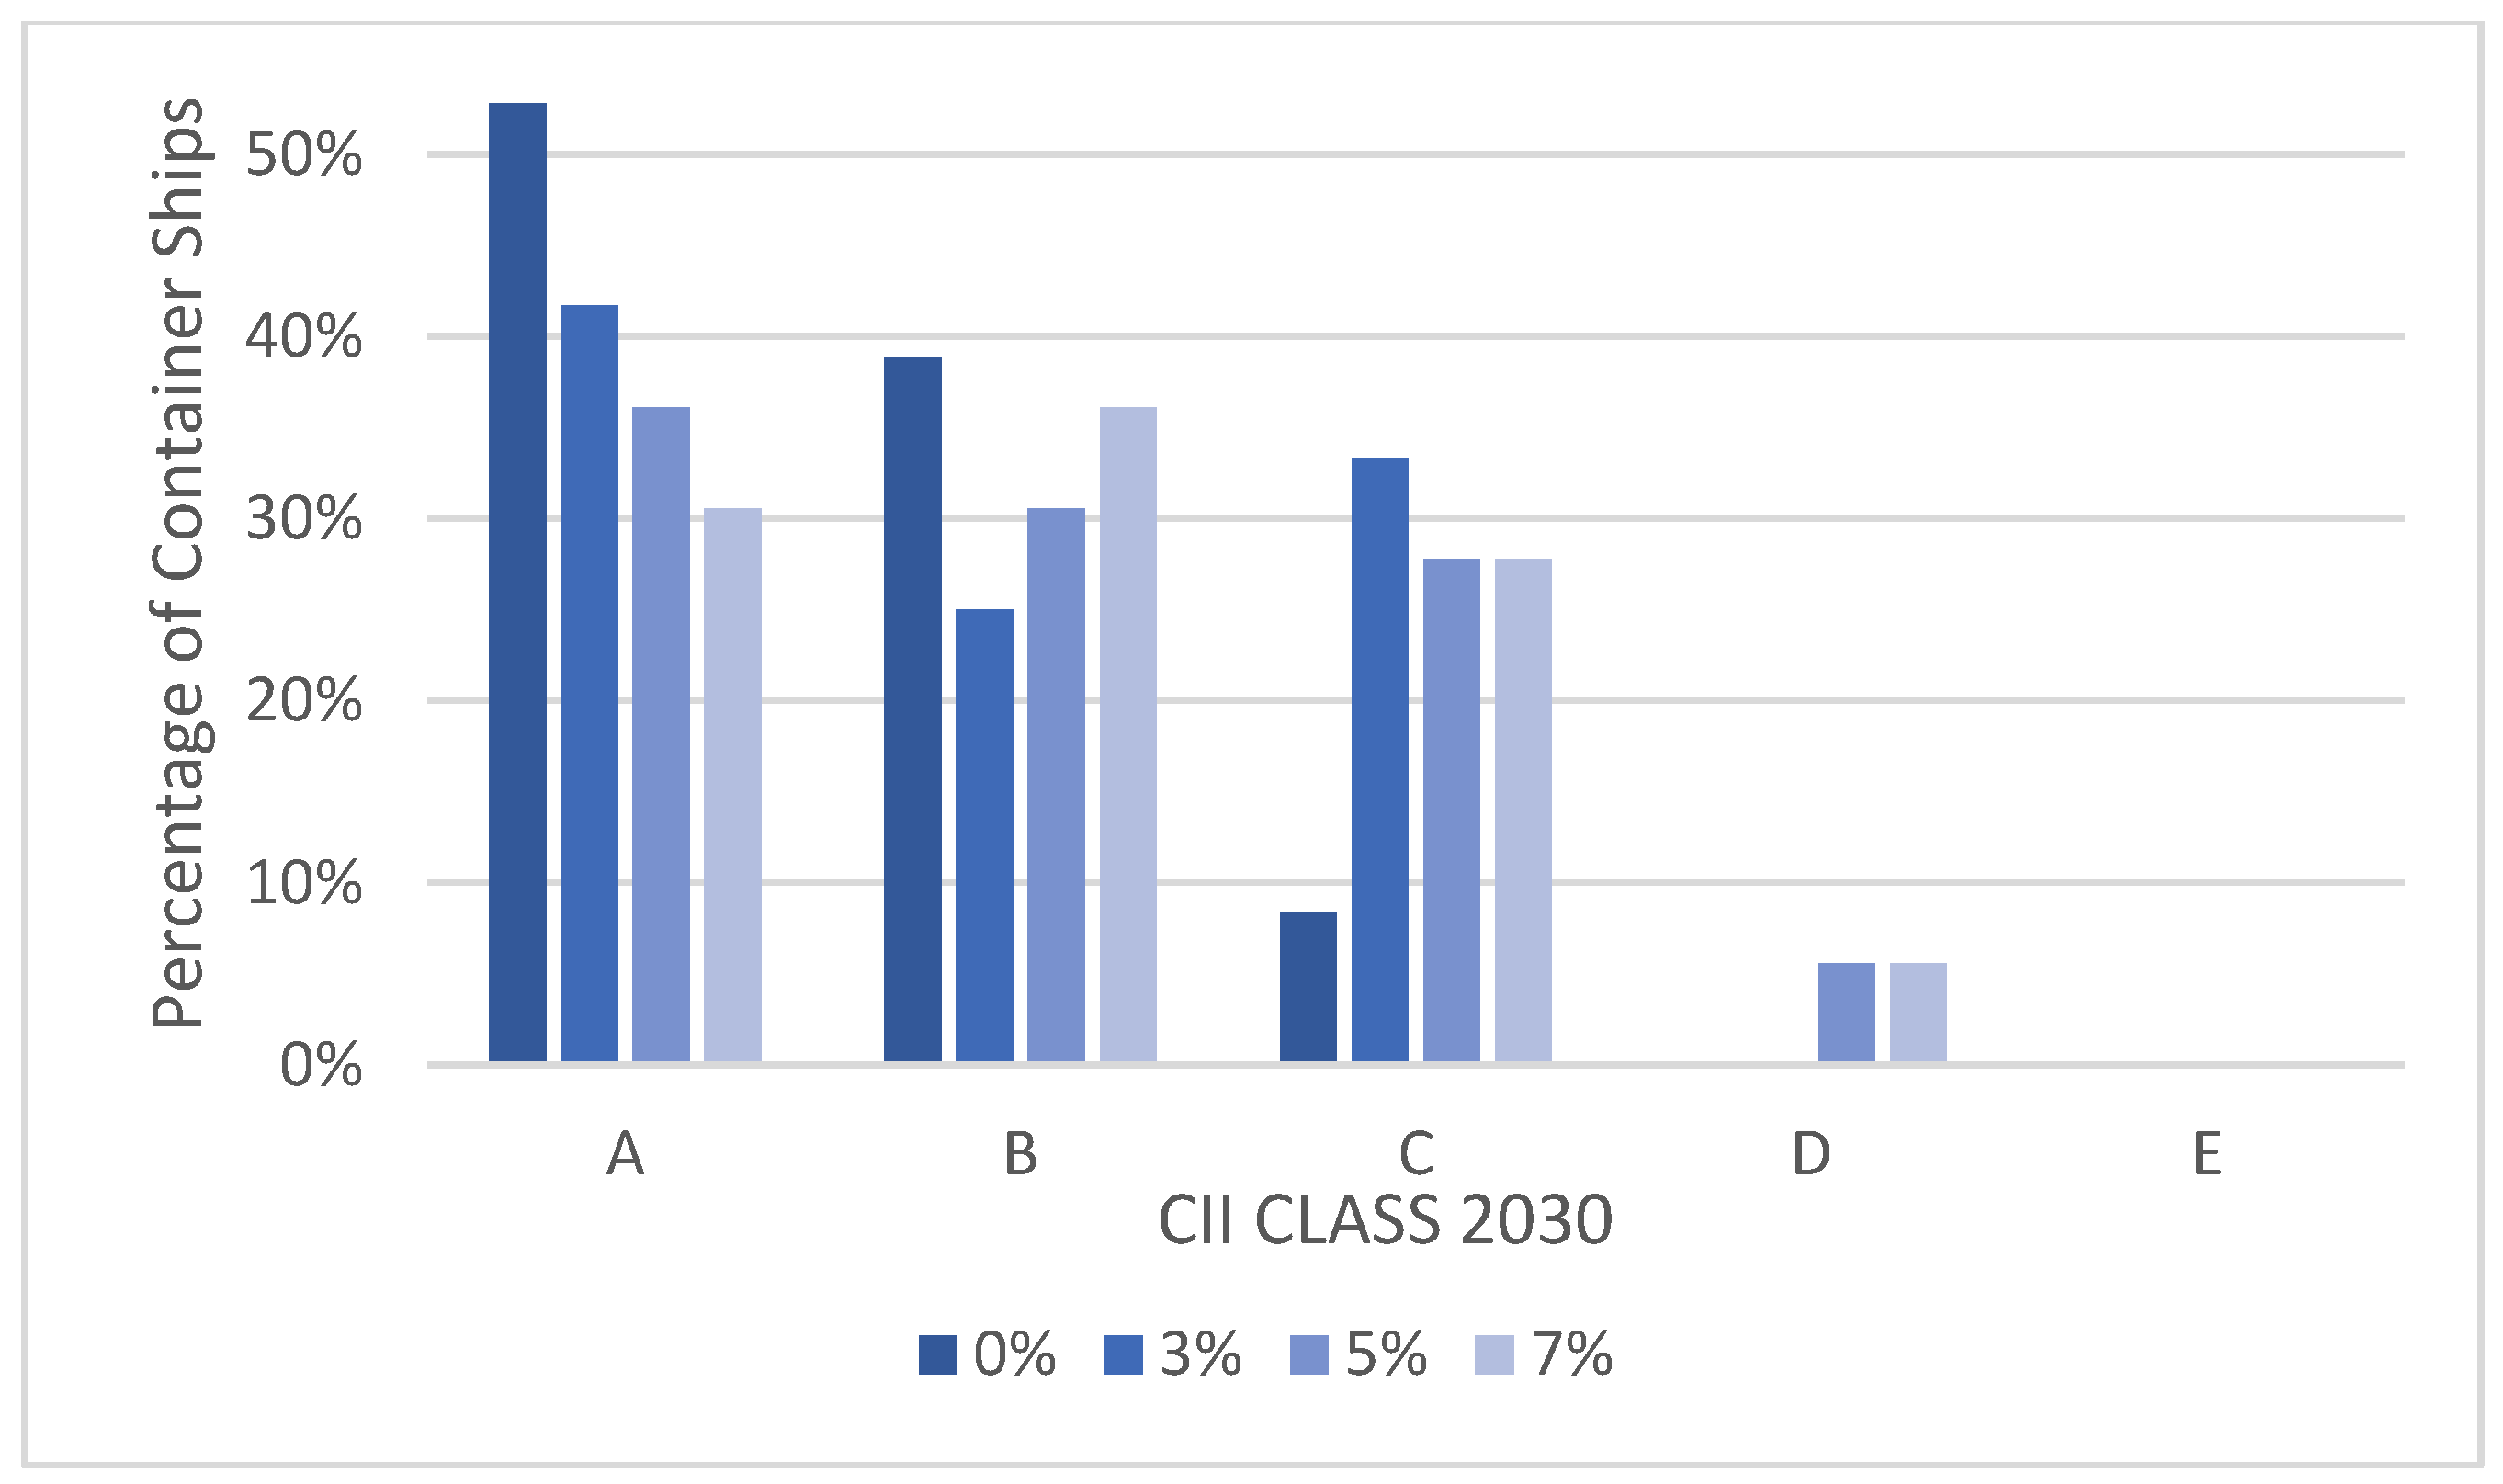
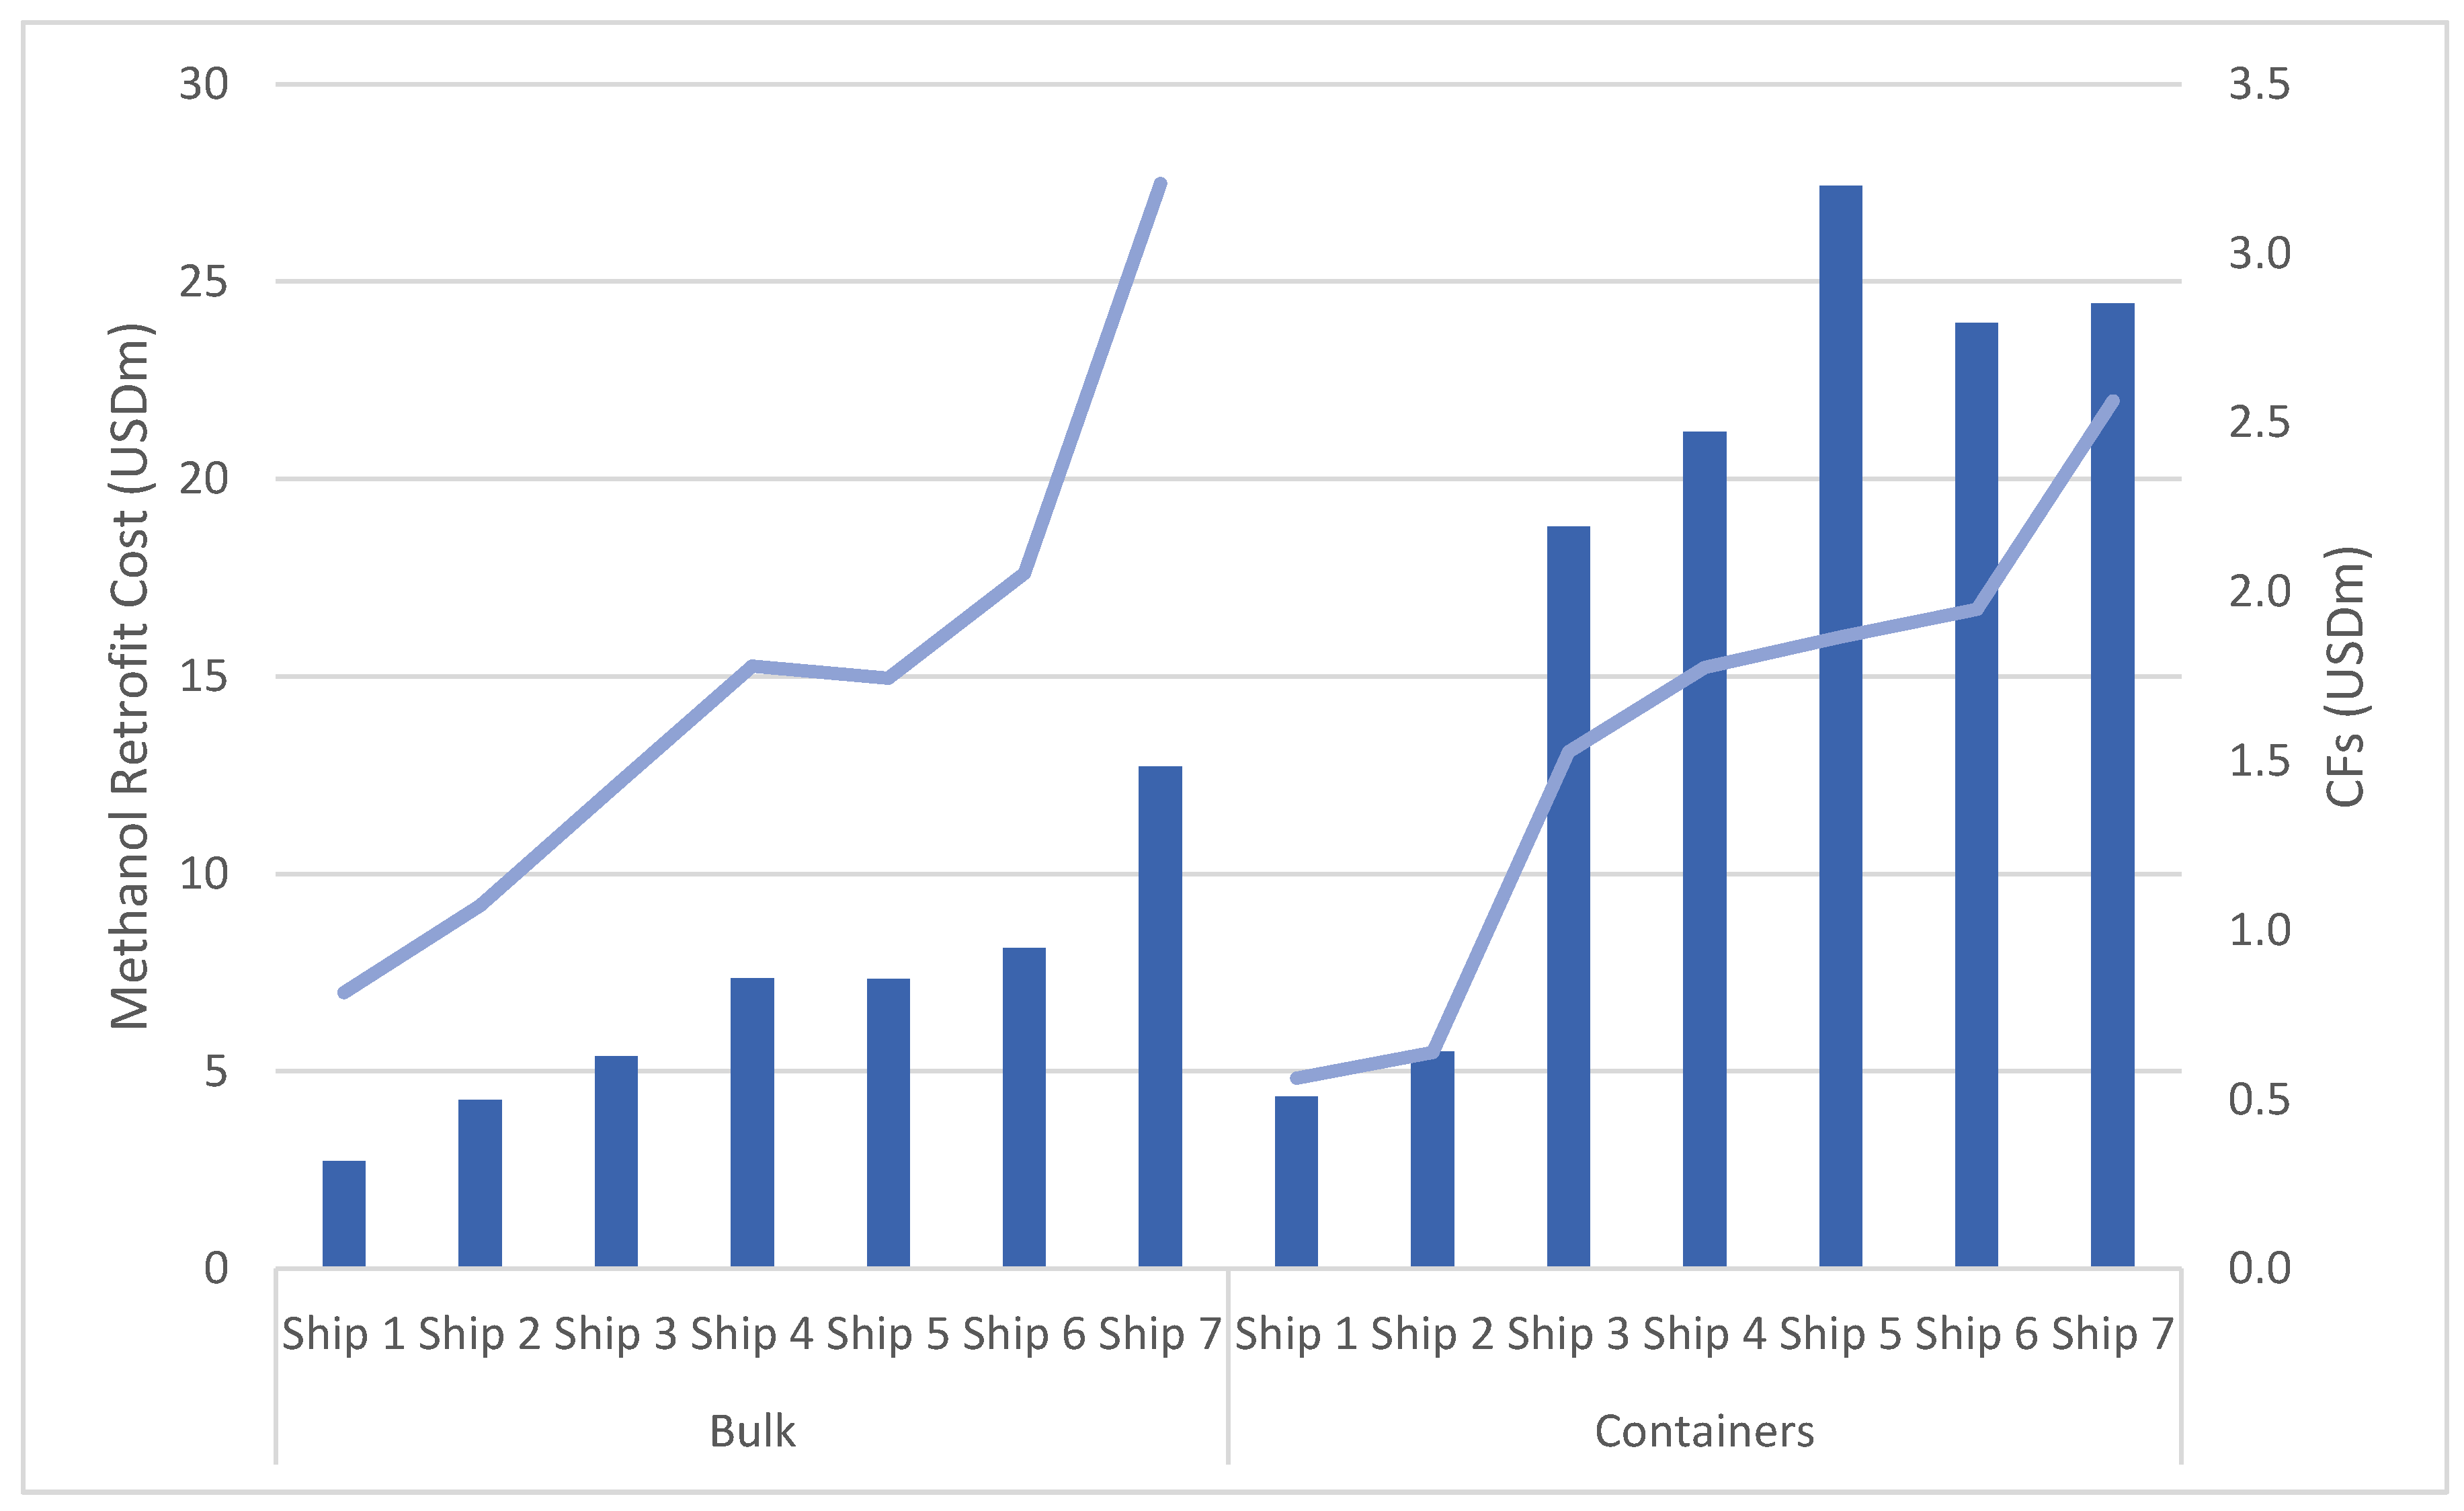

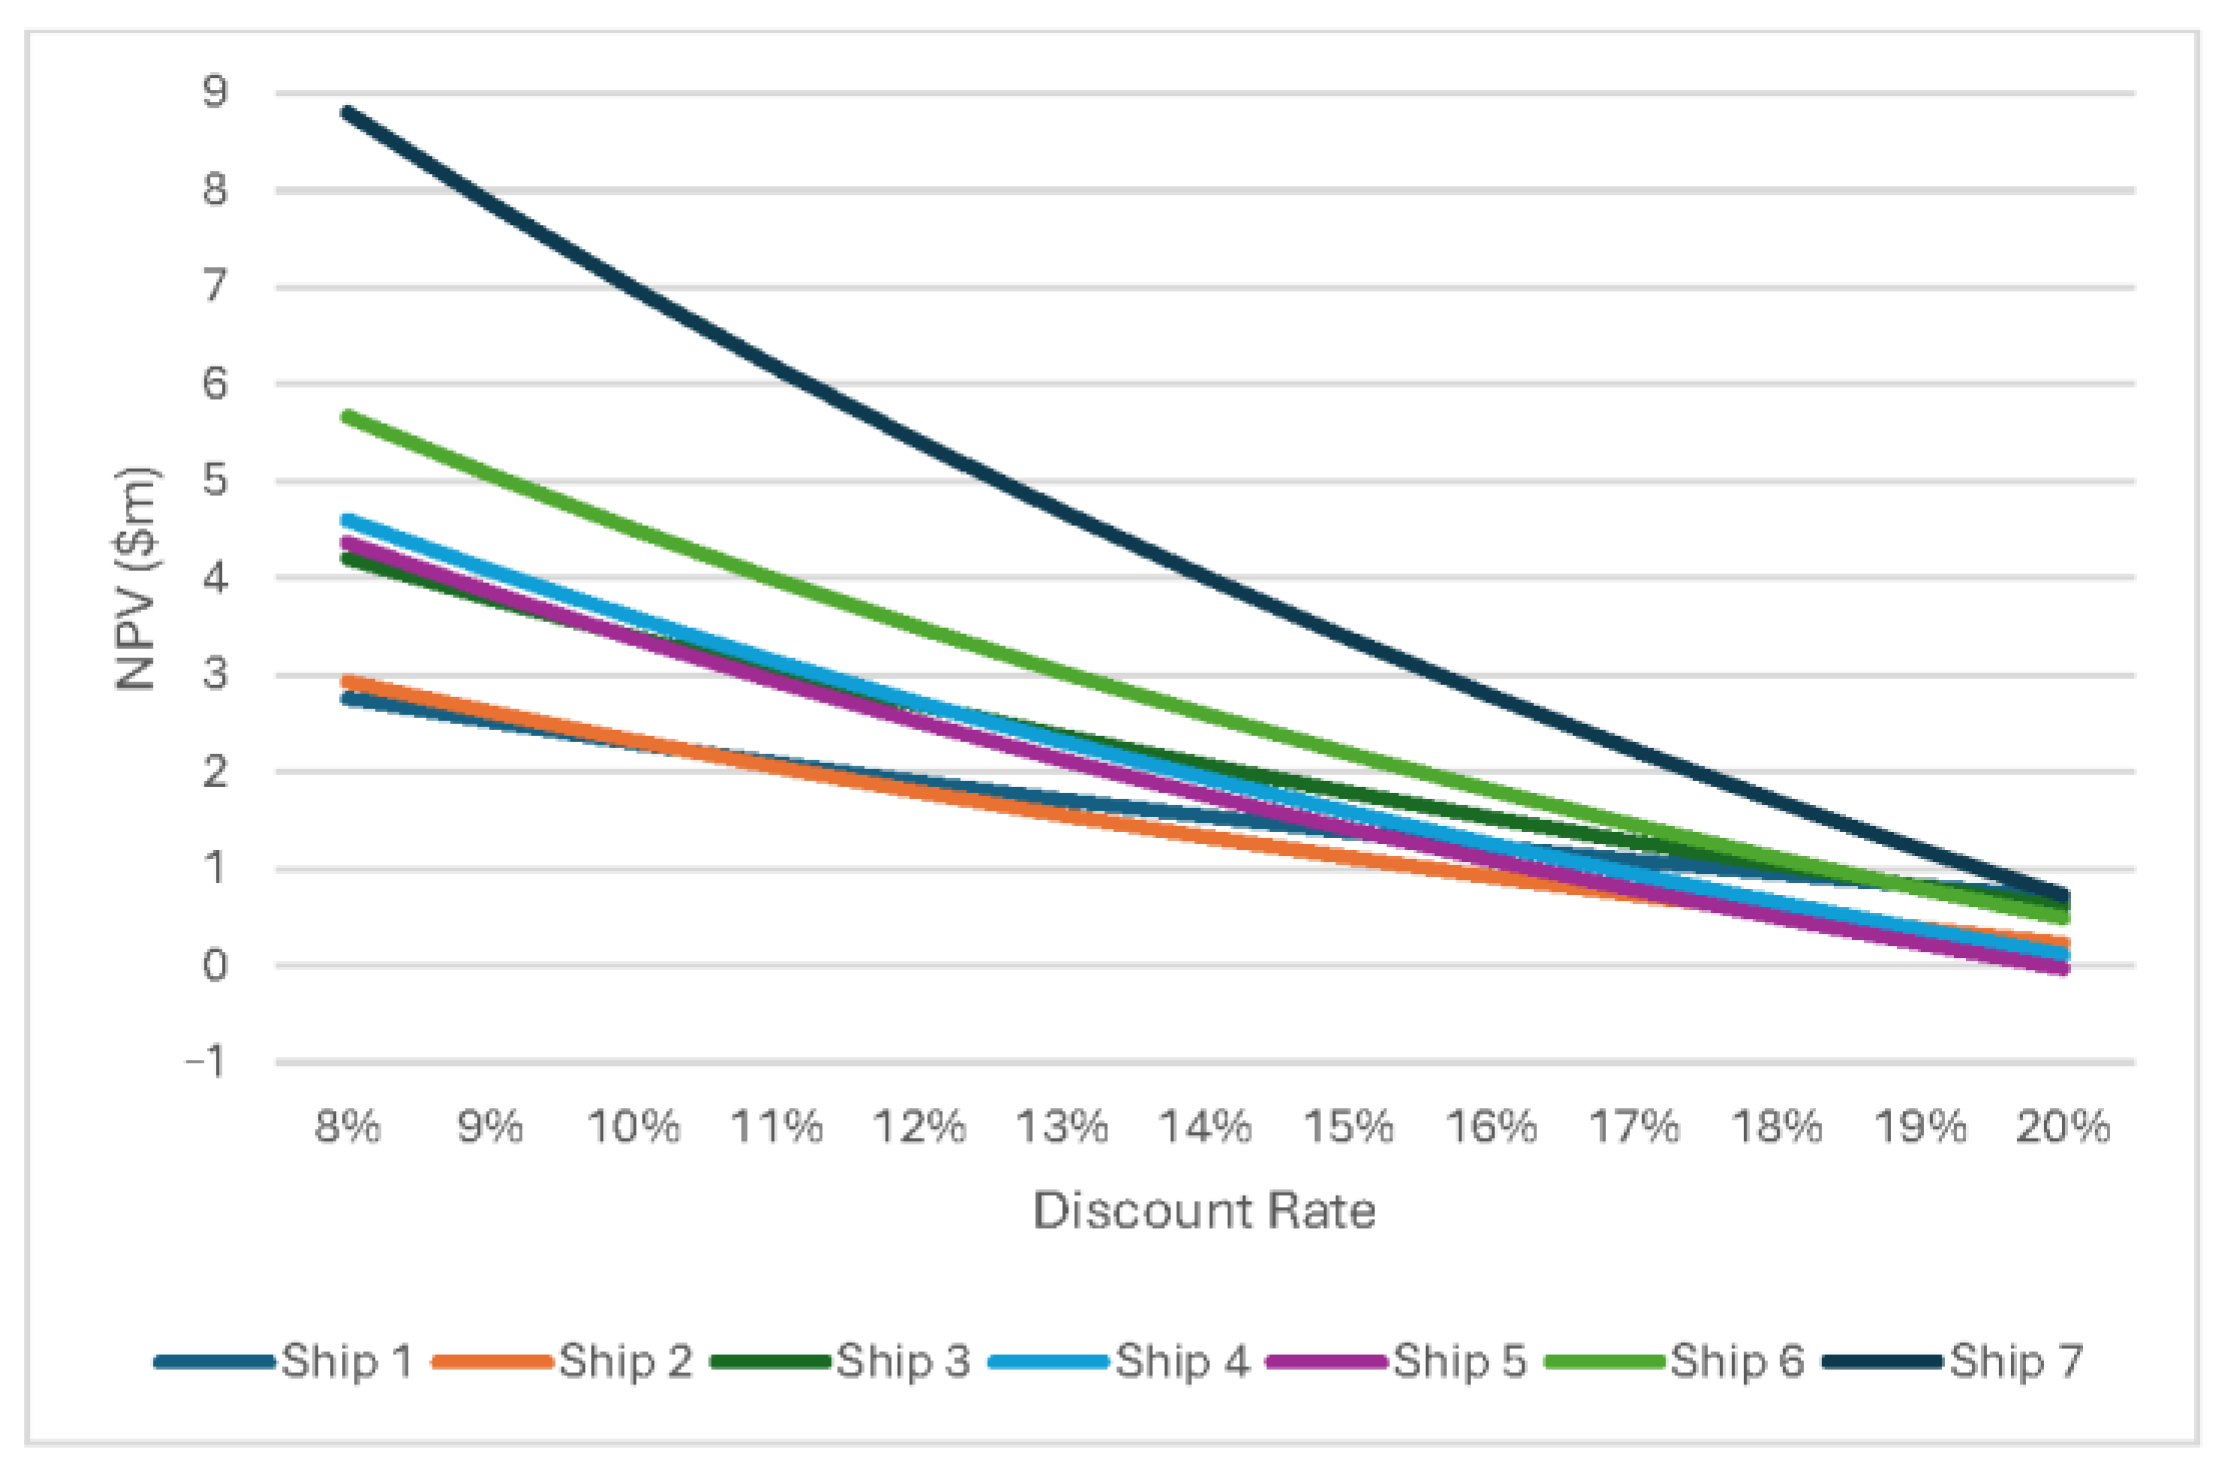
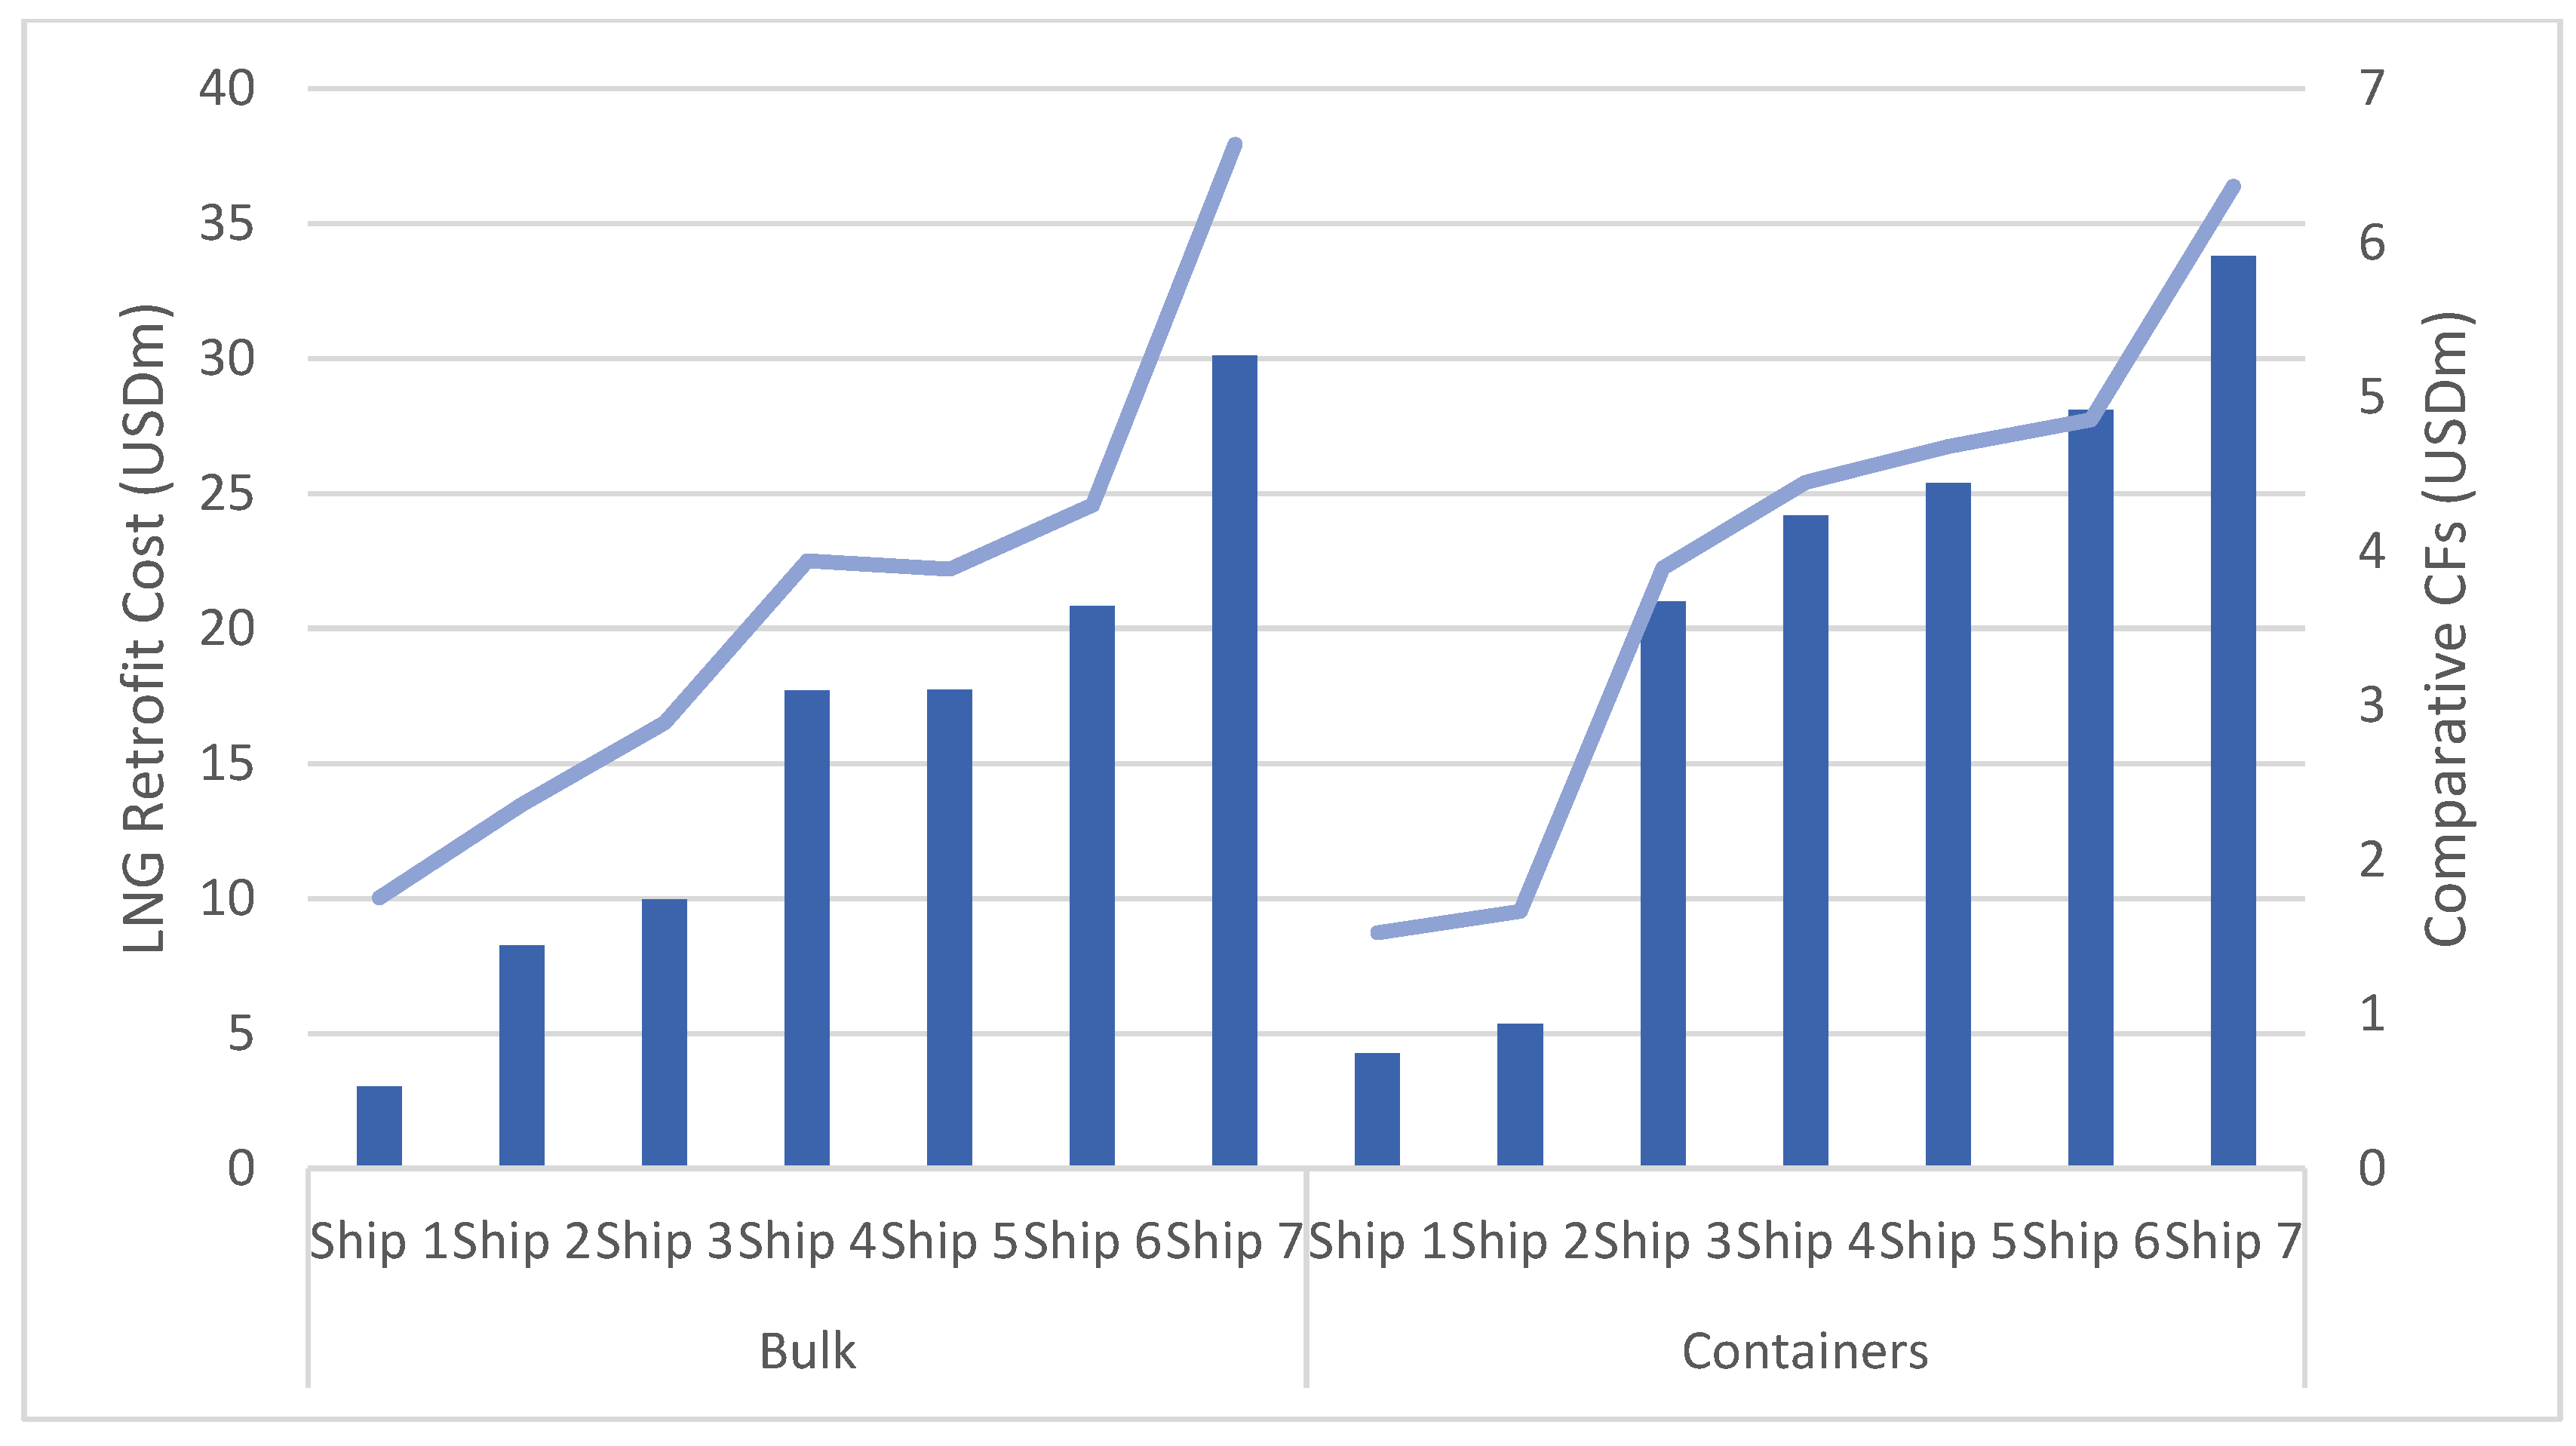
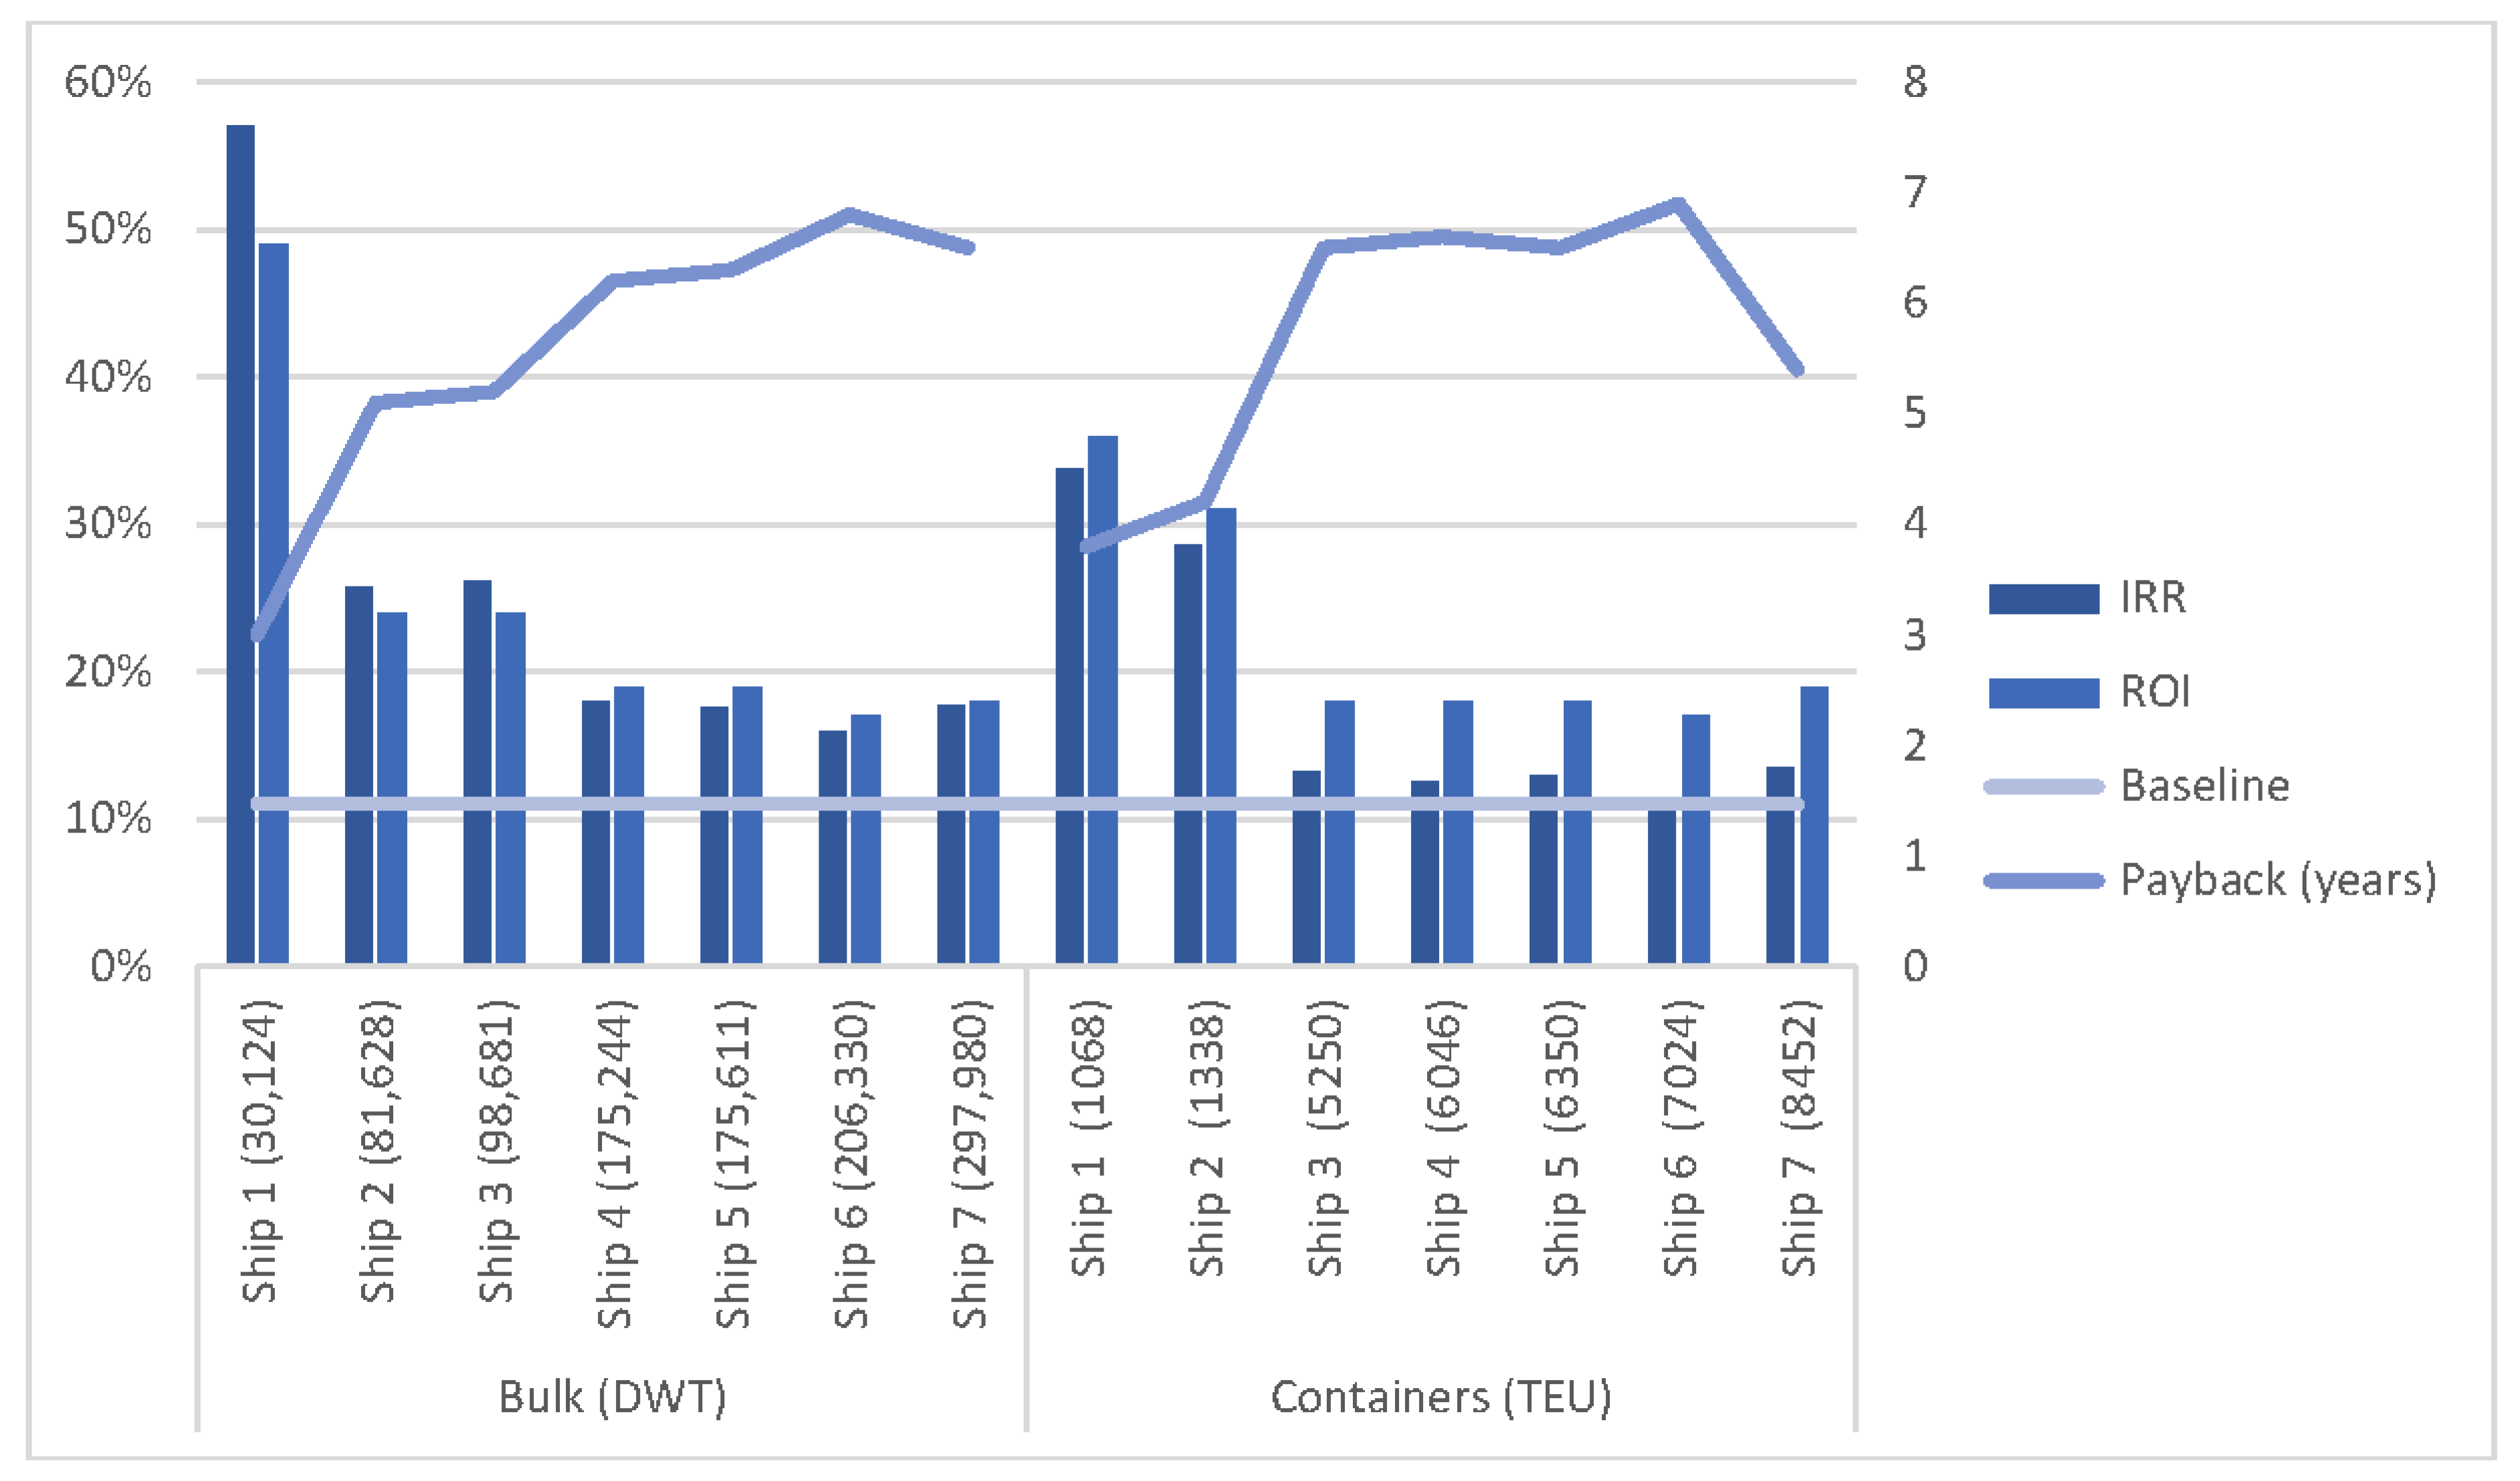
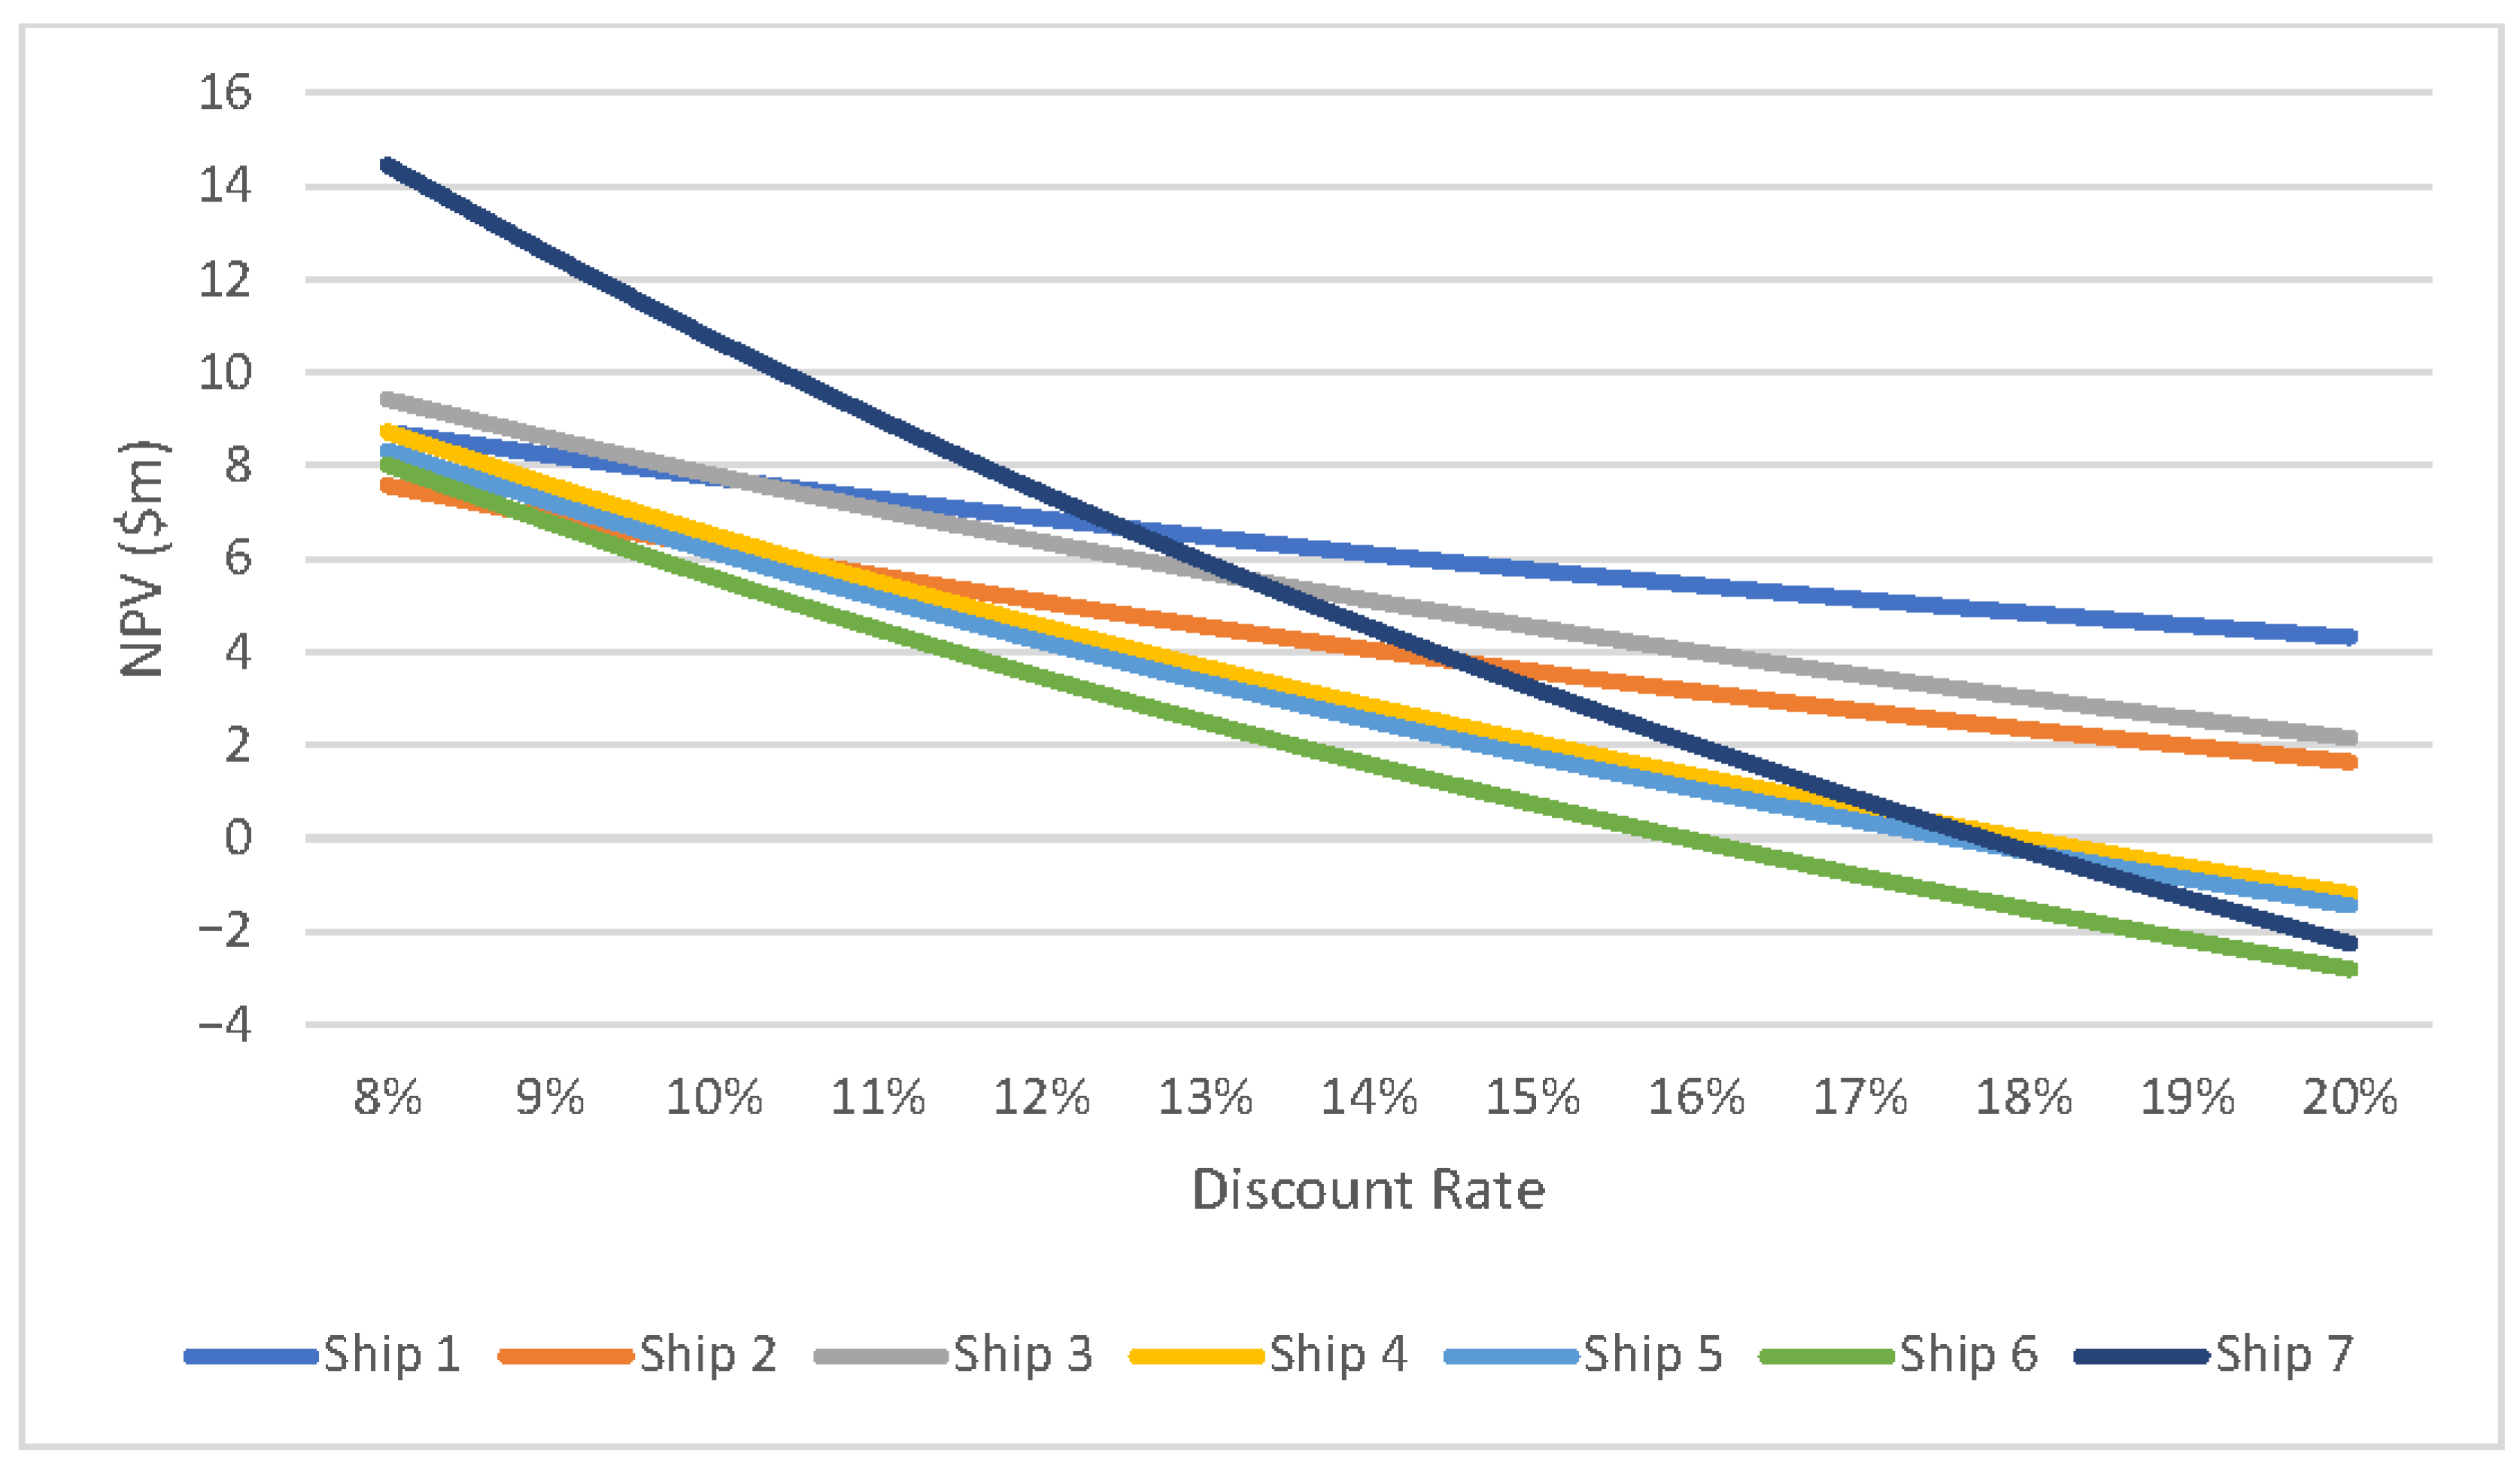
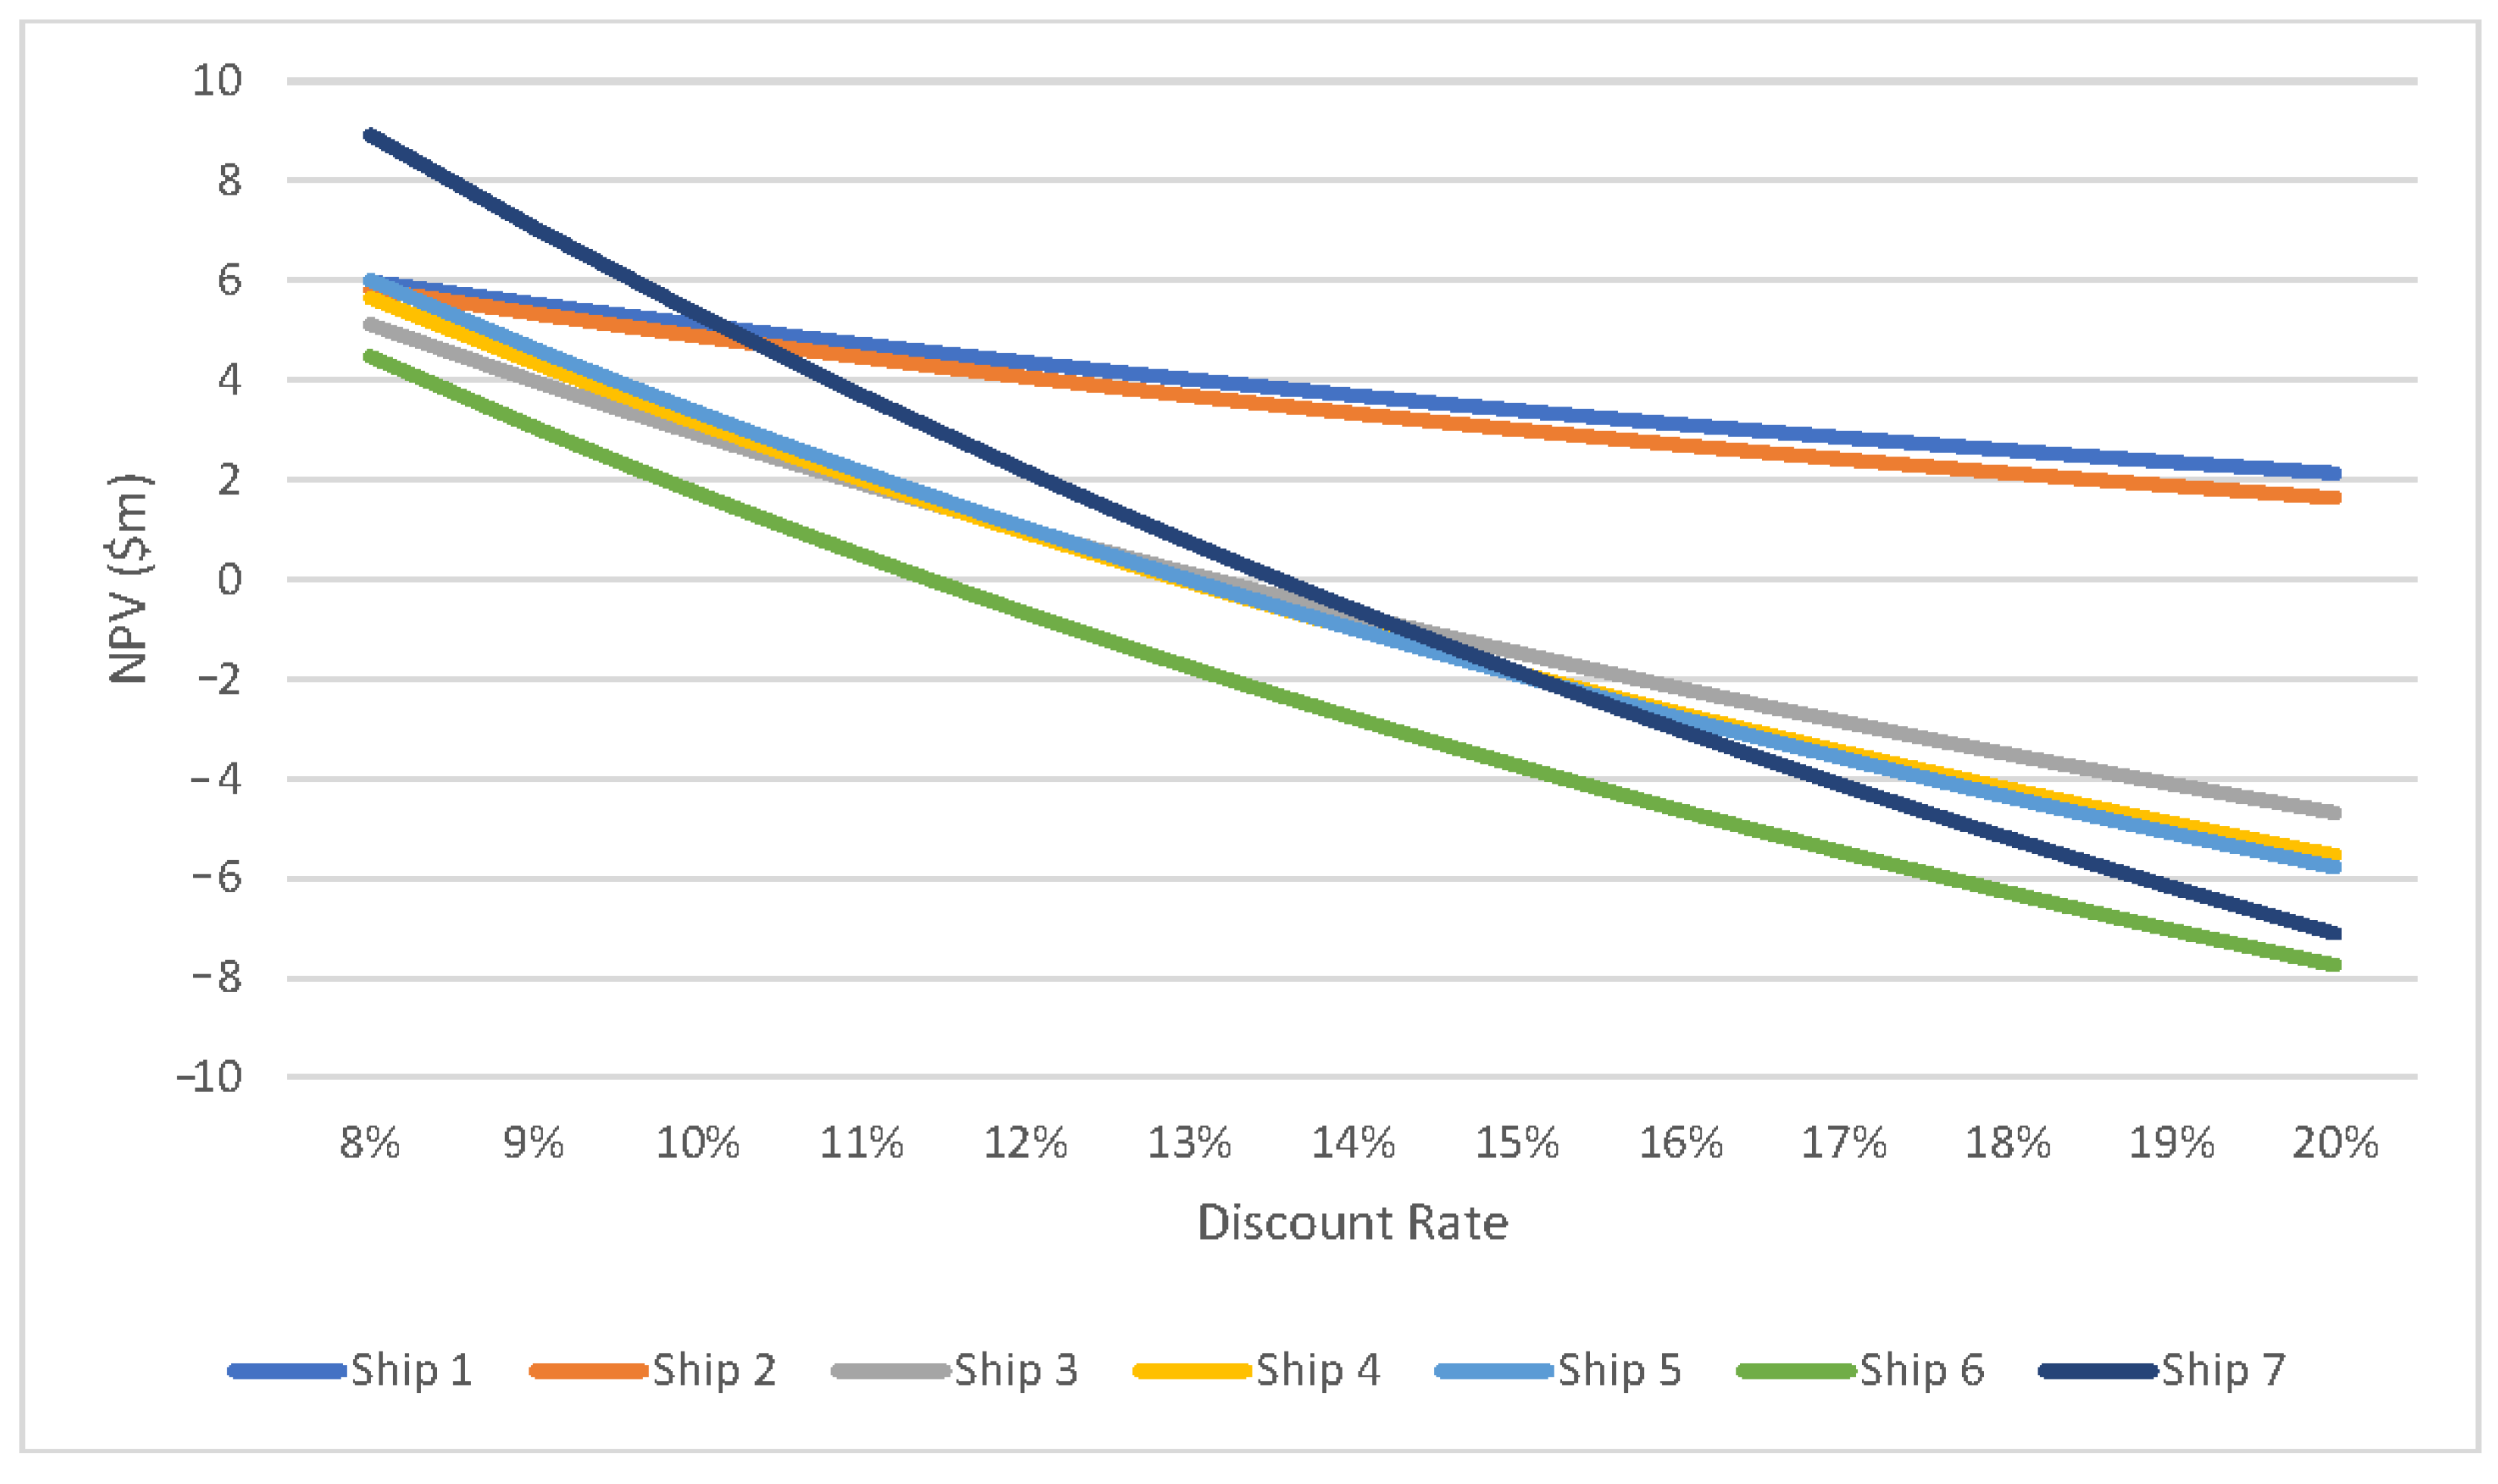

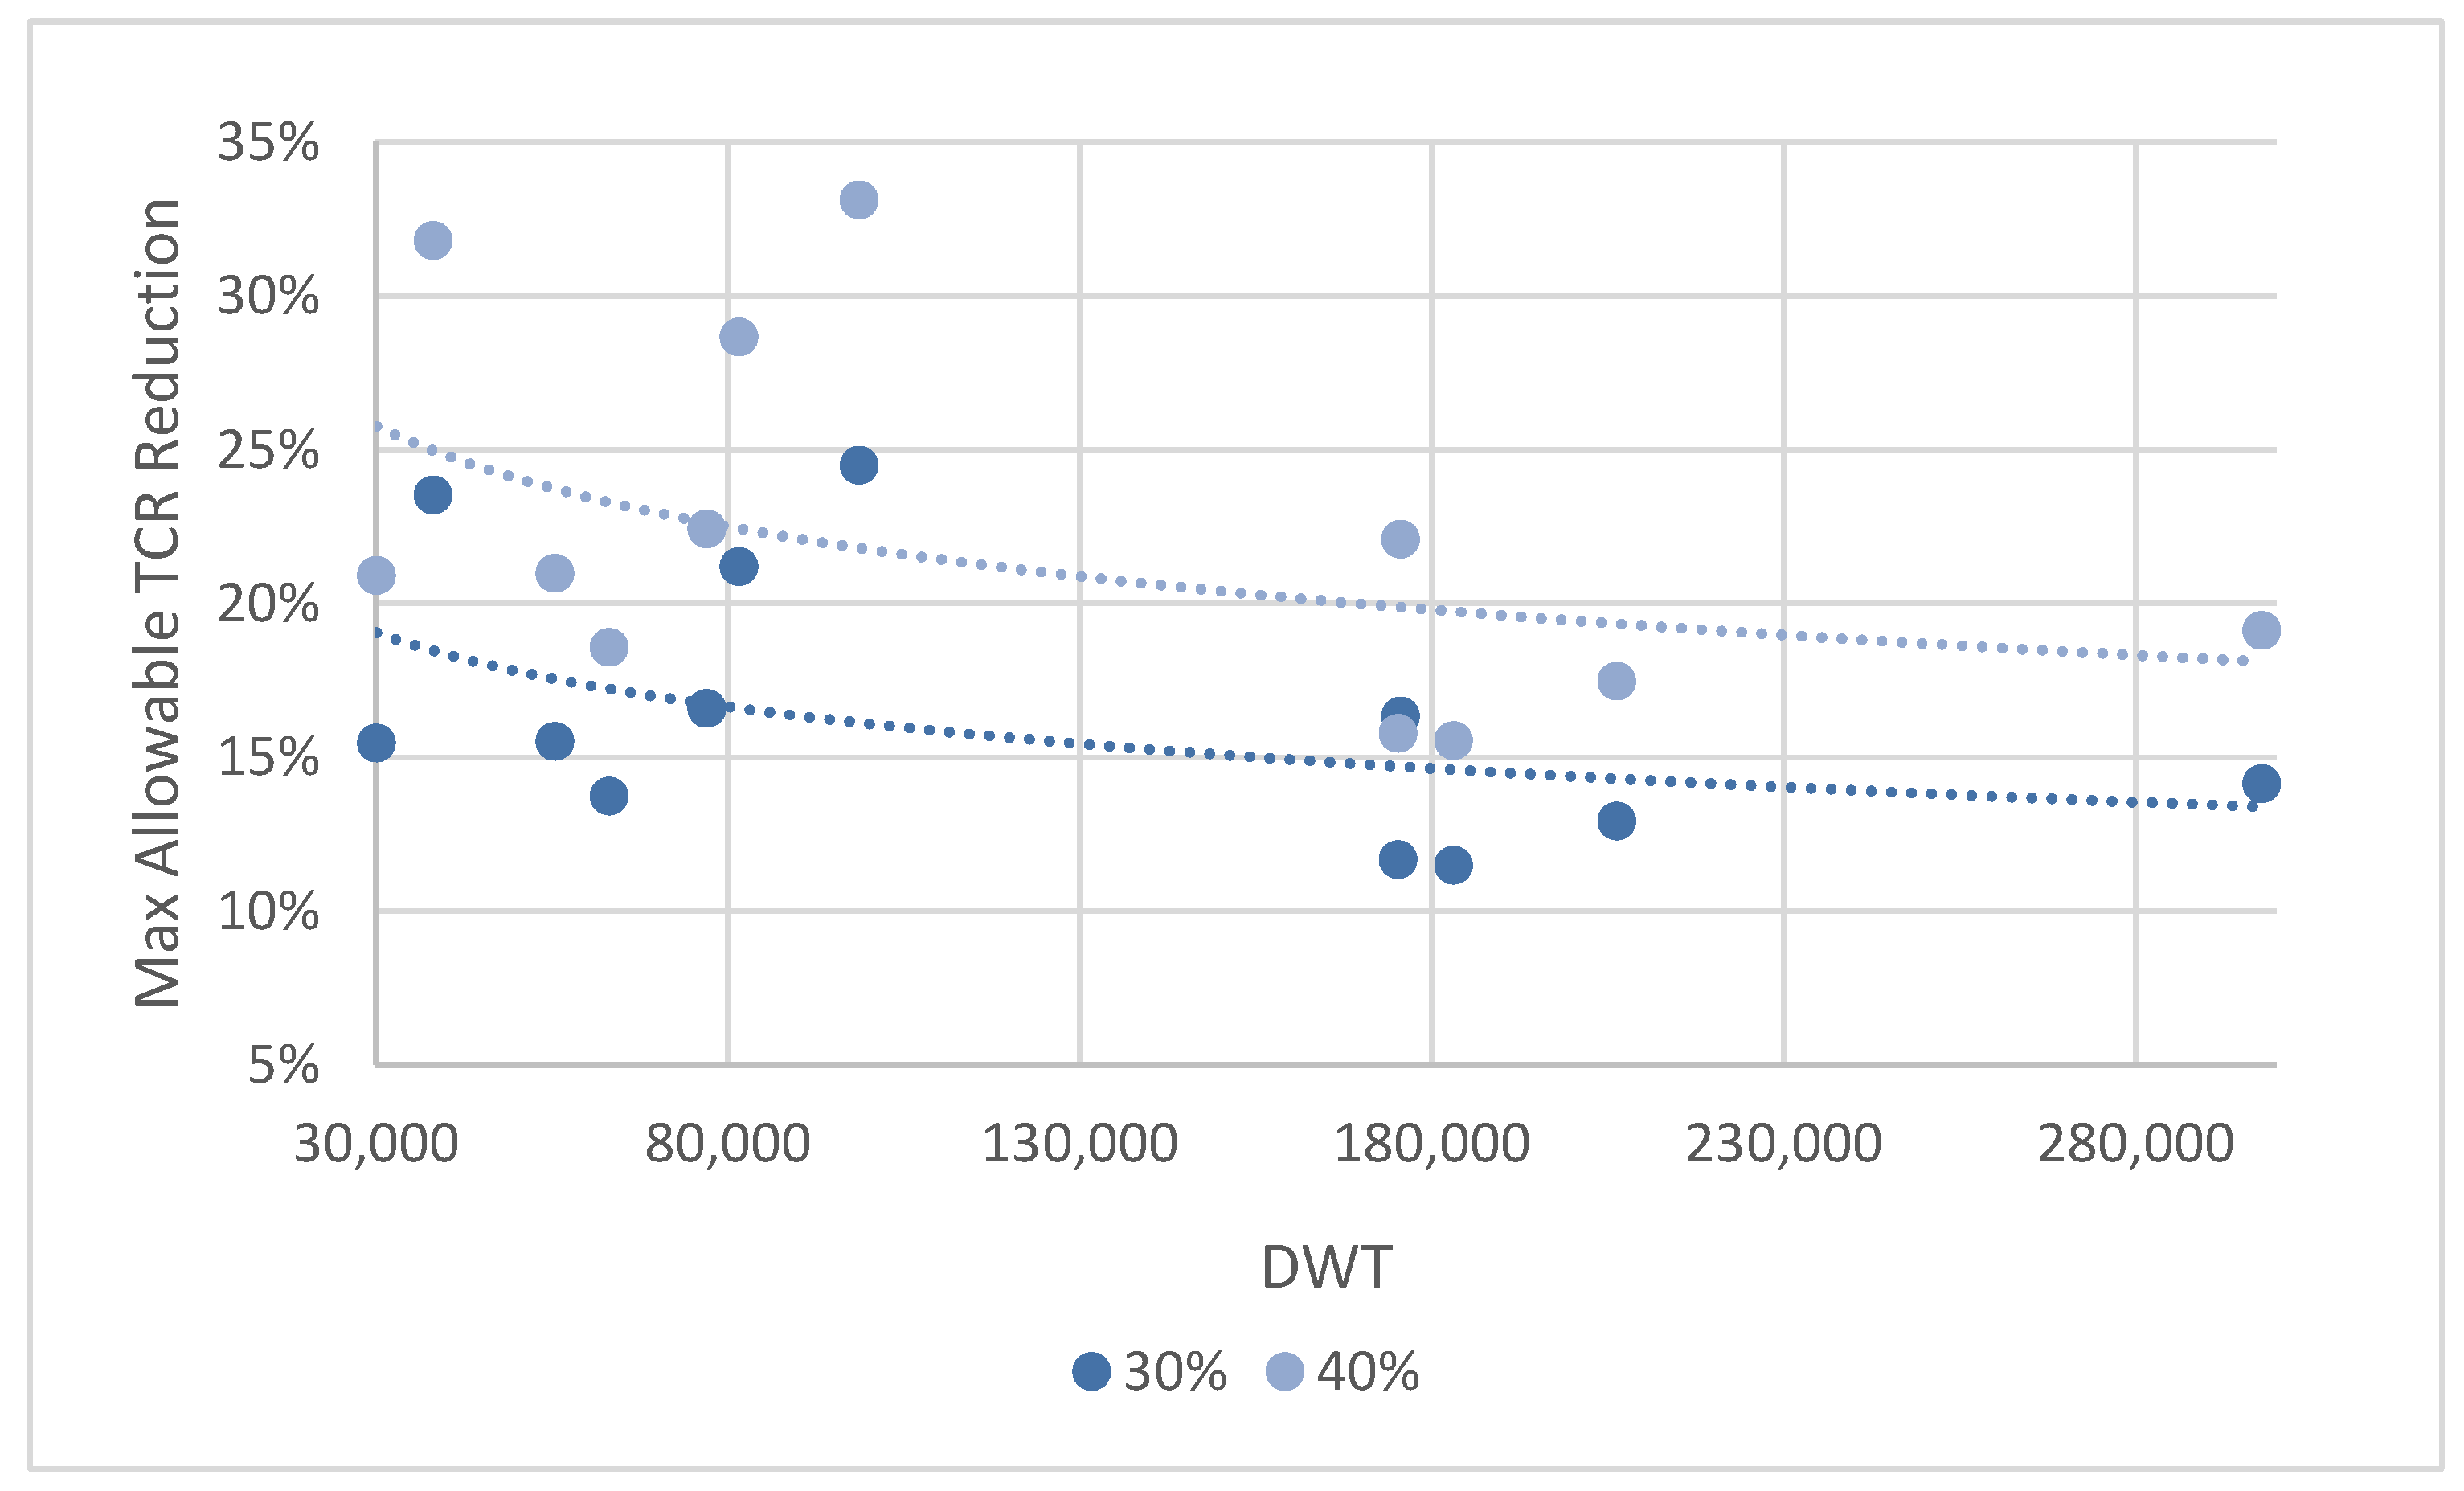
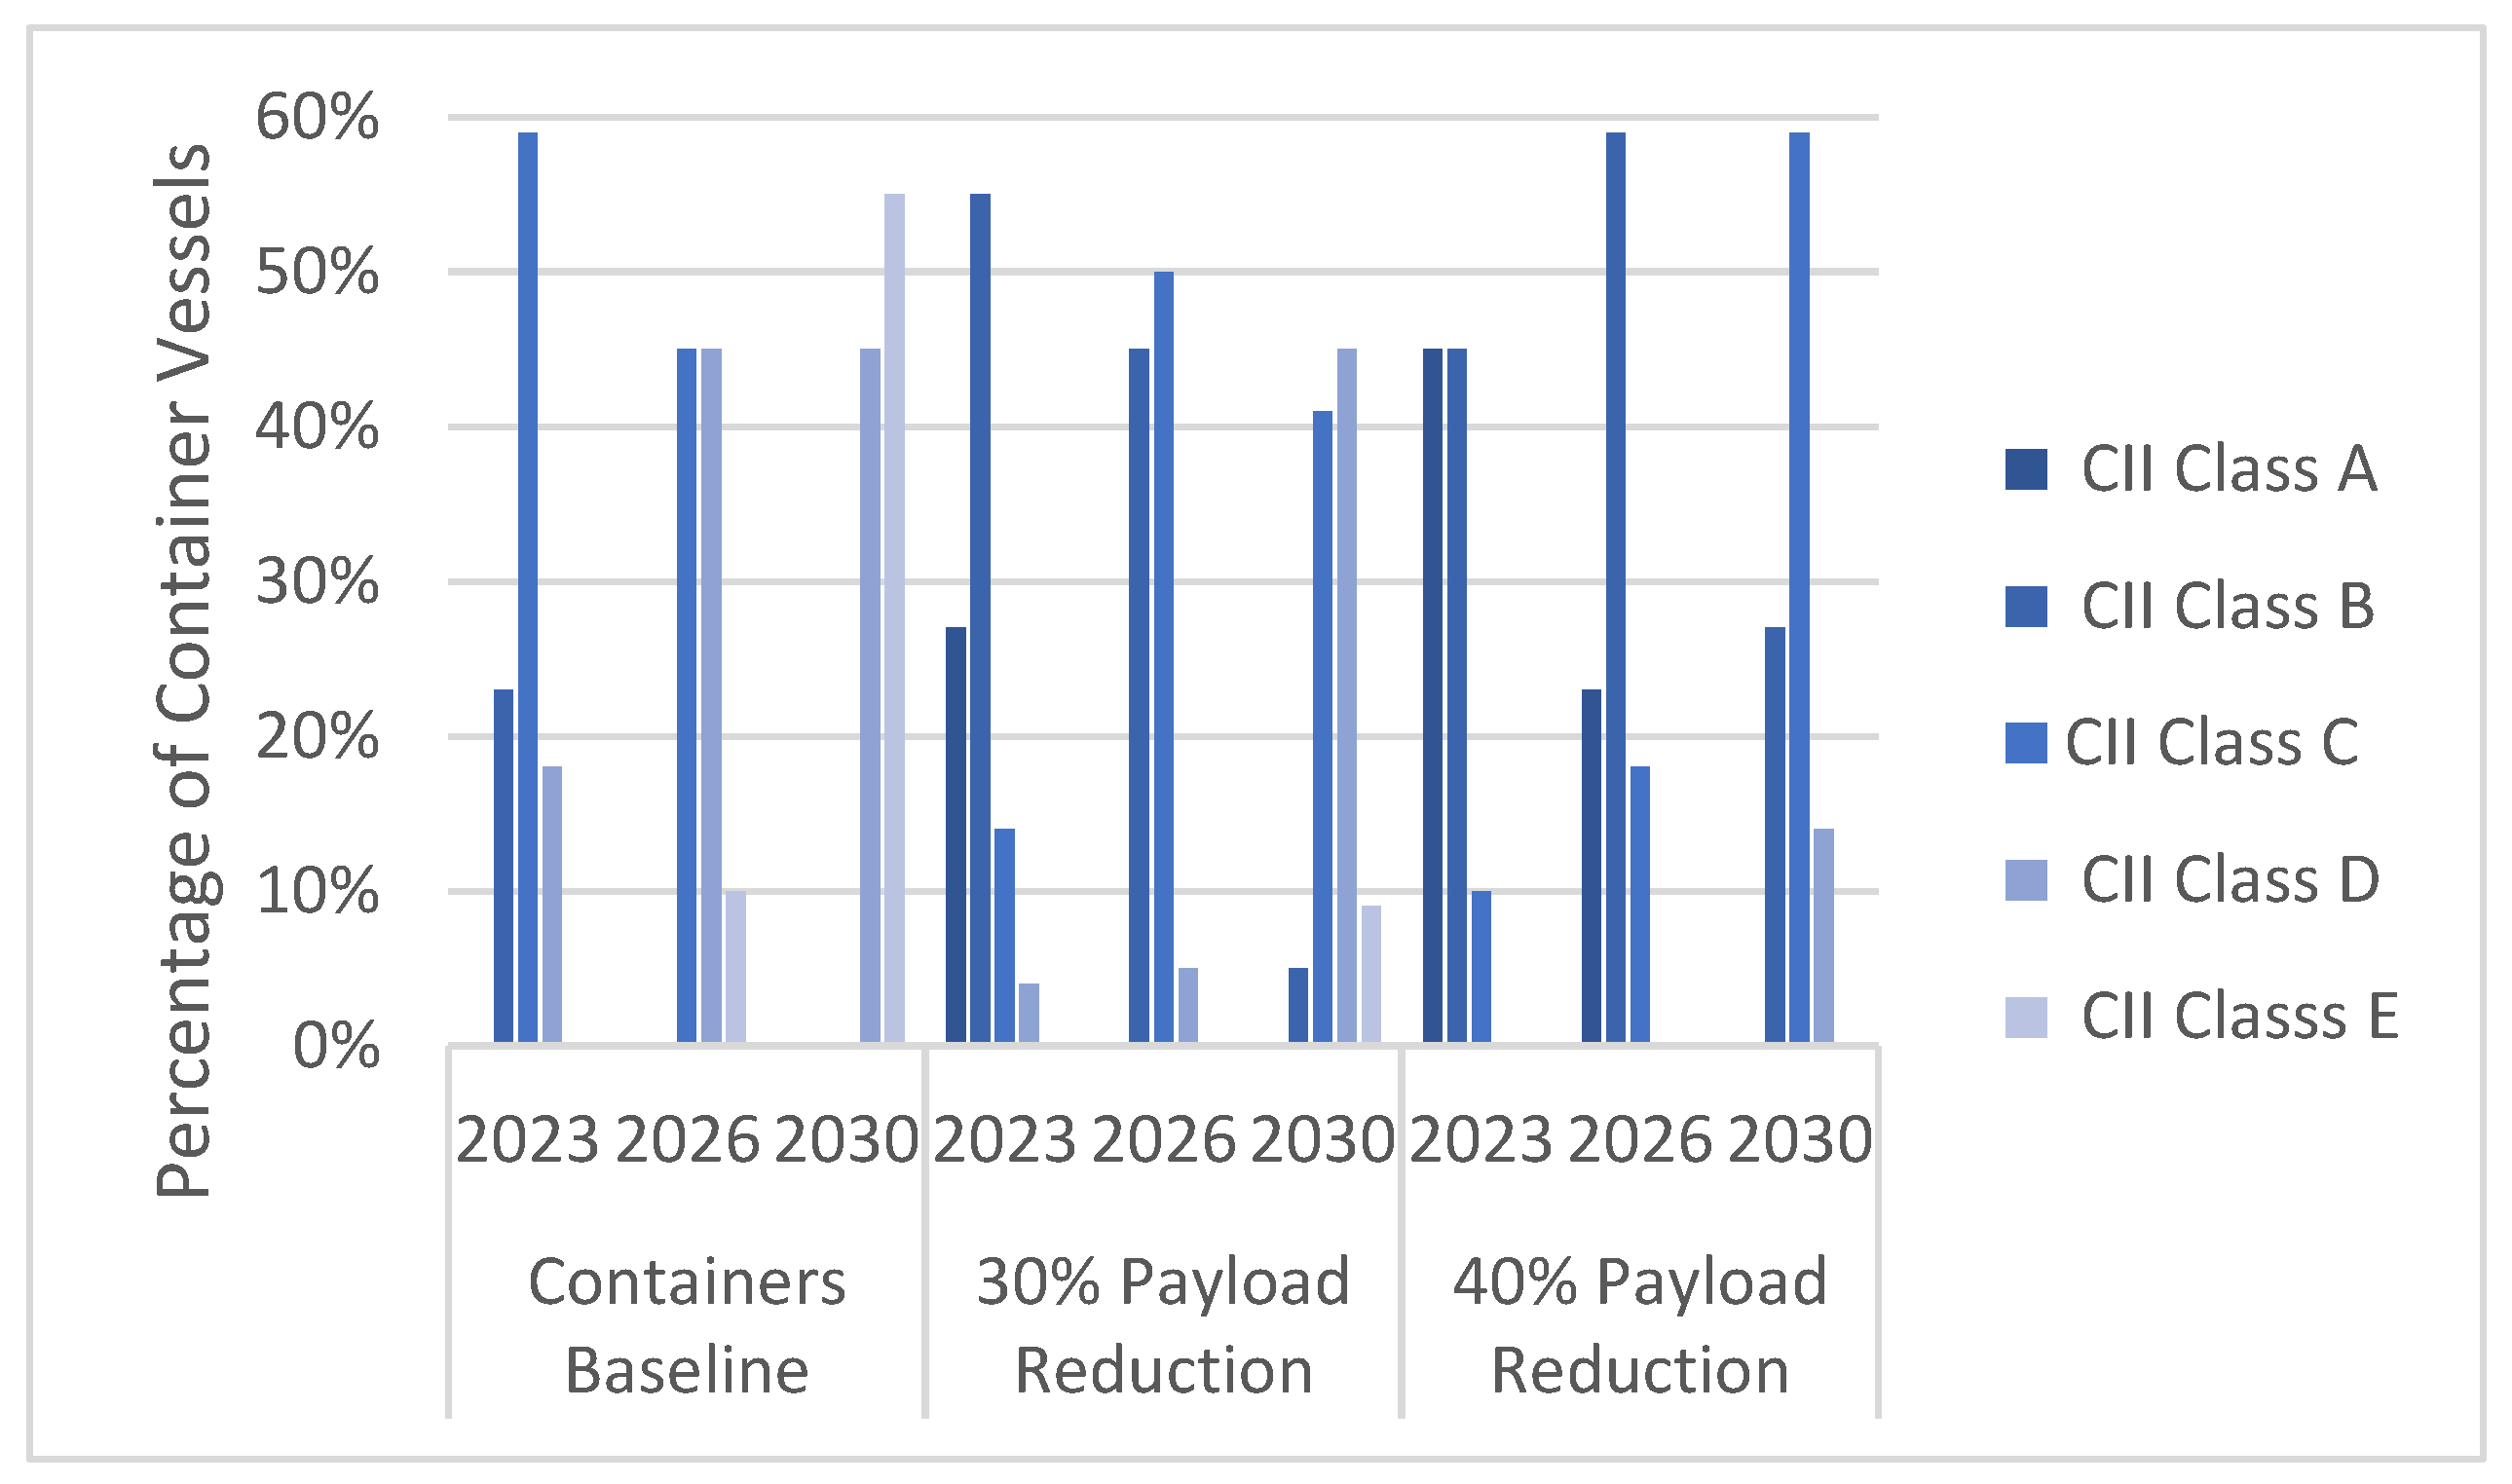

Disclaimer/Publisher’s Note: The statements, opinions and data contained in all publications are solely those of the individual author(s) and contributor(s) and not of MDPI and/or the editor(s). MDPI and/or the editor(s) disclaim responsibility for any injury to people or property resulting from any ideas, methods, instructions or products referred to in the content. |
© 2025 by the author. Licensee MDPI, Basel, Switzerland. This article is an open access article distributed under the terms and conditions of the Creative Commons Attribution (CC BY) license (https://creativecommons.org/licenses/by/4.0/).