


An Innovative Digital Platform for Socioeconomic Forecasting Climate Risks and Financial Management
 , , , , and
Abstract
1. Introduction
2. Literature Review
3. Methodology
3.1. Sample and Data
- Countries with low GDP per capita (Low income): less than USD 1026;
- Countries with below-average GDP per capita (Lower-middle income): USD 1026–3995;
- Countries with above-average GDP per capita (Upper-middle income): USD 3996–12,375;
- Countries with high GDP per capita (High income): more than USD 12,375.
- α—the predicted value of the indicator in the country that belongs to category i;
- βi—the factual basic value of the indicator in a country that belongs to category i;
- δ—forecast coefficient for the category of countries i.
- αj1—any variable from Table 1;
- b—constant;
- c—regression coefficient with each variable in Table 1, apart from αj1;
- j—sequence number of the variable from Table 1;
- k—total number of factor variables (8), which are considered in the model (2), from Table 2.
3.2. Measures of Variables
3.3. Approach and Data Analysis Procedure
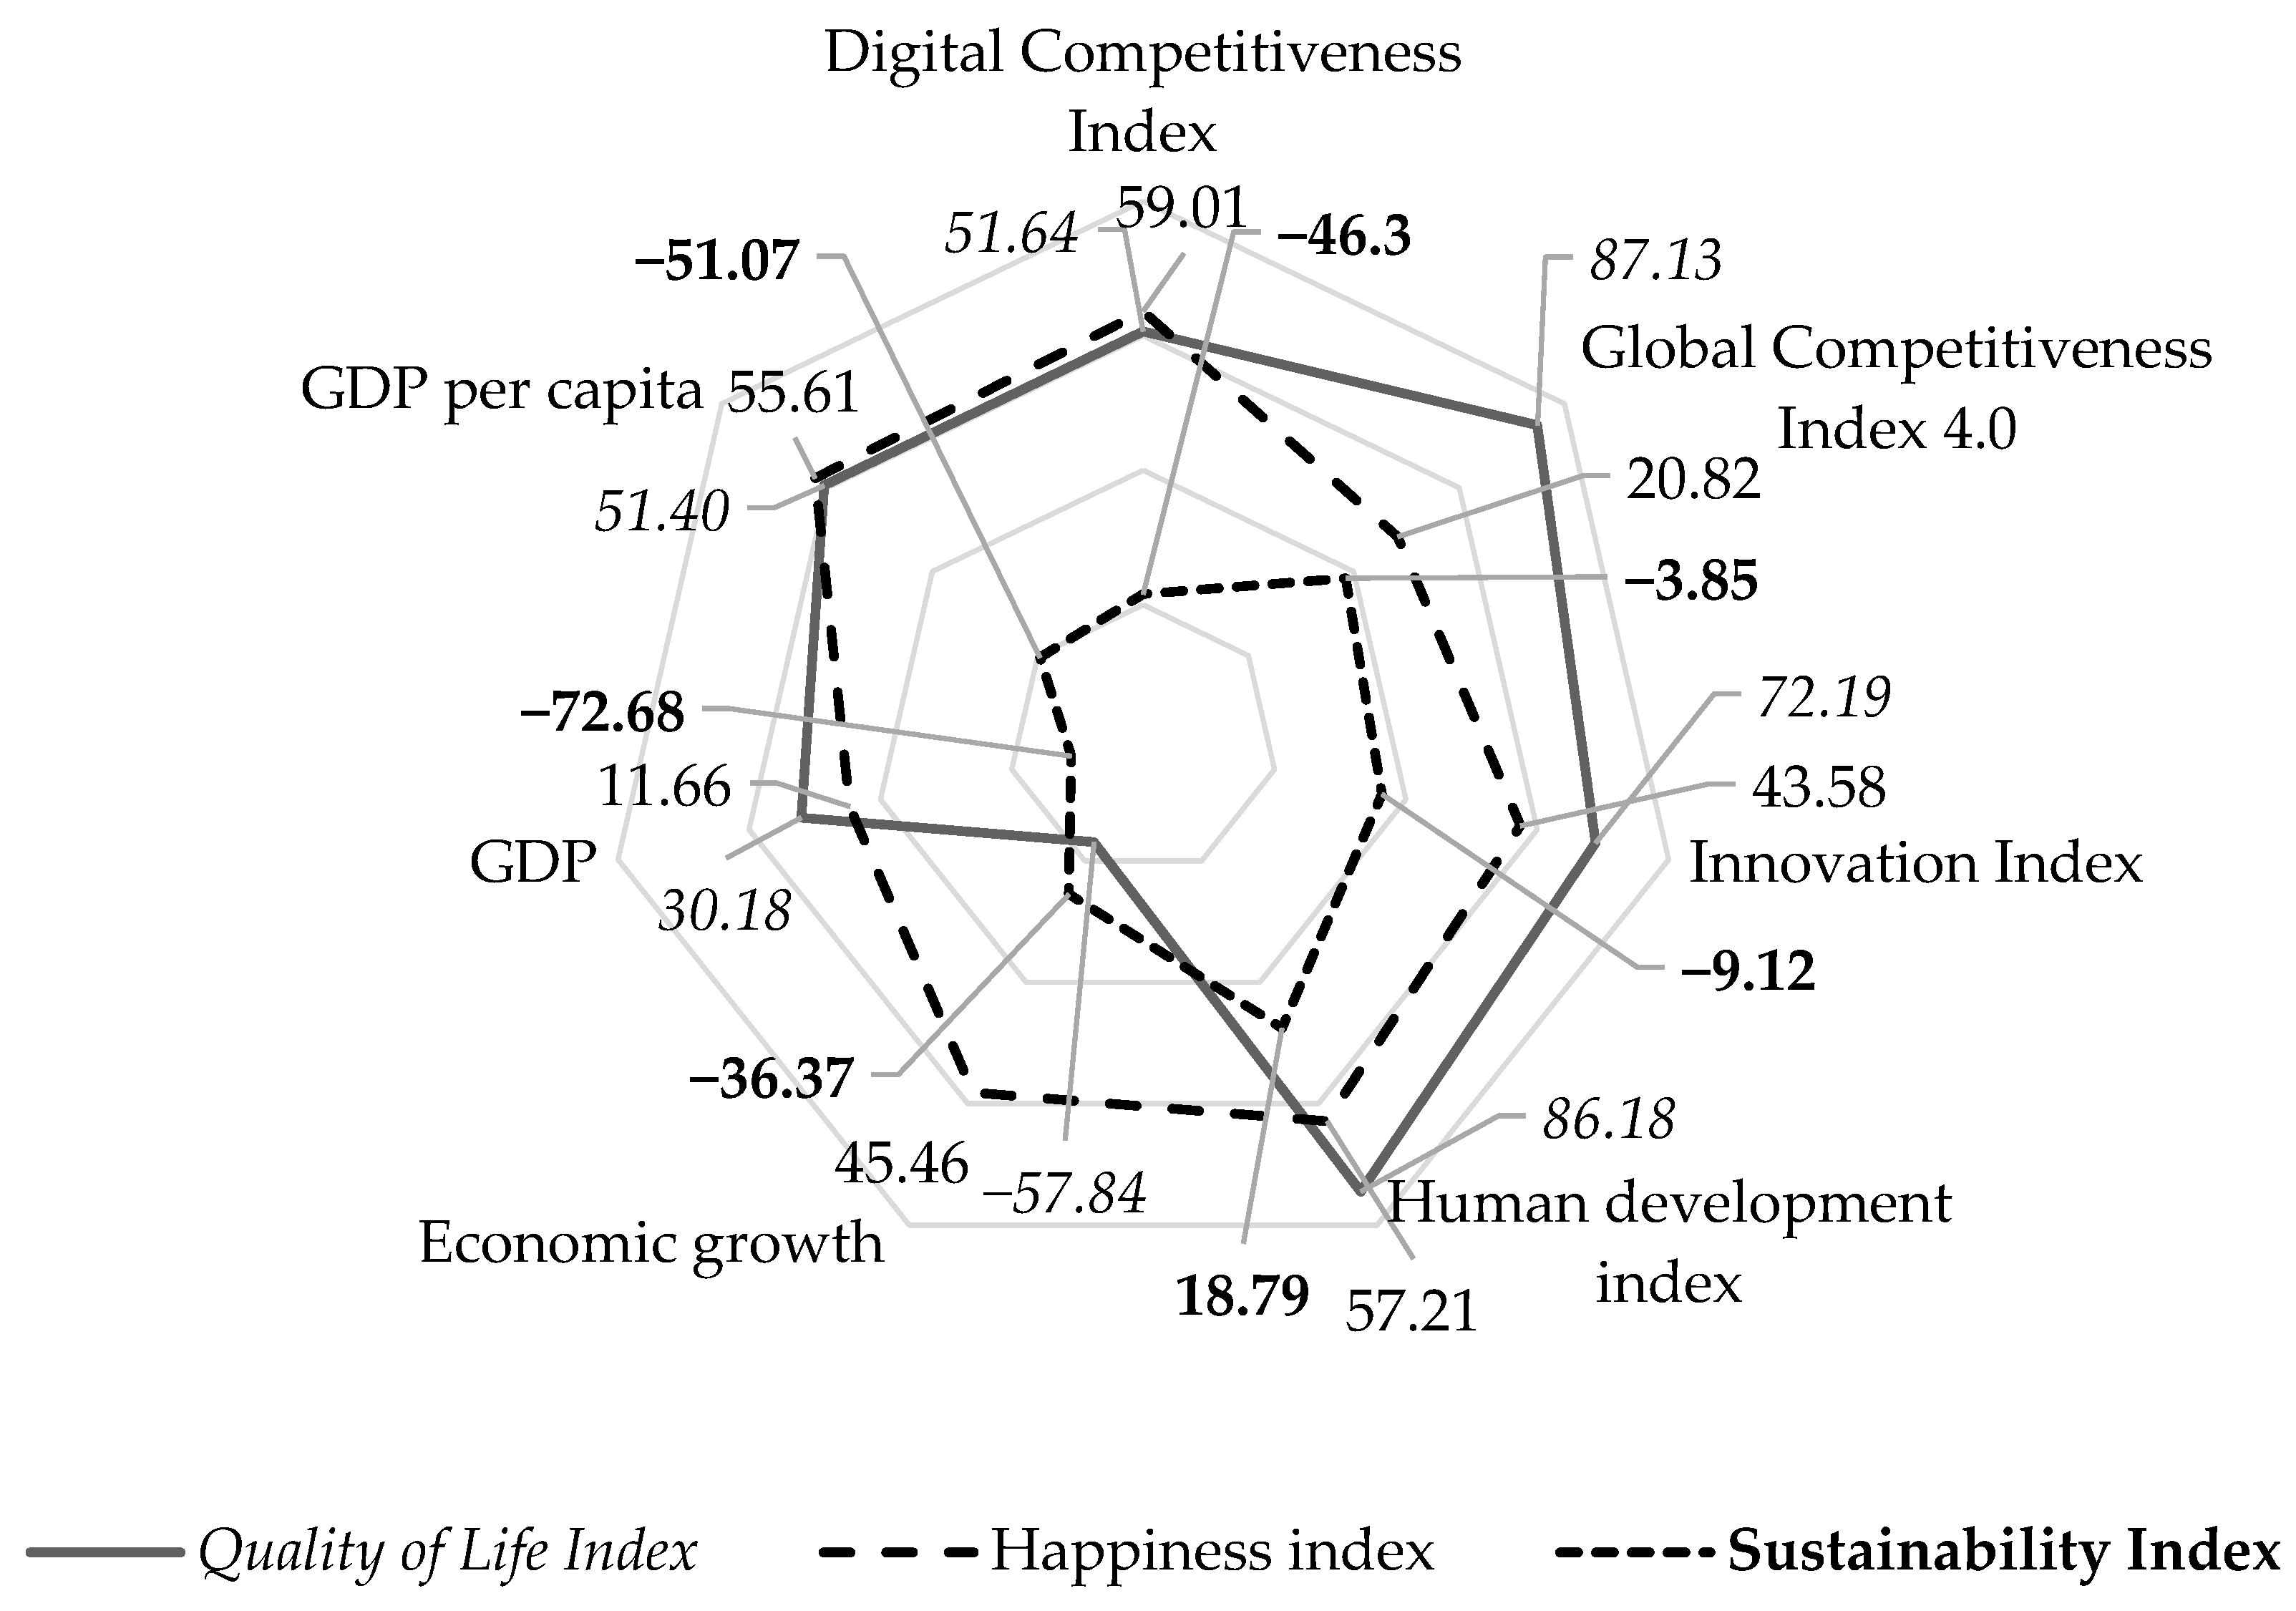
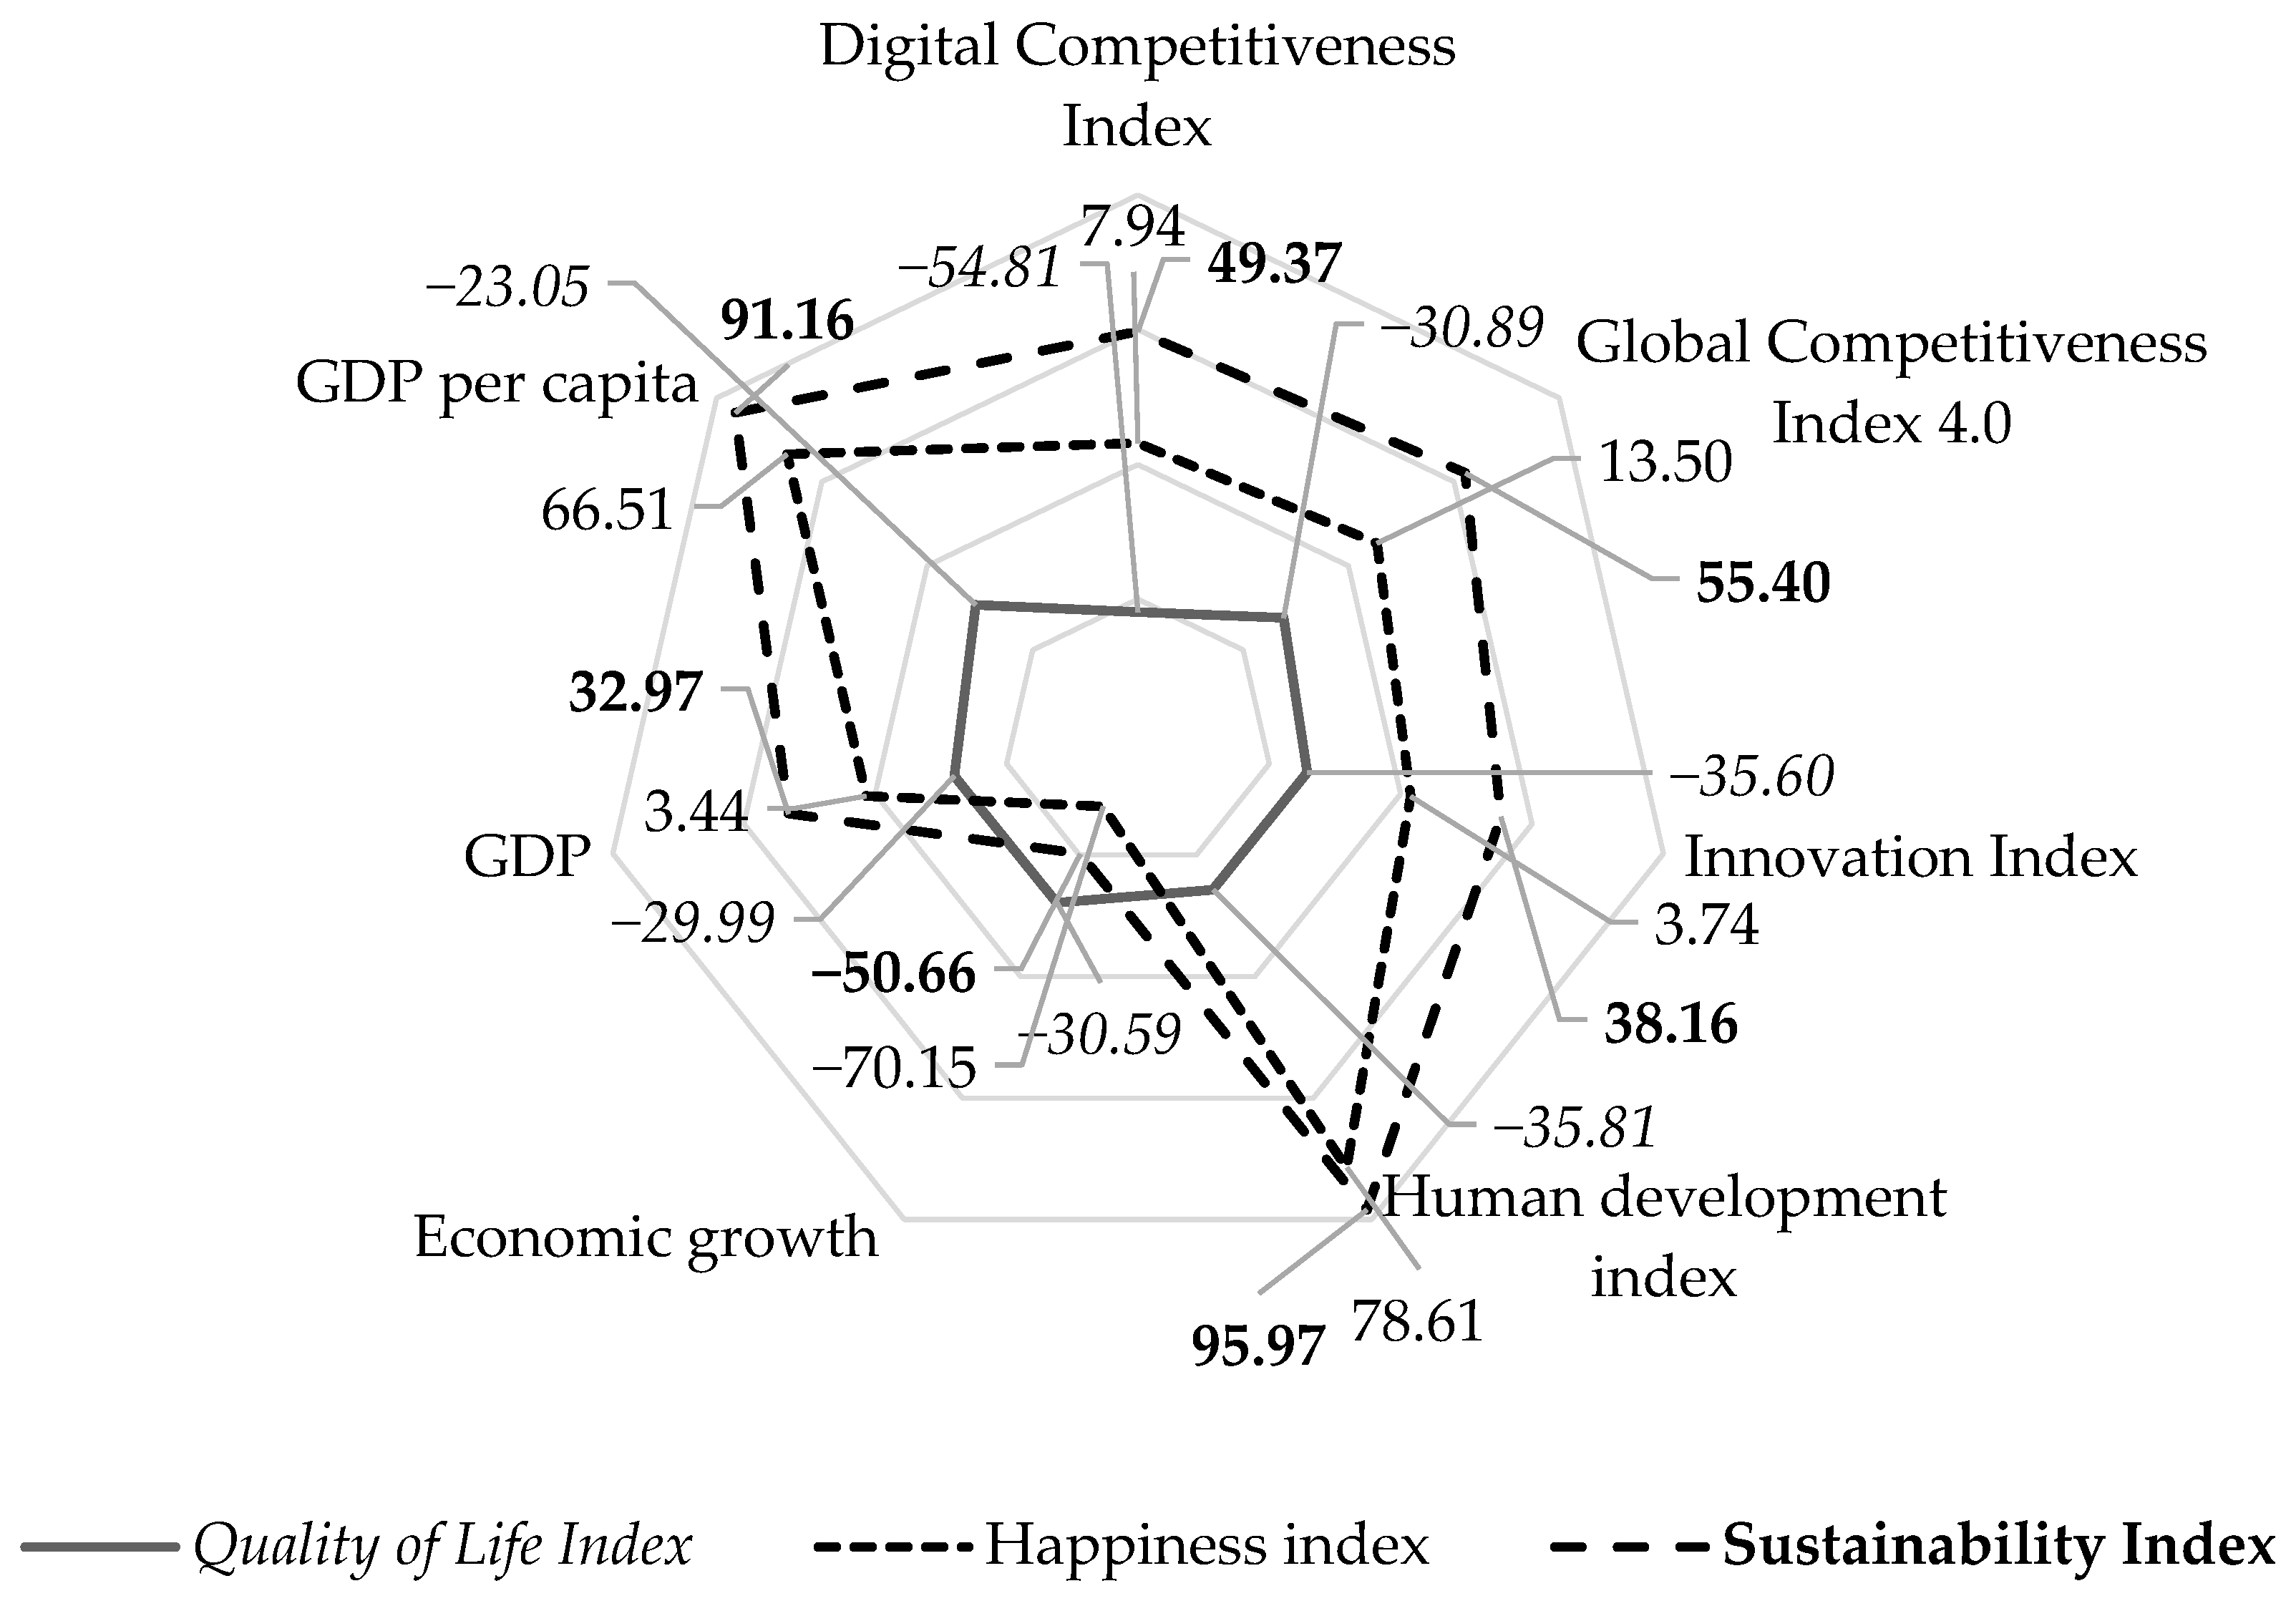
4. Results
- Digital Competitiveness Index;
- Global Competitive Index 4.0.
- Innovation Index;
- Human development index.
- Rate of economic growth;
- GDP;
- GDP per capita.
- Quality of life index;
- Index of happiness;
- Sustainable development index.
- -
- The dataset enables swift compilation of a diverse array of information with just a few clicks, facilitating the selection process and promoting enhanced decision-making;
- -
- The dataset offers valuable insights into the G7 and BRICS countries. By pinpointing the distinct factors that influence sustainable development within these nations, customized recommendations can be formulated to optimize the efficacy of economic management and foster sustainable growth.
5. Discussion
6. Conclusions
Author Contributions
Funding
Institutional Review Board Statement
Informed Consent Statement
Data Availability Statement
Conflicts of Interest
References
- Ang, A.-M., & Seng, K. P. (2016). Big sensor data applications in urban environments. Big Data Research, 4, 1–12. [Google Scholar] [CrossRef]
- Asem, N., Ramadan, A., Hassany, M., Ghazy, R. M., Abdallah, M., Ibrahim, M., Gamal, E. M., Hassan, S., Kamal, N., & Zaid, H. (2021). Pattern and determinants of COVID-19 infection and mortality across countries: An ecological study. Heliyon, 7(7), e07504. [Google Scholar] [CrossRef] [PubMed]
- Batko, K., & Ślęzak, A. (2022). The use of big data analytics in healthcare. Journal of Big Data, 9(1), 3. [Google Scholar] [CrossRef] [PubMed]
- Battaglia, F., Cervellati, E. M., Salerno, D., Stella, G. P., & Vannoni, V. (2024). How the COVID-19 pandemic changed Italians’ financial risk tolerance. Qualitative Research in Financial Markets, 17(2), 415–431. [Google Scholar] [CrossRef]
- Bedianashvili, G. (2021). Macroeconomic and cultural determinants of the COVID-19 pandemic crisis. Bulletin of the Georgian National Academy of Sciences, 15(2), 191–197. [Google Scholar] [CrossRef]
- Belaïd, F., & Amine, R. (2025). Globalization, climate change, and compound health risks in the era of COVID-19 pandemic: The case of the GCC. In Climate-resilient cities (pp. 219–234). Contributions to Economics, Part F3776. Springer. [Google Scholar] [CrossRef]
- Benati, I., & Coccia, M. (2022). Global analysis of timely COVID-19 vaccinations: Improving governance to reinforce response policies for pandemic crises. International Journal of Health Governance, 27(3), 240–253. [Google Scholar] [CrossRef]
- Berti, K., Bienvenido-Huertas, D., Rubio-Bellido, C., & Romero-Recuero, I. (2025). Changing climate in Italian cities and Italian building regulations: Analysis focused on future climate change scenarios. Urban Climate, 61, 102408. [Google Scholar] [CrossRef]
- Bibri, S. E. (2018). Data science for urban sustainability: Data mining and data-analytic thinking in the next wave of city analytics. In Smart sustainable cities of the future (pp. 189–246). Urban Book Series. Springer Nature. [Google Scholar] [CrossRef]
- Burkart, C., Besiou, M., & Wakolbinger, T. (2016). The funding—Humanitarian supply chain interface. Surveys in Operations Research and Management Science, 21(2), 31–45. [Google Scholar] [CrossRef]
- Cardillo, G., & Chiappini, H. (2022). The credit risk of sustainable firms during the pandemic. Global Business Review, 23(6), 1462–1480. [Google Scholar] [CrossRef]
- Chen, K., Song, Y.-y., Pan, J.-f., & Yang, G.-l. (2020). Measuring destocking performance of the Chinese real estate industry: A DEA-Malmquist approach. Socio-Economic Planning Sciences, 69, 100691. [Google Scholar] [CrossRef]
- Coccia, M. (2021). Preparedness of countries to face COVID-19 pandemic crisis: Strategic positioning and underlying structural factors to support strategies of prevention of pandemic threats. Environmental Research, 203, 111678. [Google Scholar] [CrossRef] [PubMed]
- Cui, Y., Ma, Z., Wang, L., Kong, S., & Wang, H. (2023). A survey on big data-enabled innovative online education systems during the COVID-19 pandemic. Journal of Innovation and Knowledge, 8(1), 100295. [Google Scholar] [CrossRef]
- Culyer, A., Chalkidou, K., Teerawattananon, Y., & Santatiwongchai, B. (2018). Rival perspectives in health technology assessment and other economic evaluations for investing in global and national health. Who decides? Who pays? F1000Research, 7, 72. [Google Scholar] [CrossRef]
- Çelik, M. (2016). Network restoration and recovery in humanitarian operations: Framework, literature review, and research directions. Surveys in Operations Research and Management Science, 21(2), 47–61. [Google Scholar] [CrossRef]
- de la Barrera, E. (2016). COP-eration for global food security. F1000Research, 5, 2814. [Google Scholar] [CrossRef] [PubMed]
- Desogus, M., Sergi, E., & Zedda, S. (2024). The role of credit consortia in the financial structure of sardinian companies during the SARS-CoV-2 crisis. Risks, 12(12), 190. [Google Scholar] [CrossRef]
- Dubey, R., Bryde, D. J., Blome, C., Childe, S. J., & Foropon, C. (2024). Alliances and digital transformation are crucial for benefiting from dynamic supply chain capabilities during times of crisis: A multi-method study. International Journal of Production Economics, 269, 109166. [Google Scholar] [CrossRef]
- Emmanuel, T., Maupong, T., Mpoeleng, D., Semong, T., Mphago, B., & Tabona, O. (2021). A survey on missing data in machine learning. Journal of Big Data, 8(1), 140. [Google Scholar] [CrossRef]
- Ergasheva, S. T., Zinovyeva, I. S., Abdurashitov, A. A., Kopytina, Y. A., & Makarova, T. V. (2023). ESG investments in support of the development of the green economy in russia and central Asia. In ESG management of the development of the green economy in central Asia (pp. 419–428). Environmental Footprints and Eco-Design of Products and Processes, Part F1766. Springer. [Google Scholar] [CrossRef]
- Feng, K., Yang, Z., Zhuo, Y., Wang, B., & Liu, Z. (2024). Impact of carbon tax on renewable energy development and environmental–economic synergies. Energies, 17(21), 5347. [Google Scholar] [CrossRef]
- Fertő, I., & Harangozó, G. (2025). Trade-offs and synergies when balancing economic growth and globalization for sustainable development goals achievement. Scientific Reports, 15(1), 8634. [Google Scholar] [CrossRef]
- Fiorillo, P., Meles, A., Salerno, D., & Verdoliva, V. (2024). Geopolitical turmoil and investor green preference: Evidence from the corporate bond market. Journal of International Money and Finance, 149, 103218. [Google Scholar] [CrossRef]
- Gorman, M. F. (2016). A “Metasurvey” analysis in operations research and management science: A survey of literature reviews. Surveys in Operations Research and Management Science, 21(1), 18–28. [Google Scholar] [CrossRef]
- Guan, X., Huang, H., Ke, X., Cheng, X., Zhang, H., Chen, A., Qiu, G., Wu, H., & Wei, C. (2025). Monitoring, modeling, and forecasting long-term changes in coastal seawater quality due to climate change. Nature Communications, 16(1), 2616. [Google Scholar] [CrossRef] [PubMed]
- Håkansson, A. (2021). Gambling and self-reported changes in gambling during COVID-19 in web survey respondents in Denmark. Heliyon, 7(7), e07506. [Google Scholar] [CrossRef] [PubMed]
- Horvey, S. S., & Odei-Mensah, J. (2025). Towards economic growth in Sub-Saharan Africa: Is there a synergy between insurance market development and ICT diffusion? Information Technology for Development, 31(1), 178–205. [Google Scholar] [CrossRef]
- IMD. (2025). World digital competitiveness ranking 2021. Available online: https://www.imd.org/centers/world-competitiveness-center/rankings/world-digital-competitiveness/ (accessed on 1 May 2025).
- International Monetary Fund. (2025). World economic outlook database. October 2021. Available online: https://www.imf.org/en/Publications/WEO/weo-database/2021/October (accessed on 1 May 2025).
- Jihan, M. A. T., Popy, S., Kayes, S., Rasul, G., Maowa, A. S., & Rahman, M. M. (2025). Climate change scenario in Bangladesh: Historical data analysis and future projection based on CMIP6 model. Scientific Reports, 15(1), 7856. [Google Scholar] [CrossRef]
- Kantor, O. G., Rudneva, Y. R., Dunov, D. Y., Ergasheva, S. T., & Leybert, B. M. (2023). Green finance: Analysis of prospects of the Russian market. In Food security in the economy of the future: Transition from digital agriculture to agriculture 4.0 based on deep learning (pp. 45–56). Palgrave Macmillan. [Google Scholar] [CrossRef]
- Kordestani, A., Oghazi, P., Izmir, O., Oypan, O., & Ozer, S. (2023). Identification of the drivers of and barriers to COVID-19 vaccine intake behavior using a mixed-method design: Implications from a developing country. Journal of Innovation and Knowledge, 8(4), 100413. [Google Scholar] [CrossRef]
- Kumar, P., Sharma, S. K., & Dutot, V. (2023). Artificial intelligence (AI)-enabled CRM capability in healthcare: The impact on service innovation. International Journal of Information Management, 69, 102598. [Google Scholar] [CrossRef]
- Laatifi, M., Douzi, S., Bouklouz, A., Ezzine, H., Jaafari, J., Zaid, Y., El Ouahidi, B., & Naciri, M. (2022). Machine learning approaches in COVID-19 severity risk prediction in Morocco. Journal of Big Data, 9(1), 5. [Google Scholar] [CrossRef]
- Lee, J.-H., Yu, Y.-J., Kwon, Y.-S., & Lee, J.-S. (2025). Soil temperature and respiration dataset from Mt. Namsan: Long-term projection and its implications under SSP climate scenarios. Data in Brief, 59, 111397. [Google Scholar] [CrossRef]
- Londoño Díaz, W., & Prado Mejía, A. (2021). Experiences of citizenship in precarization: An ethnography from northern Colombia during COVID-19. Heliyon, 7(7), e07659. [Google Scholar] [CrossRef] [PubMed]
- Luo, X. (2019). Construction of artificial neural network economic forecasting model based on the consideration of state transition diagram. Neural Computing and Applications, 31(12), 8289–8296. [Google Scholar] [CrossRef]
- Maharana, N., Panigrahi, A. K., Chaudhury, S. K., Barik, P., & Kulkarni, P. (2025). Economic resilience in post-pandemic india: Analysing stock volatility and global links using VAR-DCC-GARCH and wavelet approach. Journal of Risk and Financial Management, 18(1), 18. [Google Scholar] [CrossRef]
- Martin, A., Kistemaker, B., Allen, B., & Jones, B. (2025). Anticipating climate change-related mobility in Karachi and Ho Chi Minh City: Lessons from a hybrid foresight approach. Data and Policy, 7, e13. [Google Scholar] [CrossRef]
- Martínez-Campillo, A., & Fernández-Santos, Y. (2020). The impact of the economic crisis on the (in)efficiency of public higher education institutions in Southern Europe: The case of Spanish universities. Socio-Economic Planning Sciences, 71, 100771. [Google Scholar] [CrossRef]
- Mislan, & Dani, A. T. R. (2025). Navigating Samarinda’s climate: A comparative analysis of rainfall forecasting models. MethodsX, 14, 103080. [Google Scholar] [CrossRef] [PubMed]
- Nguyen, H. D., Tran, K. P., Thomassey, S., & Hamad, M. (2021). Forecasting and anomaly detection approaches using LSTM and LSTM autoencoder techniques with the applications in supply chain management. International Journal of Information Management, 57, 102282. [Google Scholar] [CrossRef]
- Nguyen, T. L., Nguyen, H. T., Nguyen, N. H., Nguyen, T. T. D., & Le, D. L. (2023). Factors affecting students’ career choice in economics majors in the COVID-19 post-pandemic period: A case study of a private university in Vietnam. Journal of Innovation and Knowledge, 8(2), 100338. [Google Scholar] [CrossRef]
- Numbeo. (2025). Quality of life index for country 2021 mid-year. Available online: https://www.numbeo.com/quality-of-life/rankings_by_country.jsp (accessed on 1 May 2025).
- Obreja, D. M., Rughiniș, R., & Rosner, D. (2024). Mapping the conceptual structure of innovation in artificial intelligence research: A bibliometric analysis and systematic literature review. Journal of Innovation and Knowledge, 9(1), 100465. [Google Scholar] [CrossRef]
- Odoardi, I., & Muratore, F. (2019). The role of human capital after the crisis in Italy: A regional analysis. Socio-Economic Planning Sciences, 66, 58–67. [Google Scholar] [CrossRef]
- Papava, V. (2020). Coronomic crisis: When the economy is a hostage to medicine. Eurasia Review. Available online: https://www.eurasiareview.com/29032020-coronomic-crisis-when-the-economy-is-a-hostage-to-medicine-oped/ (accessed on 1 May 2025).
- Piserà, S., & Chiappini, H. (2024). Are ESG indexes a safe-haven or hedging asset? Evidence from the COVID-19 pandemic in China. International Journal of Emerging Markets, 19(1), 56–75. [Google Scholar] [CrossRef]
- Popkova, E. G. (2019). Preconditions of formation and development of industry 4.0 in the conditions of the knowledge economy. Studies in Systems, Decision and Control, 169(1), 65–72. [Google Scholar]
- Popkova, E. G., Egorova, E. N., Popova, E., & Pozdnyakova, U. A. (2019). The model of state management of the economy based on the Internet of Things. Studies in Computational Intelligence, 826, 1137–1144. [Google Scholar]
- Popkova, E. G., & Gulzat, K. (2020a). Contradiction of the digital economy: Public well-being vs. cyber threats. Lecture Notes in Networks and Systems, 87, 112–124. [Google Scholar]
- Popkova, E. G., & Gulzat, K. (2020b). Technological revolution in the 21st century: Digital society vs. artificial intelligence. Lecture Notes in Networks and Systems, 91, 339–345. [Google Scholar]
- Popkova, E. G., & Parakhina, V. N. (2016). Managing the global financial system based on artificial intelligence: Possibilities and limitations. Lecture Notes in Networks and Systems, 57, 939–946. [Google Scholar]
- Popkova, E. G., & Sergi, B. S. (2019). Digital economy: Complexity and variety vs. rationality. Springer International Publishing. [Google Scholar]
- Popkova, E. G., & Zmiyak, K. V. (2019). Priorities of training of digital personnel for industry 4.0: Social competencies vs. technical competencies. On the Horizon, 27(3–4), 138–144. [Google Scholar] [CrossRef]
- Sarraf, S., Kushwaha, A. K., Kar, A. K., Dwivedi, Y. K., & Giannakis, M. (2024). How did online misinformation impact stockouts in the e-commerce supply chain during COVID-19—A mixed methods study. International Journal of Production Economics, 267, 109064. [Google Scholar] [CrossRef]
- Setiawan, M., & Septiani, B. A. (2025). Firm performance and the determinants in the textile and textile product industry of indonesia pre- and post-COVID-19 pandemic. Journal of Risk and Financial Management, 18(1), 35. [Google Scholar] [CrossRef]
- Sharma, S. K., Janssen, M., Bunker, D., Dominguez-Péry, C., Singh, J. B., Dwivedi, Y. K., & Misra, S. K. (2023). Unlocking the potential of smart technologies: Addressing adoption challenges. Information Systems Frontiers, 25(4), 1293–1298. [Google Scholar] [CrossRef]
- Srivastava, S., Mehta, R., Mohanty, A., Satapathy, P., Sah, R., & Apostoloopoulos, V. (2025). Climate change impacts and pandemics. New Microbes and New Infections, 63, 101556. [Google Scholar] [CrossRef] [PubMed]
- UN. (2025). World happiness report 2021. Available online: https://worldhappiness.report/ed/2021/ (accessed on 1 May 2025).
- UNDP. (2025a). Human development report 2020. Available online: http://hdr.undp.org/en/content/latest-human-development-index-ranking (accessed on 1 May 2025).
- UNDP. (2025b). Sustainable development report 2021. Available online: https://dashboards.sdgindex.org/rankings (accessed on 1 May 2025).
- Wach, B., Schwarz, J. O., & von Held, F. (2025). Corporate foresight for the benefit of corporates’ innovation climate. Futures and Foresight Science, 7(1), e195. [Google Scholar] [CrossRef]
- WIPO. (2025). The global innovation index—2021. Available online: https://www.wipo.int/global_innovation_index/en/2021/?gclid=Cj0KCQiAnuGNBhCPARIsACbnLzoqQAMj0VigYSnmOT0_BY2rulV5DVwrzaanreroz2iMKyam-3PjS8AaAsrCEALw_wcB (accessed on 1 May 2025).
- World Bank. (2025). Indicators. Available online: https://data.worldbank.org/indicator/ (accessed on 1 May 2025).
- World Economic Forum. (2025). The global competitiveness report 2019. Available online: https://www.weforum.org/reports/how-to-end-a-decade-of-lost-productivity-growth (accessed on 1 May 2025).
- Xie, H., Chang, S., Liu, P., & Lin, R. F.-Y. (2024). Sustainable development: Uncovering the synergy between natural resources, clean technologies, and economic progress. Resources Policy, 88, 104380. [Google Scholar] [CrossRef]
- Yhang, Y.-B., Lim, C.-M., & Jeong, D. (2025). APEC climate center multi-model ensemble dataset for seasonal climate prediction. Scientific Data, 12(1), 303. [Google Scholar] [CrossRef]
- Zedda, S., Patanè, M., & Miggiano, L. (2021). The role of correlation in systemic risk: Mechanisms, effects, and policy implications. In Mathematical and statistical methods for actuarial sciences and finance: eMAF2020 (pp. 395–401). Springer. [Google Scholar] [CrossRef]

| Indicator | Forecast of the Annual Growth Rate of the Indicator | |||
|---|---|---|---|---|
| Countries with Low GDP per Capita | Countries with Below-Average GDP per Capita | Countries with Above-Average GDP per Capita | Countries with High GDP per Capita | |
| Industry 4.0: | Slow | accelerated | rapid | very rapid |
| Digital Competitiveness Index | not subject to calculation | ×1.015 | ×1.02 | ×1.025 |
| World Competitiveness Index 4.0 | ×1.01 | |||
| Knowledge Economy: | Slow | accelerated | rapid | very rapid |
| Global Innovation Index | ×1.01 | ×1.015 | ×1.02 | ×1.025 |
| Human Development Index | ||||
| Economic growth * | Slow | rapid | very rapid | accelerated |
| GDP * | ×1.01 | ×1.02 | ×1.025 | ×1.015 |
| Rate of economic growth * | ||||
| GDP per capita * | ||||
| Sustainable development: | Slow | accelerated | very rapid | rapid |
| Quality of Life Index | ×1.01 | ×1.015 | ×1.02 | ×1.025 |
| Happiness Index | ||||
| Sustainable Development Index | ||||
| Country | Digital Competitiveness Index, Score 1–100 | Global Competitiveness Index 4.0, Score 1–100 | Innovation Index, Score 1–100 | Human Development Index, Share of 1 | Economic Growth Rate, % | GDP, Billion Dollars | GDP per Capita, Dollars | Quality of Life Index, Score 1–200 | Happiness Index, Score 1–10 | Sustainability Index, Score 1–100 |
|---|---|---|---|---|---|---|---|---|---|---|
| Major Advanced Economies—G7 (developed countries): 2019 factual data | ||||||||||
| Canada | 90.836 | 79.6 | 53.88 | 0.922 | 1.843 | 1719.451 | 45,845.251 | 169.42 | 7.278 | 77.9 |
| France | 82.522 | 78.8 | 54.25 | 0.891 | 1.749 | 2562.275 | 39,121.158 | 156.10 | 6.592 | 81.5 |
| Germany | 86.216 | 81.8 | 58.19 | 0.939 | 1.415 | 3617.086 | 43,372.885 | 184.30 | 6.985 | 81.1 |
| Italy | 67.903 | 71.5 | 46.30 | 0.883 | 0.800 | 1879.410 | 30,941.744 | 143.81 | 6.223 | 75.8 |
| Japan | 82.775 | 82.3 | 54.68 | 0.915 | 0.846 | 5085.741 | 40,542.057 | 176.46 | 5.886 | 78.9 |
| UK | 88.691 | 81.2 | 61.30 | 0.920 | 1.606 | 2607.850 | 38,965.146 | 166.73 | 7.054 | 79.4 |
| USA | 100.000 | 83.7 | 61.73 | 0.920 | 2.121 | 21,239.303 | 64,212.535 | 176.77 | 6.892 | 74.5 |
| BRICS (developing countries): 2019 factual data | ||||||||||
| Brazil | 57.346 | 60.9 | 33.82 | 0.761 | 1.954 | 2340.842 | 11,110.946 | 103.87 | 6.300 | 70.6 |
| China | 84.292 | 73.9 | 54.82 | 0.758 | 6.000 | 13,862.968 | 9850.988 | 99.87 | 5.191 | 73.2 |
| India | 64.952 | 61.4 | 36.58 | 0.647 | 7.791 | 2959.667 | 2173.500 | 115.41 | 4.015 | 61.1 |
| Russia | 70.406 | 66.7 | 37.62 | 0.824 | 1.500 | 1654.091 | 11,558.835 | 104.05 | 5.648 | 70.9 |
| South Africa | 60.865 | 62.4 | 34.04 | 0.705 | 2.198 | 339.846 | 5790.651 | 135.75 | 4.722 | 61.5 |
| Major Advanced Economies—G7 (developed countries): 2021 factual data | ||||||||||
| Canada | 87.310 | n/a | 53.1 | 0.929 | 5.688 | 2015.983 | 52,791.228 | 157.25 | 7.103 | 79.16 |
| France | 75.656 | n/a | 55.0 | 0.901 | 6.293 | 2940.428 | 45,028.265 | 153.60 | 6.690 | 81.47 |
| Germany | 79.334 | n/a | 57.3 | 0.947 | 3.051 | 4230.172 | 50,787.859 | 175.24 | 7.155 | 82.48 |
| Italy | 61.767 | n/a | 45.7 | 0.892 | 5.770 | 2120.232 | 35,584.882 | 137.77 | 6.483 | 78.76 |
| Japan | 73.014 | n/a | 54.5 | 0.919 | 2.358 | 5103.110 | 40,704.304 | 164.06 | 5.940 | 79.85 |
| UK | 85.827 | n/a | 59.8 | 0.932 | 6.763 | 3108.416 | 46,200.258 | 156.94 | 7.064 | 79.97 |
| USA | 100.00 | n/a | 61.3 | 0.926 | 5.973 | 22,939.580 | 69,375.375 | 163.60 | 6.951 | 76.01 |
| BRICS (Developing Countries): 2021 Factual Data | ||||||||||
| Brazil | 51.478 | n/a | 34.2 | 0.765 | 5.229 | 1645.837 | 7741.153 | 104.70 | 6.330 | 71.34 |
| China | 84.431 | n/a | 54.8 | 0.761 | 8.015 | 16,862.979 | 11,891.202 | 103.16 | 5.339 | 72.06 |
| India | 55.126 | n/a | 36.4 | 0.645 | 9.497 | 2946.061 | 2116.444 | 103.00 | 3.819 | 60.07 |
| Russia | 60.271 | n/a | 36.6 | 0.824 | 4.690 | 1647.568 | 11,273.242 | 97.91 | 5.477 | 73.75 |
| South Africa | 43.641 | n/a | 32.7 | 0.709 | 5.000 | 415.315 | 6861.166 | 131.37 | 4.956 | 63.74 |
| Major Advanced Economies—G7 (developed countries): forecast (other conditions being equal) for 2024 | ||||||||||
| Canada | 103.124 | 90.4 | 61.17 | 1.047 | 1.854 | 1970.620 | 50,845.660 | 192.34 | 8.263 | 88.4 |
| France | 93.685 | 89.5 | 61.59 | 1.012 | 1.914 | 2900.437 | 43,681.620 | 177.22 | 7.484 | 92.5 |
| Germany | 97.879 | 92.9 | 66.06 | 1.066 | 1.208 | 4042.000 | 48,433.690 | 209.23 | 7.930 | 92.1 |
| Italy | 77.088 | 81.2 | 52.56 | 1.002 | 0.876 | 2053.830 | 33,858.150 | 163.26 | 7.065 | 86.1 |
| Japan | 93.972 | 93.4 | 62.08 | 1.039 | 0.657 | 5530.441 | 44,660.940 | 200.33 | 6.682 | 89.6 |
| UK | 100.688 | 92.2 | 69.59 | 1.044 | 1.975 | 2960.219 | 43,403.150 | 189.28 | 8.008 | 90.1 |
| USA | 113.527 | 95.0 | 70.08 | 1.044 | 1.754 | 24,478.490 | 72,325.760 | 200.68 | 7.824 | 84.6 |
| BRICS (developing countries): forecast (other conditions being equal) for 2024 | ||||||||||
| Brazil | 61.778 | 67.2 | 37.34 | 0.840 | 2.094 | 2811.758 | 13,092.080 | 114.68 | 6.956 | 77.9 |
| China | 93.065 | 81.6 | 60.53 | 0.837 | 5.989 | 18,603.030 | 12,988.590 | 110.26 | 5.731 | 80.8 |
| India | 69.972 | 66.1 | 39.41 | 0.697 | 5.621 | 1651.163 | 5917.128 | 124.33 | 4.325 | 65.8 |
| Russia | 77.734 | 73.6 | 41.54 | 0.910 | 1.576 | 1934.049 | 13,586.510 | 114.88 | 6.236 | 78.3 |
| South Africa | 67.200 | 68.9 | 37.58 | 0.778 | 2.334 | 399.684 | 6487.678 | 149.88 | 5.213 | 67.9 |
| Regression statistics | ||||||
| Multiple R | 0.9934 | |||||
| R-square | 0.9869 | |||||
| Adjusted R-square | 0.9519 | |||||
| Standard error | 3.7281 | |||||
| Observations | 12 | |||||
| Analysis of variance | ||||||
| df | SS | MS | F | Significance F | ||
| Regression | 8 | 3139.6802 | 392.4600 | 28.2377 | 0.0096 | |
| Residual | 3 | 41.6953 | 13.8984 | |||
| Total | 11 | 3181.3756 | ||||
| Coefficients | Standard error | t-Stat | p-value | Lower 95% | Upper 95% | |
| Y-intercept | −4.9146 | 45.1681 | −0.1088 | 0.9202 | −148.6597 | 138.8305 |
| αj2 | 1.4566 | 0.5451 | 2.6722 | 0.0755 | −0.2781 | 3.1912 |
| αj3 | 167.4801 | 61.0078 | 2.7452 | 0.0710 | −26.6740 | 361.6342 |
| αj4 | 0.6522 | 1.2792 | 0.5099 | 0.6453 | −3.4186 | 4.7231 |
| αj5 | 0.0005 | 0.0004 | 1.0781 | 0.3599 | −0.0009 | 0.0019 |
| αj6 | −0.0002 | 0.0001 | −1.9740 | 0.1429 | −0.0005 | 0.0001 |
| αj7 | −0.1671 | 0.1587 | −1.0531 | 0.3696 | −0.6720 | 0.3378 |
| αj8 | 1.7496 | 3.1377 | 0.5576 | 0.6160 | −8.2360 | 11.7353 |
| αj9 | −1.6591 | 1.0059 | −1.6495 | 0.1976 | −4.8602 | 1.5420 |
| Regression statistics | ||||||
| Multiple R | 0.9945 | |||||
| R-square | 0.9890 | |||||
| Adjusted R-square | 0.9597 | |||||
| Standard error | 2.1478 | |||||
| Observations | 12 | |||||
| Analysis of variance | ||||||
| df | SS | MS | F | Significance F | ||
| Regression | 8 | 1244.1910 | 155.5239 | 33.7143 | 0.0074 | |
| Residual | 3 | 13.8390 | 4.6130 | |||
| Total | 11 | 1258.0300 | ||||
| Coefficients | Standard error | t-Stat | p-value | Lower 95% | Upper 95% | |
| Y-intercept | −19.1450 | 23.6144 | −0.8107 | 0.4769 | −94.2964 | 56.0065 |
| αj1 | 0.4834 | 0.1809 | 2.6722 | 0.0755 | −0.0923 | 1.0592 |
| αj3 | −85.6822 | 43.4912 | −1.9701 | 0.1434 | −224.0906 | 52.7262 |
| αj4 | 0.2485 | 0.7547 | 0.3293 | 0.7636 | −2.1532 | 2.6503 |
| αj5 | −2.11 × 10⁻⁵ | 0.0003 | −0.0696 | 0.9489 | −0.0010 | 0.0009 |
| αj6 | 8.06 × 10⁻⁵ | 8.028 × 10⁻⁵ | 1.0041 | 0.3893 | −0.0002 | 0.0003 |
| αj7 | 0.1514 | 0.0617 | 2.4554 | 0.0912 | −0.0448 | 0.3476 |
| αj8 | −1.7427 | 1.6106 | −1.0820 | 0.3585 | −6.8684 | 3.3830 |
| αj9 | 1.2270 | 0.3721 | 3.2972 | 0.0458 | 0.0427 | 2.4114 |
| Regression statistics | ||||||
| Multiple R | 0.9953 | |||||
| R-square | 0.9906 | |||||
| Adjusted R-square | 0.9655 | |||||
| Standard error | 0.0188 | |||||
| Observations | 12 | |||||
| Analysis of variance | ||||||
| df | SS | MS | F | Significance F | ||
| Regression | 8 | 0.1120 | 0.0140 | 39.5032 | 0.0059 | |
| Residual | 3 | 0.0011 | 0.0004 | |||
| Total | 11 | 0.1131 | ||||
| Coefficients | Standard error | t-Stat | p-value | Lower 95% | Upper 95% | |
| Y-intercept | −0.0057 | 0.2285 | −0.0249 | 0.9817 | −0.7329 | 0.7215 |
| αj2 | −0.0066 | 0.0033 | −1.9701 | 0.1434 | −0.0172 | 0.0041 |
| αj1 | 0.0043 | 0.0016 | 2.7452 | 0.0710 | −0.0007 | 0.0092 |
| αj4 | −0.0026 | 0.0066 | −0.4023 | 0.7144 | −0.0235 | 0.0182 |
| αj5 | −1.56 × 10⁻⁶ | 2.502 × 10⁻⁶ | −0.6229 | 0.5775 | −9.5 × 10⁻⁶ | 6.4 × 10⁻⁶ |
| αj6 | 9.034 × 10⁻⁷ | 6.24 × 10⁻⁷ | 1.4477 | 0.2435 | −1.1 × 10⁻⁶ | 2.9 × 10⁻⁶ |
| αj7 | 0.0010 | 0.0007 | 1.4435 | 0.2446 | −0.0013 | 0.0033 |
| αj8 | −0.0038 | 0.0165 | −0.2285 | 0.8339 | −0.0563 | 0.0487 |
| αj9 | 0.0099 | 0.0040 | 2.4681 | 0.0902 | −0.0029 | 0.0228 |
| Regression statistics | ||||||
| Multiple R | 0.9004 | |||||
| R-square | 0.8106 | |||||
| Adjusted R-square | 0.3057 | |||||
| Standard error | 1.6142 | |||||
| Observations | 12 | |||||
| Analysis of variance | ||||||
| df | SS | MS | F | Significance F | ||
| Regression | 8 | 33.4639 | 4.1830 | 1.6054 | 0.3801 | |
| Residual | 3 | 7.8168 | 2.6056 | |||
| Total | 11 | 41.2807 | ||||
| Coefficients | Standard error | t-Stat | p-value | Lower 95% | Upper 95% | |
| Y-intercept | 28.6007 | 10.5507 | 2.7108 | 0.0731 | −4.9763 | 62.1778 |
| αj3 | −19.3983 | 48.2202 | −0.4023 | 0.7144 | −172.8565 | 134.0598 |
| αj2 | 0.1404 | 0.4263 | 0.3293 | 0.7636 | −1.2162 | 1.4970 |
| αj1 | 0.1223 | 0.2398 | 0.5099 | 0.6453 | −0.6409 | 0.8854 |
| αj5 | −0.0003 | 0.0002 | −1.5413 | 0.2209 | −0.0008 | 0.0003 |
| αj6 | 4.886 × 10⁻⁵ | 6.378 × 10⁻⁵ | 0.7662 | 0.4994 | −0.0002 | 0.0003 |
| αj7 | −0.0591 | 0.0728 | −0.8117 | 0.4764 | −0.2908 | 0.1726 |
| αj8 | 0.9102 | 1.3270 | 0.6859 | 0.5420 | −3.3129 | 5.1332 |
| αj9 | −0.2588 | 0.5826 | −0.4442 | 0.6870 | −2.1127 | 1.5952 |
| Regression statistics | ||||||
| Multiple R | 0.9518 | |||||
| R-square | 0.9060 | |||||
| Adjusted R-square | 0.6552 | |||||
| Standard error | 4087.2041 | |||||
| Observations | 12 | |||||
| Analysis of variance | ||||||
| df | SS | MS | F | Significance F | ||
| Regression | 8 | 482,815,236 | 60,351,904.5060 | 3.6128 | 0.1593 | |
| Residual | 3 | 50,115,711.85 | 16,705,237.2820 | |||
| Total | 11 | 532,930,947.9 | ||||
| Coefficients | Standard error | t-Stat | p-value | Lower 95% | Upper 95% | |
| Y-intercept | 62,239.5686 | 34,213.8745 | 1.8191 | 0.1665 | −46,644.2500 | 171,123.3871 |
| αj4 | −1683.2465 | 1092.0910 | −1.5413 | 0.2209 | −5158.7675 | 1792.2745 |
| αj3 | −73,475.8448 | 117,949.5670 | −0.6229 | 0.5775 | −448,844.0085 | 301,892.3189 |
| αj2 | −76.4352 | 1097.8010 | −0.0696 | 0.9489 | −3570.1280 | 3417.2575 |
| αj1 | 579.3524 | 537.3703 | 1.0781 | 0.3599 | −1130.7999 | 2289.5046 |
| αj6 | 0.2179 | 0.1239 | 1.7589 | 0.1768 | −0.1764 | 0.6122 |
| αj7 | −109.7099 | 193.4607 | −0.5671 | 0.6103 | −725.3883 | 505.9685 |
| αj8 | 1350.4587 | 3528.7569 | 0.3827 | 0.7274 | −9879.6206 | 12,580.5379 |
| αj9 | −292.2135 | 1513.4400 | −0.1931 | 0.8592 | −5108.6551 | 4524.2282 |
| Regression statistics | ||||||
| Multiple R | 0.9514 | |||||
| R-square | 0.9052 | |||||
| Adjusted R-square | 0.6525 | |||||
| Standard error | 13,363.9686 | |||||
| Observations | 12 | |||||
| Analysis of variance | ||||||
| df | SS | MS | F | Significance F | ||
| Regression | 8 | 5,116,934,684 | 639,616,835.5 | 3.5814 | 0.1610 | |
| Residual | 3 | 535,786,970.9 | 178,595,657 | |||
| Total | 11 | 5,652,721,655 | ||||
| Coefficients | Standard error | t-Stat | p-value | Lower 95% | Upper 95% | |
| Y-intercept | −112,988.1653 | 148,539.9796 | −0.7607 | 0.5022 | −585,708.6746 | 359,732.3441 |
| αj5 | 2.3297 | 1.3246 | 1.7589 | 0.1768 | −1.8856 | 6.5451 |
| αj4 | 3349.1357 | 4371.3674 | 0.7662 | 0.4994 | −10,562.5064 | 17,260.7779 |
| αj3 | 455,245.6501 | 314,468.6491 | 1.4477 | 0.2435 | −545,533.9402 | 1,456,025.2404 |
| αj2 | 3120.5658 | 3107.9385 | 1.0041 | 0.3893 | −6770.2815 | 13,011.4132 |
| αj1 | −2694.5364 | 1364.9806 | −1.9740 | 0.1429 | −7038.5140 | 1649.4412 |
| αj7 | −110.9712 | 662.5111 | −0.1675 | 0.8776 | −2219.3772 | 1997.4347 |
| αj8 | 1143.0401 | 11,797.8525 | 0.0969 | 0.9289 | −36,402.9920 | 38,689.0722 |
| αj9 | −3029.7834 | 4661.7779 | −0.6499 | 0.5621 | −17,865.6412 | 11,806.0743 |
| Regression statistics | ||||||
| Multiple R | 0.9771 | |||||
| R-square | 0.9546 | |||||
| Adjusted R-square | 0.8337 | |||||
| Standard error | 11.5921 | |||||
| Observations | 12 | |||||
| Analysis of variance | ||||||
| df | SS | MS | F | Significance F | ||
| Regression | 8 | 8485.1905 | 1060.6488 | 7.8932 | 0.0584 | |
| Residual | 3 | 403.1270 | 134.3757 | |||
| Total | 11 | 8888.3175 | ||||
| Coefficients | Standard error | t-Stat | p-value | Lower 95% | Upper 95% | |
| Y-intercept | 157.0741 | 107.6048 | 1.4597 | 0.2405 | −185.3723 | 499.5206 |
| αj6 | −8.34949 × 10⁻⁵ | 0.0005 | −0.1675 | 0.8776 | −0.0017 | 0.0015 |
| αj5 | −0.0009 | 0.0016 | −0.5671 | 0.6103 | −0.0058 | 0.0041 |
| αj4 | −3.0474 | 3.7544 | −0.8117 | 0.4764 | −14.9954 | 8.9007 |
| αj3 | 394.2114 | 273.0981 | 1.4435 | 0.2446 | −474.9087 | 1263.3315 |
| αj2 | 4.4103 | 1.7962 | 2.4554 | 0.0912 | −1.3060 | 10.1266 |
| αj1 | −1.6153 | 1.5340 | −1.0531 | 0.3696 | −6.4971 | 3.2664 |
| αj8 | 9.0491 | 8.8181 | 1.0262 | 0.3803 | −19.0140 | 37.1122 |
| αj9 | −6.4419 | 2.1957 | −2.9339 | 0.0608 | −13.4295 | 0.5458 |
| Regression statistics | ||||||
| Multiple R | 0.9442 | |||||
| R-square | 0.8916 | |||||
| Adjusted R-square | 0.6025 | |||||
| Standard error | 0.6530 | |||||
| Observations | 12 | |||||
| Analysis of variance | ||||||
| df | SS | MS | F | Significance F | ||
| Regression | 8 | 10.5186 | 1.3148 | 3.0838 | 0.1920 | |
| Residual | 3 | 1.2791 | 0.4264 | |||
| Total | 11 | 11.7977 | ||||
| Coefficients | Standard error | t-Stat | p-value | Lower 95% | Upper 95% | |
| Y-intercept | −7.8771 | 6.4924 | −1.2133 | 0.3118 | −28.5388 | 12.7845 |
| αj7 | 0.0287 | 0.0280 | 1.0262 | 0.3803 | −0.0603 | 0.1178 |
| αj6 | 0.0000 | 0.0000 | 0.0969 | 0.9289 | −0.0001 | 9.23644 × 10⁻⁵ |
| αj5 | 0.0000 | 0.0001 | 0.3827 | 0.7274 | −0.0003 | 0.0003 |
| αj4 | 0.1489 | 0.2171 | 0.6859 | 0.5420 | −0.5421 | 0.8400 |
| αj3 | −4.5366 | 19.8532 | −0.2285 | 0.8339 | −67.7184 | 58.6453 |
| αj2 | −0.1611 | 0.1489 | −1.0820 | 0.3585 | −0.6348 | 0.3127 |
| αj1 | 0.0537 | 0.0963 | 0.5576 | 0.6160 | −0.2527 | 0.3600 |
| αj9 | 0.2235 | 0.2062 | 1.0836 | 0.3579 | −0.4329 | 0.8799 |
| Regression statistics | ||||||
| Multiple R | 0.9934 | |||||
| R-square | 0.9869 | |||||
| Adjusted R-square | 0.9521 | |||||
| Standard error | 1.5496 | |||||
| Observations | 12 | |||||
| Analysis of variance | ||||||
| df | SS | MS | F | Significance F | ||
| Regression | 8 | 544.4388 | 68.0549 | 28.3414 | 0.0096 | |
| Residual | 3 | 7.2038 | 2.4013 | |||
| Total | 11 | 551.6426 | ||||
| Coefficients | Standard error | t-Stat | p-value | Lower 95% | Upper 95% | |
| Y-intercept | 18.2335 | 15.5901 | 1.1696 | 0.3266 | −31.3812 | 67.8481 |
| αj8 | 1.2586 | 1.1616 | 1.0836 | 0.3579 | −2.4380 | 4.9552 |
| αj7 | −0.1151 | 0.0392 | −2.9339 | 0.0608 | −0.2400 | 0.0098 |
| αj6 | −4.0736 × 10⁻⁵ | 6.26784 × 10⁻⁵ | −0.6499 | 0.5621 | −0.0002 | 0.0002 |
| αj5 | −4.20035 × 10⁻⁵ | 0.0002 | −0.1931 | 0.8592 | −0.0007 | 0.0007 |
| αj4 | −0.2385 | 0.5369 | −0.4442 | 0.6870 | −1.9471 | 1.4701 |
| αj3 | 67.3765 | 27.2990 | 2.4681 | 0.0902 | −19.5009 | 154.2540 |
| αj2 | 0.6387 | 0.1937 | 3.2972 | 0.0458 | 0.0222 | 1.2552 |
| αj1 | −0.2867 | 0.1738 | −1.6495 | 0.1976 | −0.8397 | 0.2664 |
| Category of Countries | Country | Digital Competitiveness Index, Score 1–100 | Innovation Index, Score 1–100 | Human Development Index, Share of 1 | Economic Growth Rate, % | GDP, Billion Dollars | GDP per Capita, Dollars | Quality of Life Index, Score 1–200 | Happiness Index, Score 1–10 | Sustainability Index, Score 1–100 | |||||||||
|---|---|---|---|---|---|---|---|---|---|---|---|---|---|---|---|---|---|---|---|
| αj1 | αj2 | αj3 | αj4 | αj5 | αj6 | αj7 | αj8 | αj9 | |||||||||||
| 2021 Factual Data | Forecast for 2021 | 2021 Factual Data | Forecast for 2021 | 2021 Factual Data | Forecast for 2021 | 2021 Factual Data | Forecast for 2021 | 2021 Factual Data | Forecast for 2021 | 2021 Factual Data | Forecast for 2021 | 2021 Factual Data | Forecast for 2021 | 2021 Factual Data | Forecast for 2021 | 2021 Factual Data | Forecast for 2021 | ||
| Major Advanced Economies—G7 (developed countries) | Canada | 87.31 | 95.43 | 53.10 | 56.61 | 0.93 | 0.97 | 5.69 | 1.90 | 2015.98 | 1771.42 | 52,791.23 | 47,230.92 | 157.25 | 178.00 | 7.10 | 7.65 | 79.16 | 81.84 |
| France | 75.66 | 86.70 | 55.00 | 57.00 | 0.90 | 0.94 | 6.29 | 1.80 | 2940.43 | 2639.72 | 45,028.27 | 40,303.60 | 153.60 | 164.00 | 6.69 | 6.93 | 81.47 | 85.63 | |
| Germany | 79.33 | 90.58 | 57.30 | 61.14 | 0.95 | 0.99 | 3.05 | 1.46 | 4230.17 | 3726.41 | 50,787.86 | 44,683.83 | 175.24 | 193.63 | 7.16 | 7.34 | 82.48 | 85.21 | |
| Italy | 61.77 | 71.34 | 45.70 | 48.64 | 0.89 | 0.93 | 5.77 | 0.82 | 2120.23 | 1936.22 | 35,584.88 | 31,876.96 | 137.77 | 151.09 | 6.48 | 6.54 | 78.76 | 79.64 | |
| Japan | 73.01 | 86.97 | 54.50 | 57.45 | 0.92 | 0.96 | 2.36 | 0.87 | 5103.11 | 5239.46 | 40,704.30 | 41,767.44 | 164.06 | 185.39 | 5.94 | 6.18 | 79.85 | 82.89 | |
| UK | 85.83 | 93.18 | 59.80 | 64.40 | 0.93 | 0.97 | 6.76 | 1.65 | 3108.42 | 2686.67 | 46,200.26 | 40,142.87 | 156.94 | 175.17 | 7.06 | 7.41 | 79.97 | 83.42 | |
| USA | 100.00 | 102.50 | 61.30 | 64.86 | 0.93 | 0.97 | 5.97 | 2.19 | 22,939.58 | 21,881.26 | 69,375.38 | 66,153.36 | 163.60 | 185.72 | 6.95 | 7.24 | 76.01 | 78.27 | |
| BRICS (developing countries) | Brazil | 51.48 | 59.66 | 34.20 | 35.19 | 0.77 | 0.79 | 5.23 | 2.05 | 1645.84 | 2459.35 | 7741.15 | 11,673.44 | 104.70 | 108.07 | 6.33 | 6.55 | 71.34 | 73.45 |
| China | 84.43 | 87.70 | 54.80 | 57.03 | 0.76 | 0.79 | 8.02 | 6.30 | 16,862.98 | 14,564.78 | 11,891.20 | 10,349.69 | 103.16 | 103.90 | 5.34 | 5.40 | 72.06 | 76.16 | |
| India | 55.13 | 67.58 | 36.40 | 38.06 | 0.65 | 0.67 | 9.50 | 8.19 | 2946.06 | 3109.50 | 2116.44 | 2283.53 | 103.00 | 120.07 | 3.82 | 4.18 | 60.07 | 63.57 | |
| Russia | 60.27 | 73.25 | 36.60 | 39.14 | 0.82 | 0.86 | 4.69 | 1.58 | 1647.57 | 1737.83 | 11,273.24 | 12,144.00 | 97.91 | 108.25 | 5.48 | 5.88 | 73.75 | 73.76 | |
| South Africa | 43.64 | 63.32 | 32.70 | 35.42 | 0.71 | 0.73 | 5.00 | 2.31 | 415.31 | 357.05 | 6861.17 | 6083.80 | 131.37 | 141.23 | 4.96 | 4.91 | 63.74 | 63.98 | |
| Category of Countries | Country | Digital Competitiveness Index, Score 1–100 | Innovation Index, Score 1–100 | Human Development Index, Share of 1 | Economic Growth Rate, % | GDP, Billion Dollars | GDP per Capita, Dollars | Quality of Life Index, Score 1–200 | Happiness Index, Score 1–10 | Sustainability Index, Score 1–100 |
|---|---|---|---|---|---|---|---|---|---|---|
| Major Advanced Economies—G7 (developed countries) | Canada | −8.51 | −6.20 | −4.23 | 199.37 | 13.81 | 11.77 | −11.66 | −7.15 | −3.27 |
| France | −12.74 | −3.51 | −4.15 | 249.61 | 11.39 | 11.72 | −6.34 | −3.46 | −4.86 | |
| Germany | −12.42 | −6.28 | −4.34 | 108.97 | 13.52 | 13.66 | −9.50 | −2.52 | −3.20 | |
| Italy | −13.42 | −6.04 | −4.09 | 603.66 | 9.50 | 11.63 | −8.82 | −0.87 | −1.10 | |
| Japan | −16.05 | −5.13 | −4.27 | 171.03 | −2.60 | −2.55 | −11.51 | −3.88 | −3.67 | |
| UK | −7.89 | −7.14 | −3.92 | 309.88 | 15.70 | 15.09 | −10.41 | −4.67 | −4.14 | |
| USA | −2.44 | −5.49 | −4.54 | 172.74 | 4.84 | 4.87 | −11.91 | −3.99 | −2.89 | |
| BRICS (developing countries) | Brazil | −13.71 | −2.81 | −3.16 | 155.07 | −33.08 | −33.69 | −3.12 | −3.36 | −2.87 |
| China | −3.73 | −3.91 | −3.67 | 27.22 | 15.78 | 14.89 | −0.71 | −1.13 | −5.38 | |
| India | −18.43 | −4.36 | −3.73 | 15.96 | −5.26 | −7.32 | −14.22 | −8.64 | −5.51 | |
| Russia | −17.72 | −6.49 | −4.19 | 196.84 | −5.19 | −7.17 | −9.55 | −6.85 | −0.01 | |
| South Africa | −31.08 | −7.68 | −2.88 | 116.45 | 16.32 | 12.78 | −6.98 | 0.94 | −0.38 | |
| The average for the G7 countries | −10.49 | −5.69 | −4.22 | 259.32 | 9.45 | 9.46 | −10.02 | −3.79 | −3.30 | |
| The average for the BRICS countries | −16.93 | −5.05 | −3.53 | 102.31 | −2.29 | −4.10 | −6.92 | −3.81 | −2.83 | |
| Existing Theory | New Results | |
|---|---|---|
| Preferred sources for studying the world economy | Available studies on the global economy focus on a limited selection of countries and key indicators | Deficits in statistics can be resolved using big data and open data for comprehensive global economic research |
| The scale of datasets, big data, and open data | Datasets should be specialized, reflecting only the specific aspects of the world economy | Datasets must contain detailed statistics on the set topic reflecting the indications of the world economy and its factors |
| Technologies of socioeconomic forecasts | Forecasts should be grounded in the experiences of specific countries and tailored to each national economy | Predictions should be grounded in global economic experience |
| Approach to analyzing economic system crises through statistics | Emphasize the phenomenon of economic crises by concentrating on GDP and growth rates | Examining how crises impact quality of life and sustainable development, along with strategies for addressing these challenges |
Disclaimer/Publisher’s Note: The statements, opinions and data contained in all publications are solely those of the individual author(s) and contributor(s) and not of MDPI and/or the editor(s). MDPI and/or the editor(s) disclaim responsibility for any injury to people or property resulting from any ideas, methods, instructions or products referred to in the content. |
© 2025 by the authors. Licensee MDPI, Basel, Switzerland. This article is an open access article distributed under the terms and conditions of the Creative Commons Attribution (CC BY) license (https://creativecommons.org/licenses/by/4.0/).
Share and Cite
Sergi, B.S.; Popkova, E.G.; Petrenko, E.; Ergasheva, S.T.; Aslanyan, M.; Mikayelyan, V. An Innovative Digital Platform for Socioeconomic Forecasting Climate Risks and Financial Management. J. Risk Financial Manag. 2025, 18, 277. https://doi.org/10.3390/jrfm18050277
Sergi BS, Popkova EG, Petrenko E, Ergasheva ST, Aslanyan M, Mikayelyan V. An Innovative Digital Platform for Socioeconomic Forecasting Climate Risks and Financial Management. Journal of Risk and Financial Management. 2025; 18(5):277. https://doi.org/10.3390/jrfm18050277
Chicago/Turabian StyleSergi, Bruno S., Elena G. Popkova, Elena Petrenko, Shakhlo T. Ergasheva, Mkhitar Aslanyan, and Vahe Mikayelyan. 2025. "An Innovative Digital Platform for Socioeconomic Forecasting Climate Risks and Financial Management" Journal of Risk and Financial Management 18, no. 5: 277. https://doi.org/10.3390/jrfm18050277
APA StyleSergi, B. S., Popkova, E. G., Petrenko, E., Ergasheva, S. T., Aslanyan, M., & Mikayelyan, V. (2025). An Innovative Digital Platform for Socioeconomic Forecasting Climate Risks and Financial Management. Journal of Risk and Financial Management, 18(5), 277. https://doi.org/10.3390/jrfm18050277