The responses to the survey provide insights into the types of goals typically being pursued by Millennials and Gen Zers, how reaching these goals can be supported by different providers, the preferred channels for this interaction, and how different personality traits influence both the selection of the goals being pursued and individuals’ interest in being supported by different service providers.
3.1. Goal Setting
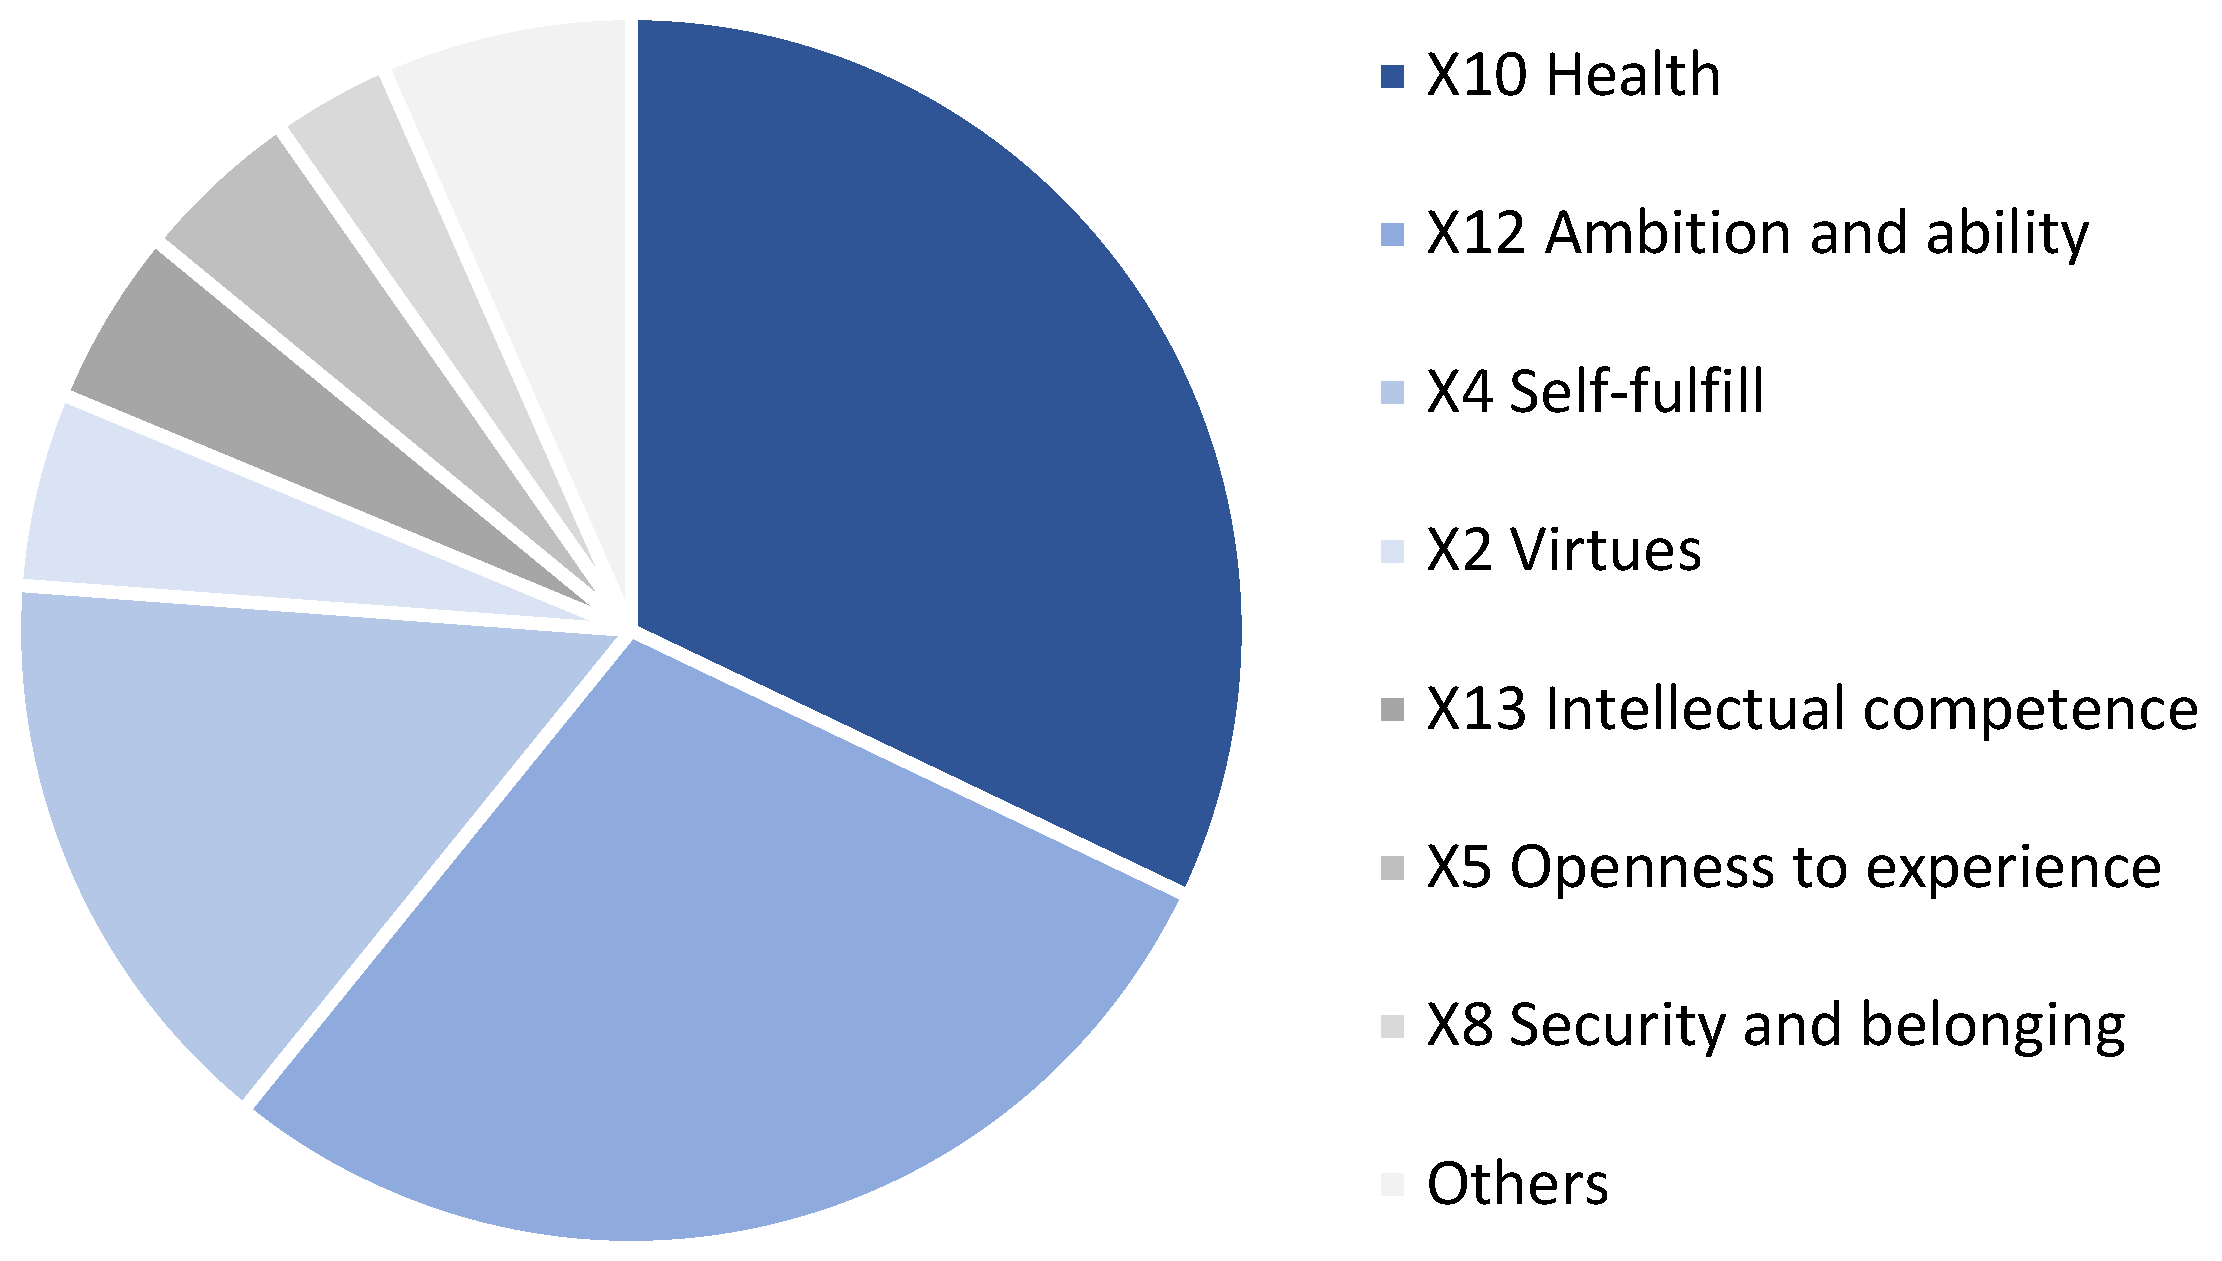
The percentages of responders for each goal are shown in
Figure 1. The majority of goals being pursued are concentrated in a few categories, with
health (32.1%) and
ambition and ability (28.8%) accounting for more than half of the goals.
Together with self-fulfill (15.7%), they account for three quarters of the declared goals, with only another four goals, virtues (5%), intellectual competence (4.6%), openness to experience (4.4%), and security and belonging (3.1%) being mentioned more than three percent of the time.
The concentration of goals in the
health and
ambition and ability categories may be at least partly explained by the fact that most respondents were university students participating in undergraduate and graduate degree programs, and by the impact of the COVID-19 pandemic. Switzerland, like all other European countries, faced a wave of contagion in the winter of 2020–2021 with visible countermeasures limiting mobility and contacts among people. Indeed, 6% of responders mentioned “COVID” or “Coronavirus” as some of the obstacles preventing them from achieving their goals (these results are not part of this study). In a previous study on goals of university students, health-related goals only accounted for some 12% of the goals mentioned, while organization-related goals (comparable to our ambition and ability category), accounted for approximately 6% (
Reisz et al. 2013). The results show no differences in the frequencies of goals individuals mention between Millennials and Gen Zers (
X2(13,
N = 1668) = 20.28,
p = 0.08).
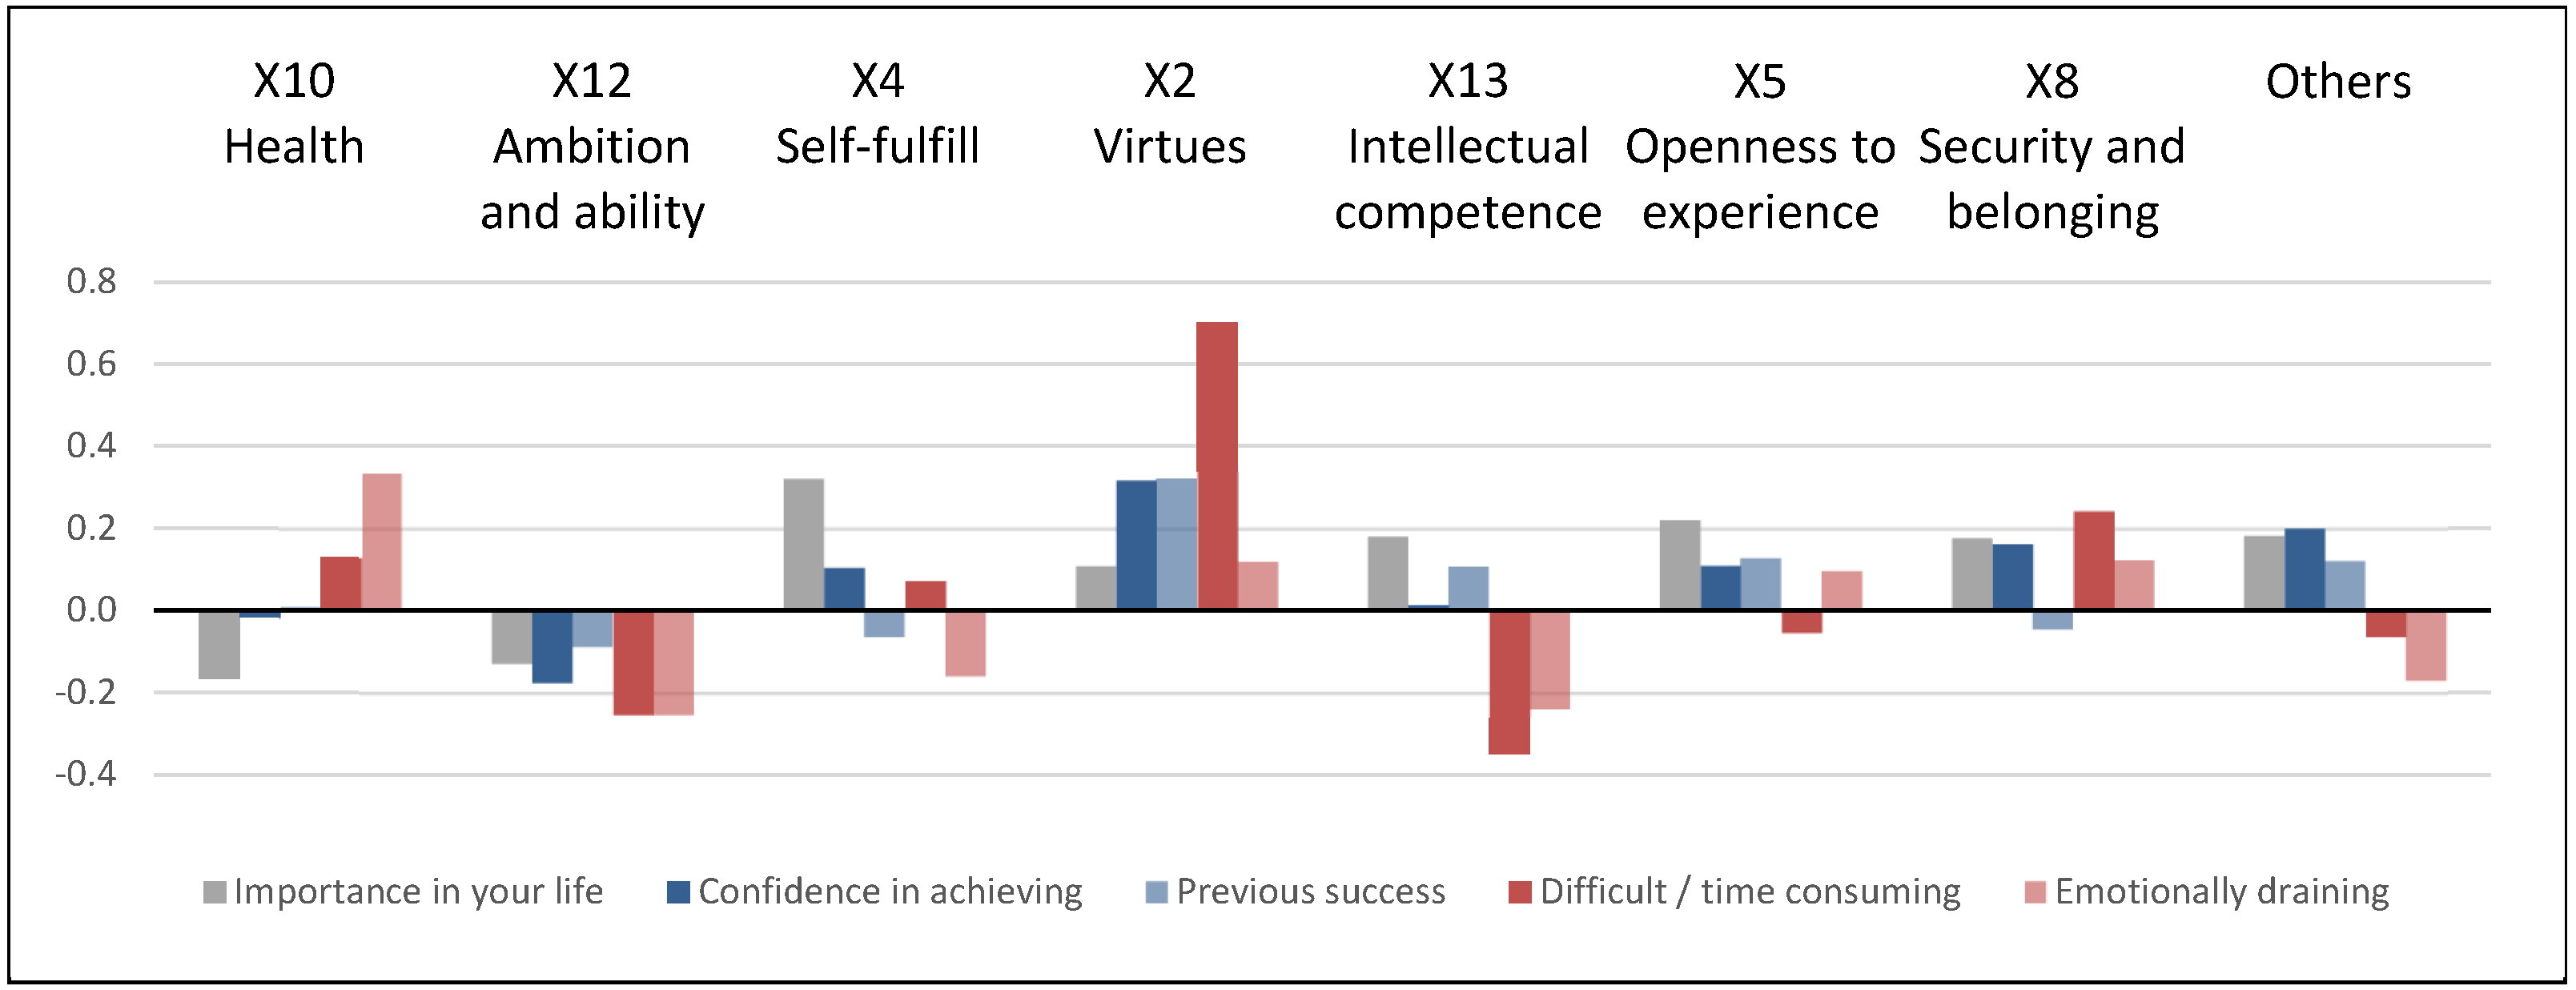
3.2. Goal Value
Goal value was determined by the ratings respondents gave their goals related to their
Importance,
confidence in achieving,
previous success, difficult/time consuming, and
emotionally draining to achieve. The rating details for each goal are tabulated in
Table 3.
Importance ratings were high (>4) for all goals, with family-related goals rating the highest in importance by respondents, followed by self-fulfill. Interestingly, despite its high frequency, health scored the lowest of all goal types in this category. Confidence in achieving the mentioned goals was overall moderate, with family ranking highest in confidence, followed by morals and values. Most goals were rate as difficult to achieve, with virtues ranking the least difficult and intellectual competence and financial and occupational success the most difficult. Emotionally draining ratings were positively correlated with difficulty, while previous success was positively correlated with confidence. However, the goals’ importance was not correlated with their difficulty or emotional load. This suggests that respondents are aware of their ability to reach goals and feel pressure to achieve their goals, but that the pressure does not come from the perceived importance.
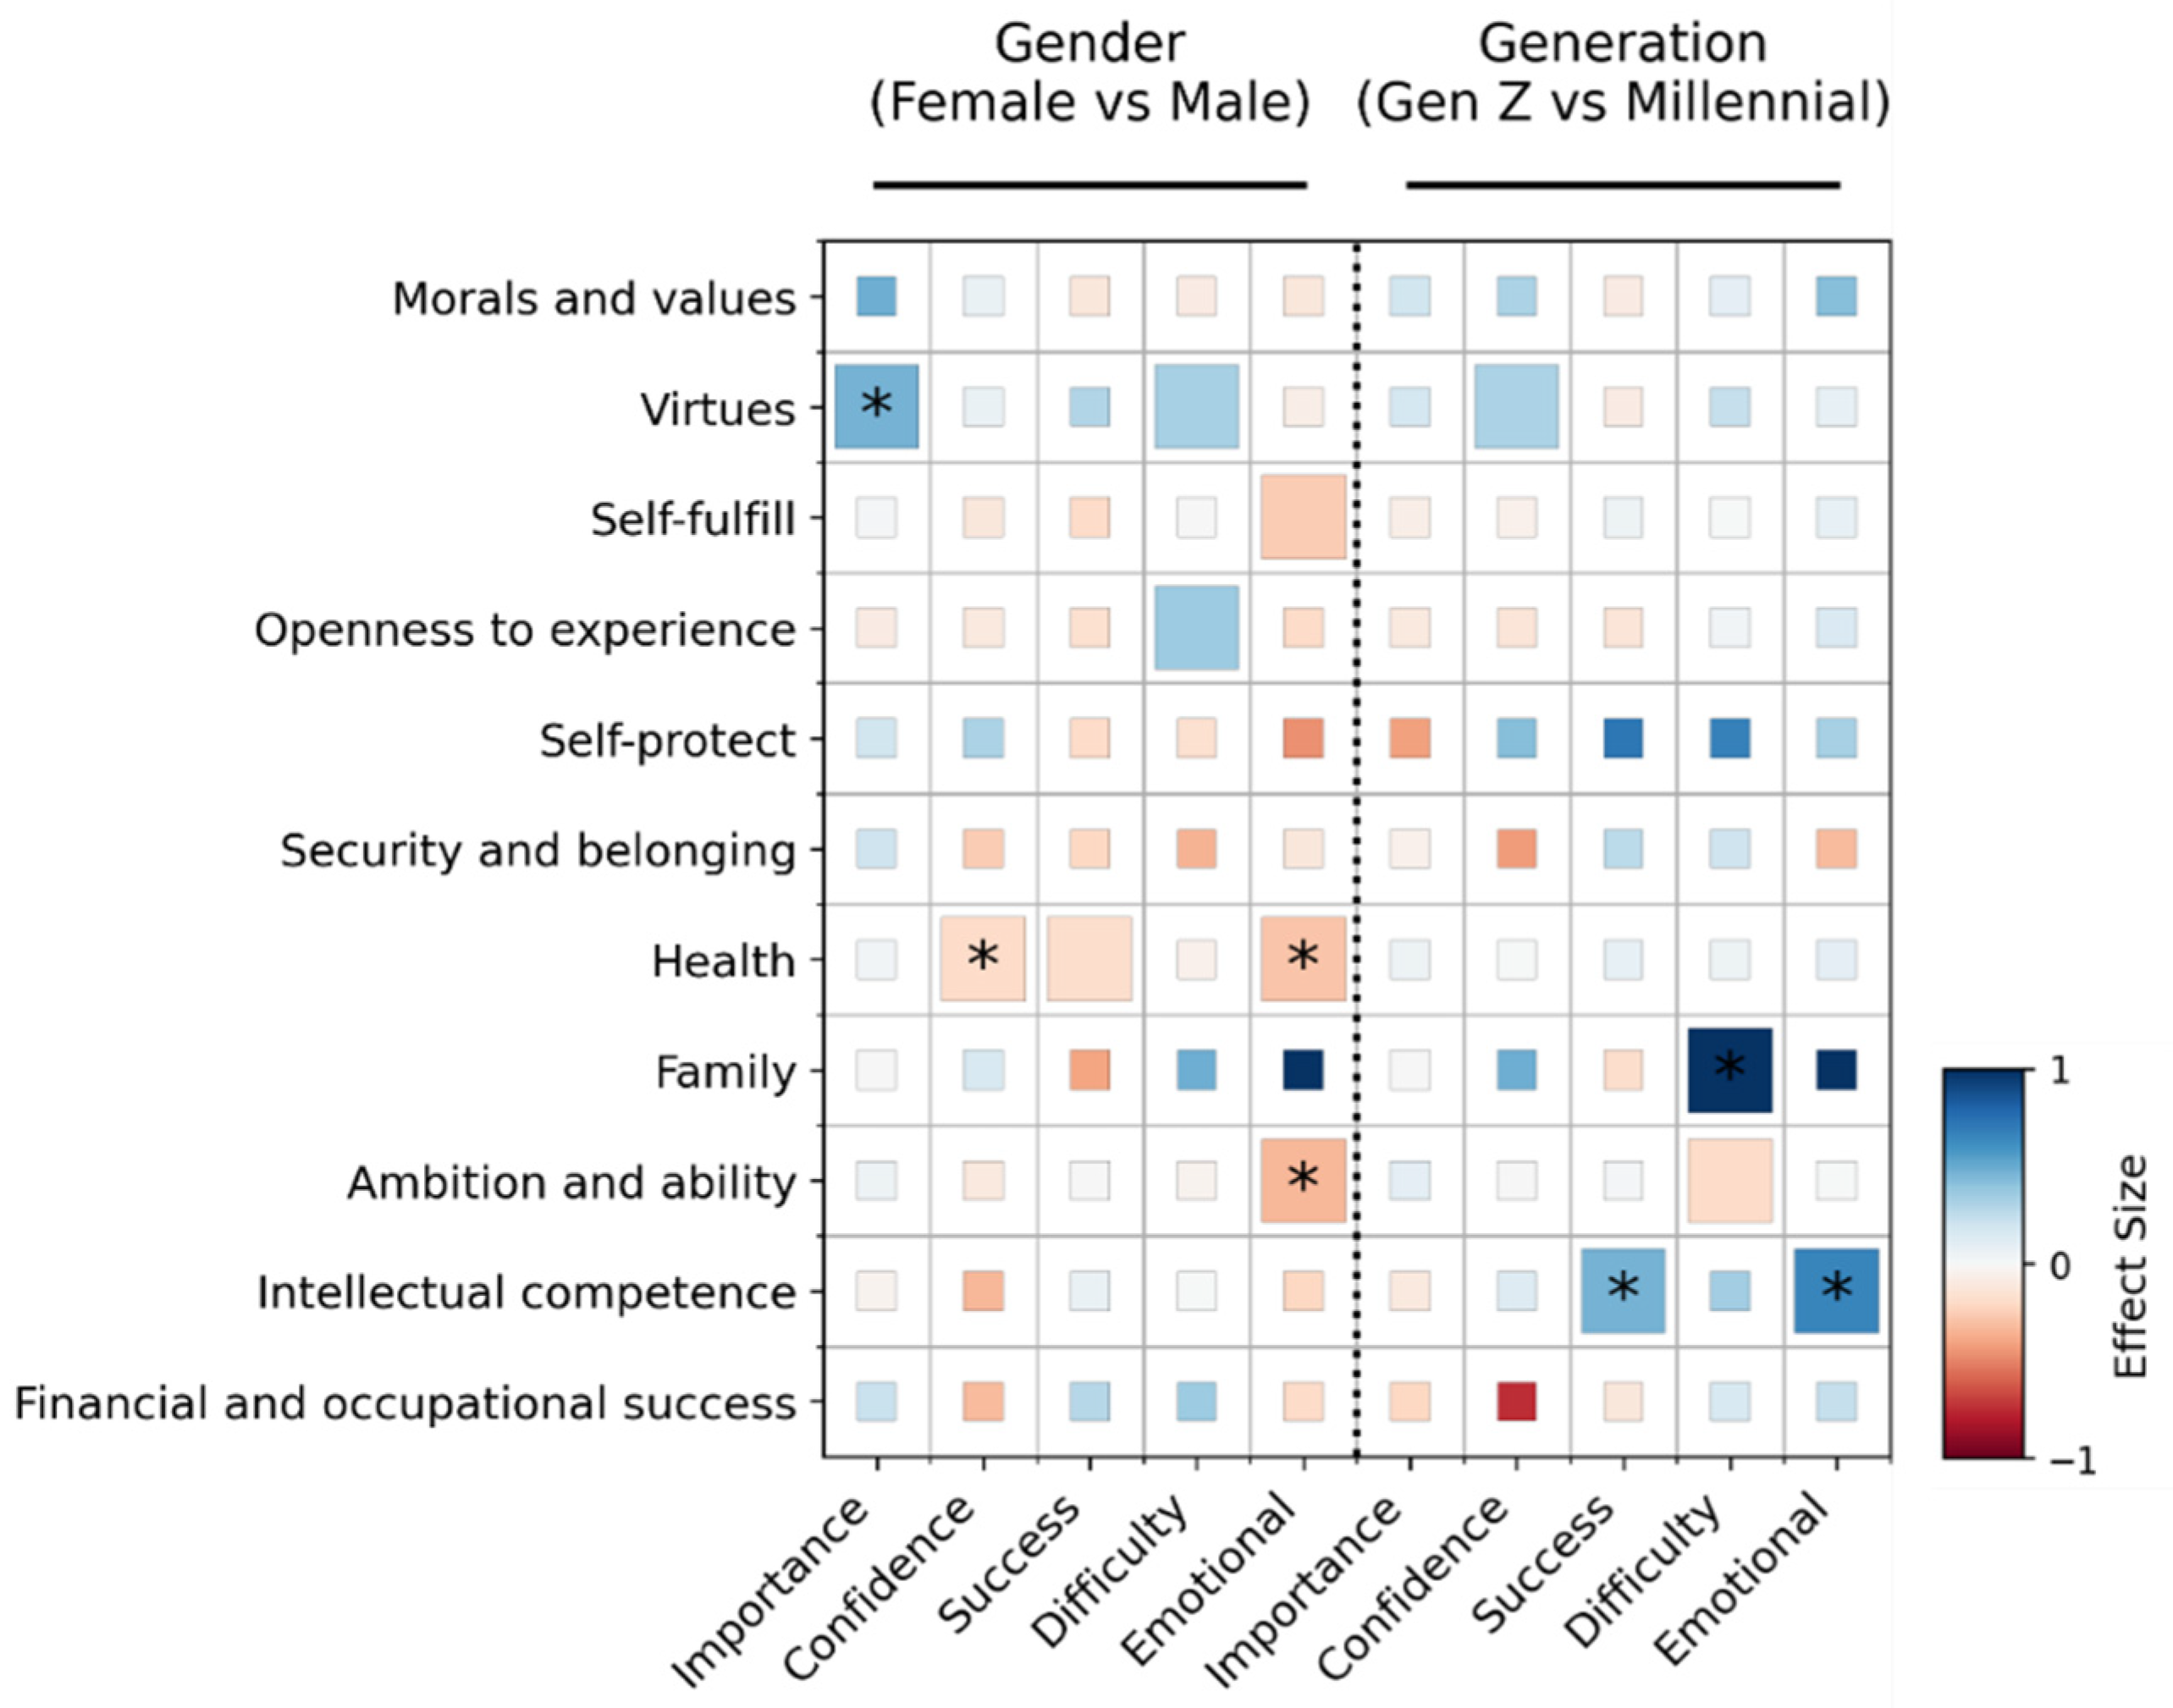
To investigate if gender or generational differences among individuals might play a role in the value ratings of each goal, the ratings of each goal with gender and generation were modeled as dependent variables. The resulting coefficients and statistical significance are shown in
Figure 2. Female respondents are less confident in achieving
health-related goals than males (
β = −0.18,
p = 0.015) and find both
health (
β = 0.09,
p = 0.002) and
ambition and ability (
β = −0.33,
p < 0.001) goals more emotionally draining than their male counterparts. On the other hand,
virtue-related goals are rated more important by females than males (
β = 0.49,
p = 0.001). In terms of generational differences, Gen Zers rate
intellectual-competence-related goals as less emotionally draining (
β = 0.68,
p = 0.003) and have experienced more previous success (
β = 0.48,
p = 0.017) than Millennials.
3.3. The Role of Service Providers
Different service providers may be more or less qualified to support individuals to achieve their goals. To understand the views that individuals have concerning which service providers are more qualified to support individuals’ goals, each responder was asked to rate how much a particular provider would help them in attaining the goals they mentioned.
Educational establishments ranked highest overall, followed by healthcare providers and entertainment and technology companies, as shown in
Table 4.
There are some differences by gender, with males showing a higher affinity for providers in education, technology, and banking, while there are no significant differences between Millennial and Gen Z respondents. The prominent role of education can again potentially be explained by the population sampled, while healthcare can be linked to the high trust enjoyed by these providers. More unusual is the high score for entertainment and technology providers. The latter have typically not enjoyed a high level of trust in Switzerland as compared with local providers (
Pugnetti and Seitz 2021), but they nonetheless seem to be viewed as a reasonable partner to support achieving personal goals. Insurance does not appear to be a particularly desirable partner, as do many other established industries.
The respondents’ interest in receiving support by different service providers depends in general on the type of goal being pursued. This is the case for all but three of the service providers. While for healthcare providers the results are undifferentiated but high, for utilities and especially for insurance the results are undifferentiated and low, as shown in
Table 5. This could potentially indicate that these service providers have not established a clear profile in the eyes of Millennial and Gen Z customers. For insurance, this result is consistent with the existing literature (
Pugnetti and Bekaert 2018).
Table 5 also displays a heatmap of the difference between the desirability of support from different service providers for each type of goal, with values above average shaded in blue and values below average in red. Darker colors indicate larger deviations from the overall mean value. The significance of the variation of the preference for the support by a particular service provider was calculated using ANOVA.
Overall, respondents are more open to support from education providers for goals pertaining to intellectual competence, financial and occupational success, and to some extent morals and values. They are less open to goals focusing on health and family and to some extent on self-protect. Entertainment is particularly linked to openness to experience but not to health goals, whereas technology is sought after to support financial and occupational success but not family. These differentiated results can help service providers sharpen their profile and offer solutions particularly targeted at classes of problems and/or communicate effectively to address these prevailing perceptions. As discussed earlier, insurance companies are singularly undifferentiated in individuals’ perceptions and not particularly desired as a partner across all goals. Looking at the data by goal cluster, rather than by provider, some clusters can be observed, e.g., financial and occupational success, intellectual competence, and morals and values, are linked to higher provider preferences. On the other hand, other goal clusters, e.g., family, health, self-protect, and security and belonging, are linked to providers being excluded from customer preferences.
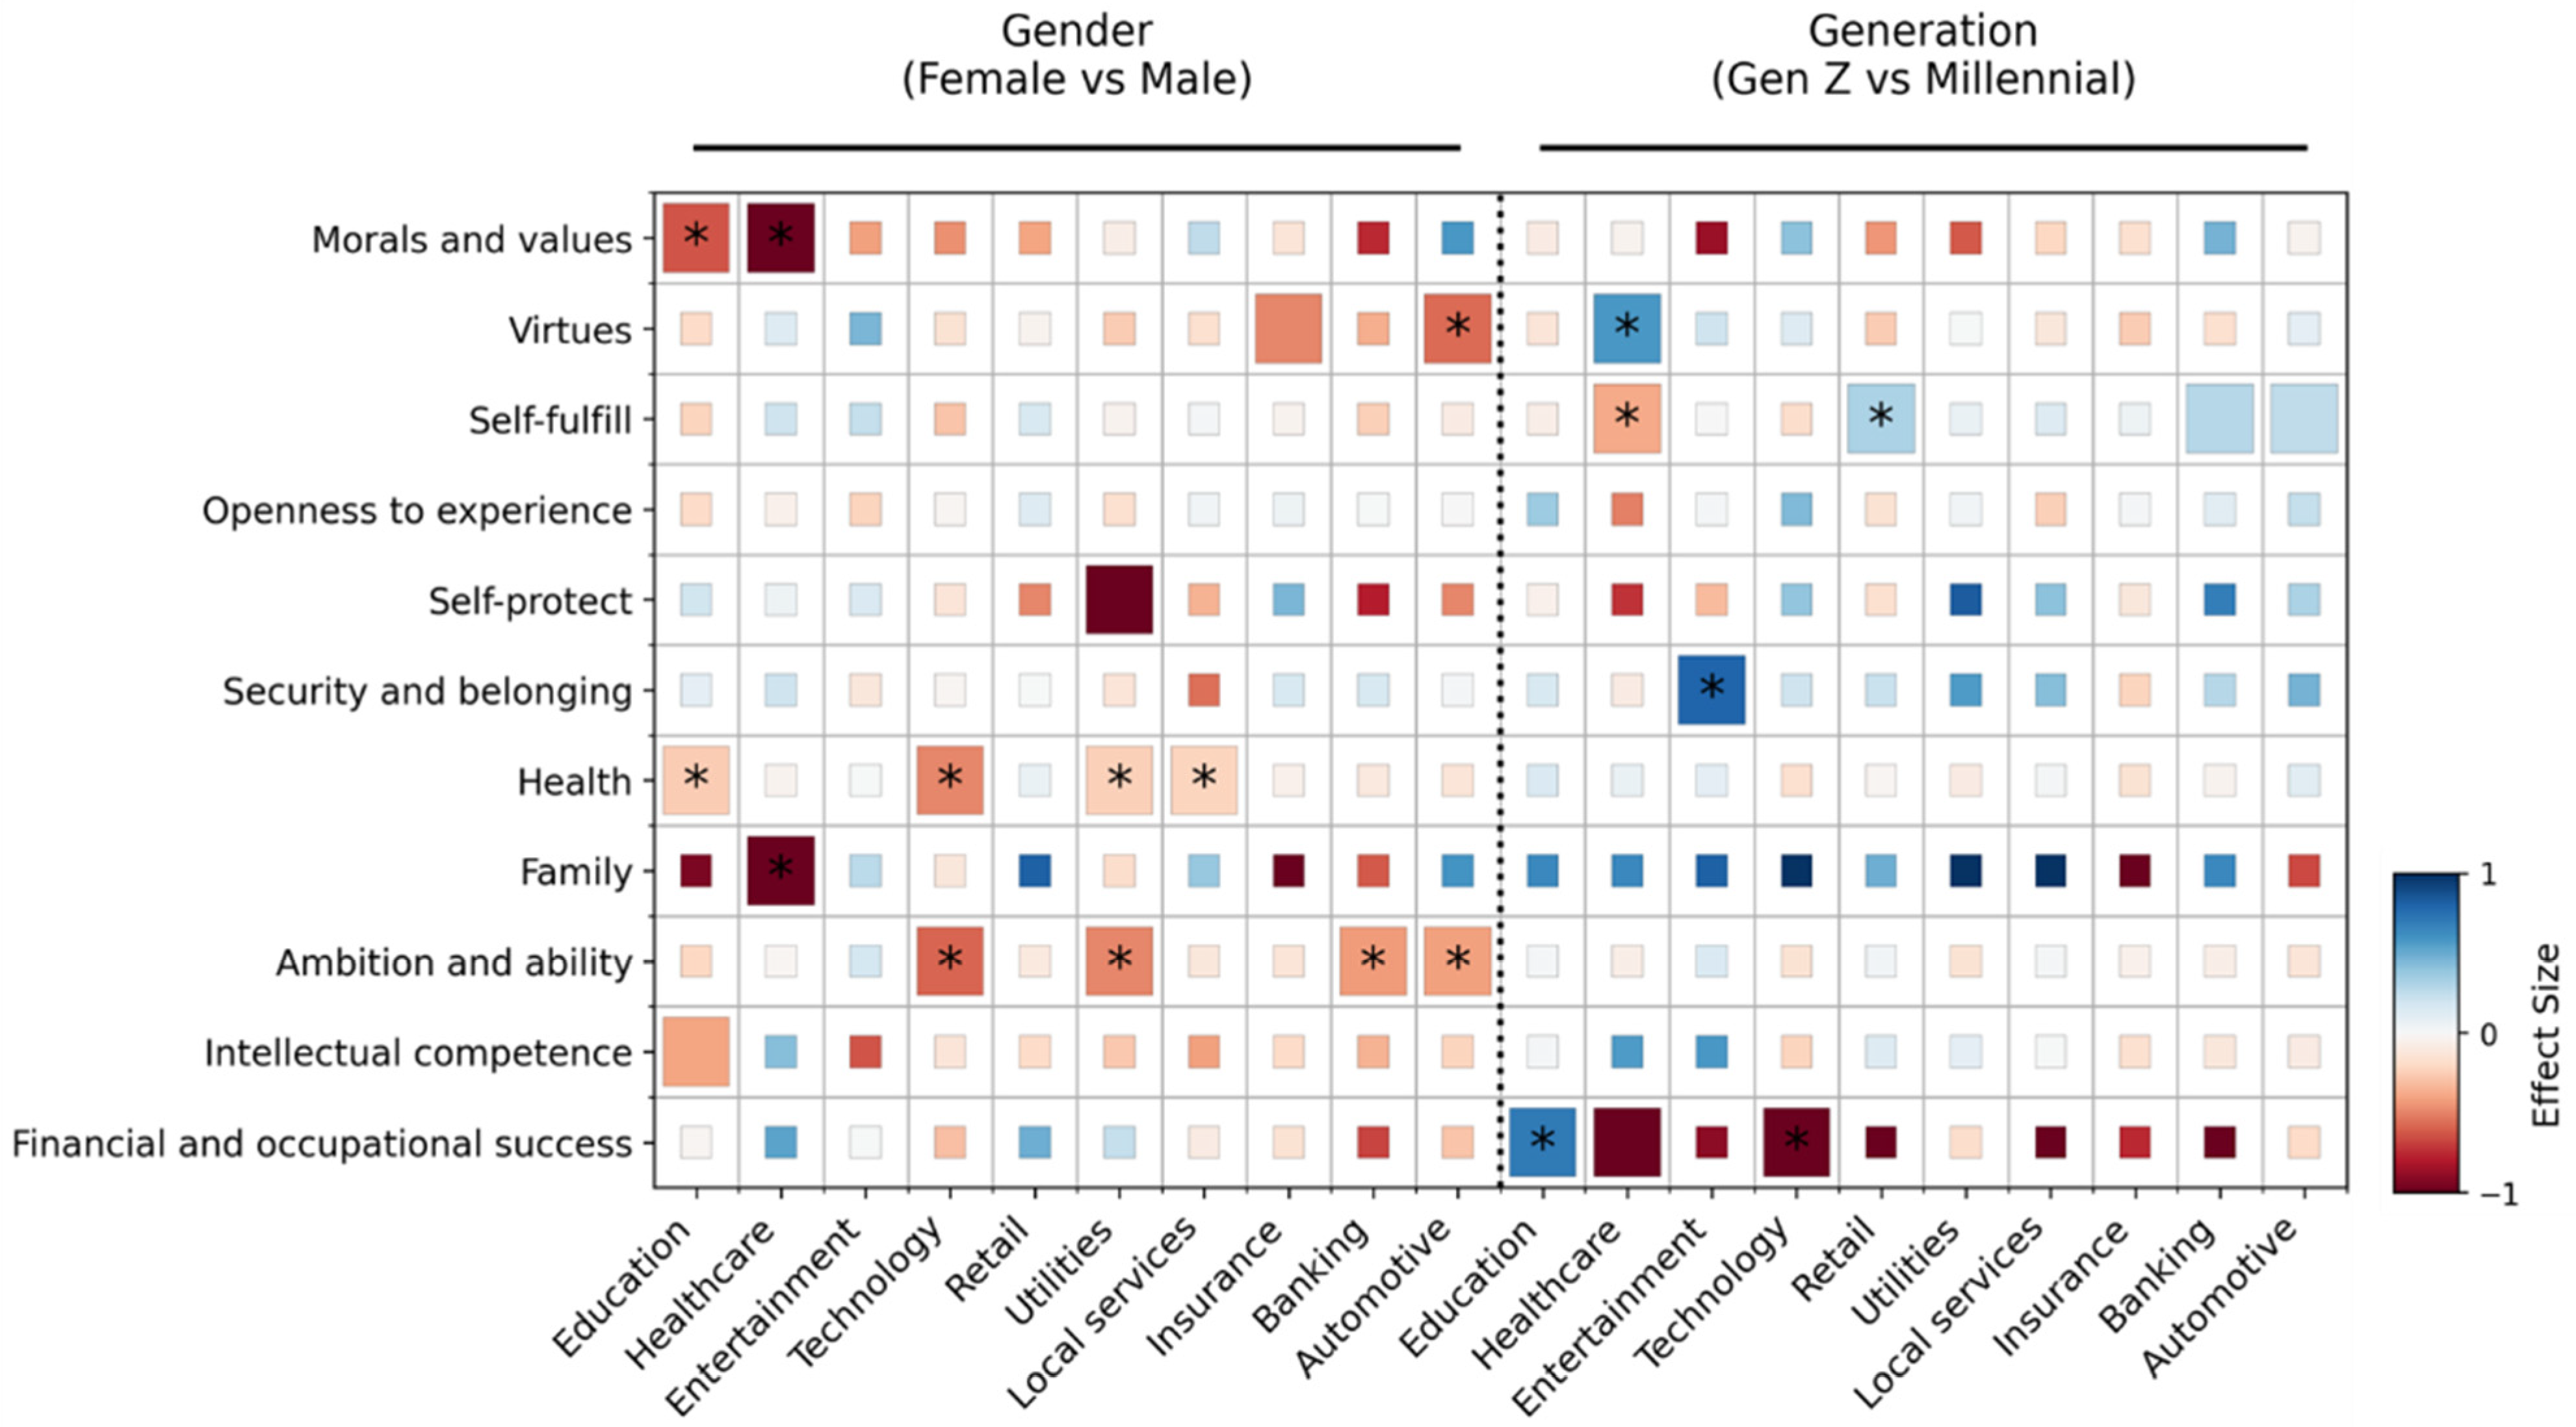
To understand gender or generational differences in service provider support across goals, the service provider ratings for each of the goals individuals mentioned were modeled with gender and generation as dependent variables. The results can be seen in
Figure 3. Where gender differences can be observed, female respondents overall are less open to support from service providers than males. This is more evident in
health-related goals, where education, technology, utilities, and local services are rated as less supportive by females than males. Similarly, females also find
ambition and ability goals as being less supported by technology, utilities, and banking and automotive services. These results suggest that overall males view service providers as a way to achieve their goals relative to females.
Generational differences can also be observed in some goal categories. For instance, in financial and occupational success goals, Millennials find more support from technology services, while Gen Zers value education more. Interestingly, Gen Zers also find more support from entertainment services for security and belonging goals than Millennials.
3.4. Preferred Type of Contact
Respondents also indicated their preferred type of contact with the supporting service providers. In general, respondents preferred an in-person conversation, followed by an email exchange or interaction through a mobile app, as shown in
Table 6.
Thus, even younger customers value personal advice and are open to email communications, vindicating to some extent traditional advice models, for example in insurance. The relatively high rank of a mobile app interaction seems to indicate that the new app-based advice models are being well-received by younger customers. Interaction by phone, on the other hand, scores in the bottom half of the rankings and is another indication of the continuing decline of the telephone as a communication channel among these age cohorts. Despite the widespread implementation of online teaching during COVID-19, or perhaps because of it, video calls are not an established channel and score lowest among all options.
The preferred type of contact also generally varies by the type of goal being pursued, as shown in
Table 7. The table shows a heatmap to understand variability across the different goal types, similarly to
Table 5 for shading. In-person contact is widely accepted, with the potential exception of
health. Email is a welcome channel for
financial and occupational success but not for
security and belonging. Mobile apps are less preferred for
security and belonging and
family, as are online portals in this latter category. Phone conversations are linked with
family but not with
health. Video calls also do not work well with
health but are a welcome communication channel for
financial and occupational success.
Table 7 can also be read vertically to provide insights for the affinity of different goals categories for the different communication channels. For
security and belonging and
health the selection is negative, with several channels below the average acceptance for that channel, while
financial and occupational success has a higher preference for several channels. For
family, the picture is more differentiated, with several channels below their respective average, with the exception of a stronger preference for phone conversations.
The preference for each communication channel is positively correlated with the preference for the service provider involved. However, here there are also nuances, as shown in
Table 8. The table summarizes the linear regression coefficients for type of contact preference based on the preference for a particle type of service provider.
The acceptance of interaction through an online portal is only weakly correlated to the preference for service providers, indicating an overall acceptance for the channel. This is true to some extent for email, mobile app, and chat. In these three channels, it is interesting to notice the higher regression coefficient for technology service providers, indicating that they should potentially pay more attention to select communication channels when they are not the provider of choice. In-person, phone, and video call communication, on the other hand, are strongly linked to provider preference. A potential interpretation is that for synchronous communication modes, consumers would like to interact with preferred service providers if possible.
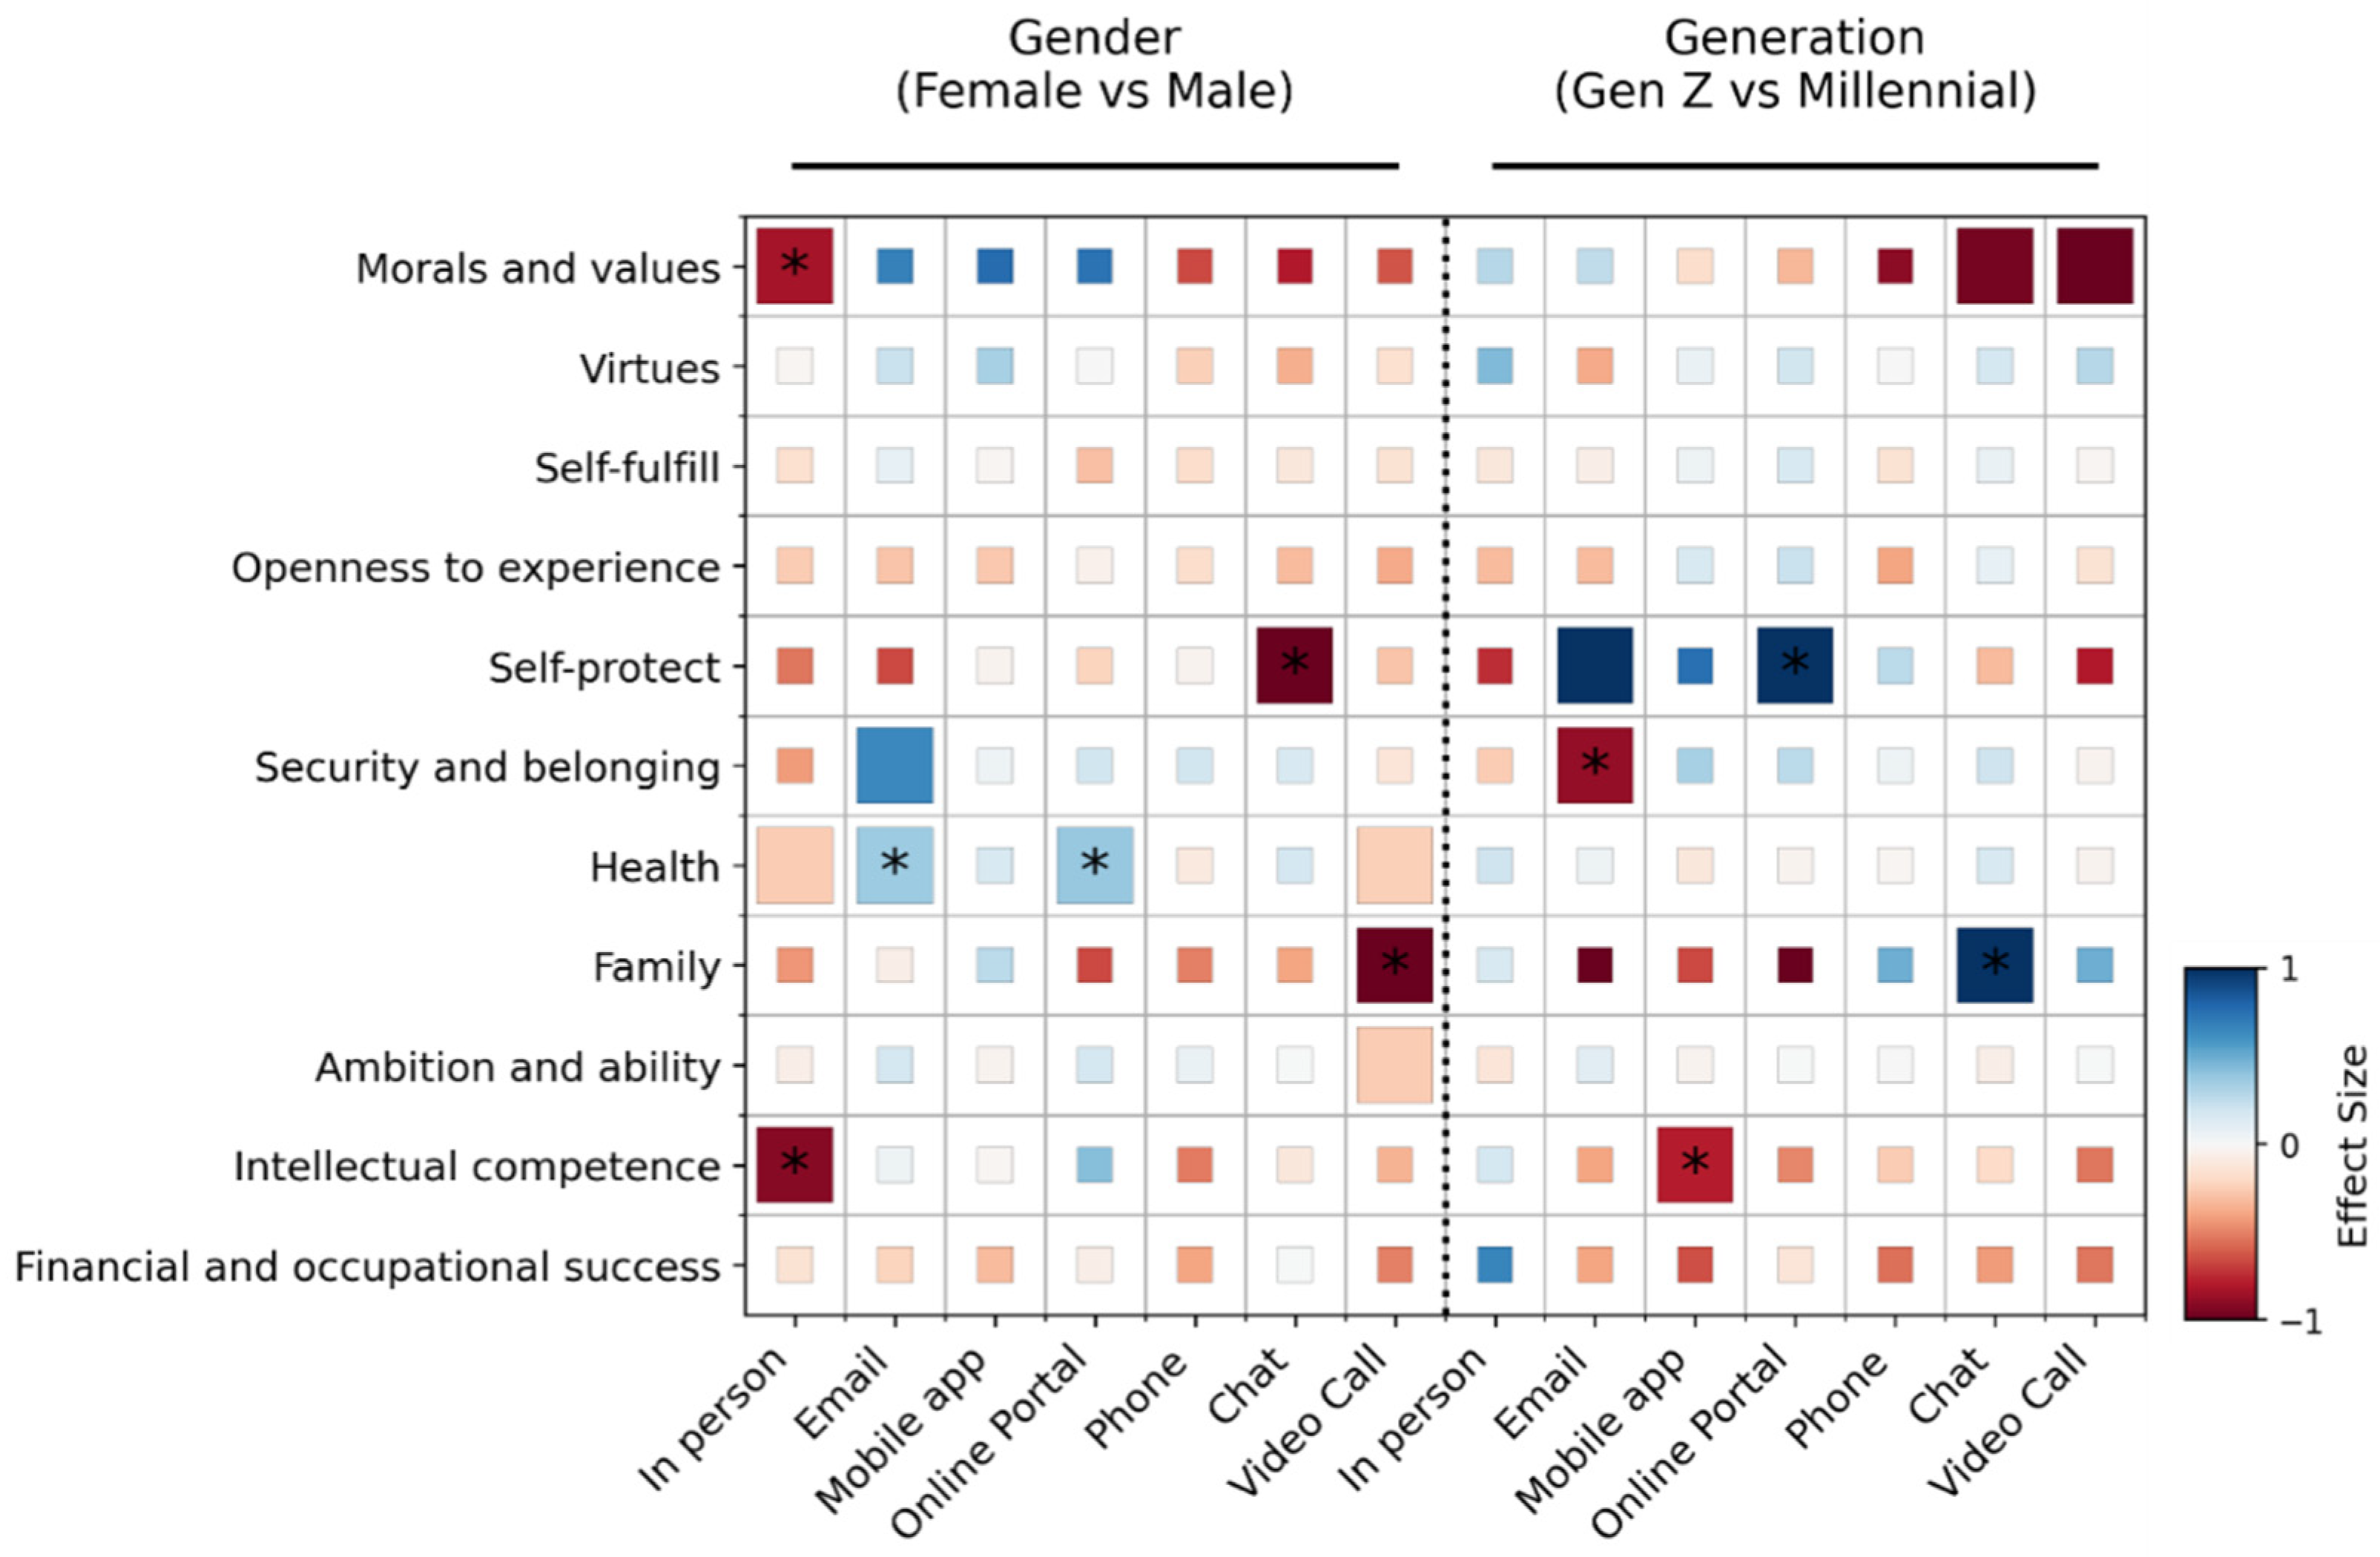
Looking at gender or generational differences in type of contact preferences across goals (
Figure 4), female respondents are less inclined to prefer in-person contact for
intellectual competence and
morals and values-related goals than their male counterparts. On the other hand, they tend to prefer email and online portal contact for
health goals relative to male respondents.
Some generational differences can also be observed, with Millennials preferring email contact for security and belonging goals and mobile apps for intellectual competence goals, while Gen Zers have a preference for online-portal-mediated contact for self-protect-related goals.


