
Impact of COVID-19, Political, and Financial Events on the Performance of Commercial Banking Sector


Abstract
:1. Introduction
2. Literature Review
3. Methodology and Model Specifications
3.1. Model Specifications
3.1.1. ARCH Model
3.1.2. GARCH Model
3.1.3. Impulse Indicator Saturation (IIS)
4. Results and Discussion
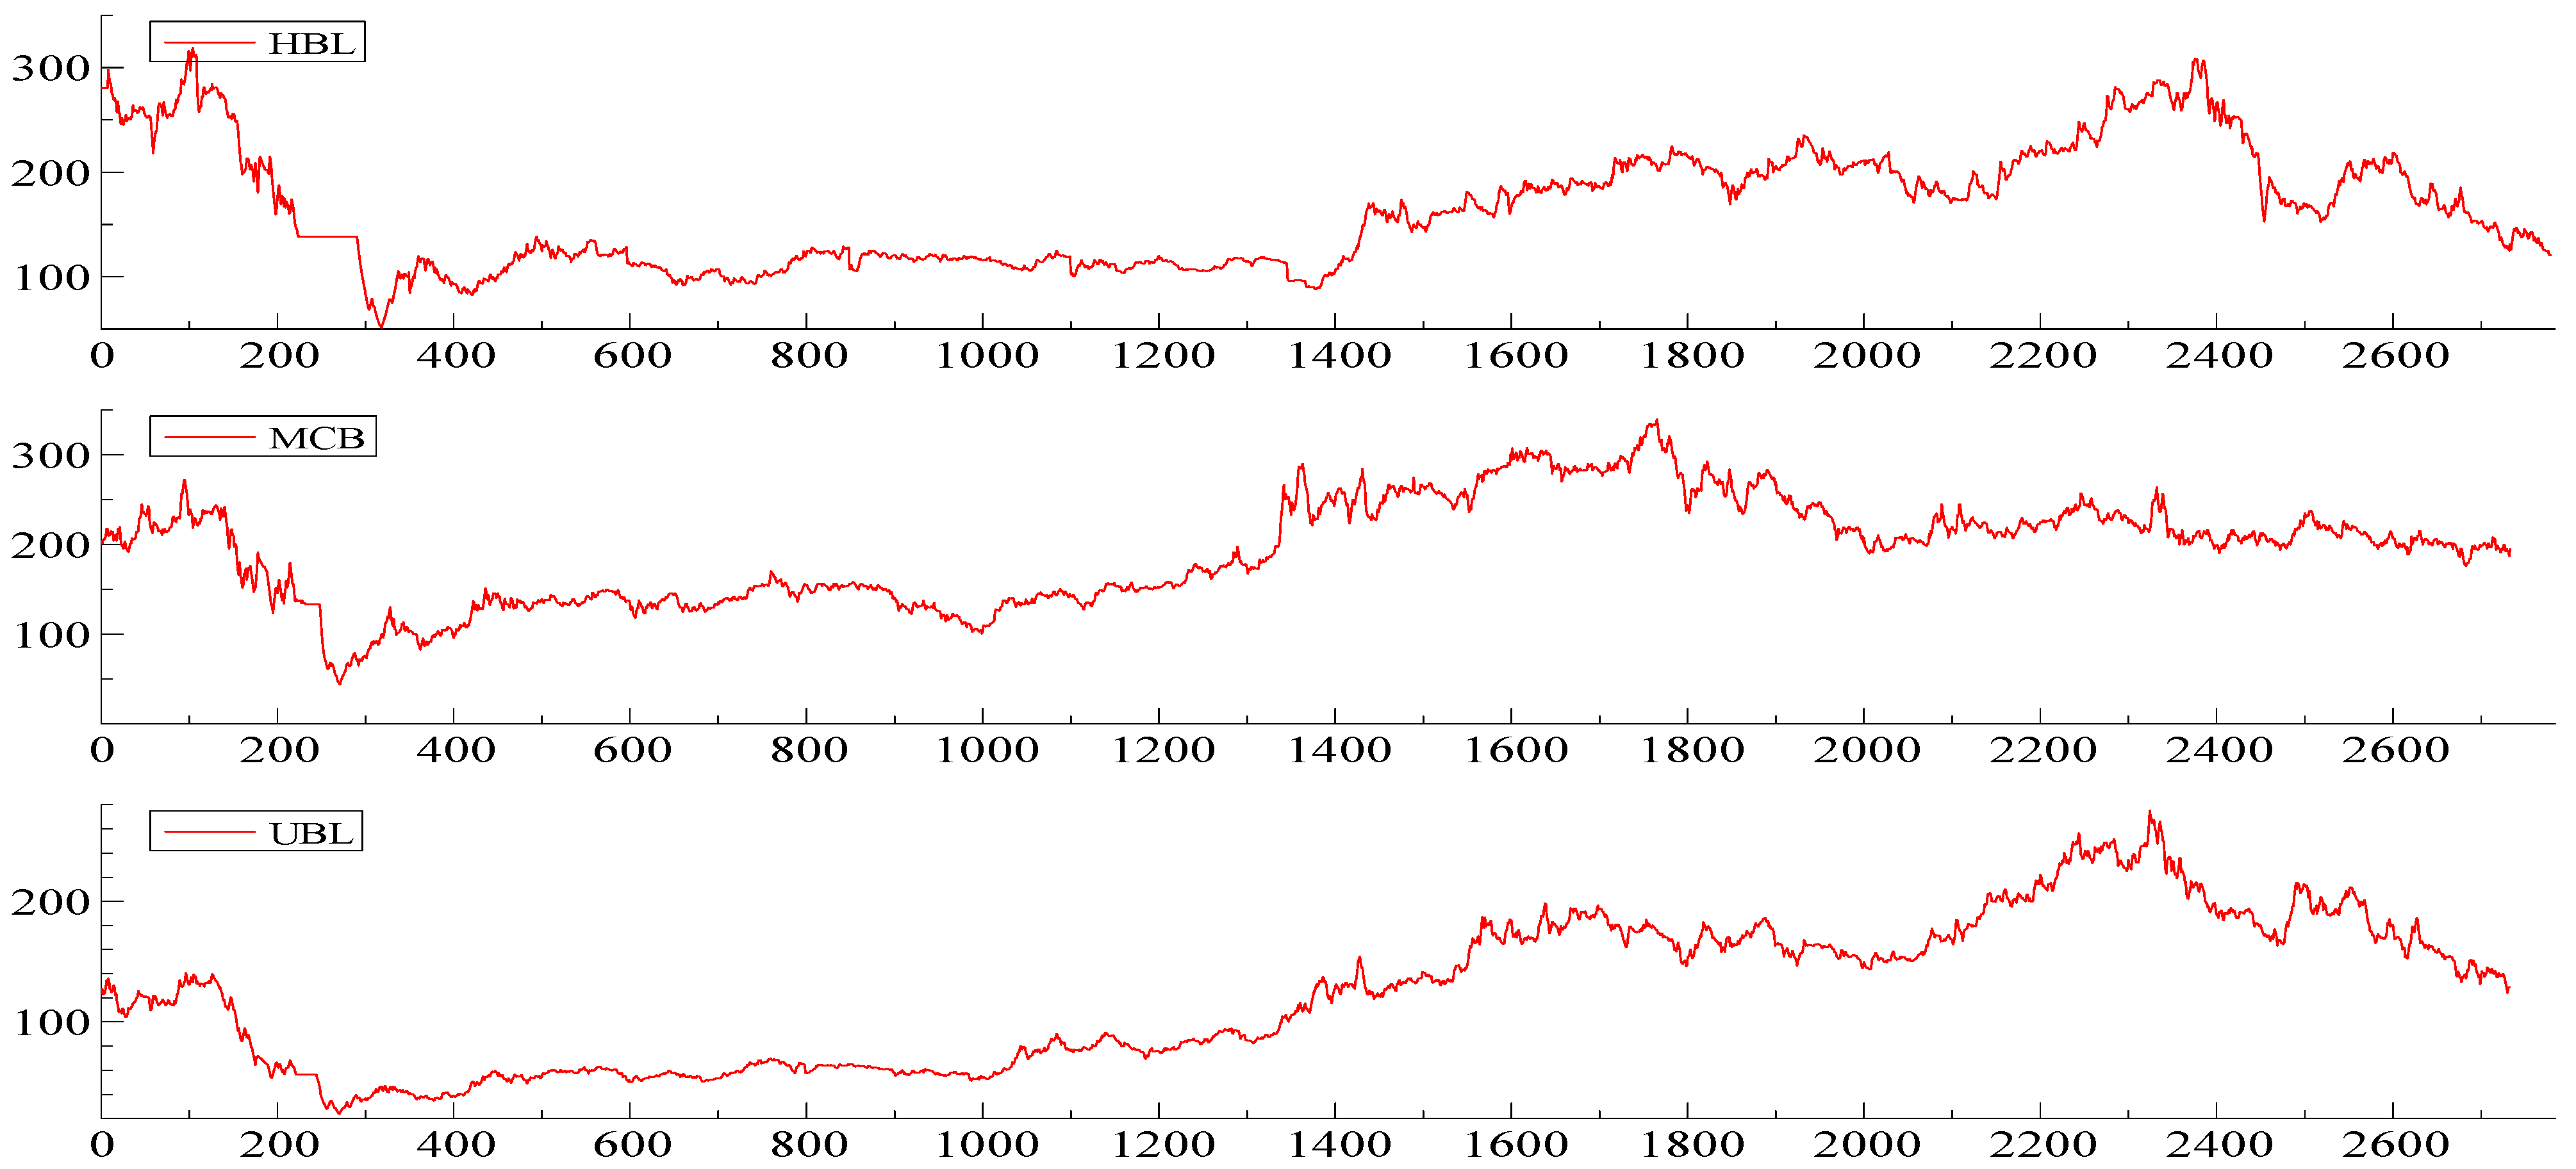
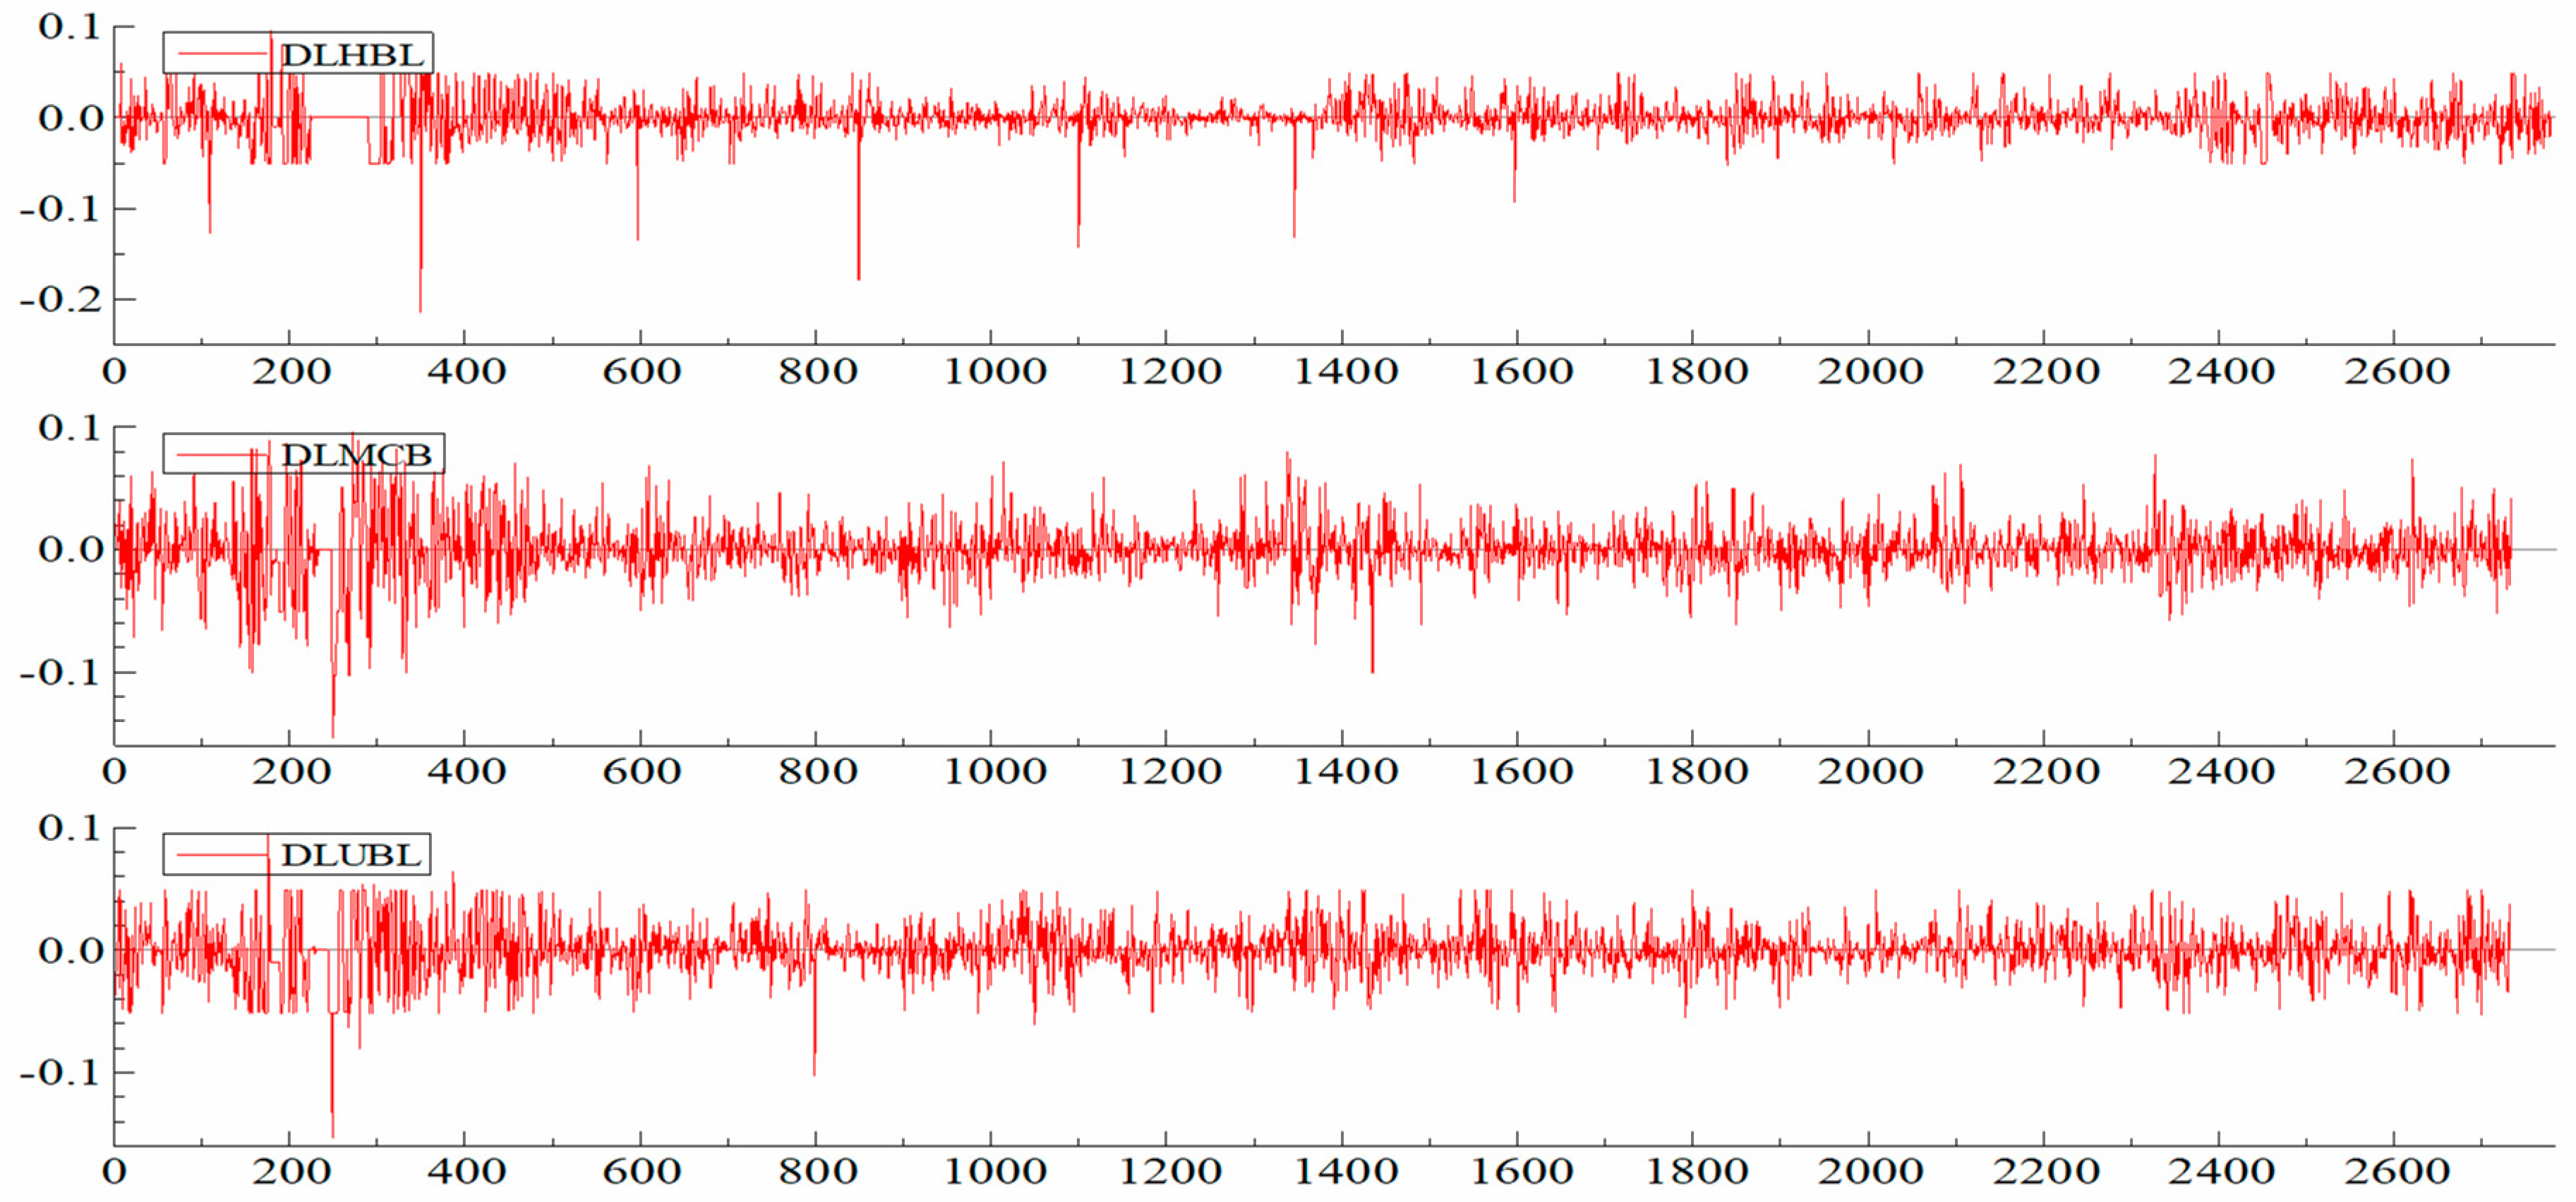
4.1. Graphical Analysis
4.2. Descriptive Statistics
4.3. Volatility Modeling
5. Conclusions and Policy Recommendations
Author Contributions
Funding
Data Availability Statement
Conflicts of Interest
| 1 | For Islamic finance rview, please refer to Al Rahahleh et al. (2019) and on Islamic Mutual fund Al Rahahleh and Bhatti (2022). |
References
- Adeinat, Iman, Naseem Al Rahahleh, and M. Ishaq Bhatti. 2019. Customer satisfaction with Ijarah financing: The mediating role of clarity and accuracy for services offered. Qualitative Research in Financial Markets 11: 227–43. [Google Scholar] [CrossRef]
- Ahmad, Wisal, Noman Khan, Abid Usman, Fawad Ahmad, and Yasir Khalil. 2017. Stock Market Reaction to Political Event’Sit-In’(Evidence from Pakistan). Journal of Managerial Sciences 11: 1. [Google Scholar]
- Ahmed, Sheharyar. 2020. Impact of COVID-19 on Performance of Pakistan Stock Exchange. Available online: https://ssrn.com/abstract=3643316 (accessed on 1 December 2019).
- Al Rahahleh, N., M. Ishaq Bhatti, and F. Najuna Misman. 2019. Developments in risk management in Islamic finance: A review. Journal of Risk and Financial Management 12: 37. [Google Scholar] [CrossRef] [Green Version]
- Al Rahahleh, Naseem, and M. Ishaq Bhatti. 2022. Empirical comparison of Shariah-compliant vs conventional mutual fund performance. International Journal of Emerging Markets. Available online: https://www.emerald.com/insight/content/doi/10.1108/IJOEM-05-2020-0565/full/html (accessed on 1 January 2022). [CrossRef]
- Aloui, R., M. S. B. Aïssa, and D. K. Nguyen. 2011. The global financial crisis, extreme interdependences, and contagion effects: The role of economic structure? Journal of Banking and Finance 35: 130–41. [Google Scholar] [CrossRef]
- Baker, Scott R., Robert A. Farrokhnia, Steffen Meyer, Michaela Pagel, and Constantine Yannelis. 2020. How does household spending respond to an epidemic? Consumption during the 2020 COVID-19 pandemic. The Review of Asset Pricing Studies 10: 834–62. [Google Scholar] [CrossRef]
- Bekiros, Stelios D. 2014. Contagion, decoupling and the spillover effects of the US financial crisis: Evidence from the BRIC markets. International Review of Financial Analysis 33: 58–69. [Google Scholar] [CrossRef]
- Bollerslev, Tim. 1986. Generalised Autoregressive Conditional Heteroskedasticity. Journal of Econometrics 31: 307–27. [Google Scholar] [CrossRef] [Green Version]
- Chen, Nai-Fu, Richard Roll, and Stephen A. Ross. 1986. Economic forces and the stock market. Journal of Business 59: 383–403. [Google Scholar] [CrossRef]
- Claessens, Stijn, and Erik Feijen. 2007. Financial Sector Development and the Millennium Development Goals. Washington, DC: The World Bank. [Google Scholar]
- Coatesworth, W., and E. Dimitriou. 2013. Asset strategies for life annuities. The Actuary, March 18. [Google Scholar]
- Dimpfl, Thomas. 2011. The impact of US news on the German stock market—An event study analysis. The Quarterly Review of Economics and Finance 51: 389–98. [Google Scholar] [CrossRef]
- Doornik, J. A., D. F. Hendry, and F. Pretis. 2013. Step-Indicator Saturation. Oxford: University of Oxford, Department of Economics. [Google Scholar]
- Eichenbaum, Martin S., Sergio Rebelo, and Mathias Trabandt. 2020. Epidemics in the Neoclassical and New Keynesian Models. (No. w27430). Cambridge: National Bureau of Economic Research. [Google Scholar]
- Engle, Robert F. 1982. Autoregressive conditional heteroscedasticity with estimates of the variance of United Kingdom inflation. Econometrica: Journal of the Econometric Society 50: 987–1007. [Google Scholar] [CrossRef]
- Fama, Eugene F., Lawrence Fisher, Michael Jensen, and Richard Roll. 1969. The adjustment of stock prices to new information. International Economic Review 10: 1–21. [Google Scholar] [CrossRef]
- Fazl-E-Haider, S. 2018. Banking Sector Advancement in Pakistan. Pakistan and Gulf Economist. Available online: http://www.pakistaneconomist.com/2018/04/09/banking-sector-advancement-pakistan/ (accessed on 1 January 2022).
- Foerster, Stephen R., and John J. Schmitz. 1997. The transmission of US election cycles to international stock returns. Journal of International Business Studies 28: 1–13. [Google Scholar] [CrossRef]
- Gärtner, Manfred, and Klaus W. Wellershoff. 1995. Is there an election cycle in American stock returns? International Review of Economics & Finance 4: 387–410. [Google Scholar]
- Ghouse, Ghulam, and Saud Ahmed Khan. 2017. Tracing dynamic linkages and spillover effect between Pakistani and leading foreign stock markets. Review of Financial Economics 35: 29–42. [Google Scholar] [CrossRef]
- Ghouse, Ghulam, Asad Ali Ashraf, and Kashif Habeeb. 2021a. Tracing Return and Volatility Spillover Effect between Exchange Rate and Pakistan Stock Exchange Index. Journal of Quantitative Methods 5: 193–216. [Google Scholar]
- Ghouse, Ghulam, Aribah Aslam, and Muhammad Ishaq Bhatti. 2021b. Role of Islamic Banking during COVID-19 on Political and Financial Events: Application of Impulse Indicator Saturation. Sustainability 13: 11619. [Google Scholar] [CrossRef]
- Ghouse, Ghulam, Saud Ahmed Khan, and Muhammad Arshad. 2019. Volatility Modelling and Dynamic Linkages between Pakistani and Leading Foreign Stock Markets: A Multivariate GARCH Analysis. The Pakistan Development Review 58: 265–82. [Google Scholar]
- Gulzar, Saqib, Ghulam Mujtaba Kayani, Hui Xiaofen, Usman Ayub, and Amir Rafique. 2019. Financial cointegration and spillover effect of global financial crisis: A study of emerging Asian financial markets. Economic Research-Ekonomska istraživanja 32: 187–218. [Google Scholar] [CrossRef] [Green Version]
- Hamza, Syed Muhammad, and Ejaz Ahmed Khan. 2014. Effect of banking sector performance in Economic growth Case study of Pakistan. Journal of Applied Environmental and Biological Sciences 4: 444–49. [Google Scholar]
- He, Pinglin, Yulong Sun, Ying Zhang, and Tao Li. 2020. COVID-19’s impact on stock prices across different sectors—An event study based on the Chinese stock market. Emerging Markets Finance and Trade 56: 2198–212. [Google Scholar] [CrossRef]
- Herbst, Anthony F., and Craig W. Slinkman. 1984. Political-economic cycles in the US stock market. Financial Analysts Journal 40: 38–44. [Google Scholar] [CrossRef]
- Ho, Linh Tu, and Christopher Gan. 2021. Foreign direct investment and world pandemic uncertainty index: Do health pandemics matter? Journal of Risk and Financial Management 14: 107. [Google Scholar] [CrossRef]
- Hobbs, Gerald R., and William B. Riley. 1984. Profiting from a presidential election. Financial Analysts Journal 40: 46–52. [Google Scholar] [CrossRef]
- Huang, Philip. 1985. The Peasant Economy and Social Change in North China. Redwood City: Stanford University Press. [Google Scholar]
- Im, Kun Shin, Kevin E. Dow, and Varun Grover. 2001. A reexamination of IT investment and the market value of the firm—An event study methodology. Information Systems Research 12: 103–17. [Google Scholar] [CrossRef]
- Irshad, Hira. 2017. Relationship among political instability, stock market returns and stock market volatility. Studies in Business and Economics 12: 70–99. [Google Scholar] [CrossRef] [Green Version]
- Javaid, Saira, Anwar Jamil, Khalid Zaman, and Abdul Gafoor. 2011. Determinants of bank profitability in Pakistan: Internal factor analysis. Mediterranean Journal of Social Sciences 2: 3794. [Google Scholar]
- Javed, Attiya Y., and Ayaz Ahmed. 1999. The Response of Karachi stock exchange to nuclear detonation. The Pakistan Development Review 38: 777–86. [Google Scholar] [CrossRef] [Green Version]
- Javid, Attiya Yasmin, and Bilal Ahmad. 2020. Event study and impulse indicator saturation analysis to assess reaction of terrorist and political events: Evidence from oil and gas sector of Pakistan. Journal of Quantitative Methods 4: 77–98. [Google Scholar] [CrossRef]
- Jones, Steven T., and Kevin Banning. 2009. US elections and monthly stock market returns. Journal of Economics and Finance 33: 273. [Google Scholar] [CrossRef]
- Kalsoom, Ume, Sheheryar Javed, Rizwan Ullah Khan, and Arif Maqsood. 2021. Stock market flexibility during COVID-19 pandemic: Evidence from Pakistan. Journal of Economic and Administrative Sciences. Available online: https://www.emerald.com/insight/content/doi/10.1108/JEAS-07-2021-0131/full/html?utm_source=rss&utm_medium=feed&utm_campaign=rss_journalLatest (accessed on 1 January 2022). [CrossRef]
- Kashif, Muhammad, Rana Palwishah, Rizwan Raheem Ahmed, Jolita Vveinhardt, and Dalia Streimikiene. 2021. Do investors herd? An examination of Pakistan stock exchange. International Journal of Finance and Economics 26: 2090–105. [Google Scholar] [CrossRef]
- Kenourgios, Dimitris, Aristeidis Samitas, and Nikos Paltalidis. 2011. Financial crises and stock market contagion in a multivariate time-varying asymmetric framework. Journal of International Financial Markets, Institutions, and Money 21: 92–106. [Google Scholar] [CrossRef]
- Khan, Dilawar, Arif Ullah, Wajid Alim, and Ihtisham ul Haq. 2022. Does terrorism affect the stock market returns and volatility? Evidence from Pakistan’s stock exchange. Journal of Public Affairs 22: e2304. [Google Scholar] [CrossRef]
- Kim, Suk-Joong. 2009. The spillover effects of target interest rate news from the US Fed and the European Central Bank on the Asia-Pacific stock markets. Journal of International Financial Markets, Institutions and Money 19: 415–31. [Google Scholar] [CrossRef] [Green Version]
- Kraus, Sascha, Thomas Clauss, Matthias Breier, Johanna Gast, Alessandro Zardini, and Victor Tiberius. 2020. The economics of COVID-19: Initial empirical evidence on how family firms in five European countries cope with the corona crisis. International Journal of Entrepreneurial Behavior and Research. Available online: https://www.emerald.com/insight/content/doi/10.1108/IJEBR-04-2020-0214/full/html (accessed on 1 January 2022). [CrossRef]
- Levine, Ross, and Sara Zervos. 1998. Stock markets, banks, and economic growth. American Economic Review 88: 537–58. [Google Scholar]
- Lilley, Andrew, Matthew Lilley, and Gianluca Rinaldi. 2020. Public Health Interventions and Economic Growth: Revisiting the Spanish Flu Evidence. Available online: https://ssrn.com/abstract=3590008 (accessed on 1 January 2022).
- Luchtenberg, Kimberly F., and Quang Viet Vu. 2015. The 2008 financial crisis: Stock market contagion and its determinants. Research in International Business and Finance 33: 178–203. [Google Scholar] [CrossRef]
- Mahmood, Shahid, Muhammad Irfan, Saeed Iqbal, Muhammad Kamran, and Ali Ijaz. 2014. Impact Of Political Events on Stock Market: Evidence from Pakistan. Journal of Asian Business Strategy 4: 163–74. [Google Scholar]
- Mehmood, Waqas, Rasidah Mohd-Rashid, and Abd Halim Ahmad. 2020. The variability of IPO issuance: Evidence from Pakistan stock exchange. Global Business Review, 0972150920929198. Available online: https://journals.sagepub.com/doi/full/10.1177/0972150920929198 (accessed on 1 January 2022). [CrossRef]
- Murtaza, Hamza, and Rafaqat Ali. 2015. Impact of major political events on stock market returns of Pakistan. Public Policy and Administration Research 5: 68–84. [Google Scholar]
- Narayan, Seema, and Paresh Kumar Narayan. 2012. Do the US macroeconomic conditions affect Asian stock markets? Journal of Asian Economics 23: 669–79. [Google Scholar] [CrossRef]
- Nazir, Mian Sajid, Hassan Younus, Ahmad Kaleem, and Zeshan Anwar. 2014. Impact of political events on stock market returns: Empirical evidence from Pakistan. Journal of Economic and Administrative Sciences. Available online: https://www.emerald.com/insight/content/doi/10.1108/JEAS-03-2013-0011/full/html?af=R (accessed on 1 January 2022).
- Nazir, Mian Sajid, Muhammad Musarat Nawaz, Waseem Anwar, and Farhan Ahmed. 2010. Determinants of stock price volatility in karachi stock exchange: The mediating role of corporate dividend policy. International Research Journal of Finance and Economics 55: 100–7. [Google Scholar]
- Neaime, Simon. 2012. The global financial crisis, financial linkages, and correlations in returns and volatilities in emerging MENA stock markets. Emerging Markets Review 13: 268–82. [Google Scholar] [CrossRef]
- Niederhoffer, Victor, Steven Gibbs, and Jim Bullock. 1970. Presidential elections and the stock market. Financial Analysts Journal 26: 111–13. [Google Scholar]
- Norouzi, Nima, Gerardo Zarazua de Rubens, Saeed Choupanpiesheh, and Peter Enevoldsen. 2020. When pandemics impact economies and climate change: Exploring the impacts of COVID-19 on oil and electricity demand in China. Energy Research and Social Science 68: 101654. [Google Scholar] [CrossRef]
- Opoku-Agyemang, D. A. 2015. Factors Influencing the Profitability of Domestic and Foreign Banks in Ghana. Ghana: AARHUS University. [Google Scholar]
- Pantzalis, Christos, David A. Stangeland, and Harry J. Turtle. 2000. Political elections and the resolution of uncertainty: The international evidence. Journal of Banking and Finance 24: 1575–604. [Google Scholar] [CrossRef]
- Patnaik, Anuradha. 2022. Measuring Demand and Supply Shocks From COVID-19: An Industry-Level Analysis for India. Margin: The Journal of Applied Economic Research 16: 76–105. [Google Scholar] [CrossRef]
- Pearce, Douglas K., and V. Vance Roley. 1984. Stock Prices and Economic News. (No. w1296). Cambridge: National Bureau of Economic Research. [Google Scholar]
- Riley, William B., and William A. Luksetich. 1980. The market prefers republicans: Myth or reality. Journal of Financial and Quantitative Analysis 15: 541–60. [Google Scholar] [CrossRef]
- Saeed, Muhammad, Ijaz Ahmad, and Muhammad Ahmad Usman. 2021. Do the stocks’ returns and volatility matter under the COVID-19 pandemic? A Case Study of Pakistan Stock Exchange. iRASD Journal of Economics 3: 13–26. [Google Scholar] [CrossRef]
- Santos, Carlos, David F. Hendry, and Soren Johansen. 2008. Automatic selection of indicators in a fully saturated regression. Computational Statistics 23: 317–35. [Google Scholar] [CrossRef] [Green Version]
- Shah, Syed Ateeb Akhter, Fatima Kaneez, and Mannan Zaheer. 2021. The Impact of COVID-19 on Stock Market and Exchange Rate Uncertainty in Pakistan. IBA Business Review 16: 2. [Google Scholar]
- Sohail, Asiya, and Attiya Yasmin Javid. 2014. The Global Financial Crisis and Investors’ Behavior; Evidence from the Karachi Stock Exchange. No 106. Islamabad Capital Territory: Pakistan Institute of Development Economics. [Google Scholar]
- Sulehri, Fiaz Ahmad, and Amjad Ali. 2020. Impact of political uncertainty on pakistan stock exchange: An event study approach. Journal of Advanced Studies in Finance 11: 194–207. [Google Scholar] [CrossRef]
- Waheed, Rida, Suleman Sarwar, Sahar Sarwar, and Muhammad Kaleem Khan. 2020. The impact of COVID-19 on Karachi stock exchange: Quantile-on-quantile approach using secondary and predicted data. Journal of Public Affairs 20: e2290. [Google Scholar] [CrossRef]
- Yarovaya, Larisa, Janusz Brzeszczyński, and Chi Keung Marco Lau. 2016. Intra-and inter-regional return and volatility spillovers across emerging and developed markets: Evidence from stock indices and stock index futures. International Review of Financial Analysis 43: 96–114. [Google Scholar] [CrossRef] [Green Version]
- Zhang, Dayong, Min Hu, and Qiang Ji. 2020. Financial markets under the global pandemic of COVID-19. Finance Research Letters 36: 101528. [Google Scholar] [CrossRef]


| Dates | Category | Detail | Source |
|---|---|---|---|
| 14-November-07 | Internal Affair | Closure of TV Channels | http://www.brecorder.com/2007/11/20071120654385/ (accessed on 10 August 2021) |
| 19-February-08 | Pakistan’s General Elections 2008 | PPP elected their Prime Minister | https://www.reuters.com/article/us-pakistan-politics-idUSISL7451920080324 (accessed on 10 August 2021) |
| 15-May-08 | Internal Affair | Lawyers Movement for Chief Justice of Pakistan (Justice Iftikhar Ahmed) | https://www.nytimes.com/2008/06/01//01PAKISTAN-t.html (accessed on 10 August 2021) |
| 7-September-08 | The Financial crisis | 2008 Global Financial crisis | https://www.federalreservehistory.org/essays/great-recession-and-its-aftermath (accessed on 10 August 2021) |
| 11-March-09 | Internal Affair | Long March organized by PML-N | https://www.aljazeera.com/news/2009/3/12/pakistans-long-march-to-stability (accessed on 10 August 2021) |
| 10-June-10 | Internal Affair | Punjab Government opposed Rah-e-Najaat | https://www.pakistanarmy.gov.pk/WOT-year.php (accessed on 10 August 2021) |
| 2-May-11 | Foreign Affair | Operation Neptune Spear | https://www.911memorial.org/learn/resources/digital-exhibitions/digital-exhibition-revealed-hunt-bin-laden/operation-neptune-spear (accessed on 10 August 2021) |
| 28-October-11 | Long March/Political Gathering | Long March started by PMLN | https://onlinelibrary.wiley.com/doi/abs/10.1111/j.2041-9066.2011.00068.x (accessed on 10 August 2021) |
| 31-October-11 | Political Gathering | Pakistan Tehreek-e-Insaf organized a political gathering | https://www.latimes.com/world/la-xpm-2011-dec-26-la-fg-pakistan-rally-20111226-story.html (accessed on 10 August 2021) |
| 18-June-12 | Internal Affair | Yousef Raza Gillani dismissal | https://www.dawn.com/news/727782 (accessed on 10 August 2021) |
| 15-January-13 | Long March/Political Gathering | Pakistan Awami Tehreek Protest against PPP | https://www.dw.com/en/no-revolution-in-pakistan-at-least-not-for-now/a-16532257 (accessed on 10 August 2021) |
| 13-May-13 | Elections | PML-N formed a new Government in Pakistan | https://www.reuters.com/article/us-pakistan-election-idUSBRE94F0B520130516 (accessed on 10 August 2021) |
| 5-June-13 | Internal Affair | Nawaz Sharif became the 20th PM of Pakistan | https://na.gov.pk/en/priminister_list.php (accessed on 10 August 2021) |
| 15-August-14 | Long March/Political Gathering | Protest against rigging by PAT and PTI | https://participedia.net/case/4514 (accessed on 10 August 2021) |
| 19-August-14 | Internal Affair | Announcement of Civil disobedience by PTI | https://www.dawn.com/news/1126126 (accessed on 10 August 2021) |
| 20-February-18 | Internal Affair | Supreme Court terminated Nawaz Sharif on embalmment | https://www.dawn.com/news/1348191 (accessed on 10 August 2021) |
| 13-July-18 | Internal Affair | PML-N leaders arrested by Police | https://www.bbc.com/news/world-asia-49277829 (accessed on 10 August 2021) |
| 25-July-18 | Internal Affair | New Elections conducted in Pakistan | https://www.orfonline.org/research/pakistan-general-elections-2018-analysis-of-results-and-implications-46324/ (accessed on 10 August 2021) |
| 26-July-18 | Internal Affair | PTI bagged the highest seat | https://www.ecp.gov.pk/frmGenericPage.aspx?PageID=3213 (accessed on 10 August 2021) |
| 9-October-18 | Exchange rate | Pakaistani rupee depreciation | https://www.dawn.com/news/1651372 (accessed on 10 August 2021) |
| 30-November-18 | Exchange rate | Rupee depreciation from 131.95 to 136.51 | https://www.cnbc.com/2018/11/30/pakistani-rupee-plunges-in-likely-central-bank-devaluation-traders.html (accessed on 10 August 2021) |
| 19-March-20 | The first outbreak of COVID-19 | First COVID-19 patient admitted to a hospital. | http://www.emro.who.int/pak/pakistan-news/who-extends-support-to-pakistan-as-it-confirms-its-first-two-cases-of-covid-19.html (accessed on 10 August 2021) |
| 23-March-20 | First, lockdown in Karachi | Lockdown in Karachi and closure of PSX. | https://www.aa.com.tr/en/asia-pacific/pakistan-karachis-province-set-for-covid-19-lockdown/1774971 (accessed on 10 August 2021) |
| 31-May-20 | Nation-wide lockdown due to COVID-19 | Nation-wide lockdown due to COVID-19. | https://crisis24.garda.com/alerts/2020/04/pakistan-government-extends-nationwide-lockdown-until-april-30-update-18?origin=fr_riskalert (accessed on 10 August 2021) |
| Series | Mean | Standard Deviation | Skewness | Jarque Bera | Excess Kurtosis | Q-Stat (5) | Q2-Stat (5) | ARCH 1–2 | KPSS |
|---|---|---|---|---|---|---|---|---|---|
| HBL | −0.2149 | 0.0204 | −0.9096 (0.0000) | 1168 (0.0000) | 9.968 (0.0000) | 79.365 (0.0000) | 89.703 (0.0000) | 25.503 (0.0000) | 0.199 |
| MCB | −0.1539 | 0.0226 | −0.1889 (0.0000) | 1517.5 (0.0021) | 3.632 (0.0000) | 23.595 (0.0000) | 23.157 (0.0000) | 4.849 (0.0003) | 0.072 |
| UBL | −0.1538 | 0.0200 | −0.1838 (0.0000) | 650.48 (0.0000) | 2.363 (0.0000) | 4.3332 (0.5025) | 6.766 (0.9290) | 126.86 (0.0000) | 0.245 |
| Hypotheses “KPSS H0: Return series is level stationary; asymptotic significant values 1% (0.739), 5% (0.463), 10% (0.347). Q-stat (return series) there is no serial autocorrelation. Q2-stat (square return series) H0: there is no serial autocorrelation. Jarque-Bera H0: distribution of series is normal. LM-ARCH H0: there is no ARCH effect. Use these asymptotic significance values of t-stat 1% (0.01), 5% (0.05), 10% (0.1) and compare these critical values with p-values (Probability values). p-values are in the parenthesis.” | |||||||||
| Parameters | Coefficient | Standard Error | t-Value | t-Probability | |||
|---|---|---|---|---|---|---|---|
| Conditional Mean Equation | |||||||
| Constant | 0.0078 * | 0.0001 | 0.3419 | 0.0732 | |||
| AR(1) | - | - | - | - | |||
| MA(1) | 0.0767 *** | 0.0231 | 3.3250 | 0.0009 | |||
| Conditional Variance Equation | |||||||
| Constant | 0.0056 * | 0.0000 | 0.2181 | 0.0827 | |||
| ARCH(1) | 0.3079 *** | 0.0270 | 11.4000 | 0.0000 | |||
| GARCH(1) | 0.8051 *** | 0.0388 | 20.7600 | 0.0000 | |||
| Student (DF) | 3.0034 *** | 0.3337 | 9.0010 | 0.0000 | |||
| Persistence of shock | 0.9655 | ||||||
| Hypotheses for nth order “AR (p) H0: No AR Process, MA (q) H0: No MA Process, ARCH H0: No ARCH effect, GARCH H0: = 0 No GARCH effect. The * and *** are showing the significance at 10% and 1% respectively”. | |||||||
| Residual Analysis | |||||||
| Tests | Jarque Bera | Q-Stat (5) | Q-Stat (10) | Q2-Stat (5) | Q2-Stat (10) | LM-ARCH (1-2) | LM-ARCH (1–5) |
| Values | 7.0768 *** (0.0000) | 1.8970 (0.9988) | 0.4549 (0.8476) | 0.9023 (0.9780) | 0.3134 * (0.0990) | 0.5654 (0.9897) | 0.7843 (0.9340) |
| Hypotheses for nth order “Q-stat (return series) there is no serial autocorrelation. Q2-stat (square return series) H0: there is no serial autocorrelation. Jarque-Bera H0: distribution of series is normal. LM-ARCH H0: there is no ARCH effect. p-values are in the parenthesis”. | |||||||
| Parameters | Coefficient | Standard Error | t-Value | t-Probability | |||
|---|---|---|---|---|---|---|---|
| Conditional Mean Equation | |||||||
| 0.0000 | 0.0002 | −0.0054 | 0.9957 | ||||
| 0.9137 *** | 0.1292 | 7.0700 | 0.0000 | ||||
| −0.9295 *** | 0.1305 | −7.1230 | 0.0000 | ||||
| Conditional Variance Equation | |||||||
| 0.1923 *** | 0.0469 | 4.0960 | 0.0000 | ||||
| 0.1843 *** | 0.0282 | 6.5310 | 0.0000 | ||||
| 0.7974 *** | 0.0275 | 29.0100 | 0.0000 | ||||
| Student (DF) | 4.6308 *** | 0.4241 | 10.9200 | 0.0000 | |||
| Persistence of shock | 0.9840 | ||||||
| Hypotheses for nth order “AR (p) H0: No AR Process, MA (q) H0: No MA Process, ARCH H0: No ARCH effect, GARCH H0: = 0 No GARCH effect. The *** is showing the significance at 1%”. | |||||||
| Residual Analysis | |||||||
| Tests | Jarque Bera | Q-Stat (5) | Q-Stat (10) | Q2-Stat (5) | Q2-Stat (10) | LM-ARCH (1-2) | LM-ARCH (1–5) |
| Values | 6.8681 (0.0000) | 2.3071 (0.9999) | 0.6750 (0.1970) | 0.7898 (0.9882) | 0.3741 (0.9990) | 0.5508 (0.4509) | 0.8702 (0.5670) |
| Hypotheses for nth order “Q-stat (return series) there is no serial autocorrelation. Q2-stat (square return series) H0: there is no serial autocorrelation. Jarque-Bera H0: distribution of series is normal. LM-ARCH H0: there is no ARCH effect. p-values are in the parenthesis.” | |||||||
| Parameters | Coefficient | Standard Error | t-Value | t-Probability | |||
|---|---|---|---|---|---|---|---|
| Conditional Mean Equation | |||||||
| 0.0000 | 0.0003 | 0.0322 | 0.9743 | ||||
| 0.0833 *** | 0.0209 | 3.9960 | 0.0001 | ||||
| - | - | - | - | ||||
| Conditional Variance Equation | |||||||
| 0.1575 *** | 0.0414 | 3.8030 | 0.0001 | ||||
| 0.1792 *** | 0.0292 | 6.1330 | 0.0000 | ||||
| 0.8022 *** | 0.0286 | 28.0400 | 0.0000 | ||||
| Student (DF) | 5.2187 *** | 0.5915 | 8.8230 | 0.0000 | |||
| Persistence of shock | 0.9814 | ||||||
| Hypotheses for nth order “AR (p) H0: No AR Process, MA (q) H0: No MA Process, ARCH H0: No ARCH effect, GARCH H0: = 0 No GARCH effect. The *** is showing the significance at 1%”. | |||||||
| Residual Analysis | |||||||
| Tests | Jarque Bera | Q-Stat (5) | Q-Stat (10) | Q2-Stat (5) | Q2-Stat (10) | LM-ARCH (1–2) | LM-ARCH (1–5) |
| Values | 9.7853 (0.0000) | 1.7806 (0.9999) | 0.4356 (0.7643) | 0.4520 (0.9881) | 0.3741 (0.9990) | 0.8759 (0.6742) | 0.6930 (0.3286) |
| Hypotheses for nth order “Q-stat (return series) there is no serial autocorrelation. Q2-stat (square return series) H0: there is no serial autocorrelation. Jarque-Bera H0: distribution of series is normal. LM-ARCH H0: there is no ARCH effect. p-values are in the parenthesis.” | |||||||
| Date | Category | Detail | HBL (F-Stat) | MCB (F-Stat) | UBL (F-Stat) |
|---|---|---|---|---|---|
| 14-November-07 | Internal Affair | Closure of TV Channels | 2.6140 0.2385 | 1.6022 0.6239 | 0.7562 0.8322 |
| 19-Feburary-08 | Elections | PPP elected their Prime Minister | 180.693 *** 0.0052 | 16.944 *** 0.0016 | 76.456 *** 0.0028 |
| 15-May-08 | Internal Affair | Lawyers Movement for Chief Justice of Pakistan (Justice Iftikhar Ahmed) | 171.885 ** 0.0494 | 93.794 ** 0.0387 | 63.865 ** 0.0376 |
| 7-September-08 | financial crisis | 2008 Global Financial crisis | 148.313 *** 0.0000 | 18.639 *** 0.0000 | 64.473 *** 0.0000 |
| 11-March-09 | Internal Affair | Long March organizaed by PML-N | 42.598 *** 0.0000 | 36.342 *** 0.0000 | 39.874 *** 0.0000 |
| 10-June-10 | Internal Affair | Punjab Government opposed Rah-e-Najaat | 2.1804 0.5004 | 1.7682 0.6649 | 2.3832 0.1539 |
| 2-May-11 | Foreign Affair | Operation Neptune Spear | 111.137 *** 0.0029 | 76.541 *** 0.0007 | 85.328 *** 0.0005 |
| 28-October-11 | Political Gathering | Long March started by PMLN | 120.758 *** 0.0000 | 98.653 *** 0.0000 | 86.234 *** 0.0000 |
| 31-October-11 | Political Gathering | Pakistan Tehreek-e-Insaf organized a political gathering | 191.055 *** 0.0000 | 48.764 *** 0.0000 | 81.582 *** 0.0000 |
| 18-June-12 | Internal Affair | Yousef Raza Gillani dismissal | 33.397 *** 0.0000 | 45.327 *** 0.0000 | 25.460 *** 0.0059 |
| 15-January-13 | Long March | Pakistan Awami Tehreek Protest against PPP | 74.6131 *** 0.0039 | 65.550 *** 0.0014 | 55.557 *** 0.0001 |
| 13-May-13 | Elections | PML-N formed a new Government in Pakistan | 145.129 *** 0.0000 | 57.475 *** 0.0000 | 74.982 *** 0.0000 |
| 5-June-13 | Internal Affair | Nawaz Sharif became the 20th PM of Pakistan | 4.386 * 0.0957 | 3.998 * 0.0846 | 3.375 * 0.0627 |
| 15-August-14 | Protest | Protest against riggning by PAT and PTI | 129.176 *** 0.0000 | 92.936 *** 0.0000 | 83.235 *** 0.0060 |
| 19-August-14 | Internal Affair | Announcement of Civil disobedience by PTI | 8.910 * 0.0654 | 9.757 * 0.0721 | 9.487 * 0.0721 |
| 20-February-18 | Internal Affair | Supreme Court terminated Nawaz Sharif on embazalment | 187.767 *** 0.0000 | 86.674 *** 0.0000 | 34.876 *** 0.0000 |
| 13-July-18 | Internal Affair | PML-N leaders arrested by Police | 19.602 *** 0.0000 | 62.798 *** 0.0000 | 71.843 0.0002 |
| 25-July-18 | Internal Affair | New Elections conducted in Pakistan | 113.855 *** 0.0000 | 48.765 *** 0.0000 | 41.532 *** 0.0000 |
| 26-July-18 | Internal Affair | PTI bagged highest seat | 143.065 * 0.0729 | 56.102 * 0.0694 | 68.385 * 0.0694 |
| 9-October-18 | Exchange rate | Pakaistani rupee depreciation | 58.530 *** 0.0000 | 86.876 *** 0.0000 | 45.977 *** 0.0070 |
| 30-November-18 | Exchange rate | Rupee depreciation from 131.95 to 136.51 | 35.194 *** 0.0000 | 16.391 0.0000 | 13.853 *** 0.0012 |
| 19-March-20 | The first outbreak of COVID-19 | First COVID-19 patient admitted to a hospital. | 12.454 *** 0.0000 | 21.840 *** 0.0000 | 24.740 *** 0.0000 |
| 23-March-20 | First lack down in Karachi due to COVID-19 | Lockdown in Karachi and closure of PSX. | 45.427 *** 0.0000 | 32.578 *** 0.0000 | 17.411 *** 0.0000 |
| 31-May-20 | Nation-wide lack down due to COVID-19 | Nation-wide lockdown due to COVID-19. | 23.004 *** 0.0000 | 31.742 *** 0.0000 | 14.900 *** 0.0000 |
| Date | Category | Detail | HBL (F-Stat) | MCB (F-Stat) | UBL (F-Stat) |
|---|---|---|---|---|---|
| 14-November-07 | Internal Affair | Closure of TV Channels | 1.8859 0.6931 | 0.4257 0.6532 | 1.4863 0.9832 |
| 19-February-08 | Elections | PPP elected their Prime Minister | 51.787 *** 0.0001 | 65.872 *** 0.0078 | 65.486 *** 0.0026 |
| 15-May-08 | Internal Affair | Lawyers Movement for Chief Justice of Pakistan (Justice Iftikhar Ahmed) | 193.450 *** 0.0005 | 16.533 *** 0.0012 | 87.562 *** 0.0018 |
| 7-September-08 | financial crisis | 2008 Global Financial crisis | 169.501 *** 0.0001 | 67.392 *** 0.0040 | 122.47 *** 0.0001 |
| 11-March-09 | Internal Affair | Long March organizaed by PML-N | 80.904 *** 0.0001 | 56.652 *** 0.0078 | 80.689 *** 0.0014 |
| 10-June-10 | Internal Affair | Punjab Government opposed Rah-e-Najaat | 129.871 * 0.0710 | 65.873 * 0.0853 | 129.877 * 0.0926 |
| 2-May-11 | Foreign Affair | Operation Neptune Spear | 84.533 *** 0.0029 | 86.765 *** 0.0016 | 81.844 *** 0.0004 |
| 28-October-11 | Long March/ Political Gathering | Long March started by PMLN | 126.084 *** 0.0000 | 83.239 *** 0.0000 | 75.476 *** 0.0000 * |
| 31-October-11 | Long March/ Political Gathering | Pakistan Tehreek-e-Insaf organized a political gathering | 176.506 *** 0.0000 | 65.846 *** 0.0000 | 81.569 *** 0.0000 |
| 18-June-12 | Internal Affair | Yousef Raza Gillani dismissal | 119.116 *** 0.0000 | 78.423 *** 0.0000 | 112.86 *** 0.0000 |
| 15-Jane-13 | Long March/ Political Gathering | Pakistan Awami Tehreek Protest against PPP | 91.389 *** 0.0006 | 84.347 *** 0.0016 | 94.847 *** 0.0003 |
| 13-May-13 | Elections | PML-N formed a new Government in Pakistan | 61.534 *** 0.0000 | 65.652 *** 0.0000 | 53.585 *** 0.0000 |
| 5-June-13 | Internal Affair | Nawaz Sharif became 20th PM of Pakistan | 52.459 *** 0.0609 | 43.742 *** 0.0785 | 86.292 *** 0.0515 |
| 15-August-14 | Long March/ Political Gathering | Protest against riggning by PAT and PTI | 196.272 *** 0.0000 | 74.652 *** 0.0000 | 74.029 *** 0.0000 |
| 19-August-14 | Internal Affair | Announcement of Civil disobedience by PTI | 146.641 *** 0.0074 | 42.237 *** 0.0052 | 55.188 *** 0.0082 |
| 20-February-18 | Internal Affair | Supreme Court terminated Nawaz Sharif on embazalment | 81.917 *** 0.0000 | 76.563 *** 0.0000 | 98.651 *** 0.0000 |
| 13-July-18 | Internal Affair | PML-N leaders arrested by Police | 86.986 *** 0.0000 | 65.856 *** 0.0000 | 65.326 *** 0.0000 |
| 25-July-18 | Internal Affair | New Elections conducted in Pakistan | 142.906 *** 0.0000 | 78.236 *** 0.0000 | 112.48 *** 0.0000 |
| 26-July-18 | Internal Affair | PTI bagged highest seat | 136.441 *** 0.0029 | 110.72 *** 0.0051 | 37.543 *** 0.0005 |
| 9-October-18 | Exchange rate | Pakaistani rupee depreciation | 73.991 *** 0.0000 | 99.375 *** 0.0000 | 73.991 *** 0.0000 |
| 30-November-18 | Exchange rate | Rupee depreciation from 131.95 to 136.51 | 167.443 0.0000 | 87.349 *** 0.0000 | 143.35 *** 0.0000 |
| 19-March-20 | The first outbreak of COVID-19 | First COVID-19 patient admitted to a hospital. | 34.655 *** 0.0000 | 45.230 *** 0.0000 | 32.027 *** 0.0000 |
| 23-March-20 | First lack down in Karachi due to COVID-19 | Lockdown in Karachi and closure of PSX. | 65.465 *** 0.0000 | 26.264 *** 0.0000 | 32.487 *** 0.0000 |
| 31-May-20 | Nation-wide lack down due to COVID-19 | Nation-wide lockdown due to COVID-19. | 36.423 *** 0.0000 | 34.420 *** 0.0000 | 35.278 *** 0.0000 |
Publisher’s Note: MDPI stays neutral with regard to jurisdictional claims in published maps and institutional affiliations. |
© 2022 by the authors. Licensee MDPI, Basel, Switzerland. This article is an open access article distributed under the terms and conditions of the Creative Commons Attribution (CC BY) license (https://creativecommons.org/licenses/by/4.0/).
Share and Cite
Ghouse, G.; Bhatti, M.I.; Shahid, M.H. Impact of COVID-19, Political, and Financial Events on the Performance of Commercial Banking Sector. J. Risk Financial Manag. 2022, 15, 186. https://doi.org/10.3390/jrfm15040186
Ghouse G, Bhatti MI, Shahid MH. Impact of COVID-19, Political, and Financial Events on the Performance of Commercial Banking Sector. Journal of Risk and Financial Management. 2022; 15(4):186. https://doi.org/10.3390/jrfm15040186
Chicago/Turabian StyleGhouse, Ghulam, Muhammad Ishaq Bhatti, and Muhammad Hassam Shahid. 2022. "Impact of COVID-19, Political, and Financial Events on the Performance of Commercial Banking Sector" Journal of Risk and Financial Management 15, no. 4: 186. https://doi.org/10.3390/jrfm15040186
APA StyleGhouse, G., Bhatti, M. I., & Shahid, M. H. (2022). Impact of COVID-19, Political, and Financial Events on the Performance of Commercial Banking Sector. Journal of Risk and Financial Management, 15(4), 186. https://doi.org/10.3390/jrfm15040186