Latent Segmentation of Stock Trading Strategies Using Multi-Modal Imitation Learning

 , and
, and
Abstract
1. Introduction
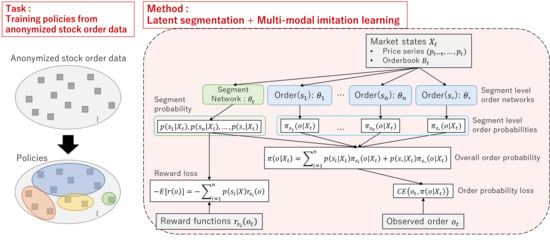
- We propose a neural network-based method for imitation learning of stock trading strategies. To consider diverse trading strategies, latent segmentation of based on a reward function is introduced.
- The proposed method is evaluated using both simulated market data and historical stock order data. The proposed method was confirmed to provide both accurate stock order predictions and a meaningful interpretation of trader segment behavior.
2. Related Work
2.1. Modeling Stock Trading Strategies
2.2. Imitation Learning
2.3. Latent Segmentation
3. Latent Segmentation Imitation Learning (LSIL)
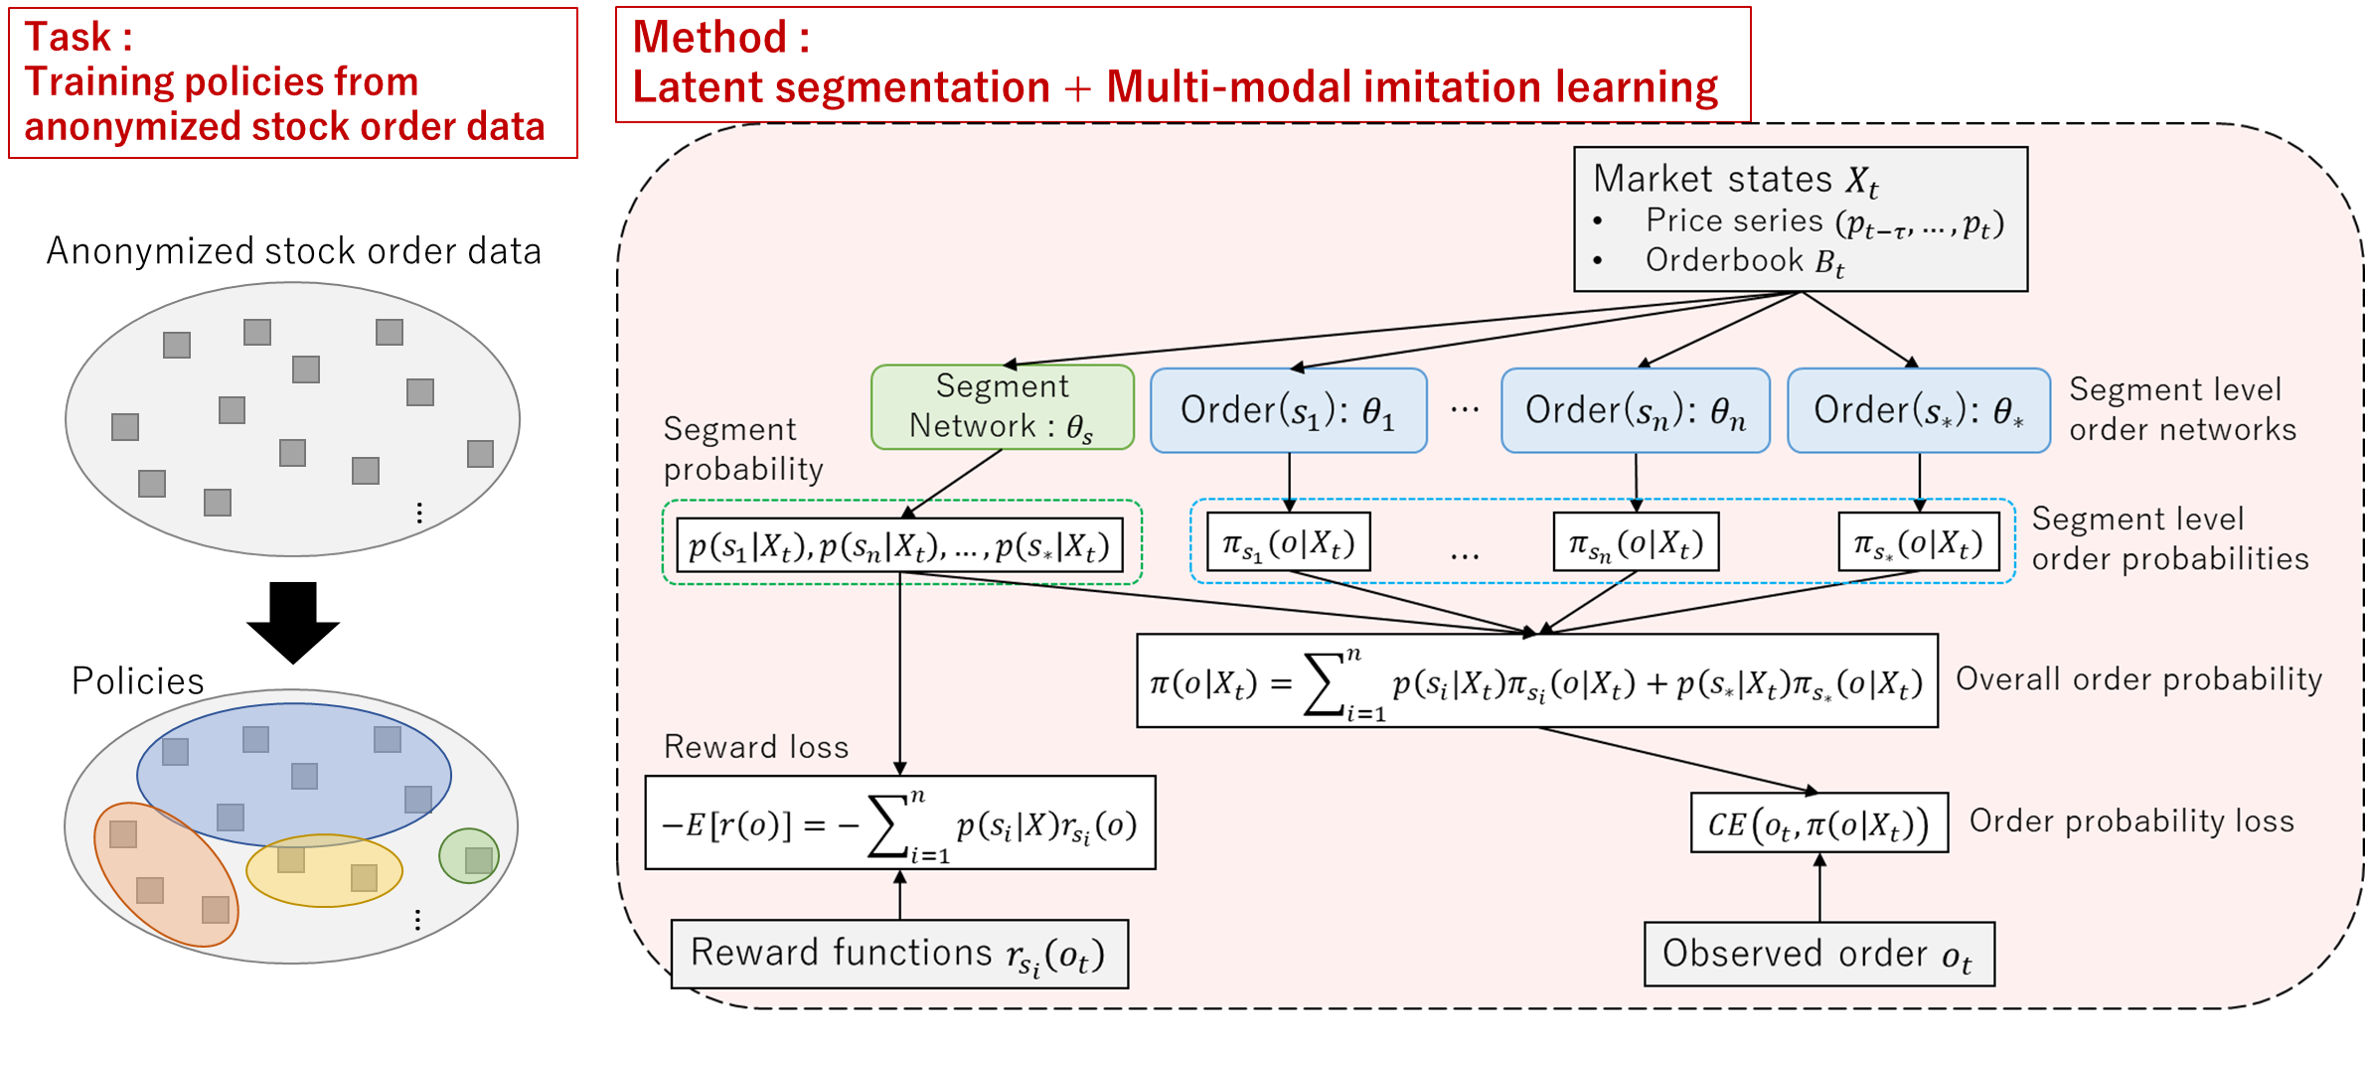
4. Neural Network Configuration
4.1. Feature Engineering
4.2. Stock Order Digitization
4.3. Network Architecture
5. Experiments
5.1. Experiments on Simulated Data
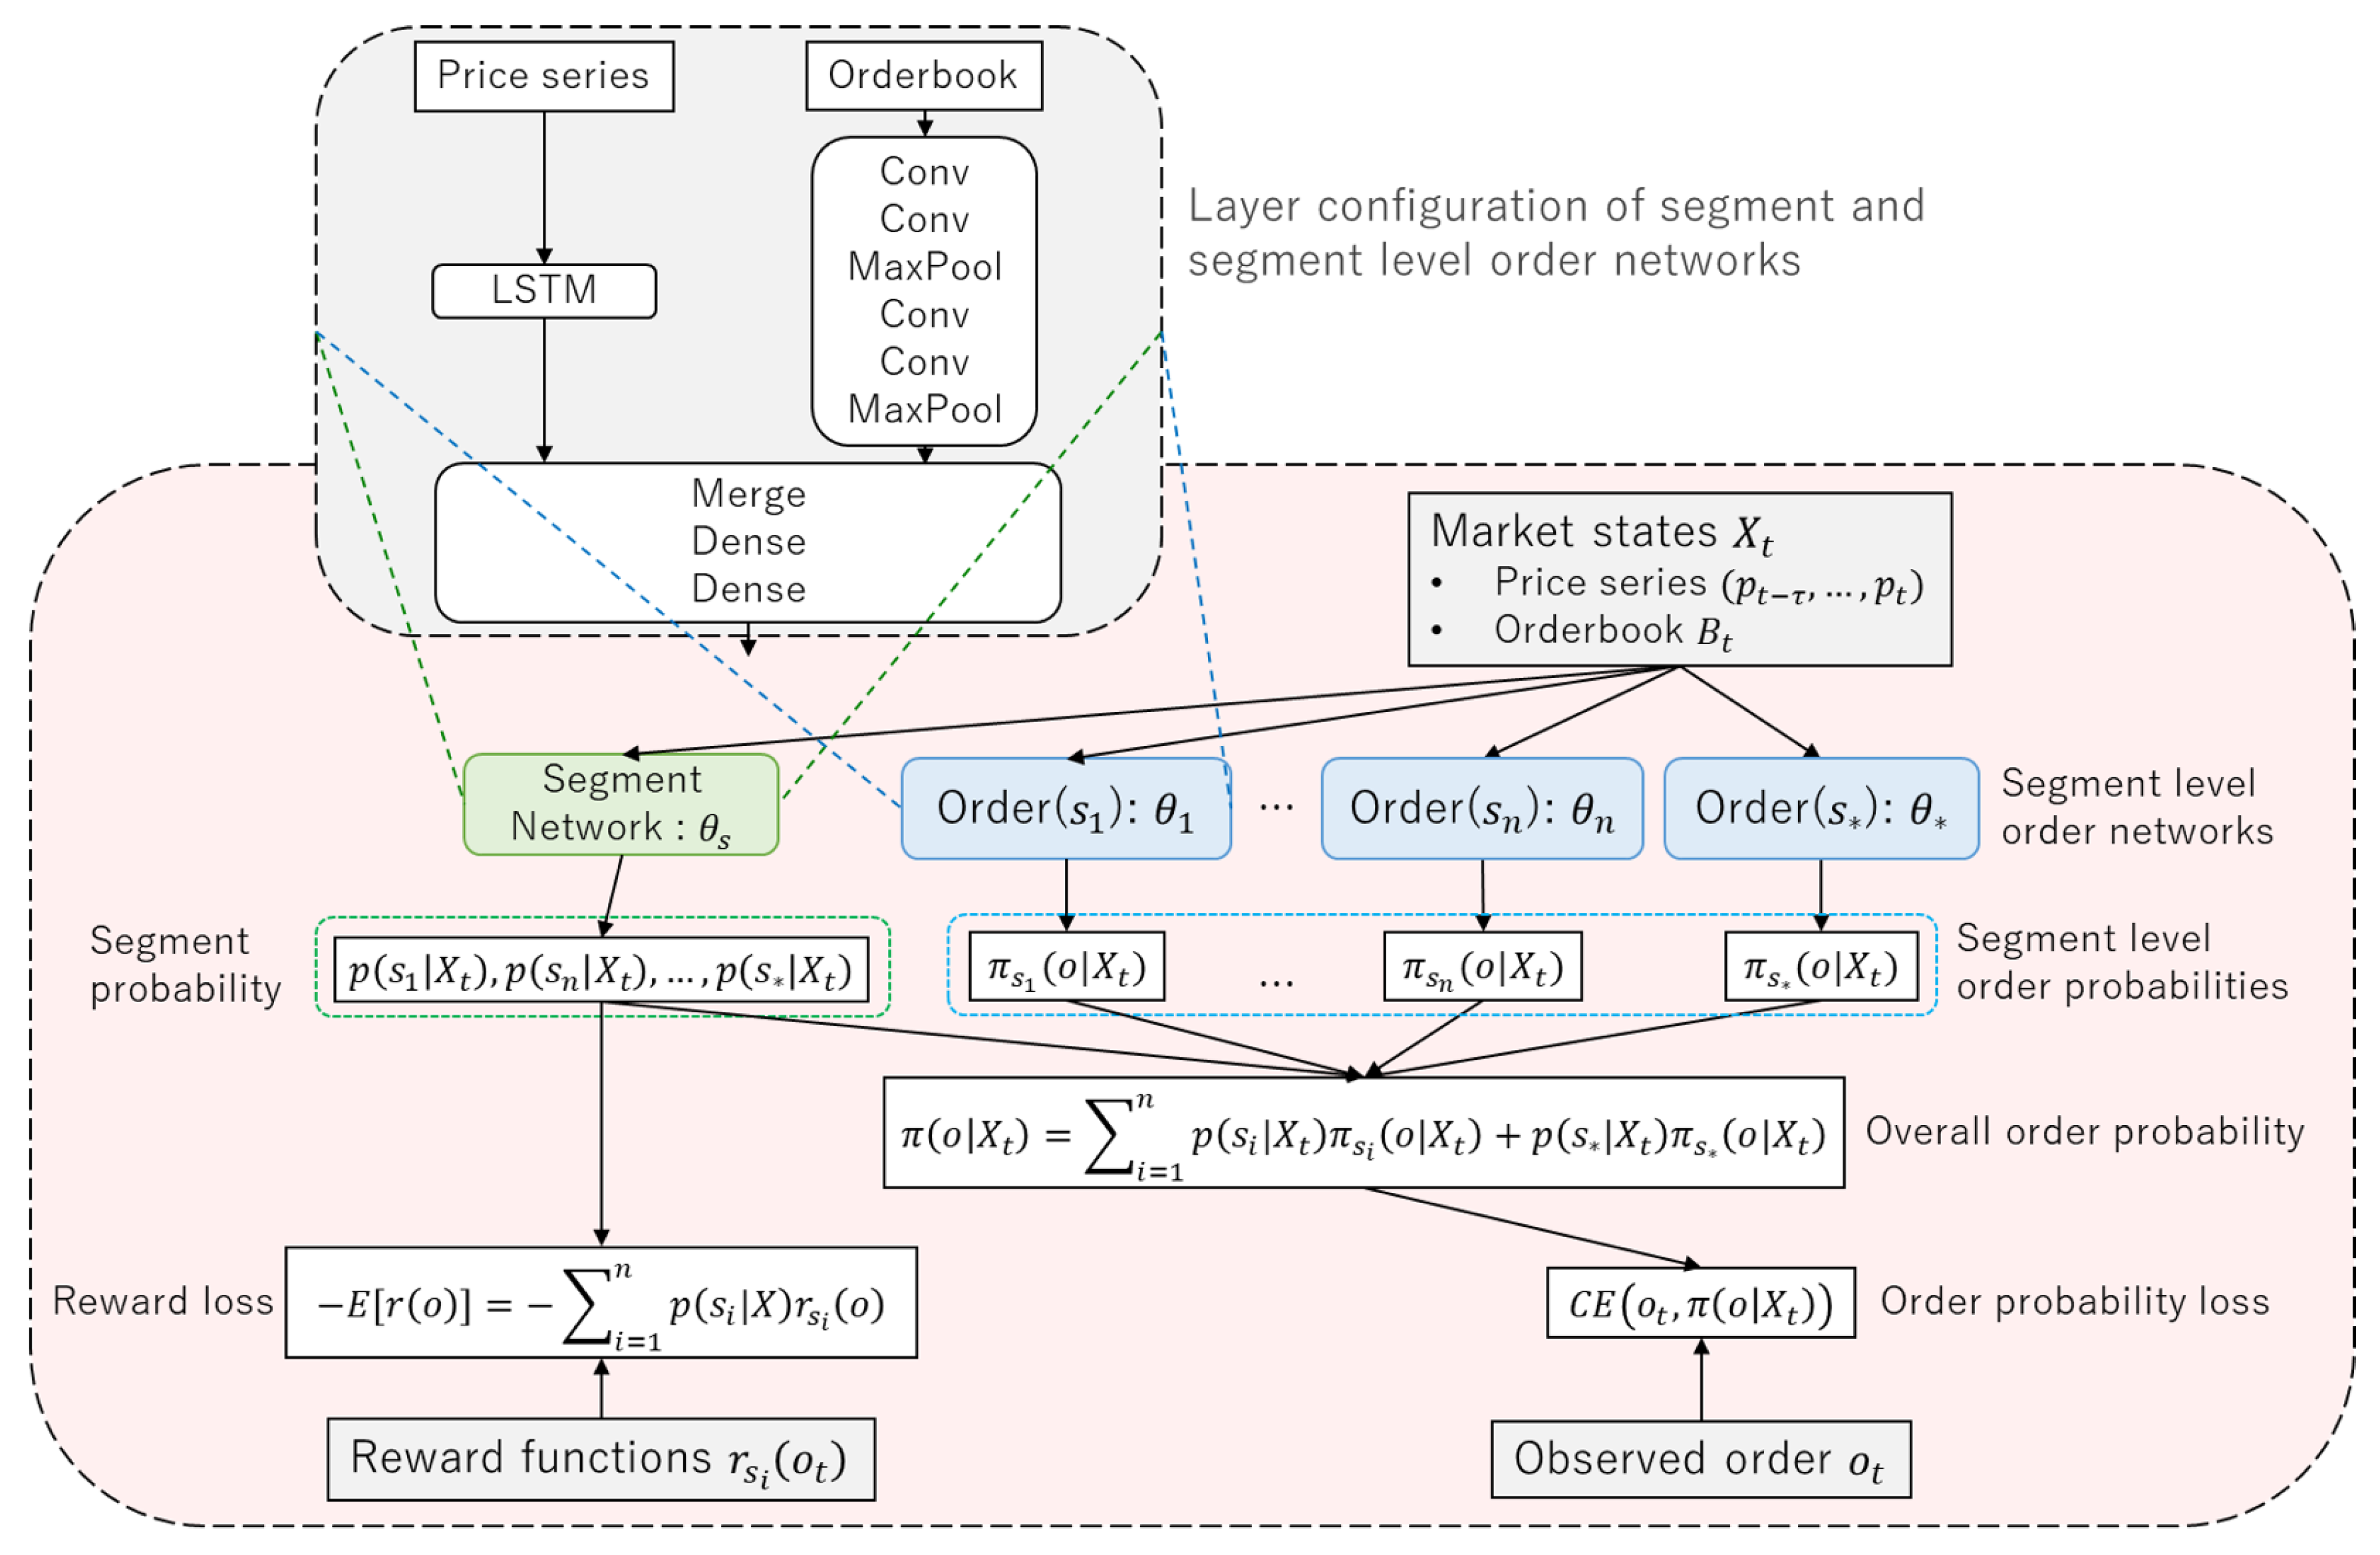
5.2. Experiments on Historical Data
6. Conclusions
Author Contributions
Funding
Acknowledgments
Conflicts of Interest
References
- Abbeel, Pieter, and Andrew Y. Ng. 2004. Apprenticeship learning via inverse reinforcement learning. Paper presented at the Twenty-First International Conference on Machine Learning, Banff, AB, Canada, July 4–8; p. 1. [Google Scholar]
- Angueira, Jaime, Karthik Charan Konduri, Vincent Chakour, and Naveen Eluru. 2019. Exploring the relationship between vehicle type choice and distance traveled: A latent segmentation approach. Transportation Letters 11: 146–57. [Google Scholar] [CrossRef]
- Bao, Wei, Jun Yue, and Yulei Rao. 2017. A deep learning framework for financial time series using stacked autoencoders and long-short term memory. PLoS ONE 12: e0180944. [Google Scholar] [CrossRef] [PubMed]
- Bhatnagar, Amit, and Sanjoy Ghose. 2004. A latent class segmentation analysis of e-shoppers. Journal of Business Research 57: 758–67. [Google Scholar] [CrossRef]
- Brock, William, Josef Lakonishok, and Blake LeBaron. 1992. Simple technical trading rules and the stochastic properties of stock returns. The Journal of Finance 47: 1731–64. [Google Scholar] [CrossRef]
- Brogaard, Jonathan, Terrence Hendershott, and Ryan Riordan. 2014. High-frequency trading and price discovery. The Review of Financial Studies 27: 2267–306. [Google Scholar] [CrossRef]
- Chavarnakul, Thira, and David Enke. 2008. Intelligent technical analysis based equivolume charting for stock trading using neural networks. Expert Systems with Applications 34: 1004–17. [Google Scholar] [CrossRef]
- Chen, An-Sing, Mark T. Leung, and Hazem Daouk. 2003. Application of neural networks to an emerging financial market: Forecasting and trading the taiwan stock index. Computers & Operations Research 30: 901–23. [Google Scholar]
- Chen, Chun-Hao, Yu-Hsuan Chen, Jerry Chun-Wei Lin, and Mu-En Wu. 2019. An effective approach for obtaining a group trading strategy portfolio using grouping genetic algorithm. IEEE Access 7: 7313–25. [Google Scholar] [CrossRef]
- Chiarella, Carl, and Giulia Iori. 2002. A simulation analysis of the microstructure of double auction markets. Quantitative Finance 2: 346–53. [Google Scholar] [CrossRef]
- Chiarella, Carl, Giulia Iori, and Josep Perelló. 2009. The impact of heterogeneous trading rules on the limit order book and order flows. Journal of Economic Dynamics and Control 33: 525–37. [Google Scholar] [CrossRef]
- Cohen, Steven H., and Venkatram Ramaswamy. 1998. Latent segmentation models. Marketing Research 10: 14. [Google Scholar]
- Comerton-Forde, Carole, and Kar Mei Tang. 2009. Anonymity, liquidity and fragmentation. Journal of Financial Markets 12: 337–67. [Google Scholar] [CrossRef]
- Deng, Yue, Feng Bao, Youyong Kong, Zhiquan Ren, and Qionghai Dai. 2016. Deep direct reinforcement learning for financial signal representation and trading. IEEE Transactions on Neural Networks and Learning Systems 28: 653–64. [Google Scholar] [CrossRef] [PubMed]
- Duan, Yan, Marcin Andrychowicz, Bradly Stadie, OpenAI Jonathan Ho, Jonas Schneider, Ilya Sutskever, Pieter Abbeel, and Wojciech Zaremba. 2017. One-shot imitation learning. In Advances in Neural Information Processing Systems. Edited by Isabelle Guyon, Ulrike Von Luxburg, Samy Bengio, Hanna Wallach, Rob Fergus, S. V. N. Vishwanathan and Roman Garnett. Vancouver: NIPS Proceedingsβ. pp. 1087–98. [Google Scholar]
- Eberlein, Ernst, and Ulrich Keller. 1995. Hyperbolic distributions in finance. Bernoulli 1: 281–99. [Google Scholar] [CrossRef]
- Ezeobiejesi, Jude, and Bir Bhanu. 2017. Latent fingerprint image segmentation using deep neural network. Advances in Computer Vision and Pattern Recognition 8: 83–107. [Google Scholar] [CrossRef]
- Finn, Chelsea, Tianhe Yu, Tianhao Zhang, Pieter Abbeel, and Sergey Levine. 2017. One-shot visual imitation learning via meta-learning. Paper presented at the 1st Annual Conference on Robot Learning, Mountain View, CA, USA, November 13–15, vol. 78, pp. 357–68. [Google Scholar]
- Fischer, Thomas, and Christopher Krauss. 2018. Deep learning with long short-term memory networks for financial market predictions. European Journal of Operational Research 270: 654–69. [Google Scholar] [CrossRef]
- Friedman, Daniel, and John Rust. 1993. The Double Auction Market: Institutions, Theories and Evidence. London: ROUTLEDGE, vol. 1, p. 14. [Google Scholar]
- Goodfellow, Ian, Jean Pouget-Abadie, Mehdi Mirza, Bing Xu, David Warde-Farley, Sherjil Ozair, Aaron Courville, and Yoshua Bengio. 2014. Generative adversarial nets. In Advances in Neural Information Processing Systems. Vancouver: NIPS Proceedingsβ. pp. 2672–80. [Google Scholar]
- Hadfield-Menell, Dylan, Stuart J. Russell, Pieter Abbeel, and Anca Dragan. 2016. Cooperative inverse reinforcement learning. In Advances in Neural Information Processing Systems. Vancouver: NIPS Proceedingsβ. pp. 3909–17. [Google Scholar]
- Hausman, Karol, Yevgen Chebotar, Stefan Schaal, Gaurav Sukhatme, and Joseph J. Lim. 2017. Multi-modal imitation learning from unstructured demonstrations using generative adversarial nets. In Advances in Neural Information Processing Systems. Vancouver: NIPS Proceedingsβ. pp. 1235–45. [Google Scholar]
- Ho, Jonathan, and Stefano Ermon. 2016. Generative adversarial imitation learning. In Advances in Neural Information Processing Systems. Vancouver: NIPS Proceedingsβ. pp. 4565–73. [Google Scholar]
- Hochreiter, Sepp, and Jürgen Schmidhuber. 1997. Long short-term memory. Neural Computation 9: 1735–80. [Google Scholar] [CrossRef]
- Hommes, Cars H. 2006. Heterogeneous agent models in economics and finance. Handbook of Computational Economics 2: 1109–86. [Google Scholar] [CrossRef]
- Hussein, Ahmed, Mohamed Medhat Gaber, Eyad Elyan, and Chrisina Jayne. 2017. Imitation learning: A survey of learning methods. ACM Computing Surveys 50: 21. [Google Scholar] [CrossRef]
- Jensen, Michael C. 2001. Value maximization, stakeholder theory, and the corporate objective function. Journal of Applied Corporate Finance 14: 8–21. [Google Scholar] [CrossRef]
- Jung, Juergen, and Chung Tran. 2016. Market inefficiency, insurance mandate and welfare: US health care reform 2010. Review of Economic Dynamics 20: 132–59. [Google Scholar] [CrossRef]
- Krauss, Christopher, Xuan Anh Do, and Nicolas Huck. 2017. Deep neural networks, gradient-boosted trees, random forests: Statistical arbitrage on the s&p 500. European Journal of Operational Research 259: 689–702. [Google Scholar]
- Krizhevsky, Alex, Ilya Sutskever, and Geoffrey E. Hinton. 2012. Imagenet classification with deep convolutional neural networks. In Advances in Neural Information Processing Systems. Vancouver: NIPS Proceedingsβ. pp. 1097–105. [Google Scholar]
- Kuefler, Alex, and Mykel J. Kochenderfer. 2018. Burn-in demonstrations for multi-modal imitation learning. Paper presented at the 17th International Conference on Autonomous Agents and MultiAgent Systems, Stockholm, Sweden, July 10–15; pp. 1071–78. [Google Scholar]
- Ladley, Dan. 2012. Zero intelligence in economics and finance. The Knowledge Engineering Review 27: 273–86. [Google Scholar] [CrossRef]
- Liu, Yang, Qi Liu, Hongke Zhao, Zhen Pan, and Chuanren Liu. 2020. Adaptive quantitative trading: An imitative deep reinforcement learning approach. Paper presented at the AAAI Conference on Artificial Intelligence, New York, NY, USA, February 7–12; pp. 2128–35. [Google Scholar]
- Meng, Terry Lingze, and Matloob Khushi. 2019. Reinforcement learning in financial markets. Data 4: 110. [Google Scholar] [CrossRef]
- Muranaga, Jun, and Tokiko Shimizu. 1999. Market Microstructure and Market Liquidity. Tokyo: Institute for Monetary and Economic Studies, Bank of Japan, vol. 99. [Google Scholar]
- Ng, Andrew Y., and Stuart J. Russell. 2000. Algorithms for inverse reinforcement learning. Paper presented at the International Conference on Machine Learning, Stanford, CA, USA, June 29–July 2, vol. 1, p. 2. [Google Scholar]
- Nguyen, Dinh-Luan, Kai Cao, and Anil K. Jain. 2018. Automatic latent fingerprint segmentation. Paper presented at the 2018 IEEE 9th International Conference on Biometrics Theory, Applications and Systems (BTAS), Los Angeles, CA, USA, October 22–25; pp. 1–9. [Google Scholar]
- Obizhaeva, Anna A., and Jiang Wang. 2013. Optimal trading strategy and supply/demand dynamics. Journal of Financial Markets 16: 1–32. [Google Scholar] [CrossRef]
- Piao, Songhao, Yue Huang, and Huaping Liu. 2019. Online multi-modal imitation learning via lifelong intention encoding. Paper presented at the 2019 IEEE 4th International Conference on Advanced Robotics and Mechatronics (ICARM), Osaka, Japan, July 3–5; pp. 786–92. [Google Scholar]
- Raberto, Marco, Silvano Cincotti, Sergio M. Focardi, and Michele Marchesi. 2001. Agent-based simulation of a financial market. Physica A: Statistical Mechanics and Its Applications 299: 319–27. [Google Scholar] [CrossRef]
- Rust, John, Richard Palmer, and John H. Miller. 1992. Behaviour of Trading Automata in a Computerized Double Auction Market. Santa Fe: Santa Fe Institute. [Google Scholar]
- Schaal, Stefan. 1999. Is imitation learning the route to humanoid robots? Trends in Cognitive Sciences 3: 233–42. [Google Scholar] [CrossRef]
- Schaal, Stefan, Auke Ijspeert, and Aude Billard. 2003. Computational approaches to motor learning by imitation. Philosophical Transactions of the Royal Society of London Series B: Biological Sciences 358: 537–47. [Google Scholar] [CrossRef]
- Shleifer, Andrei, and Lawrence H. Summers. 1990. The noise trader approach to finance. Journal of Economic Perspectives 4: 19–33. [Google Scholar] [CrossRef]
- Stadie, Bradly C., Pieter Abbeel, and Ilya Sutskever. 2017. Third-person imitation learning. arXiv arXiv:1703.01703. [Google Scholar]
- Swait, Joffre. 1994. A structural equation model of latent segmentation and product choice for cross-sectional revealed preference choice data. Journal of Retailing and Consumer Services 1: 77–89. [Google Scholar] [CrossRef]
- Tashiro, Daigo, Hiroyasu Matsushima, Kiyoshi Izumi, and Hiroki Sakaji. 2019. Encoding of high-frequency order information and prediction of short-term stock price by deep learning. Quantitative Finance 19: 1499–506. [Google Scholar] [CrossRef]
- Tsantekidis, Avraam, Nikolaos Passalis, Anastasios Tefas, Juho Kanniainen, Moncef Gabbouj, and Alexandros Iosifidis. 2017. Forecasting stock prices from the limit order book using convolutional neural networks. Paper presented at the 2017 IEEE 19th Conference on Business Informatics (CBI), Thessaloniki, Greece, July 24–27, vol. 1, pp. 7–12. [Google Scholar]
- Villarejo Ramos, Ángel Francisco, Begoña Peral Peral, and Jorge Arenas Gaitán. 2019. Latent segmentation of older adults in the use of social networks and e-banking services. Information Research 24: 841. [Google Scholar]
- Vytelingum, Perukrishnen, Rajdeep K. Dash, Esther David, and Nicholas R. Jennings. 2004. A risk-based bidding strategy for continuous double auctions. Paper presented at the 16th Eureopean Conference on Artificial Intelligence, Valencia, Spain, August 22–27, vol. 16, p. 79. [Google Scholar]
- Xiao, Shenyong, Han Yu, Yanan Wu, Zijun Peng, and Yin Zhang. 2017. Self-evolving trading strategy integrating internet of things and big data. IEEE Internet of Things Journal 5: 2518–25. [Google Scholar] [CrossRef]
- Yang, Steve Y., Qifeng Qiao, Peter A. Beling, William T. Scherer, and Andrei A. Kirilenko. 2015. Gaussian process-based algorithmic trading strategy identification. Quantitative Finance 15: 1683–703. [Google Scholar] [CrossRef]
- Yu, Lin, Hung-Gay Fung, and Wai Kin Leung. 2019. Momentum or contrarian trading strategy: Which one works better in the chinese stock market. International Review of Economics & Finance 62: 87–105. [Google Scholar]
- Yu, Lantao, Weinan Zhang, Jun Wang, and Yong Yu. 2017. Seqgan: Sequence generative adversarial nets with policy gradient. Paper presented at the Thirty-First AAAI Conference on Artificial Intelligence, San Francisco, CA, USA, February 4–9. [Google Scholar]
- Zarkias, Konstantinos Saitas, Nikolaos Passalis, Avraam Tsantekidis, and Anastasios Tefas. 2019. Deep reinforcement learning for financial trading using price trailing. Paper presented at the 2019 IEEE International Conference on Acoustics, Speech and Signal Processing (ICASSP), Brighton, UK, May 12–17; pp. 3067–71. [Google Scholar]
| 1. |


| Model | P@1 ↑ | P@5 ↑ | P@10 ↑ | AUROC ↑ |
|---|---|---|---|---|
| IL | ||||
| GAIL | ||||
| SIL | ||||
| LSIL1 | ||||
| LSIL2 |
| Model | P@1 ↑ | P@5 ↑ | P@10 ↑ | AUROC ↑ |
|---|---|---|---|---|
| IL | ||||
| GAIL | ||||
| SIL | ||||
| LSIL1 | ||||
| LSIL2 |
Publisher’s Note: MDPI stays neutral with regard to jurisdictional claims in published maps and institutional affiliations. |
© 2020 by the authors. Licensee MDPI, Basel, Switzerland. This article is an open access article distributed under the terms and conditions of the Creative Commons Attribution (CC BY) license (http://creativecommons.org/licenses/by/4.0/).
Share and Cite
Maeda, I.; deGraw, D.; Kitano, M.; Matsushima, H.; Izumi, K.; Sakaji, H.; Kato, A. Latent Segmentation of Stock Trading Strategies Using Multi-Modal Imitation Learning. J. Risk Financial Manag. 2020, 13, 250. https://doi.org/10.3390/jrfm13110250
Maeda I, deGraw D, Kitano M, Matsushima H, Izumi K, Sakaji H, Kato A. Latent Segmentation of Stock Trading Strategies Using Multi-Modal Imitation Learning. Journal of Risk and Financial Management. 2020; 13(11):250. https://doi.org/10.3390/jrfm13110250
Chicago/Turabian StyleMaeda, Iwao, David deGraw, Michiharu Kitano, Hiroyasu Matsushima, Kiyoshi Izumi, Hiroki Sakaji, and Atsuo Kato. 2020. "Latent Segmentation of Stock Trading Strategies Using Multi-Modal Imitation Learning" Journal of Risk and Financial Management 13, no. 11: 250. https://doi.org/10.3390/jrfm13110250
APA StyleMaeda, I., deGraw, D., Kitano, M., Matsushima, H., Izumi, K., Sakaji, H., & Kato, A. (2020). Latent Segmentation of Stock Trading Strategies Using Multi-Modal Imitation Learning. Journal of Risk and Financial Management, 13(11), 250. https://doi.org/10.3390/jrfm13110250