Appendix B
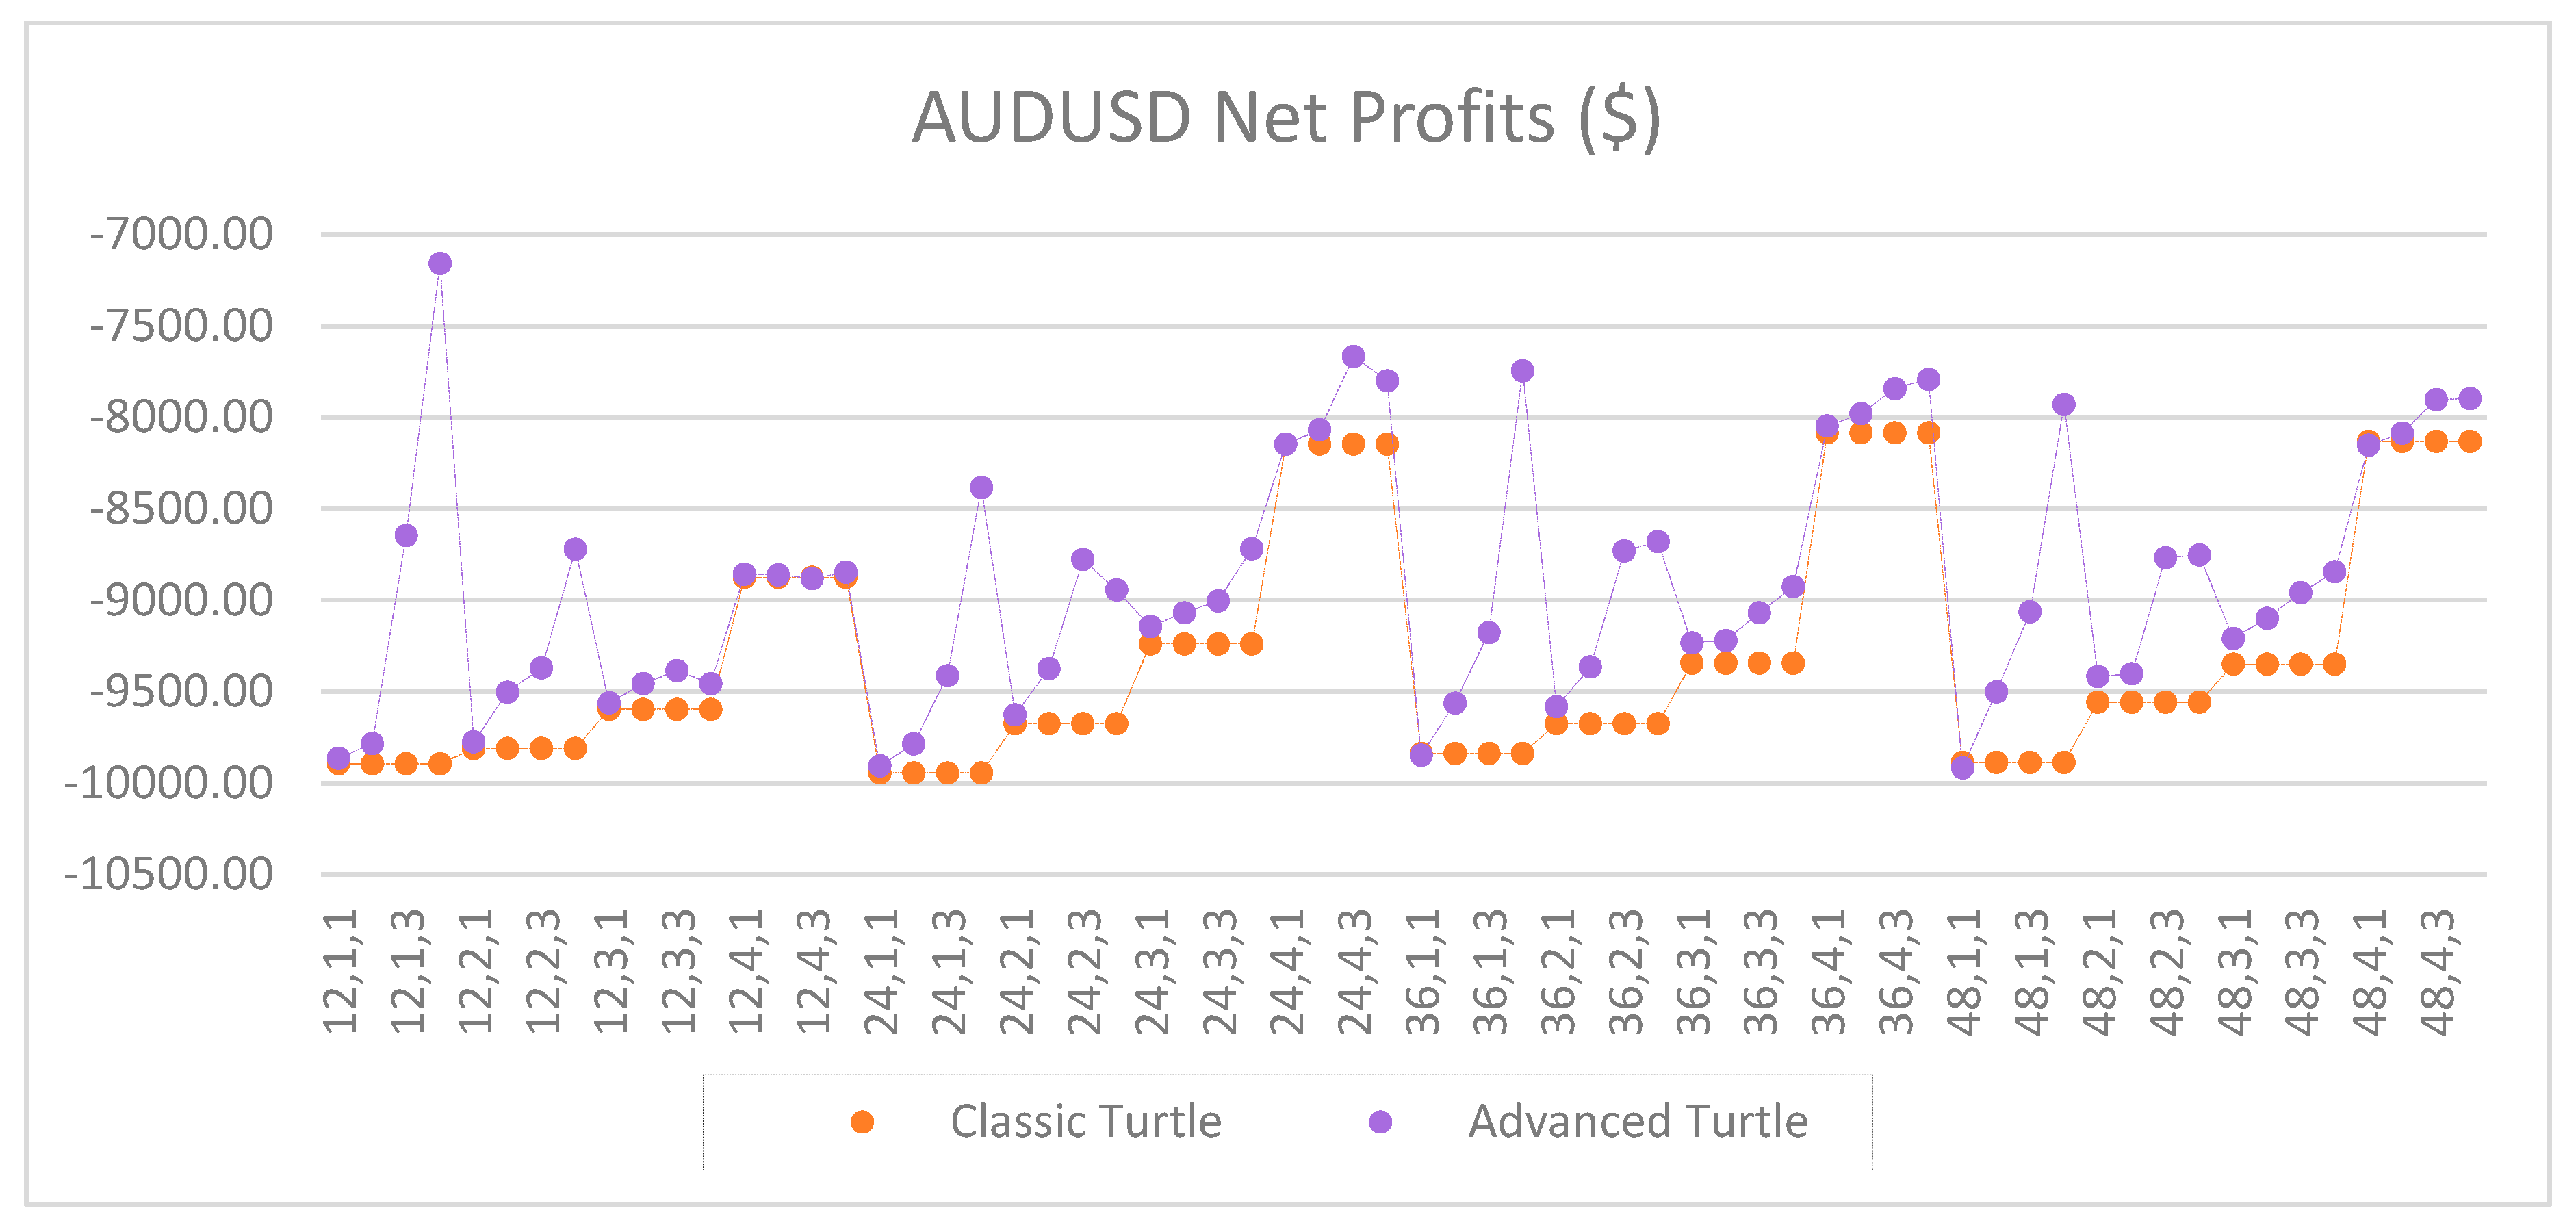
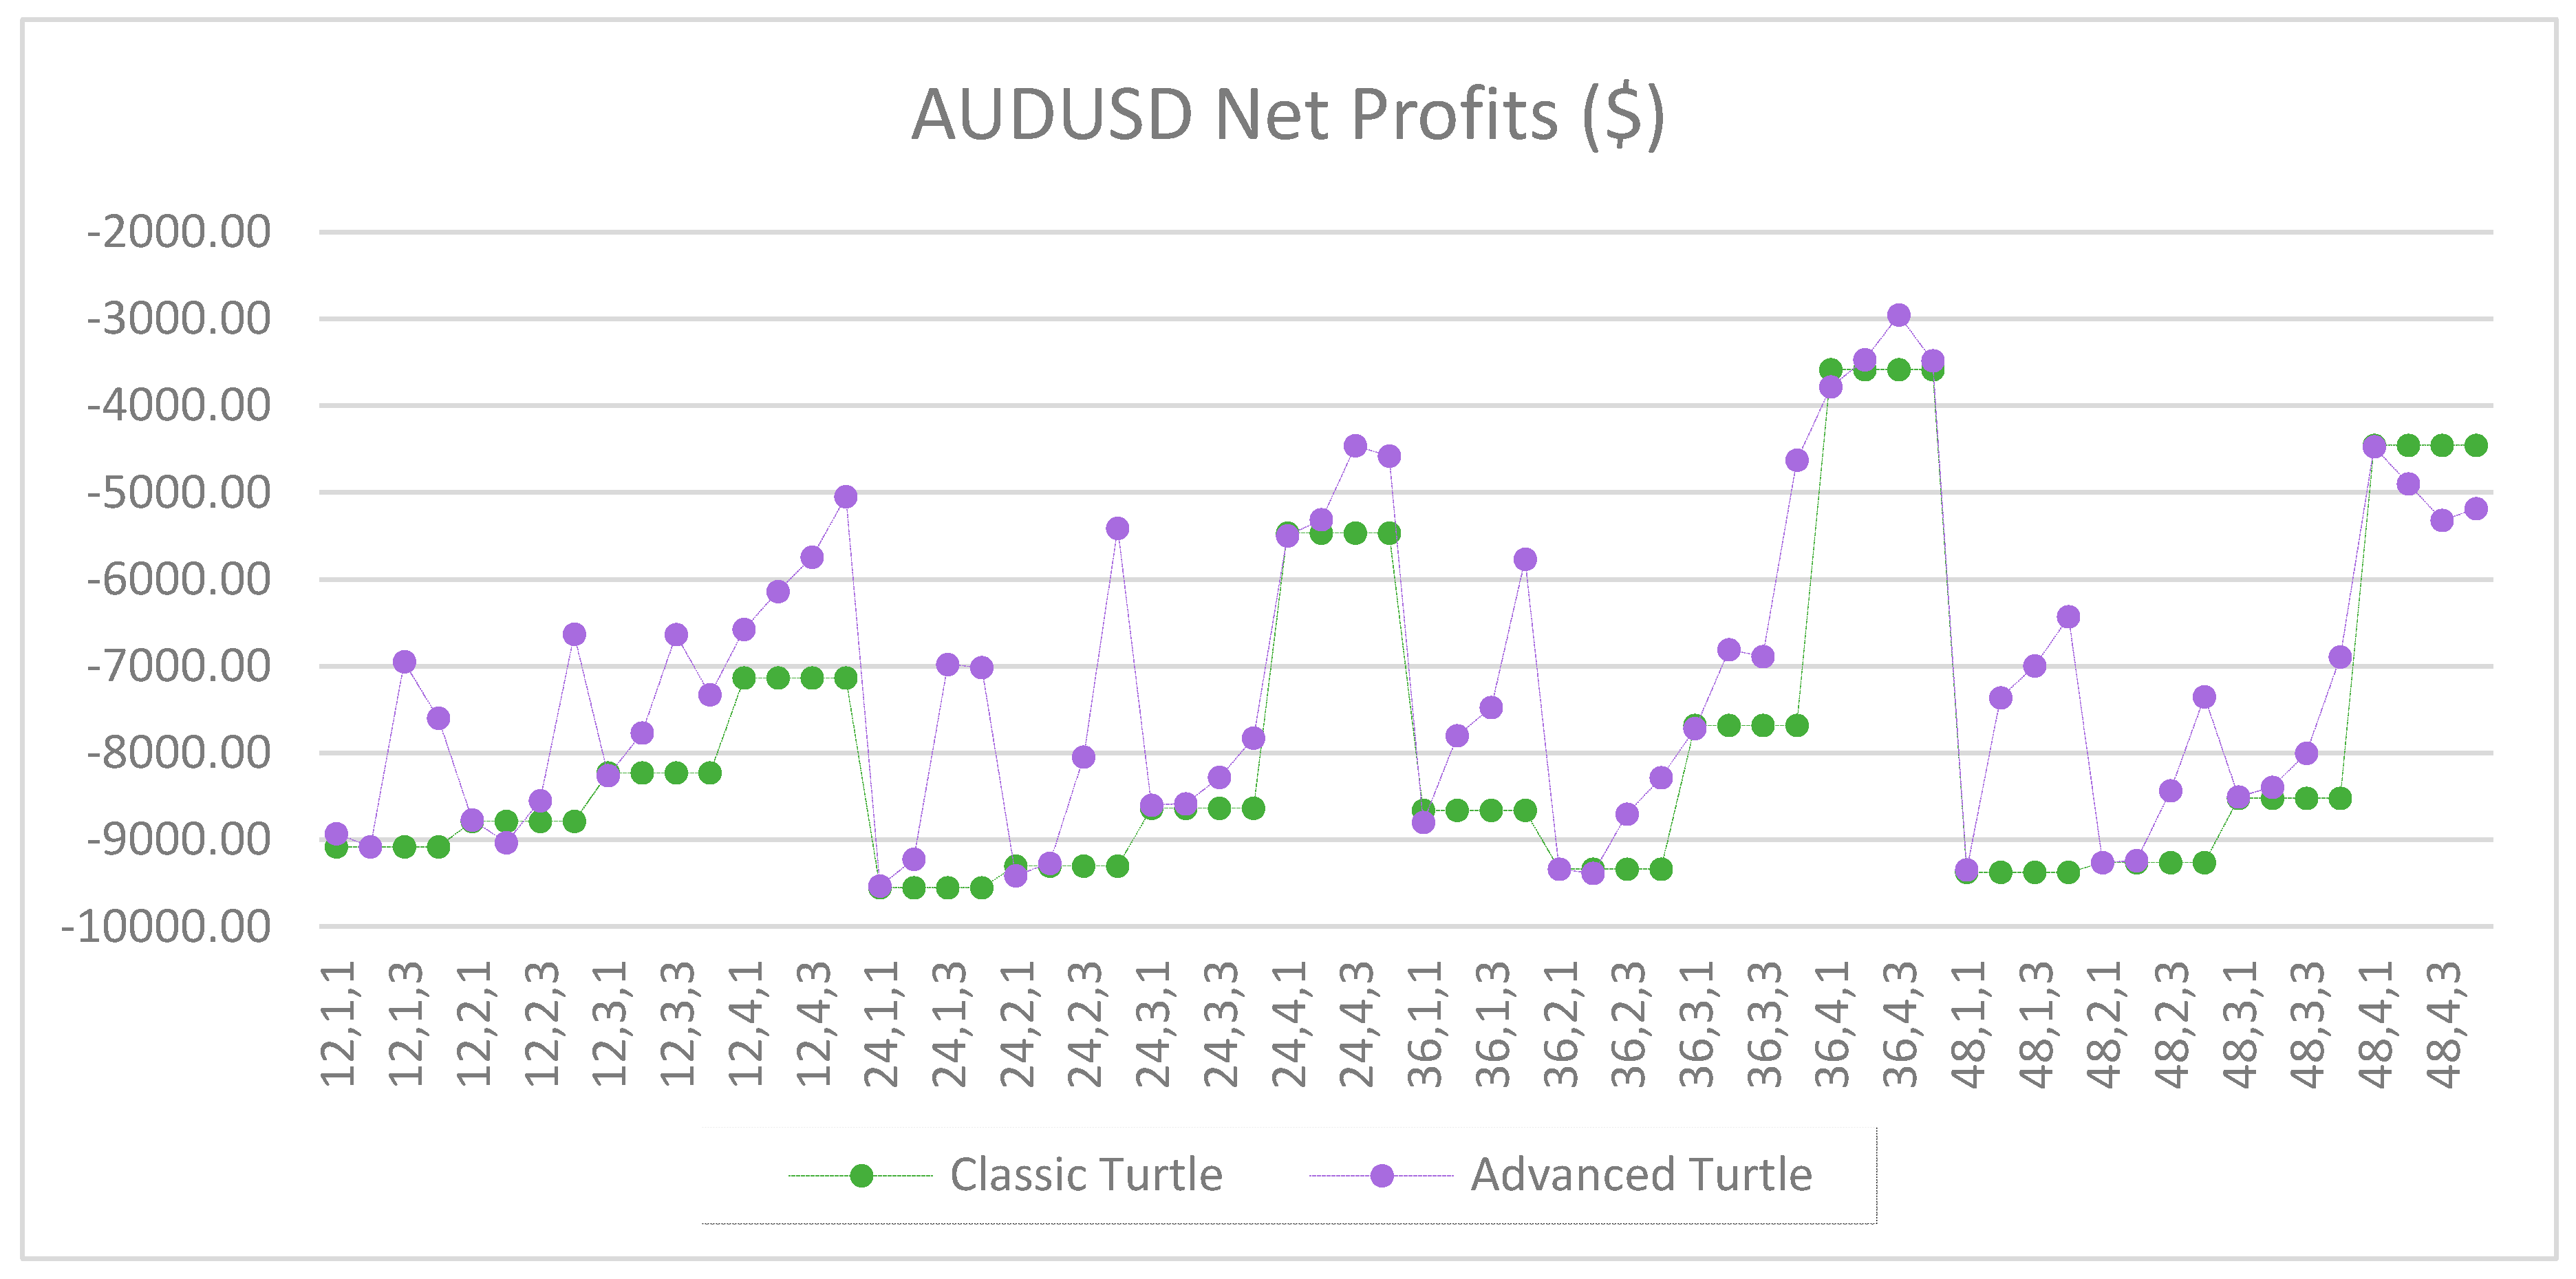
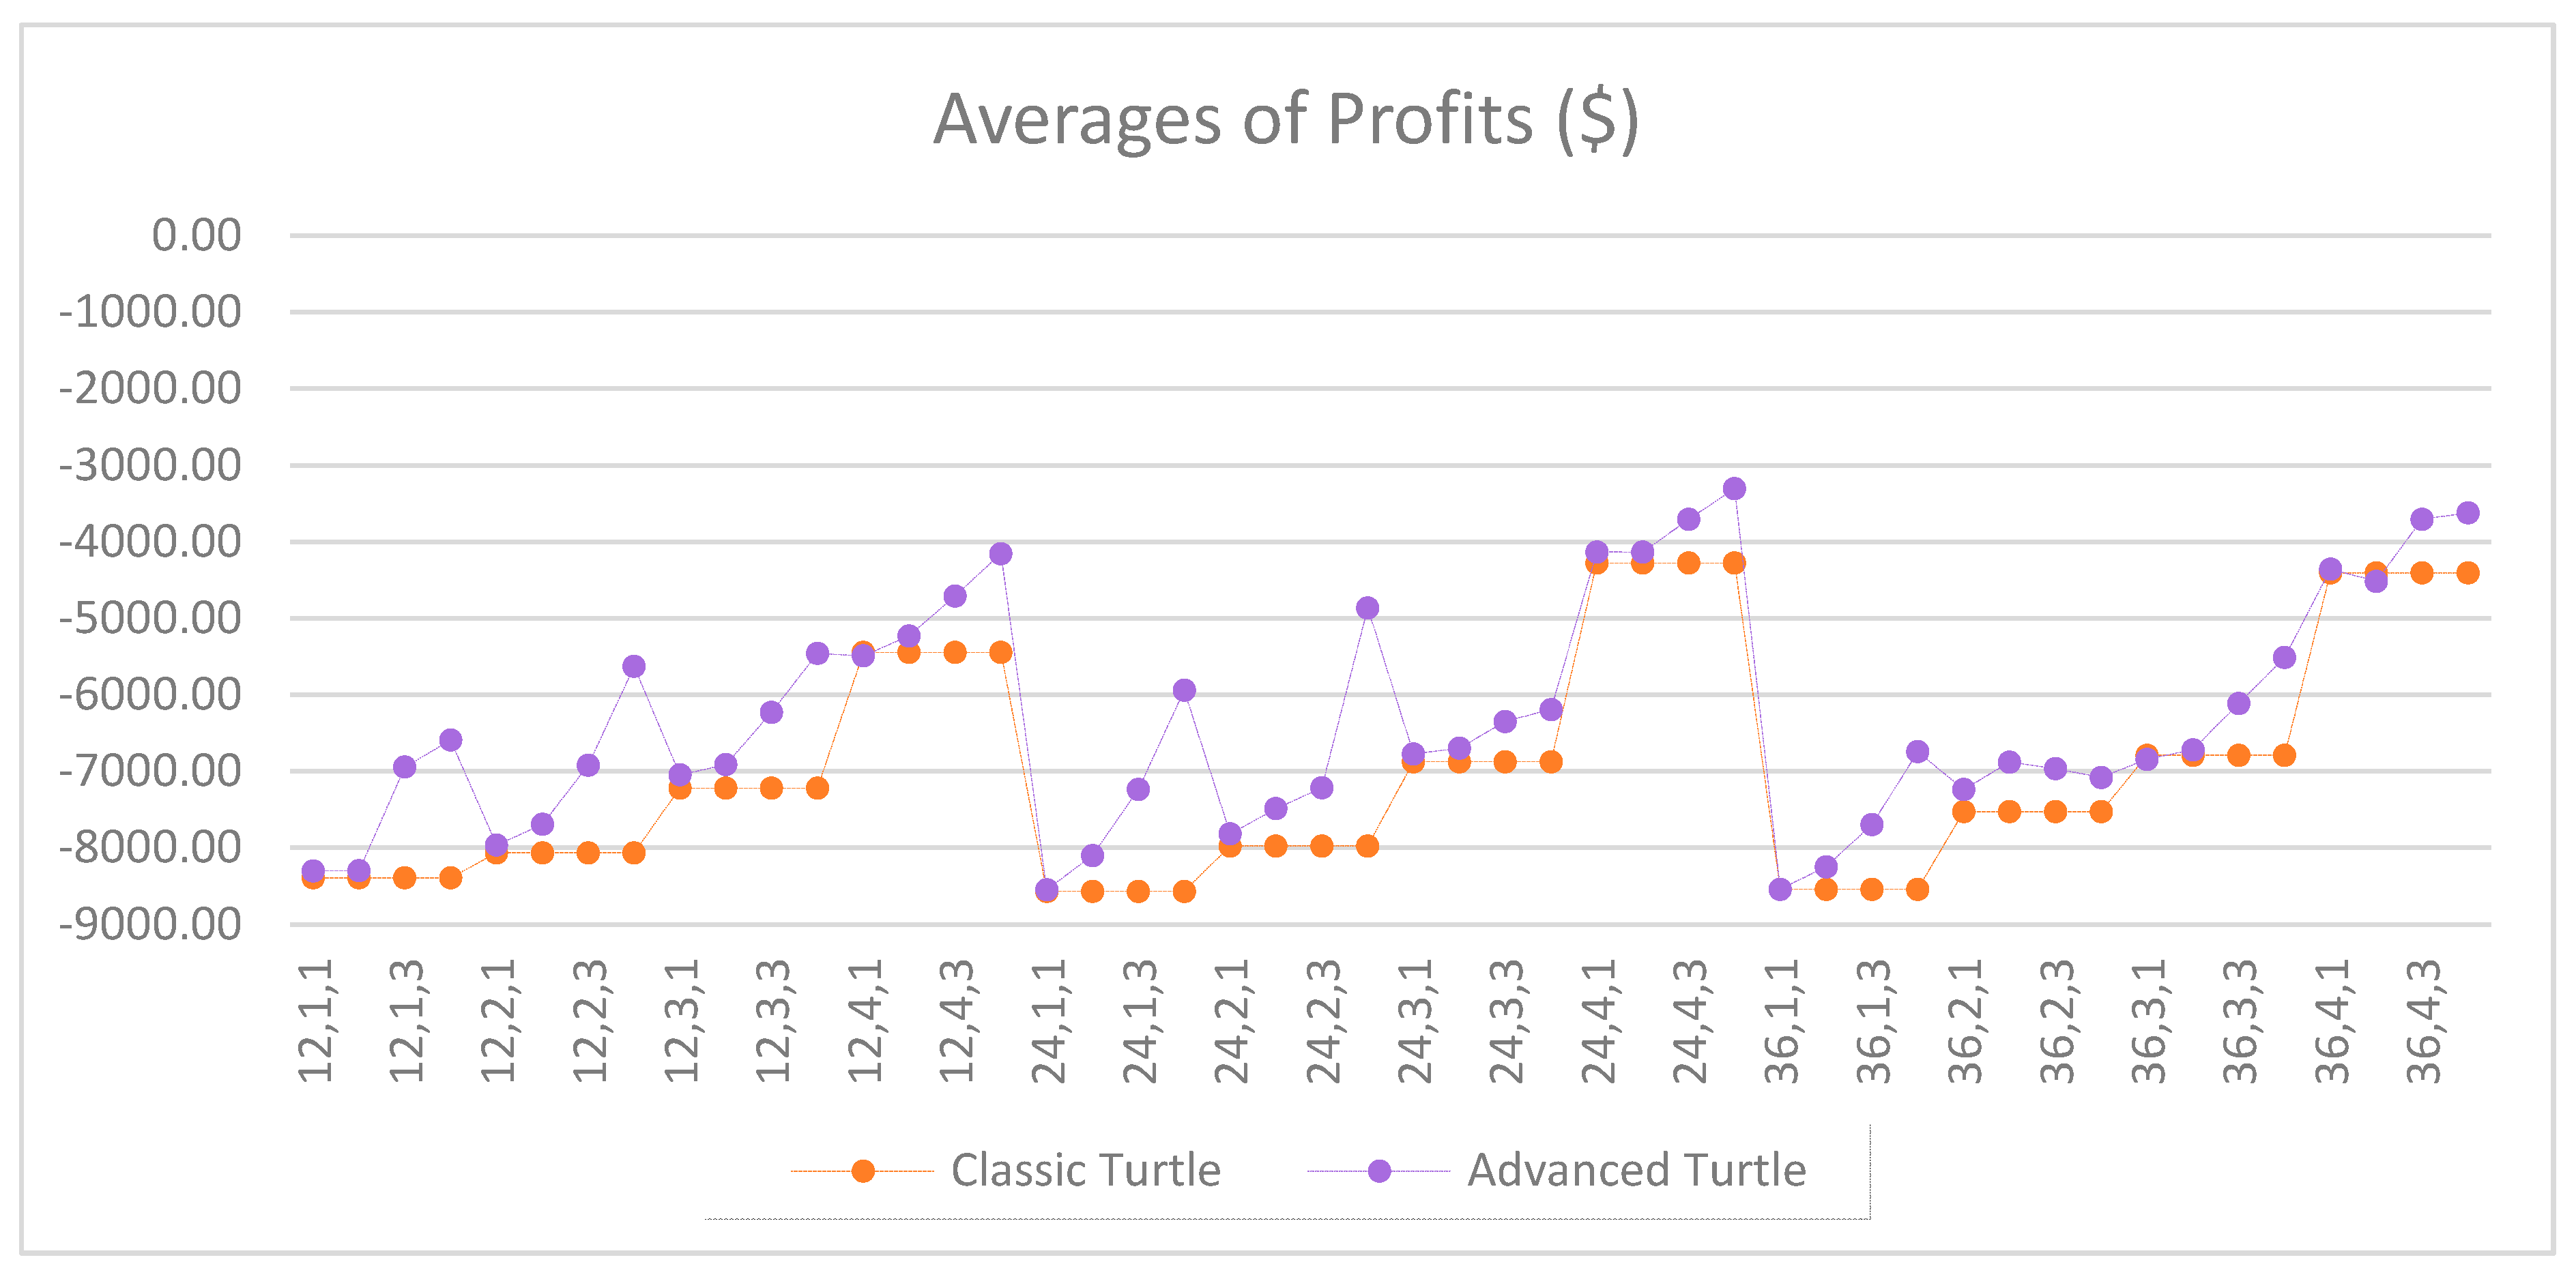
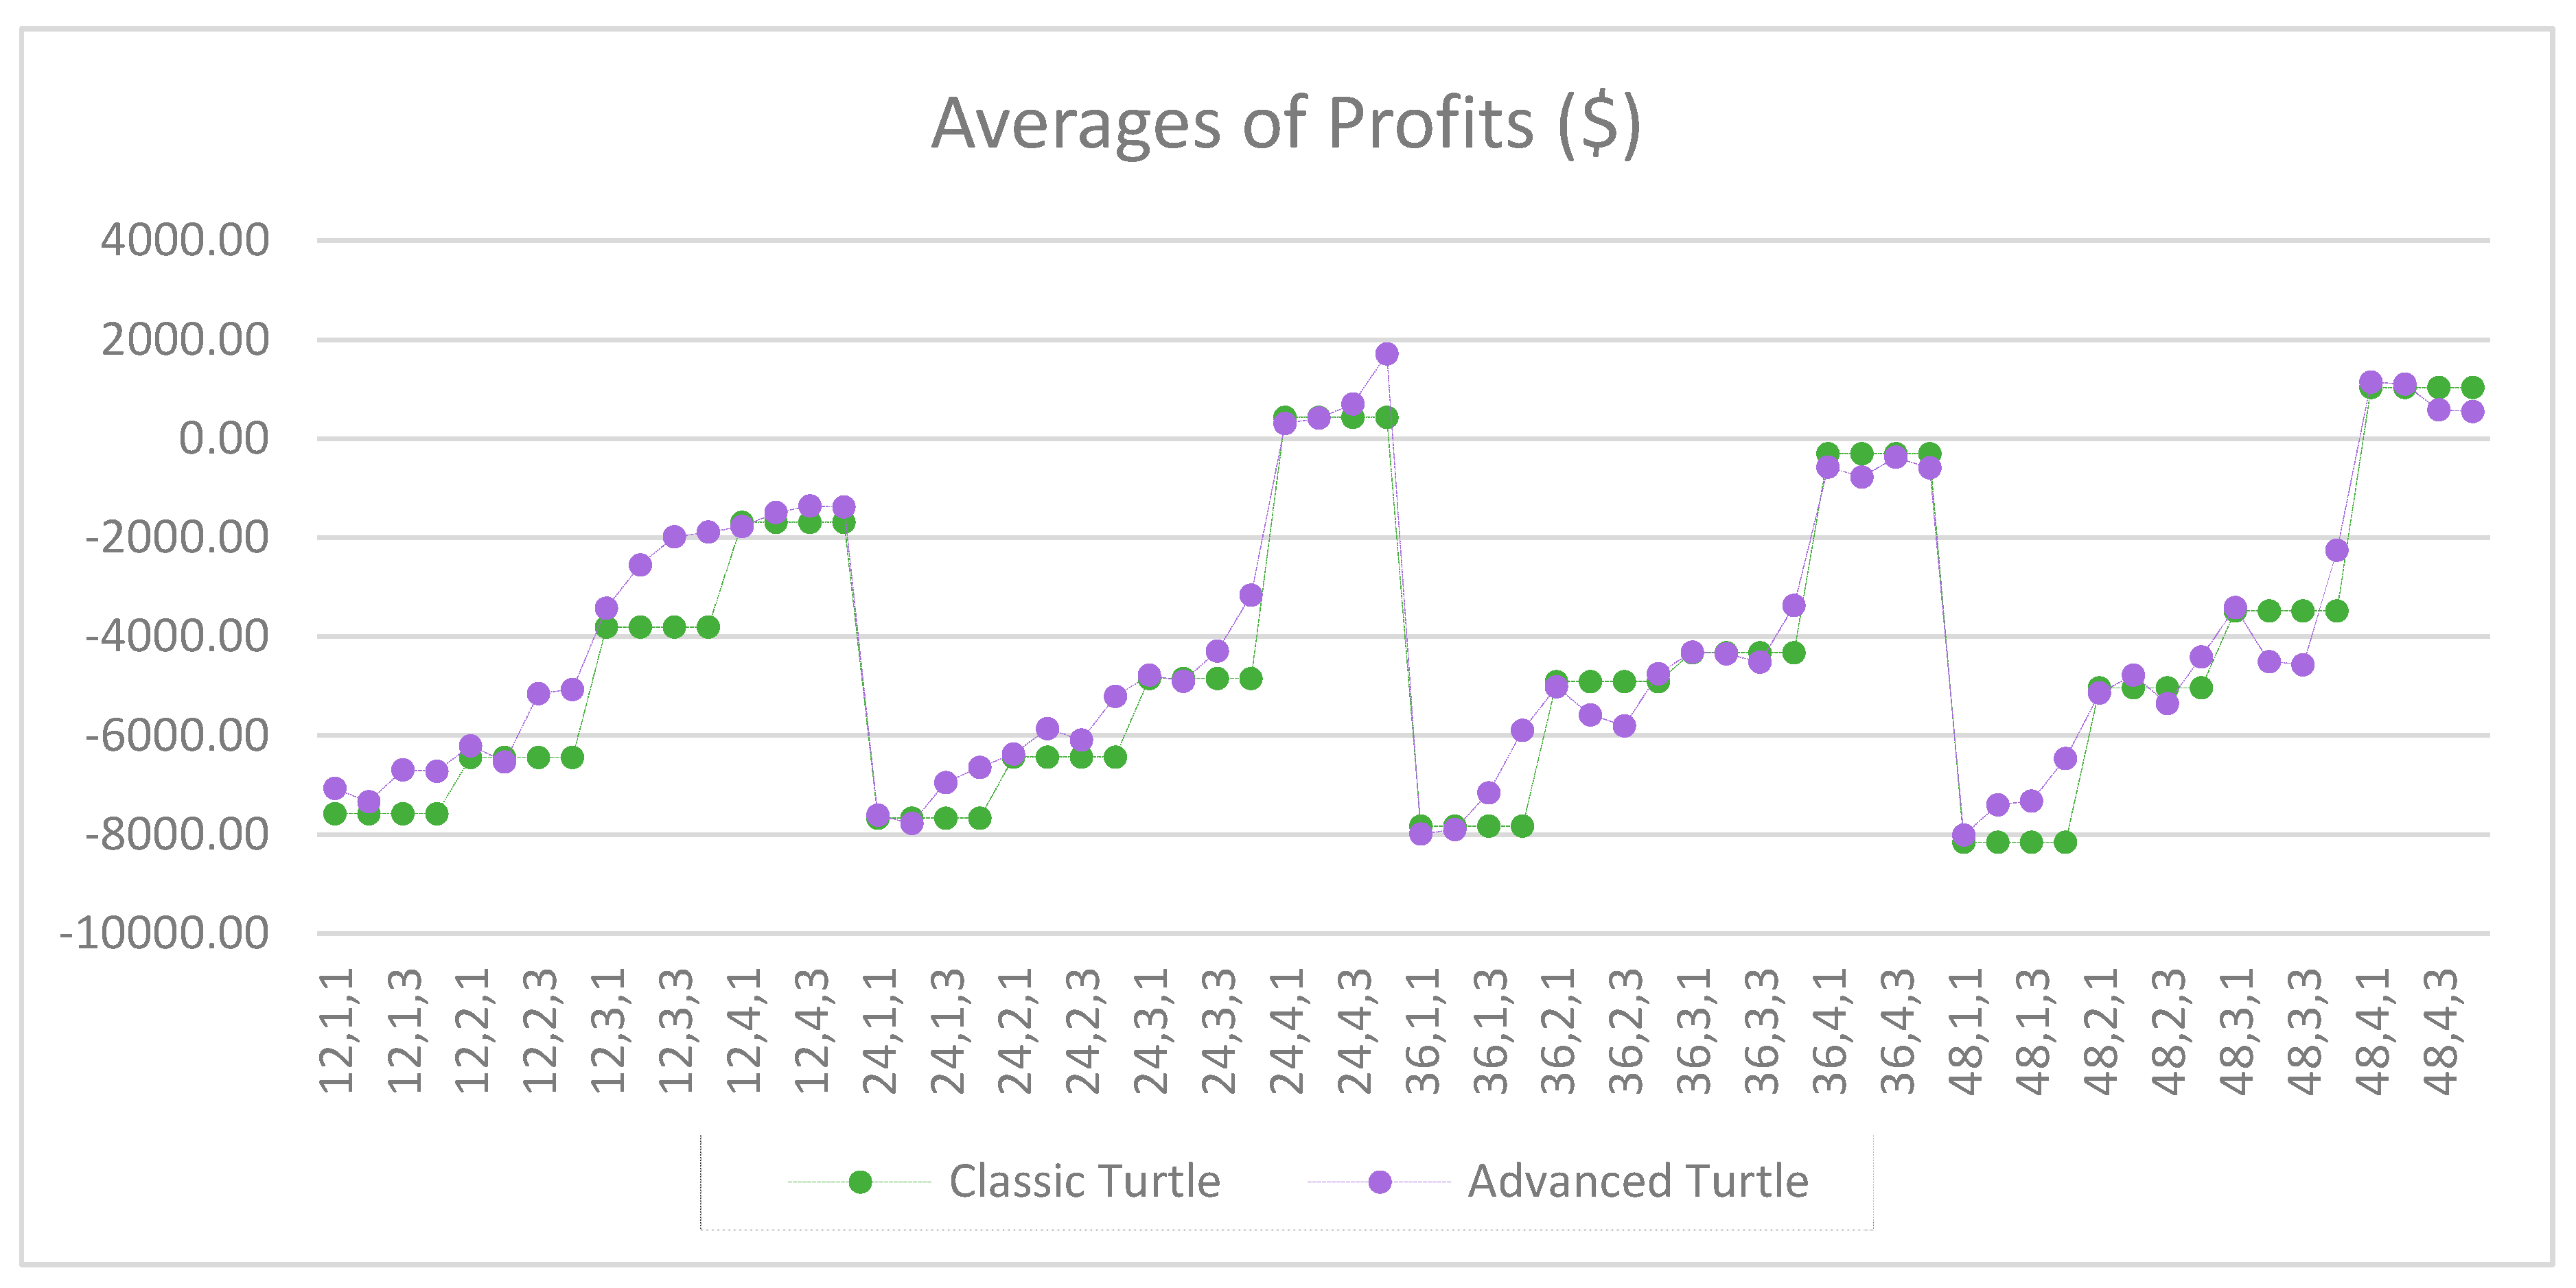
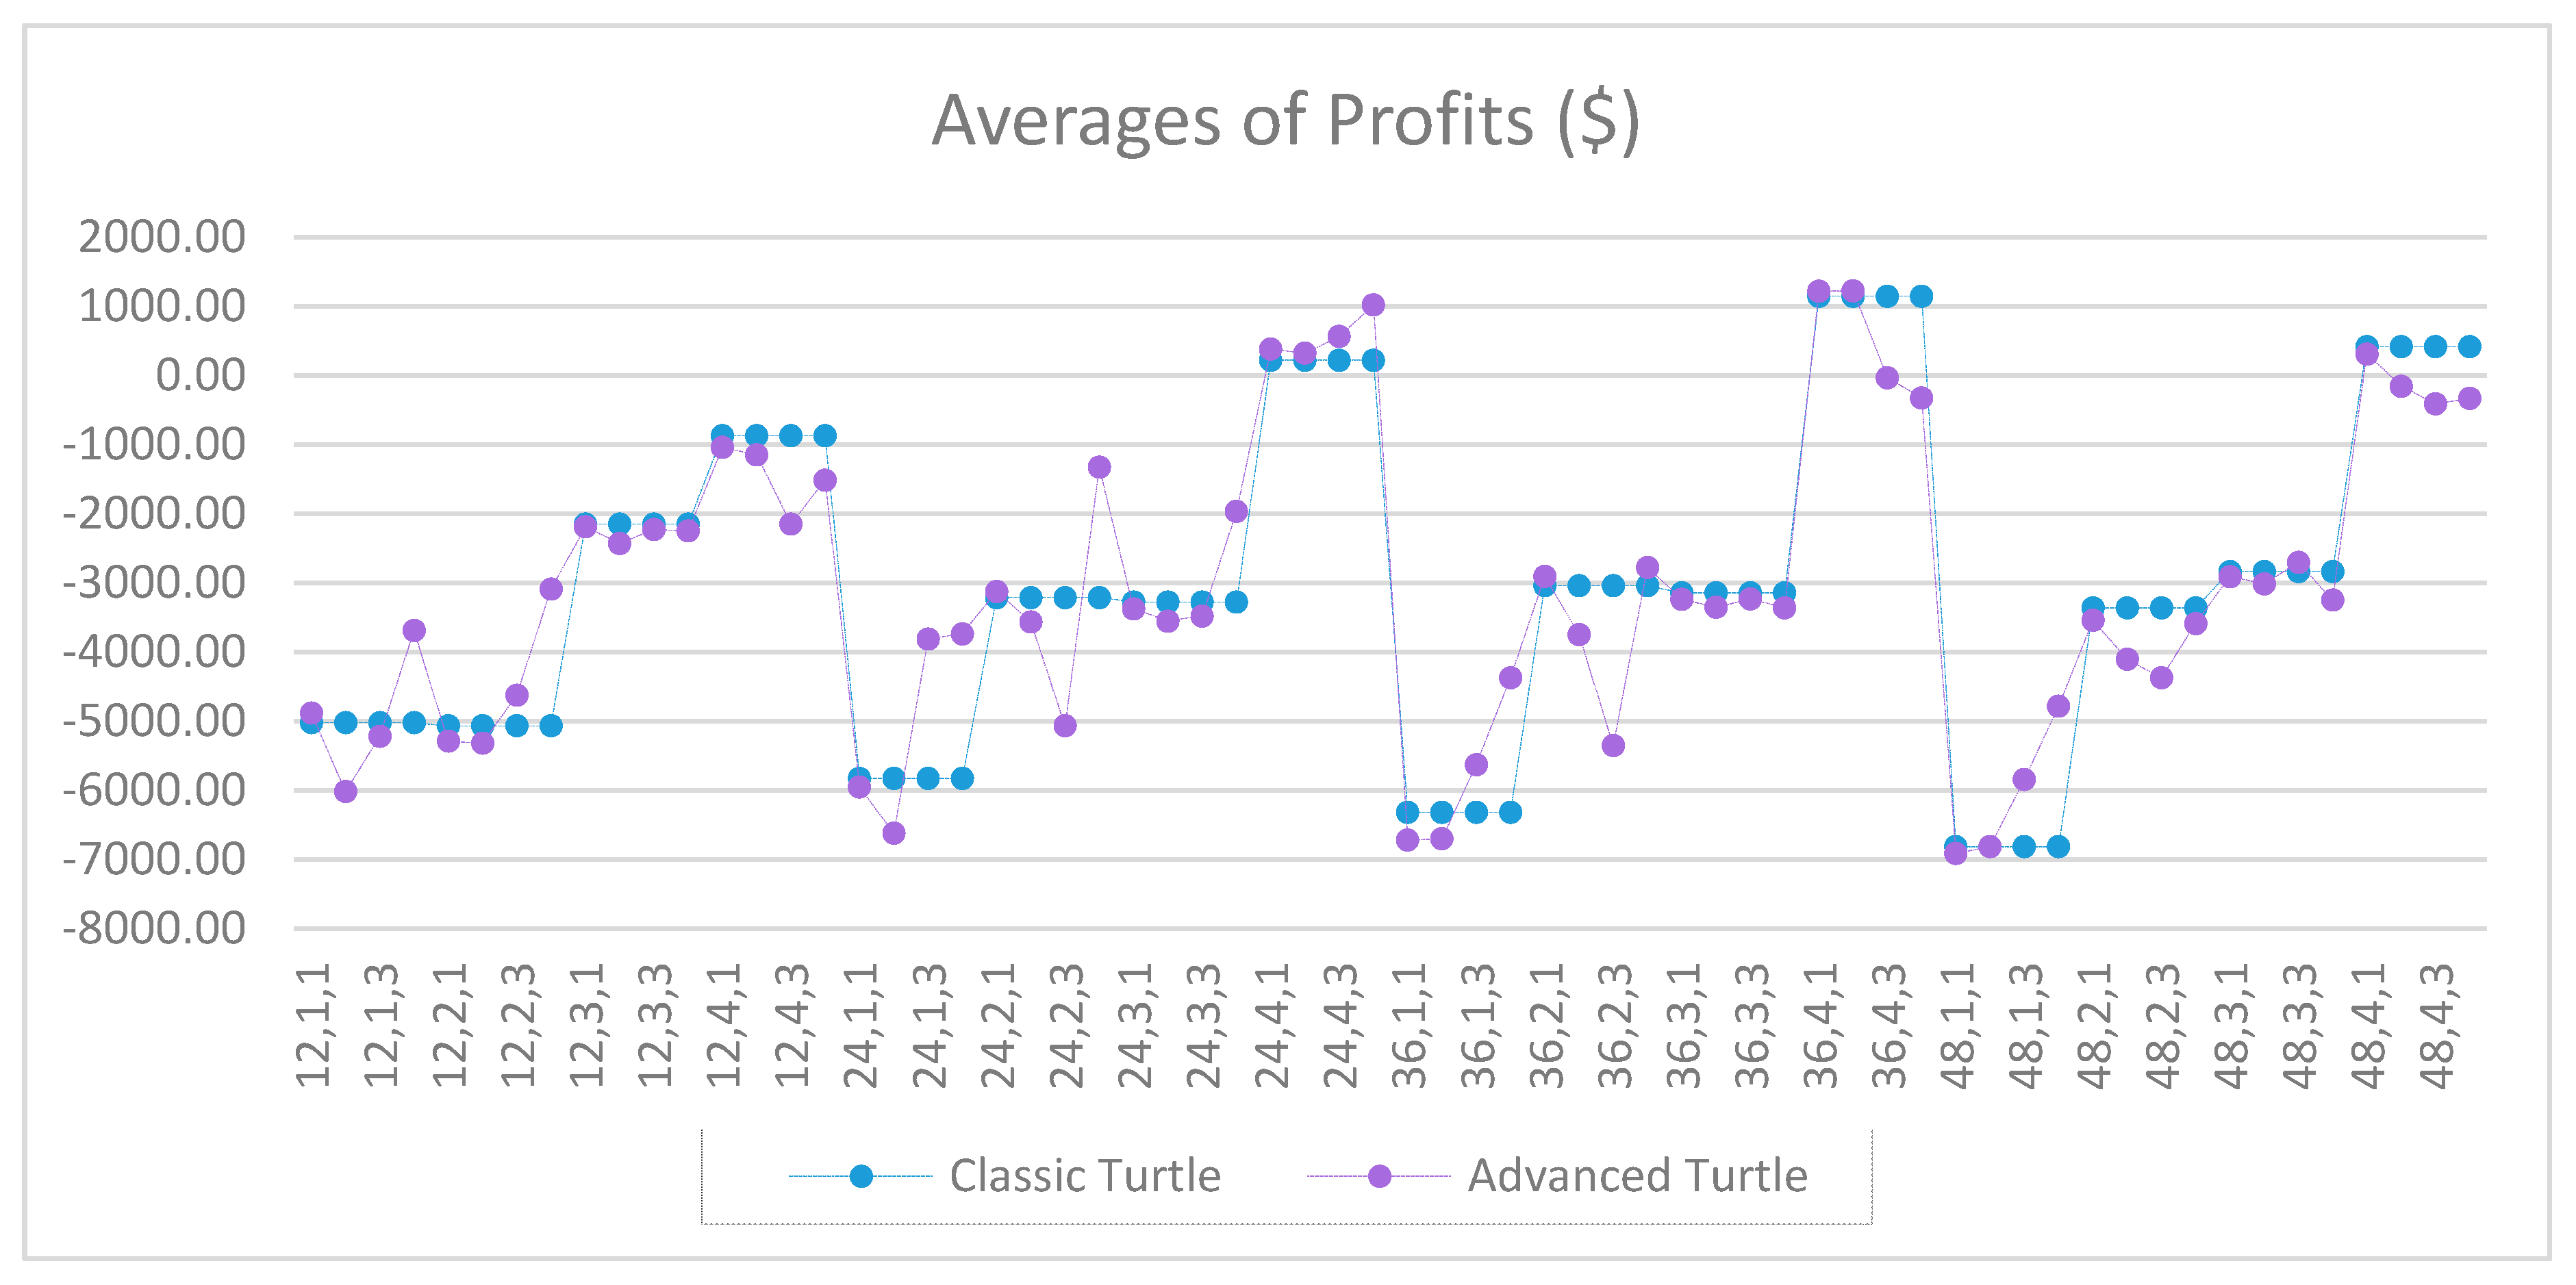
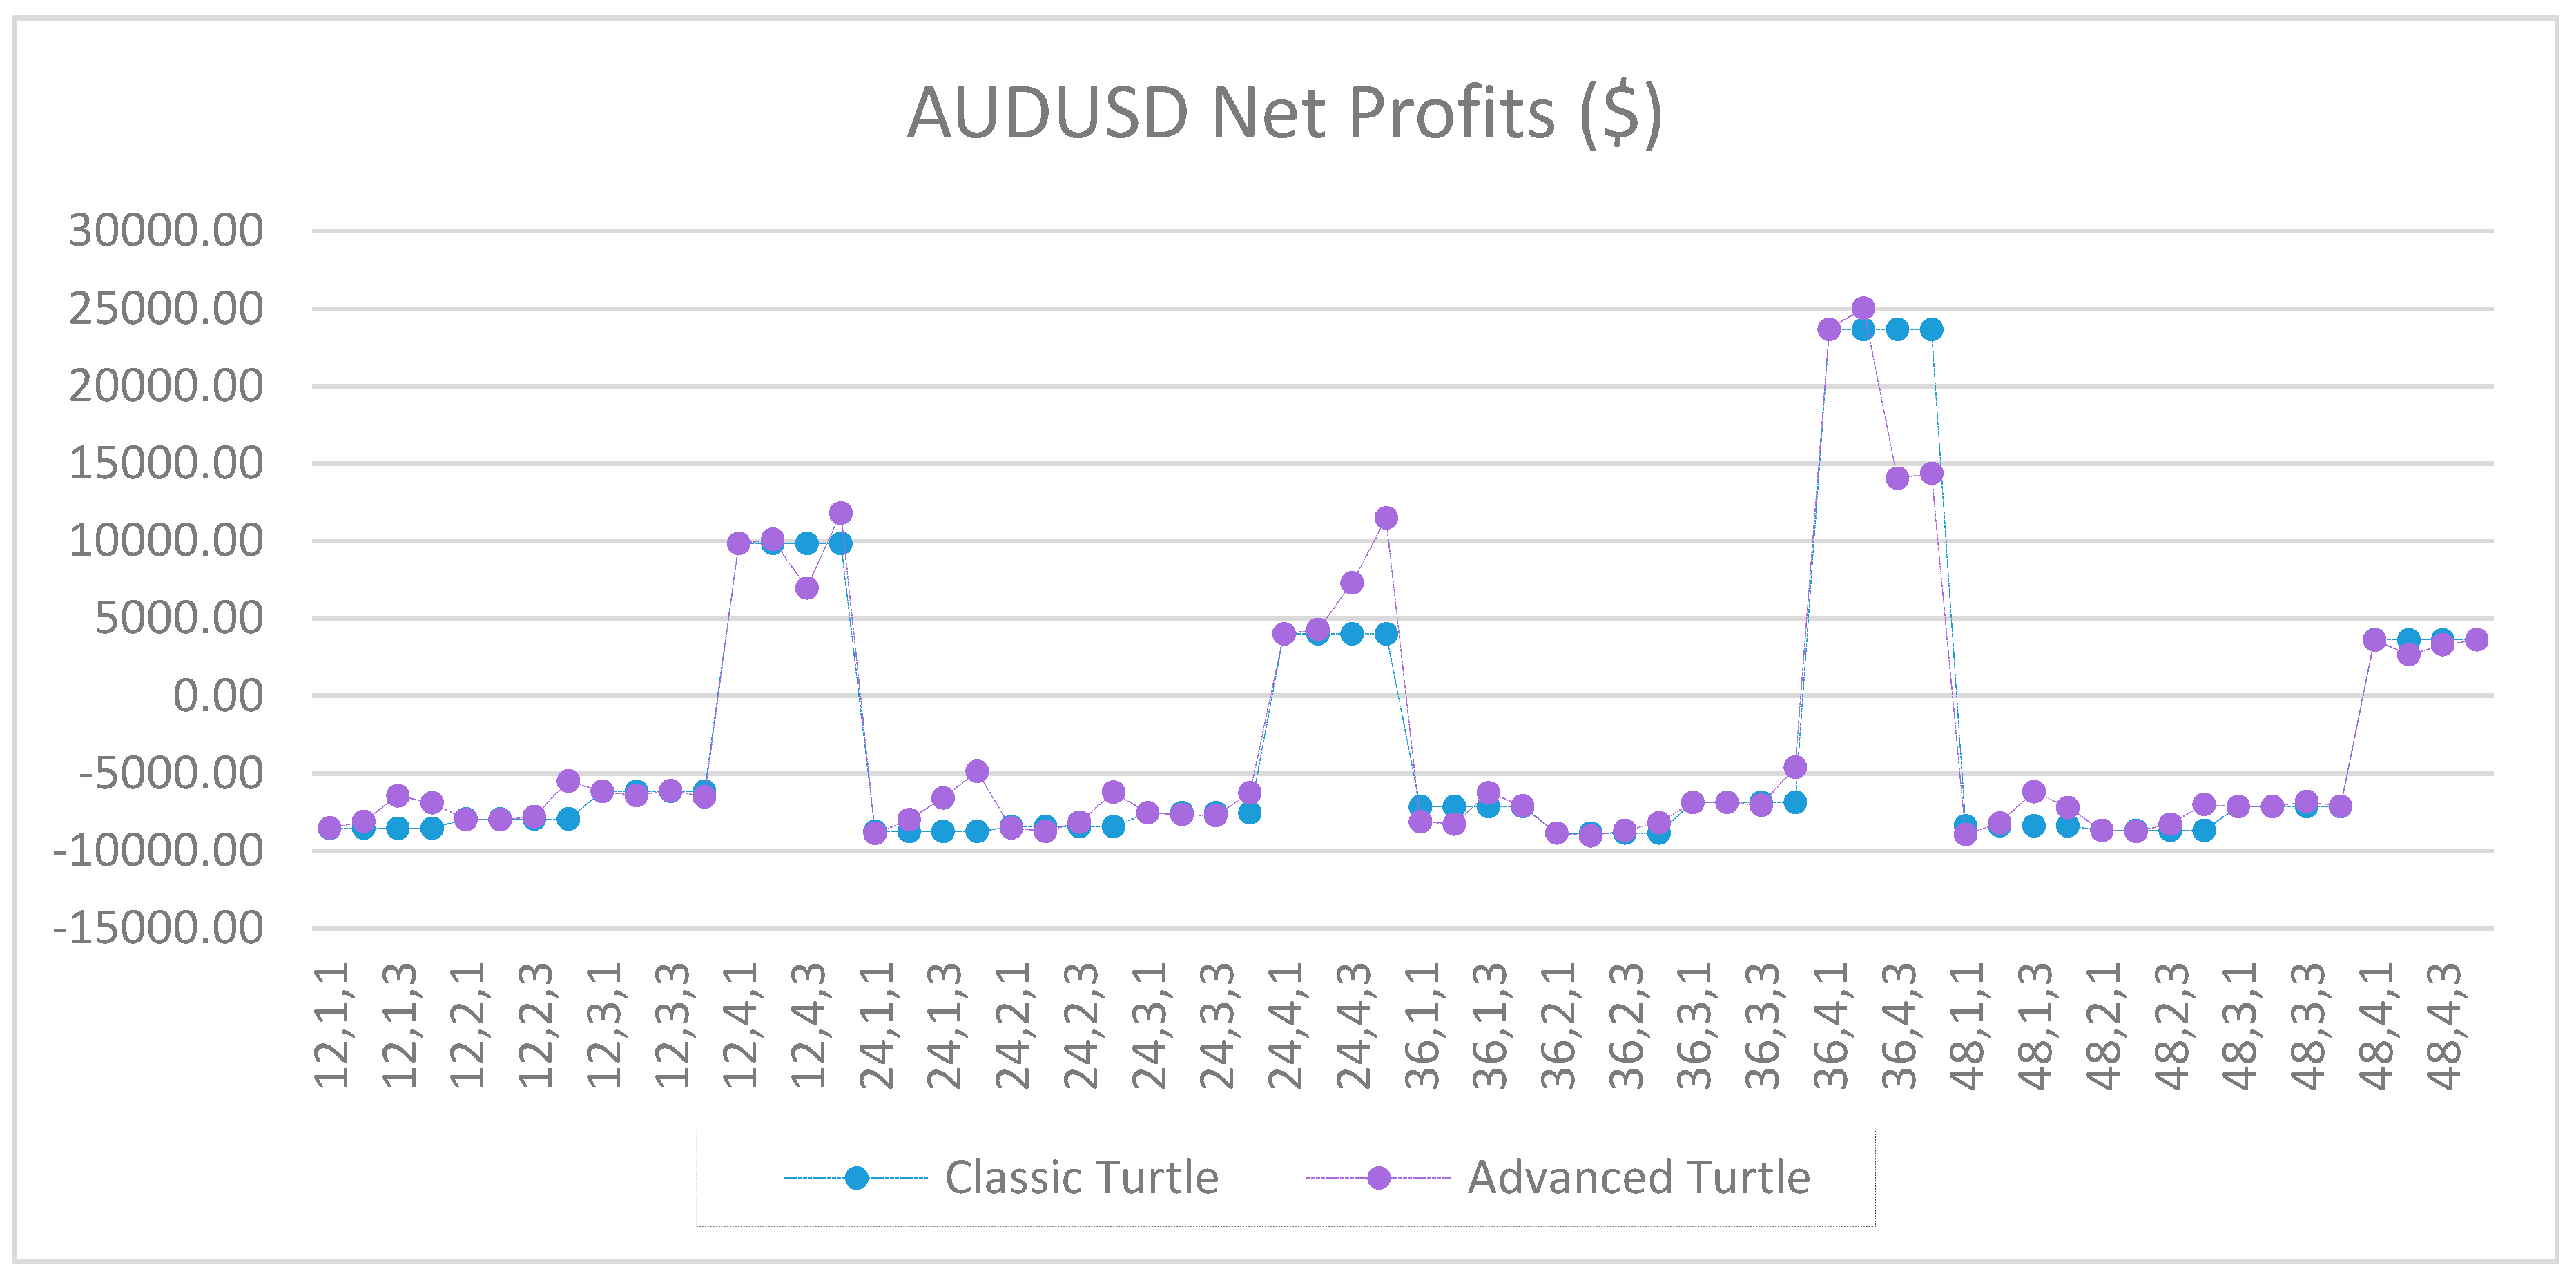
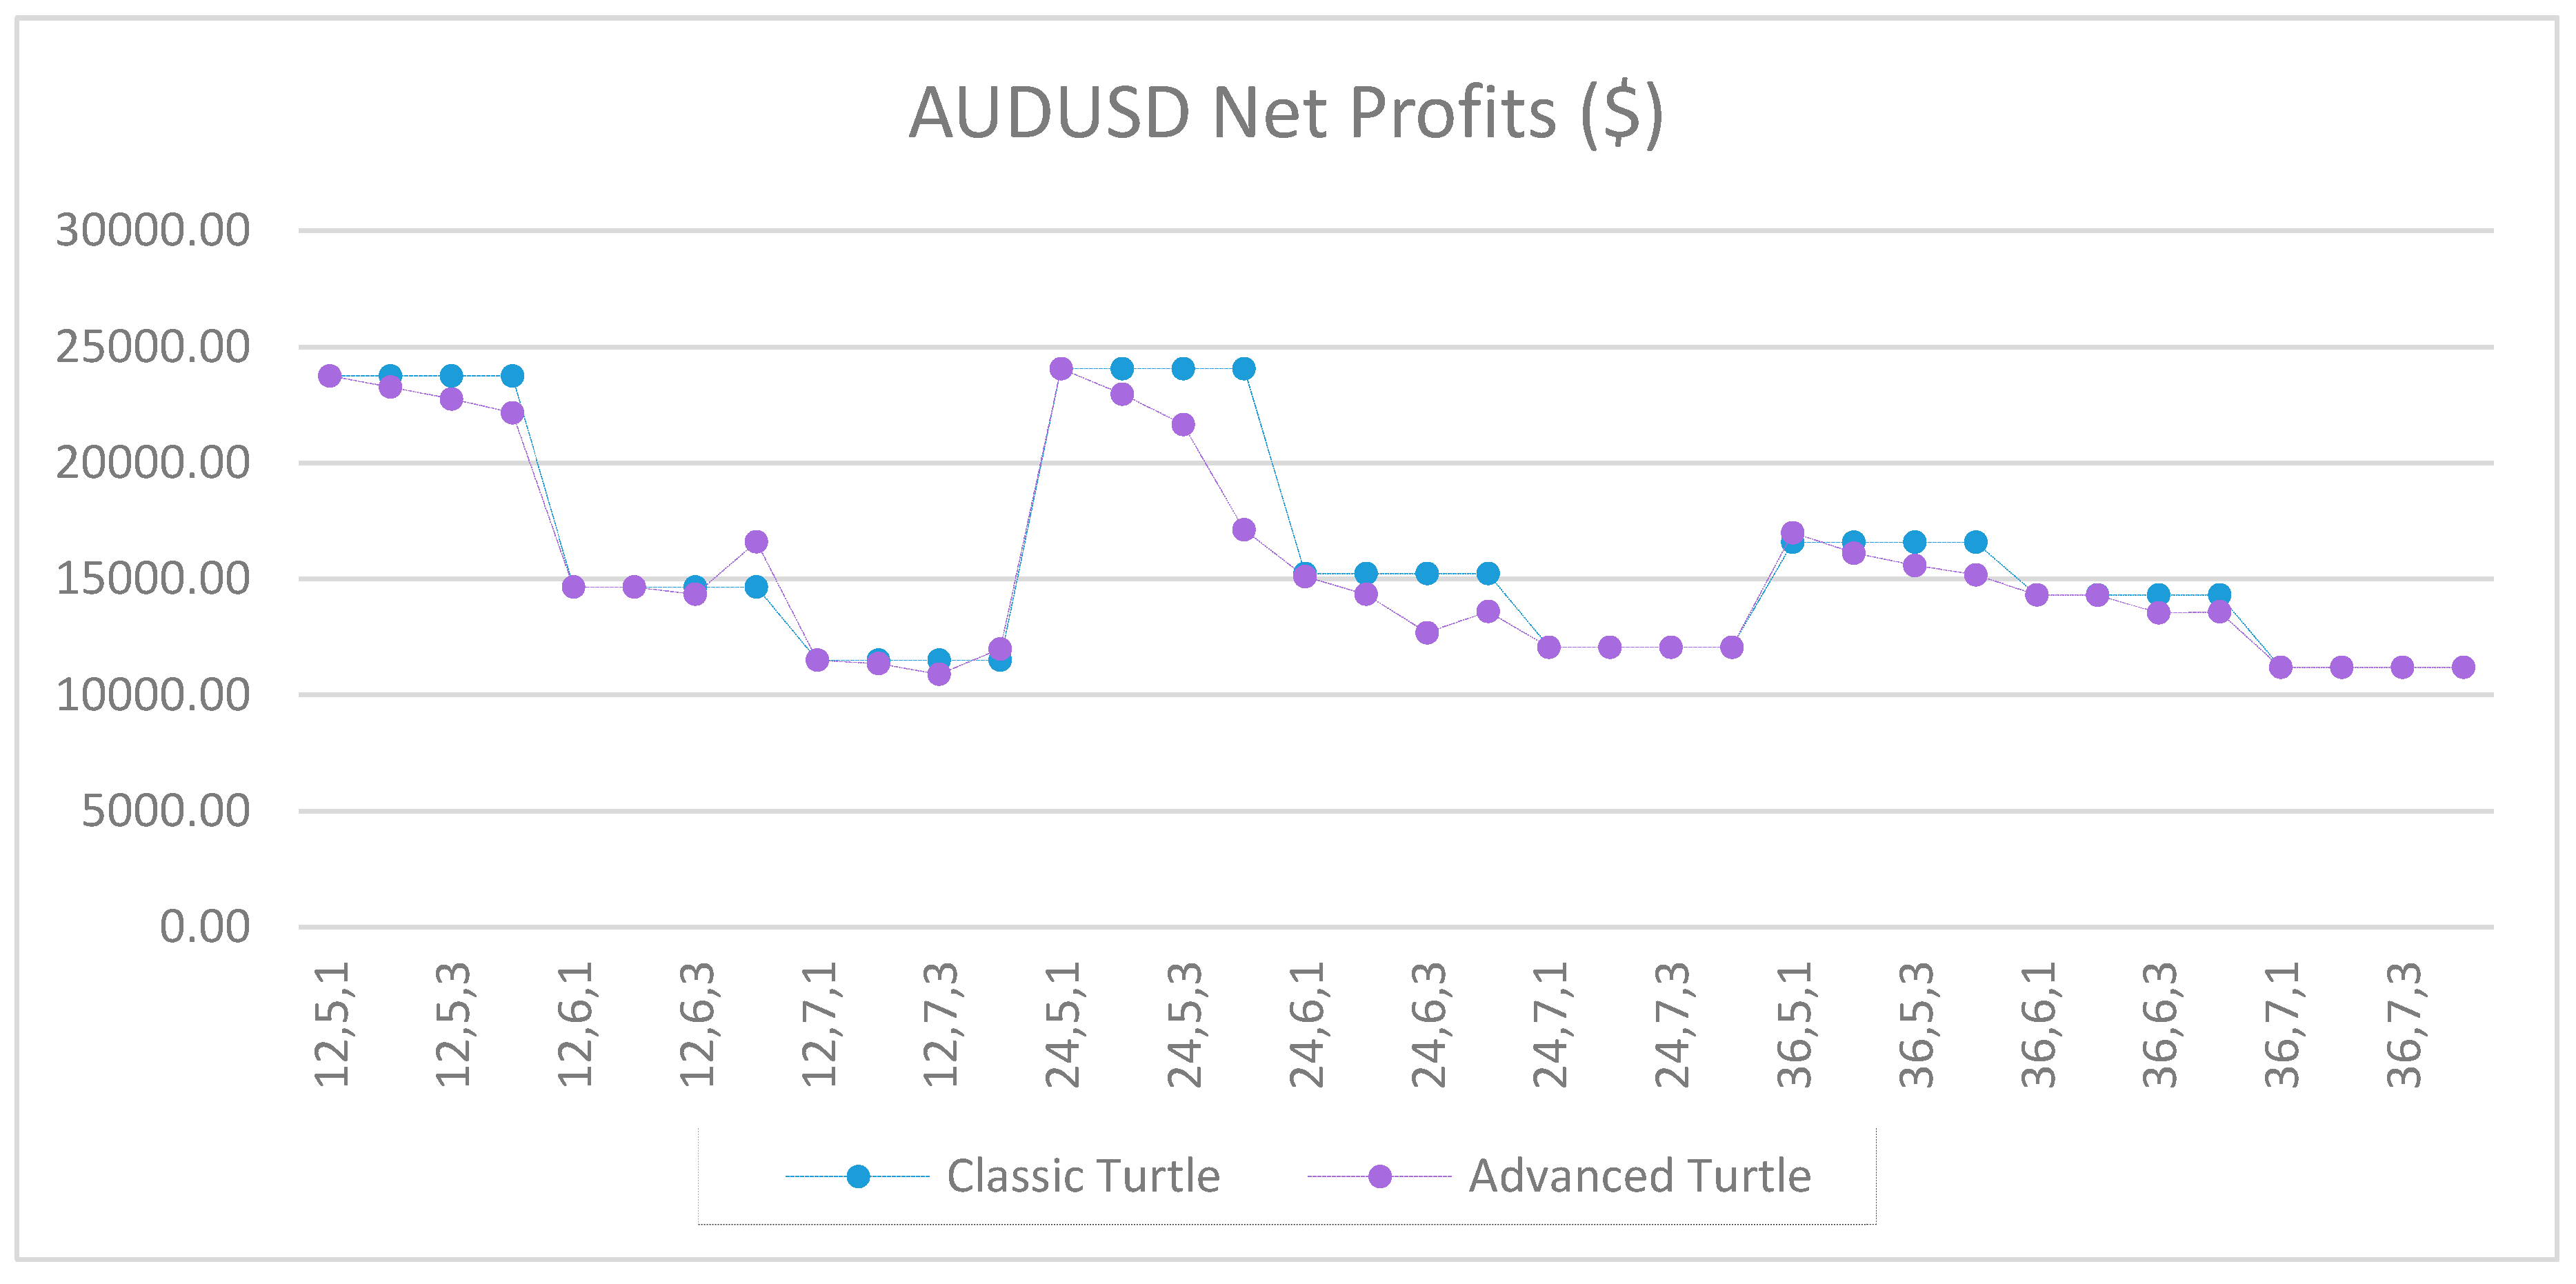
Figure A1.
Net profits of AUDUSD between the classic and the advanced Turtle systems for every combination of N, X, Y for the fast parameters (20, 40).
Figure A1.
Net profits of AUDUSD between the classic and the advanced Turtle systems for every combination of N, X, Y for the fast parameters (20, 40).
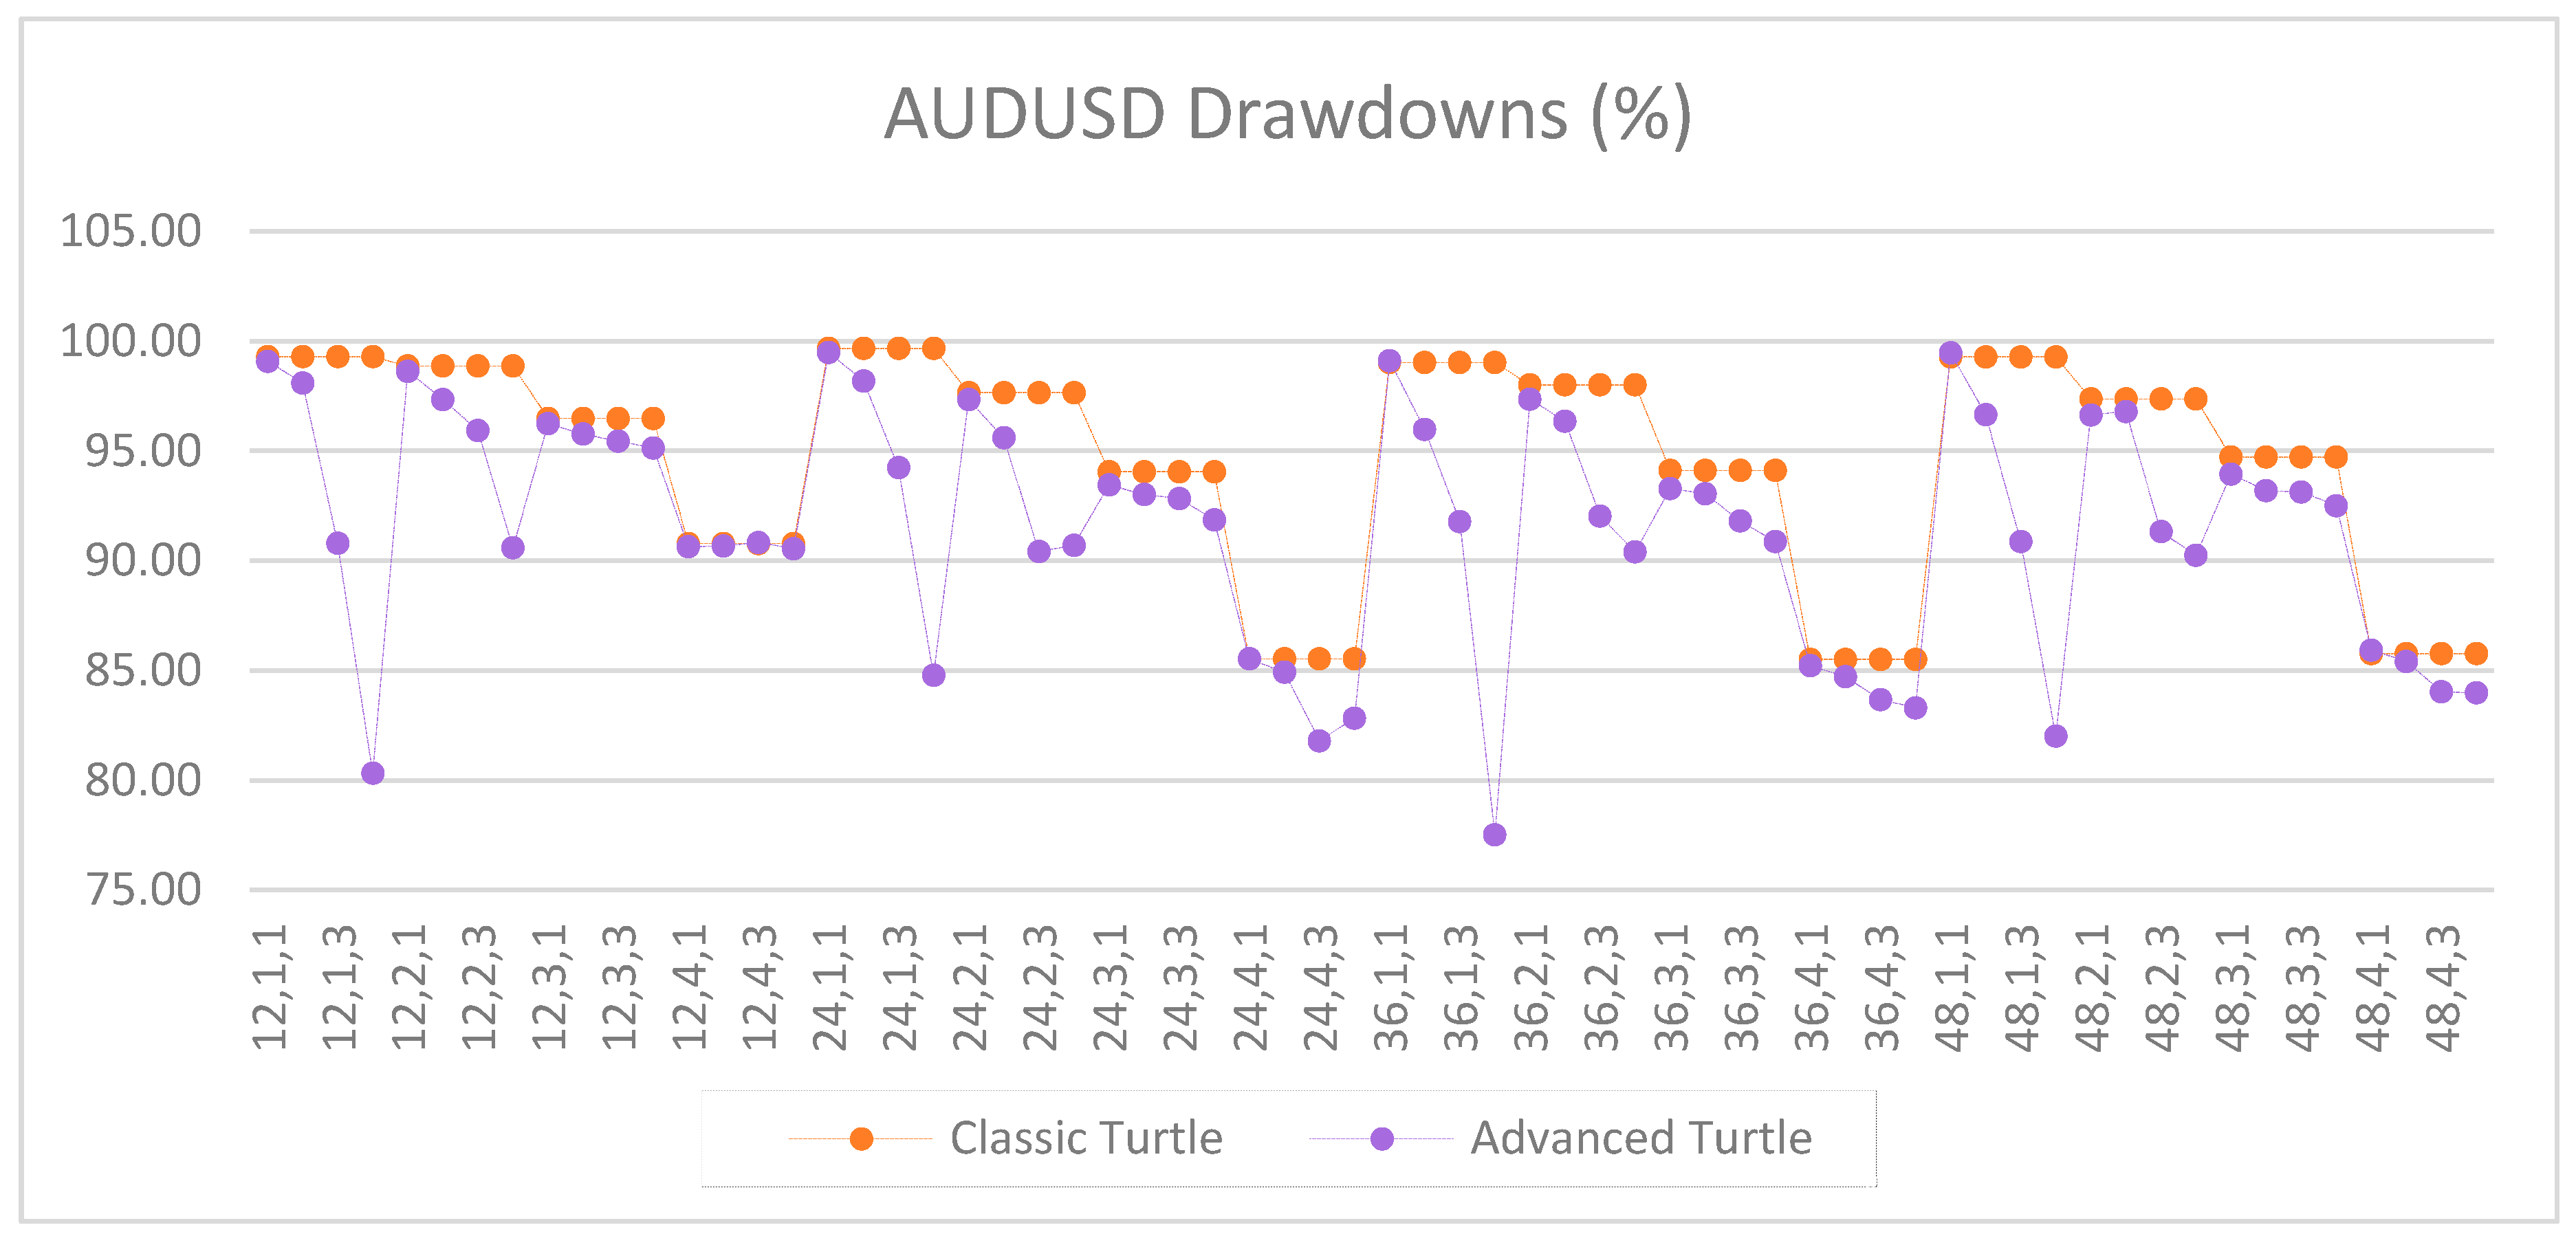
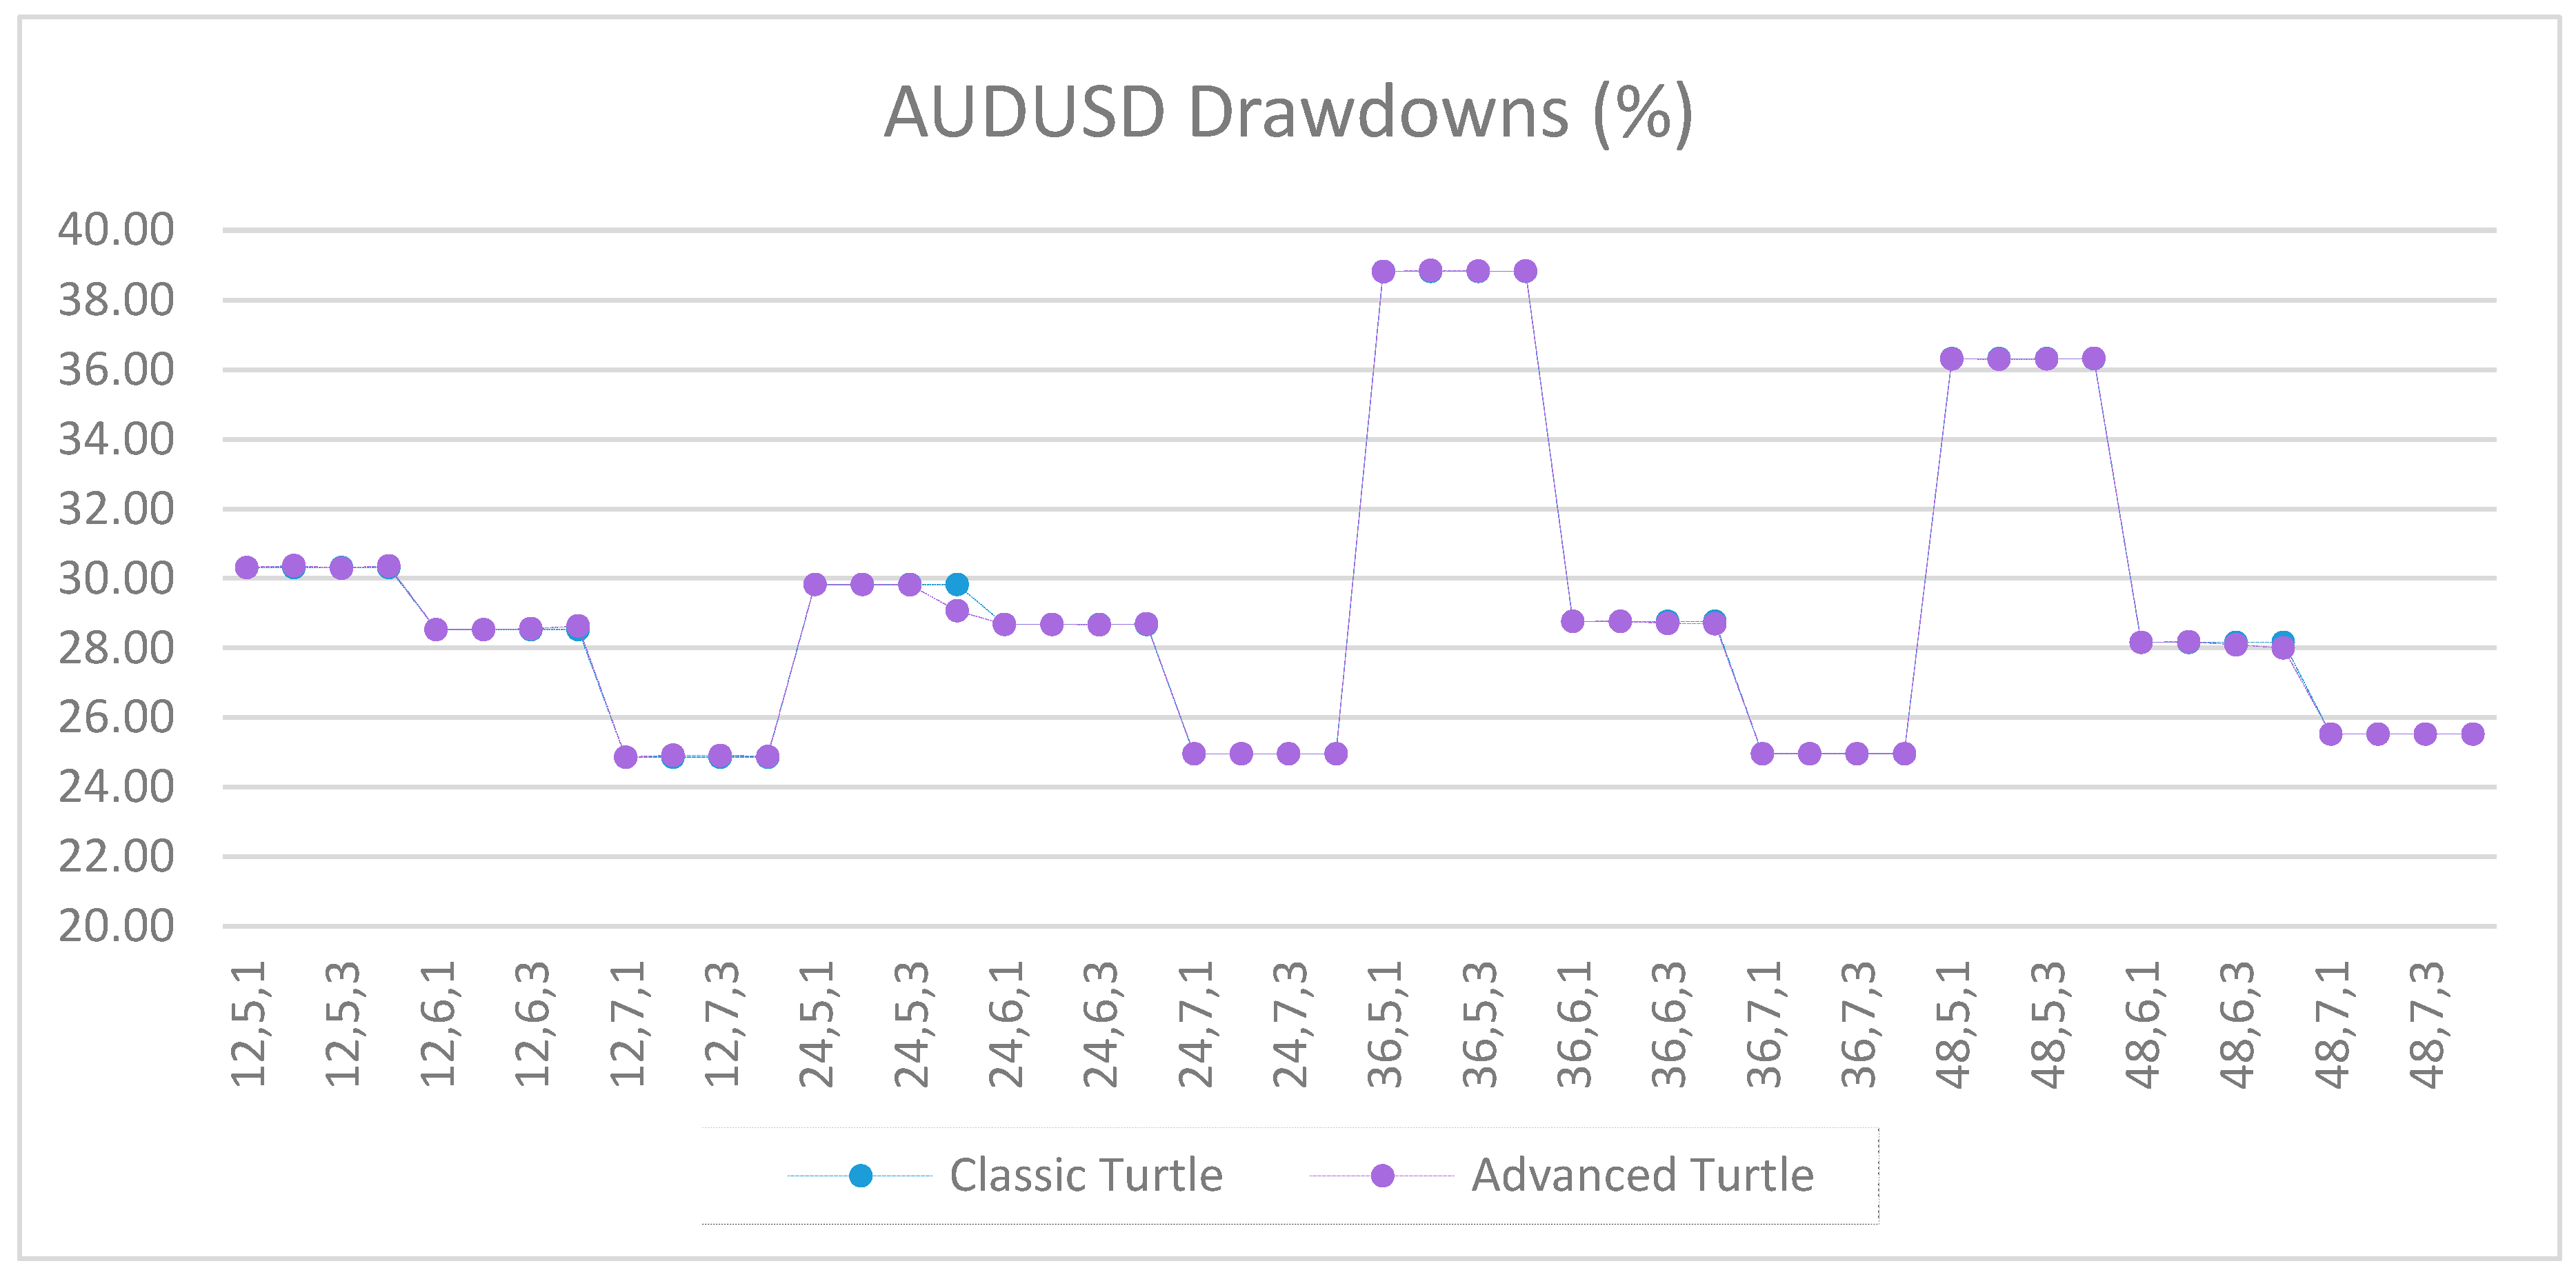
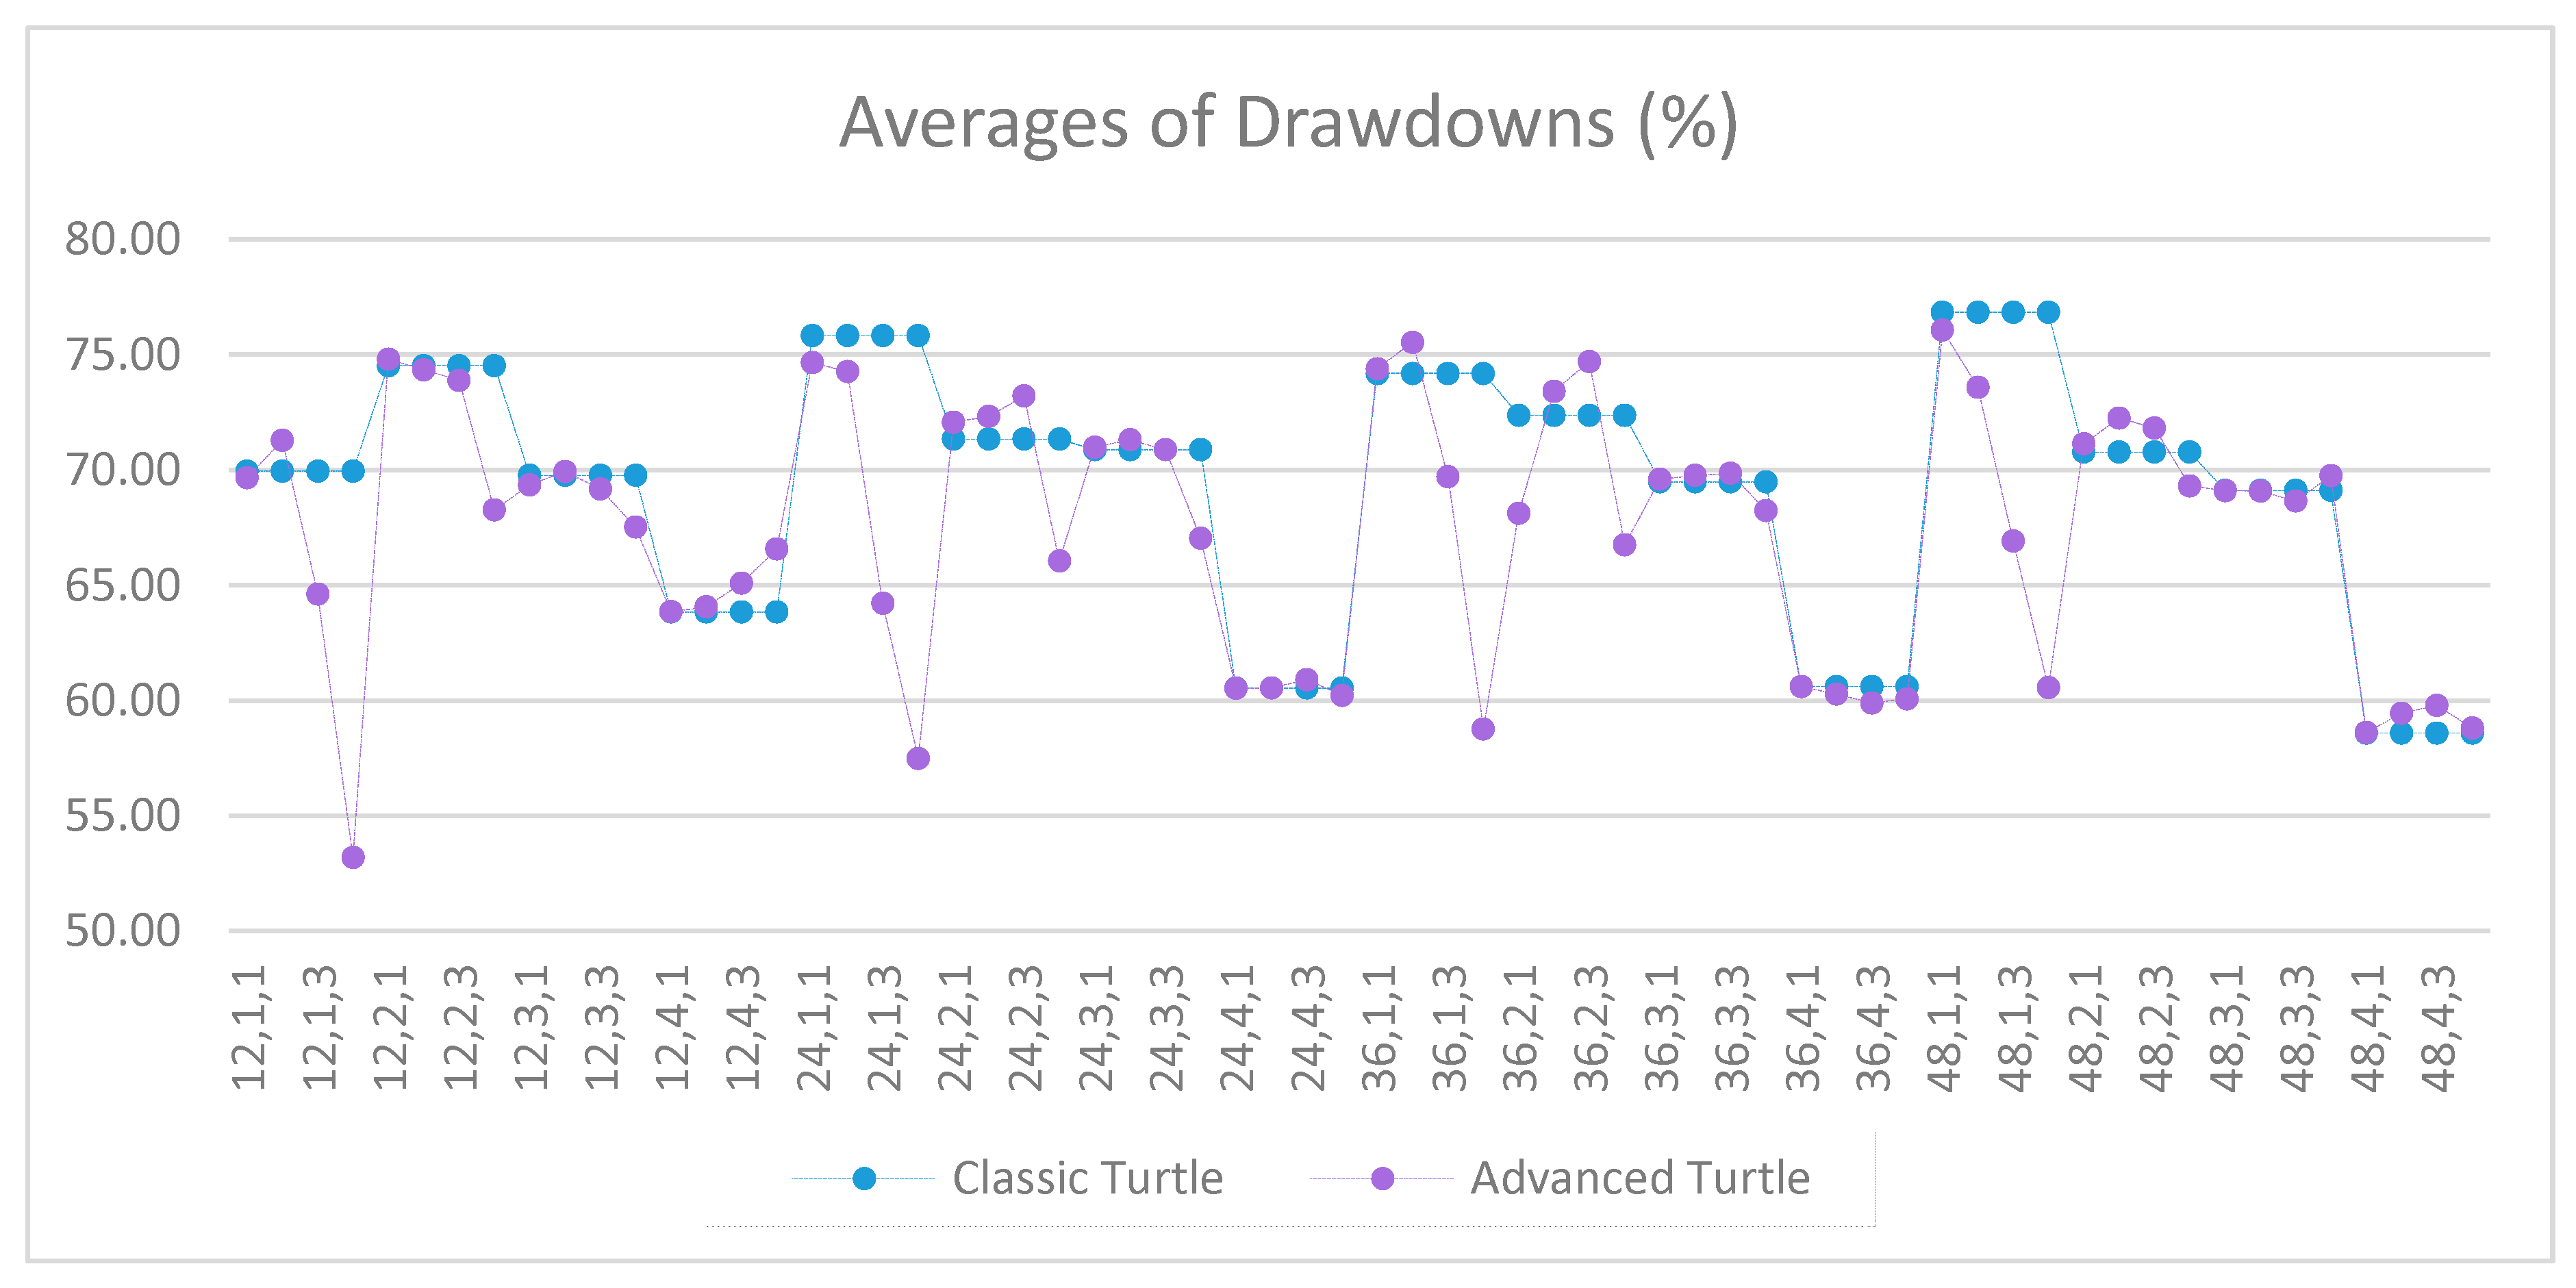
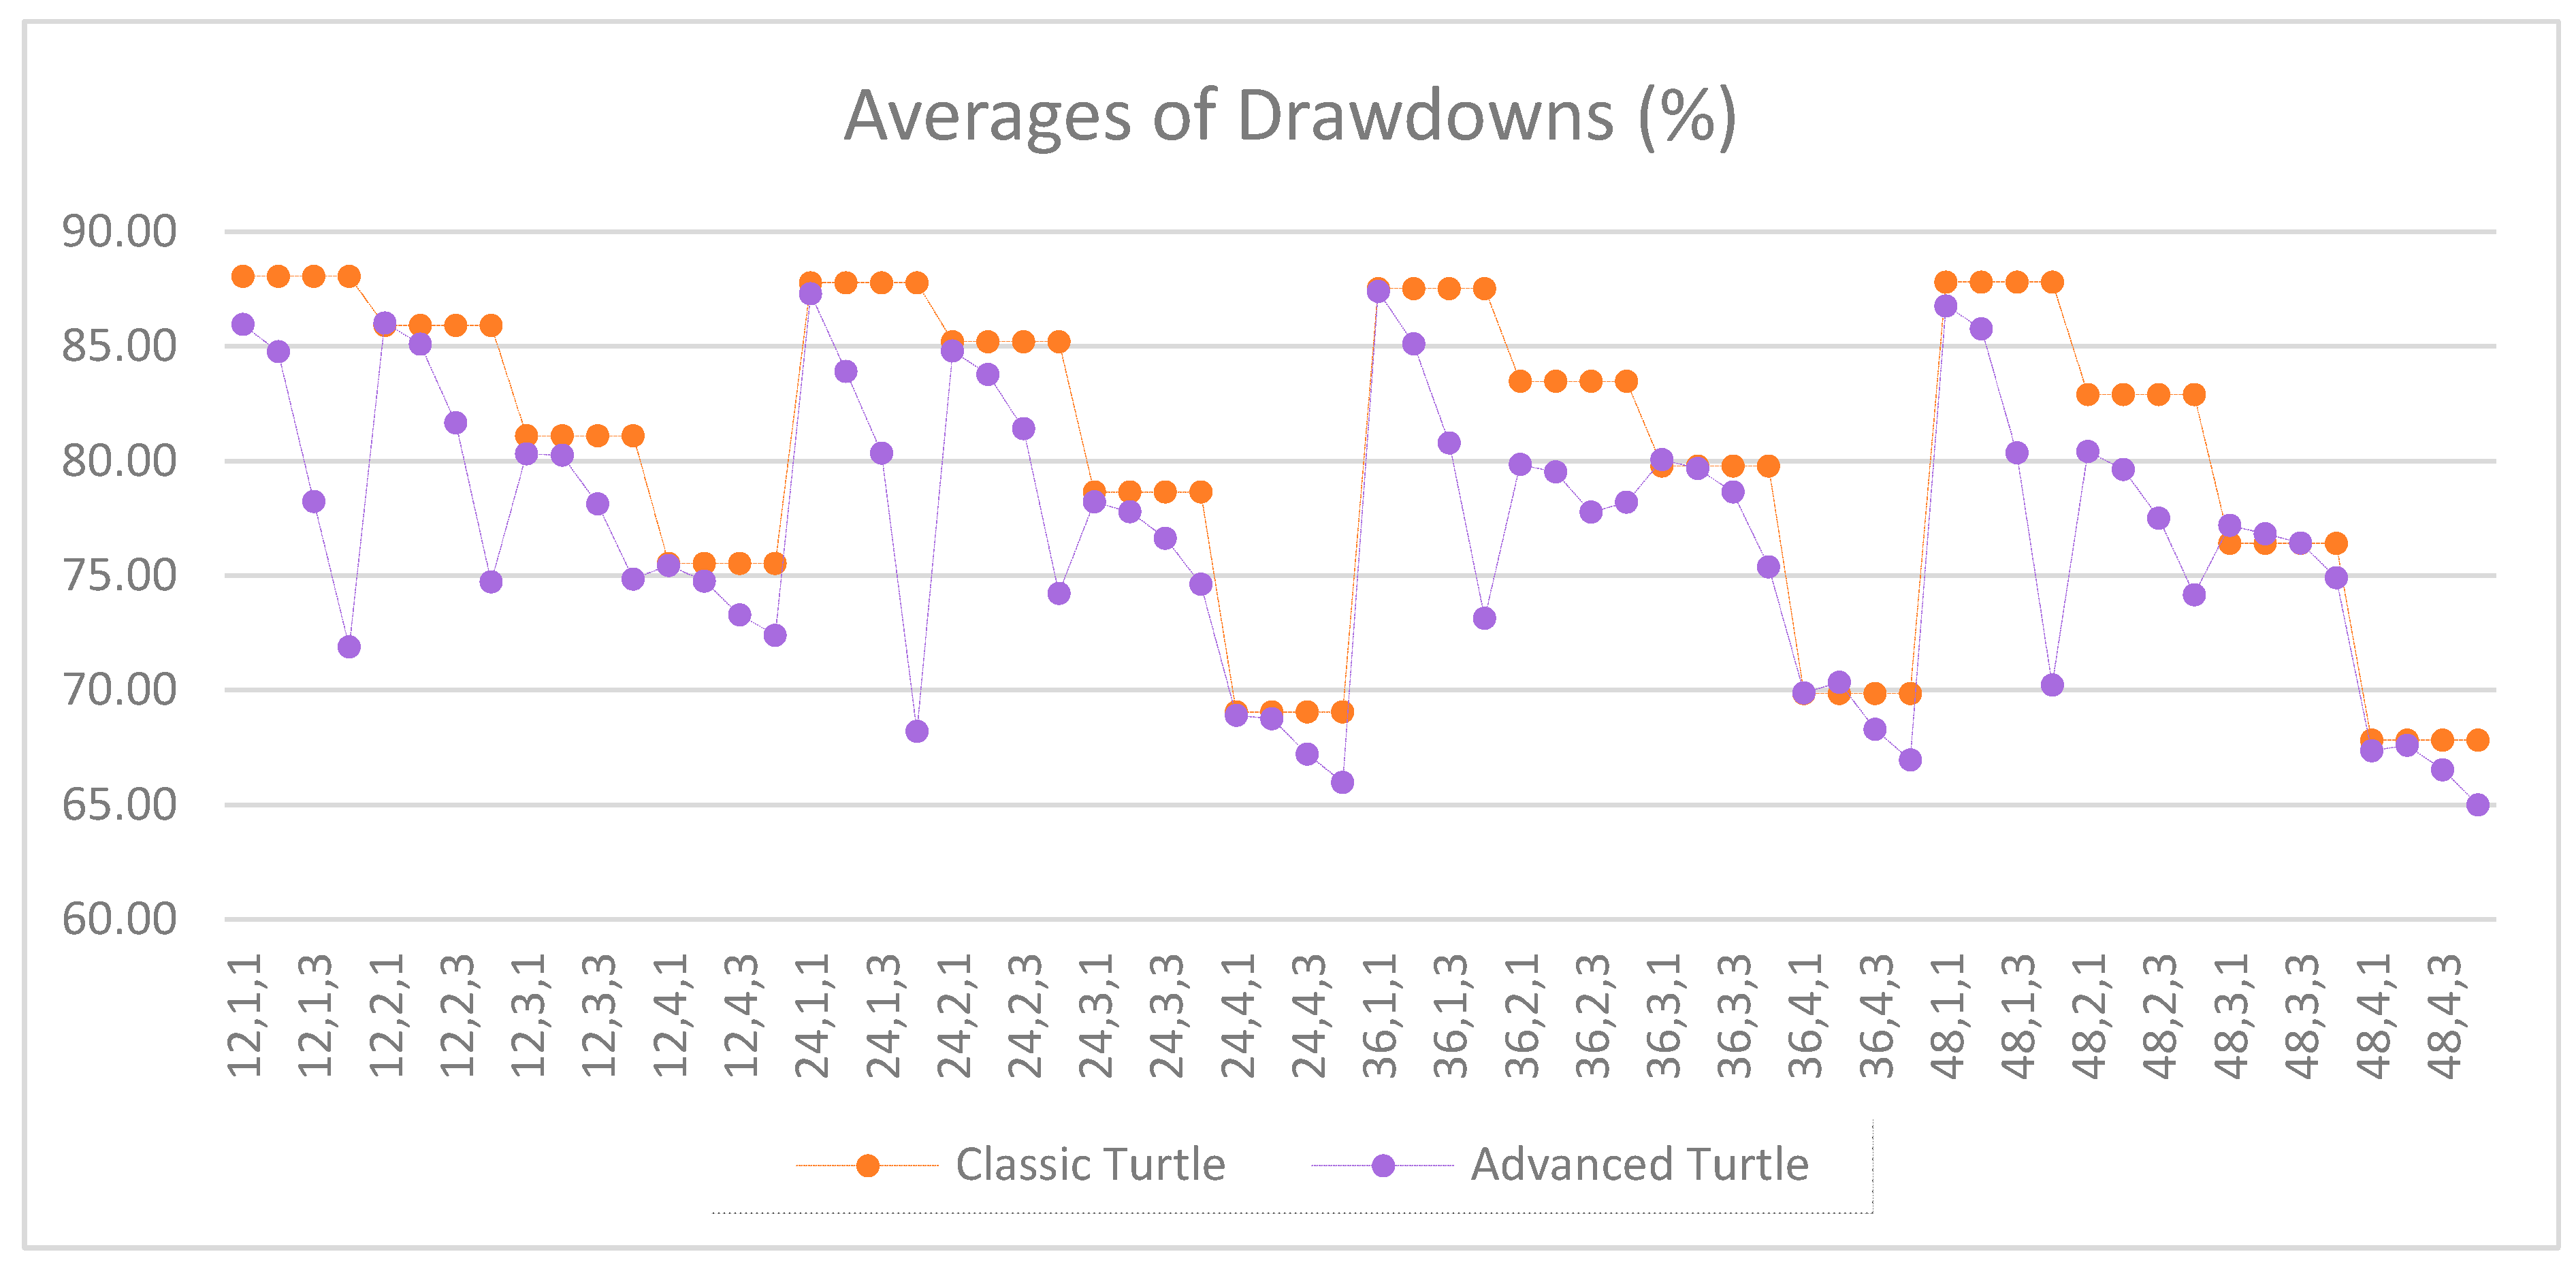
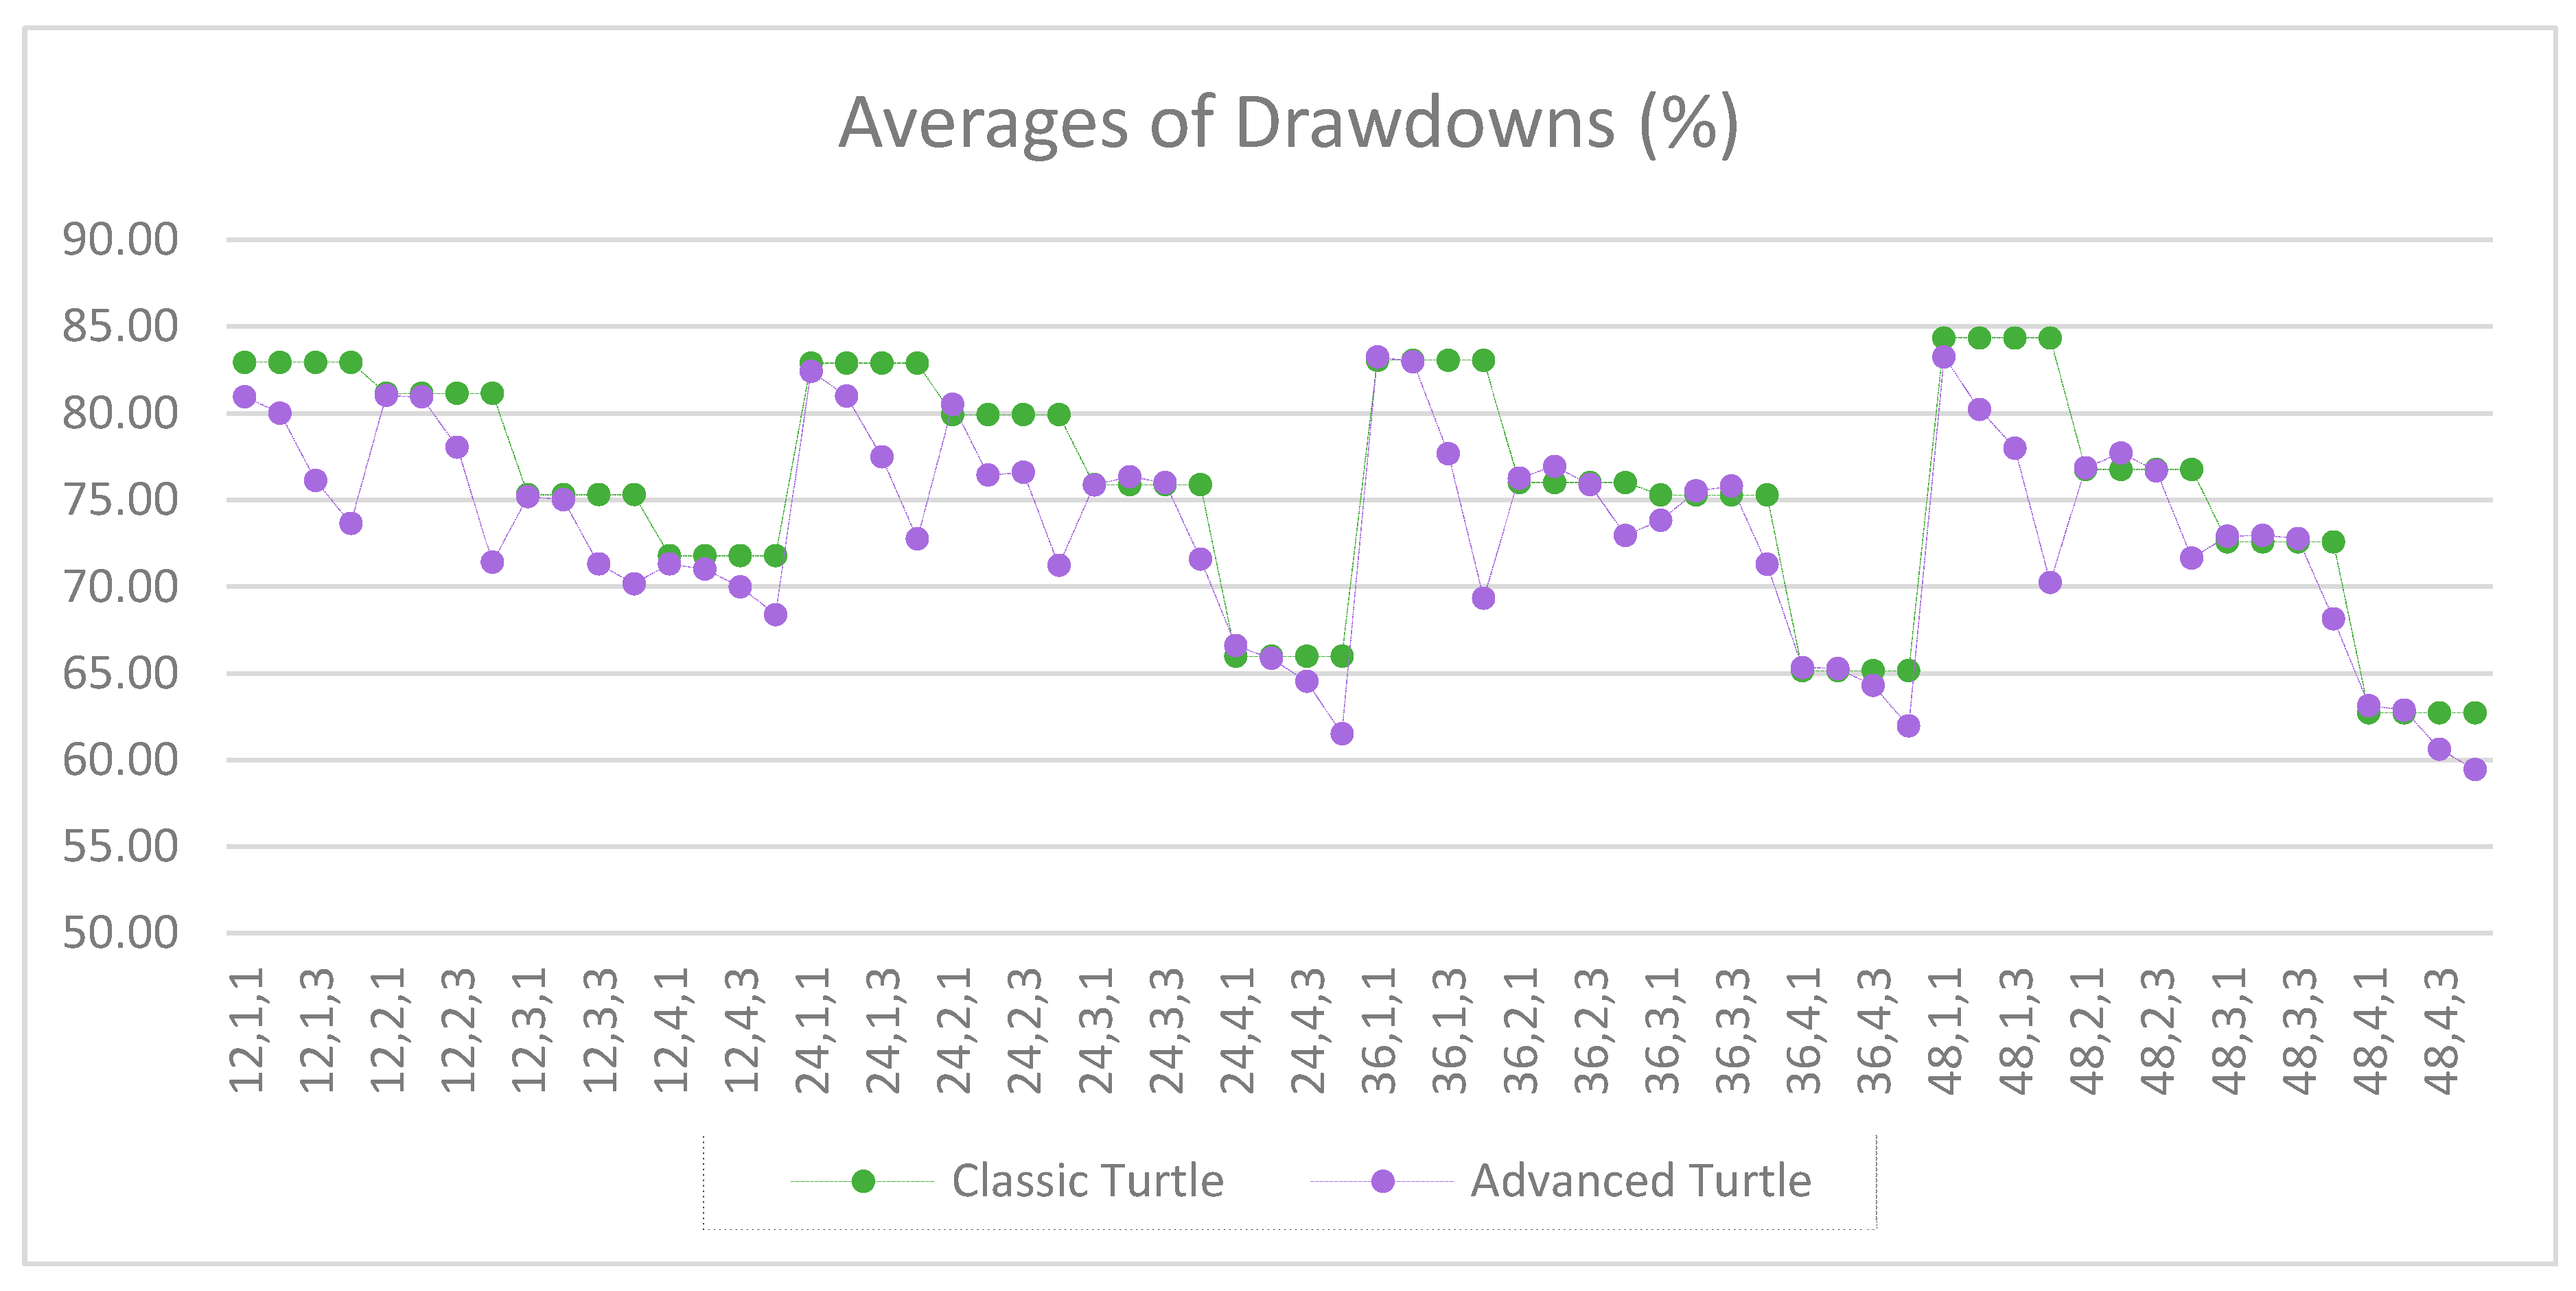
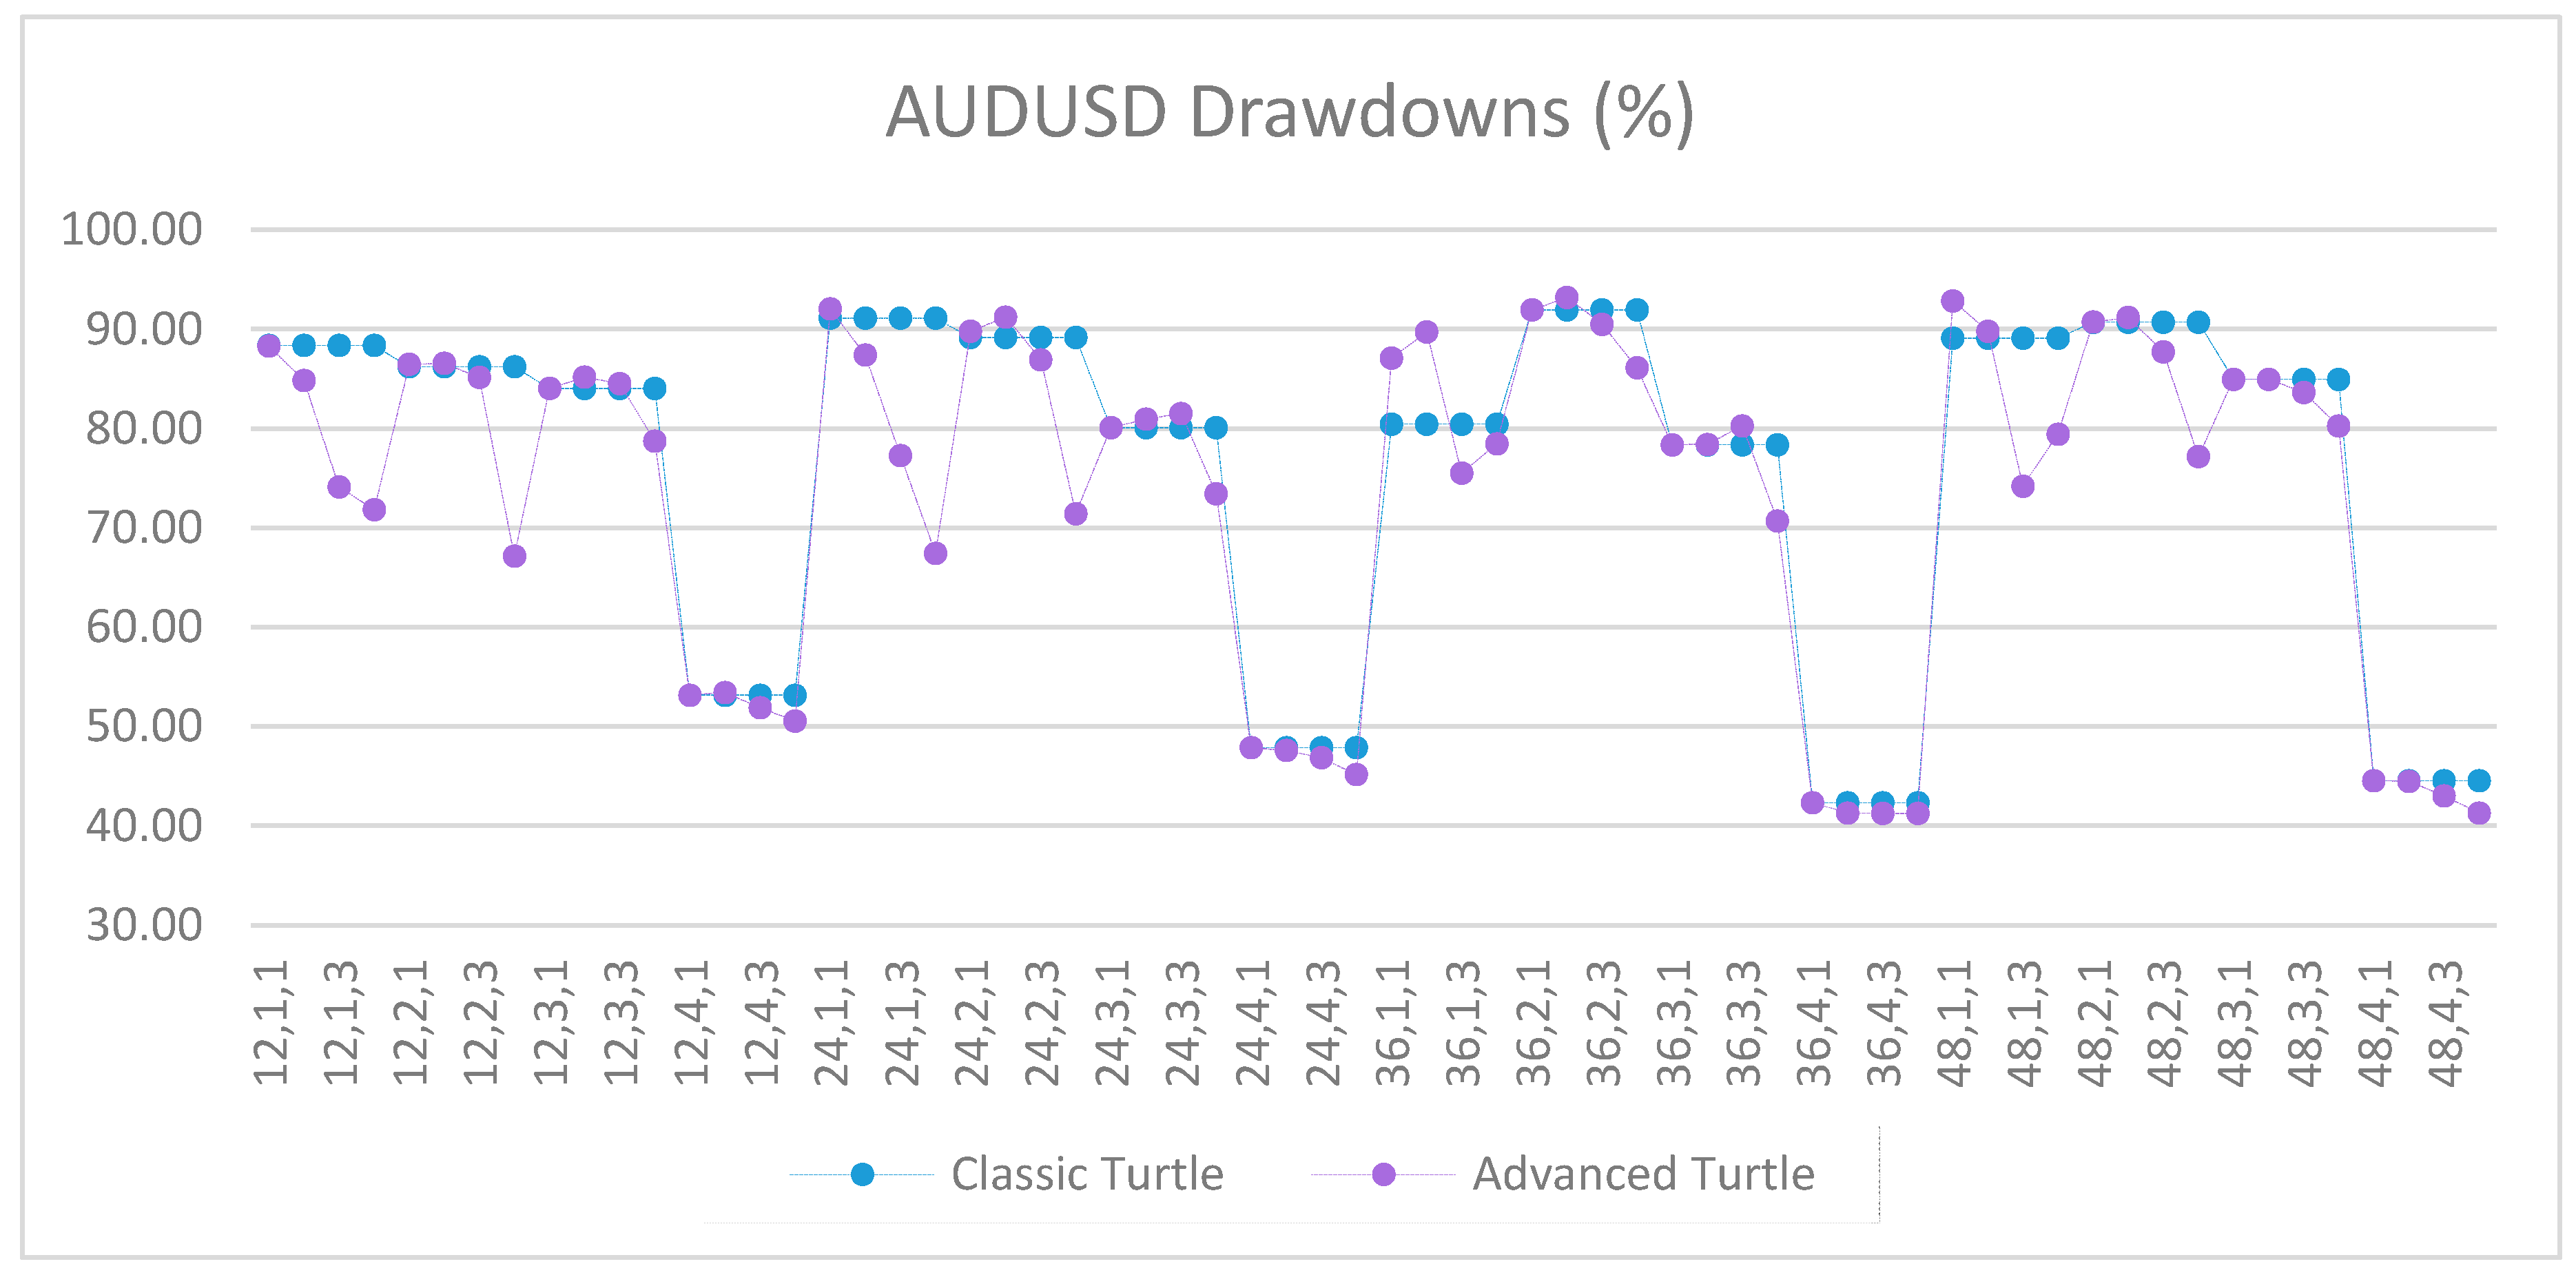
Figure A2.
Drawdowns of AUDUSD as percentage of equity between the classic and the advanced Turtle systems for every combination of N, X, Y for the fast parameters (20, 40).
Figure A2.
Drawdowns of AUDUSD as percentage of equity between the classic and the advanced Turtle systems for every combination of N, X, Y for the fast parameters (20, 40).
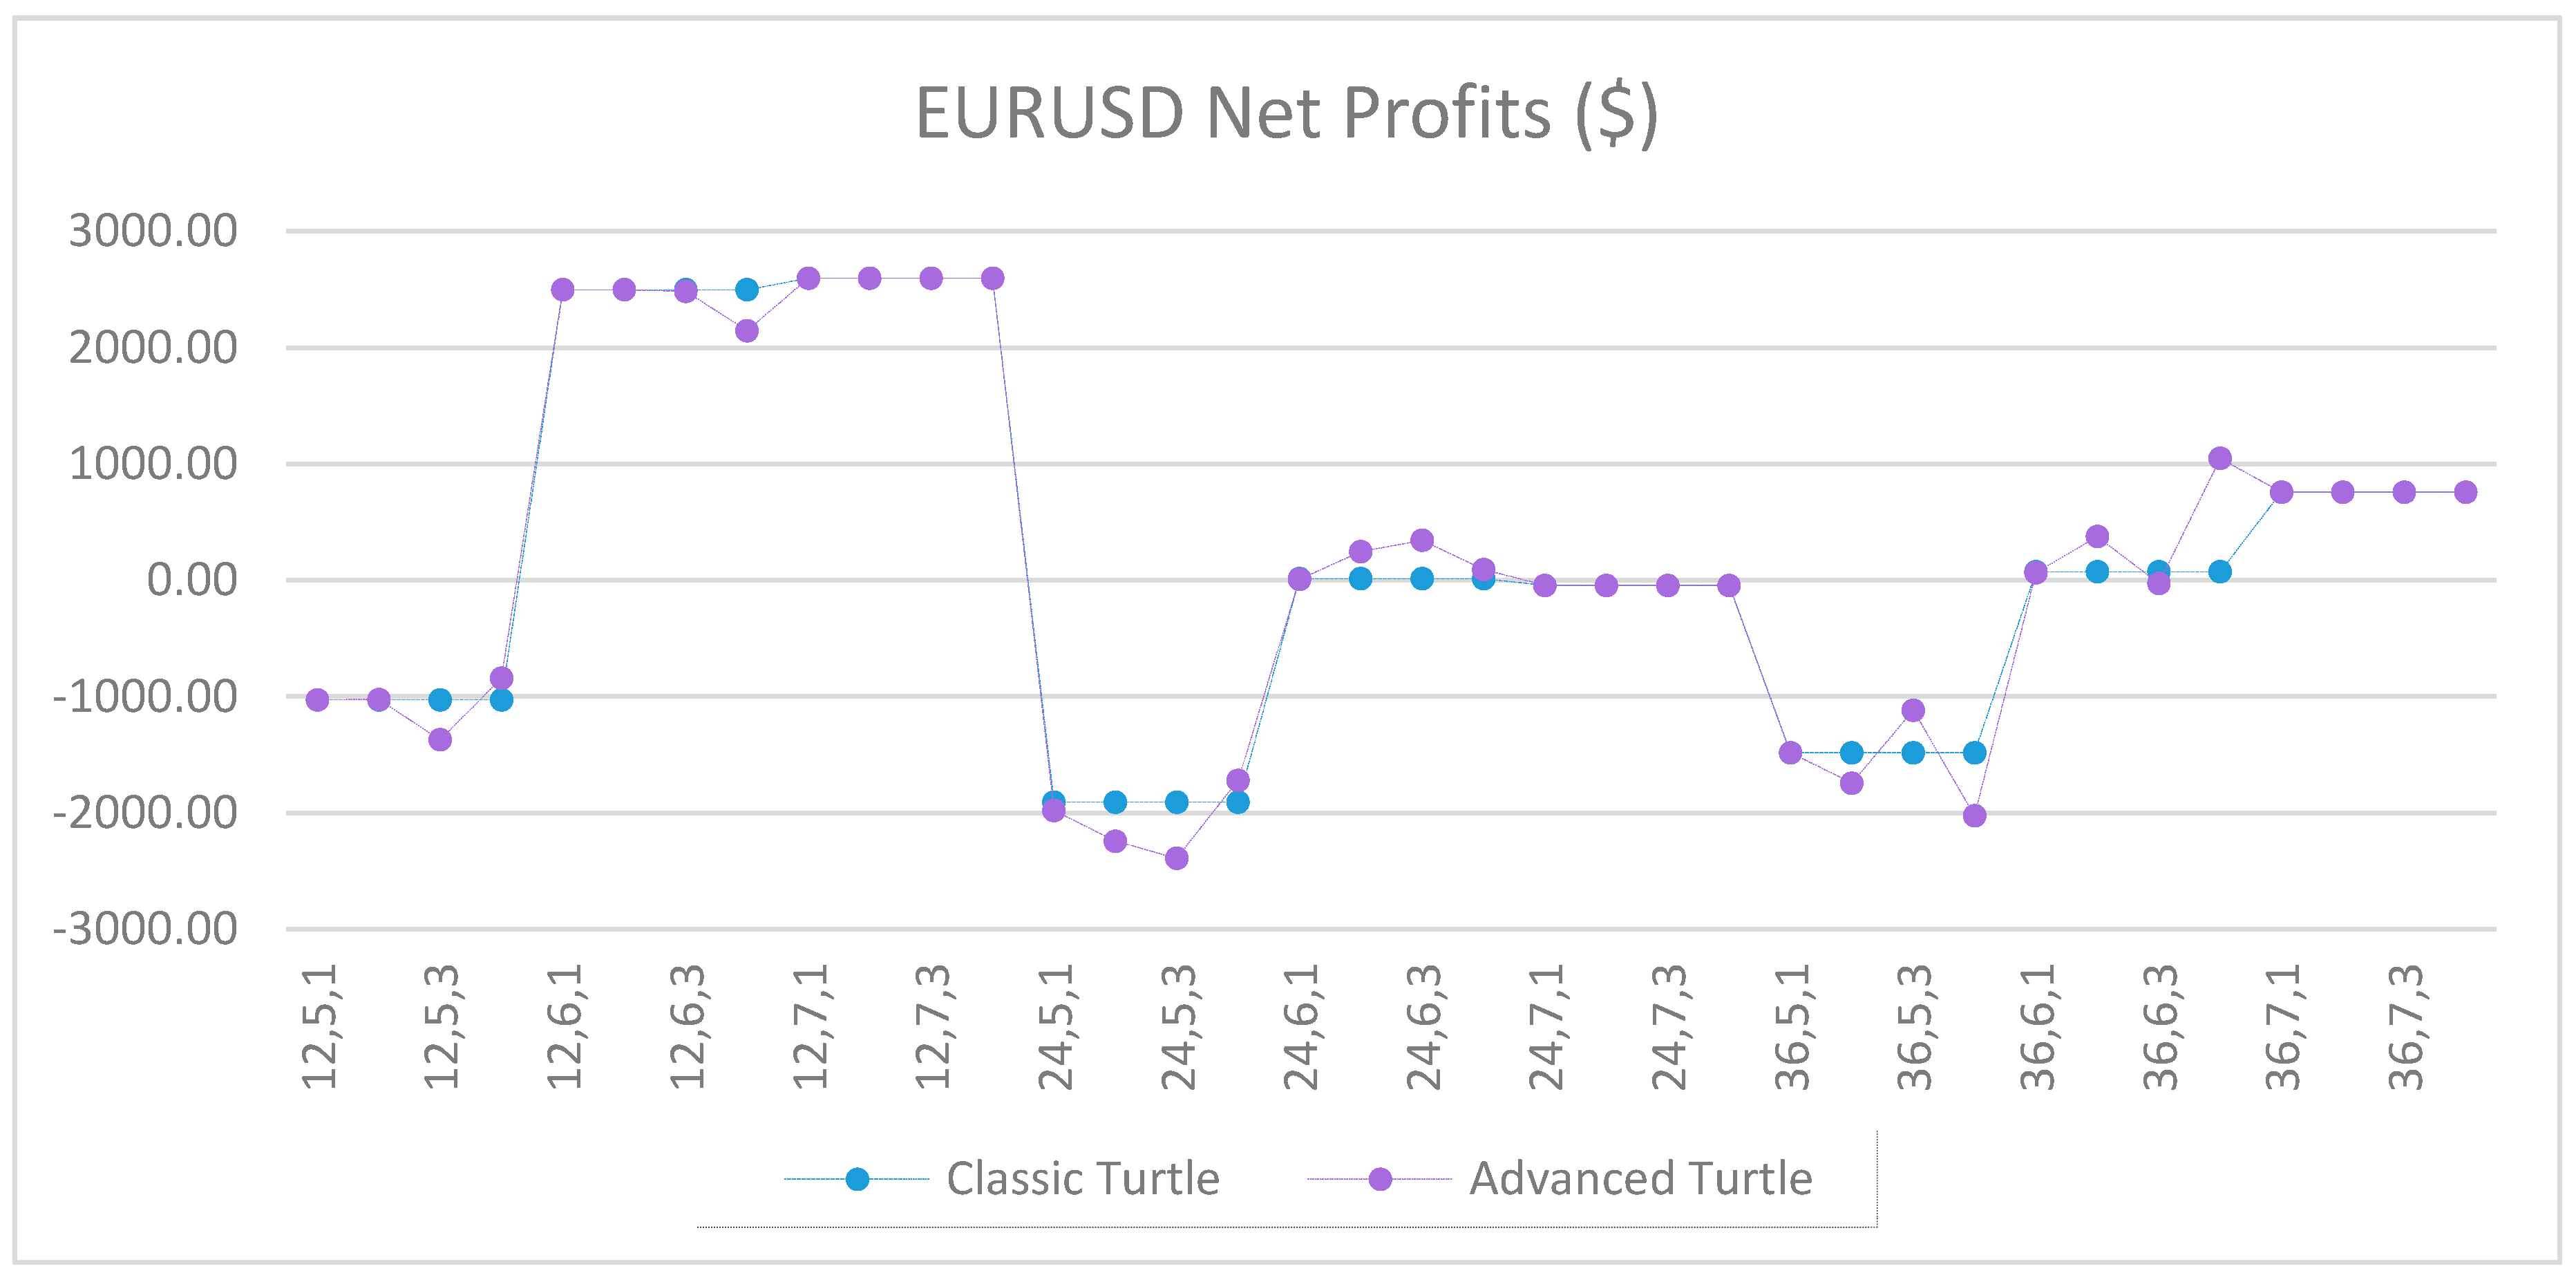
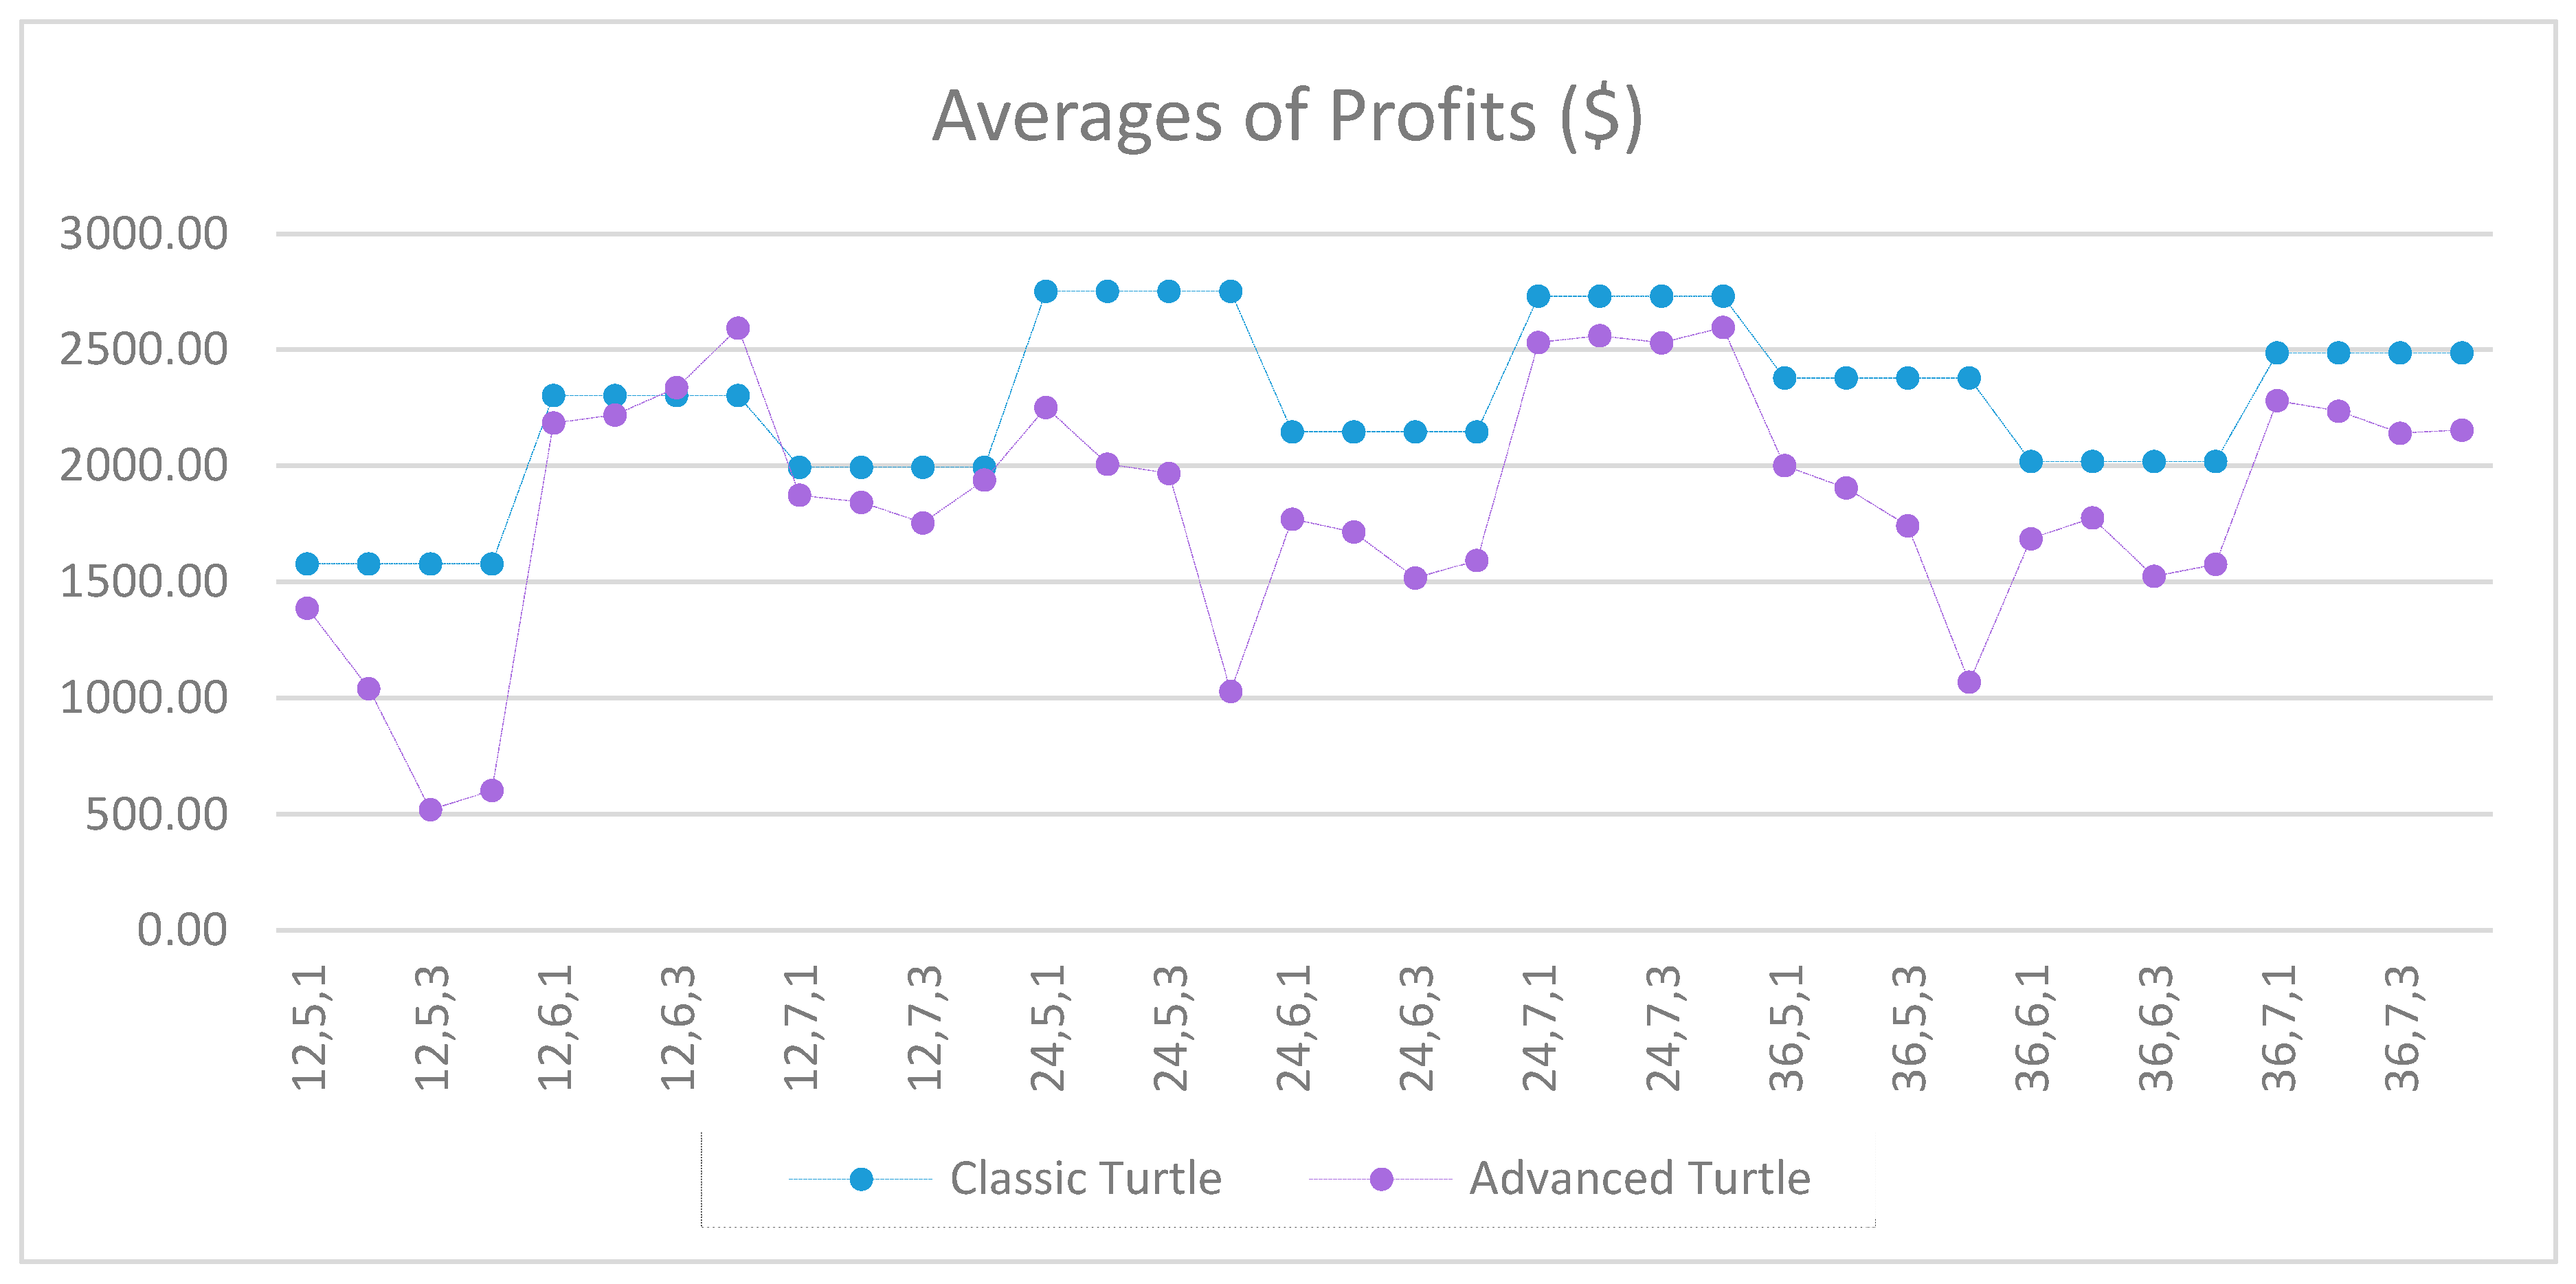
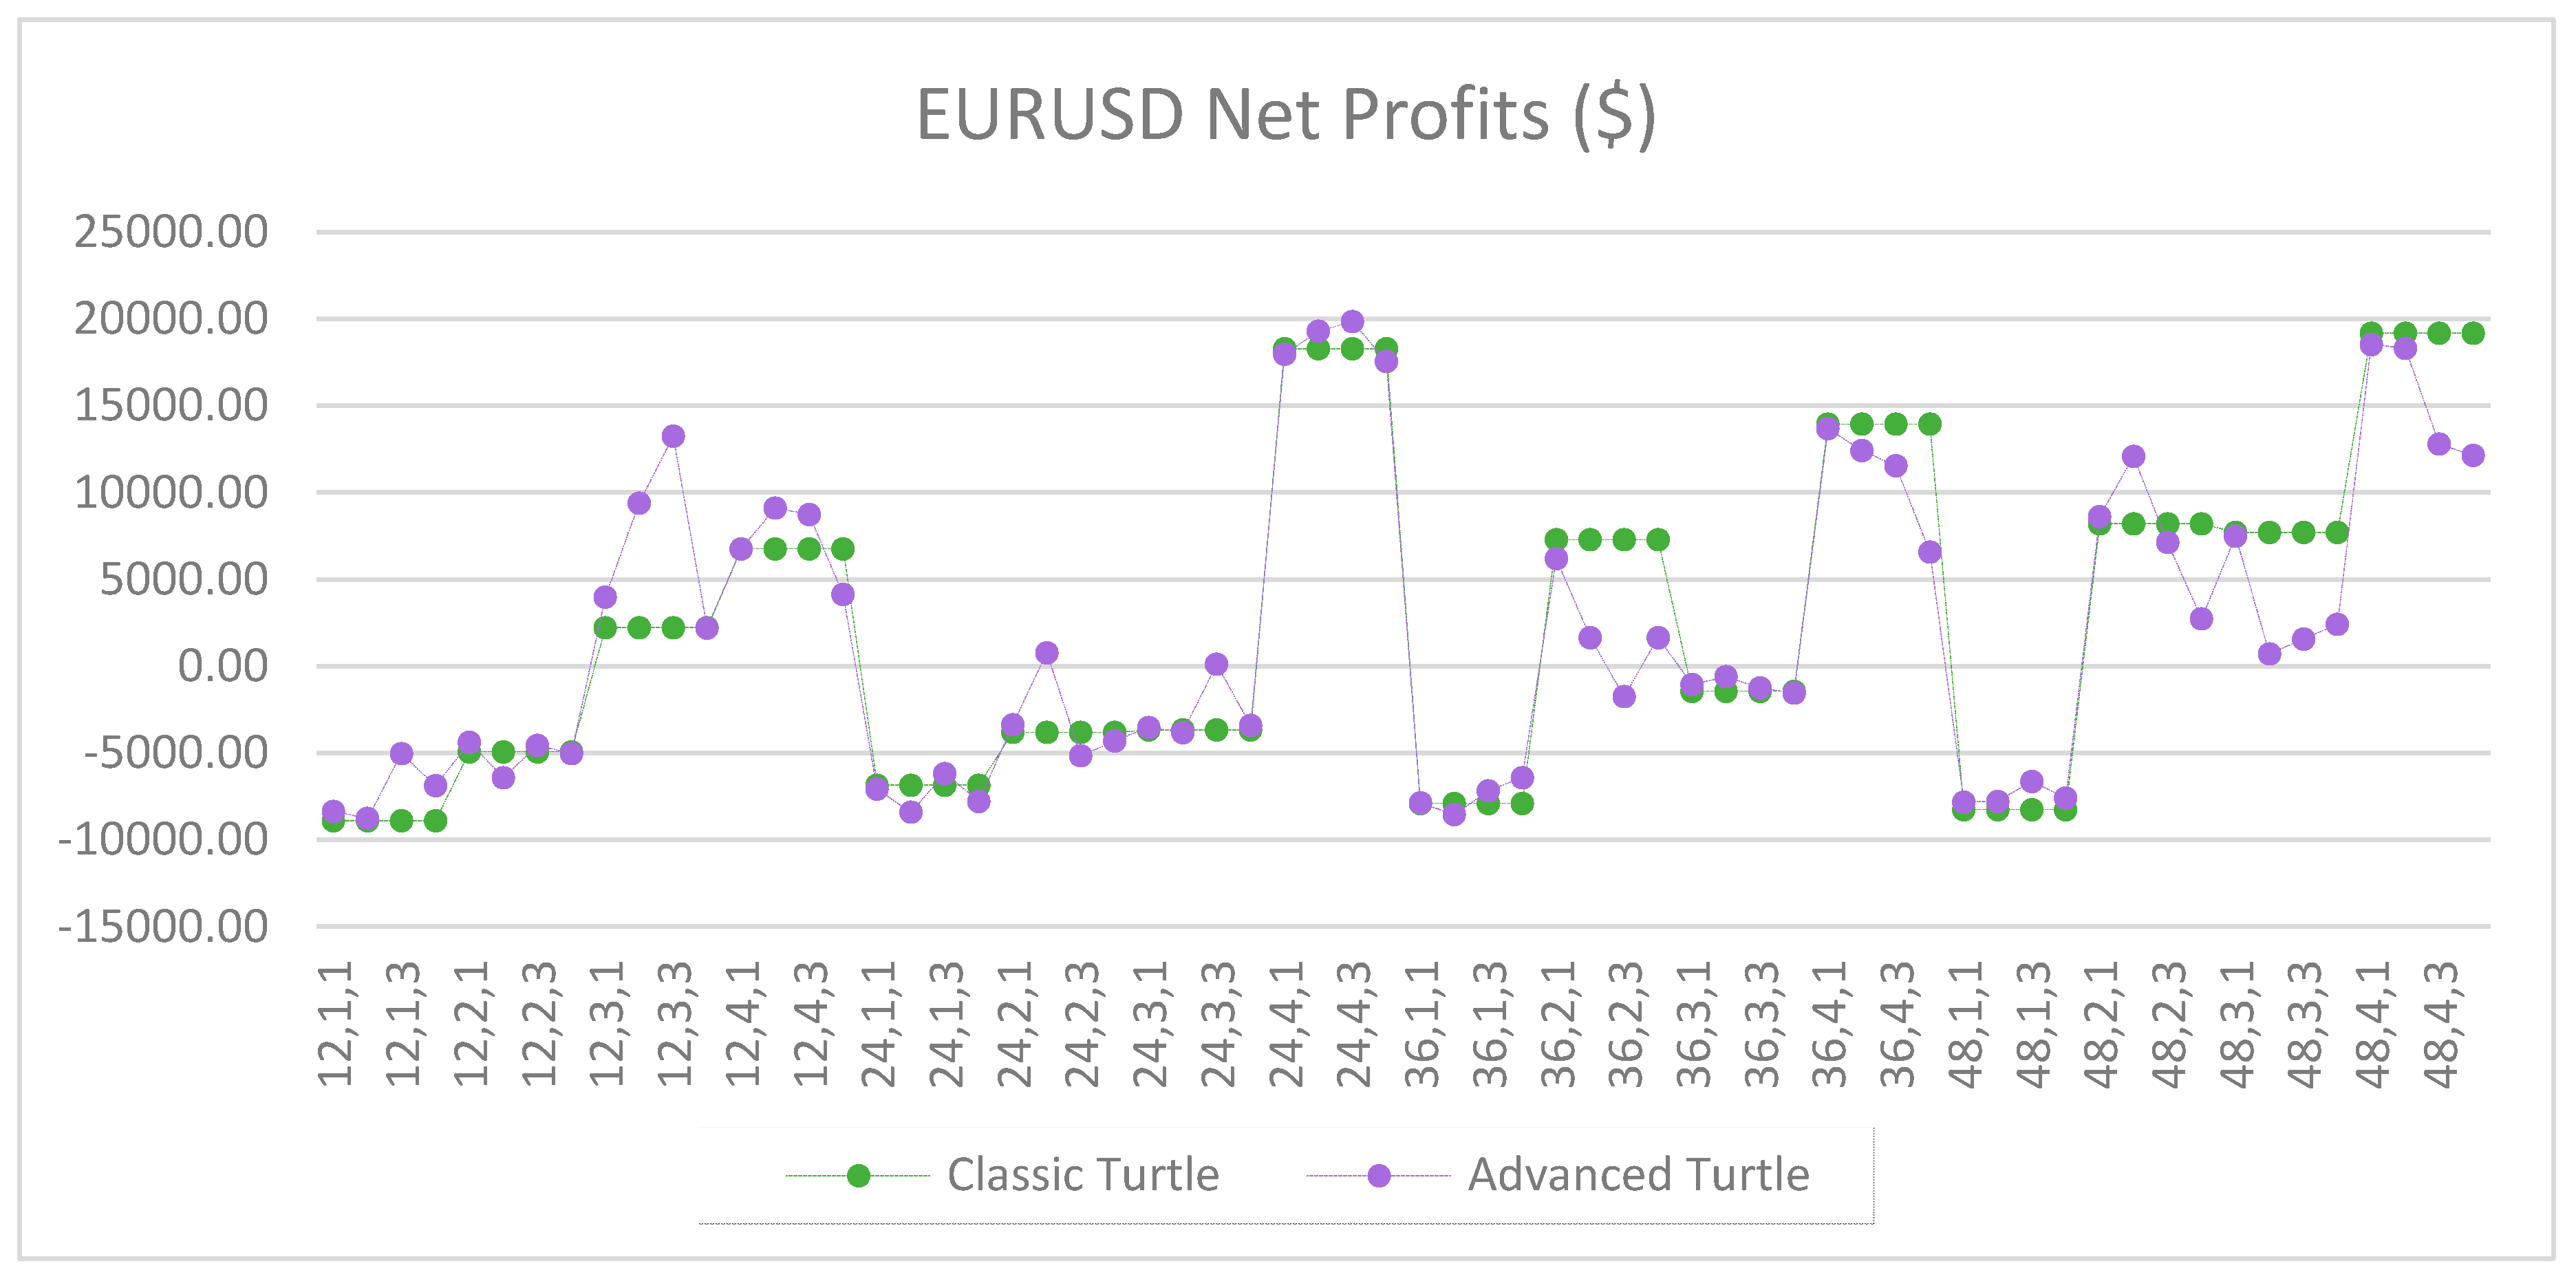
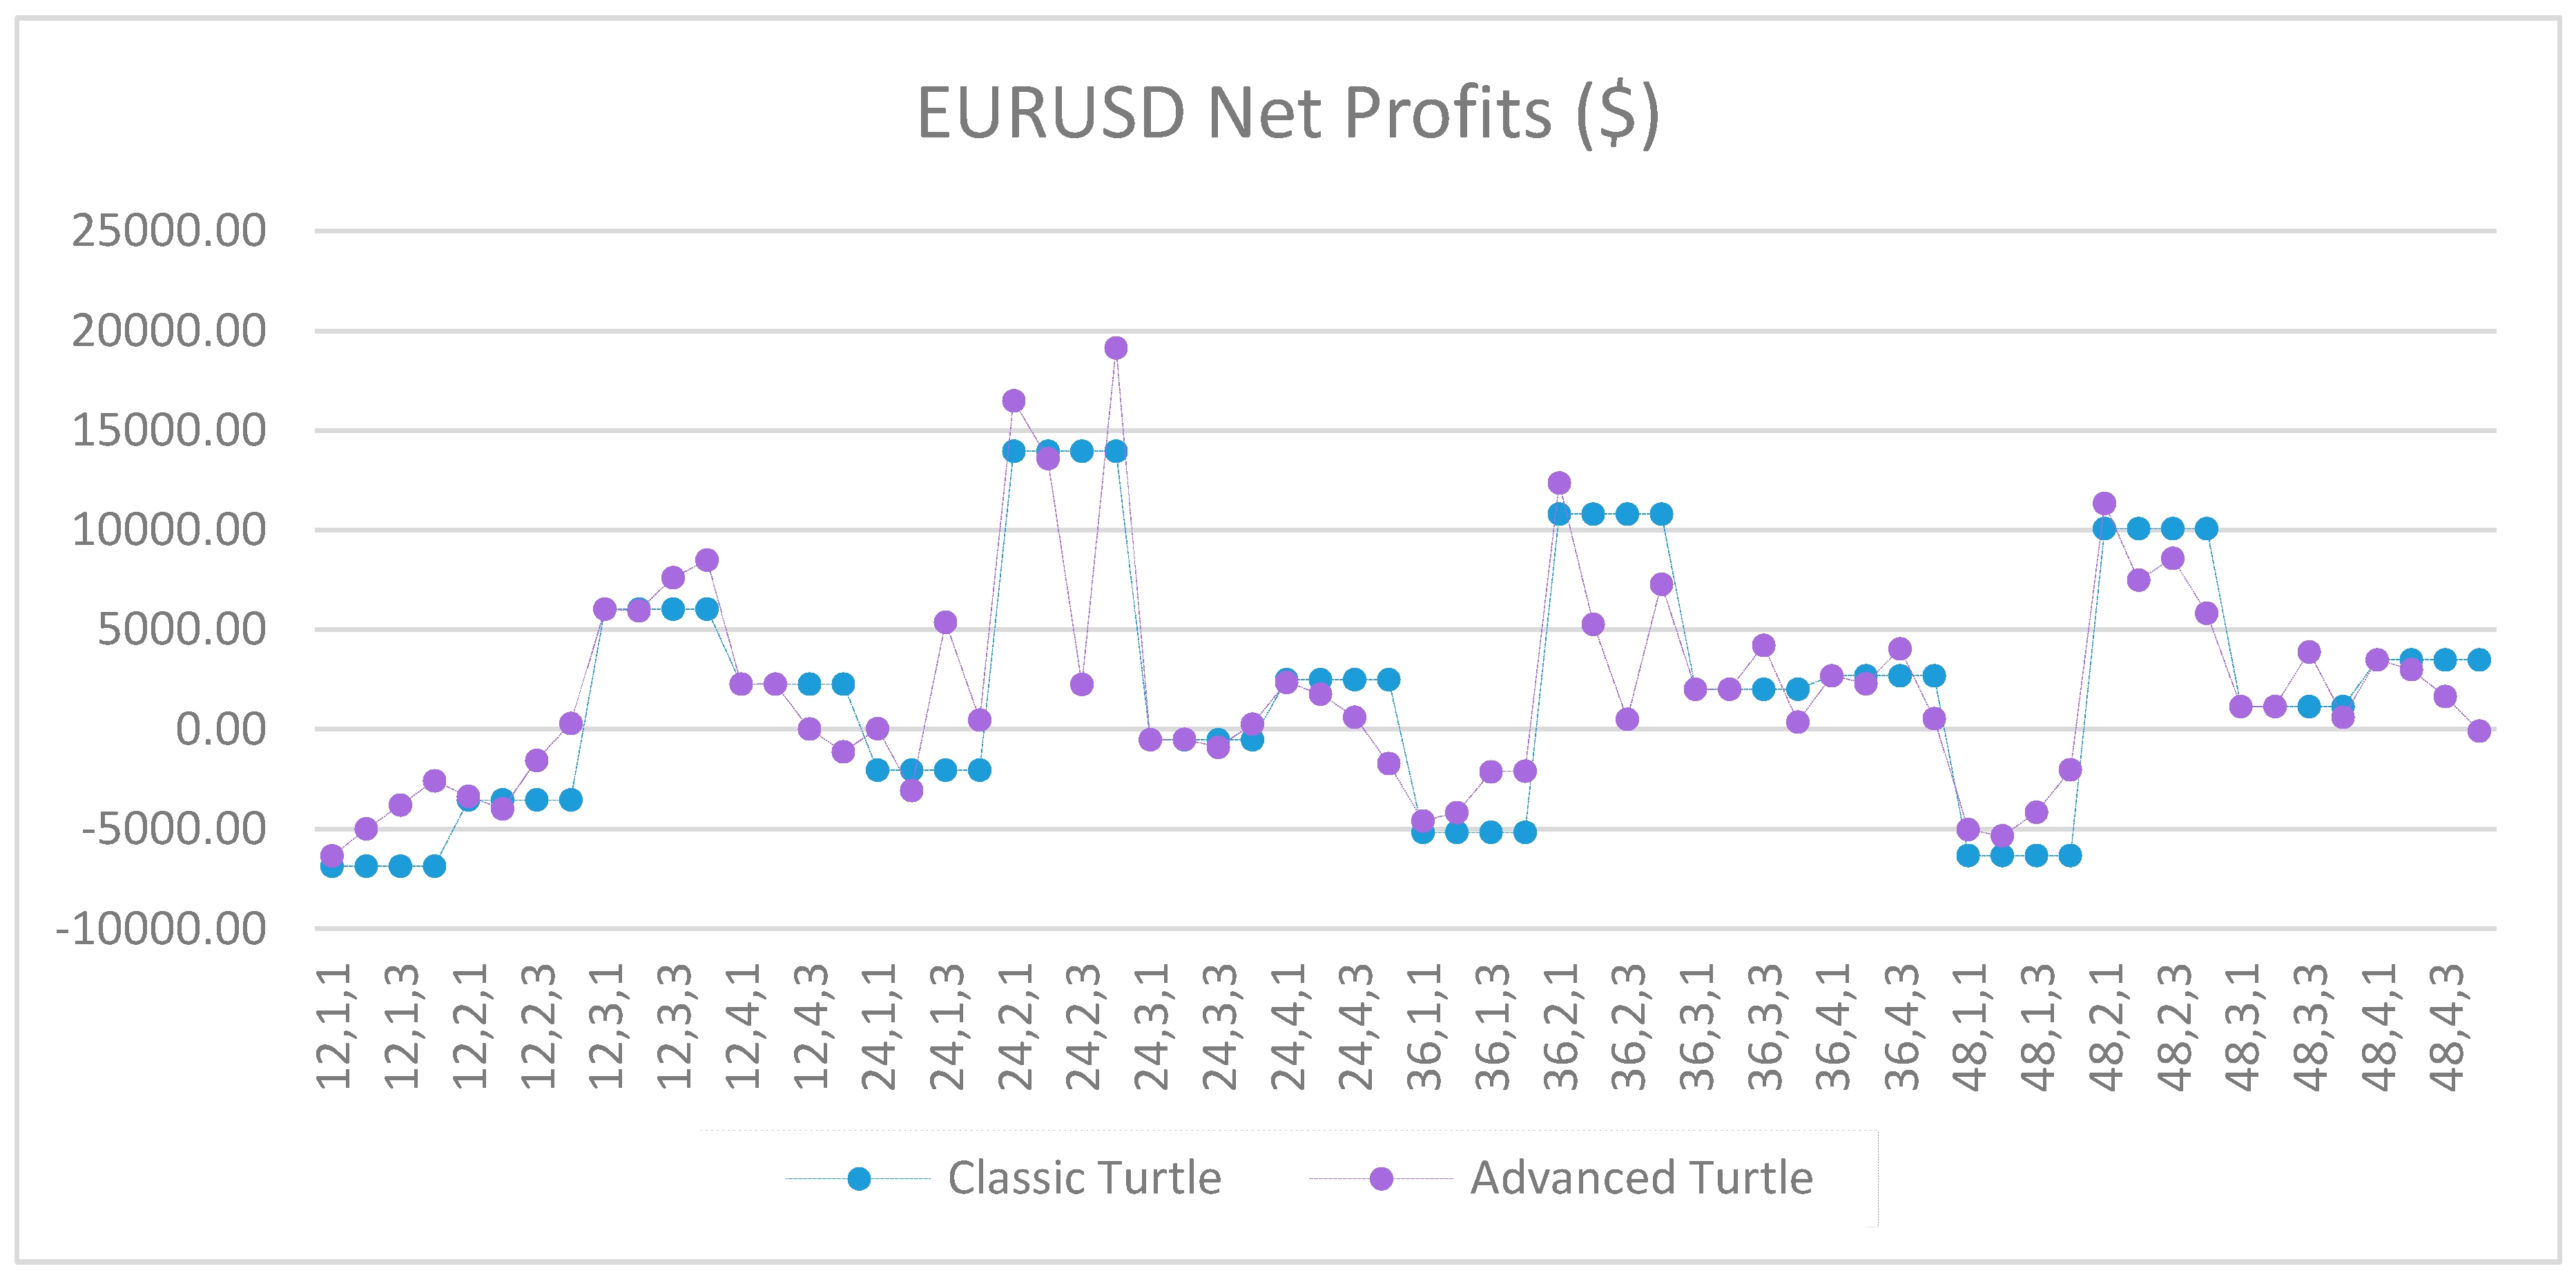
Figure A3.
Net profits of EURUSD between the classic and the advanced Turtle systems for every combination of N, X, Y for the fast parameters (20, 40).
Figure A3.
Net profits of EURUSD between the classic and the advanced Turtle systems for every combination of N, X, Y for the fast parameters (20, 40).
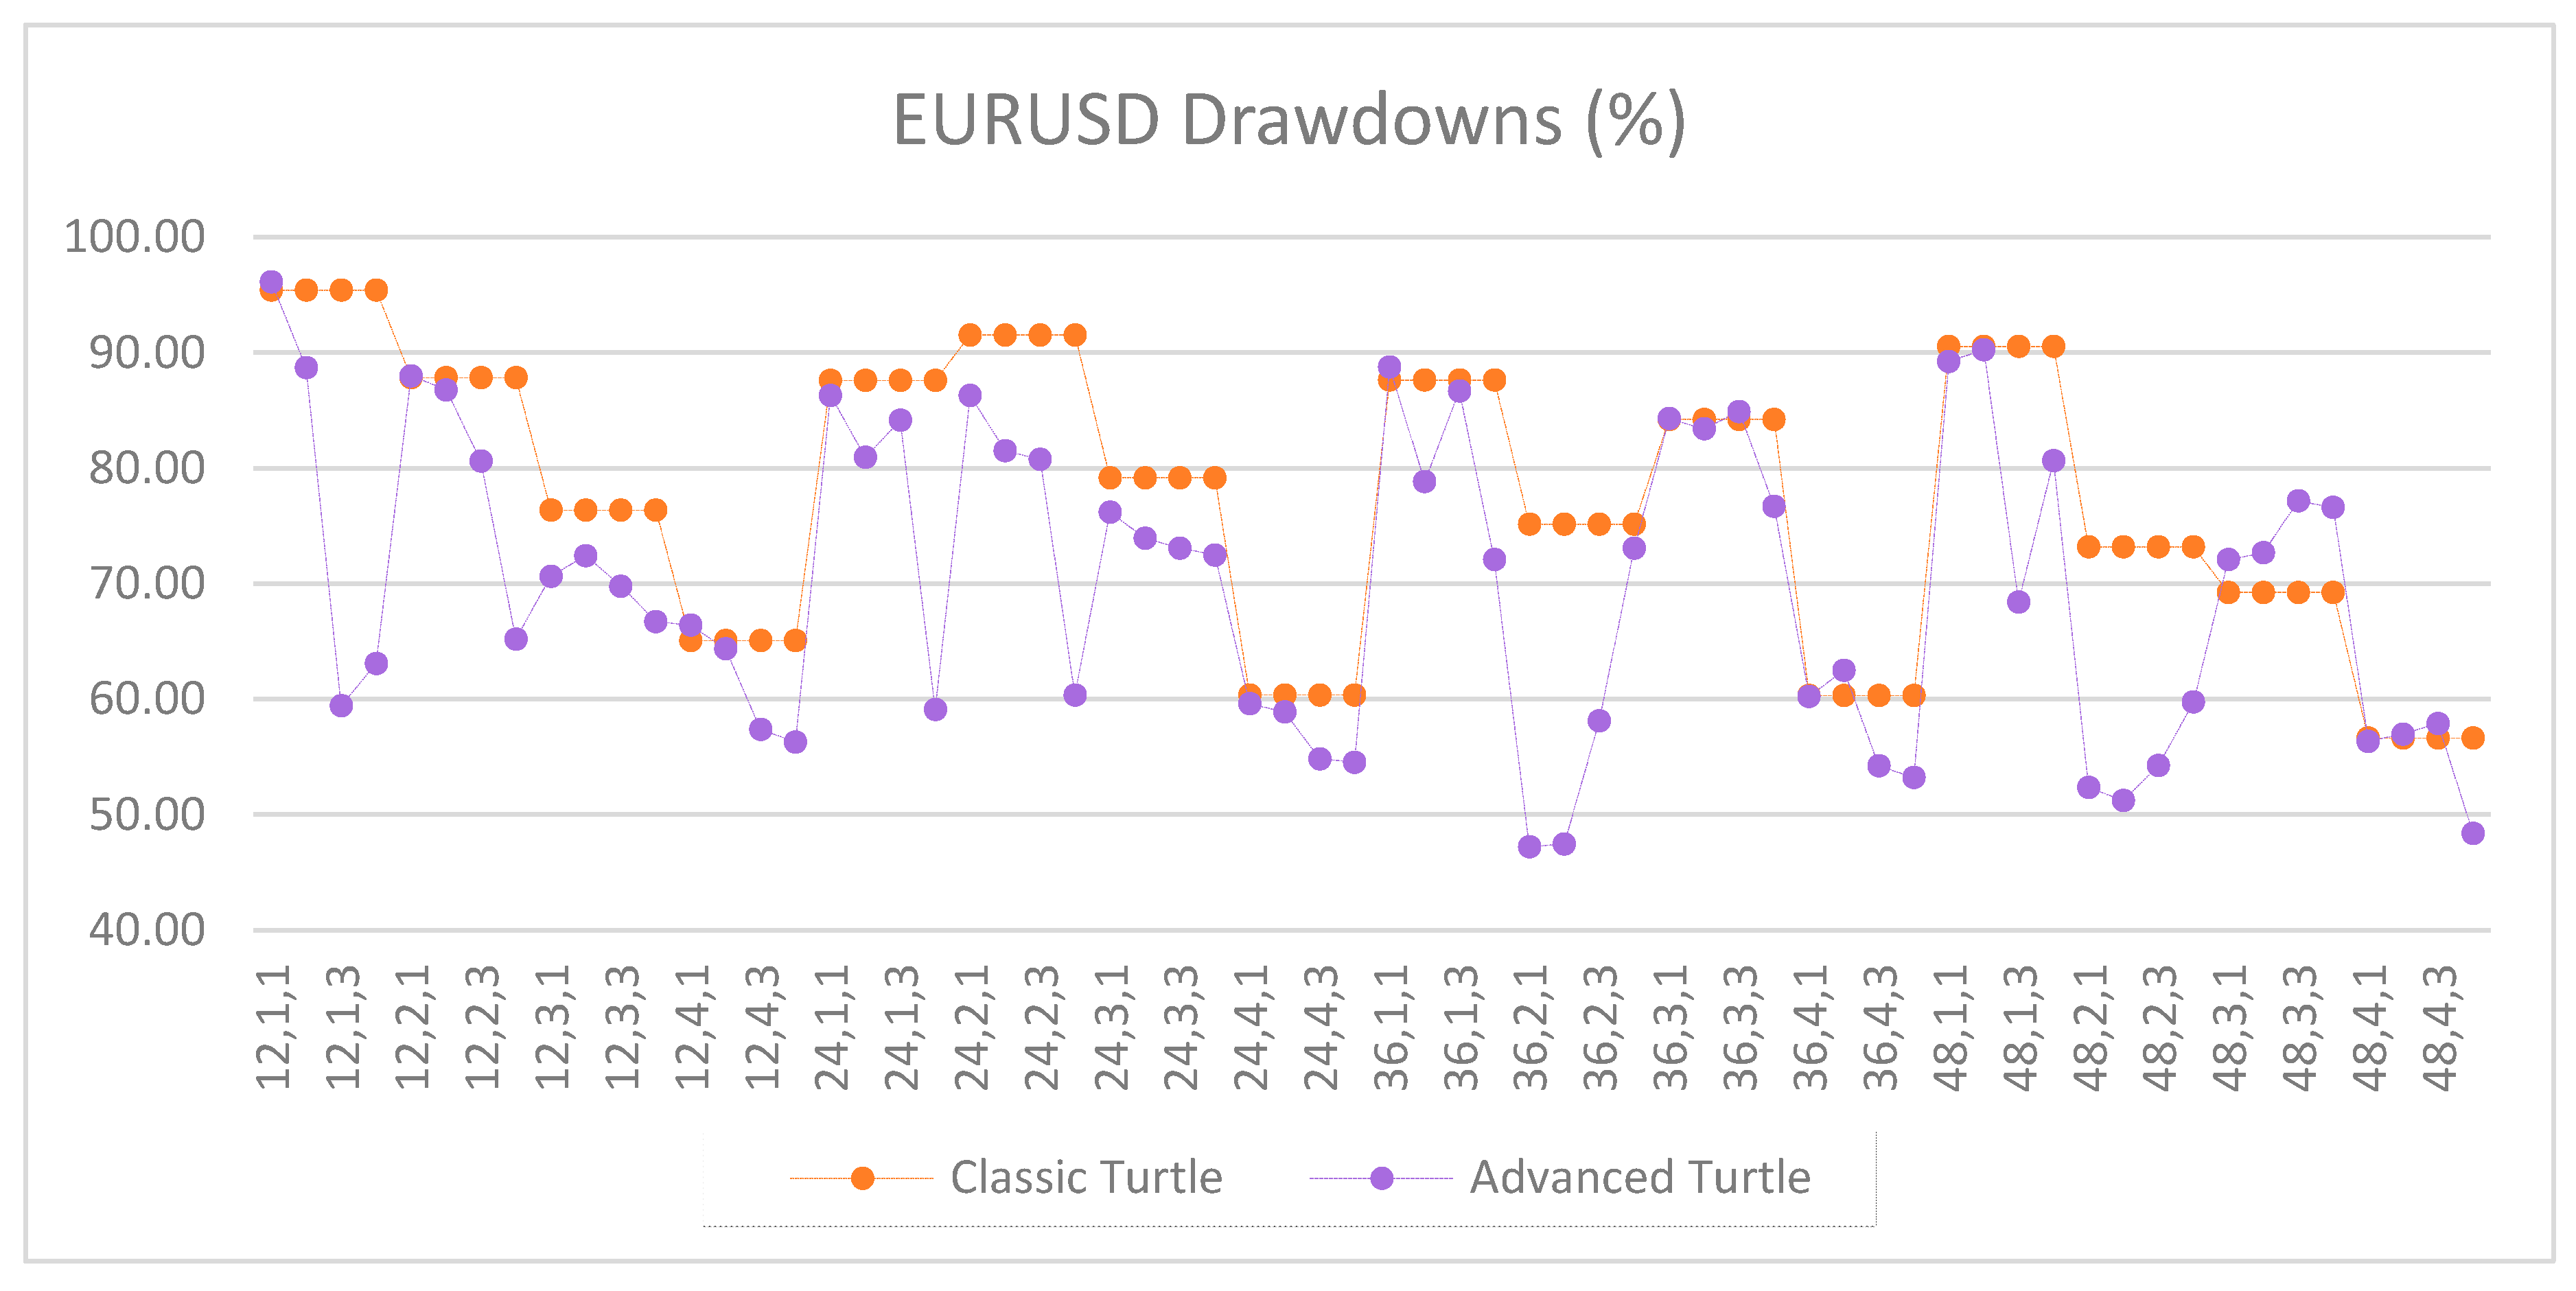
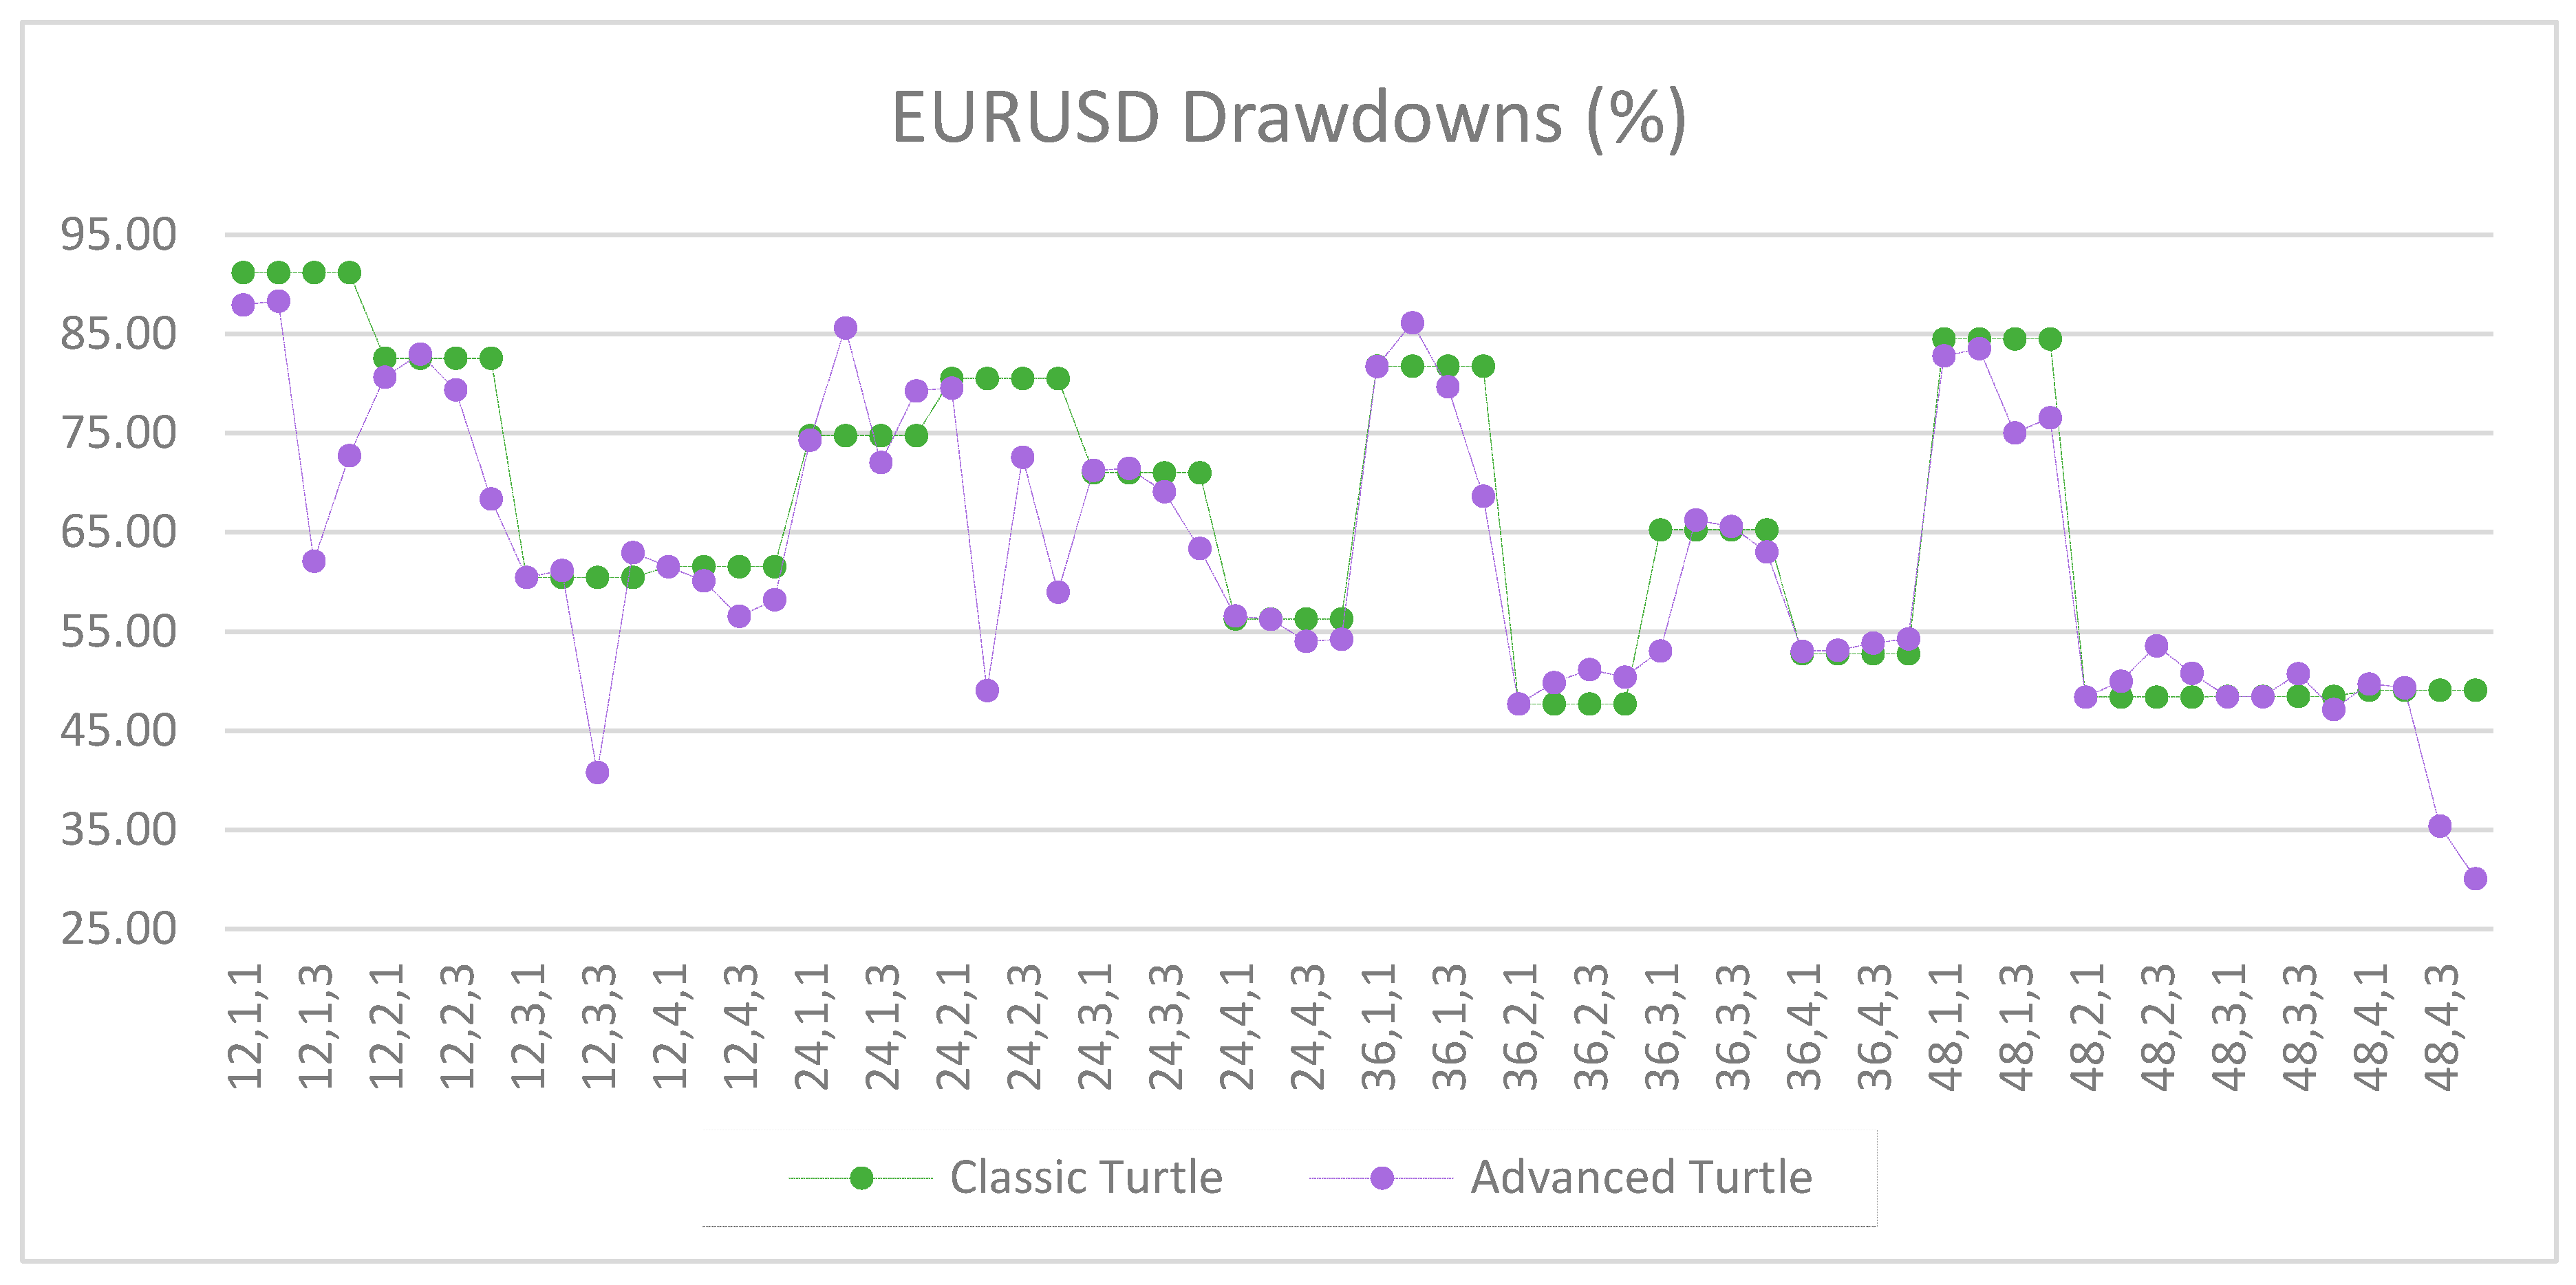
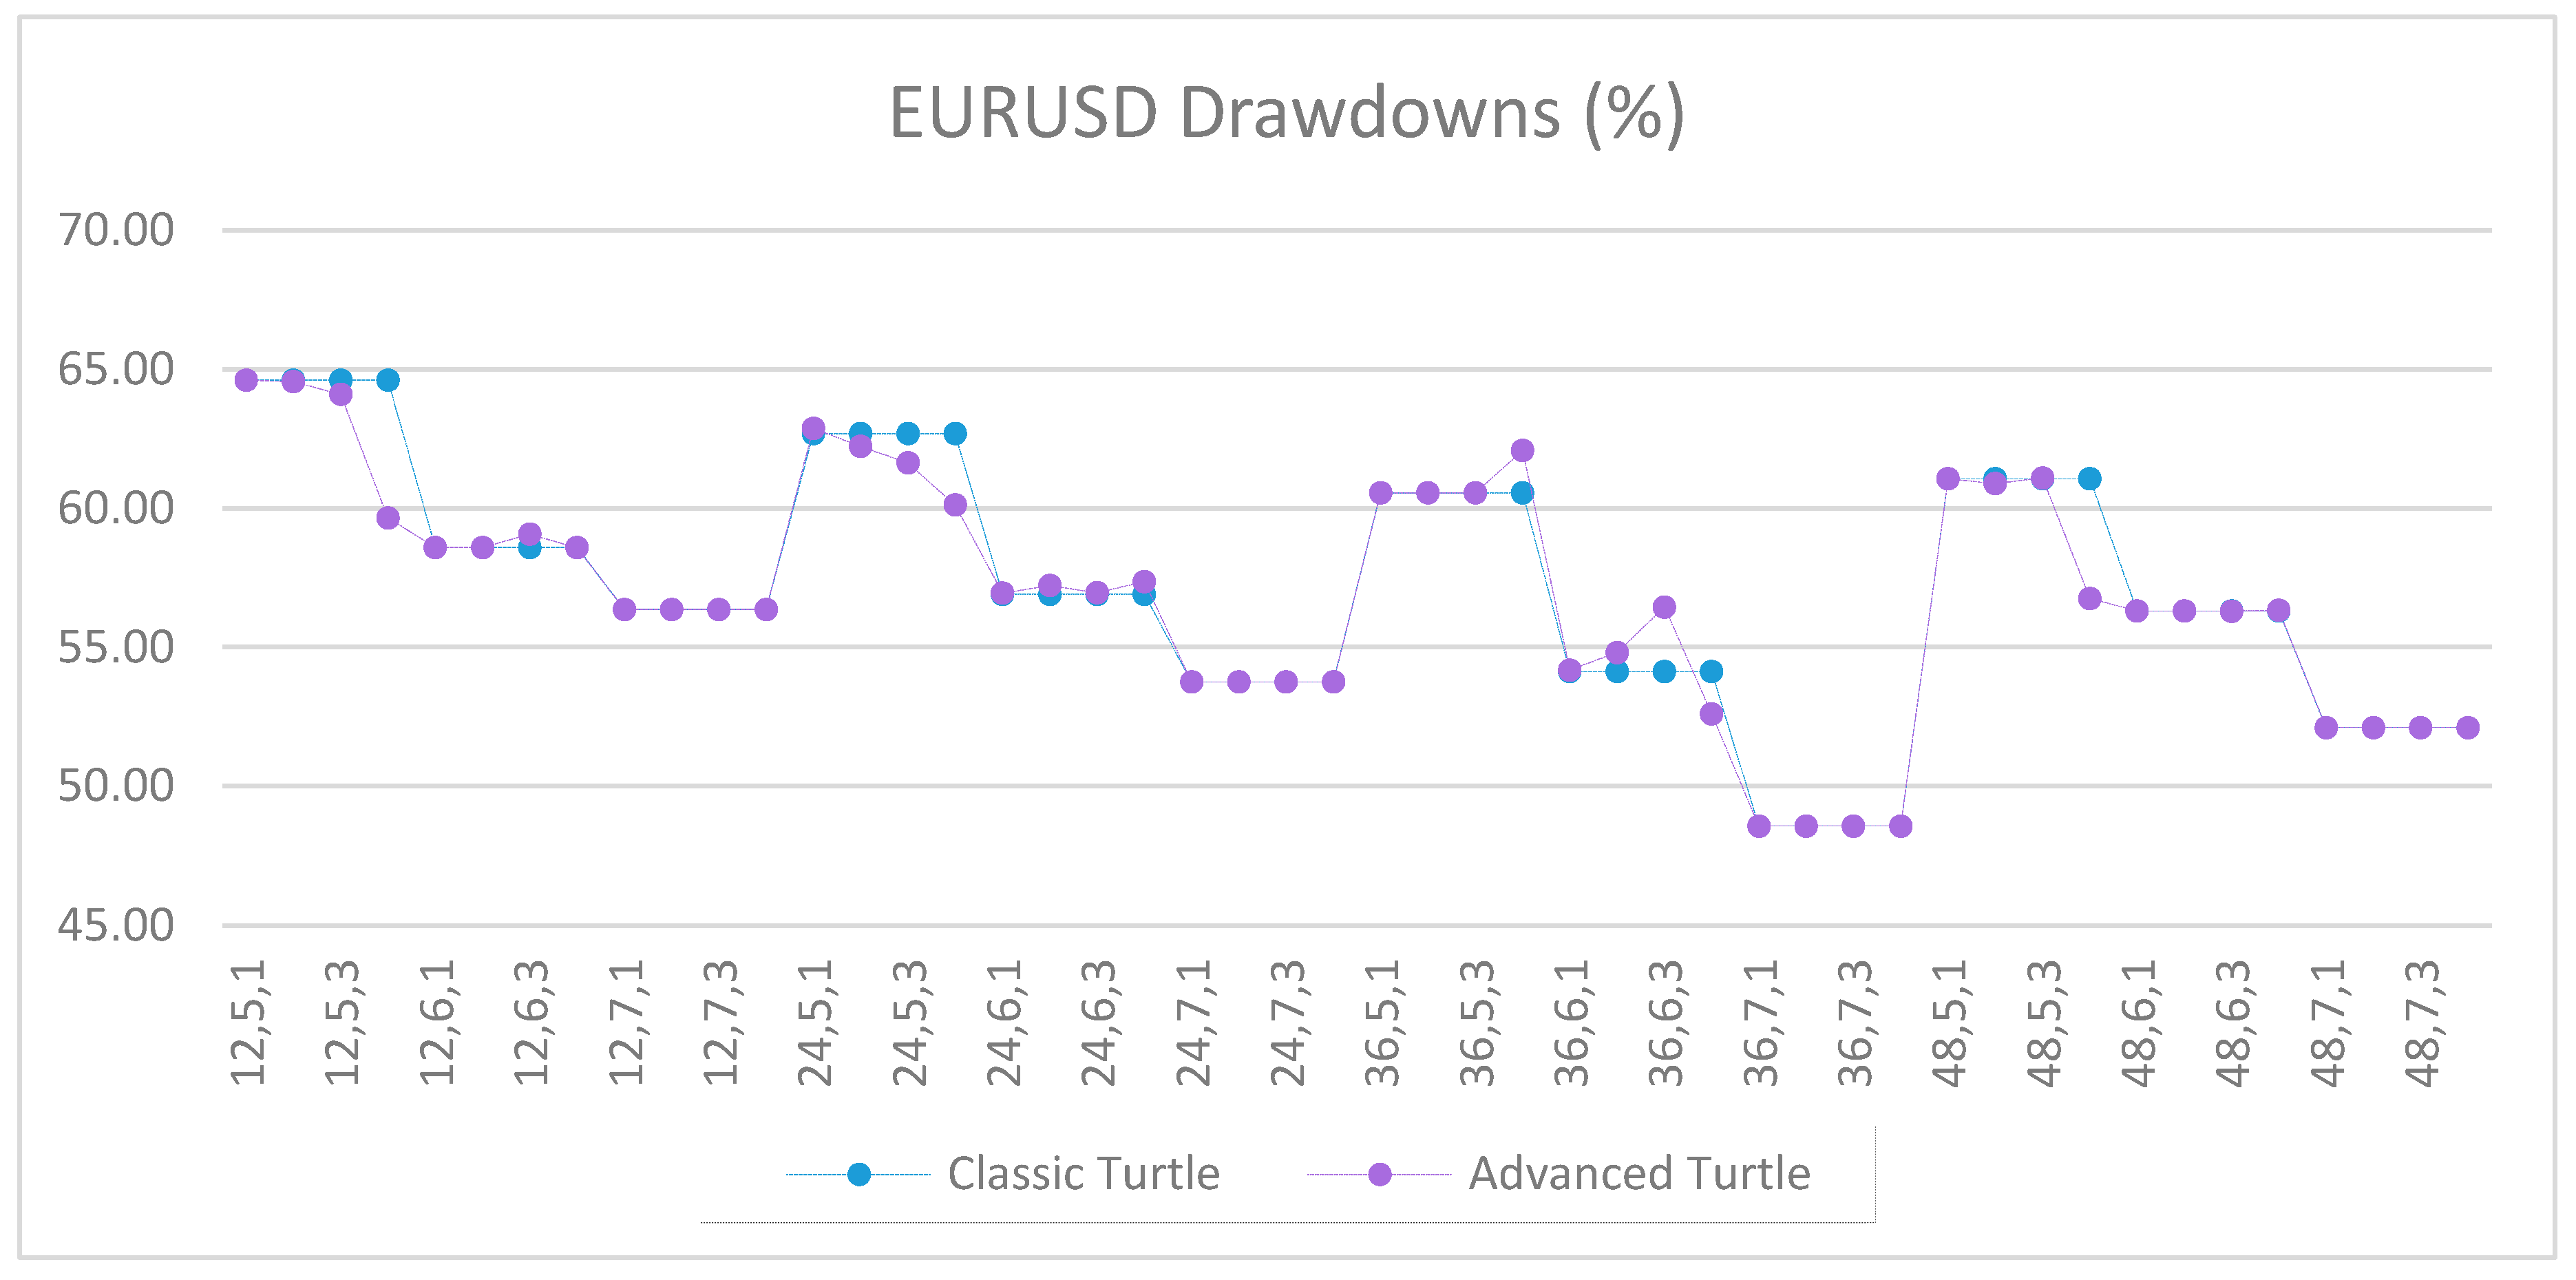
Figure A4.
Drawdowns of EURUSD as percentage of equity between the classic and the advanced Turtle systems for every combination of N, X, Y for the fast parameters (20, 40).
Figure A4.
Drawdowns of EURUSD as percentage of equity between the classic and the advanced Turtle systems for every combination of N, X, Y for the fast parameters (20, 40).
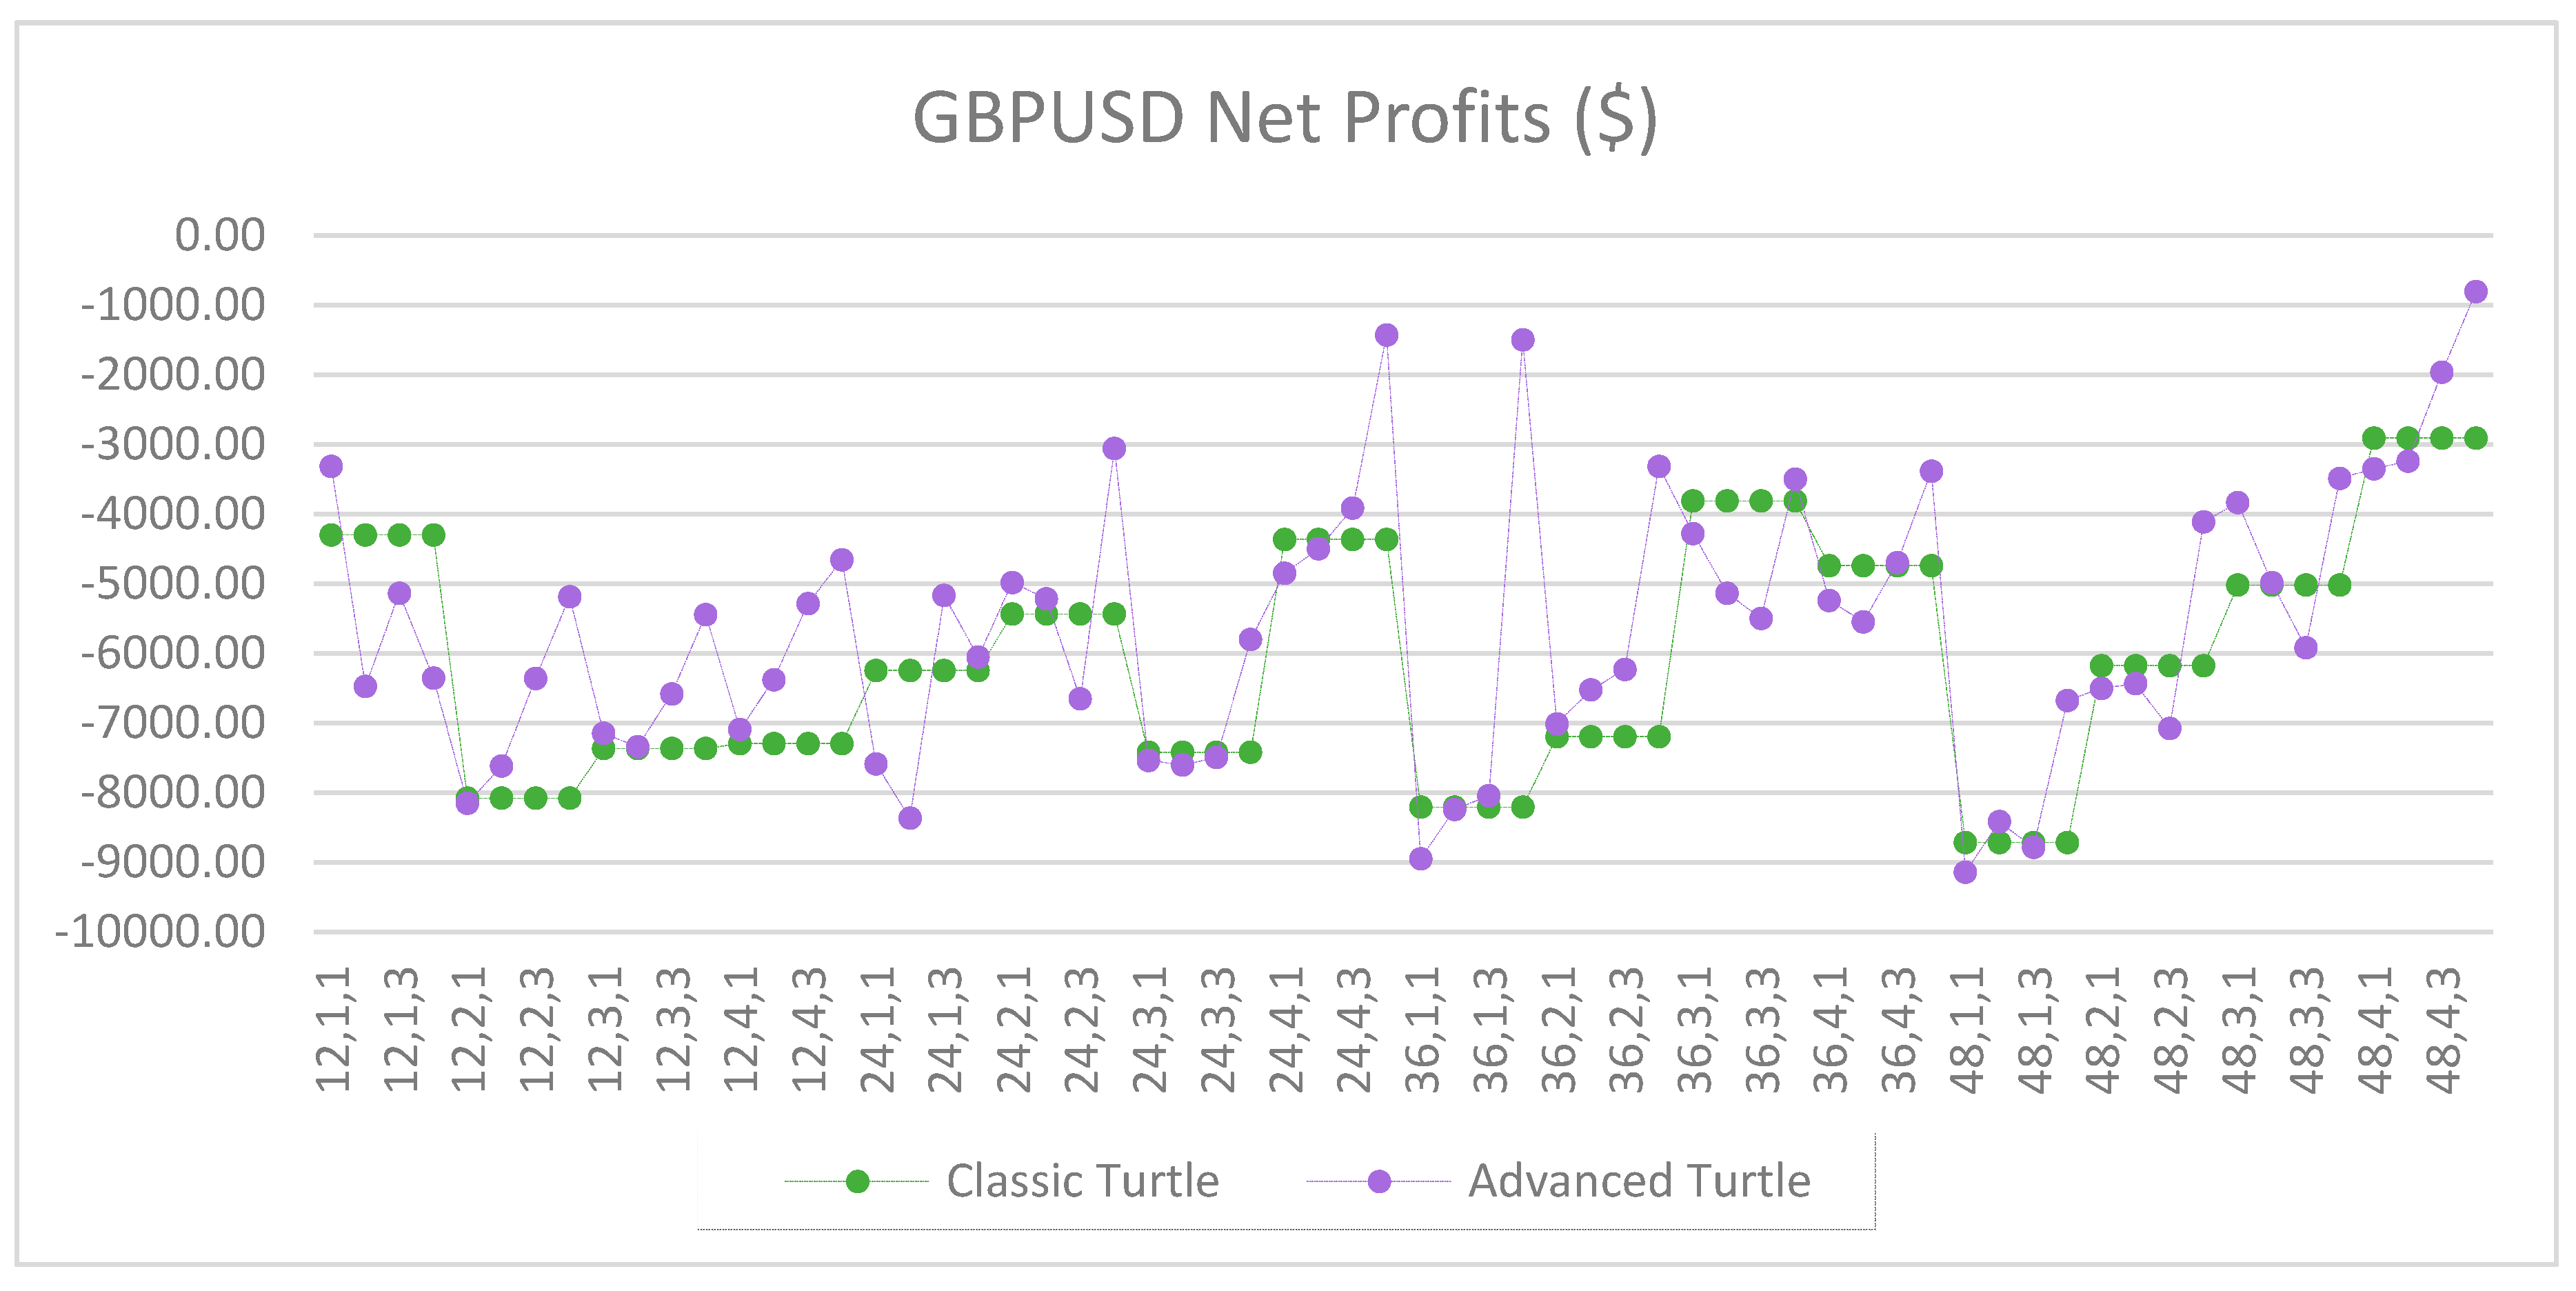
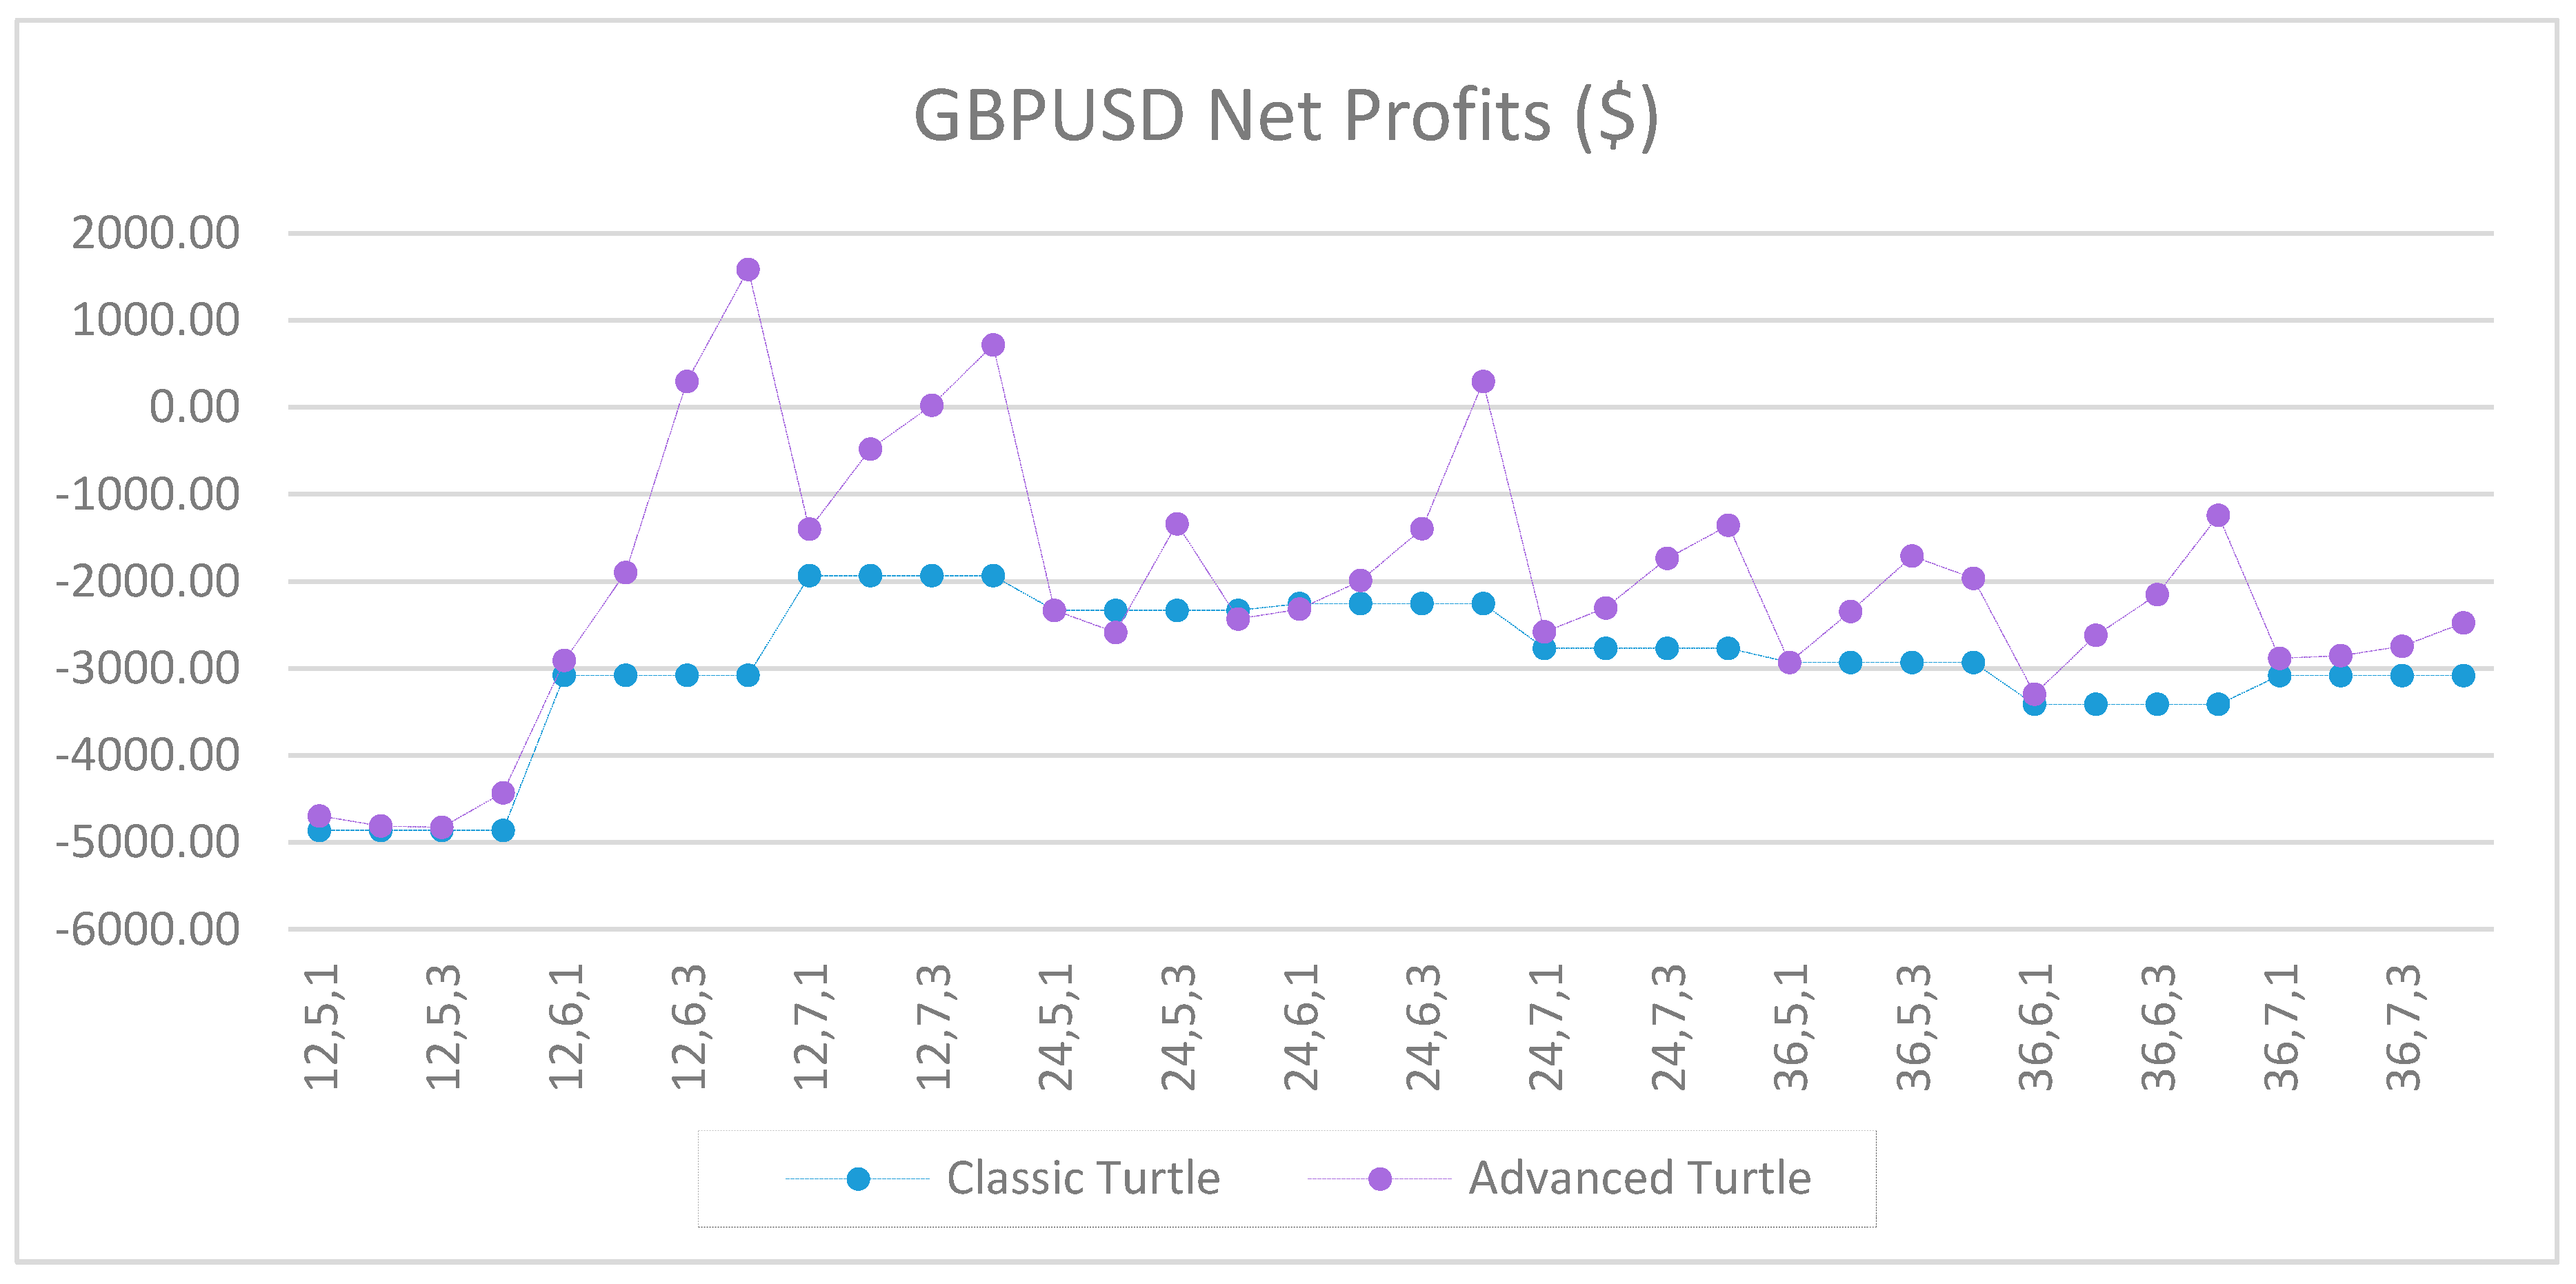
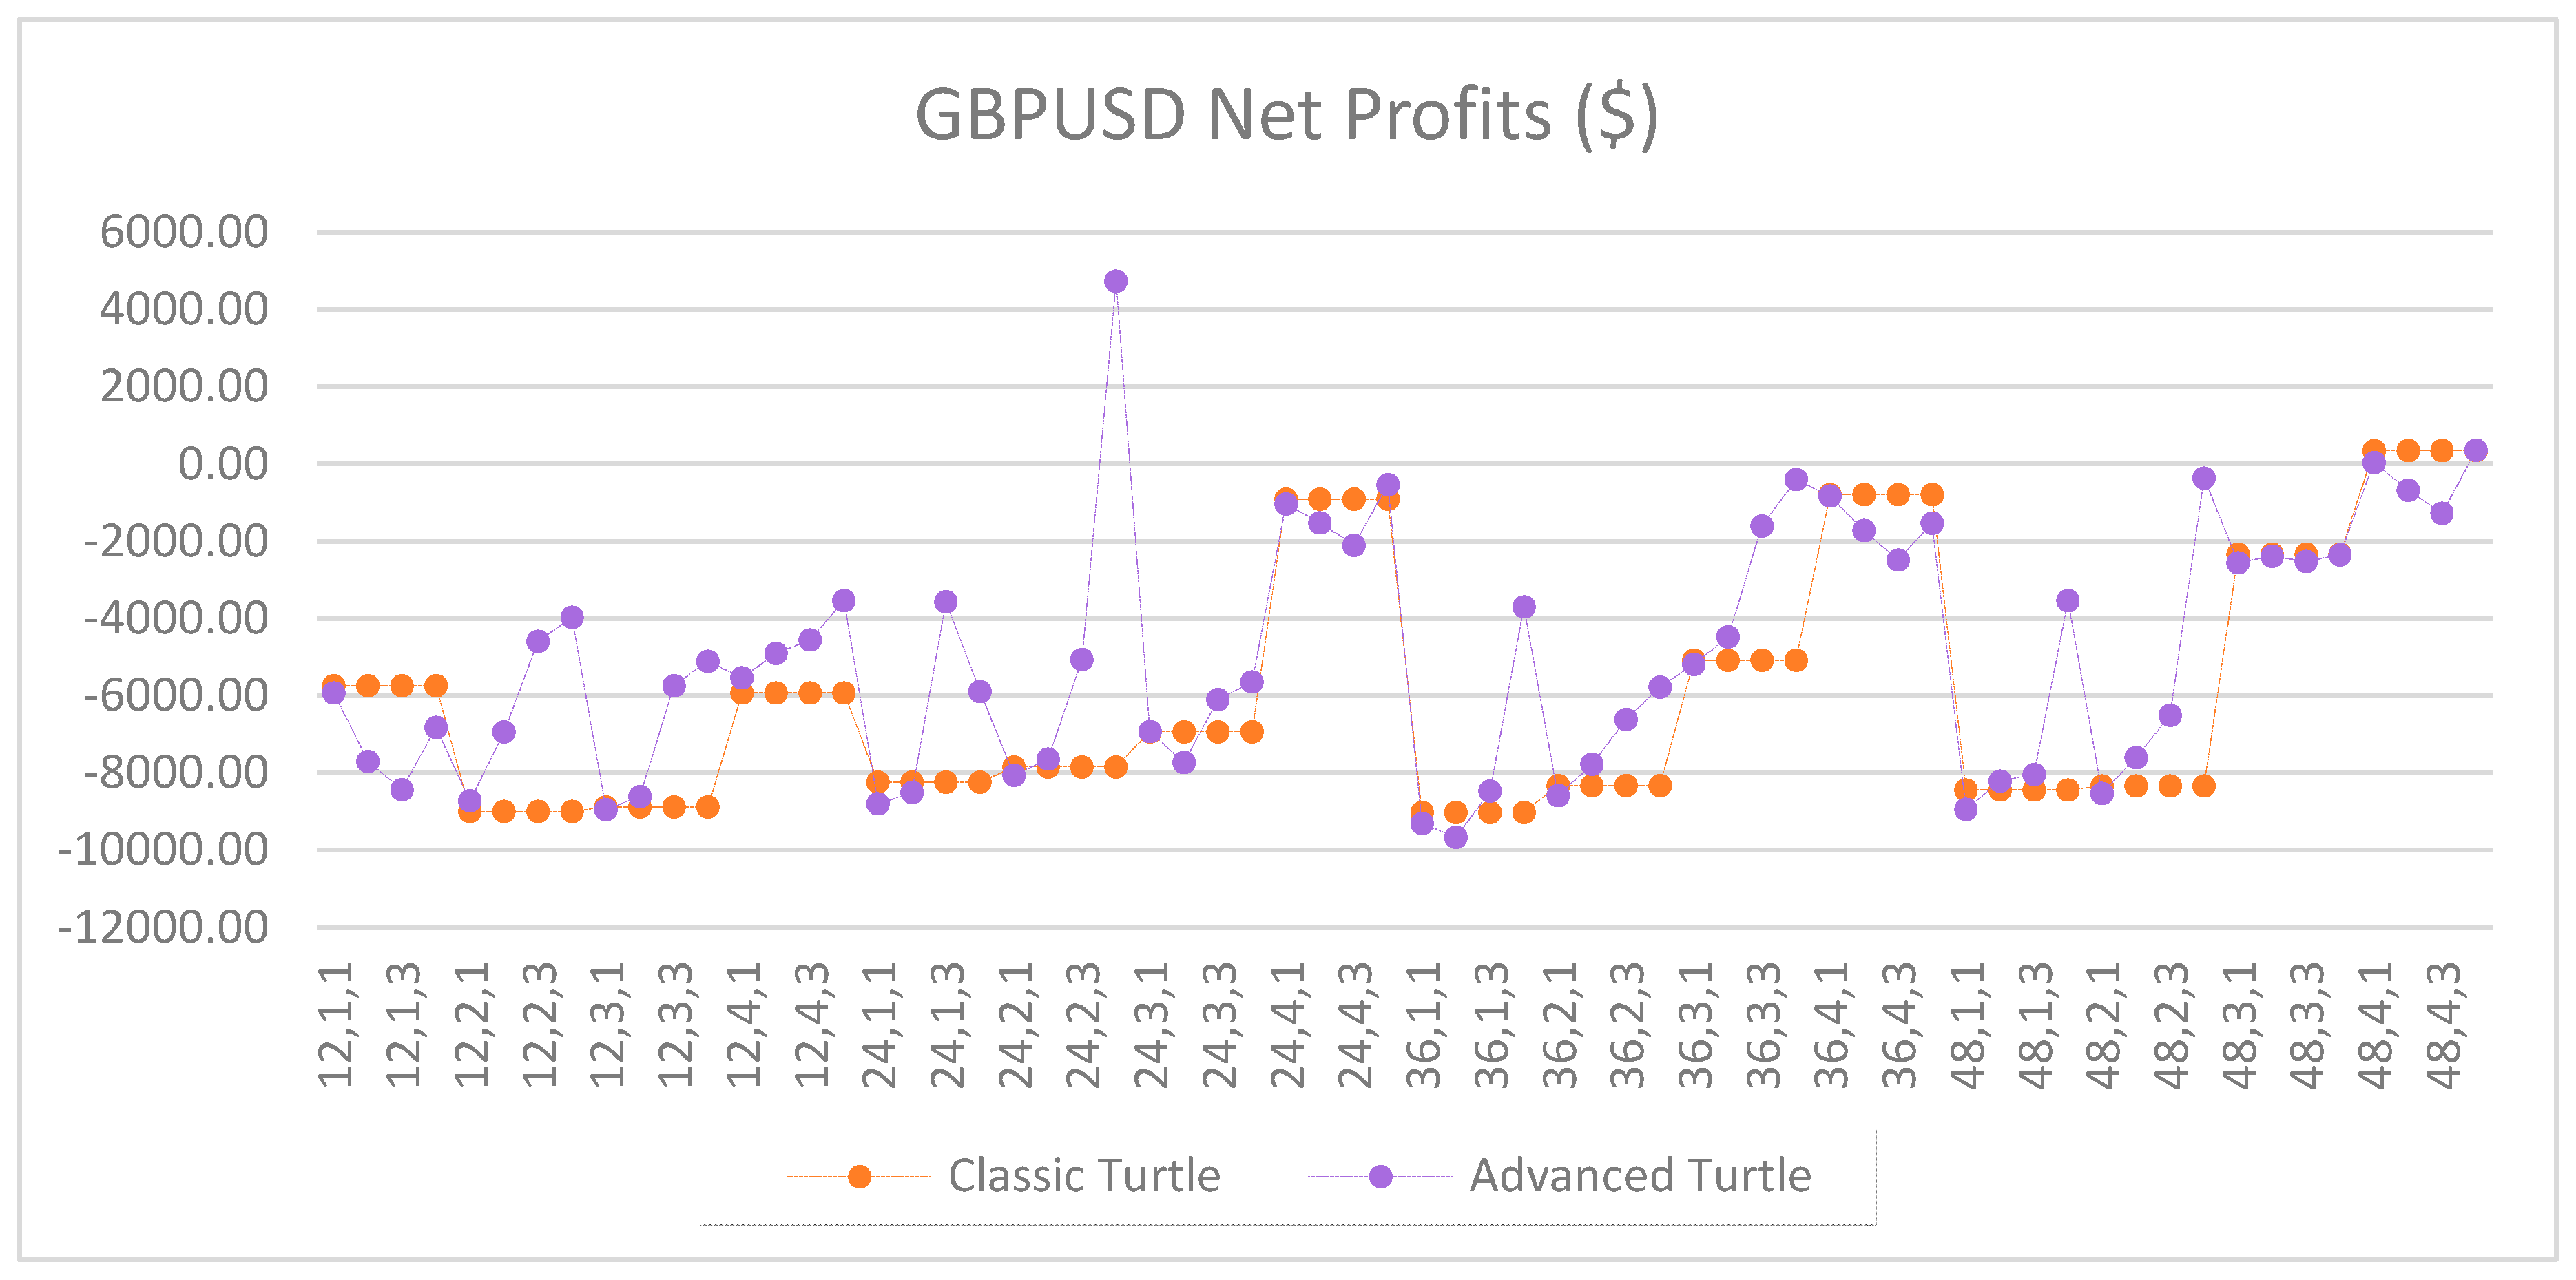
Figure A5.
Net profits of GBPUSD between the classic and the advanced Turtle systems for every combination of N, X, Y for the fast parameters (20, 40).
Figure A5.
Net profits of GBPUSD between the classic and the advanced Turtle systems for every combination of N, X, Y for the fast parameters (20, 40).
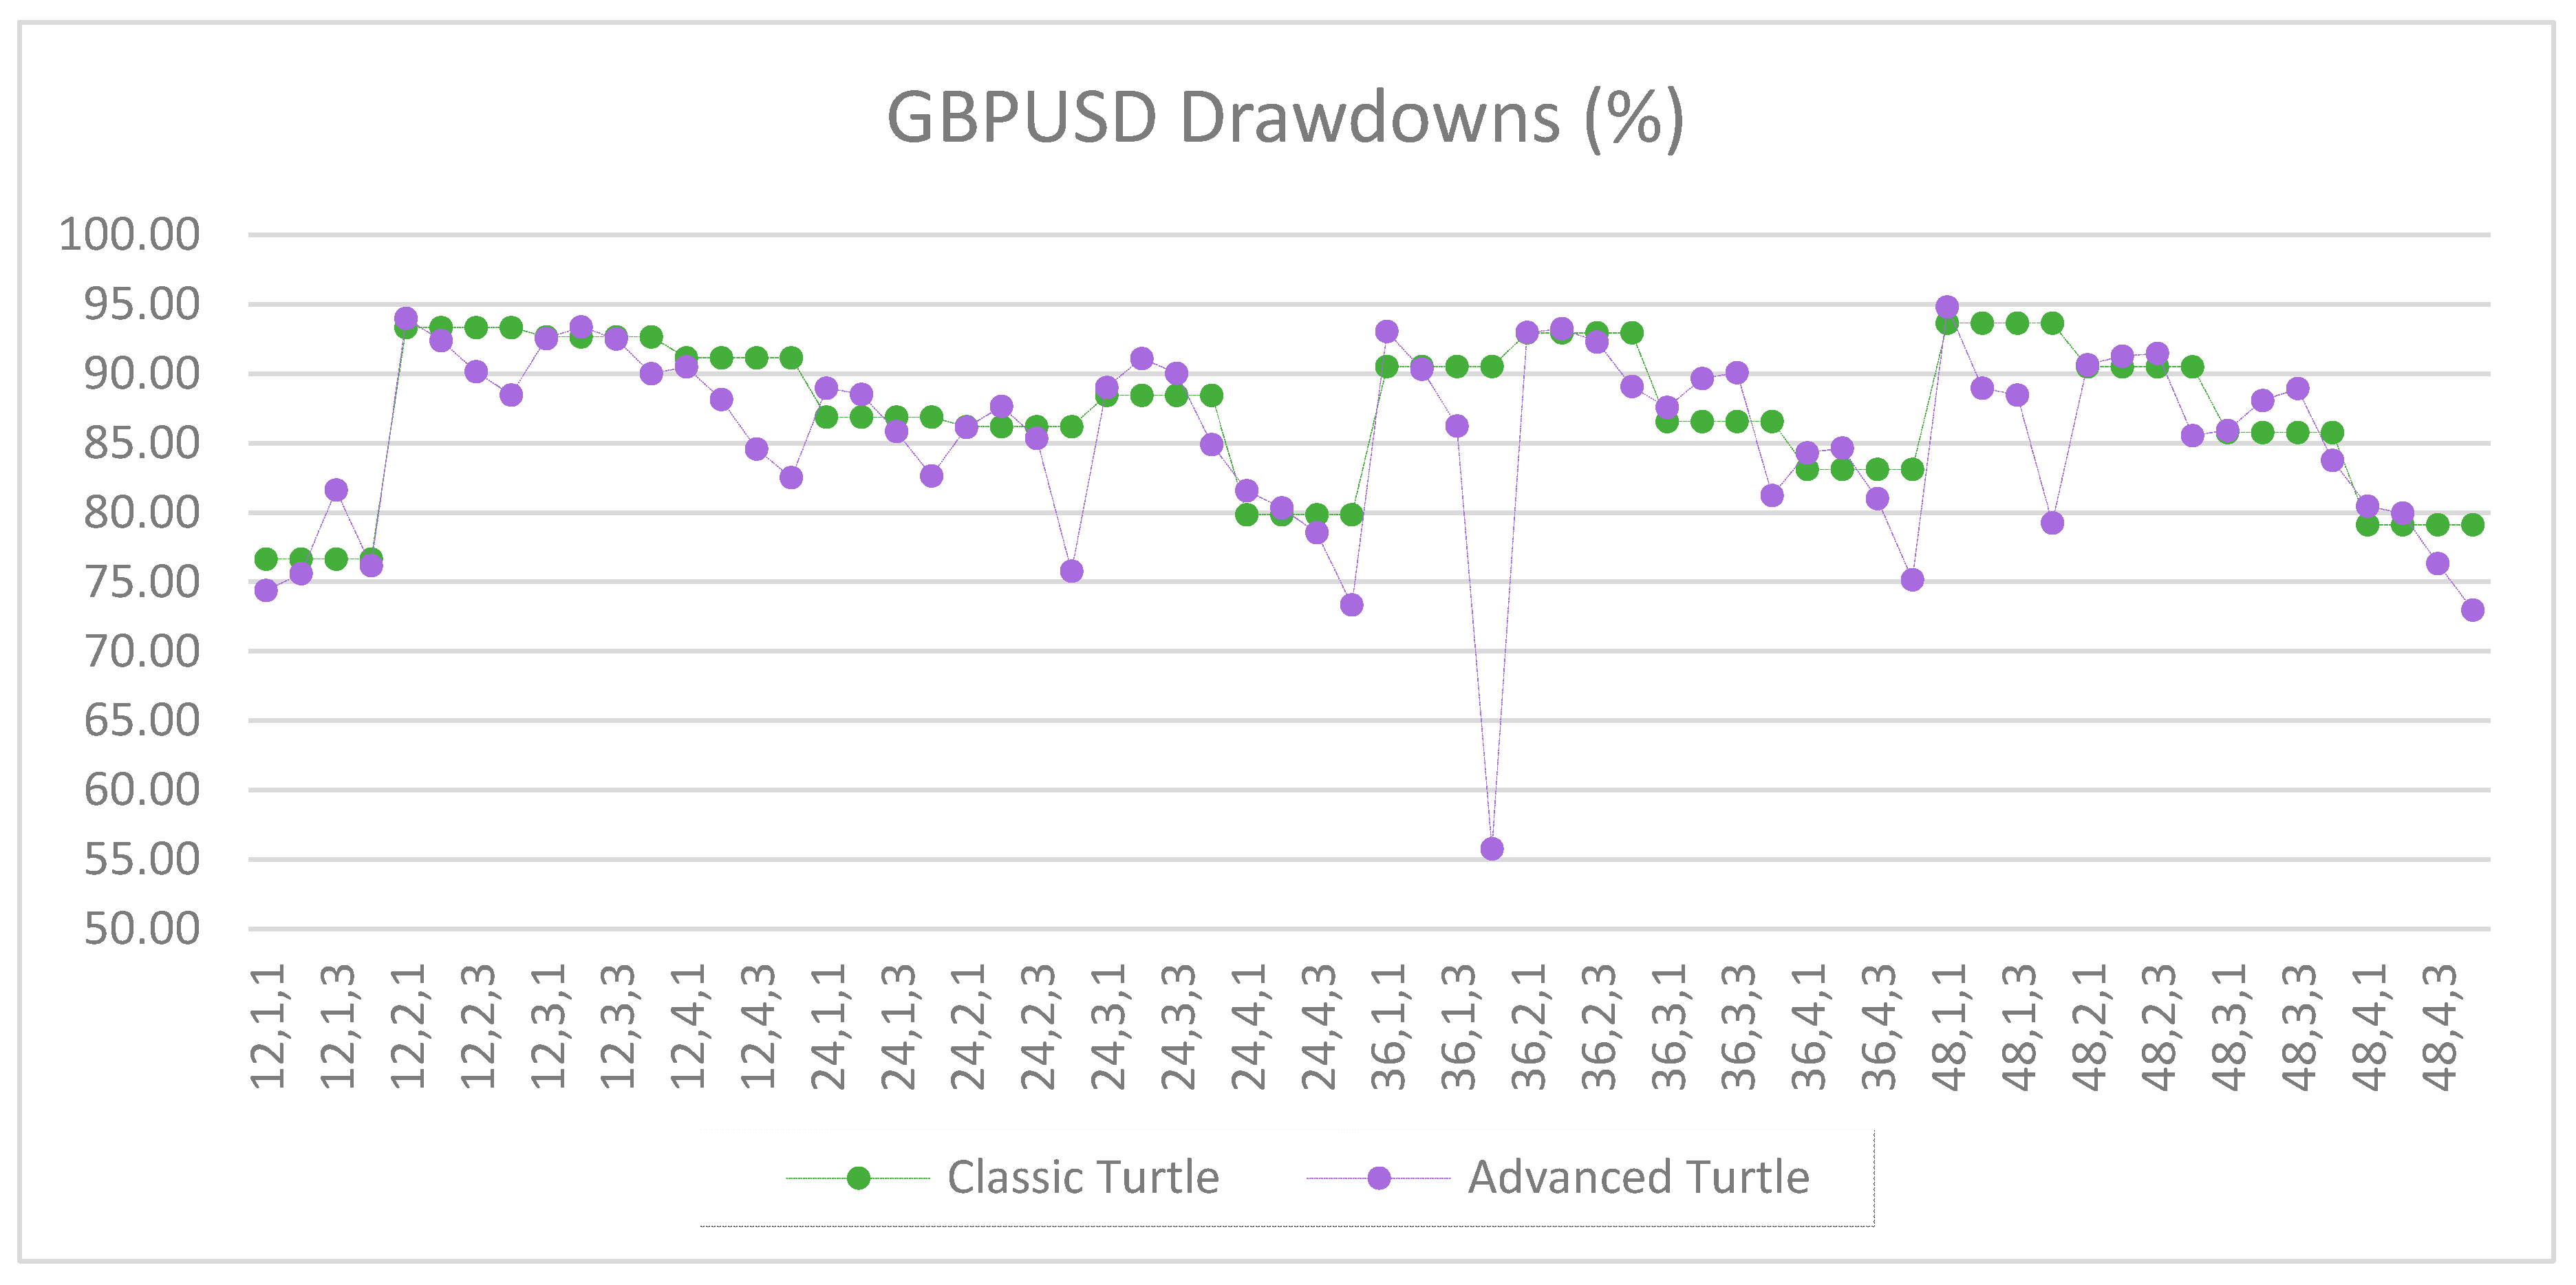
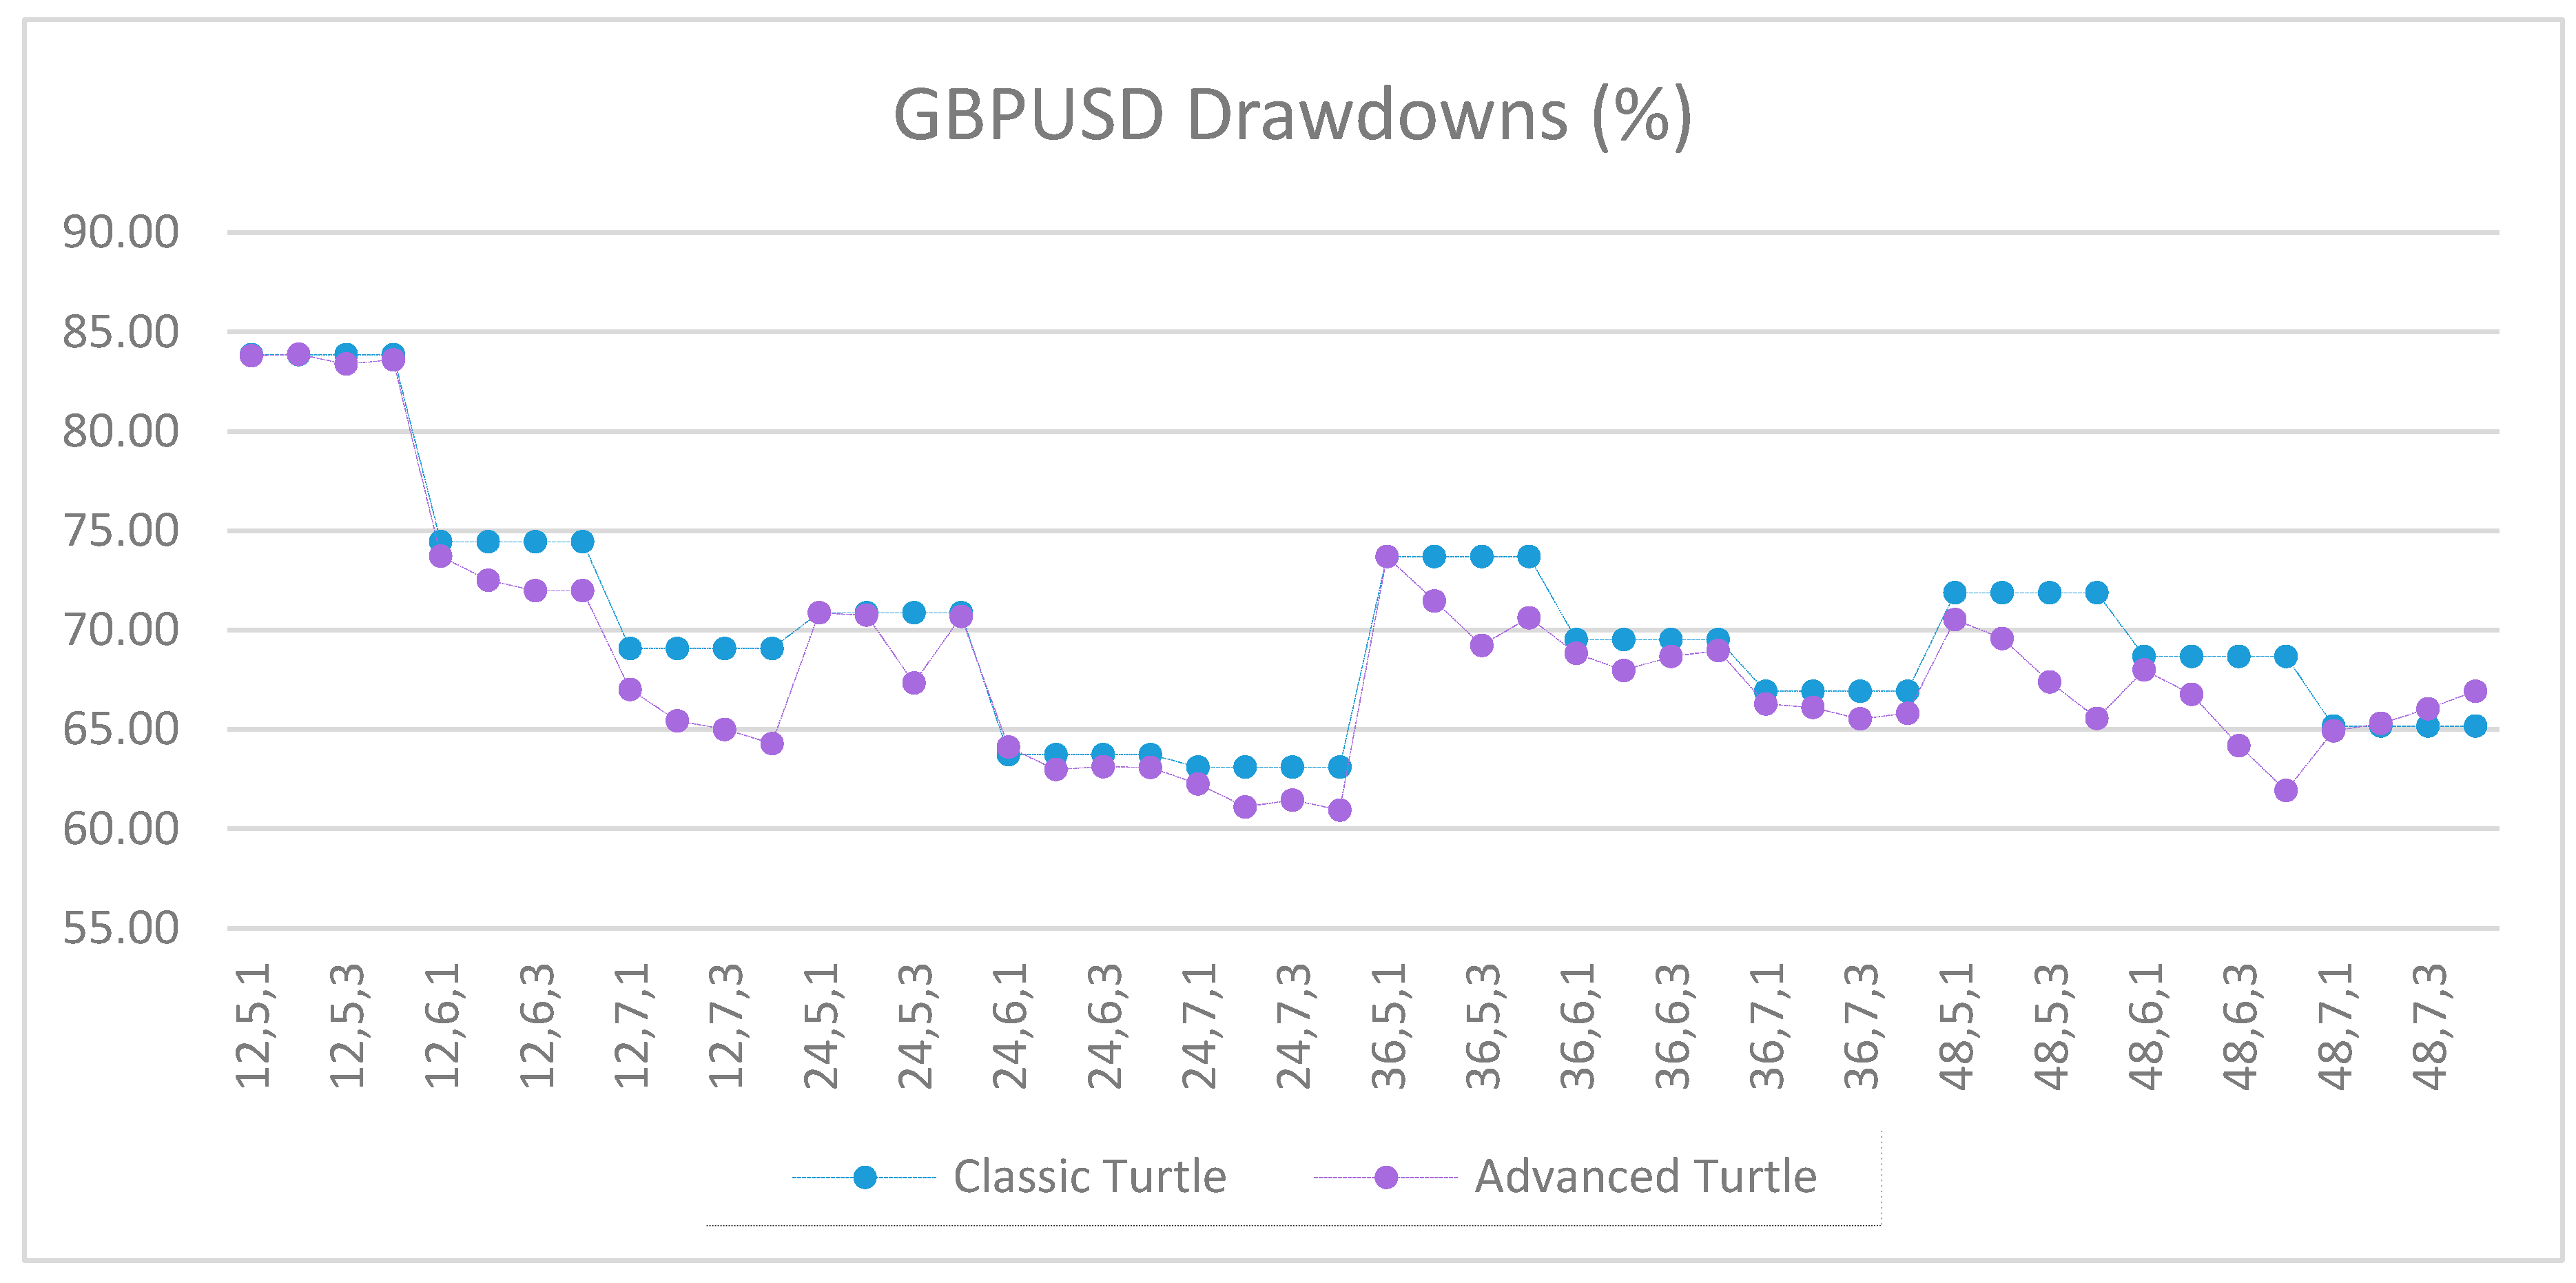
Figure A6.
Drawdowns of GBPUSD as percentage of equity between the classic and the advanced Turtle systems for every combination of N, X, Y for the fast parameters (20, 40).
Figure A6.
Drawdowns of GBPUSD as percentage of equity between the classic and the advanced Turtle systems for every combination of N, X, Y for the fast parameters (20, 40).
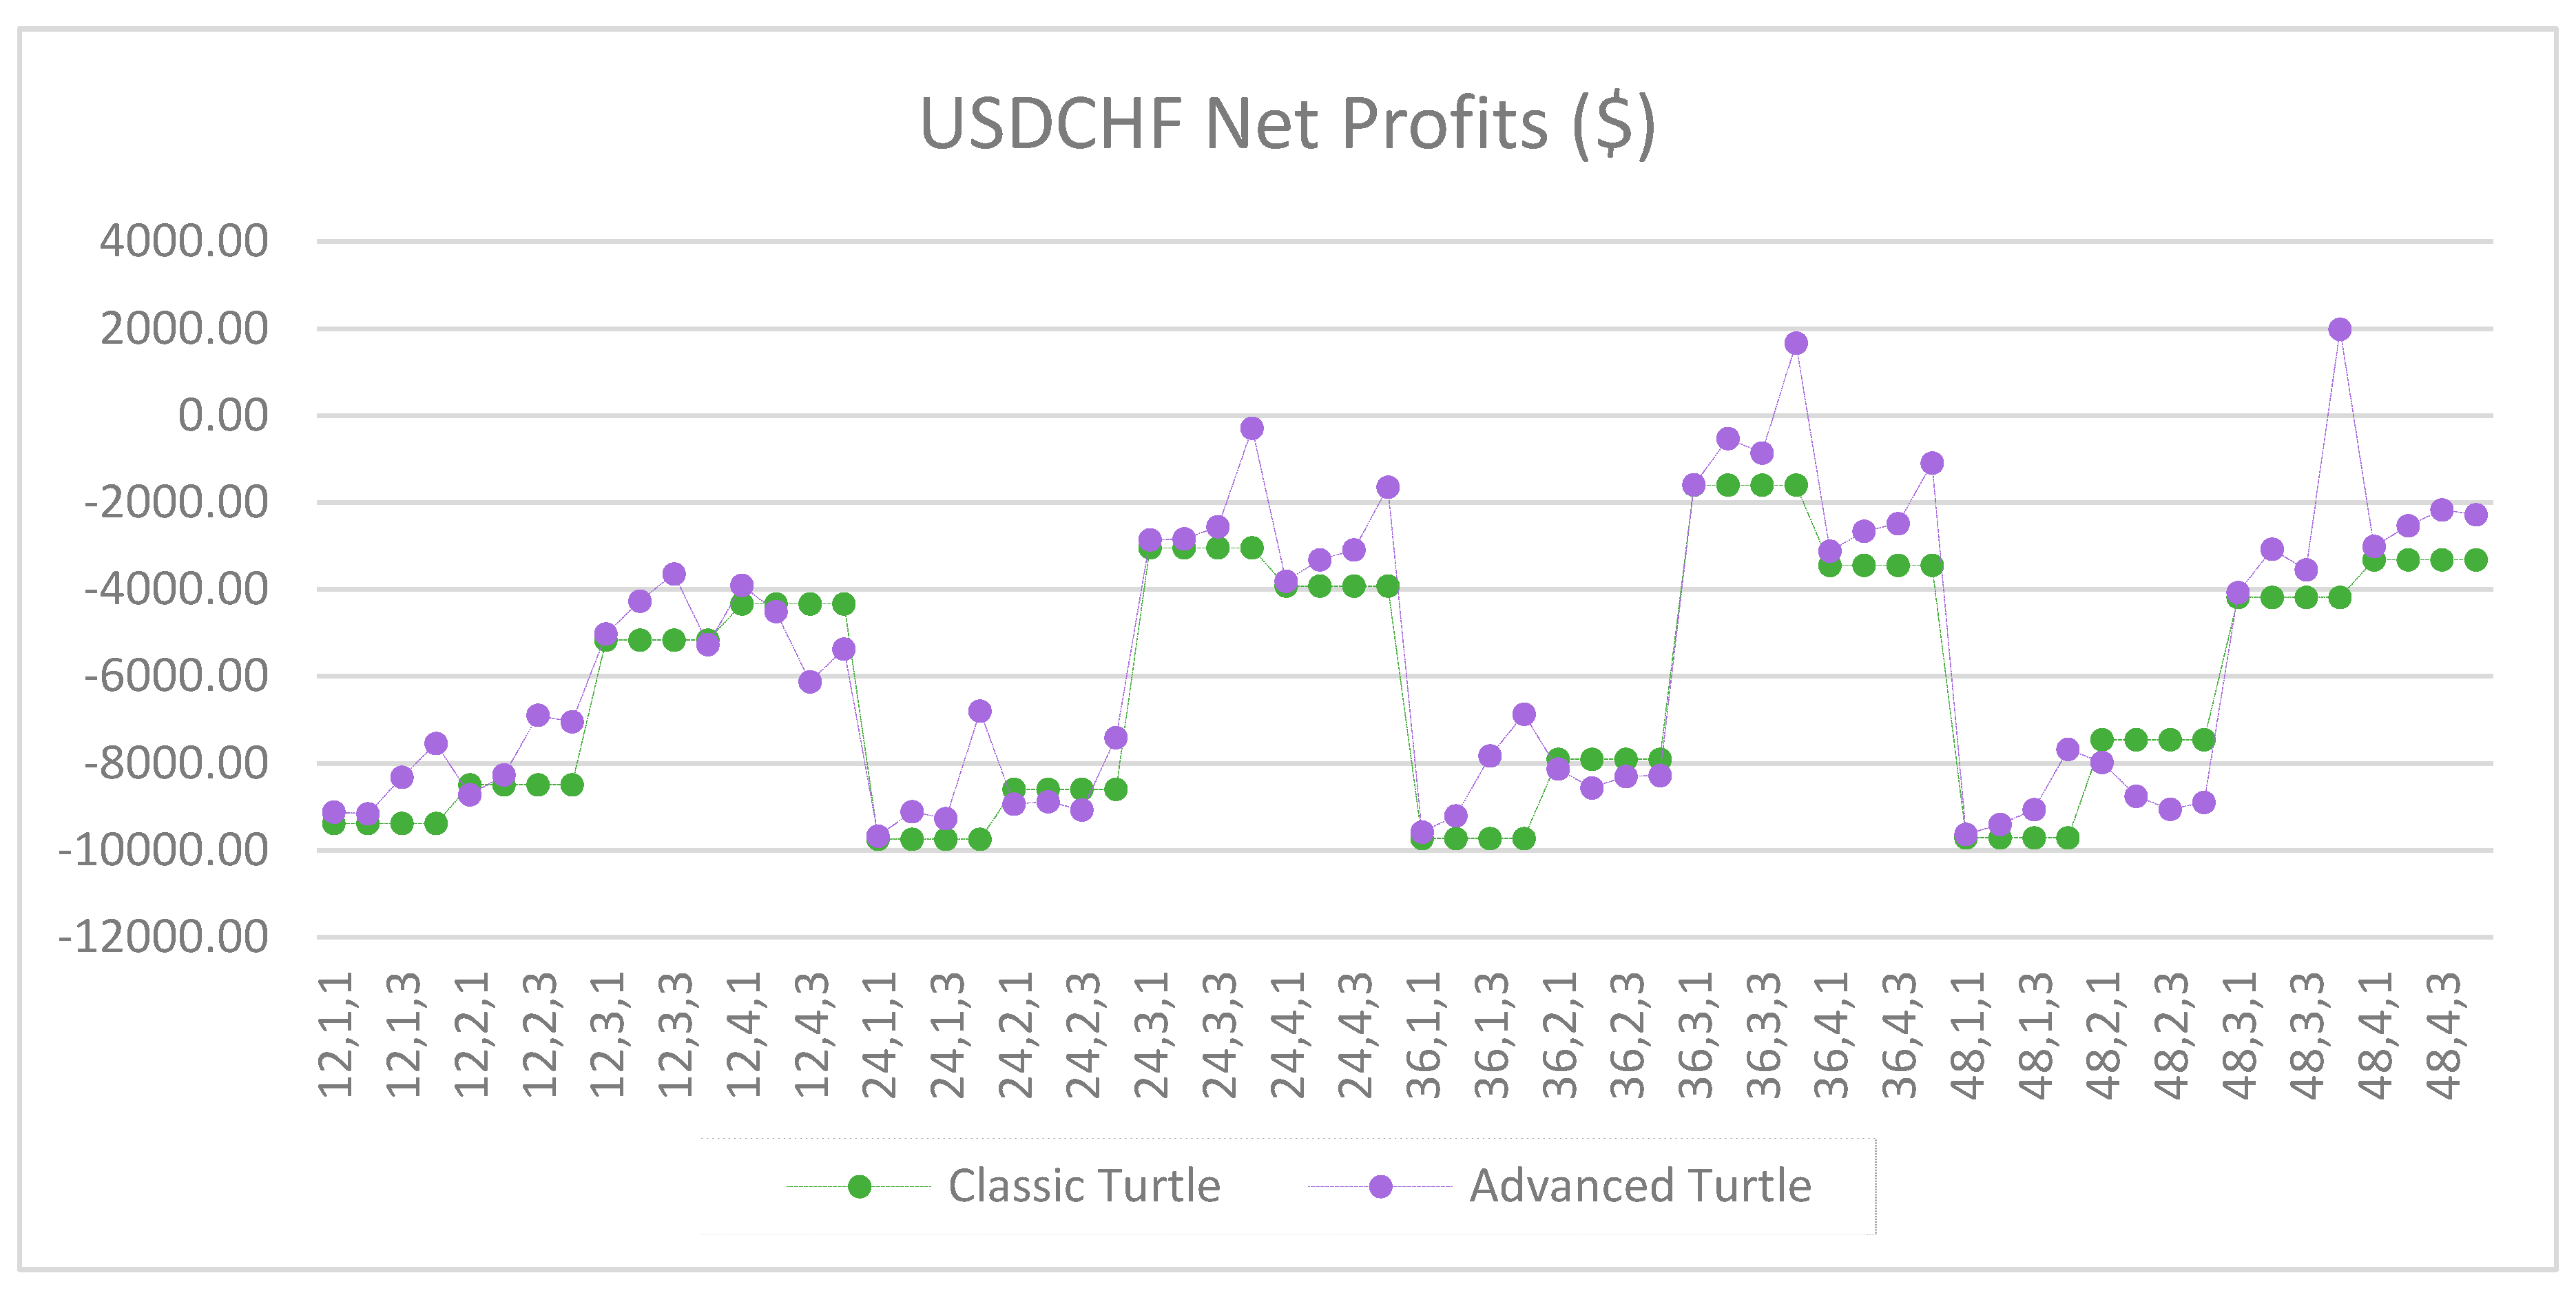
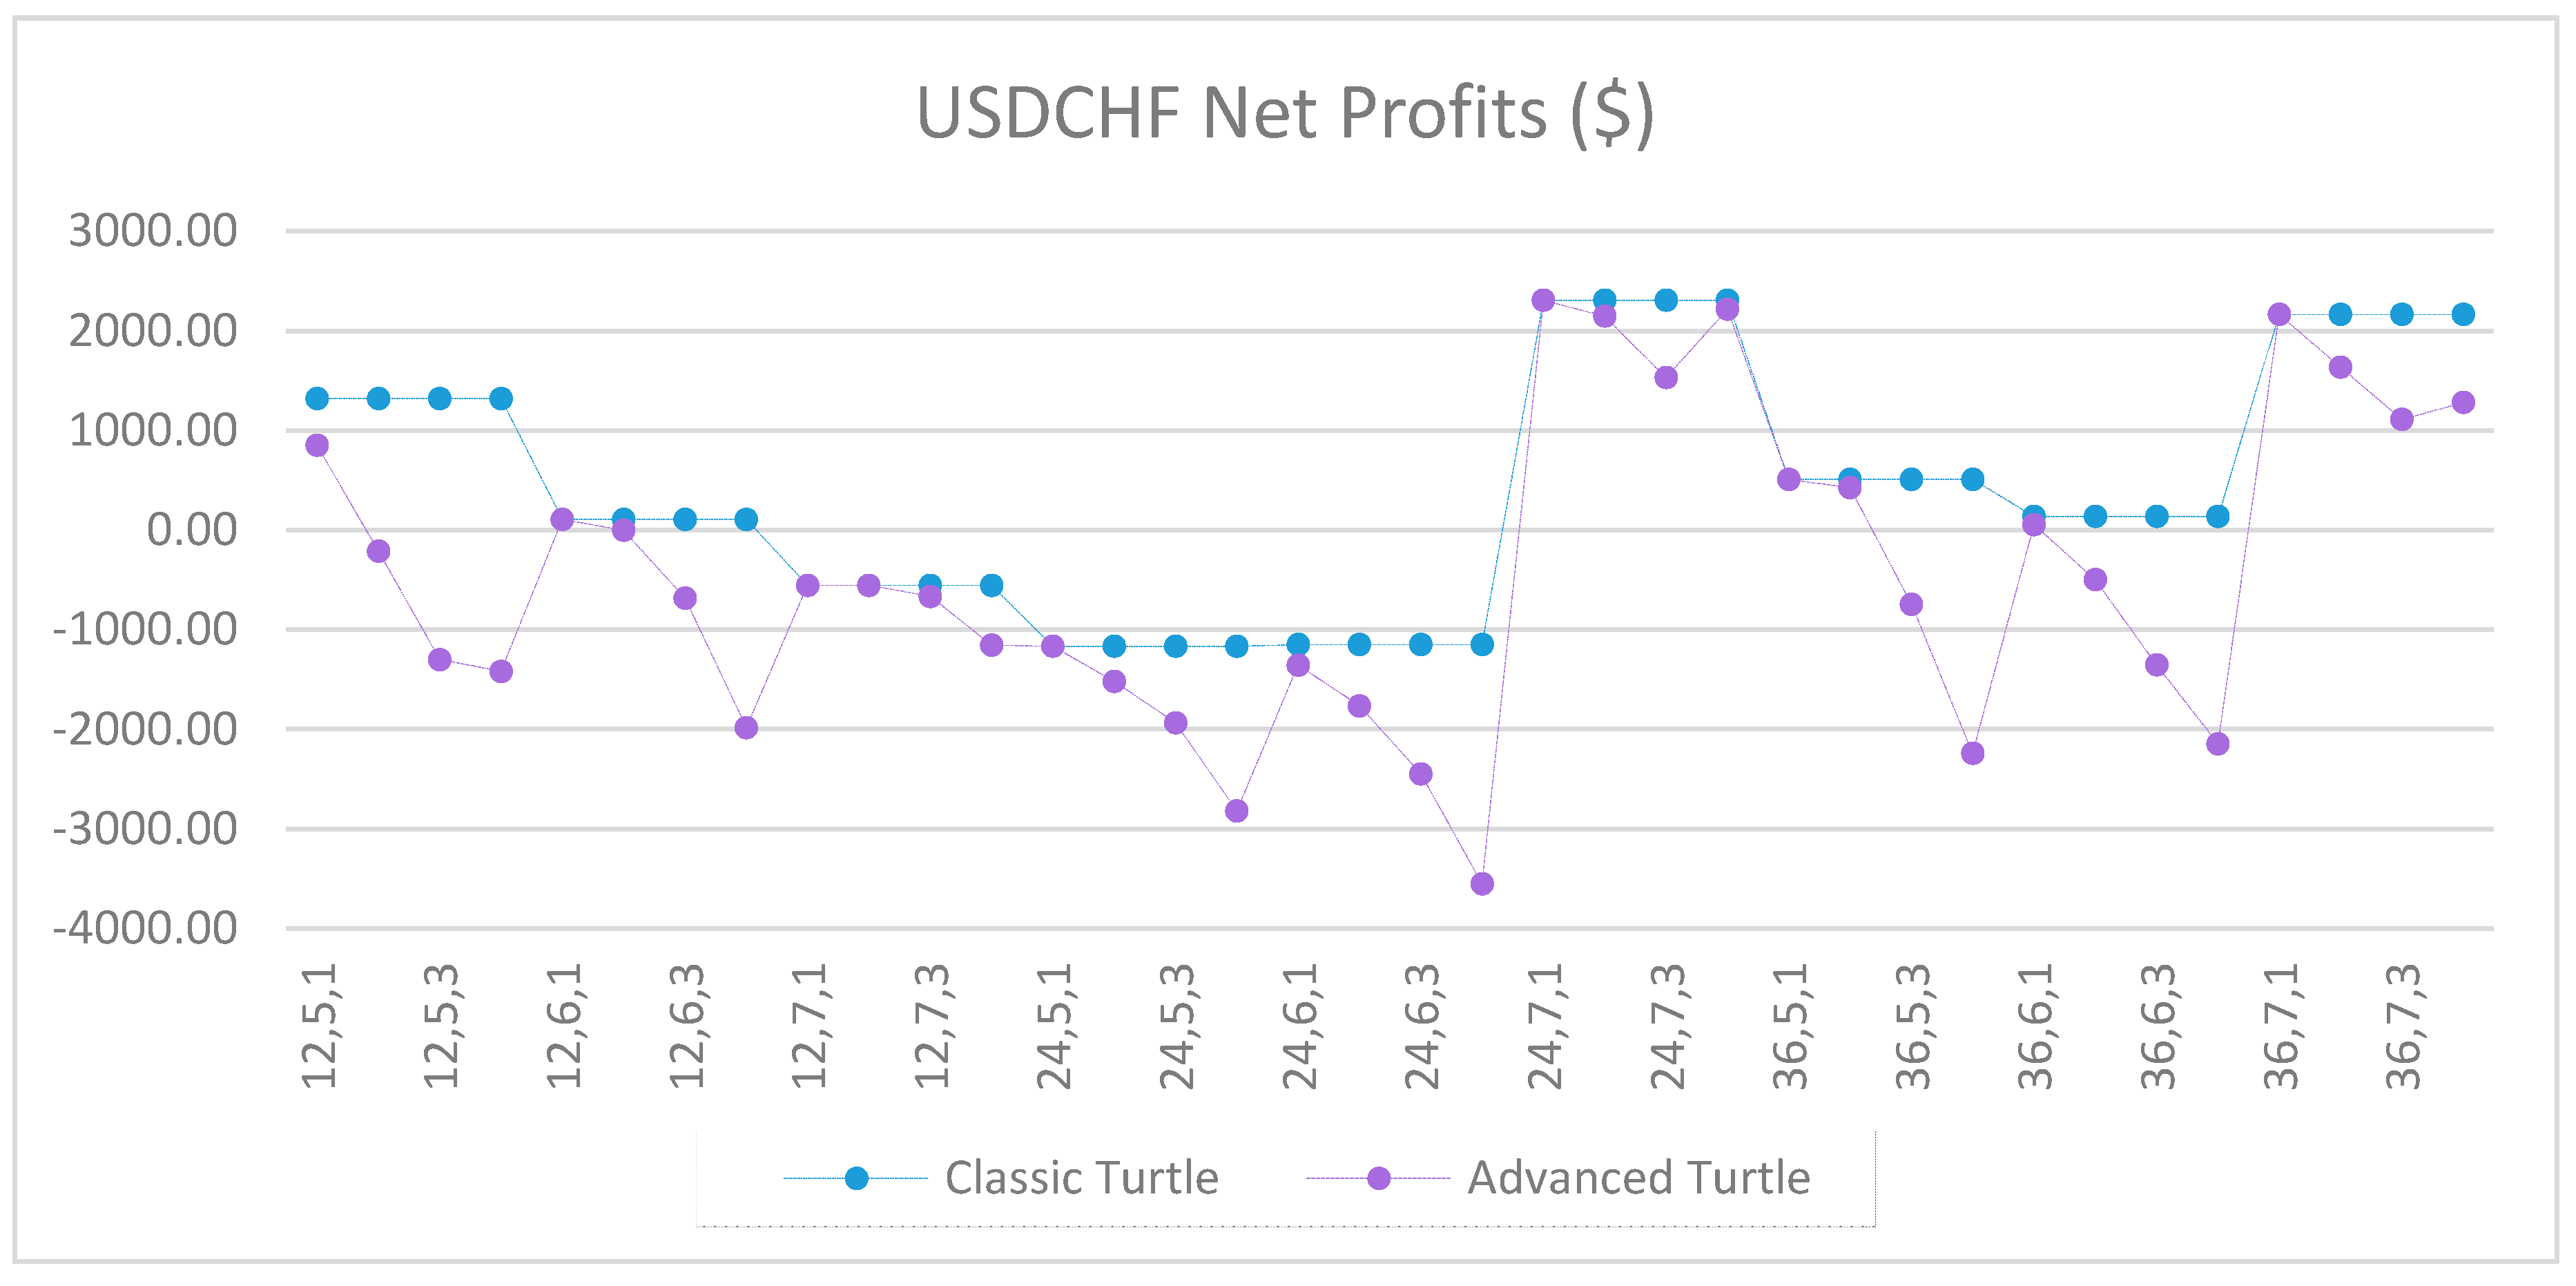
Figure A7.
Net profits of USDCHF between the classic and the advanced Turtle systems for every combination of N, X, Y for the fast parameters (20, 40).
Figure A7.
Net profits of USDCHF between the classic and the advanced Turtle systems for every combination of N, X, Y for the fast parameters (20, 40).
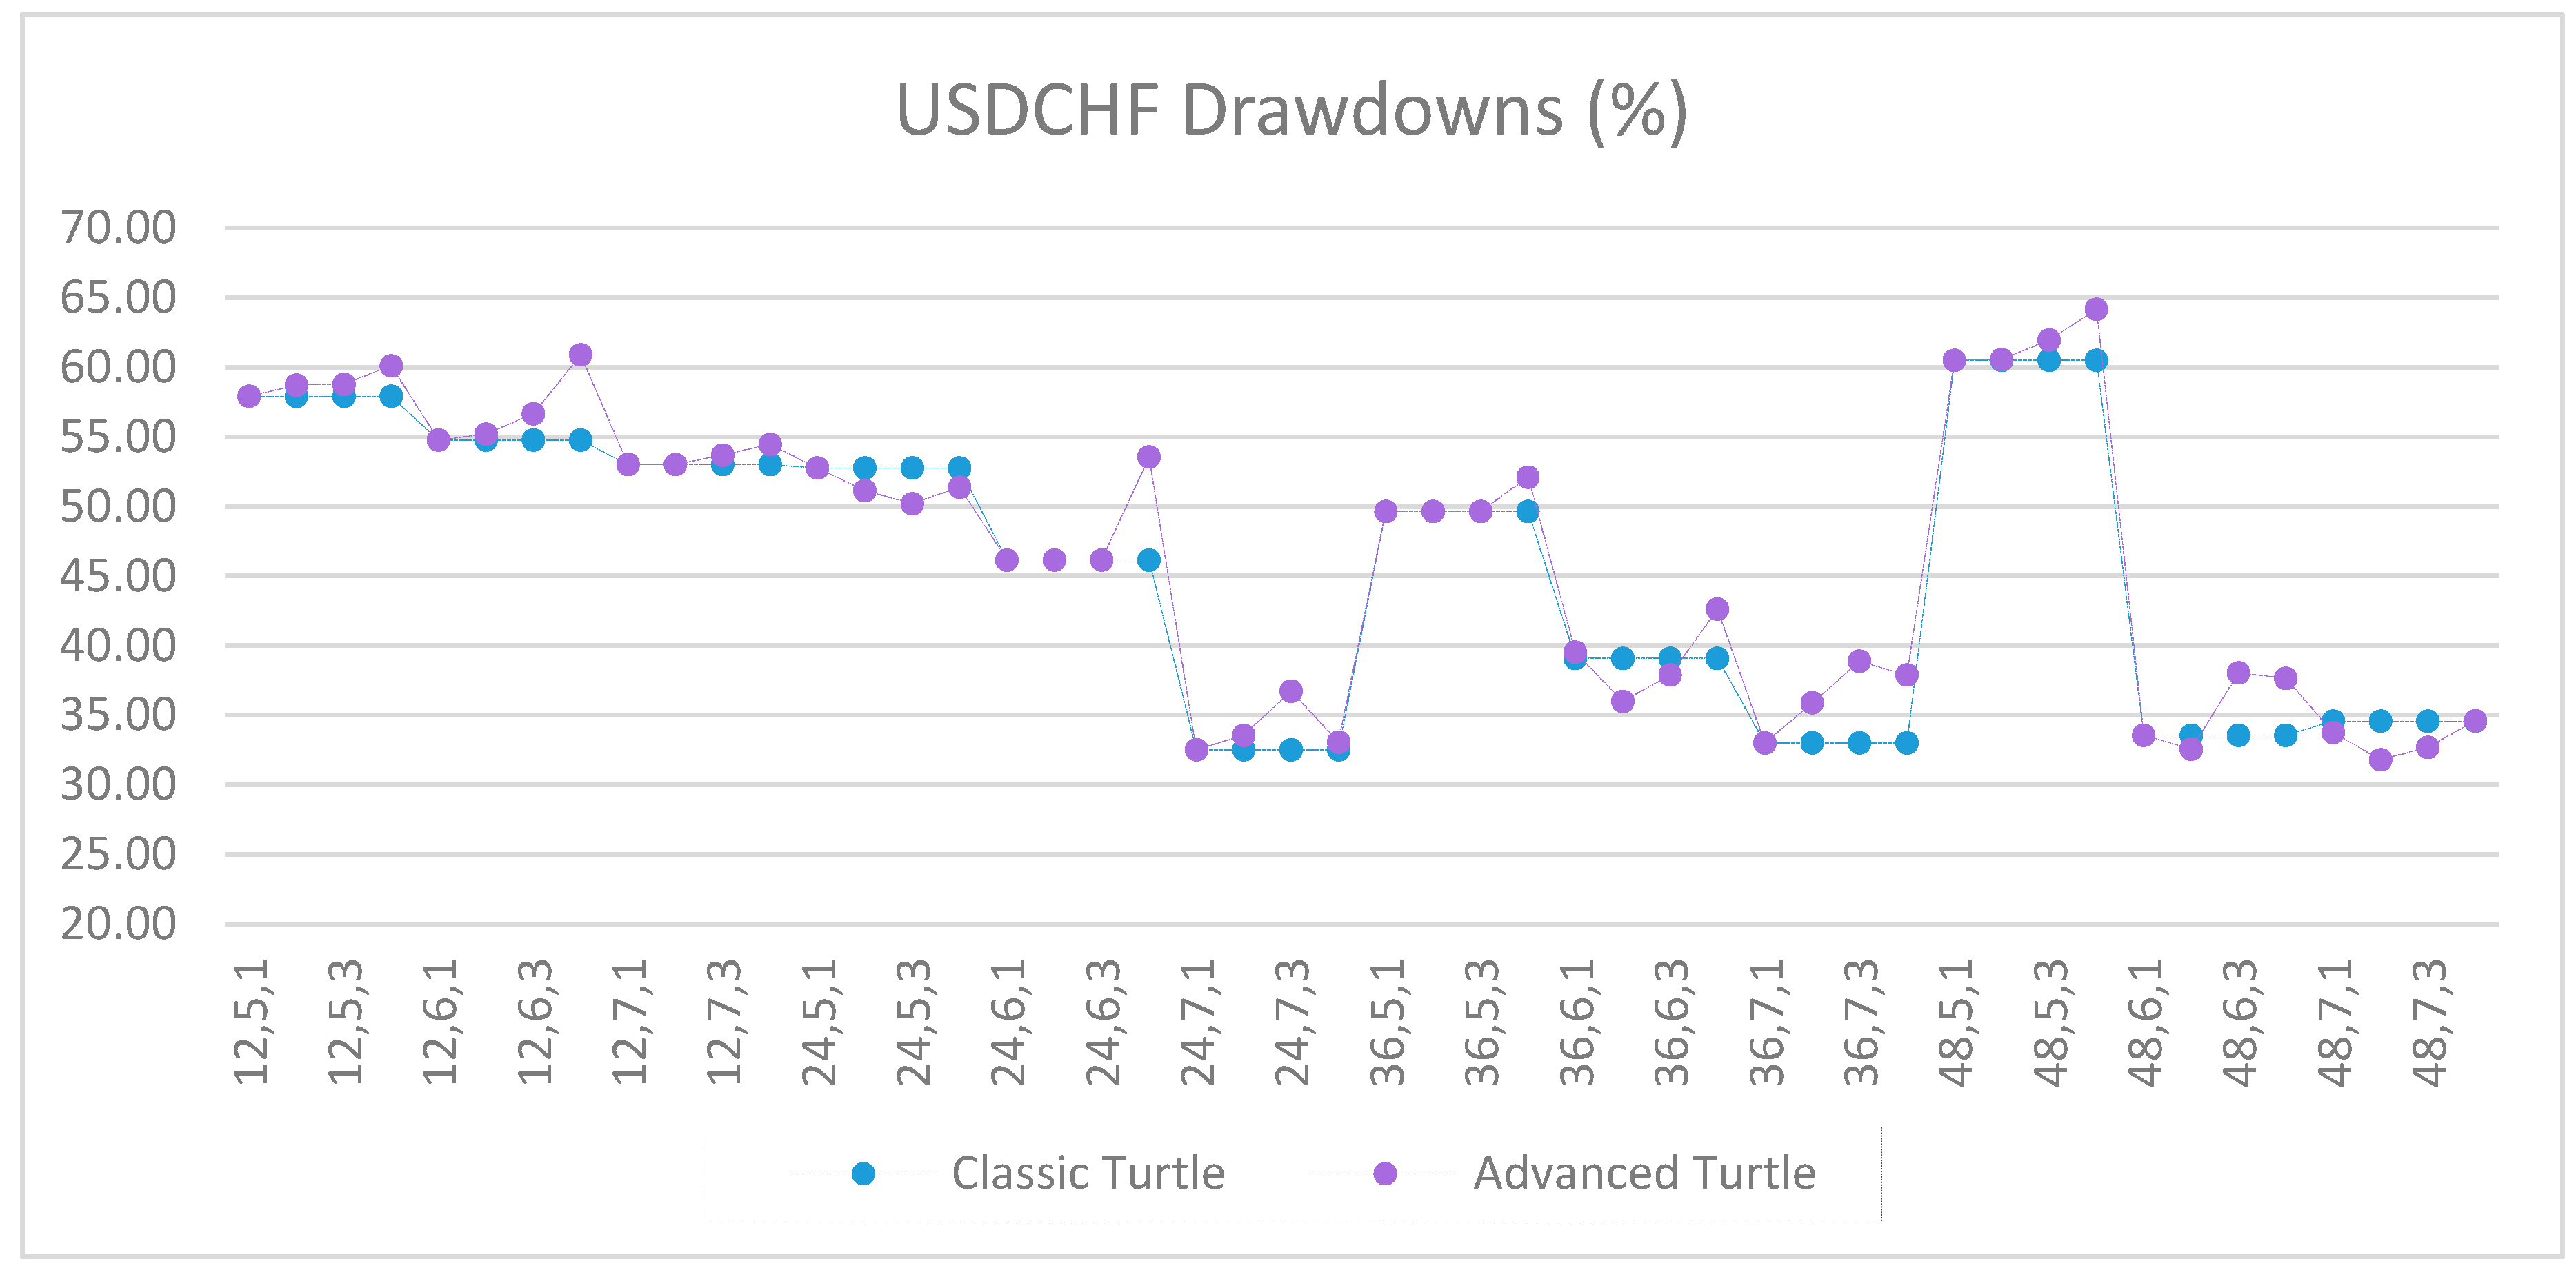
Figure A8.
Drawdowns of USDCHF as percentage of equity between the classic and the advanced Turtle systems for every combination of N, X, Y for the fast parameters (20, 40).
Figure A8.
Drawdowns of USDCHF as percentage of equity between the classic and the advanced Turtle systems for every combination of N, X, Y for the fast parameters (20, 40).
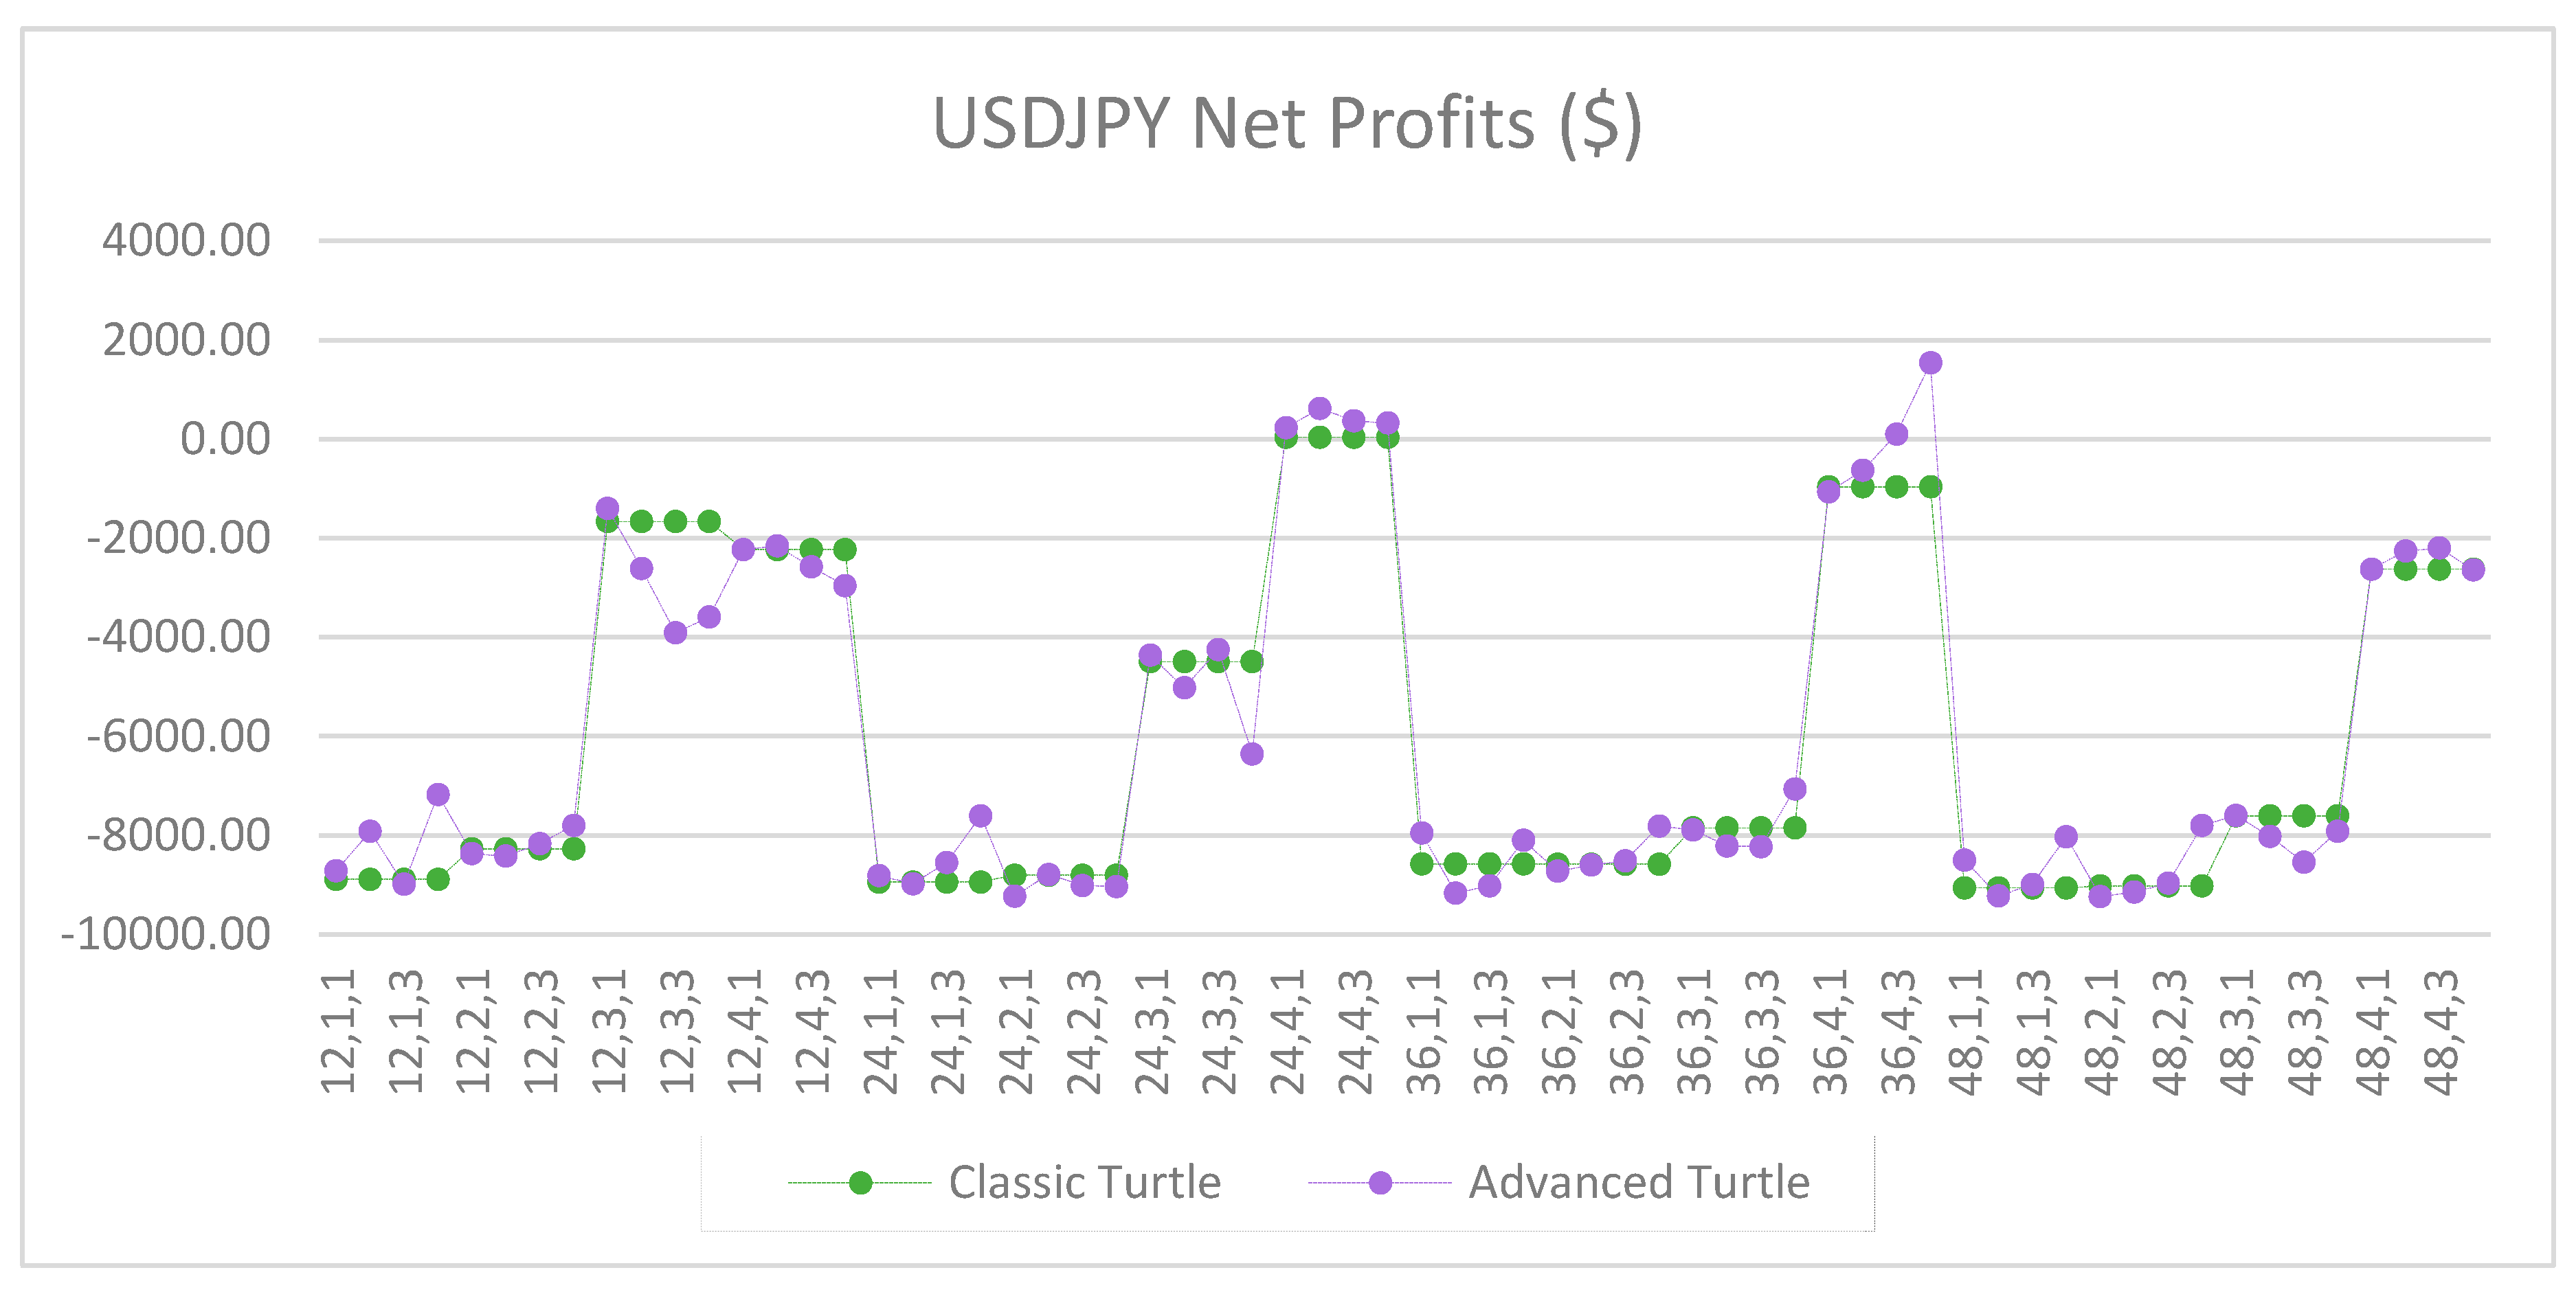
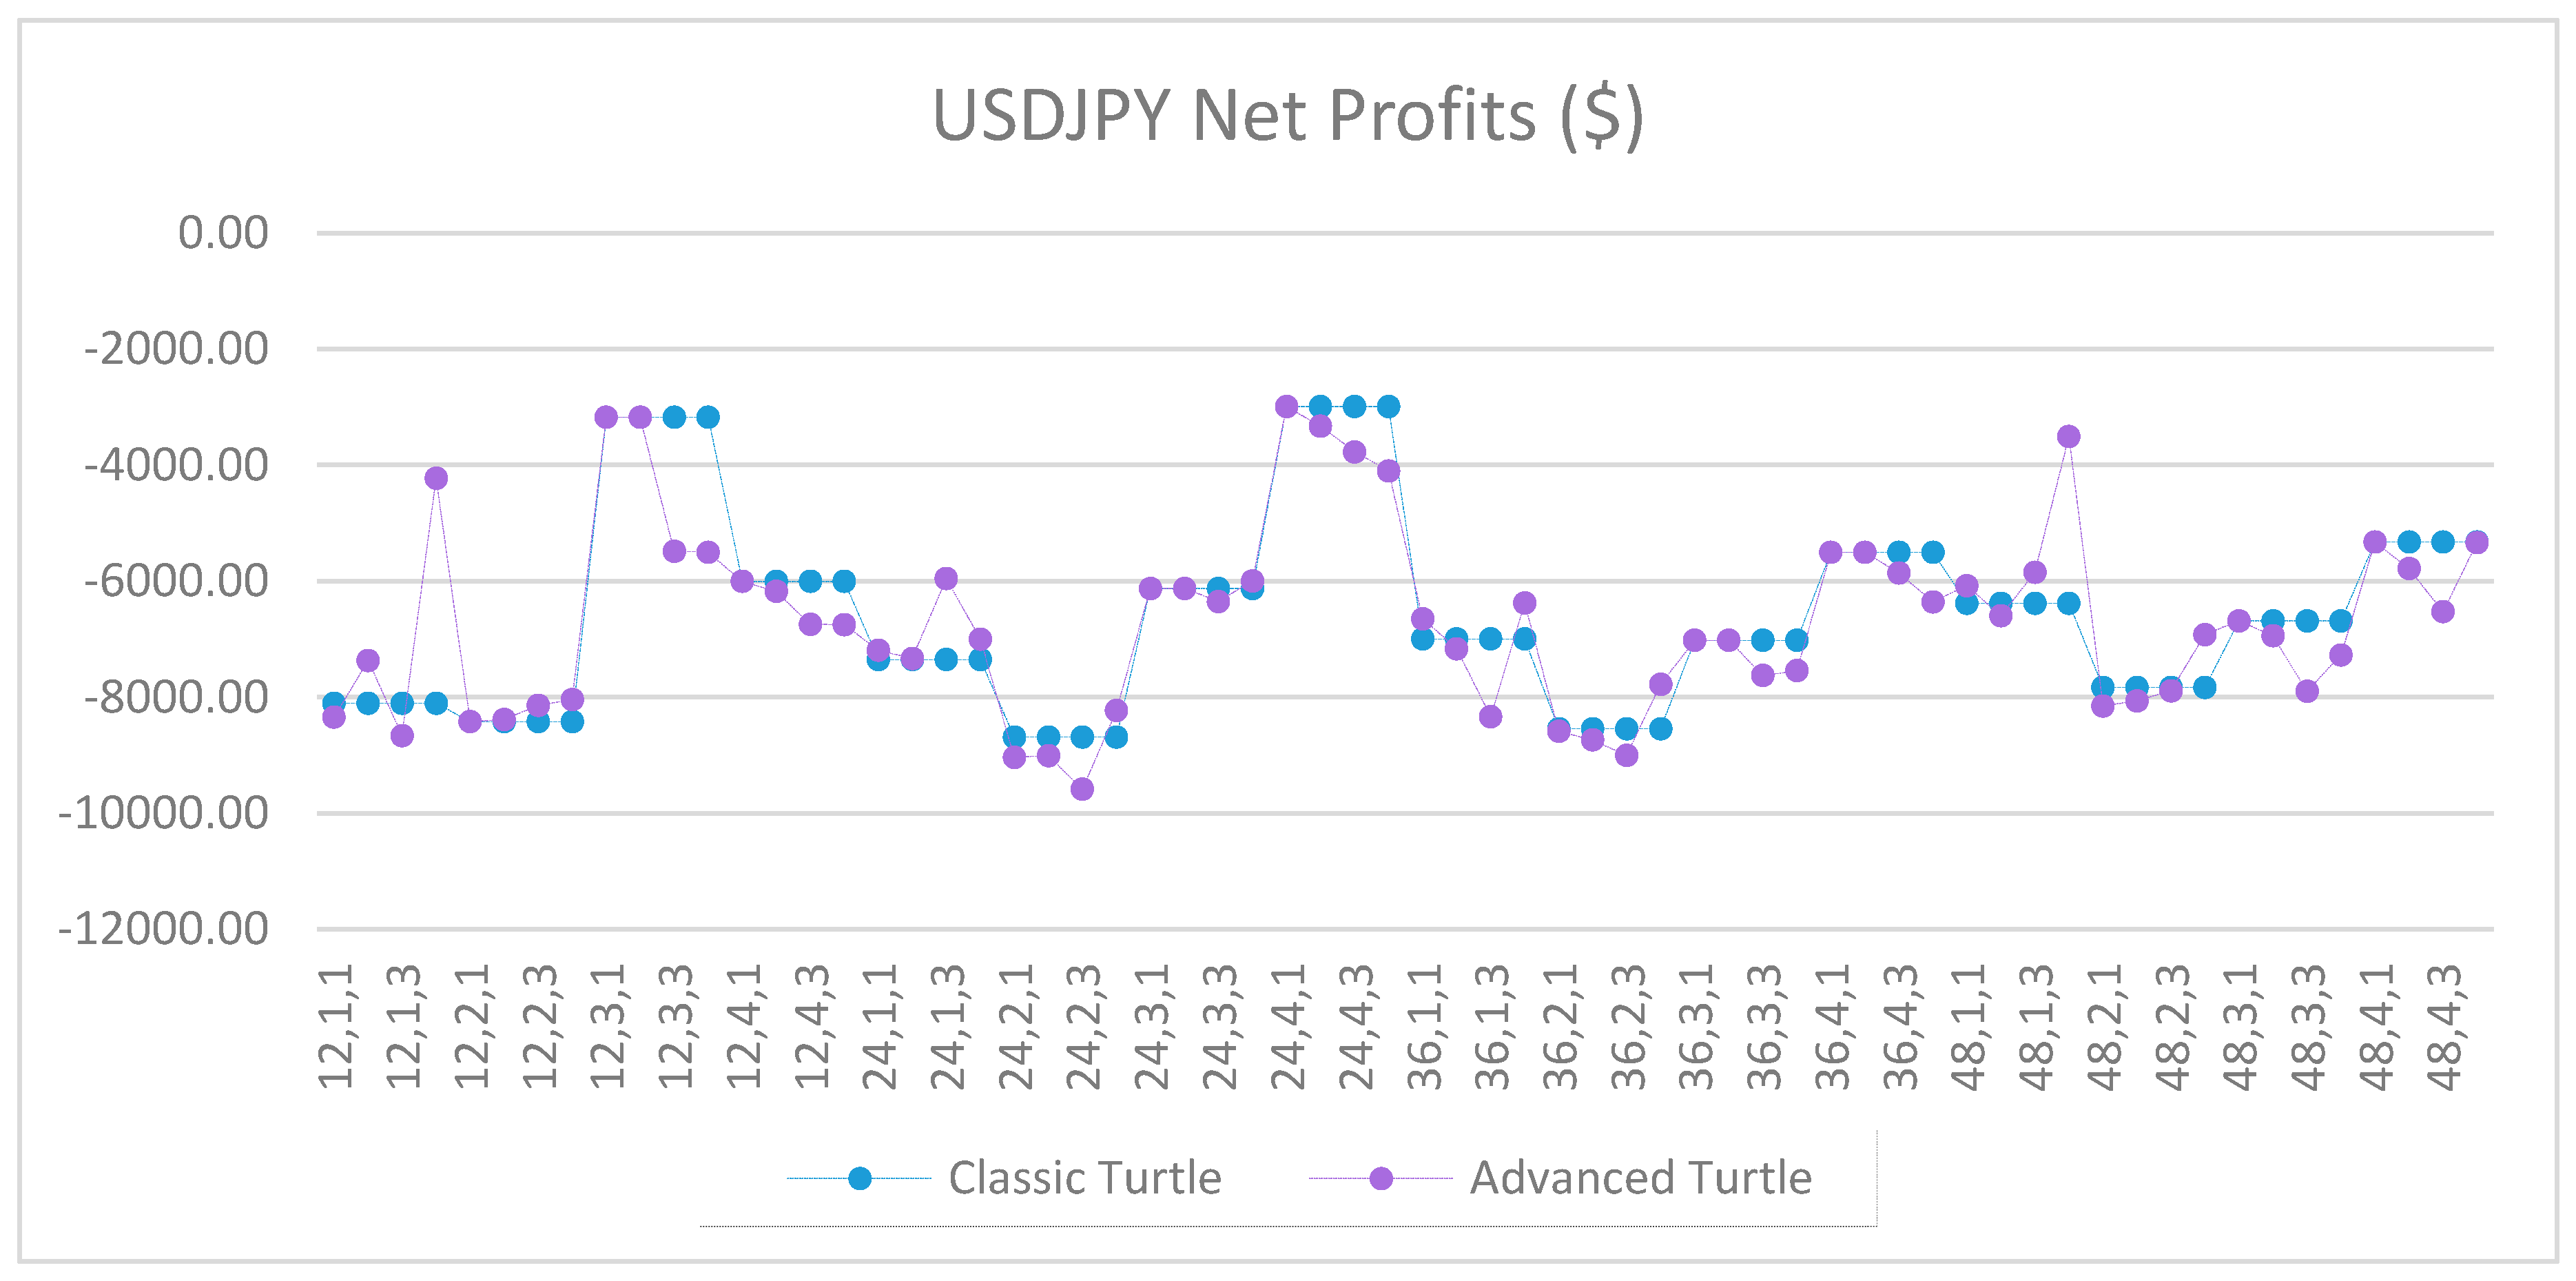
Figure A9.
Net profits of USDJPY between the classic and the advanced Turtle systems for every combination of N, X, Y for the fast parameters (20, 40).
Figure A9.
Net profits of USDJPY between the classic and the advanced Turtle systems for every combination of N, X, Y for the fast parameters (20, 40).
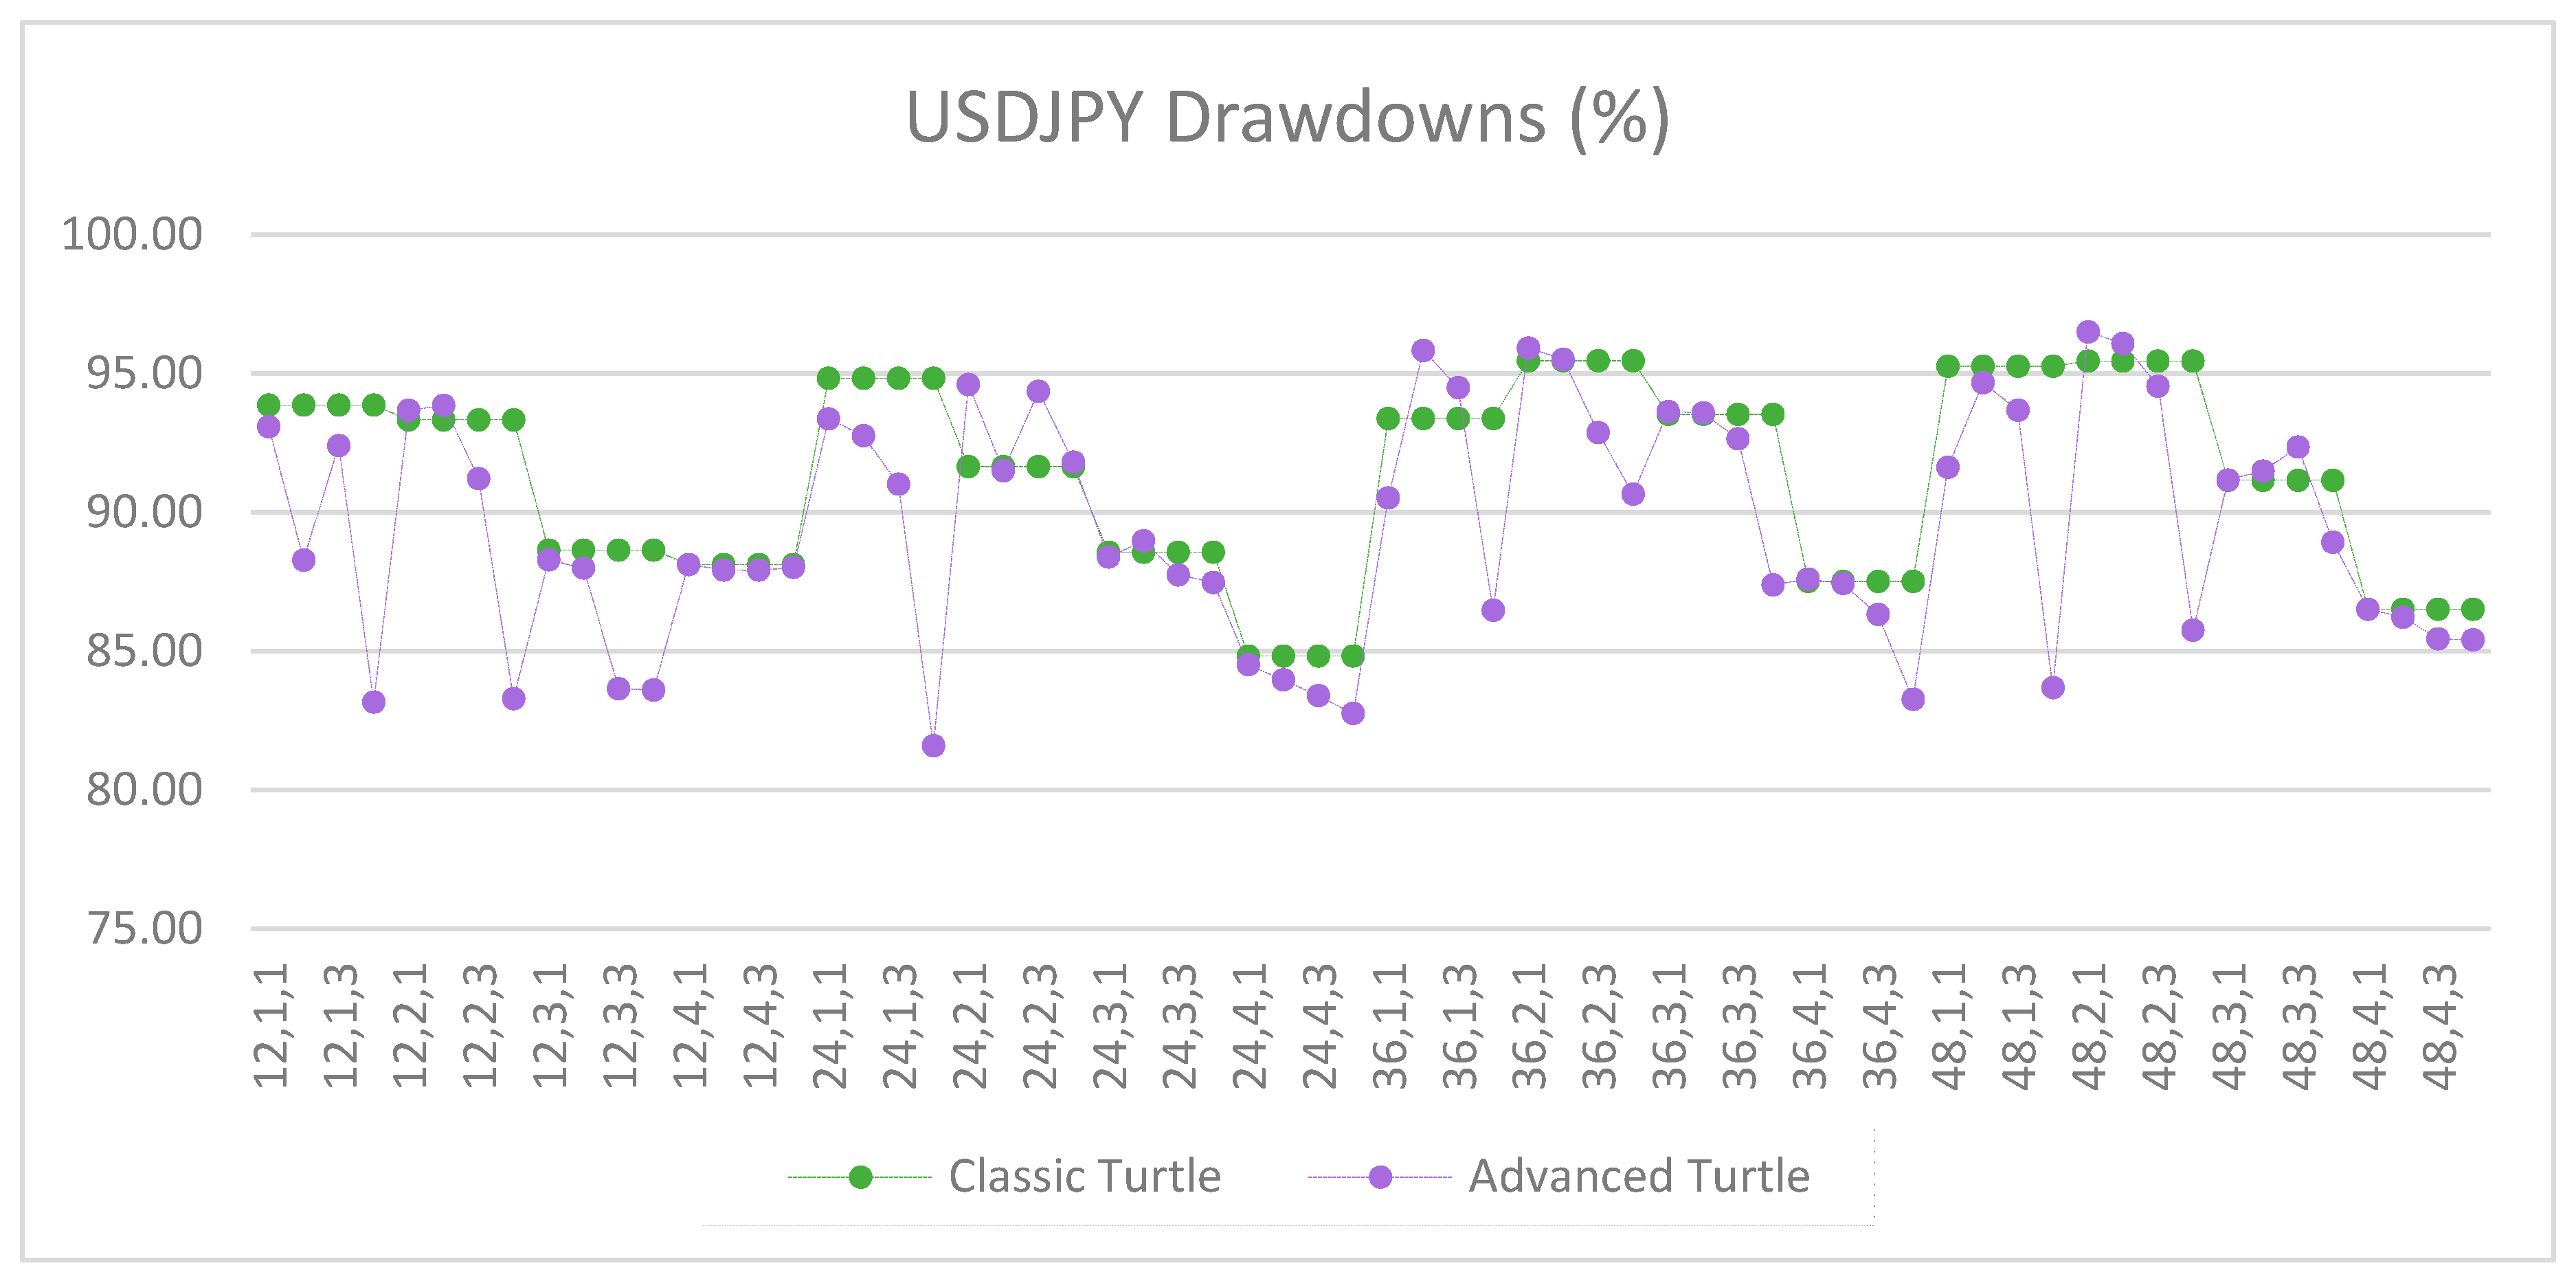
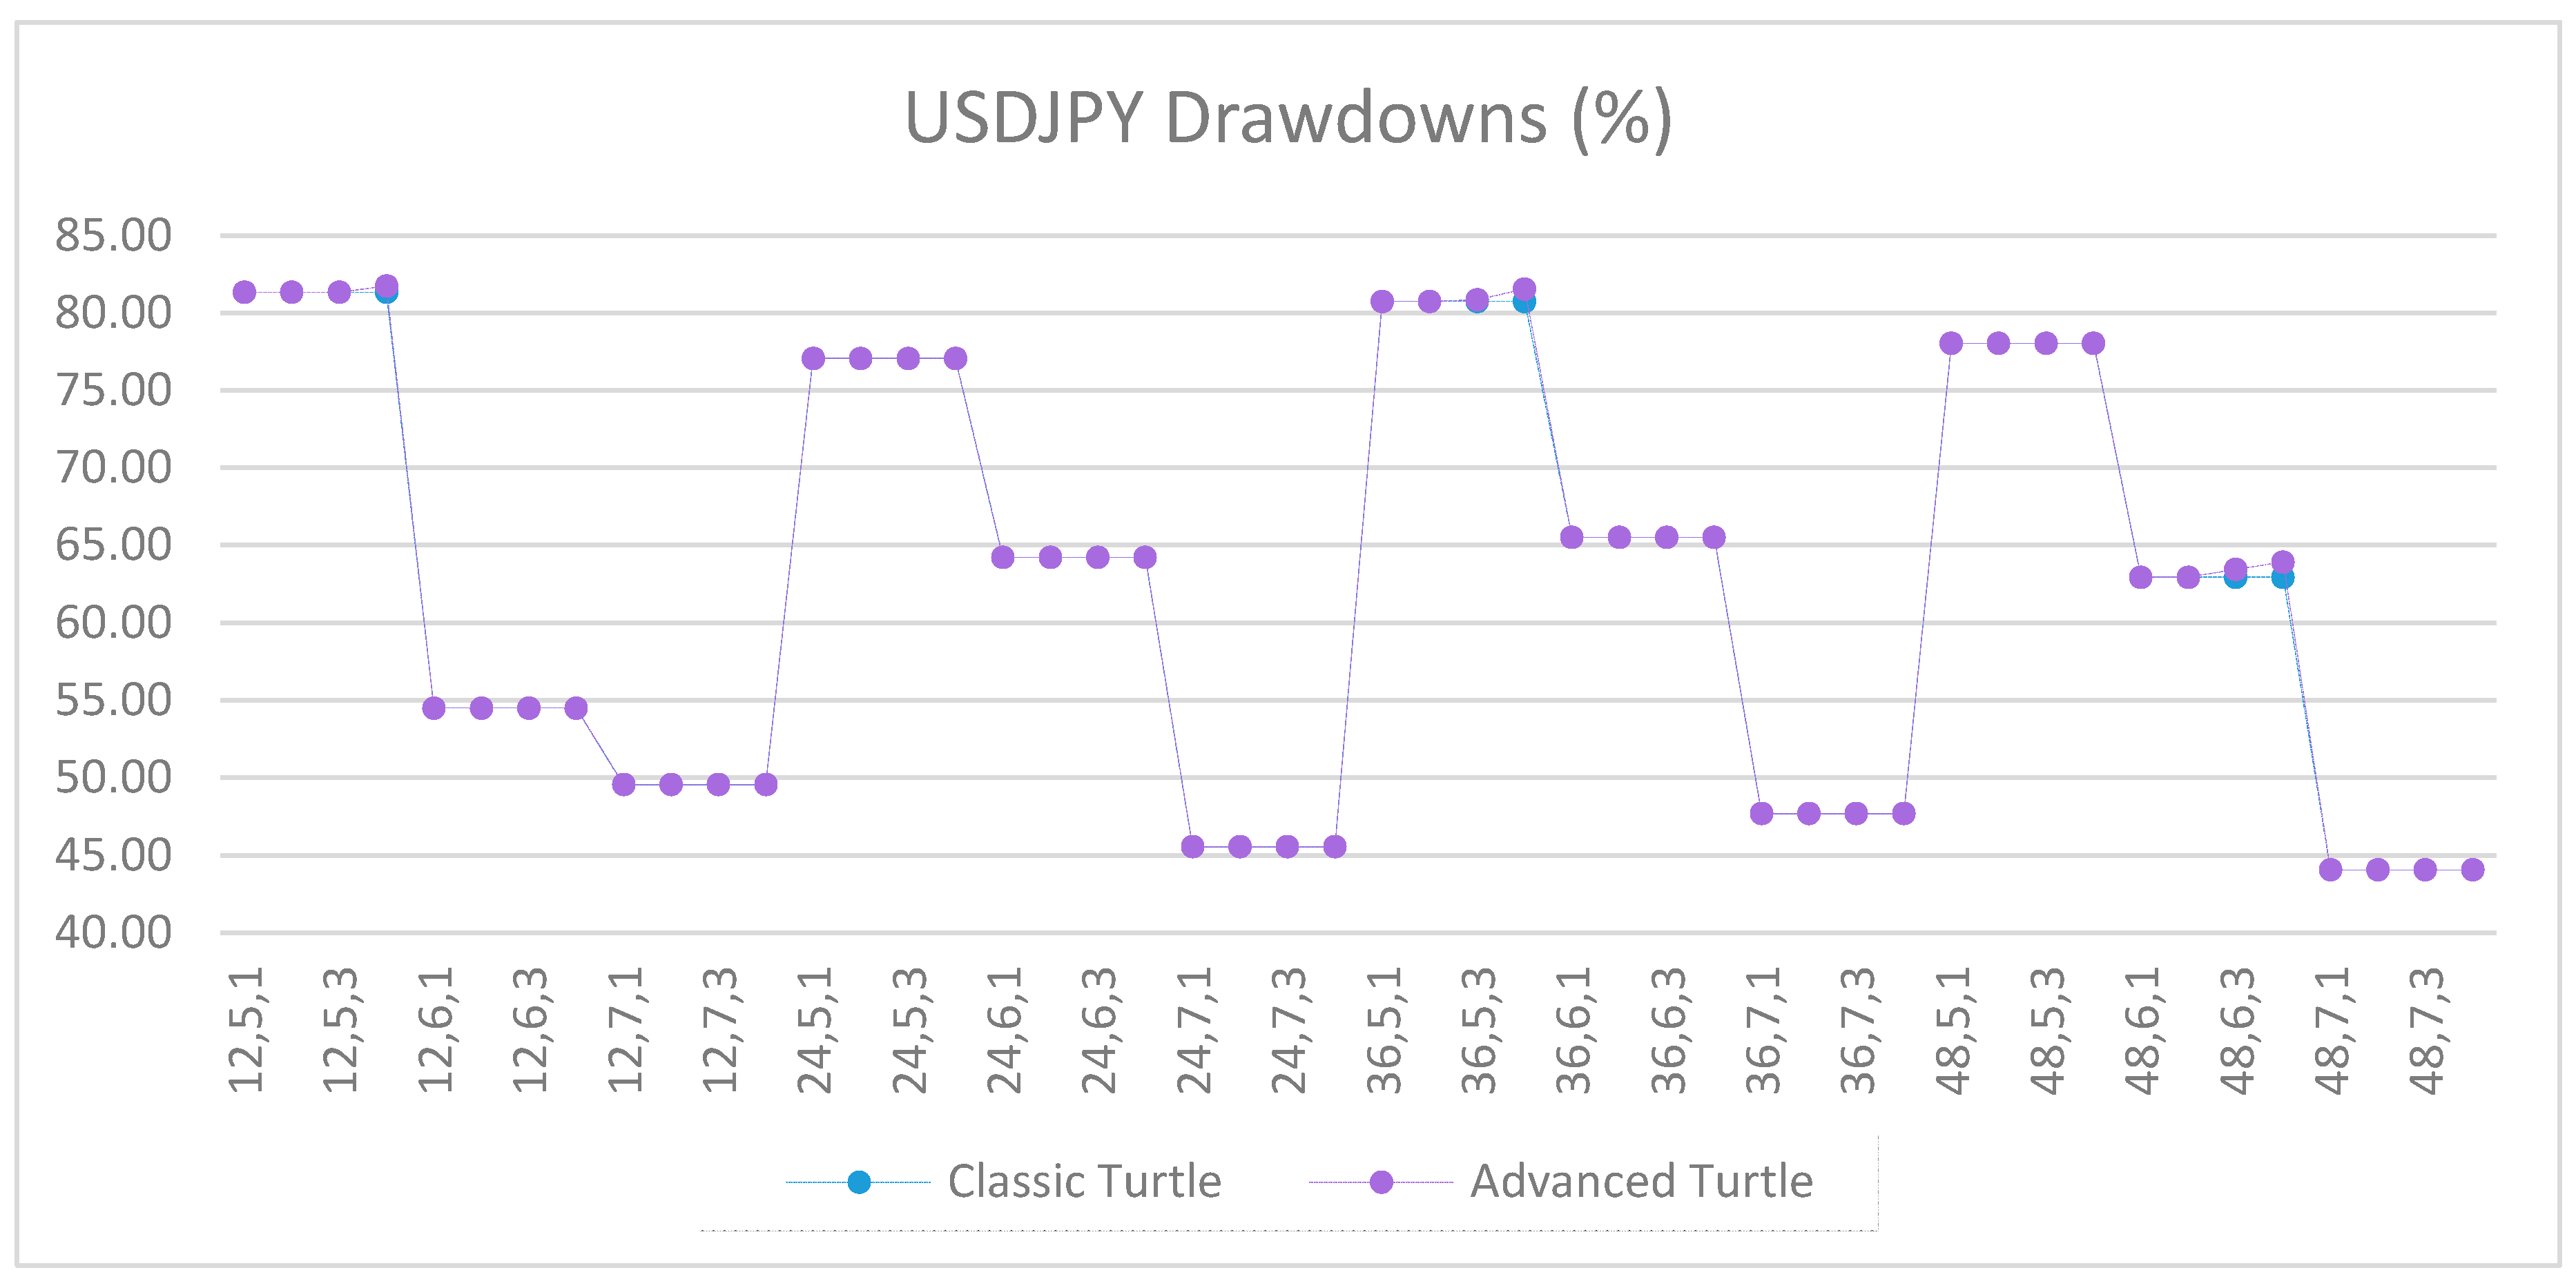
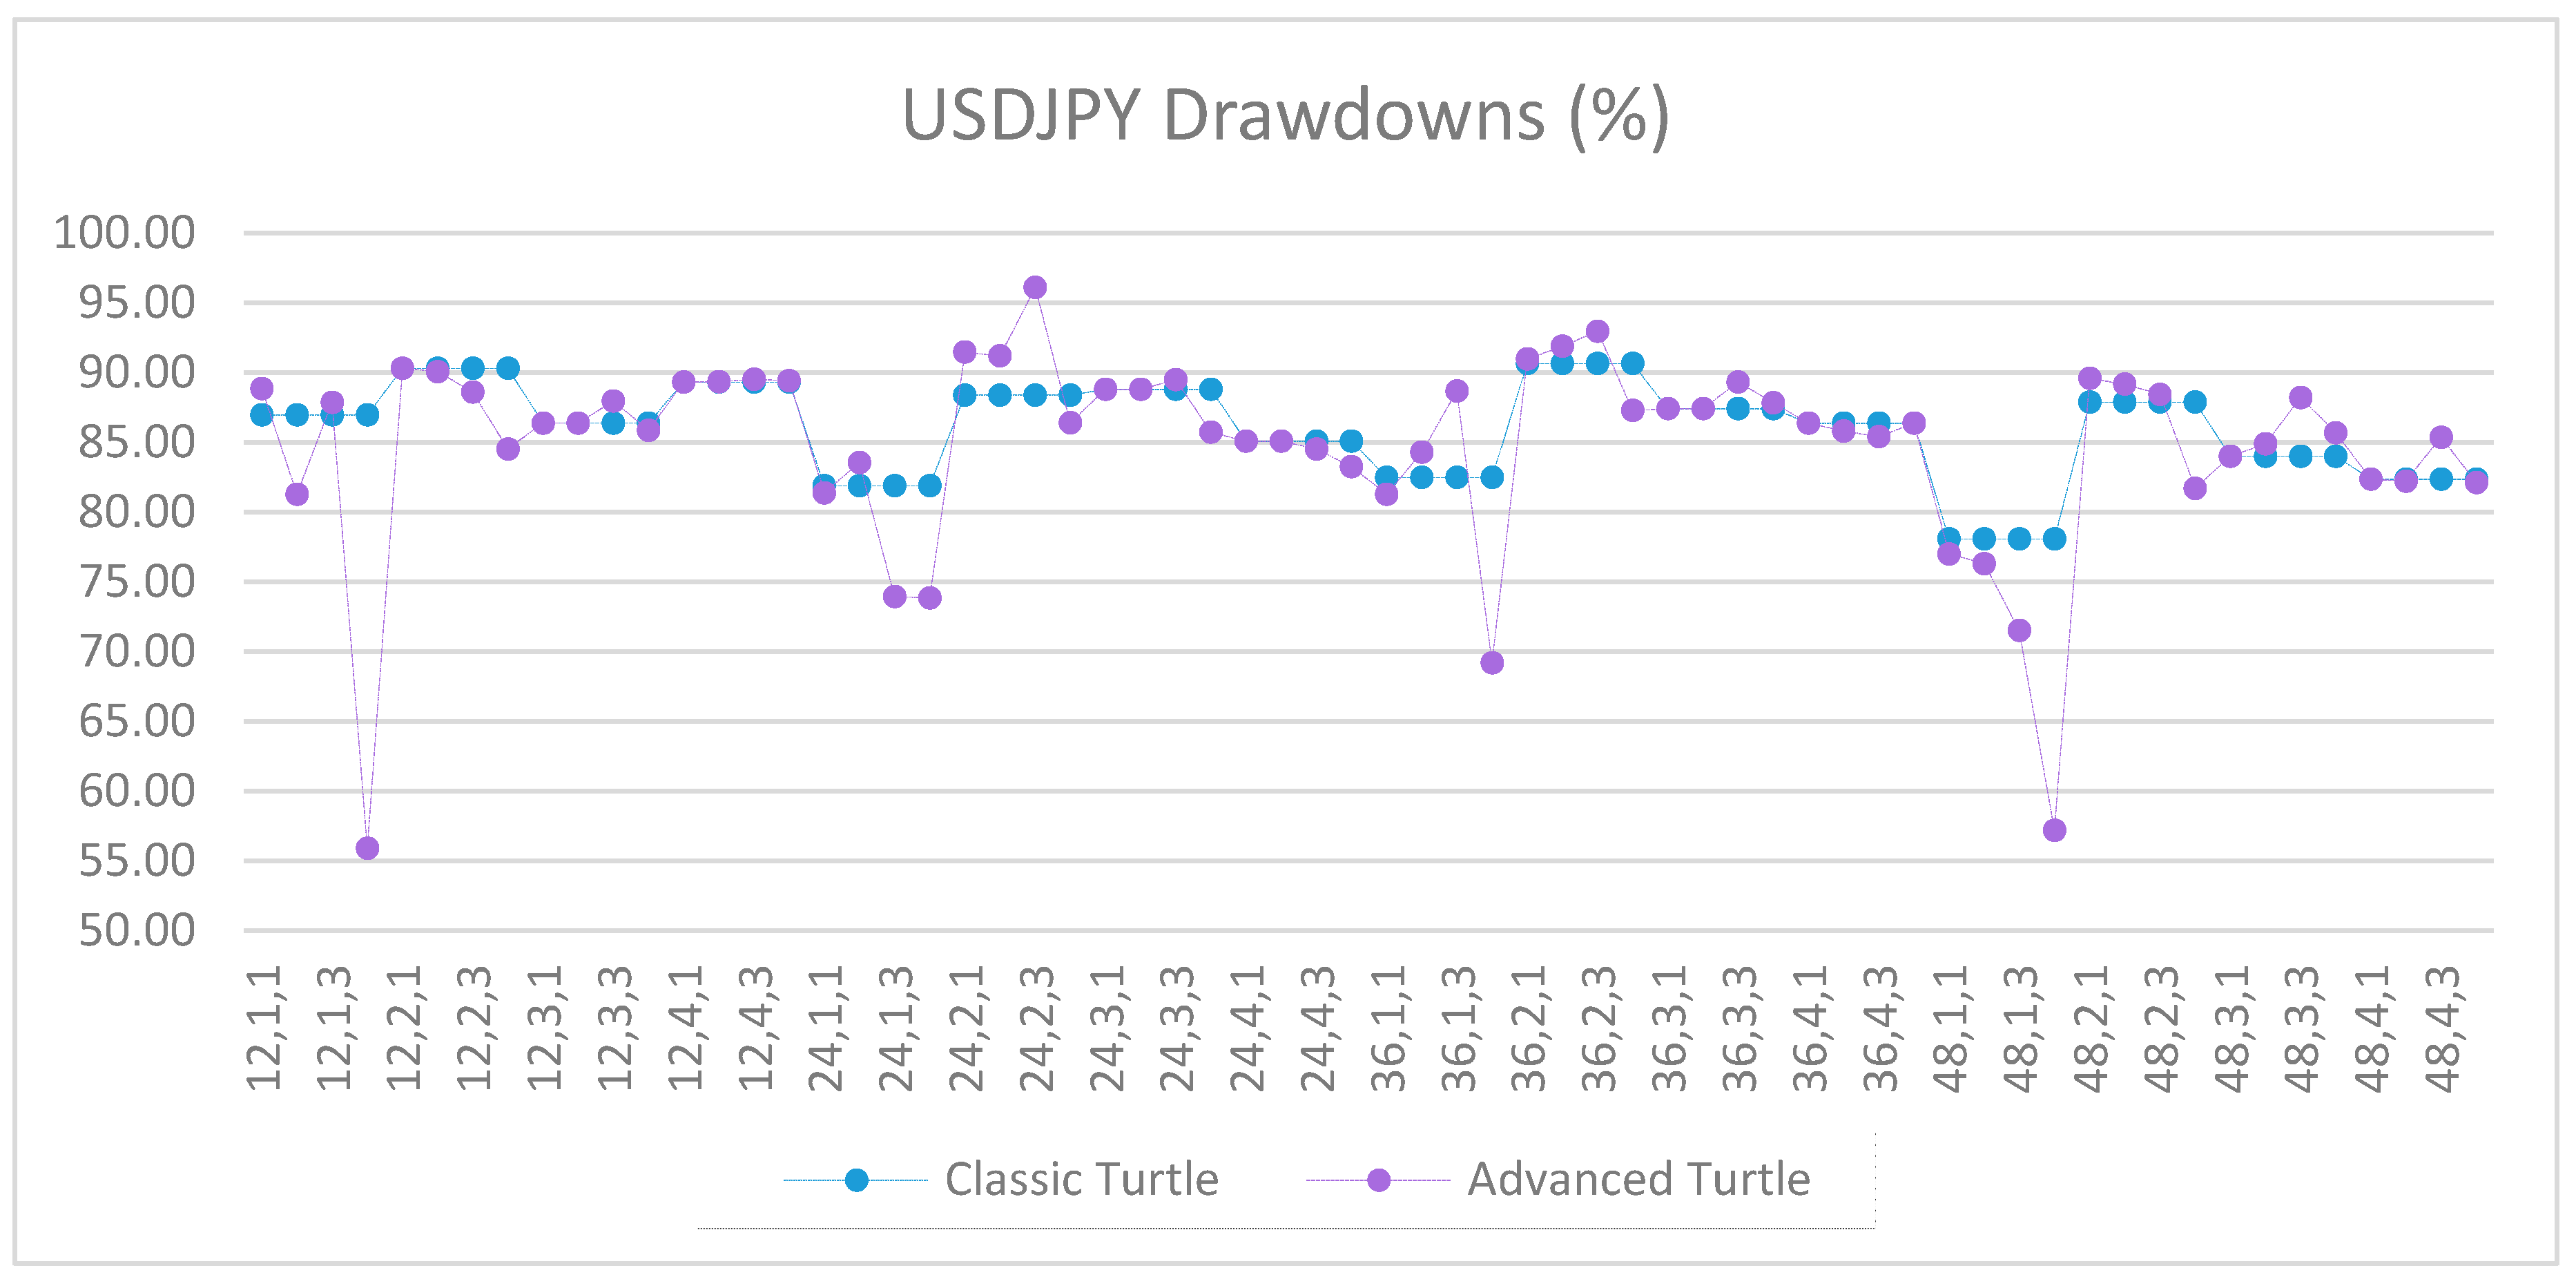
Figure A10.
Drawdowns of USDJPY as percentage of equity between the classic and the advanced Turtle systems for every combination of N, X, Y for the fast parameters (20, 40).
Figure A10.
Drawdowns of USDJPY as percentage of equity between the classic and the advanced Turtle systems for every combination of N, X, Y for the fast parameters (20, 40).
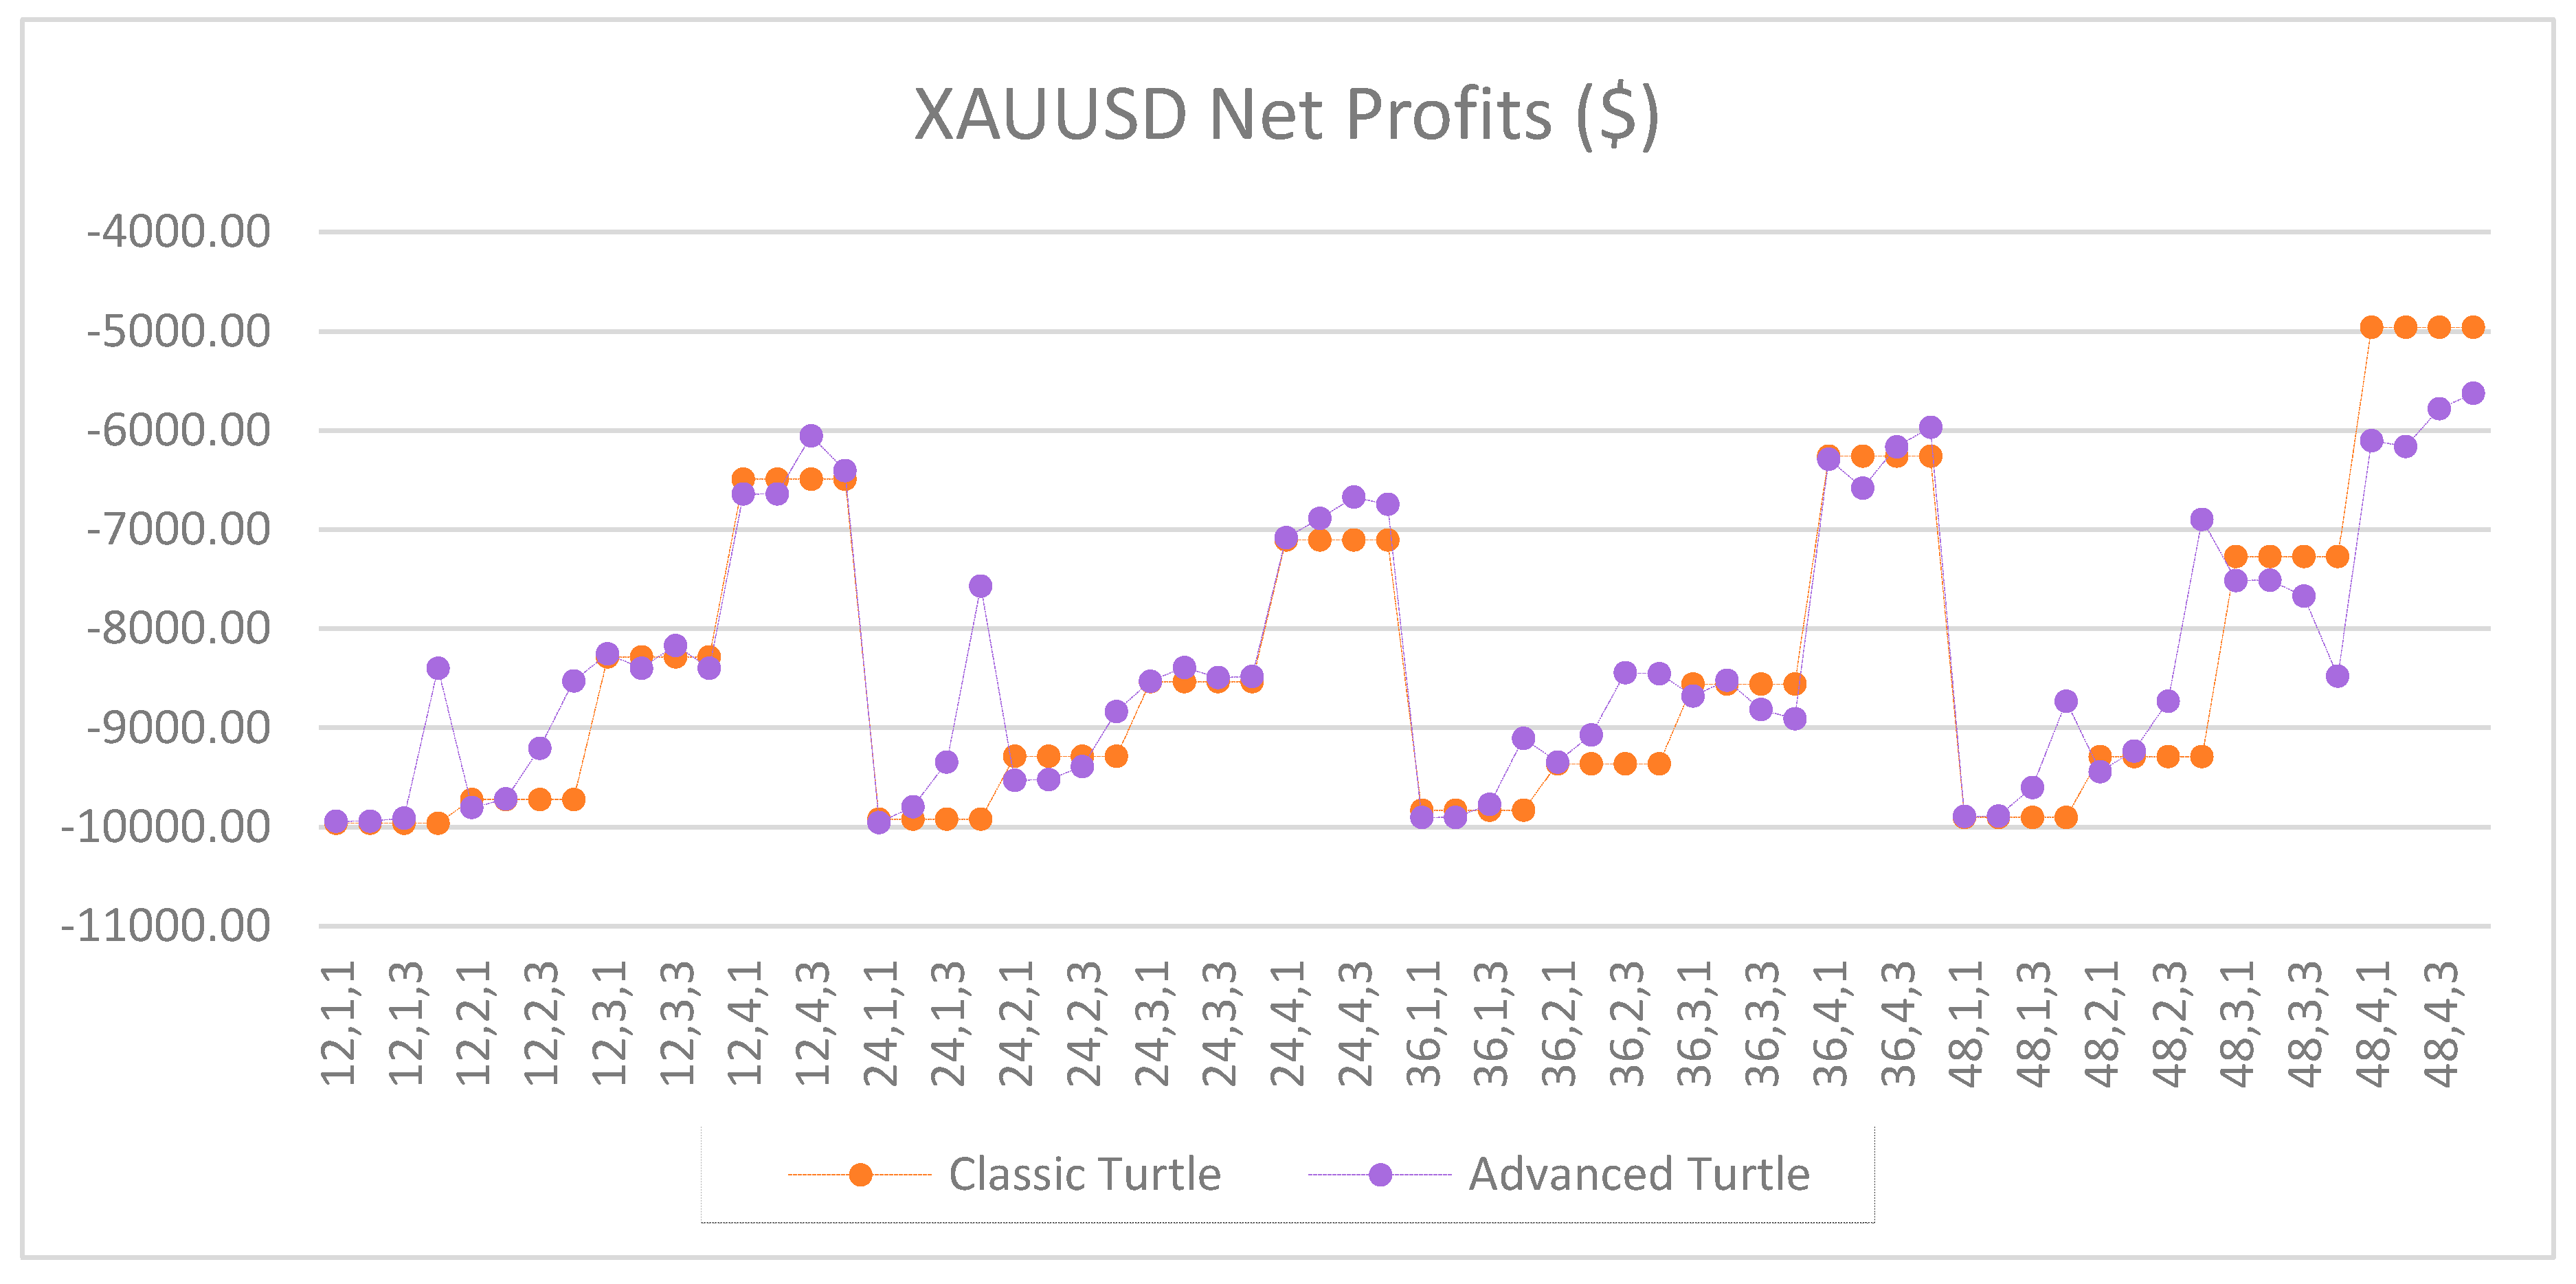
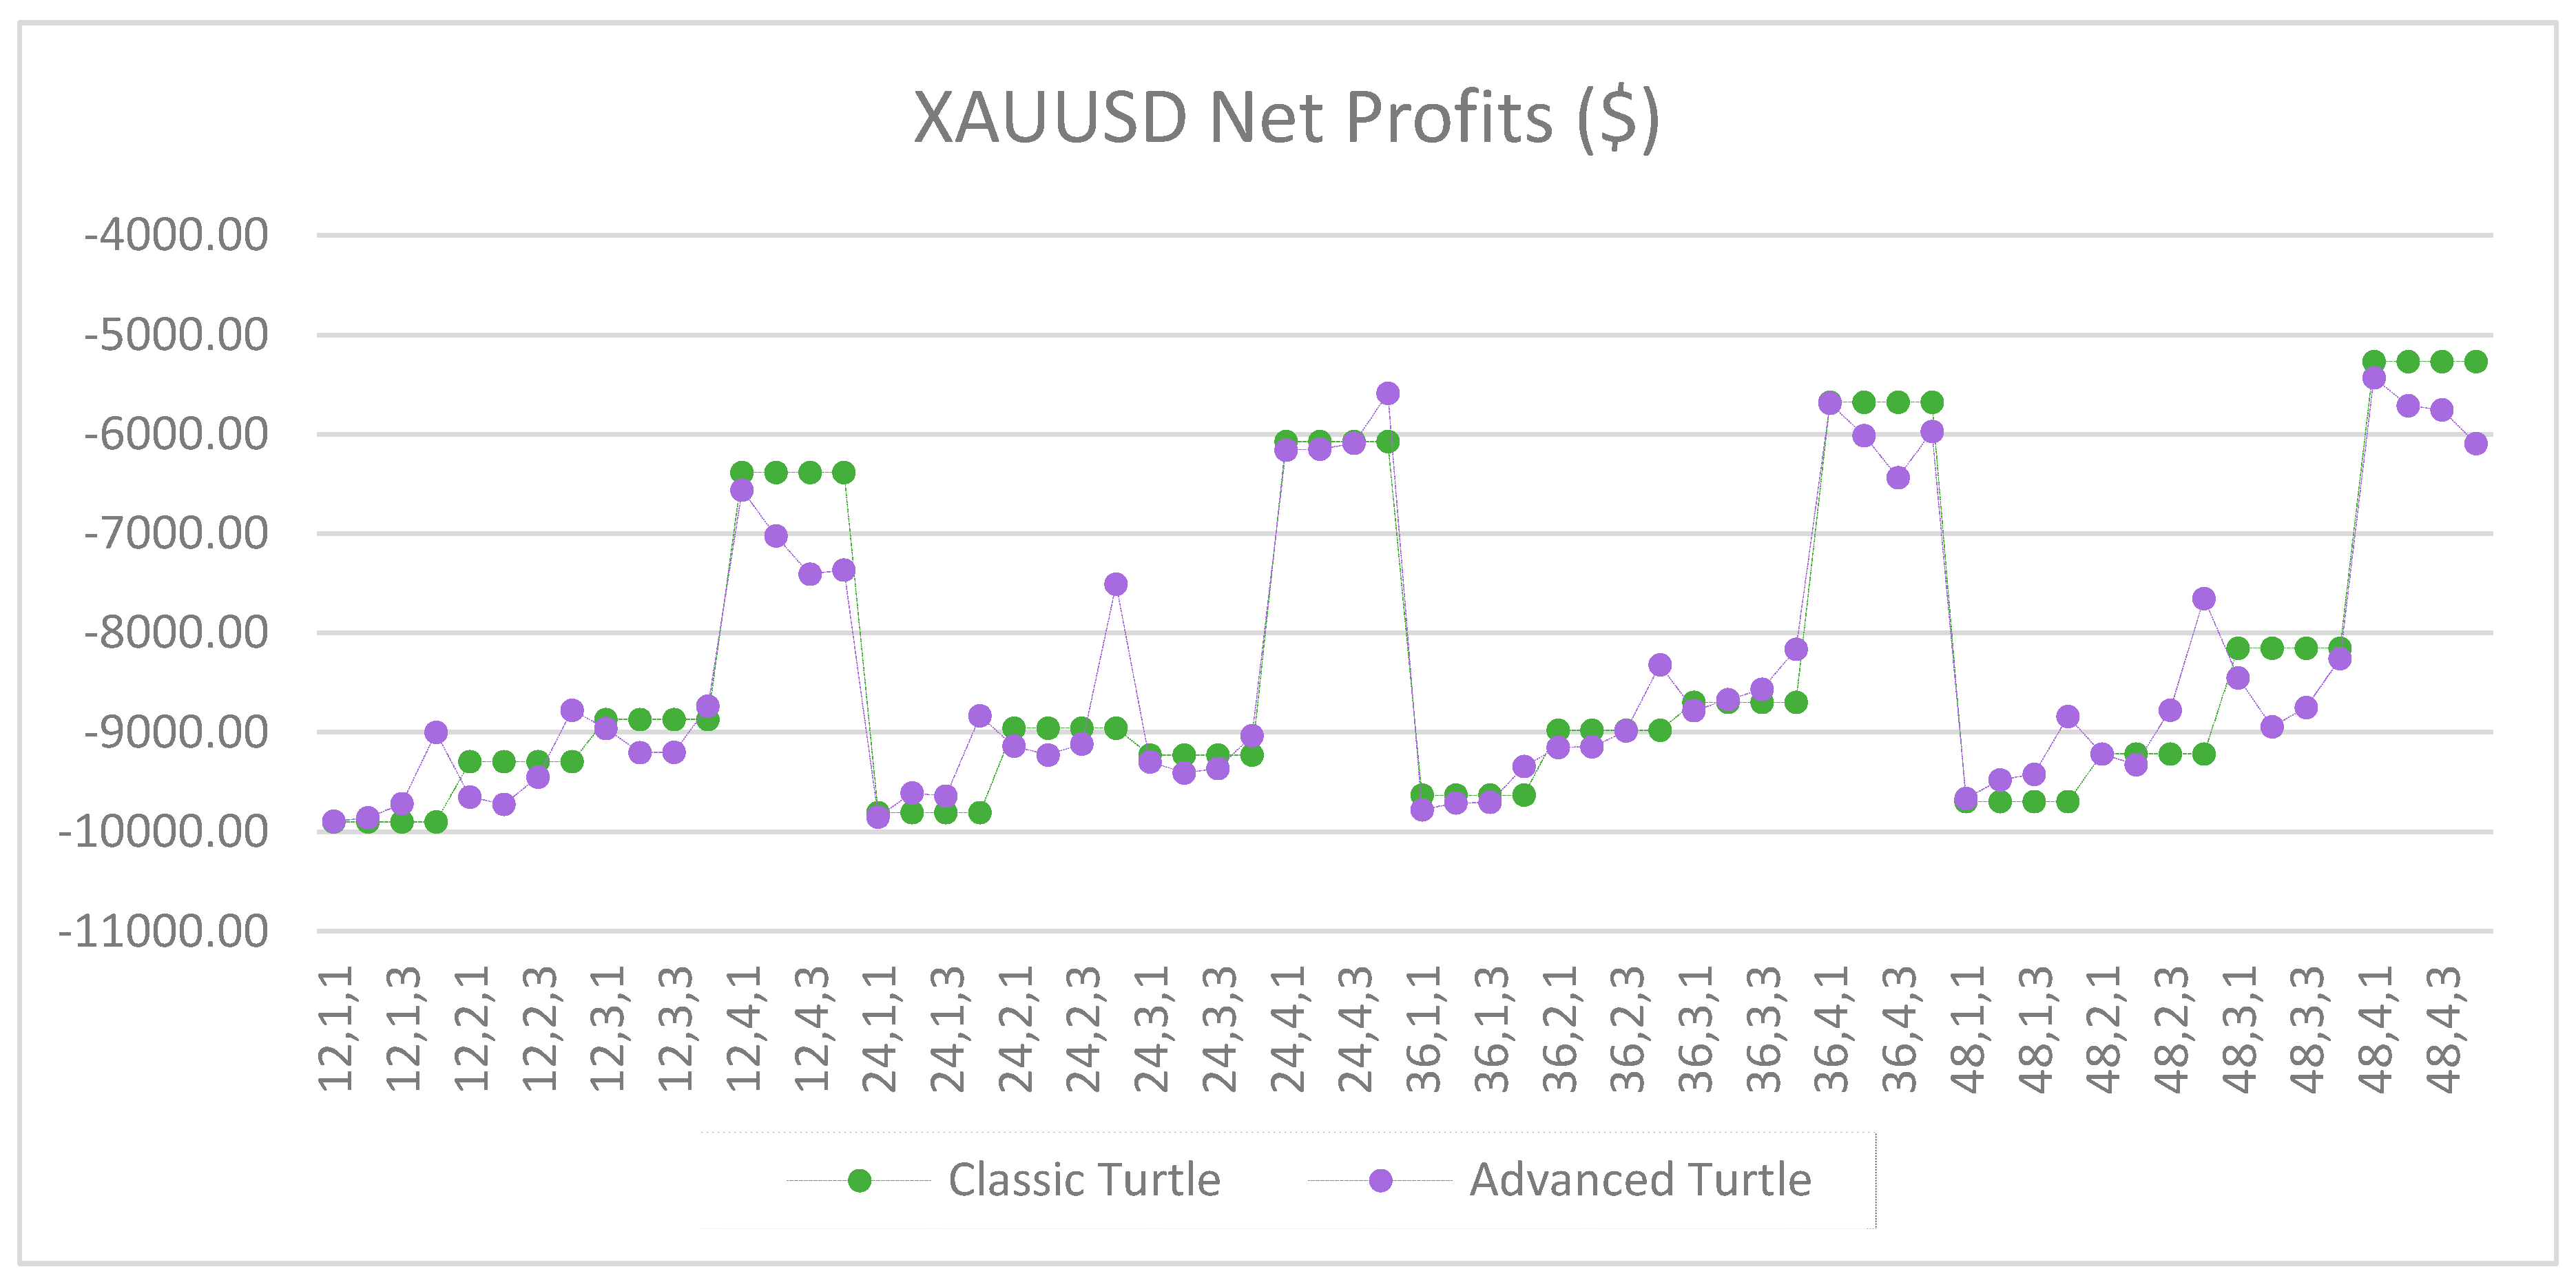
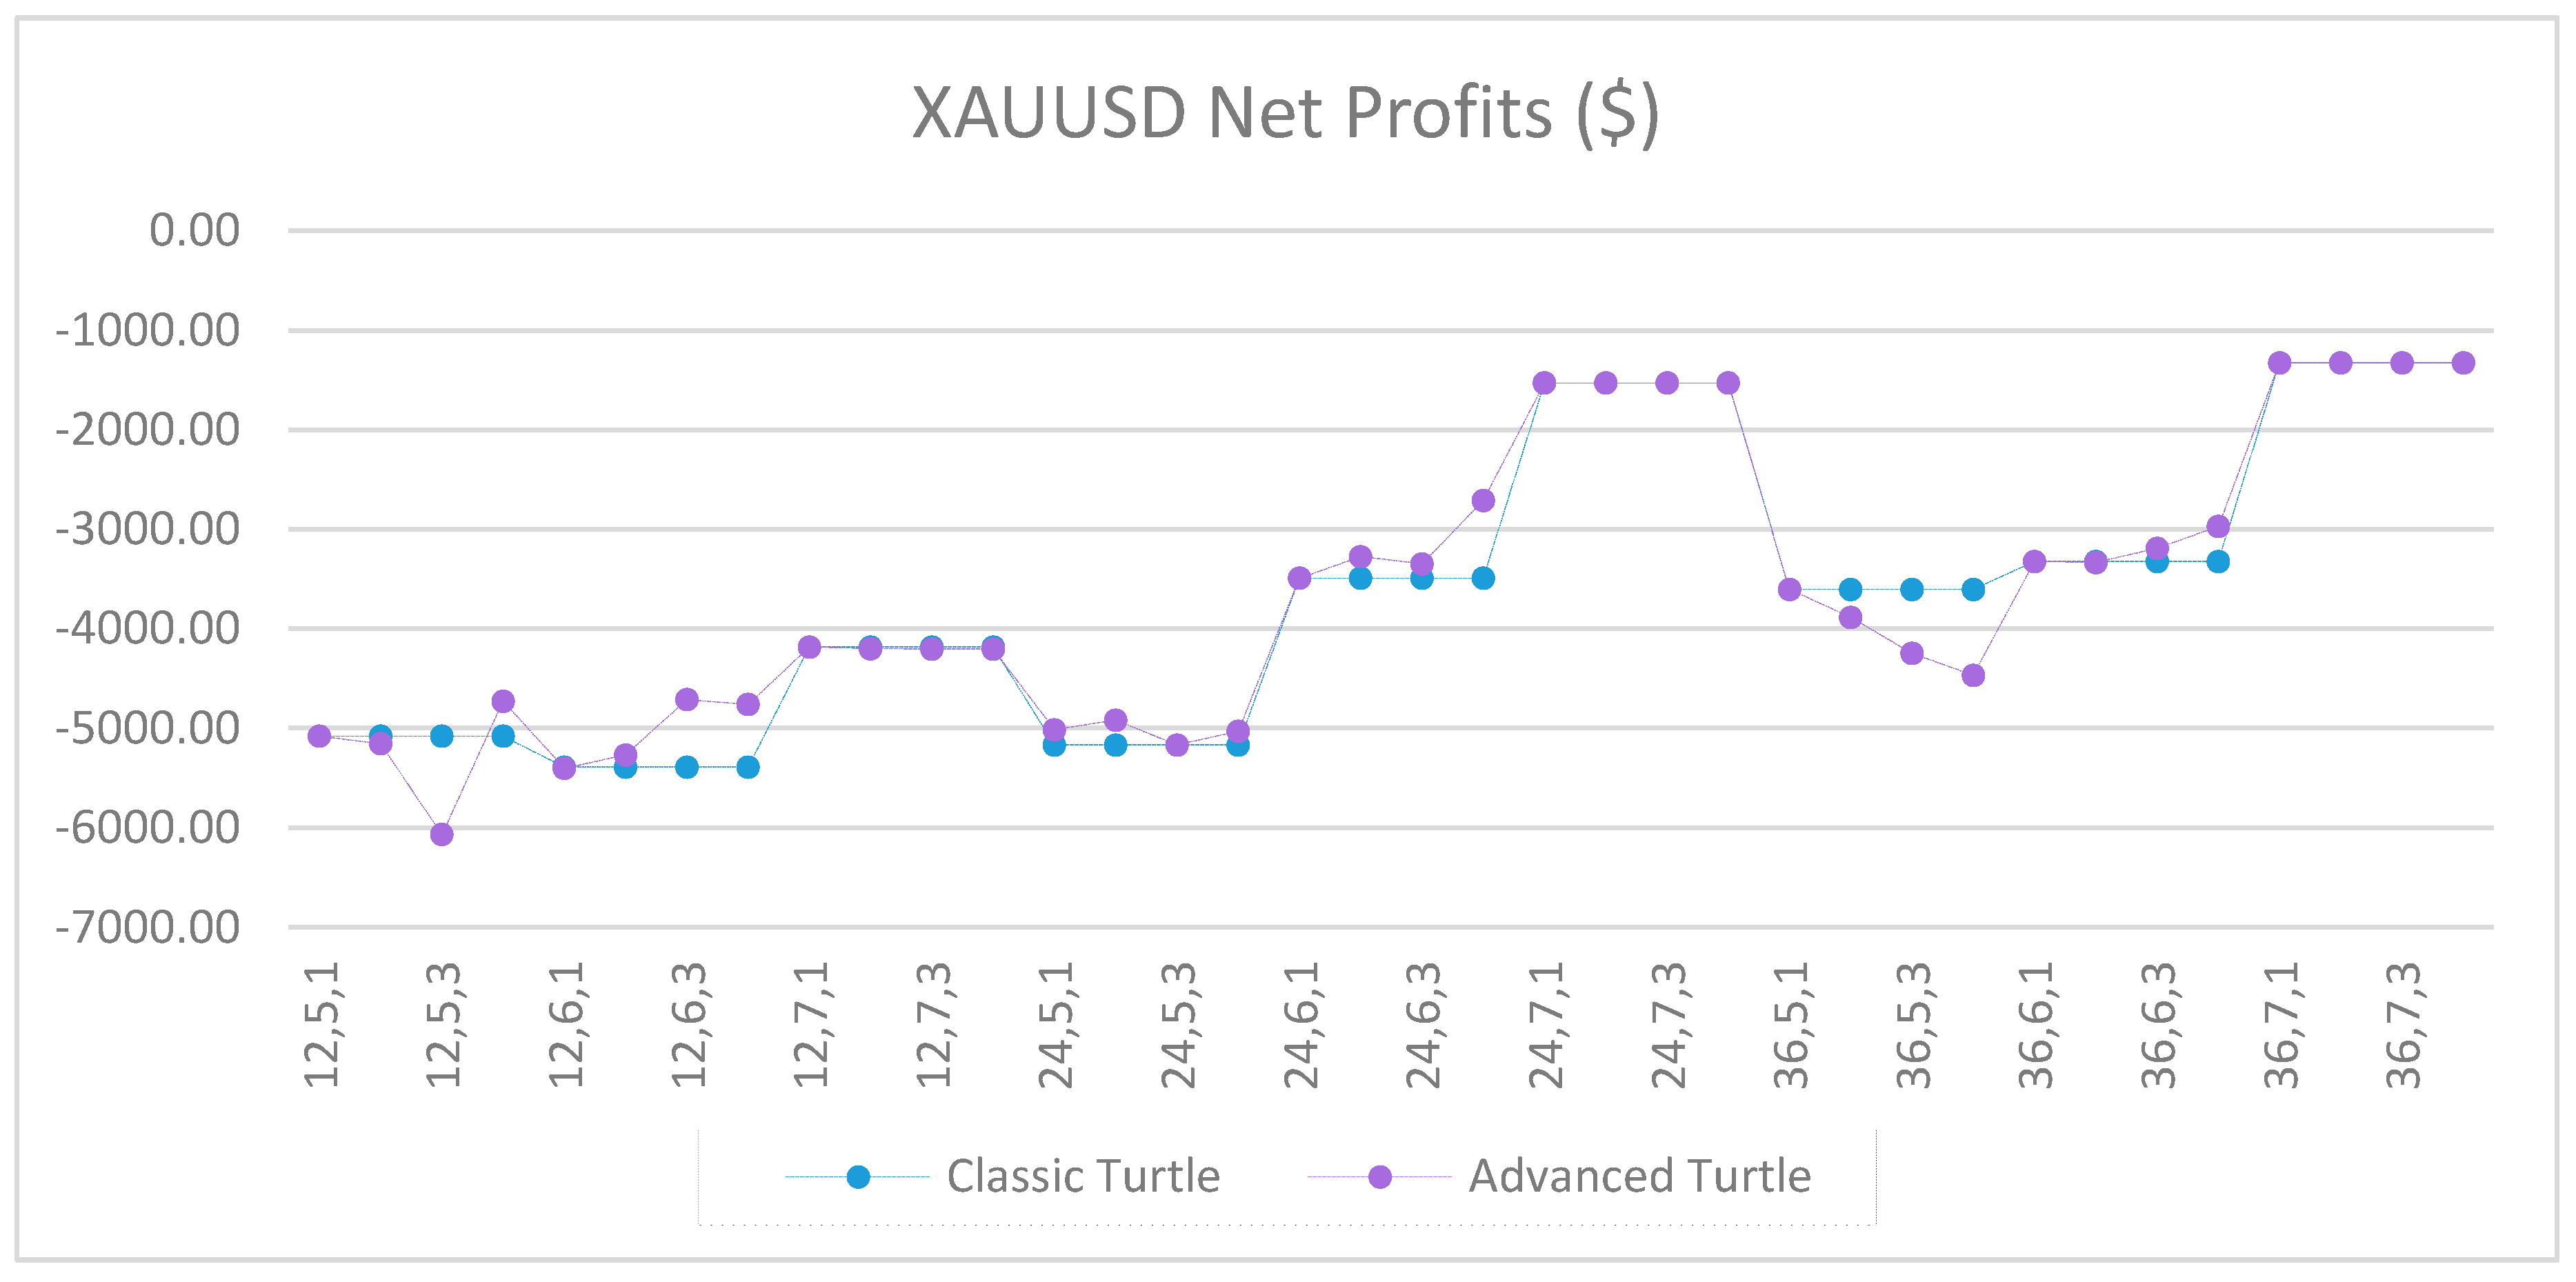
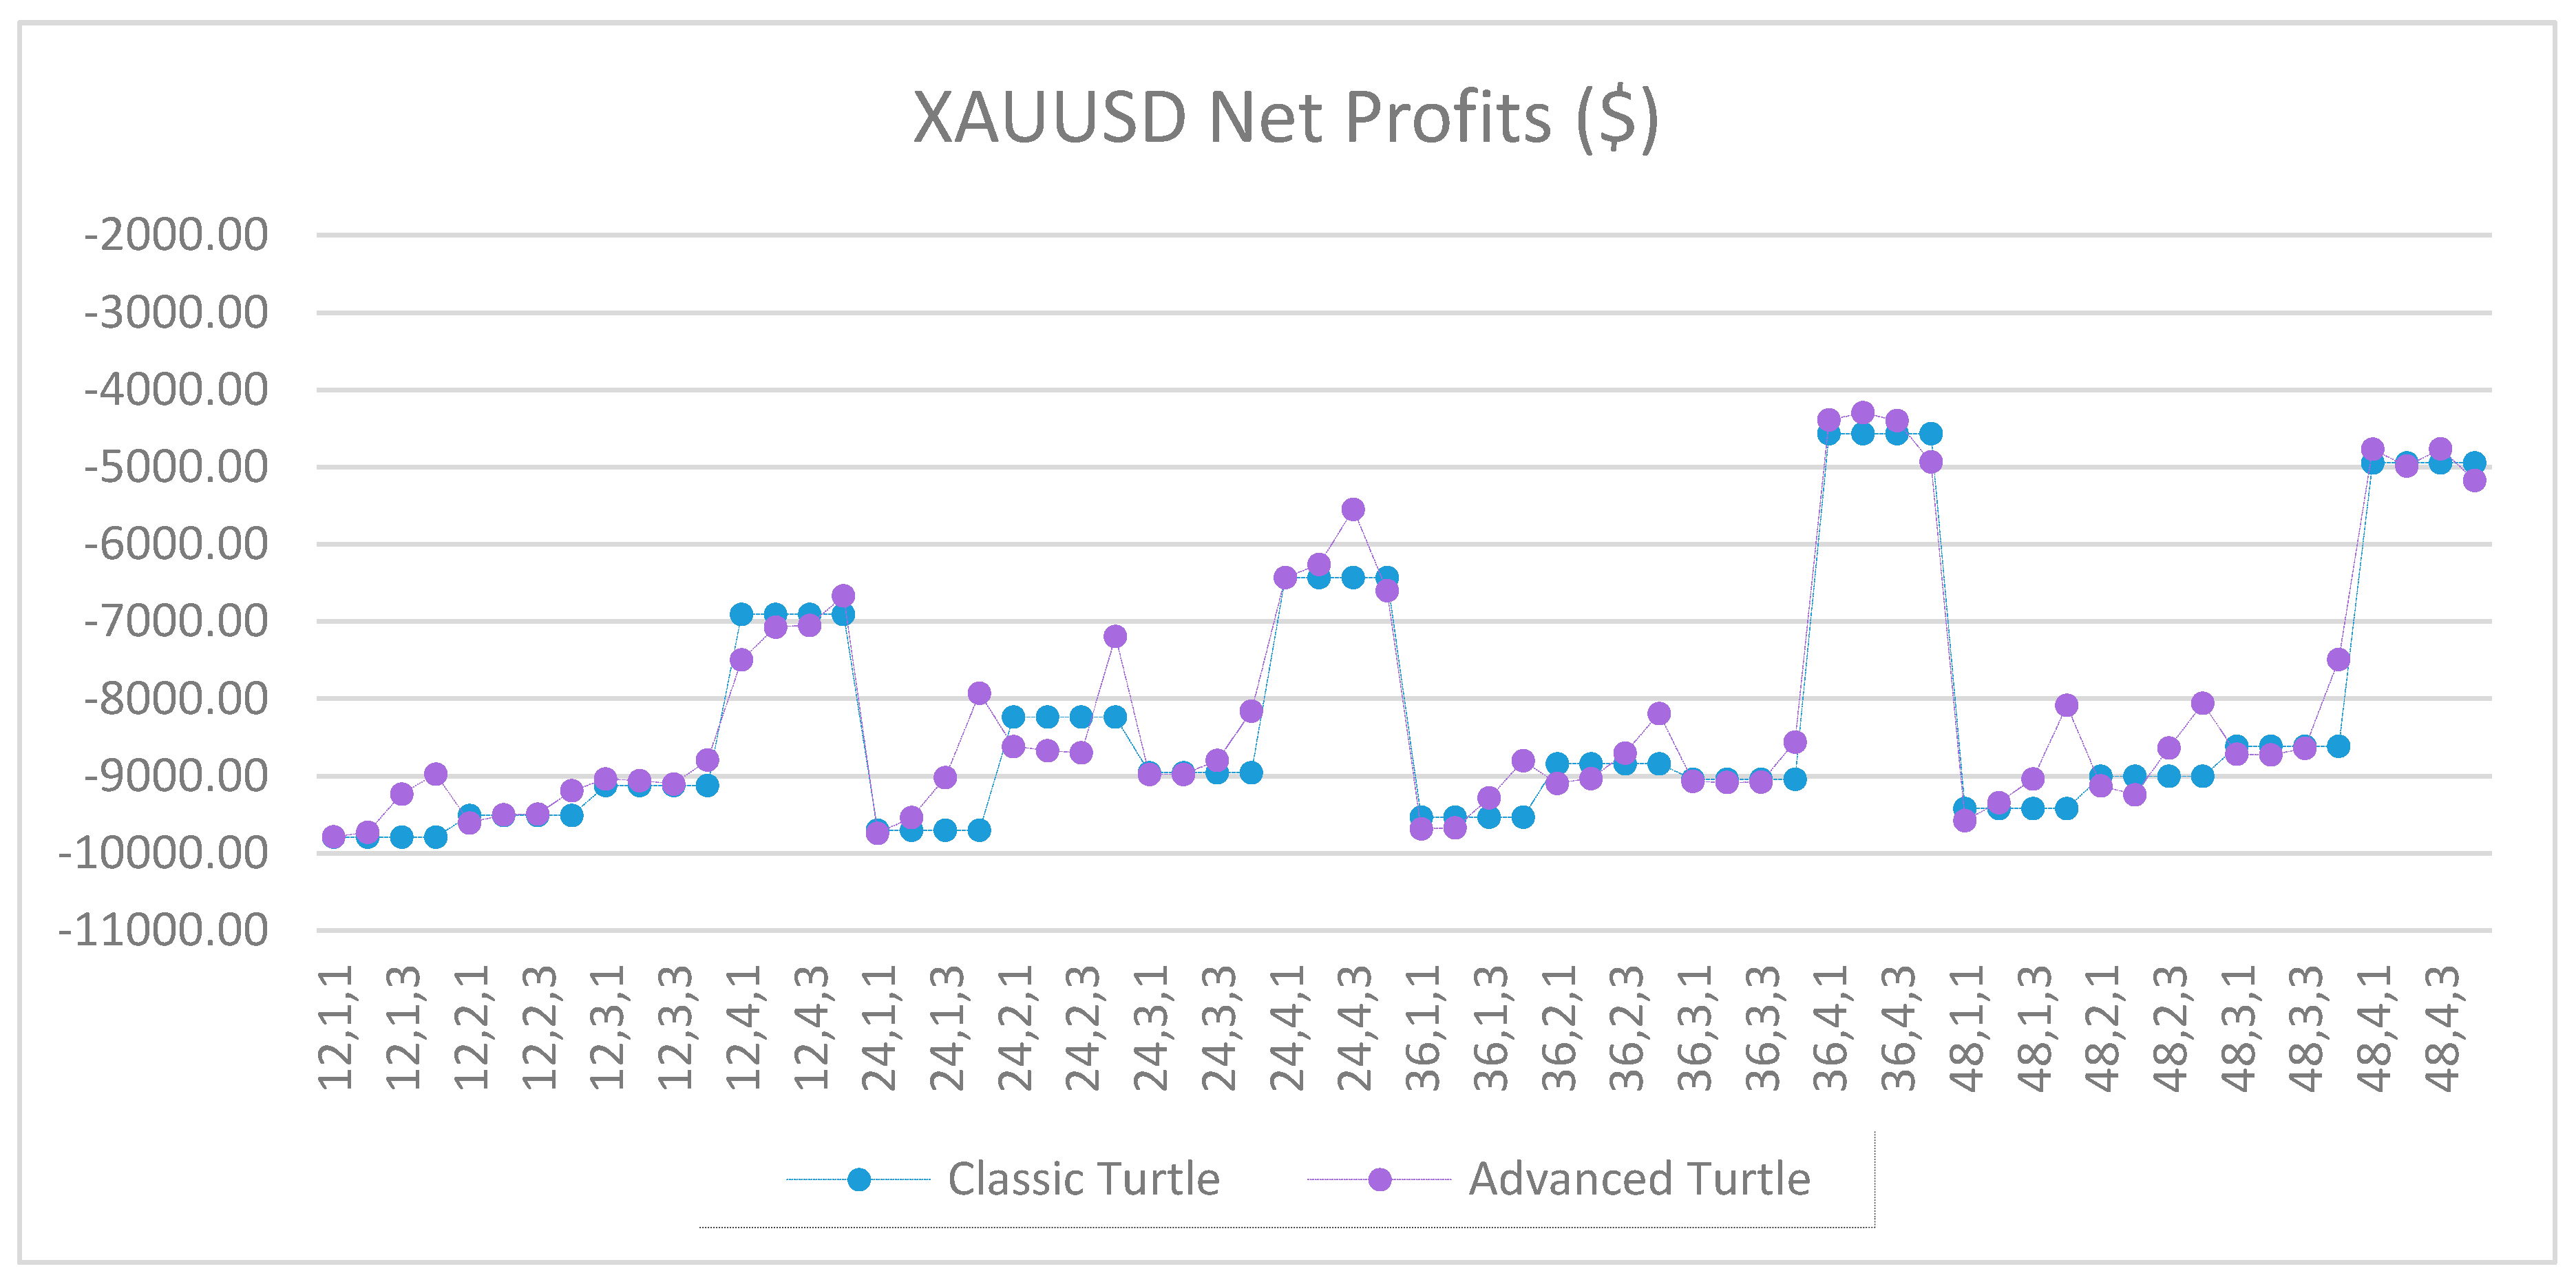
Figure A11.
Net profits of XAUUSD between the classic and the advanced Turtle systems for every combination of N, X, Y for the fast parameters (20, 40).
Figure A11.
Net profits of XAUUSD between the classic and the advanced Turtle systems for every combination of N, X, Y for the fast parameters (20, 40).
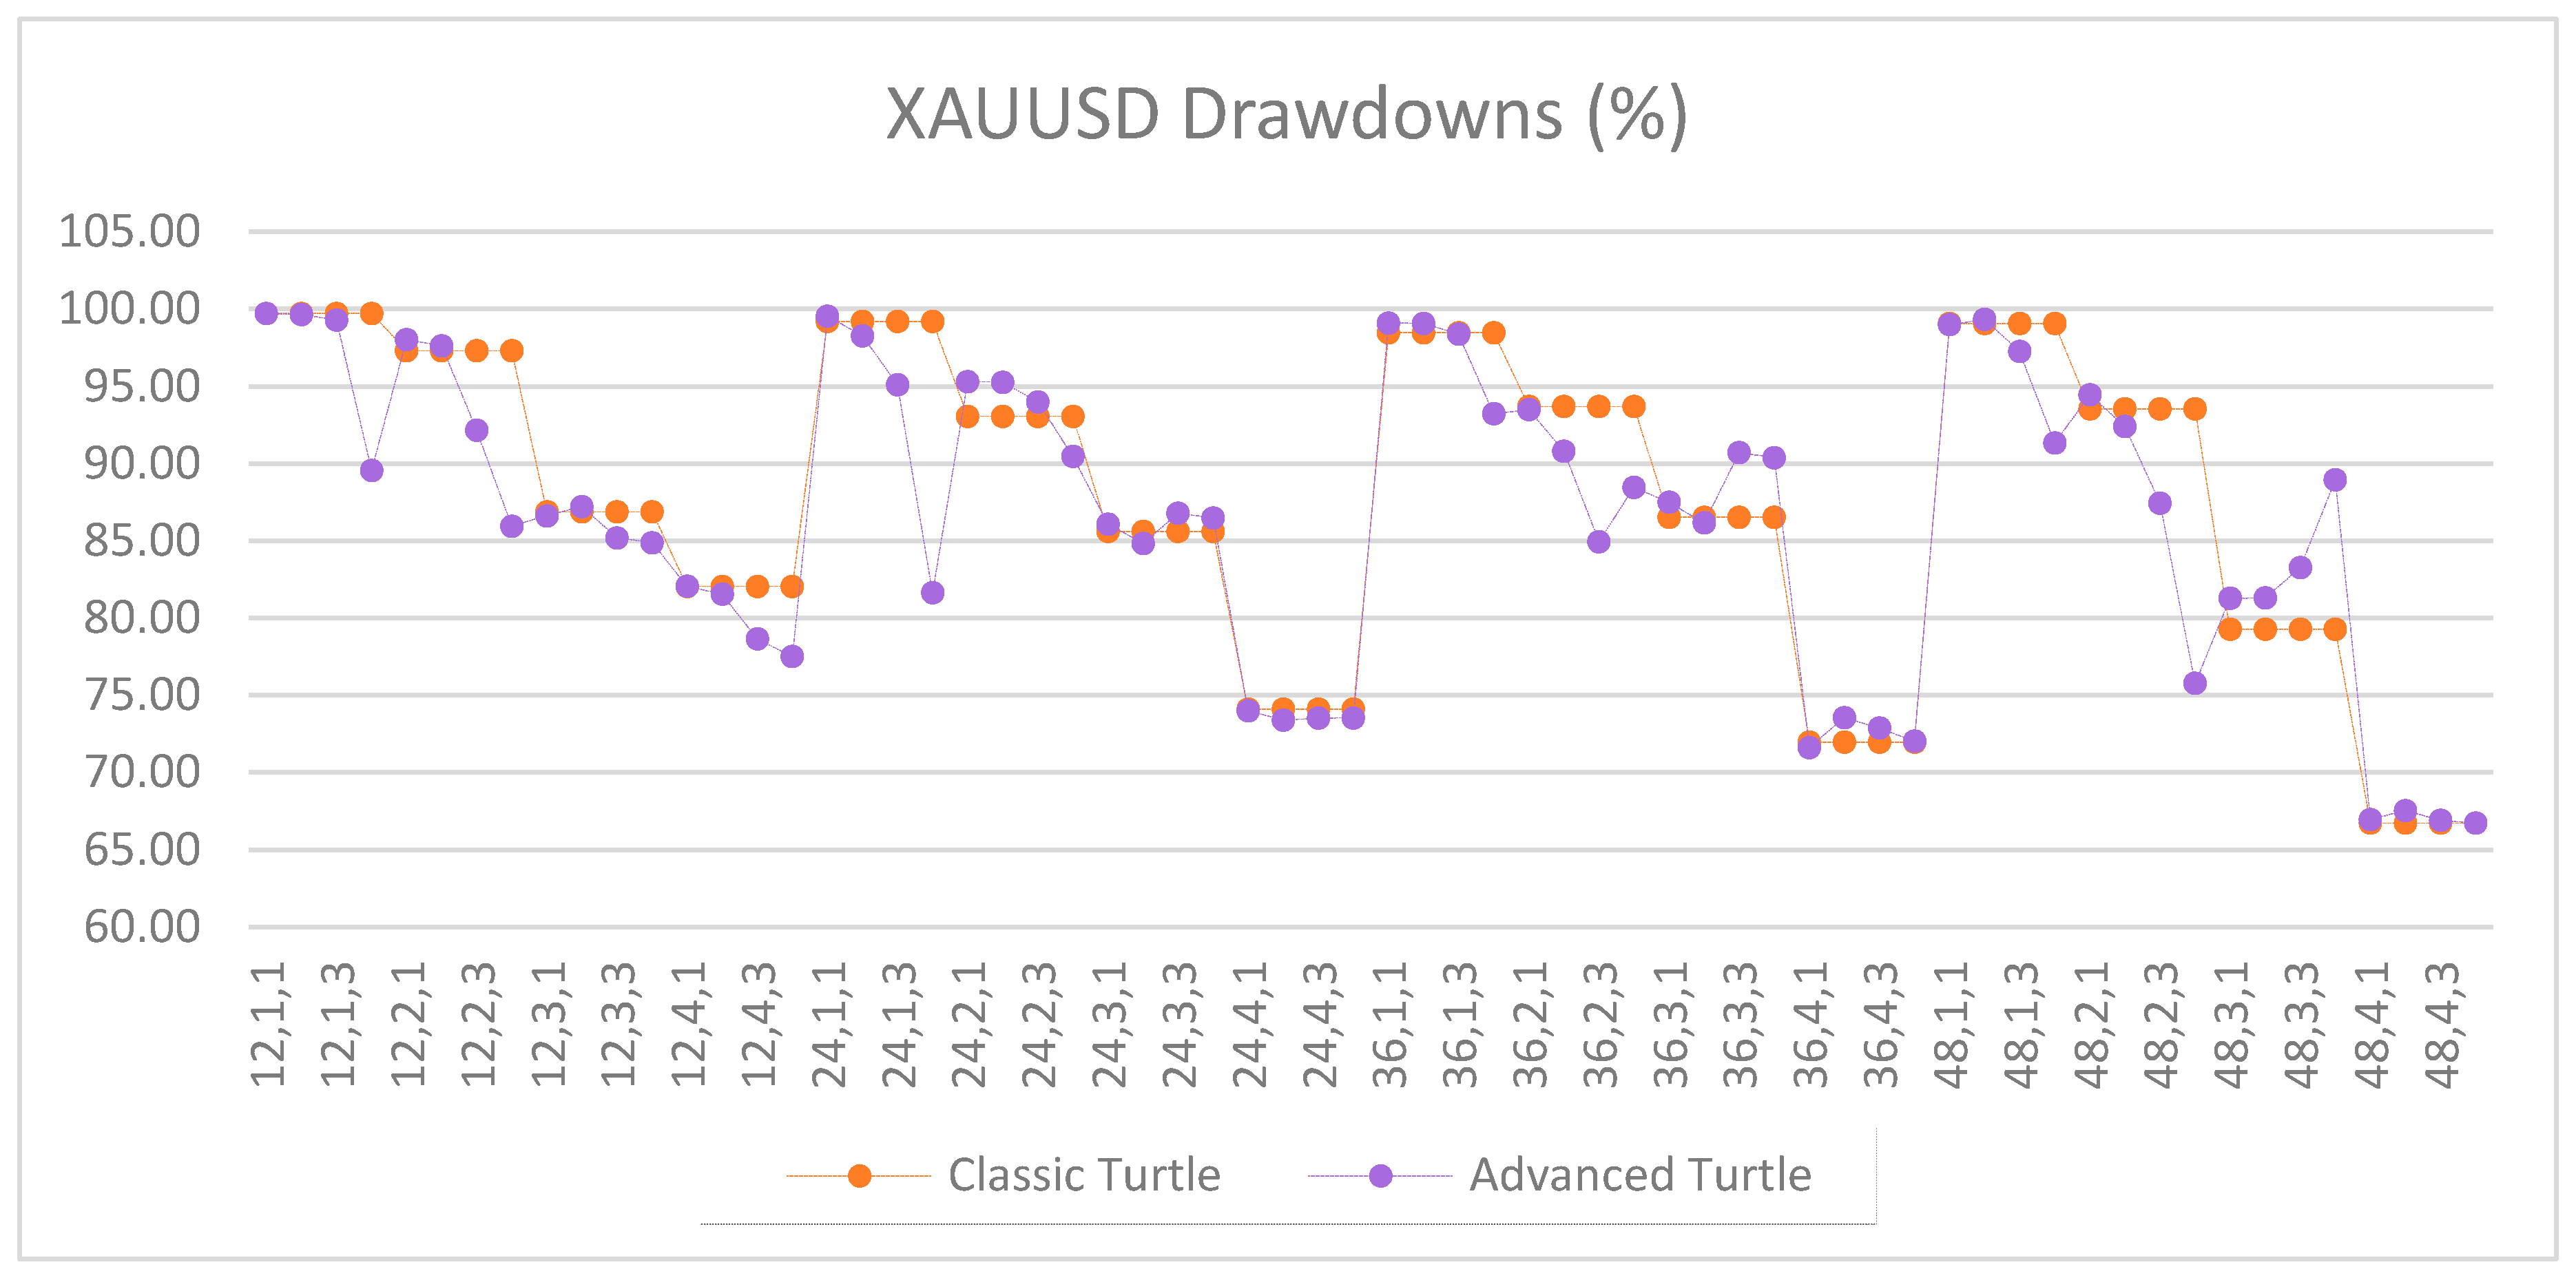
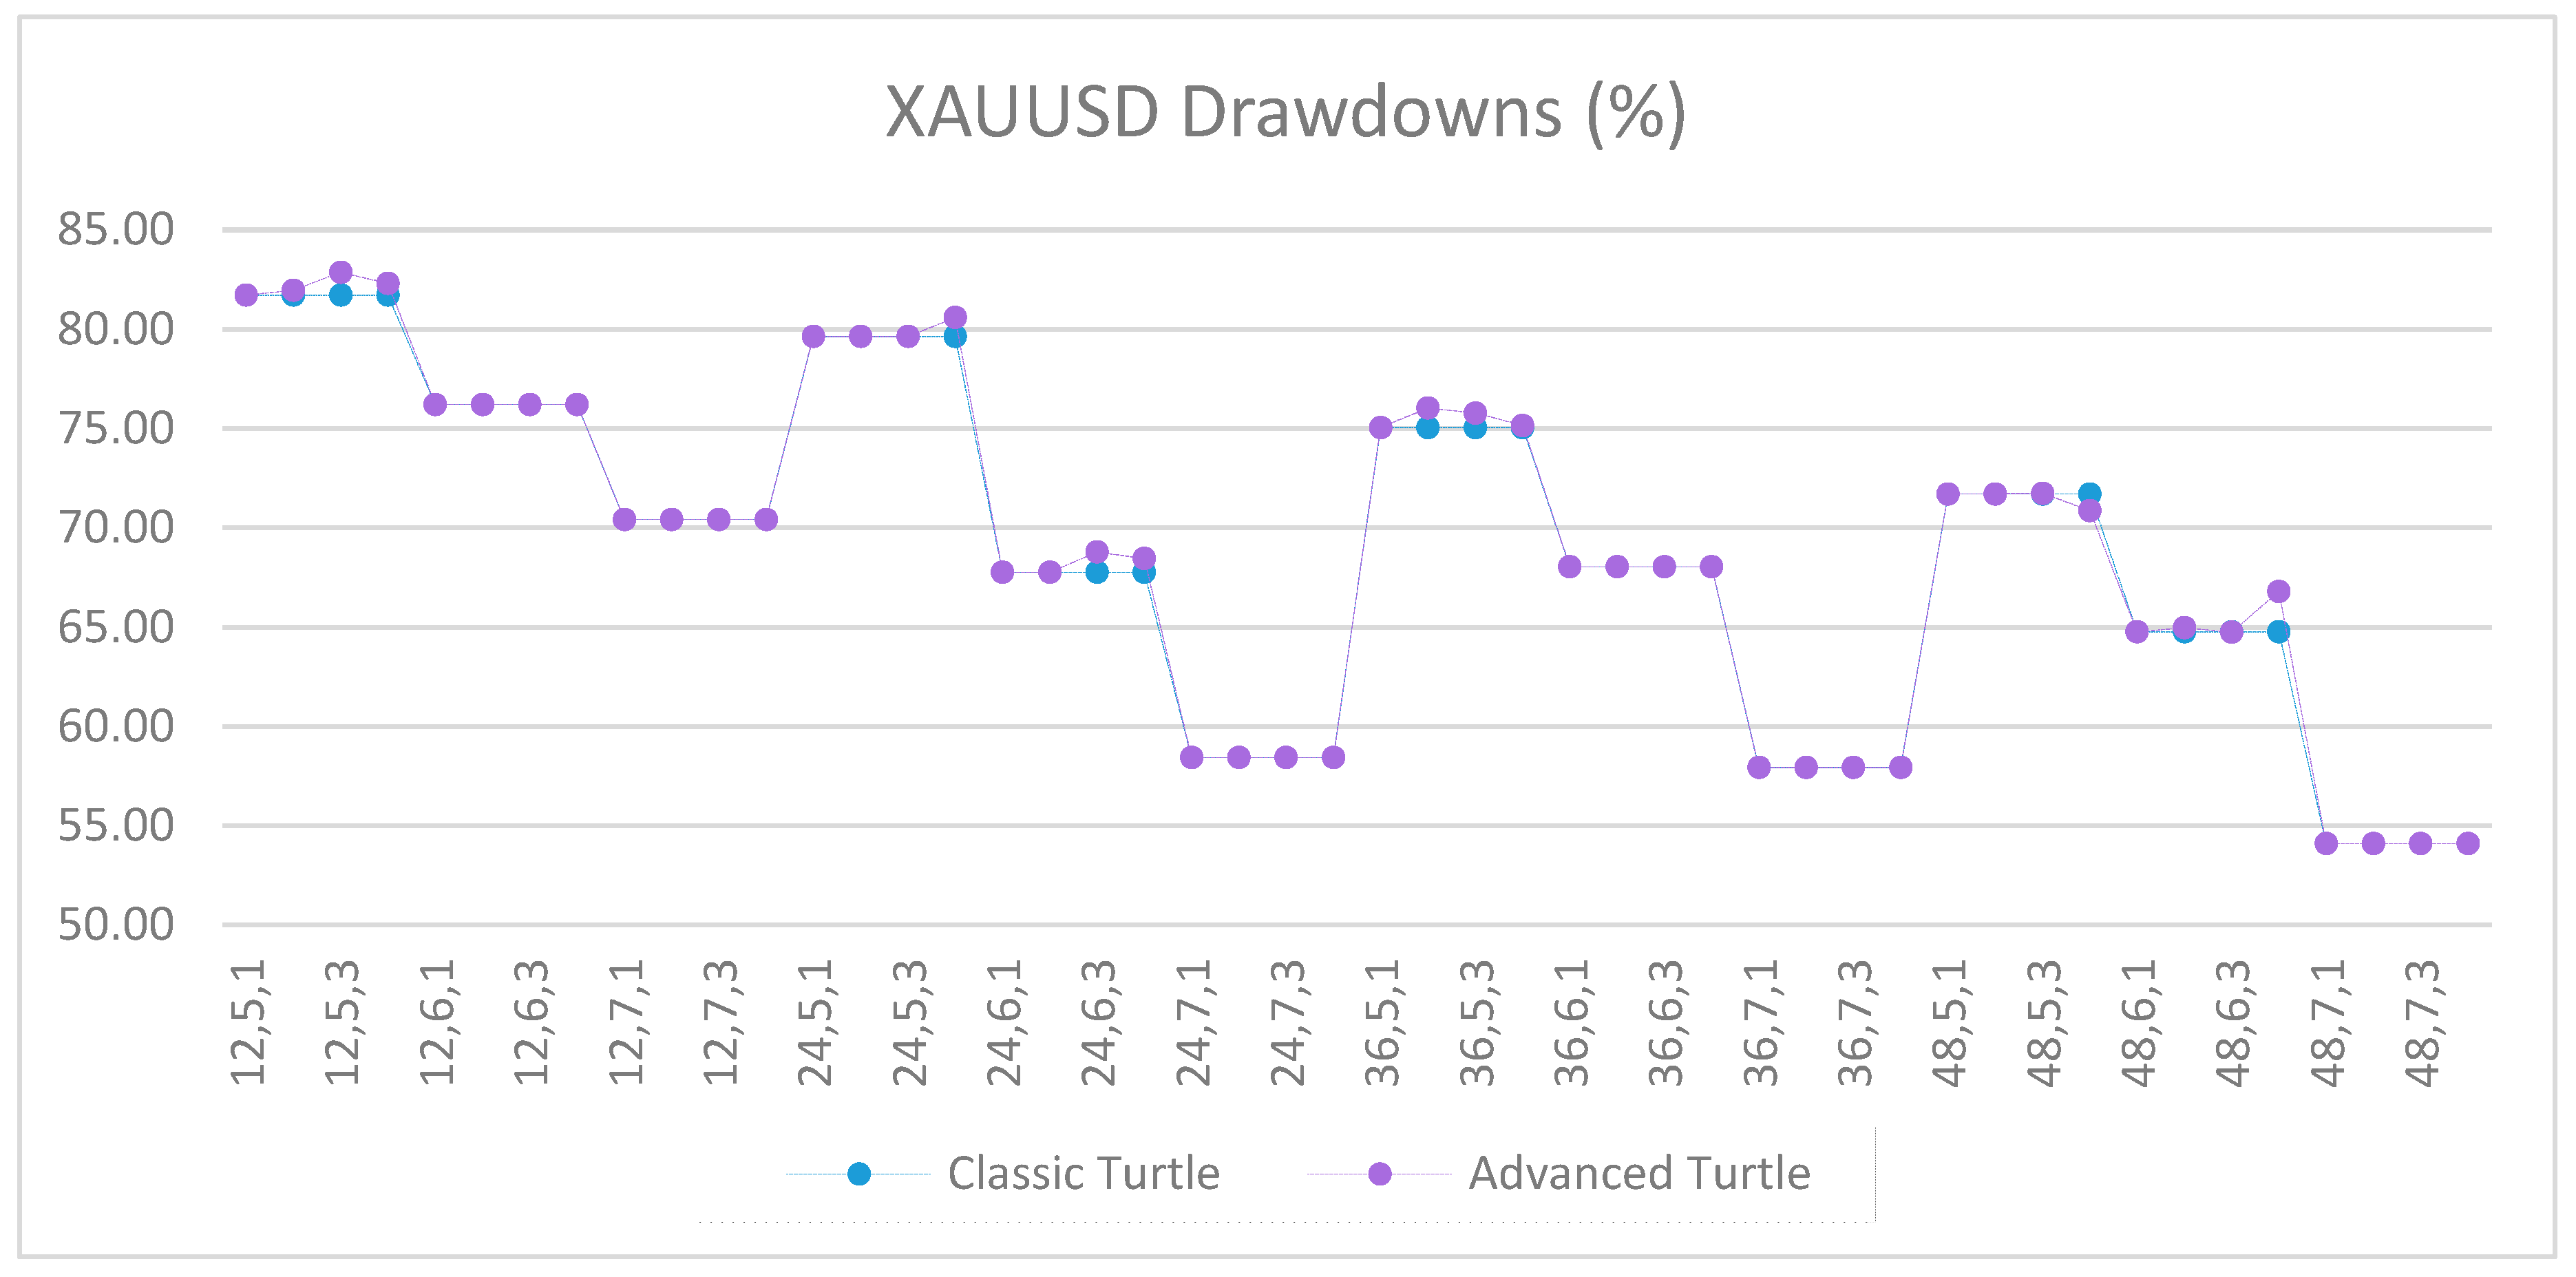
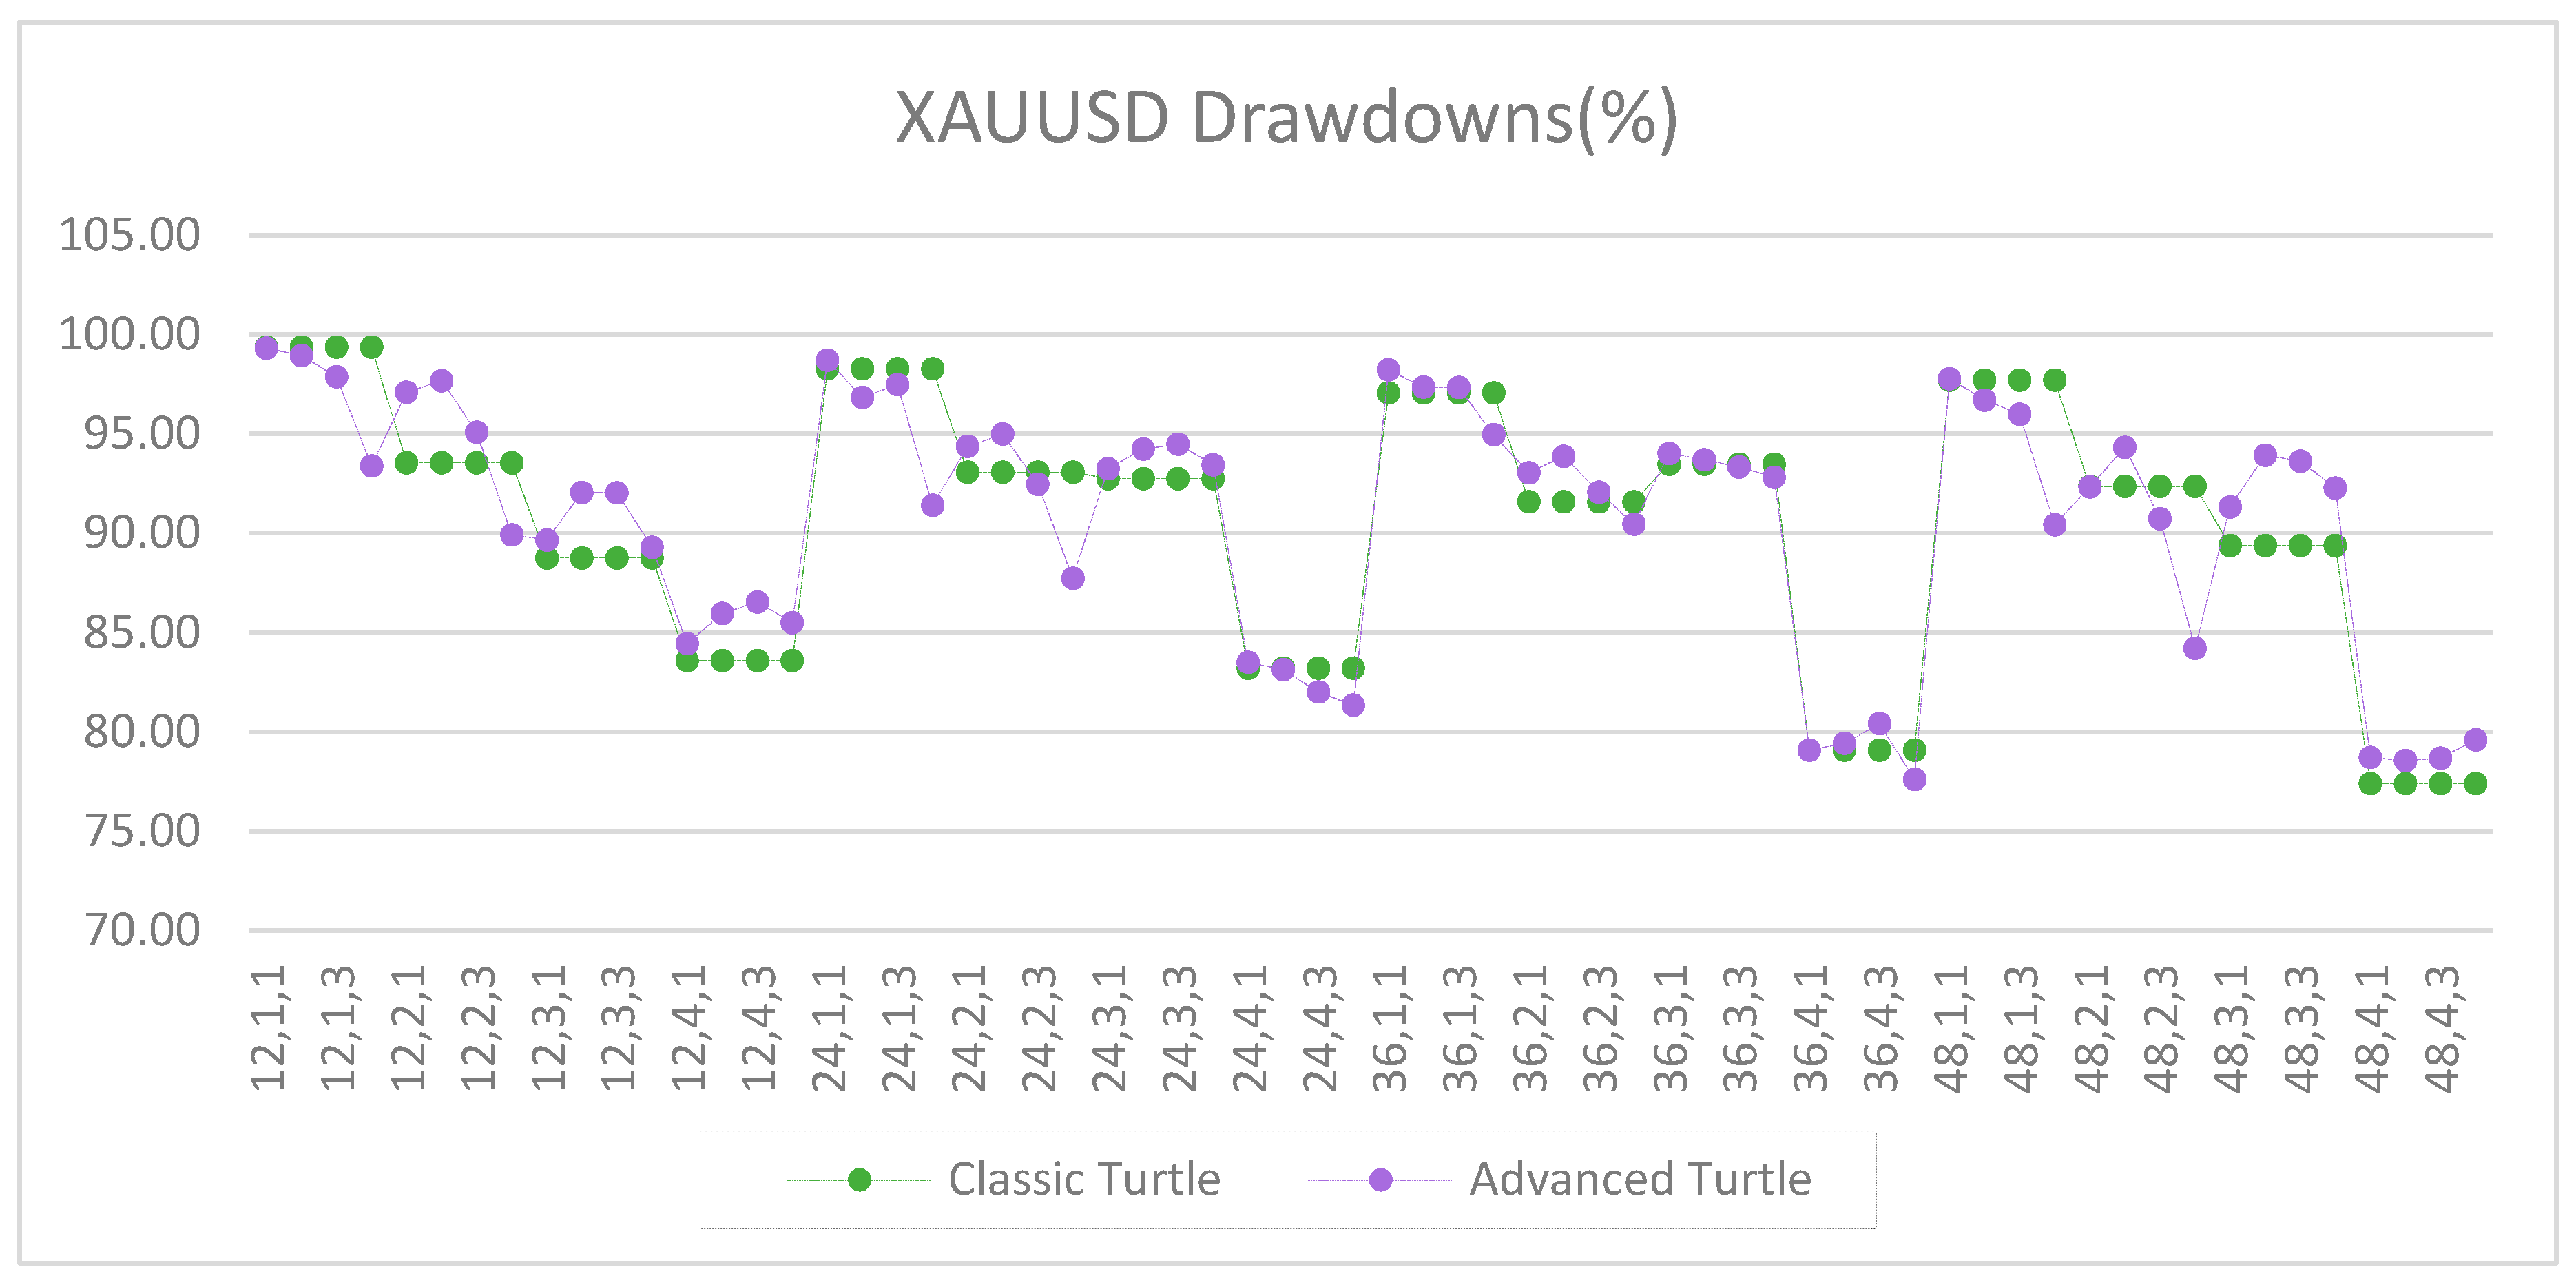
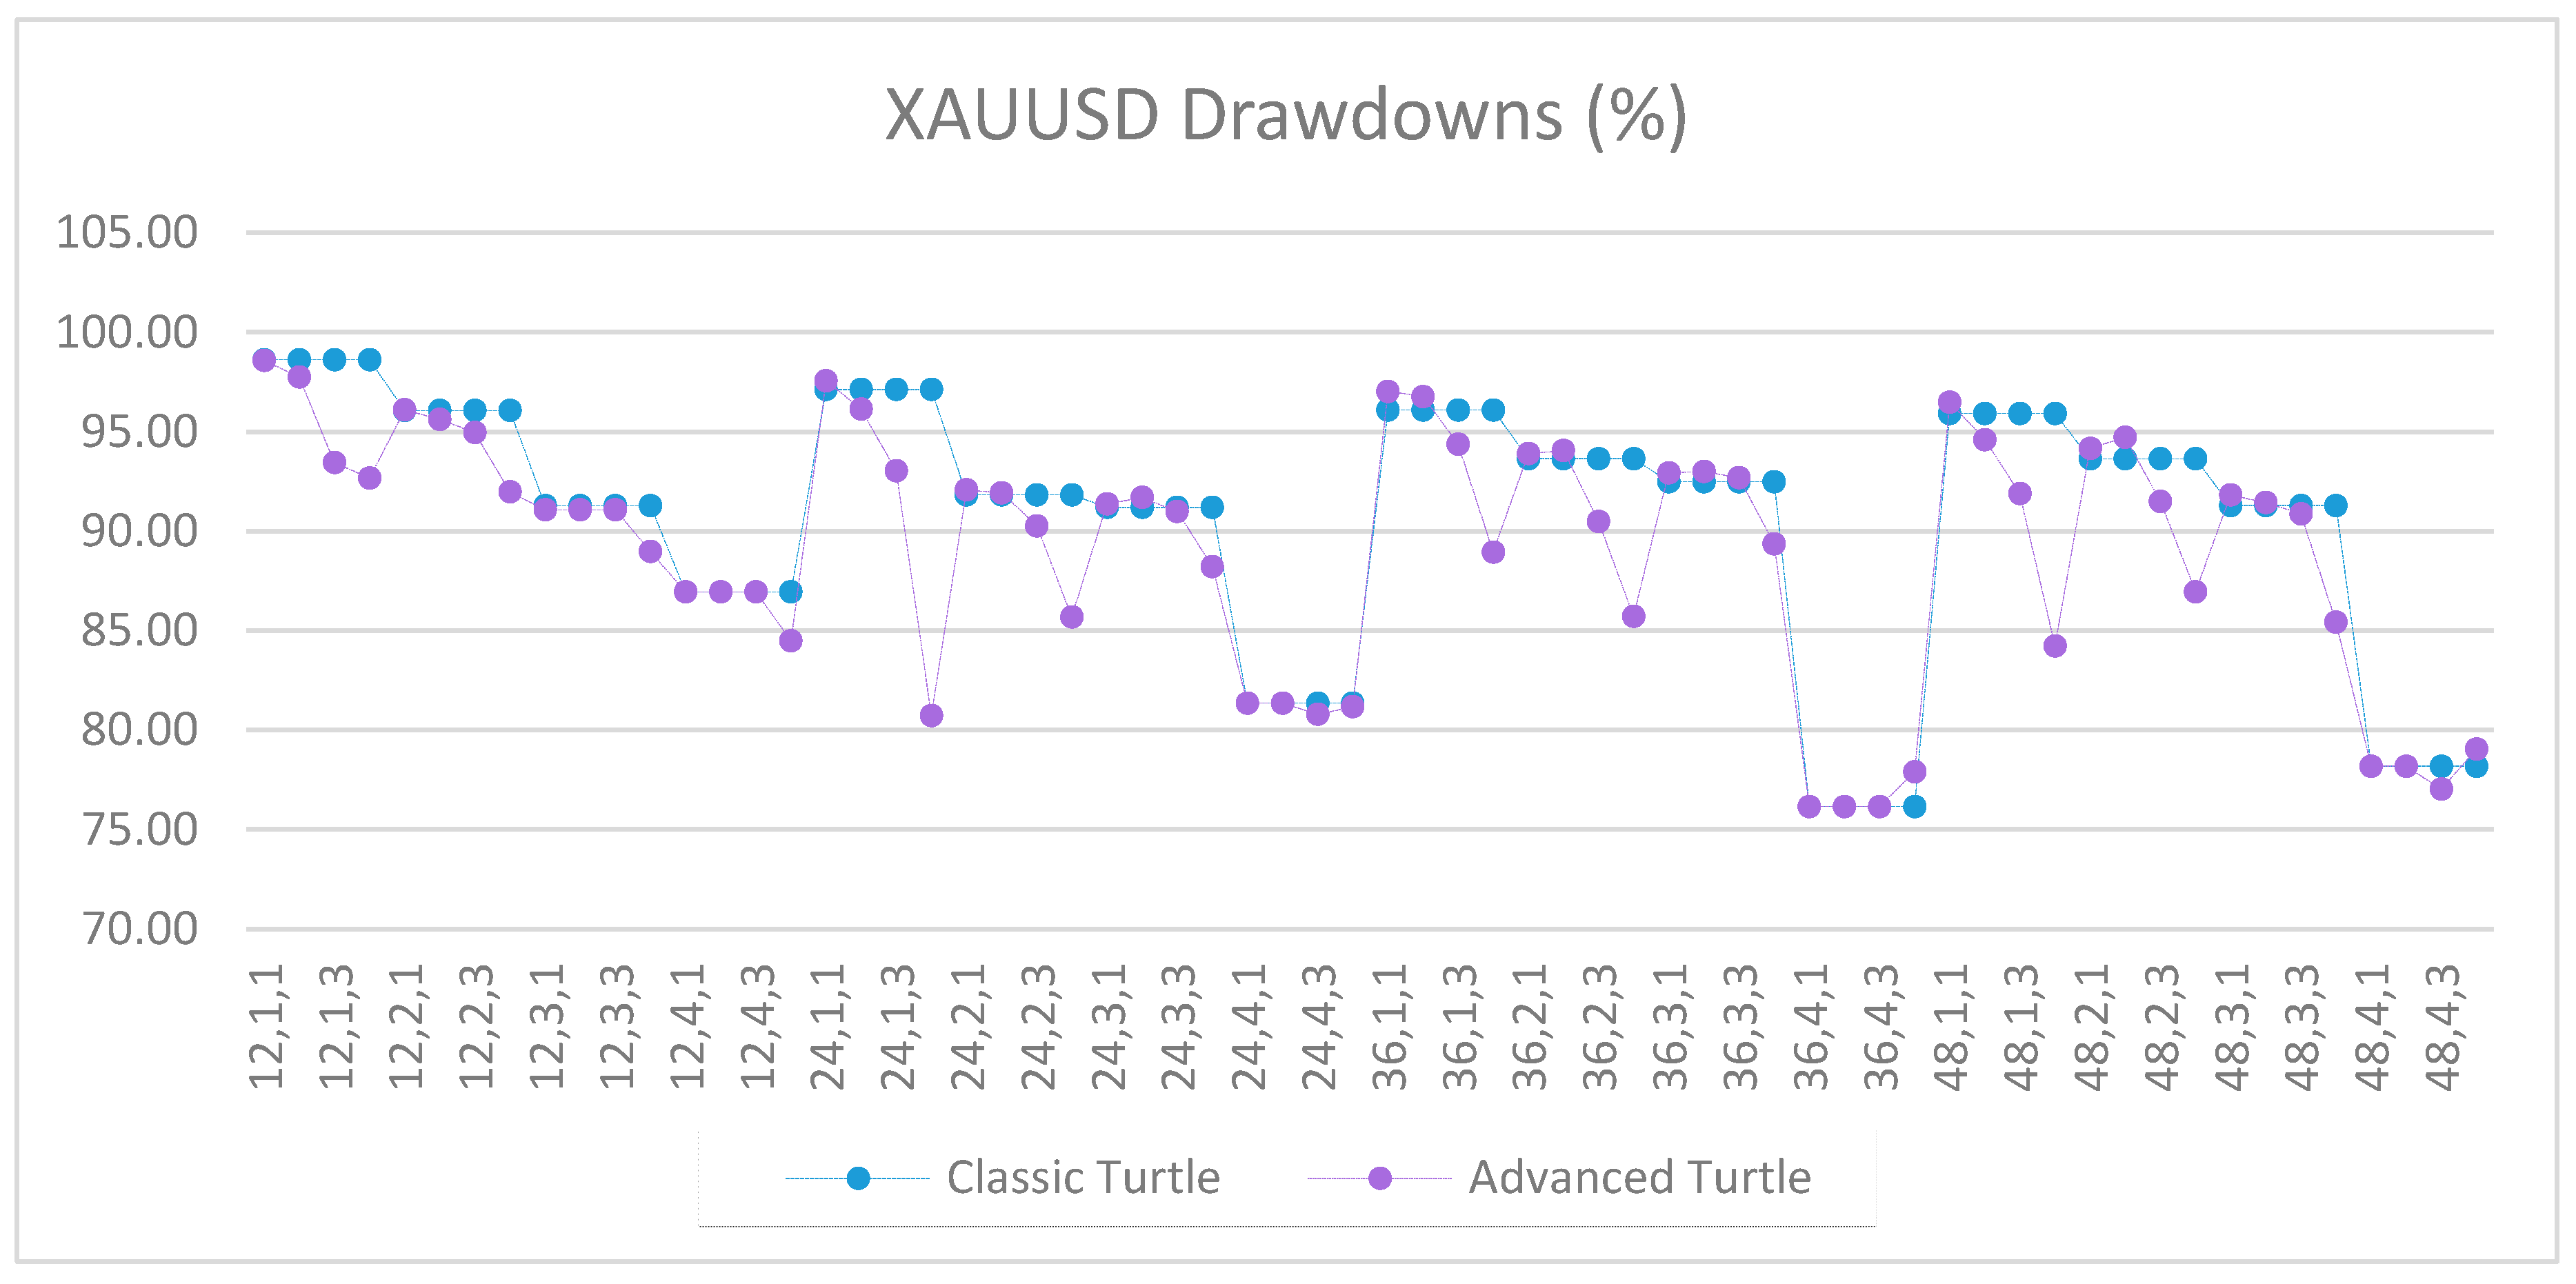
Figure A12.
Drawdowns of XAUUSD as percentage of equity between the classic and the advanced Turtle systems for every combination of N, X, Y for the fast parameters (20, 40).
Figure A12.
Drawdowns of XAUUSD as percentage of equity between the classic and the advanced Turtle systems for every combination of N, X, Y for the fast parameters (20, 40).
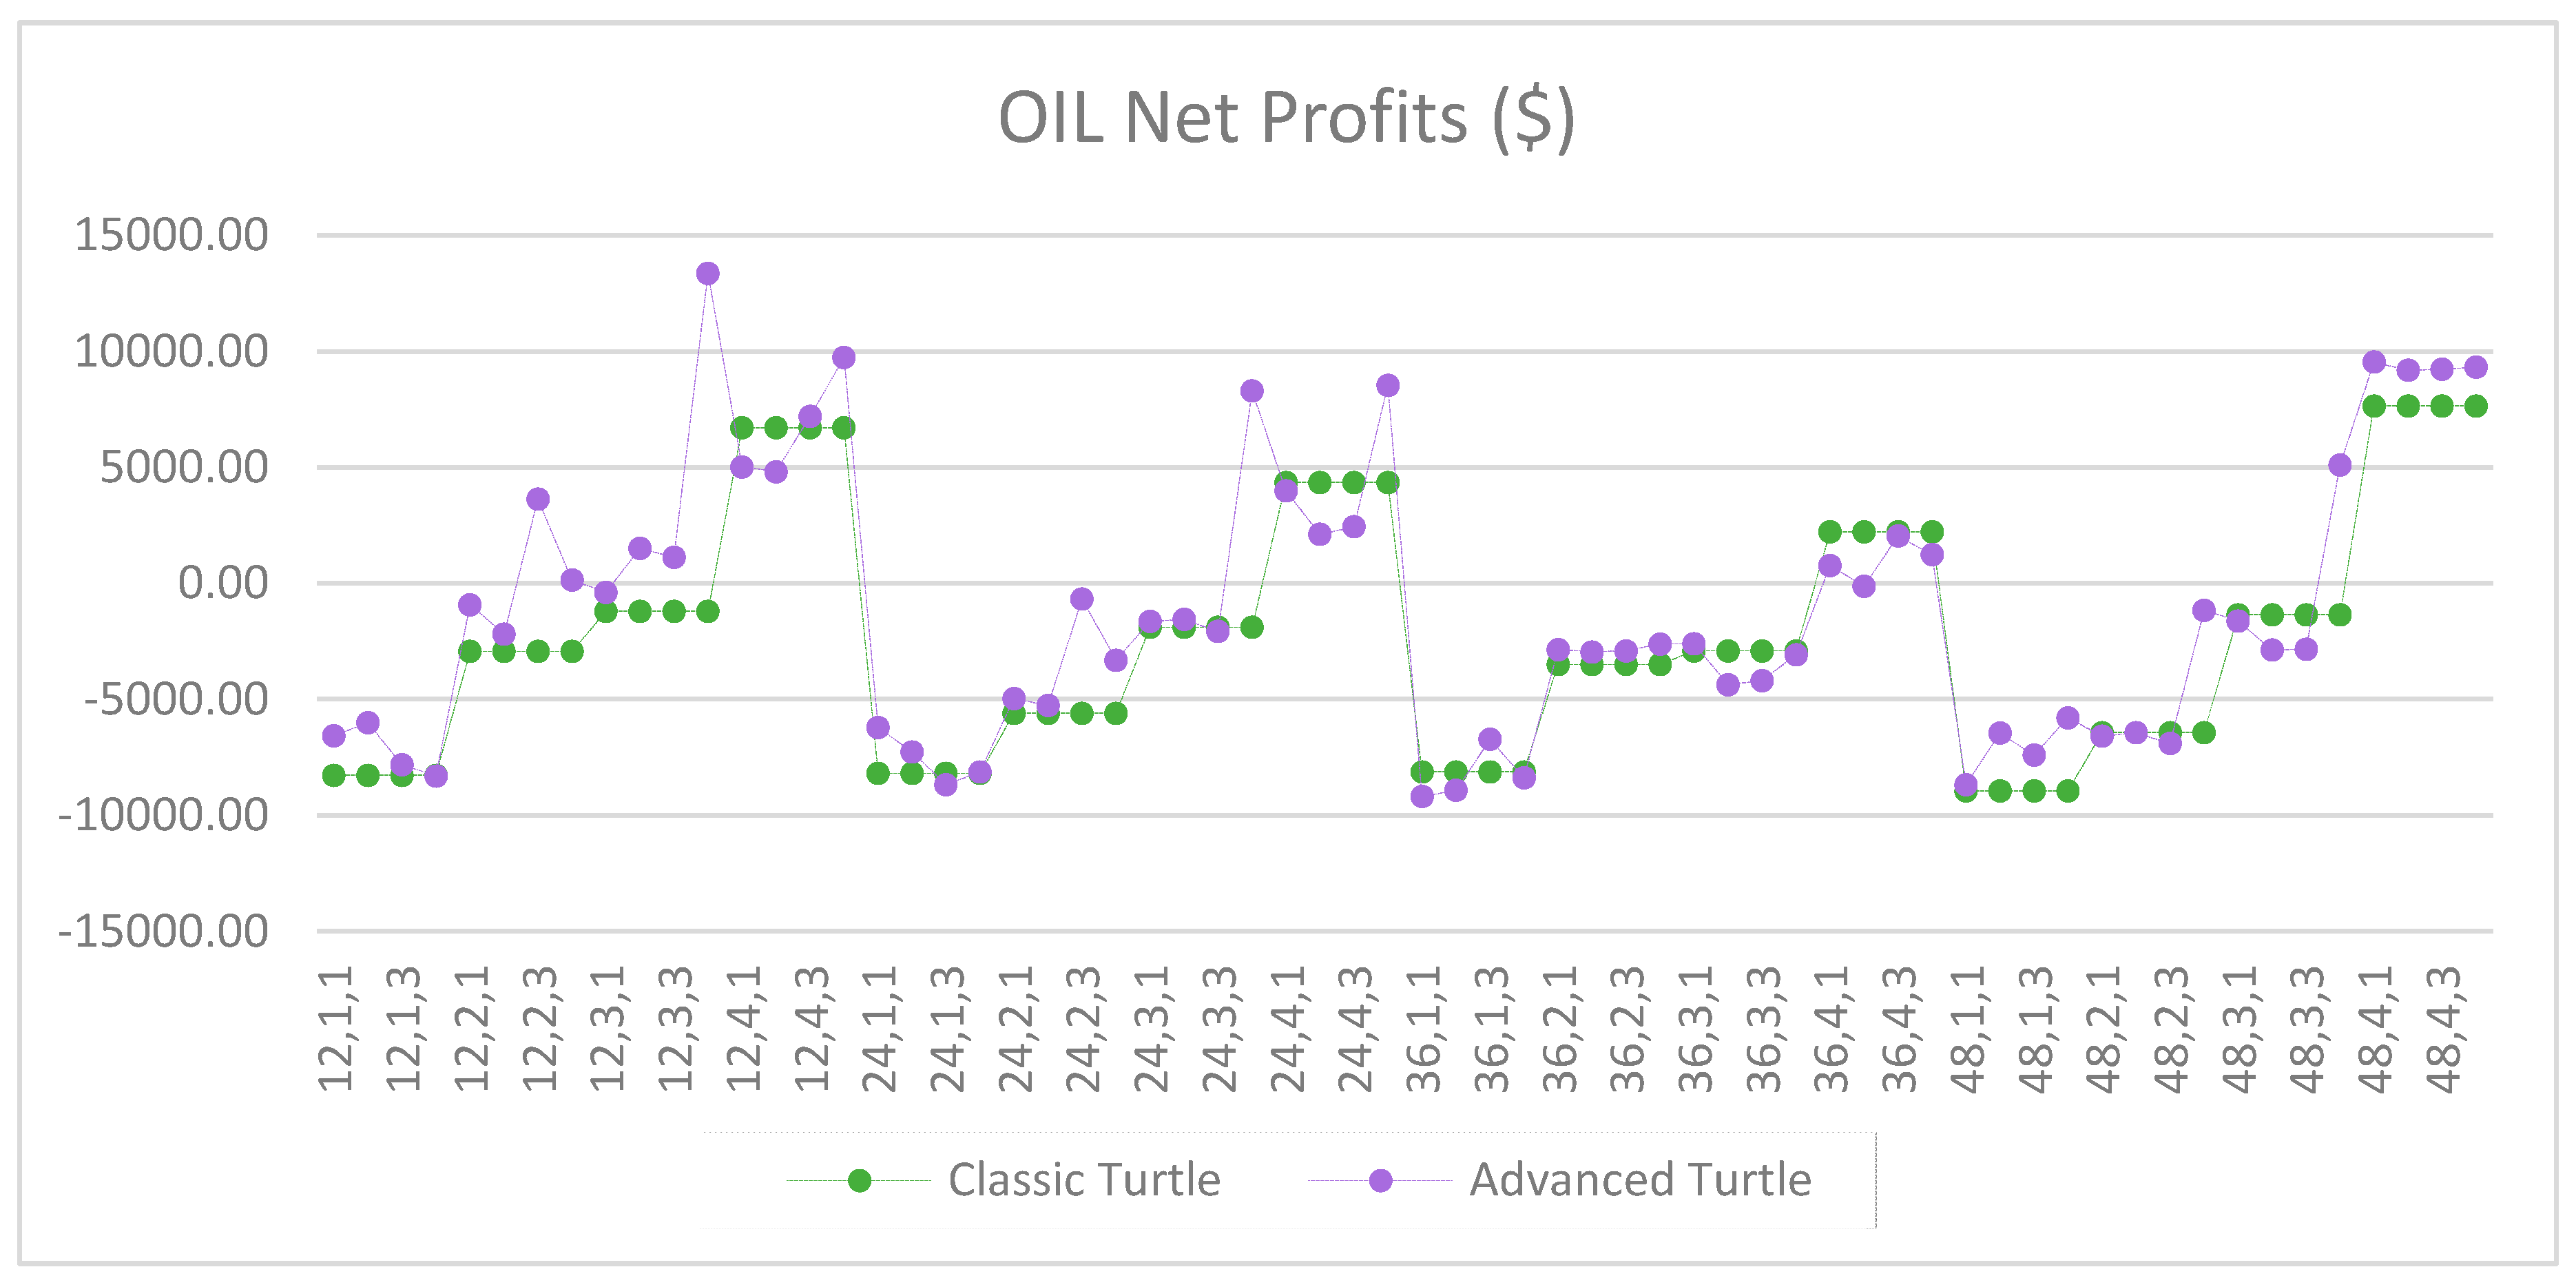
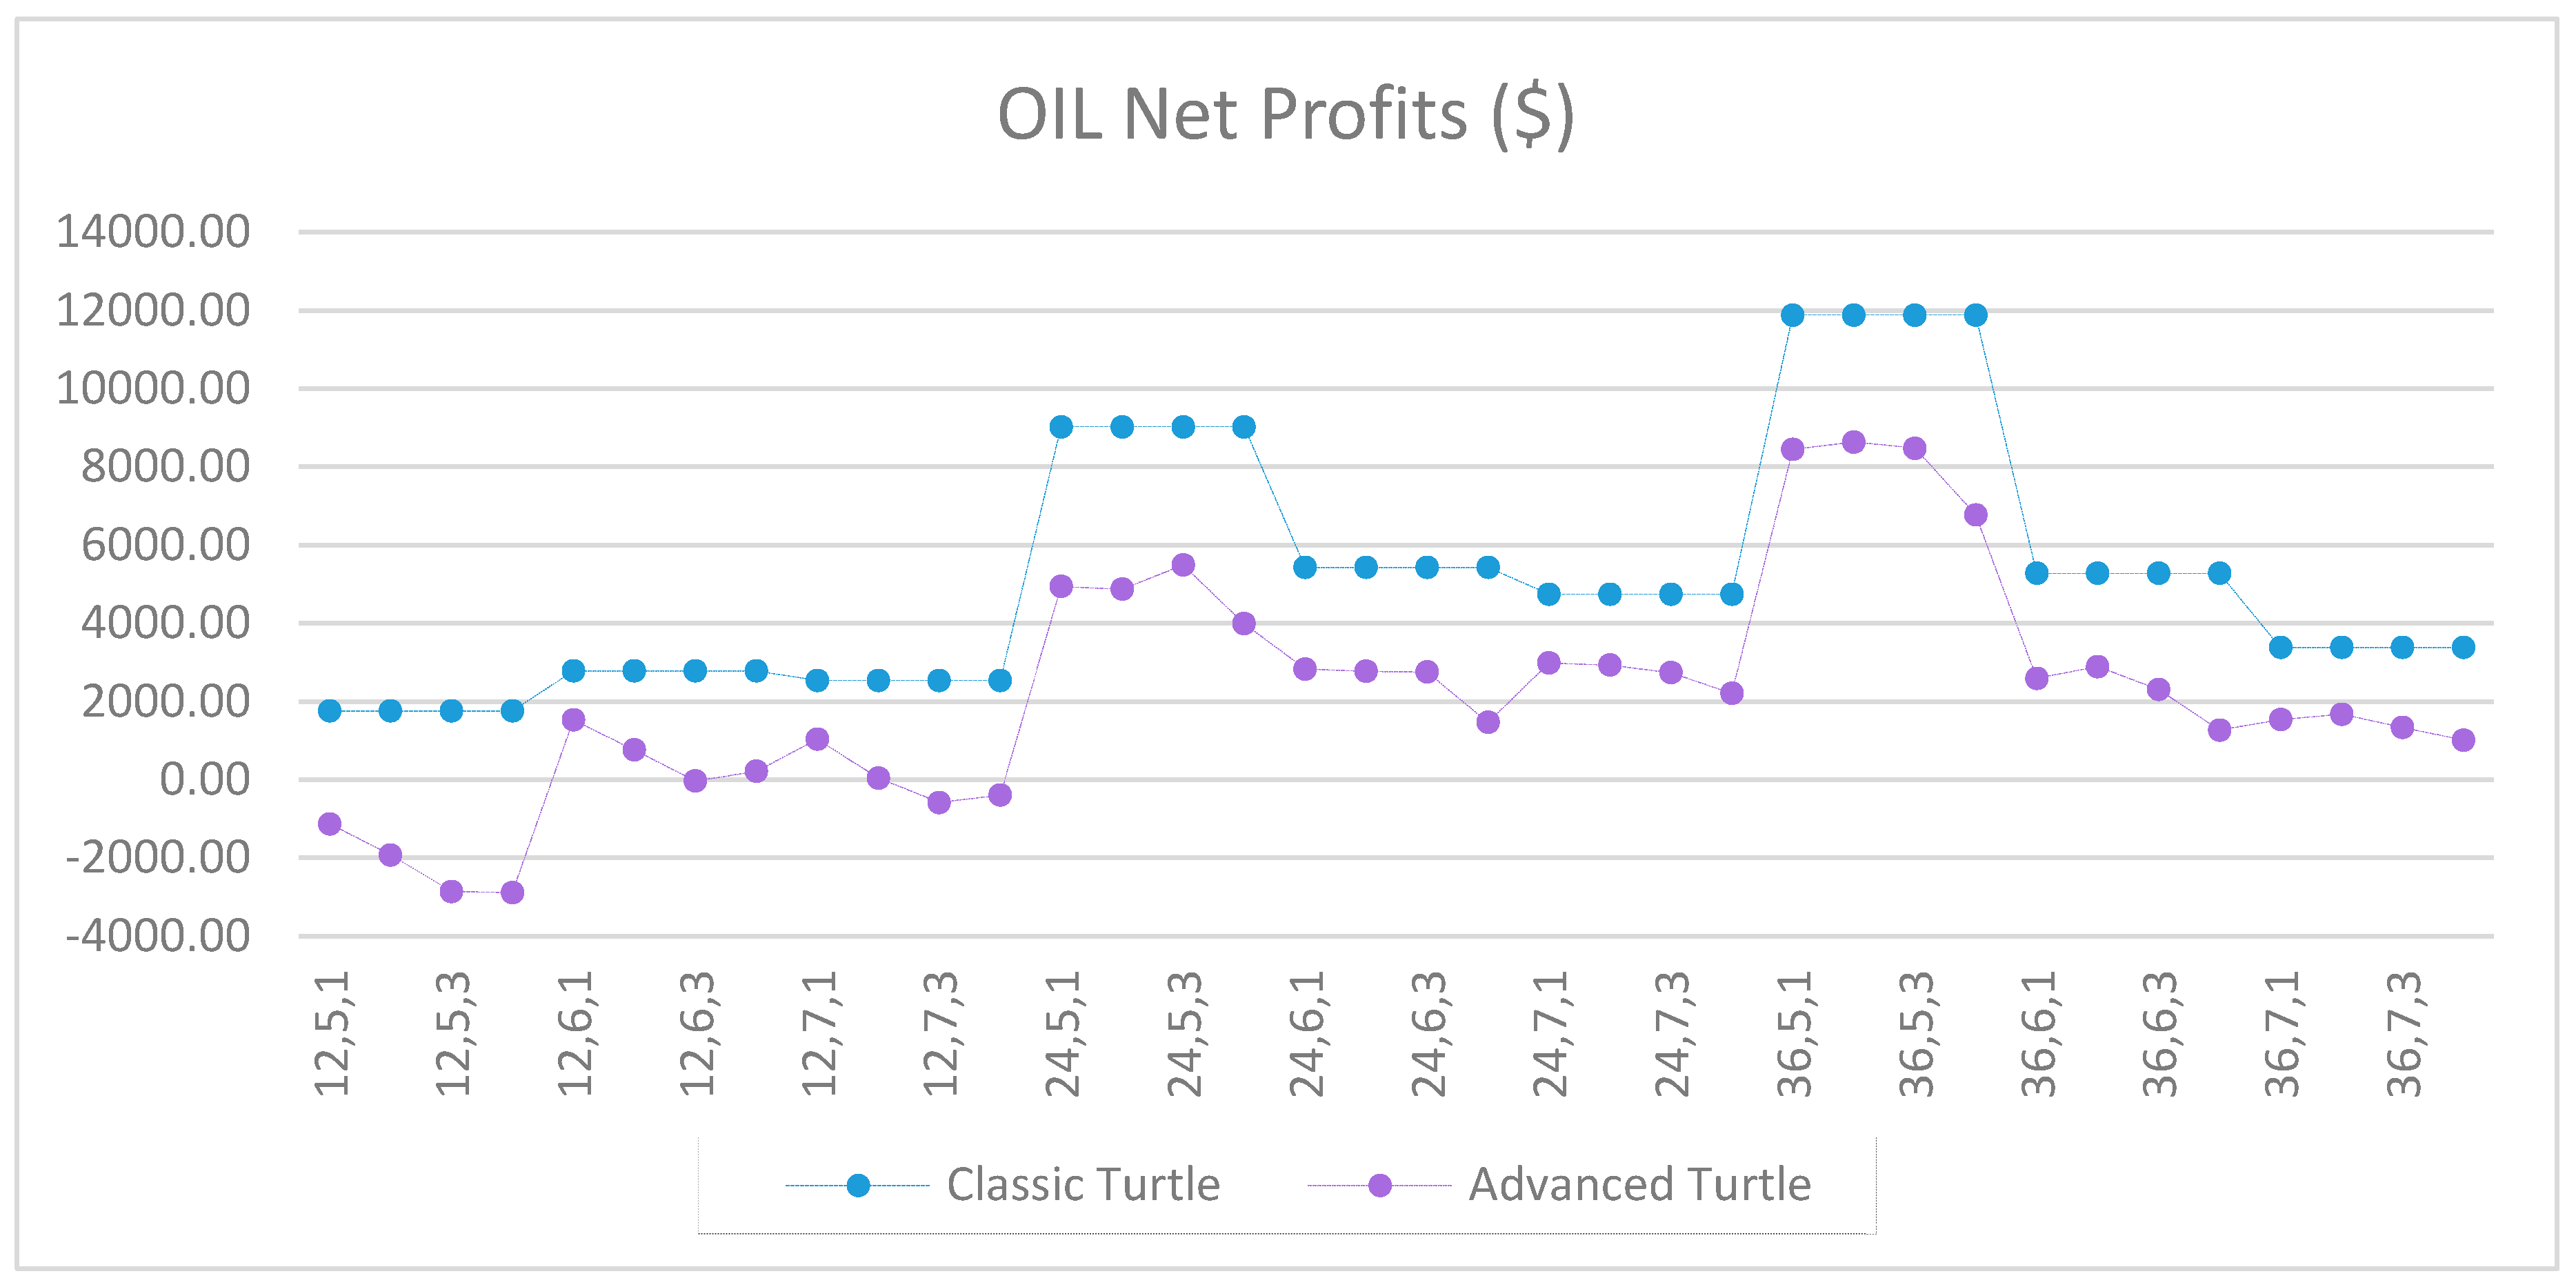
Figure A13.
Net profits of OIL between the classic and the advanced Turtle systems for every combination of N, X, Y for the fast parameters (20, 40).
Figure A13.
Net profits of OIL between the classic and the advanced Turtle systems for every combination of N, X, Y for the fast parameters (20, 40).
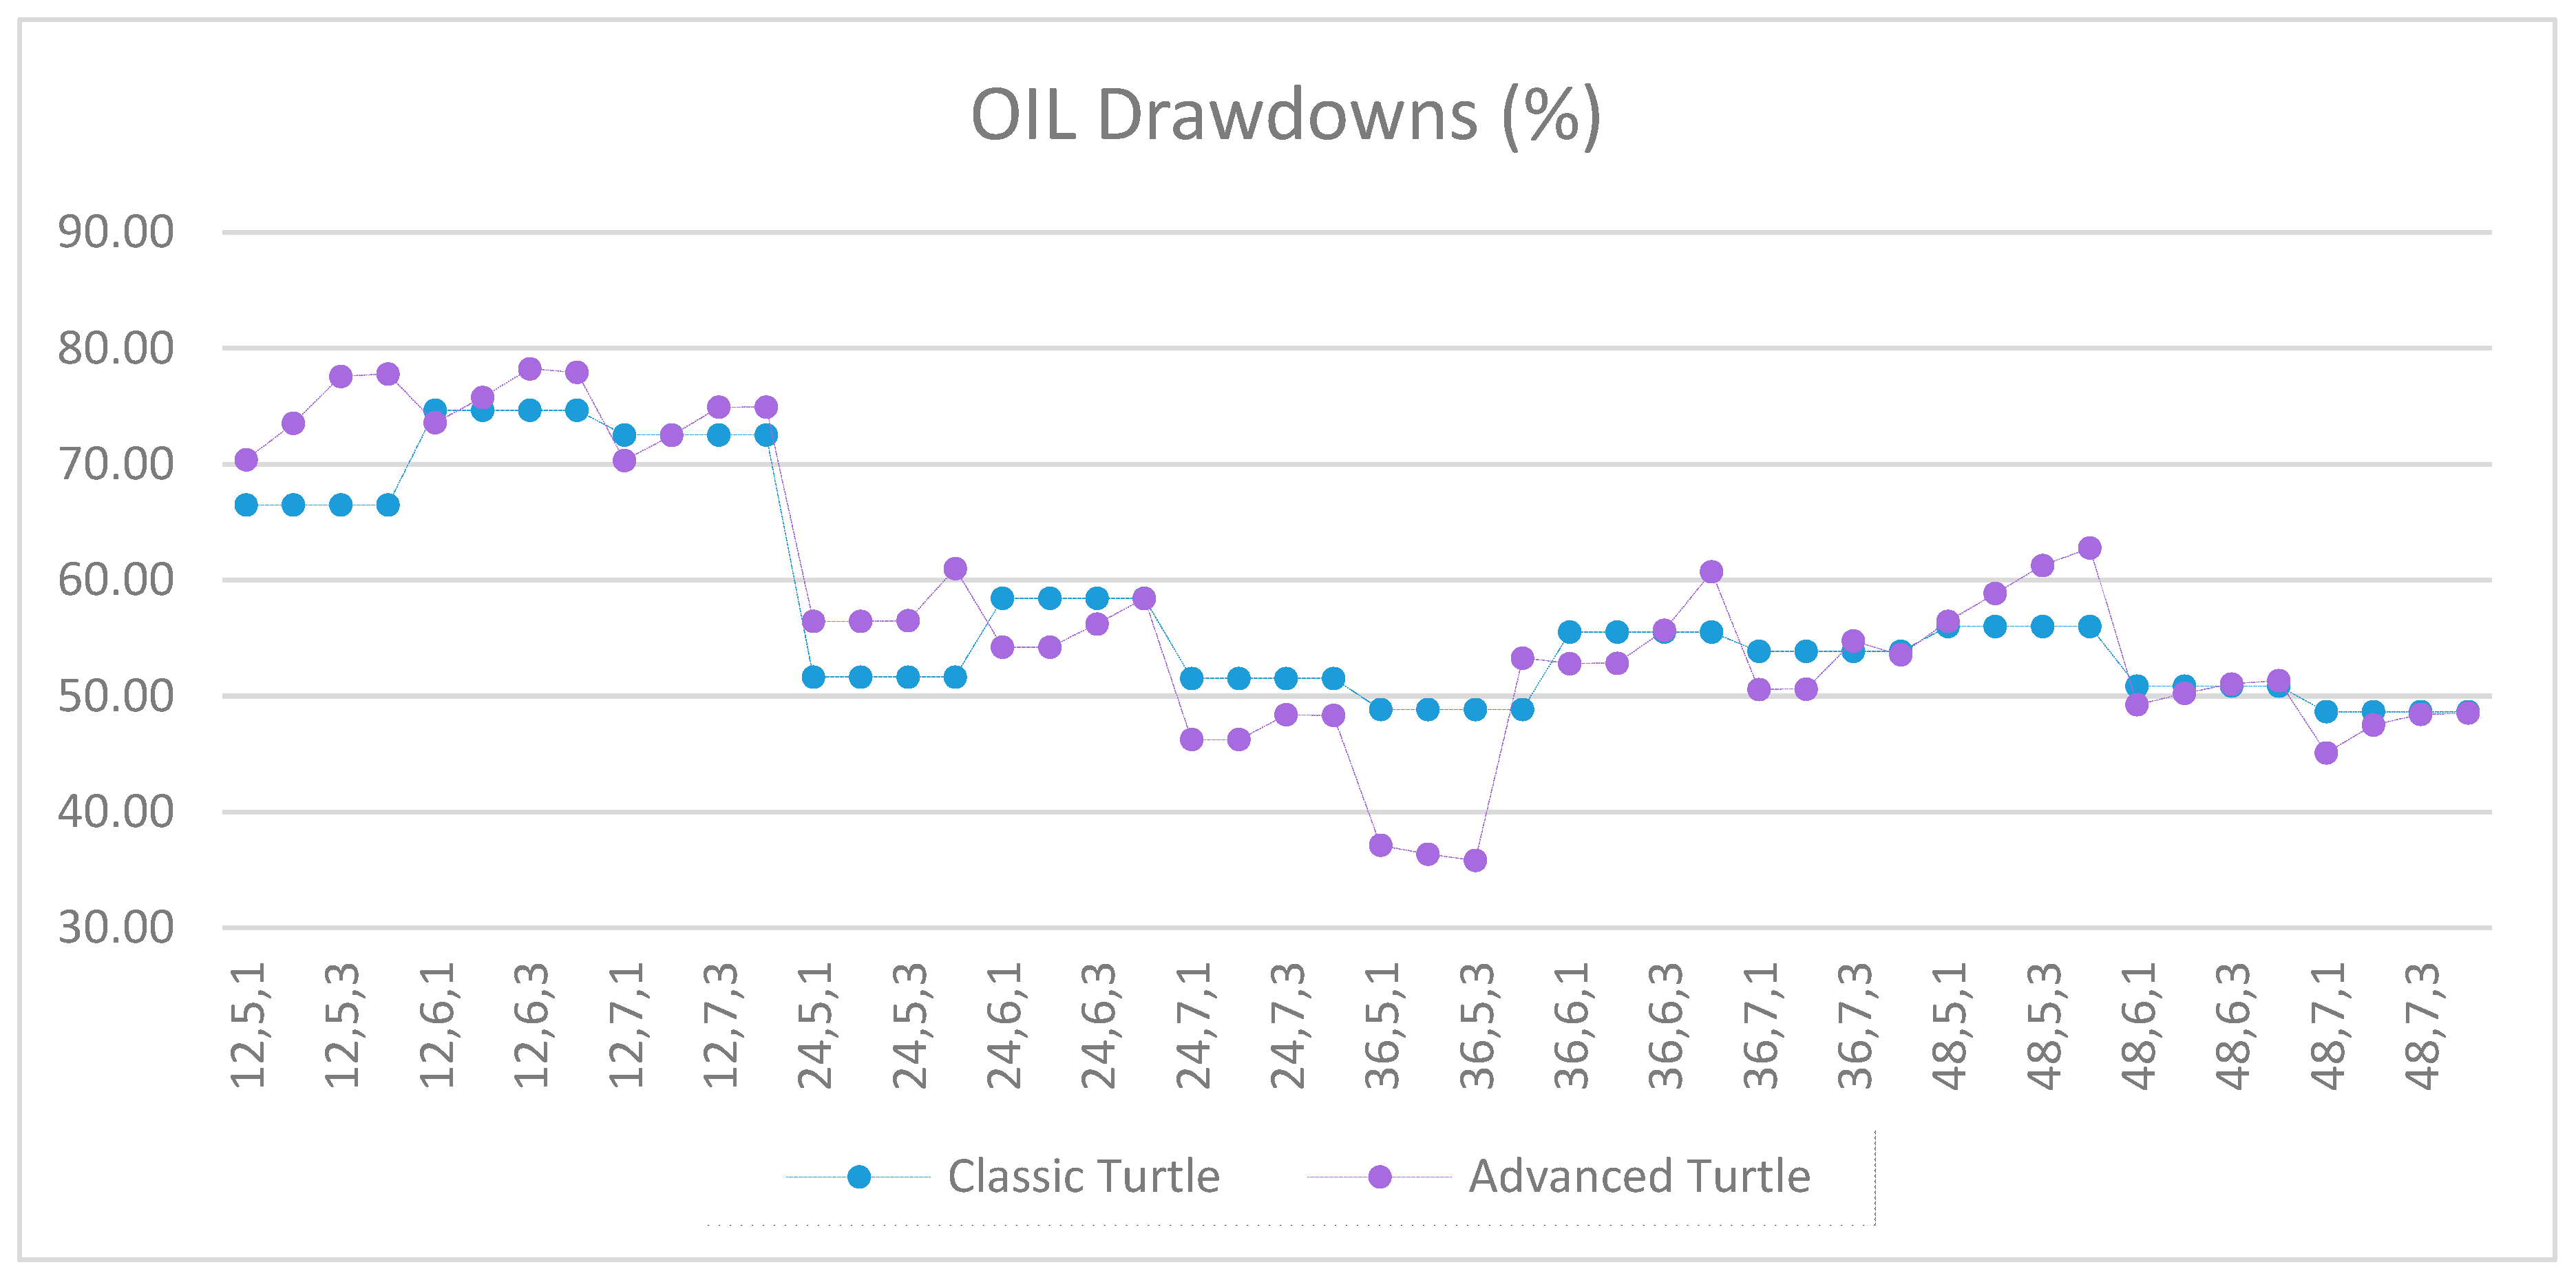
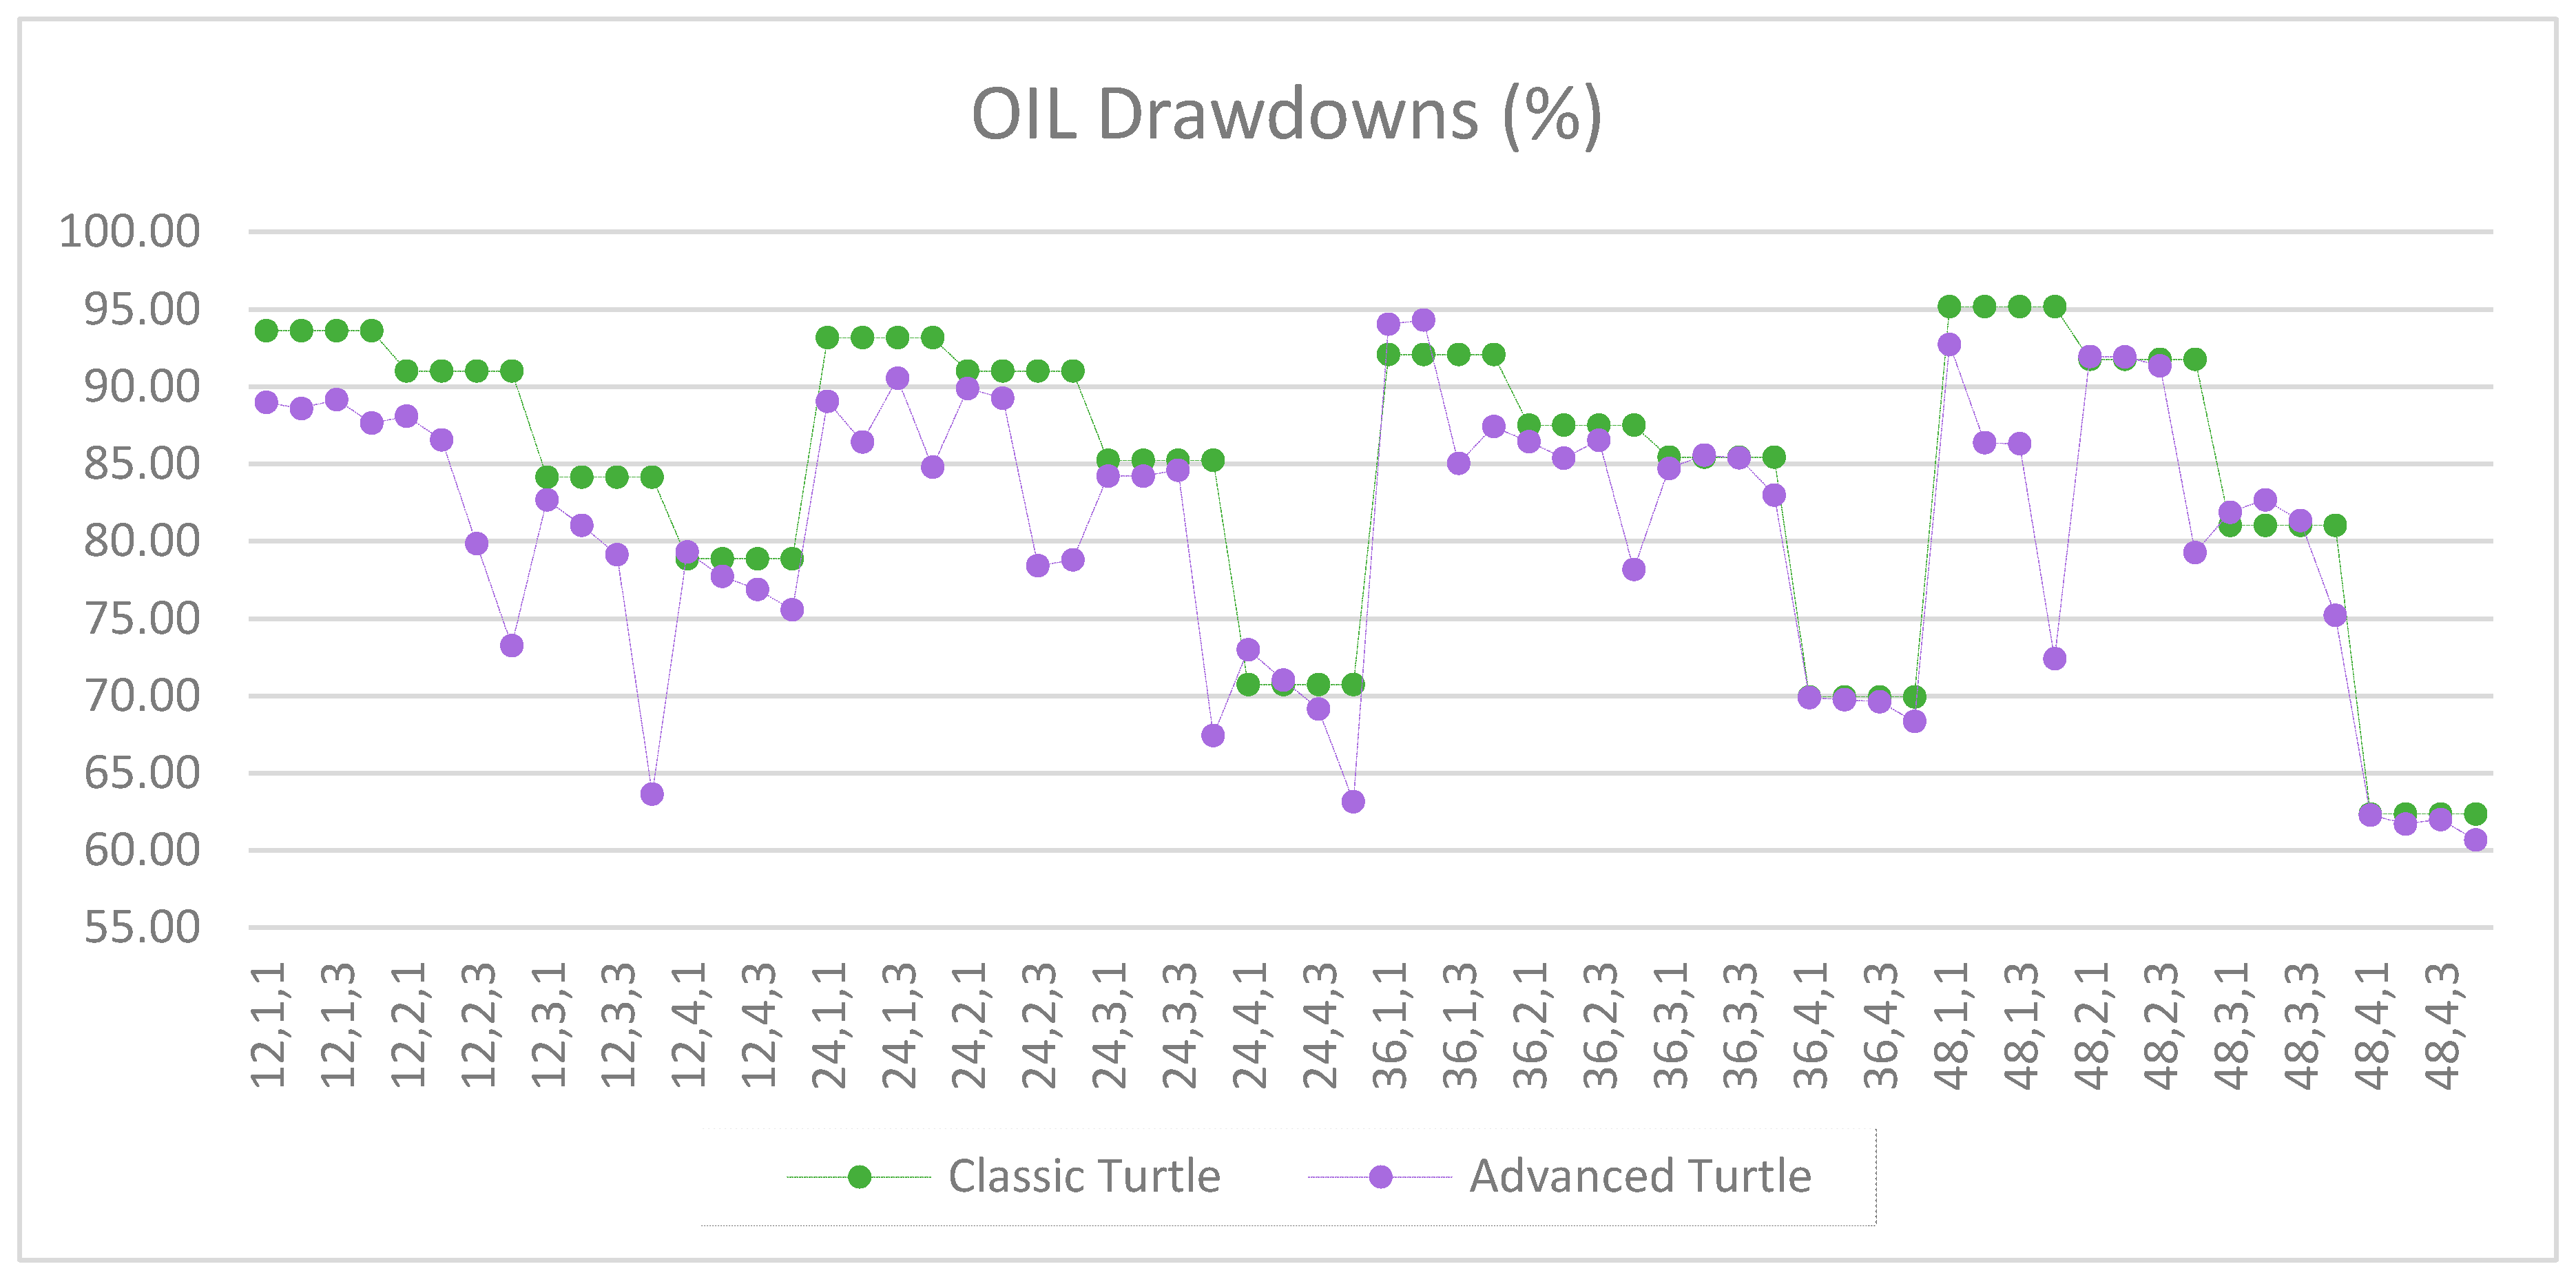
Figure A14.
Drawdowns of OIL as percentage of equity between the classic and the advanced Turtle systems for every combination of N, X, Y for the fast parameters (20, 40).
Figure A14.
Drawdowns of OIL as percentage of equity between the classic and the advanced Turtle systems for every combination of N, X, Y for the fast parameters (20, 40).
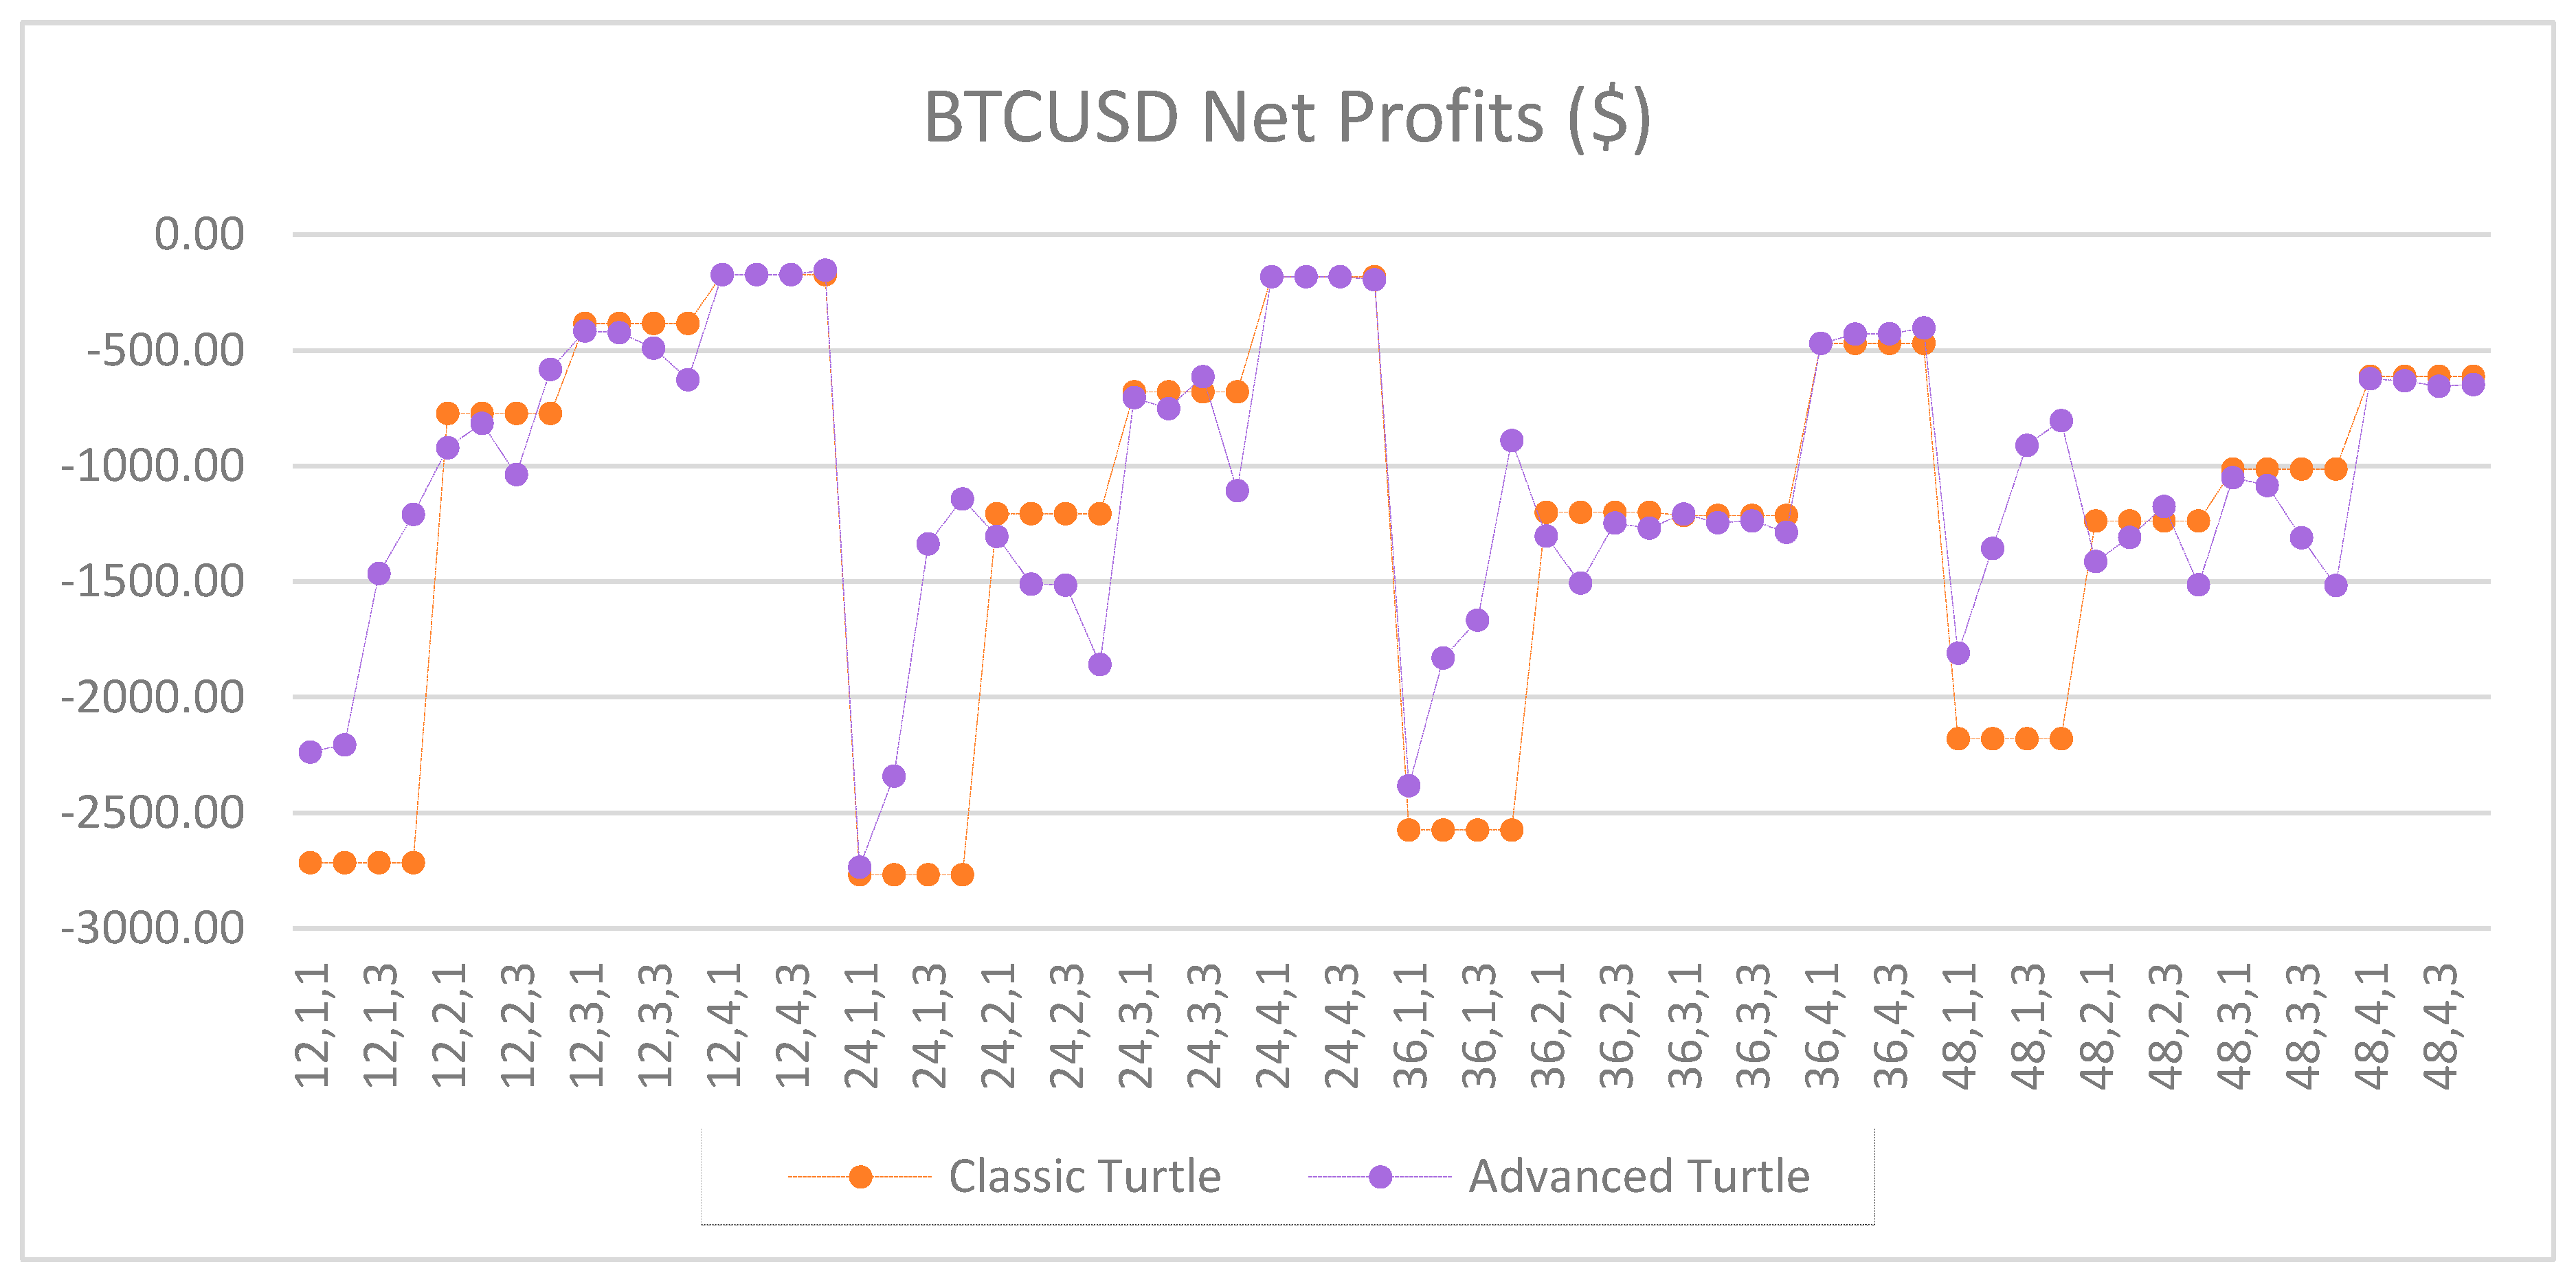
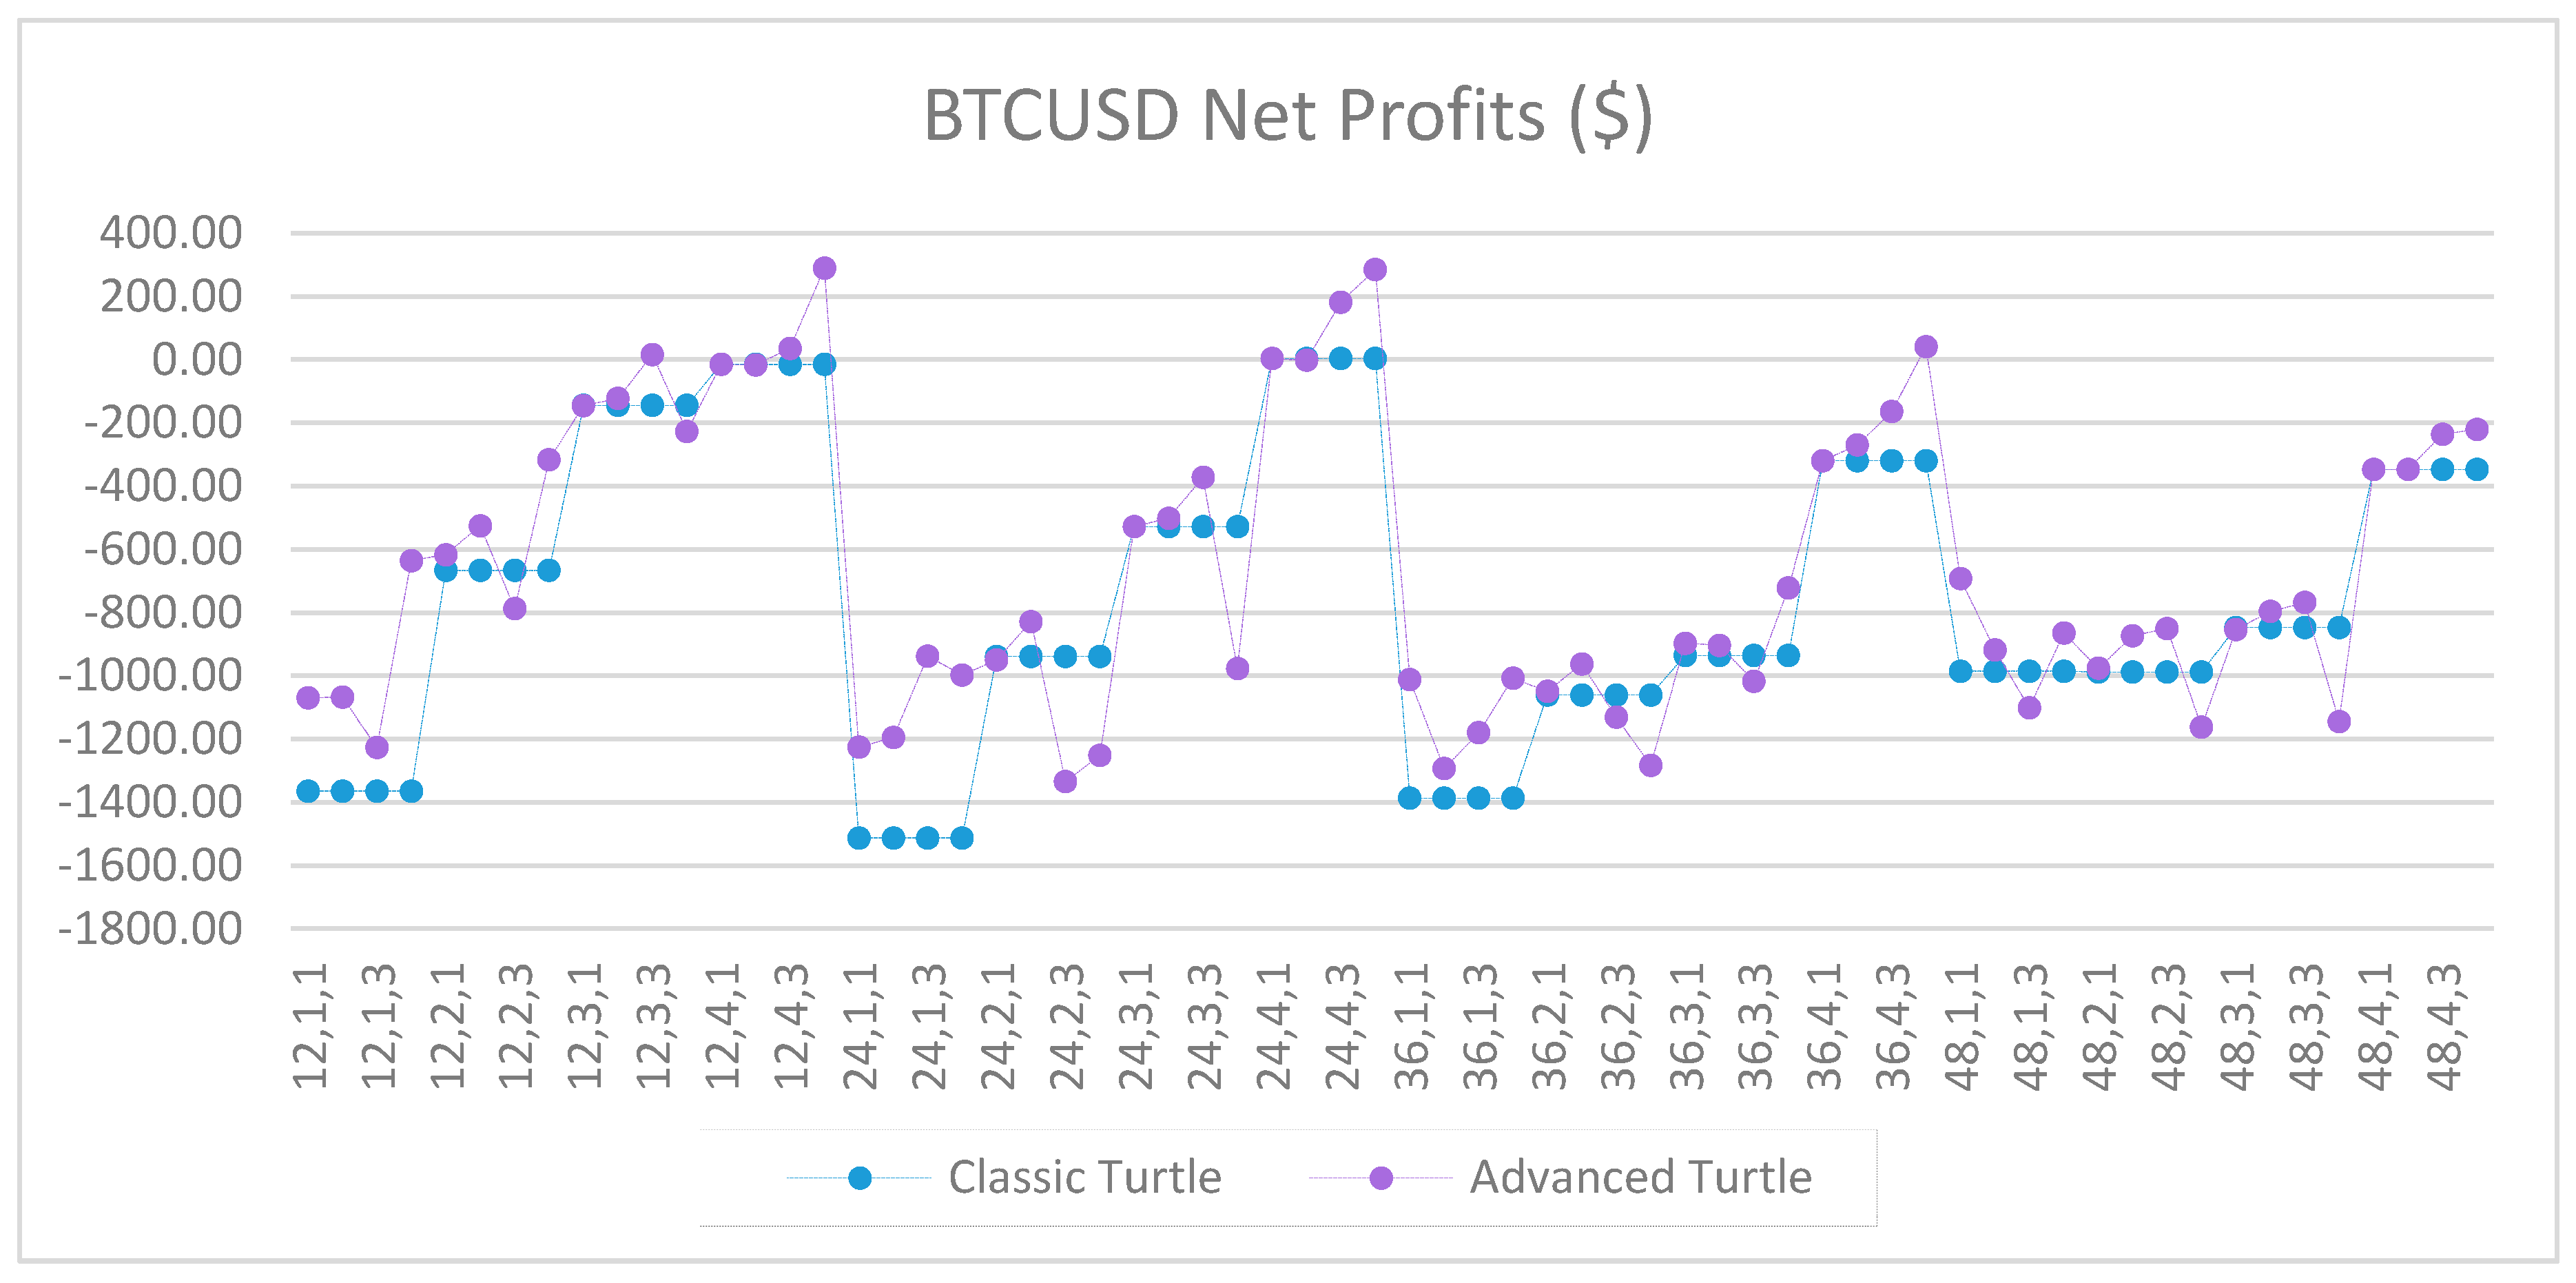
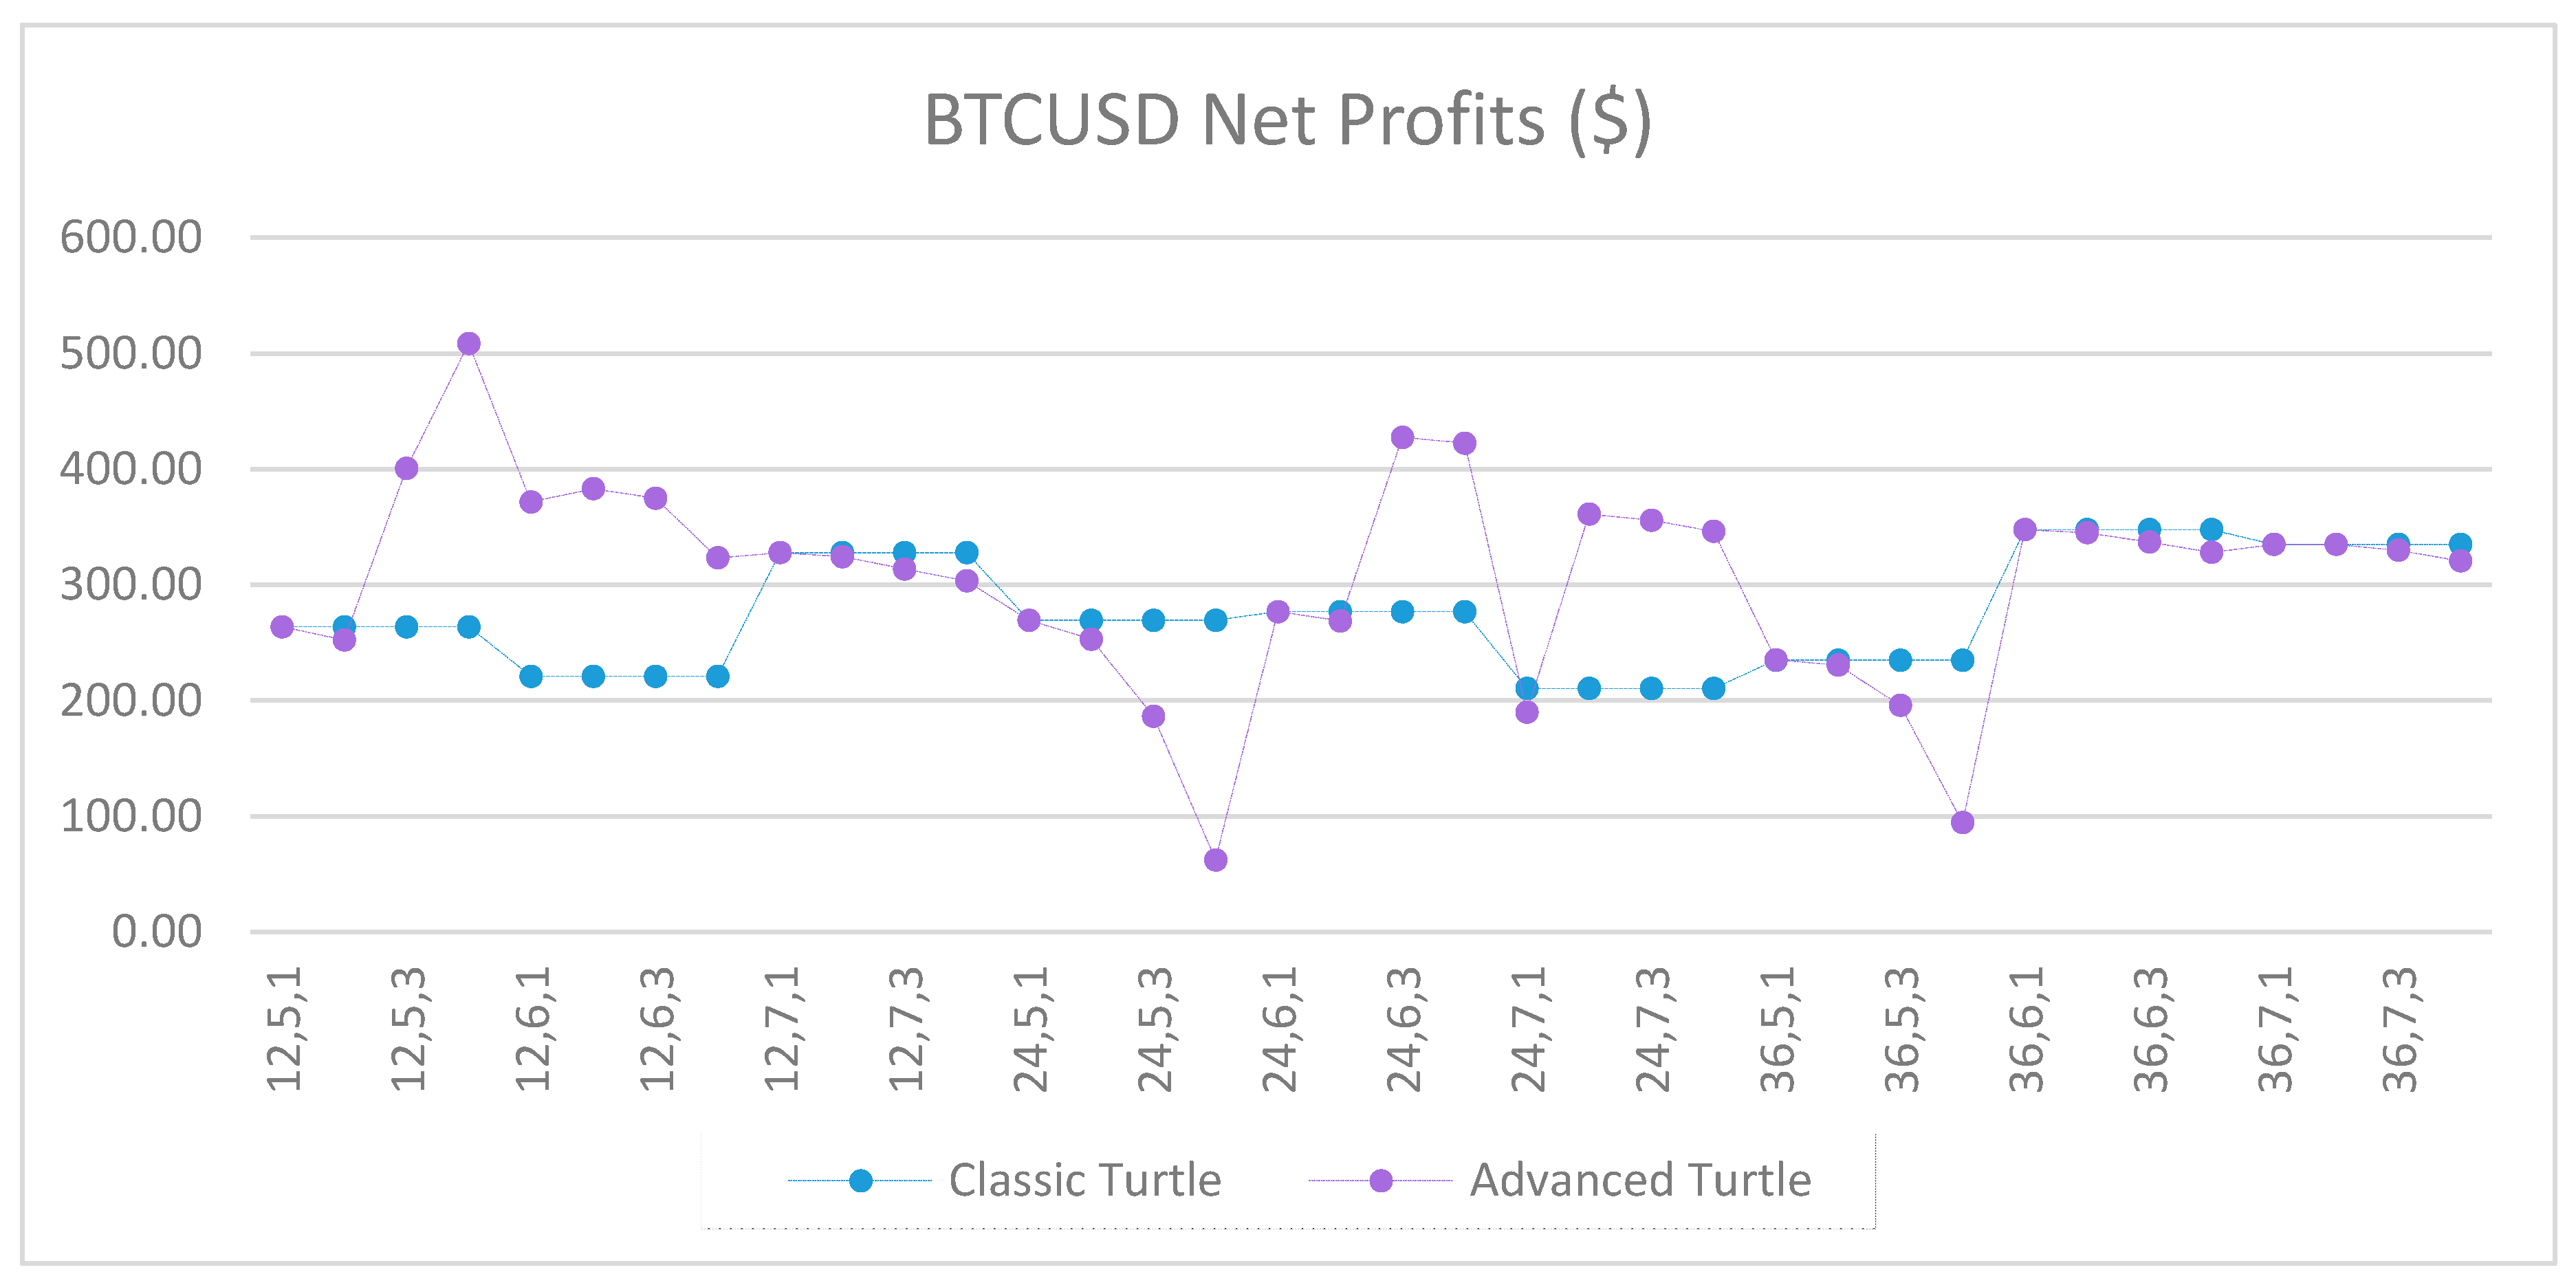
Figure A15.
Net profits of BTCUSD between the classic and the advanced Turtle systems for every combination of N, X, Y for the fast parameters (20, 40).
Figure A15.
Net profits of BTCUSD between the classic and the advanced Turtle systems for every combination of N, X, Y for the fast parameters (20, 40).
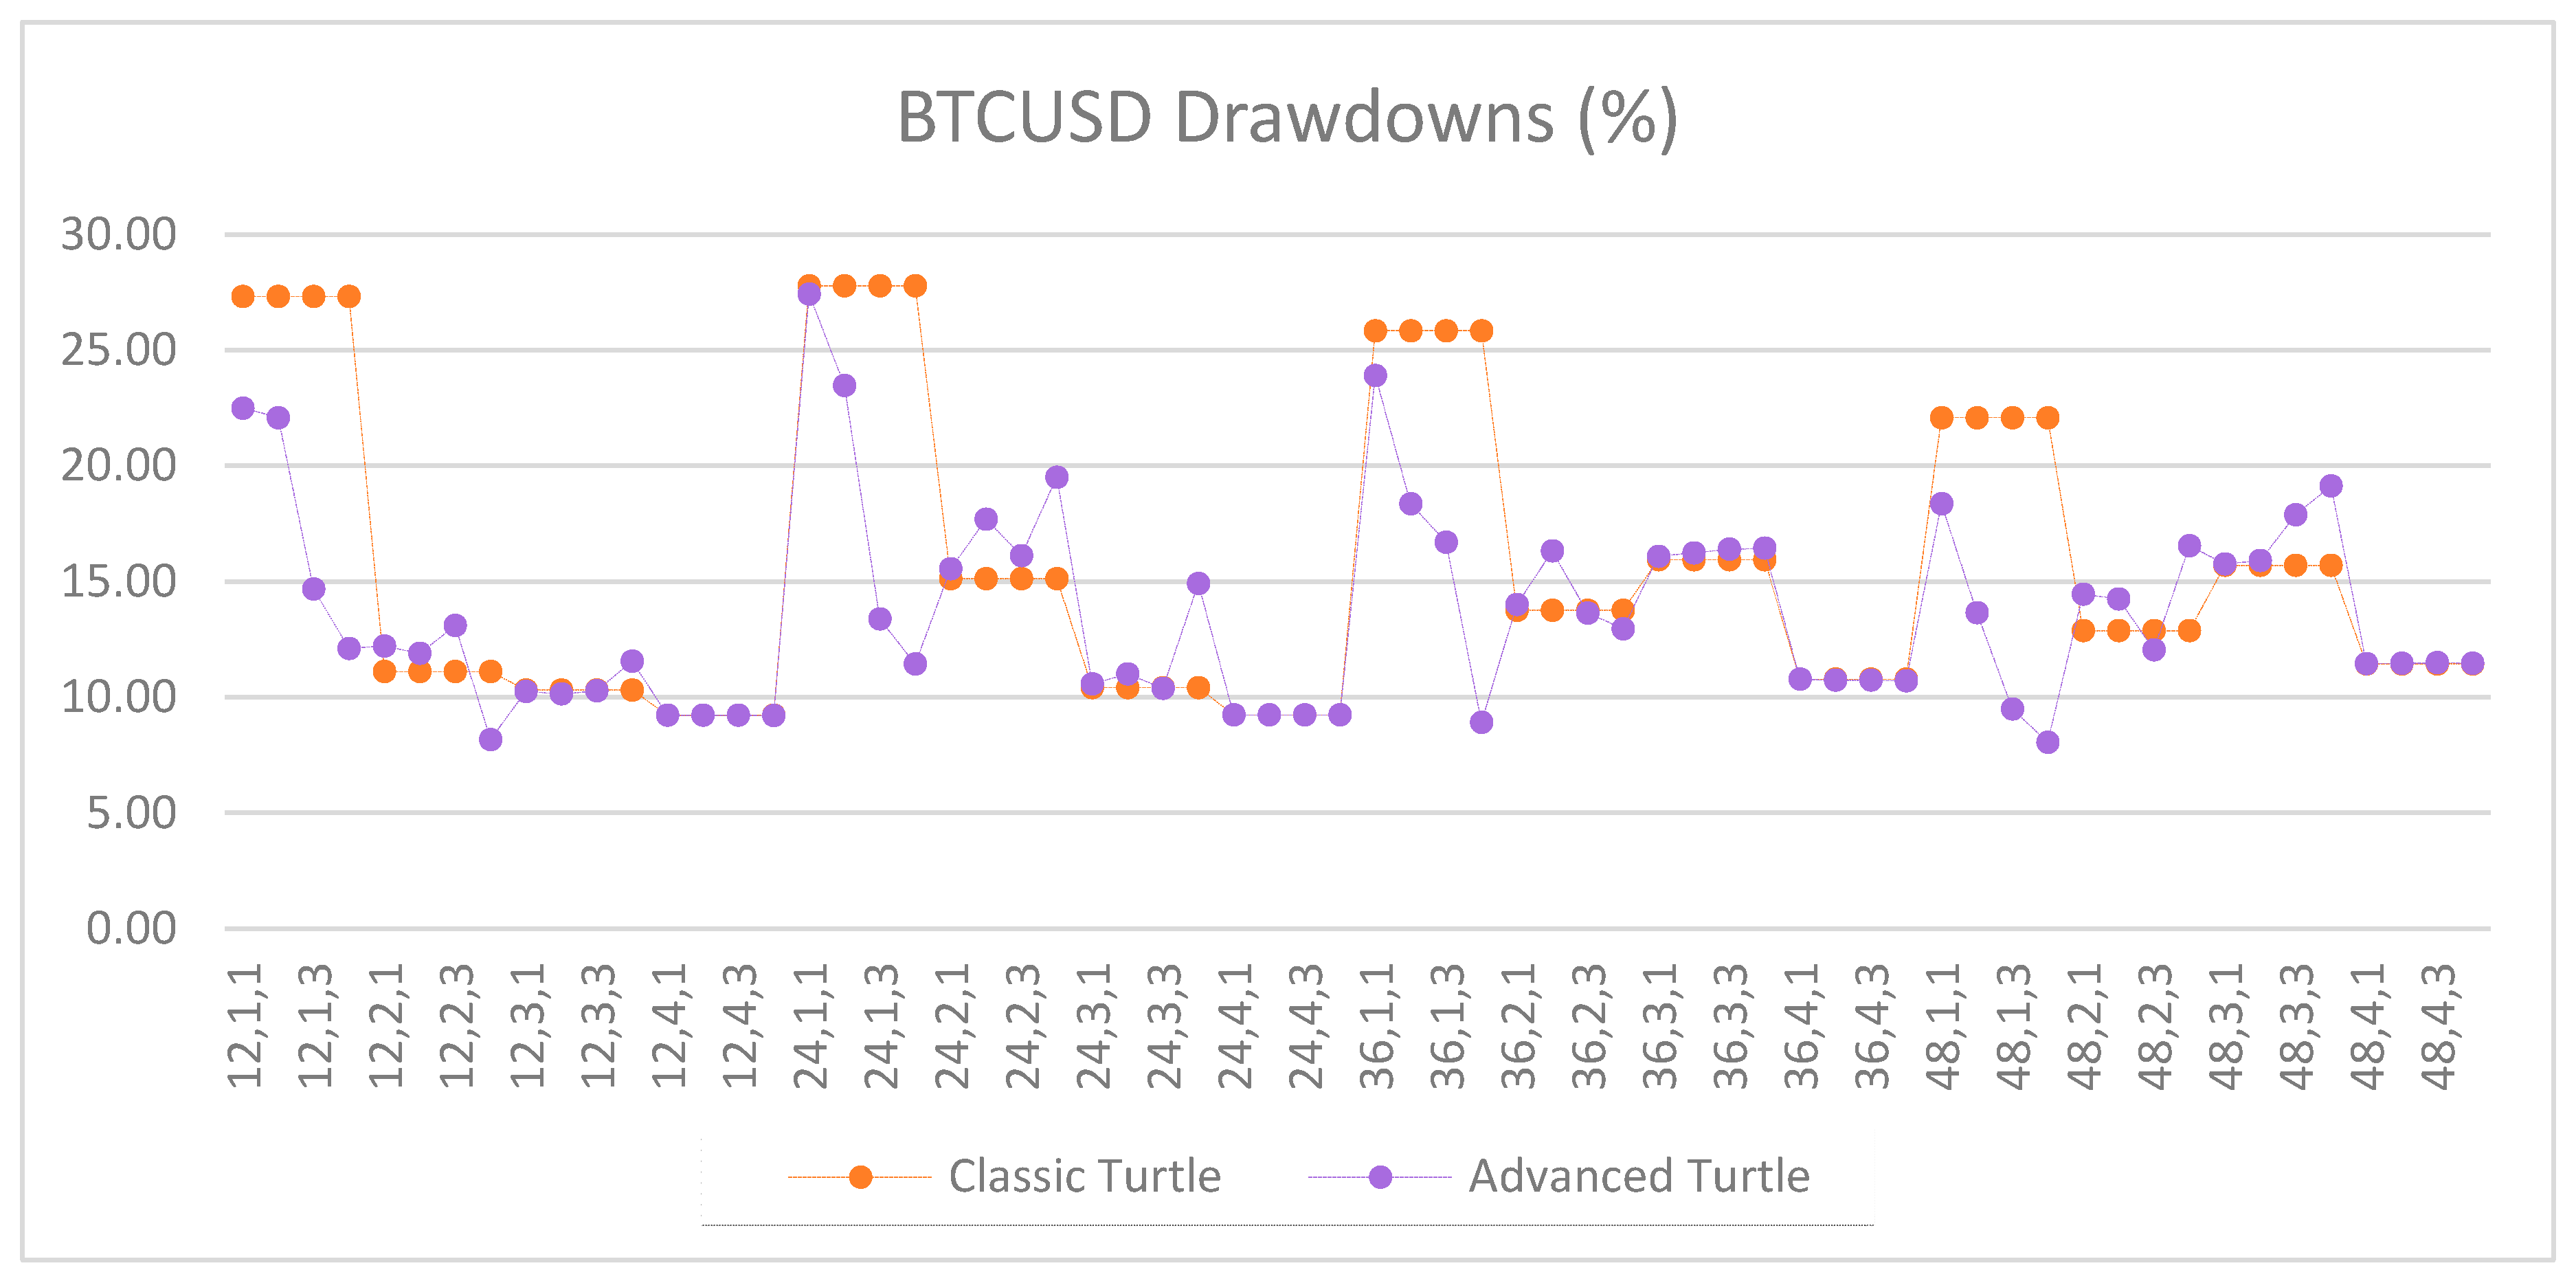
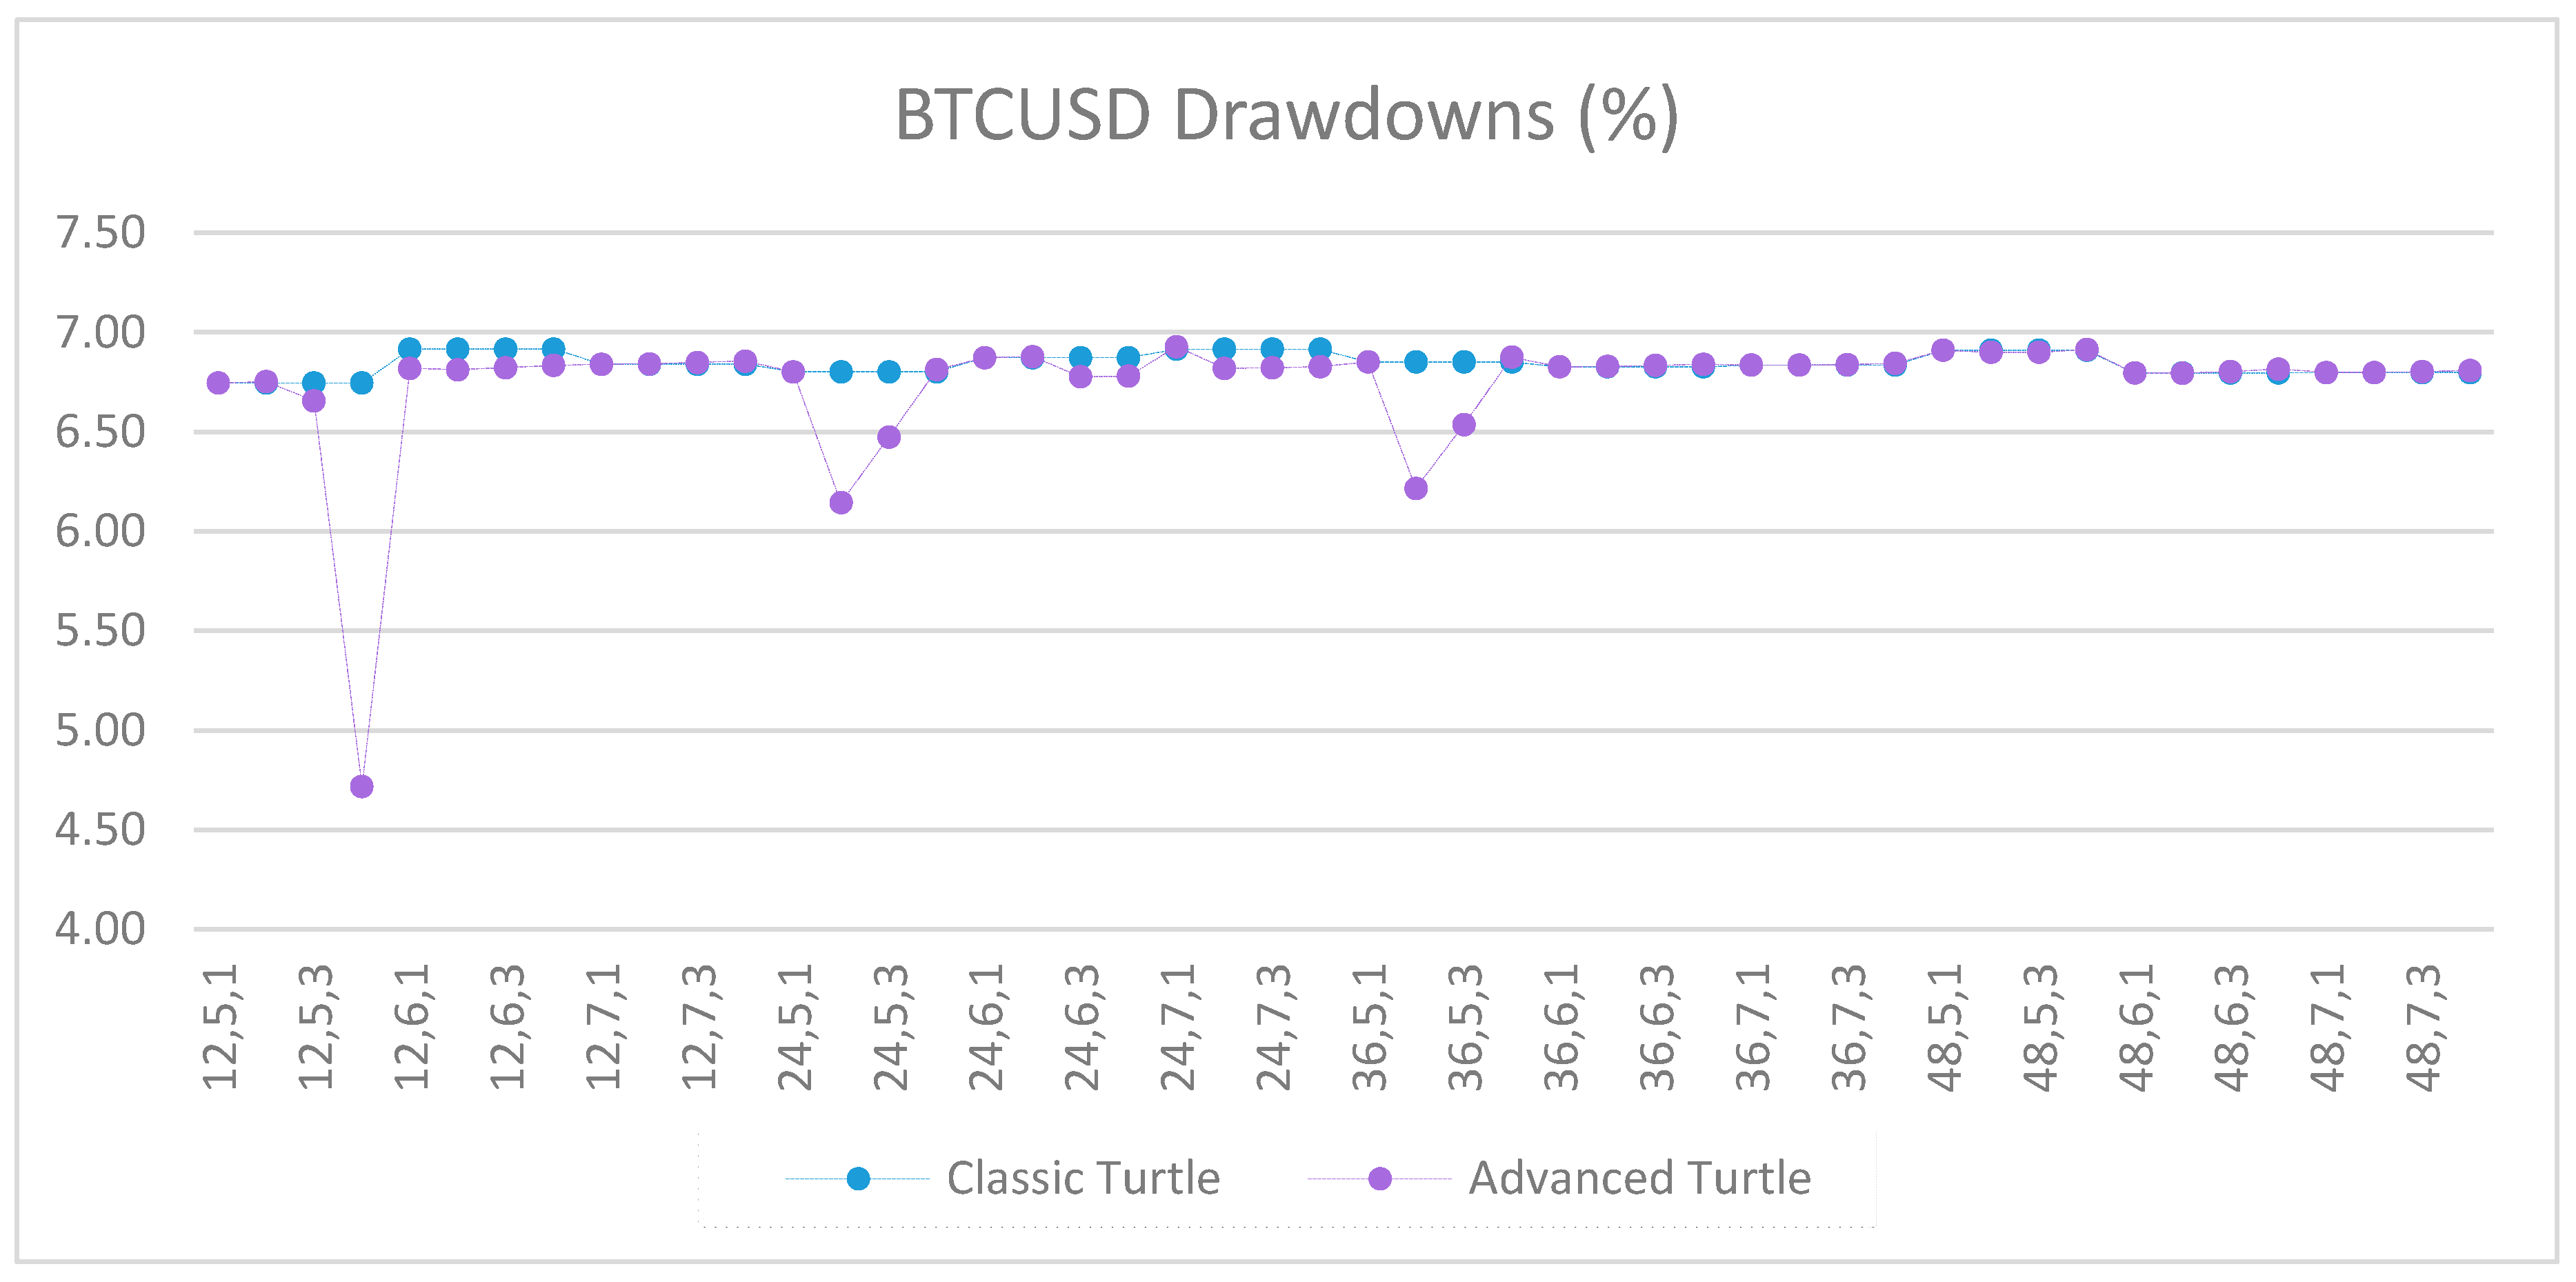
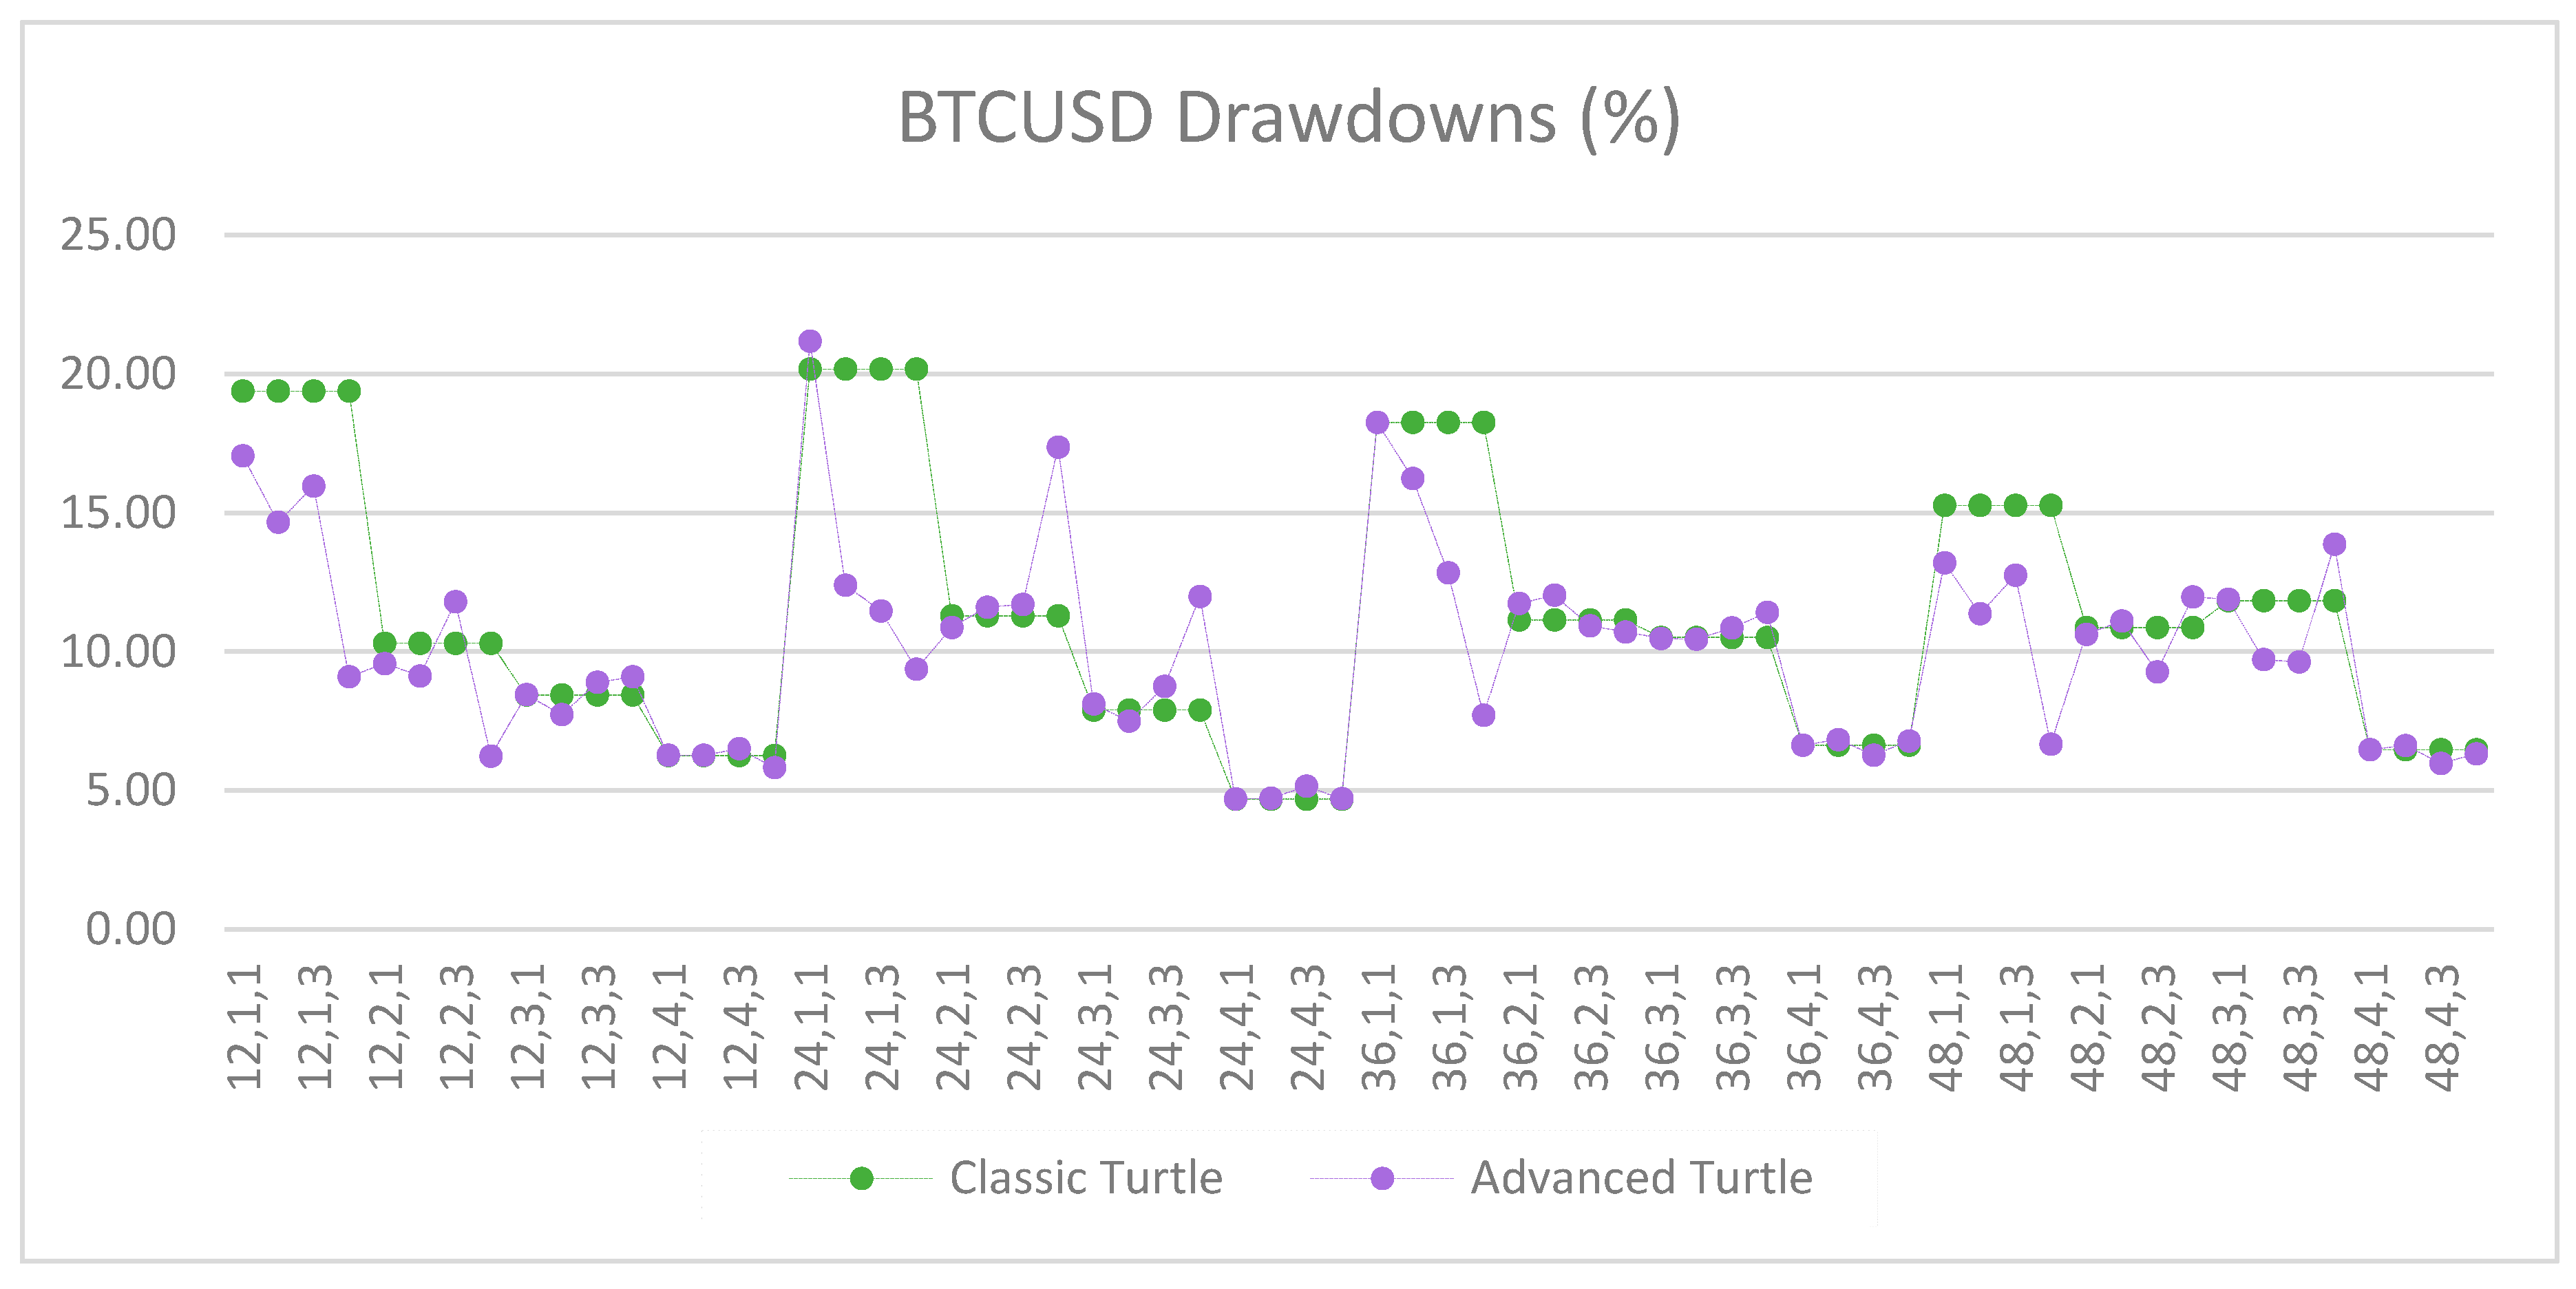
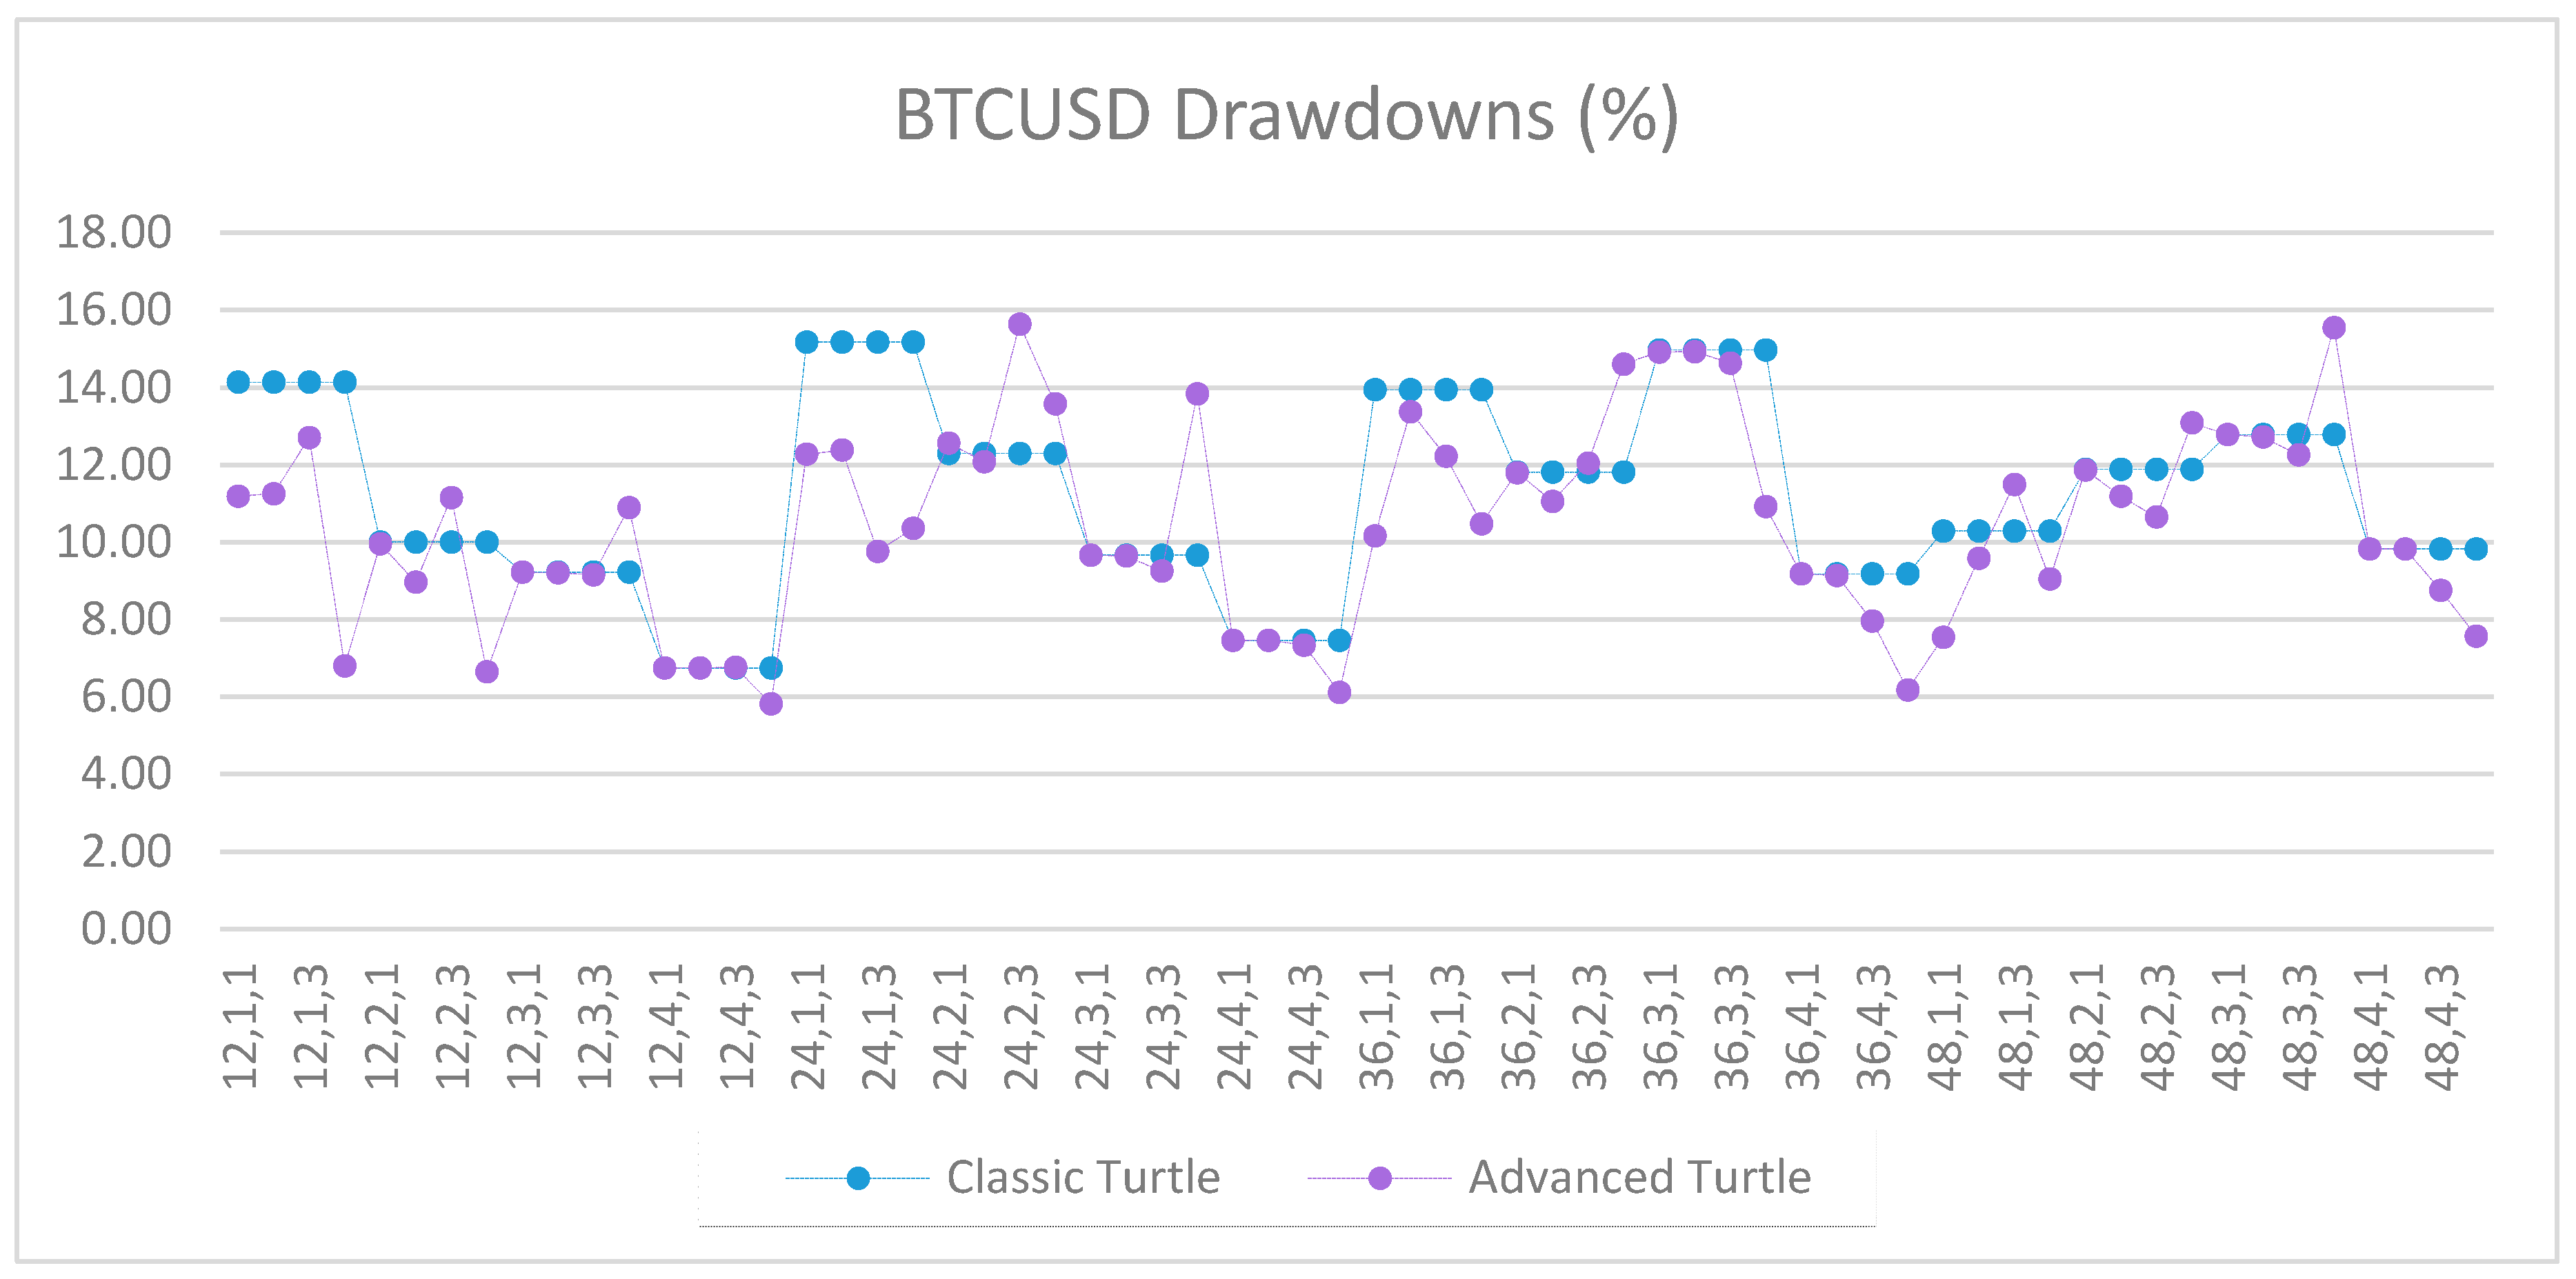
Figure A16.
Drawdowns of BTCUSD as percentage of equity between the classic and the advanced Turtle systems for every combination of N, X, Y for the fast parameters (20, 40).
Figure A16.
Drawdowns of BTCUSD as percentage of equity between the classic and the advanced Turtle systems for every combination of N, X, Y for the fast parameters (20, 40).
Figure A17.
Net profits of AUDUSD between the classic and the advanced Turtle systems for every combination of N, X, Y for the medium parameters (40, 80).
Figure A17.
Net profits of AUDUSD between the classic and the advanced Turtle systems for every combination of N, X, Y for the medium parameters (40, 80).
Figure A18.
Drawdowns of AUDUSD as percentage of equity between the classic and the advanced Turtle systems for every combination of N, X, Y for the medium parameters (40, 80).
Figure A18.
Drawdowns of AUDUSD as percentage of equity between the classic and the advanced Turtle systems for every combination of N, X, Y for the medium parameters (40, 80).
Figure A19.
Net profits of EURUSD between the classic and the advanced Turtle systems for every combination of N, X, Y for the medium parameters (40, 80).
Figure A19.
Net profits of EURUSD between the classic and the advanced Turtle systems for every combination of N, X, Y for the medium parameters (40, 80).
Figure A20.
Drawdowns of EURUSD as percentage of equity between the classic and the advanced Turtle systems for every combination of N, X, Y for the medium parameters (40, 80).
Figure A20.
Drawdowns of EURUSD as percentage of equity between the classic and the advanced Turtle systems for every combination of N, X, Y for the medium parameters (40, 80).
Figure A21.
Net profits of GBPUSD between the classic and the advanced Turtle systems for every combination of N, X, Y for the medium parameters (40, 80).
Figure A21.
Net profits of GBPUSD between the classic and the advanced Turtle systems for every combination of N, X, Y for the medium parameters (40, 80).
Figure A22.
Drawdowns of GBPUSD as percentage of equity between the classic and the advanced Turtle systems for every combination of N, X, Y for the medium parameters (40, 80).
Figure A22.
Drawdowns of GBPUSD as percentage of equity between the classic and the advanced Turtle systems for every combination of N, X, Y for the medium parameters (40, 80).
Figure A23.
Net profits of USDCHF between the classic and the advanced Turtle systems for every combination of N, X, Y for the medium parameters (40, 80).
Figure A23.
Net profits of USDCHF between the classic and the advanced Turtle systems for every combination of N, X, Y for the medium parameters (40, 80).
Figure A24.
Drawdowns of USDCHF as percentage of equity between the classic and the advanced Turtle systems for every combination of N, X, Y for the medium parameters (40, 80).
Figure A24.
Drawdowns of USDCHF as percentage of equity between the classic and the advanced Turtle systems for every combination of N, X, Y for the medium parameters (40, 80).
Figure A25.
Net profits of USDJPY between the classic and the advanced Turtle systems for every combination of N, X, Y for the medium parameters (40, 80).
Figure A25.
Net profits of USDJPY between the classic and the advanced Turtle systems for every combination of N, X, Y for the medium parameters (40, 80).
Figure A26.
Drawdowns of USDJPY as percentage of equity between the classic and the advanced Turtle systems for every combination of N, X, Y for the medium parameters (40, 80).
Figure A26.
Drawdowns of USDJPY as percentage of equity between the classic and the advanced Turtle systems for every combination of N, X, Y for the medium parameters (40, 80).
Figure A27.
Net profits of XAUUSD between the classic and the advanced Turtle systems for every combination of N, X, Y for the medium parameters (40, 80).
Figure A27.
Net profits of XAUUSD between the classic and the advanced Turtle systems for every combination of N, X, Y for the medium parameters (40, 80).
Figure A28.
Drawdowns of XAUUSD as percentage of equity between the classic and the advanced Turtle systems for every combination of N, X, Y for the medium parameters (40, 80).
Figure A28.
Drawdowns of XAUUSD as percentage of equity between the classic and the advanced Turtle systems for every combination of N, X, Y for the medium parameters (40, 80).
Figure A29.
Net profits of OIL between the classic and the advanced Turtle systems for every combination of N, X, Y for the medium parameters (40, 80).
Figure A29.
Net profits of OIL between the classic and the advanced Turtle systems for every combination of N, X, Y for the medium parameters (40, 80).
Figure A30.
Drawdowns of OIL as percentage of equity between the classic and the advanced Turtle systems for every combination of N, X, Y for the medium parameters (40, 80).
Figure A30.
Drawdowns of OIL as percentage of equity between the classic and the advanced Turtle systems for every combination of N, X, Y for the medium parameters (40, 80).
Figure A31.
Net profits of BTCUSD between the classic and the advanced Turtle systems for every combination of N, X, Y for the medium parameters (40, 80).
Figure A31.
Net profits of BTCUSD between the classic and the advanced Turtle systems for every combination of N, X, Y for the medium parameters (40, 80).
Figure A32.
Drawdowns of BTCUSD as percentage of equity between the classic and the advanced Turtle systems for every combination of N, X, Y for the medium parameters (40, 80).
Figure A32.
Drawdowns of BTCUSD as percentage of equity between the classic and the advanced Turtle systems for every combination of N, X, Y for the medium parameters (40, 80).
Figure A33.
Net profits of AUDUSD between the classic and the advanced Turtle systems for every combination of N, X, Y for the slow parameters (80, 160).
Figure A33.
Net profits of AUDUSD between the classic and the advanced Turtle systems for every combination of N, X, Y for the slow parameters (80, 160).
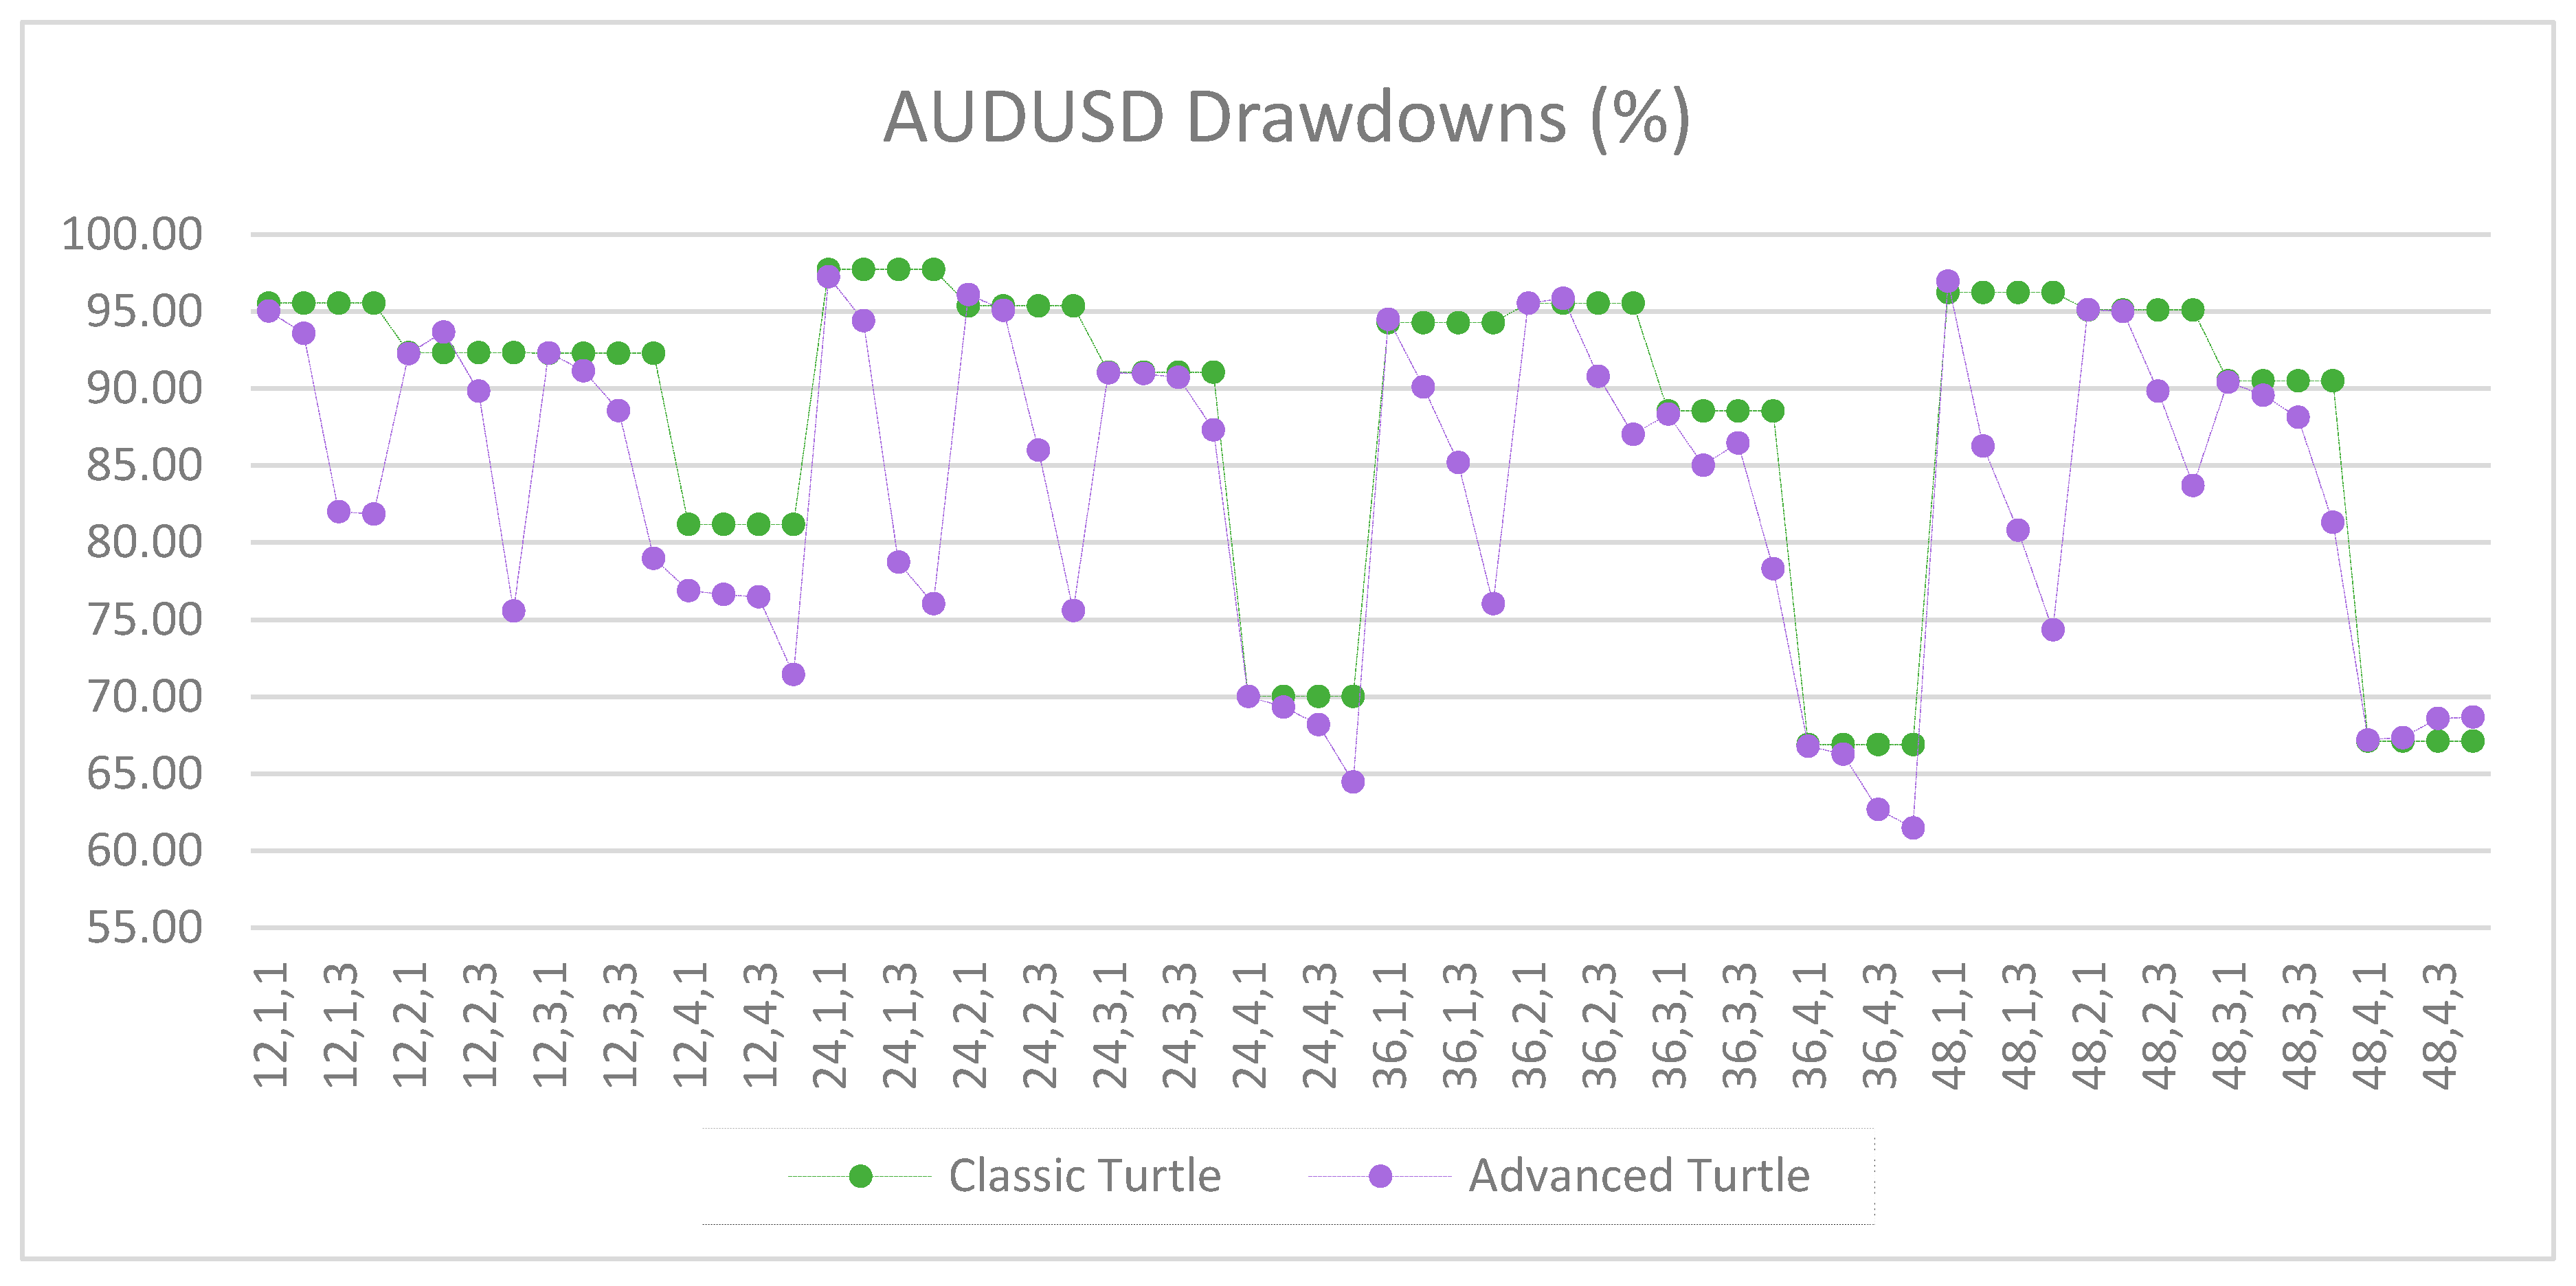
Figure A34.
Drawdowns of AUDUSD as percentage of equity between the classic and the advanced Turtle systems for every combination of N, X, Y for the slow parameters (80, 160).
Figure A34.
Drawdowns of AUDUSD as percentage of equity between the classic and the advanced Turtle systems for every combination of N, X, Y for the slow parameters (80, 160).
Figure A35.
Net profits of EURUSD between the classic and the advanced Turtle systems for every combination of N, X, Y for the slow parameters (80, 160).
Figure A35.
Net profits of EURUSD between the classic and the advanced Turtle systems for every combination of N, X, Y for the slow parameters (80, 160).
Figure A36.
Drawdowns of EURUSD as percentage of equity between the classic and the advanced Turtle systems for every combination of N, X, Y for the slow parameters (80, 160).
Figure A36.
Drawdowns of EURUSD as percentage of equity between the classic and the advanced Turtle systems for every combination of N, X, Y for the slow parameters (80, 160).
Figure A37.
Net profits of GBPUSD between the classic and the advanced Turtle systems for every combination of N, X, Y for the slow parameters (80, 160).
Figure A37.
Net profits of GBPUSD between the classic and the advanced Turtle systems for every combination of N, X, Y for the slow parameters (80, 160).
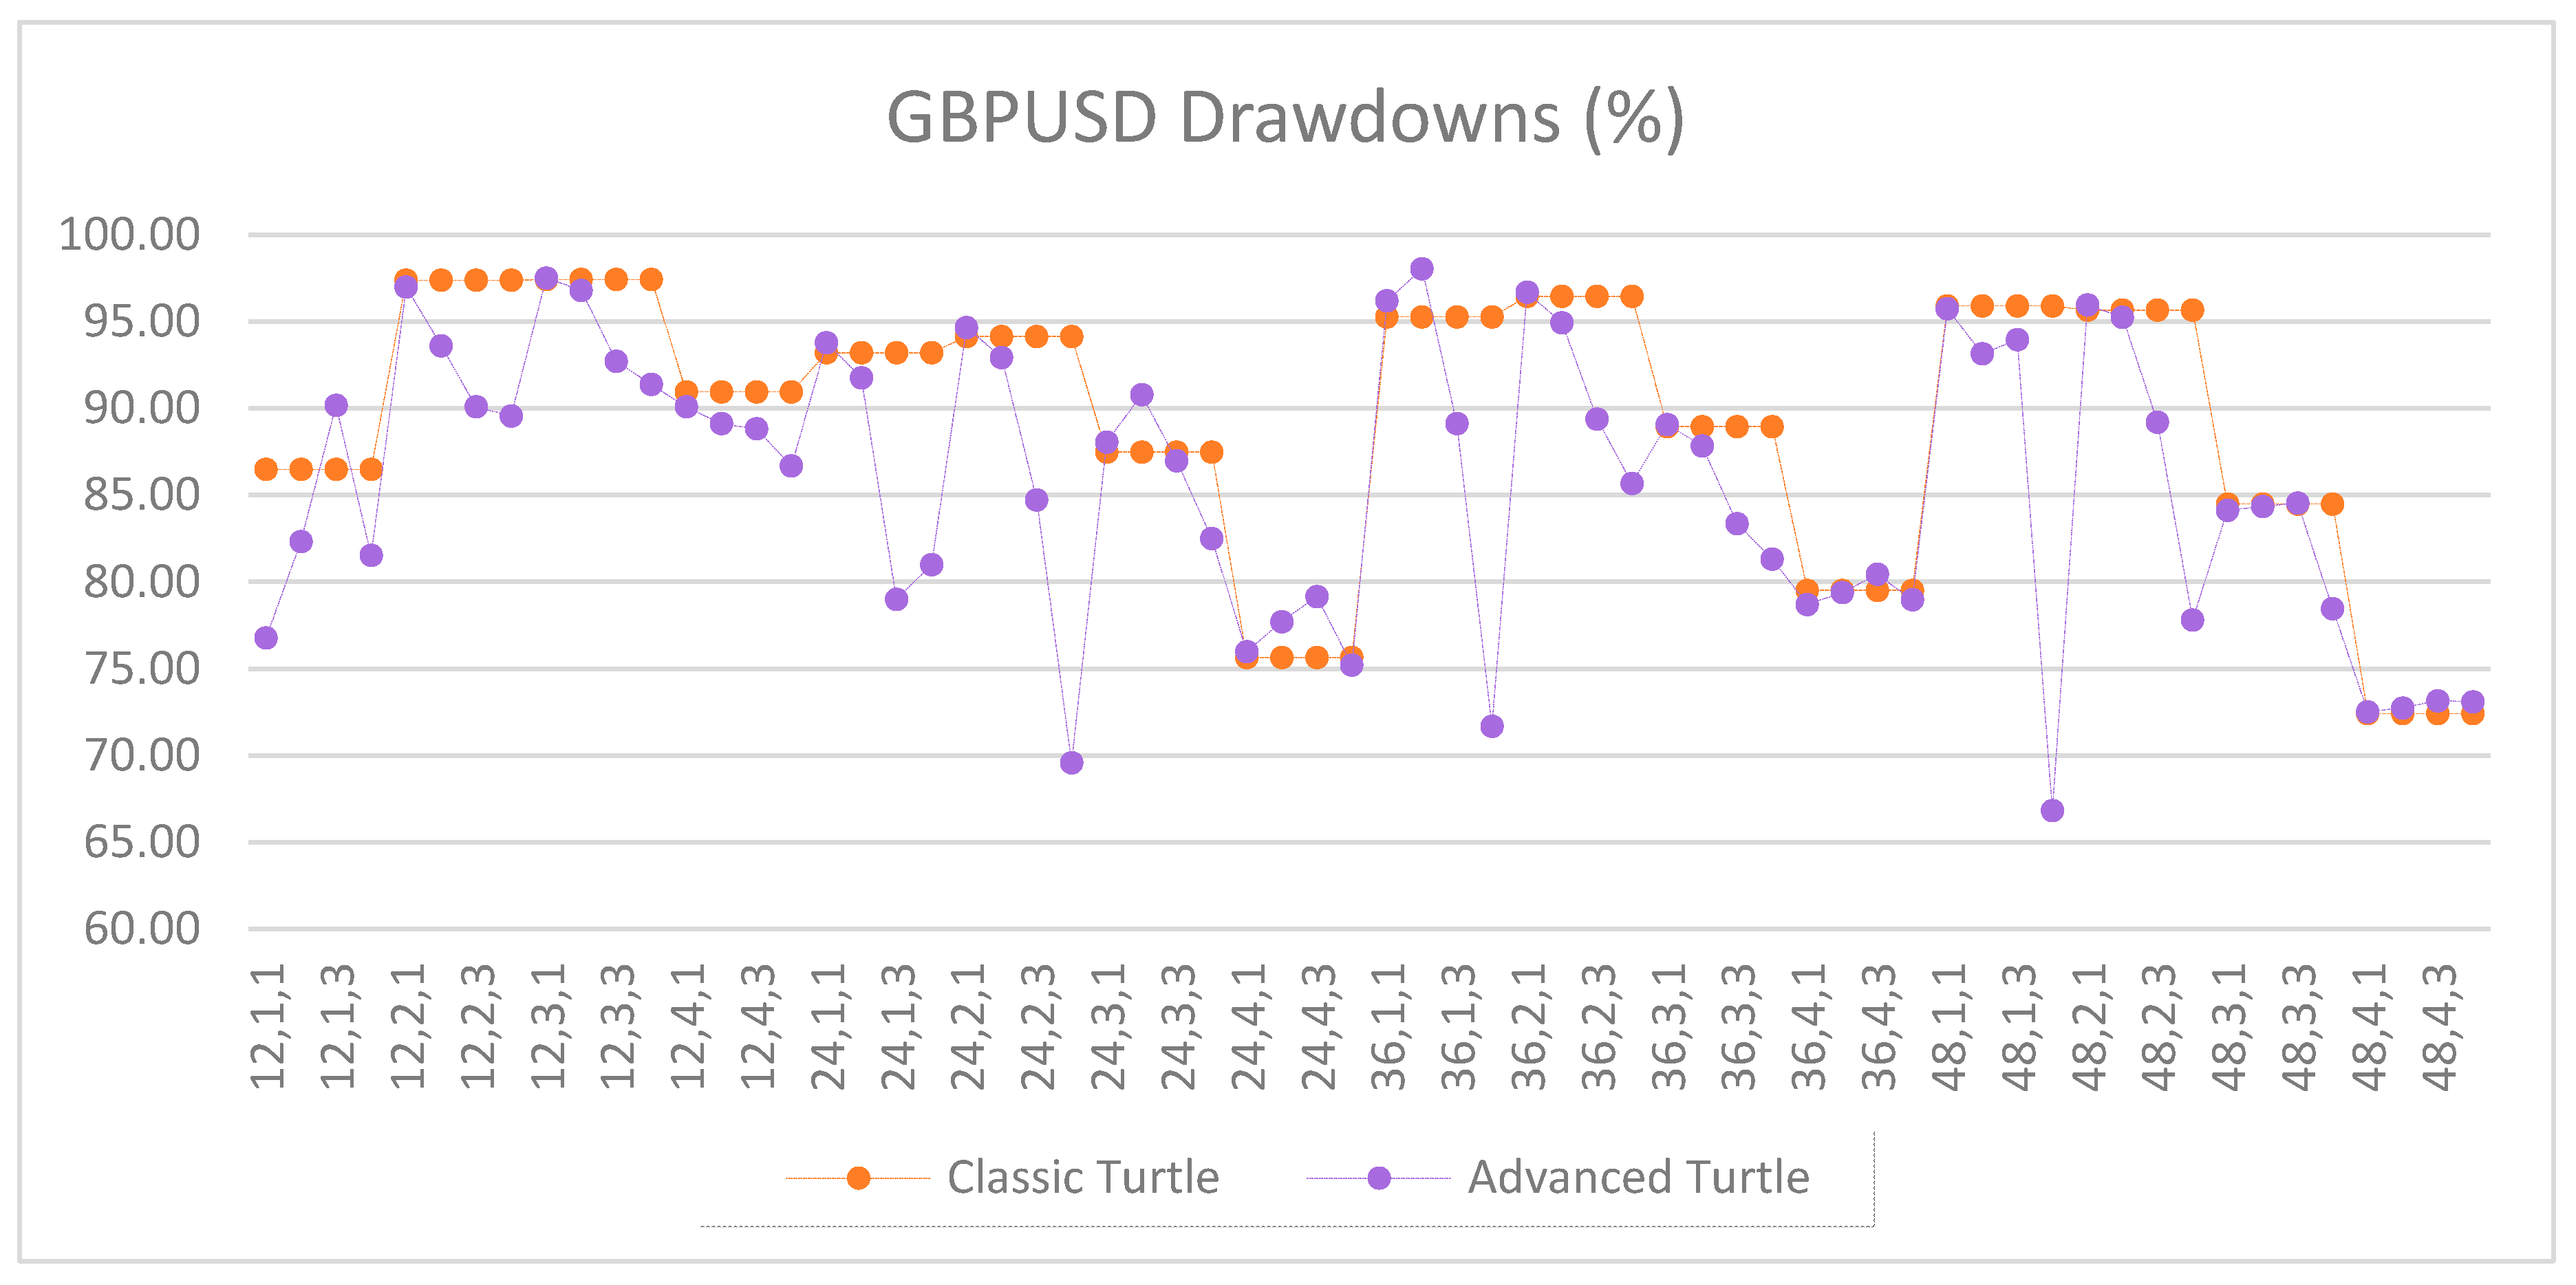
Figure A38.
Drawdowns of GBPUSD as percentage of equity between the classic and the advanced Turtle systems for every combination of N, X, Y for the slow parameters (80, 160).
Figure A38.
Drawdowns of GBPUSD as percentage of equity between the classic and the advanced Turtle systems for every combination of N, X, Y for the slow parameters (80, 160).
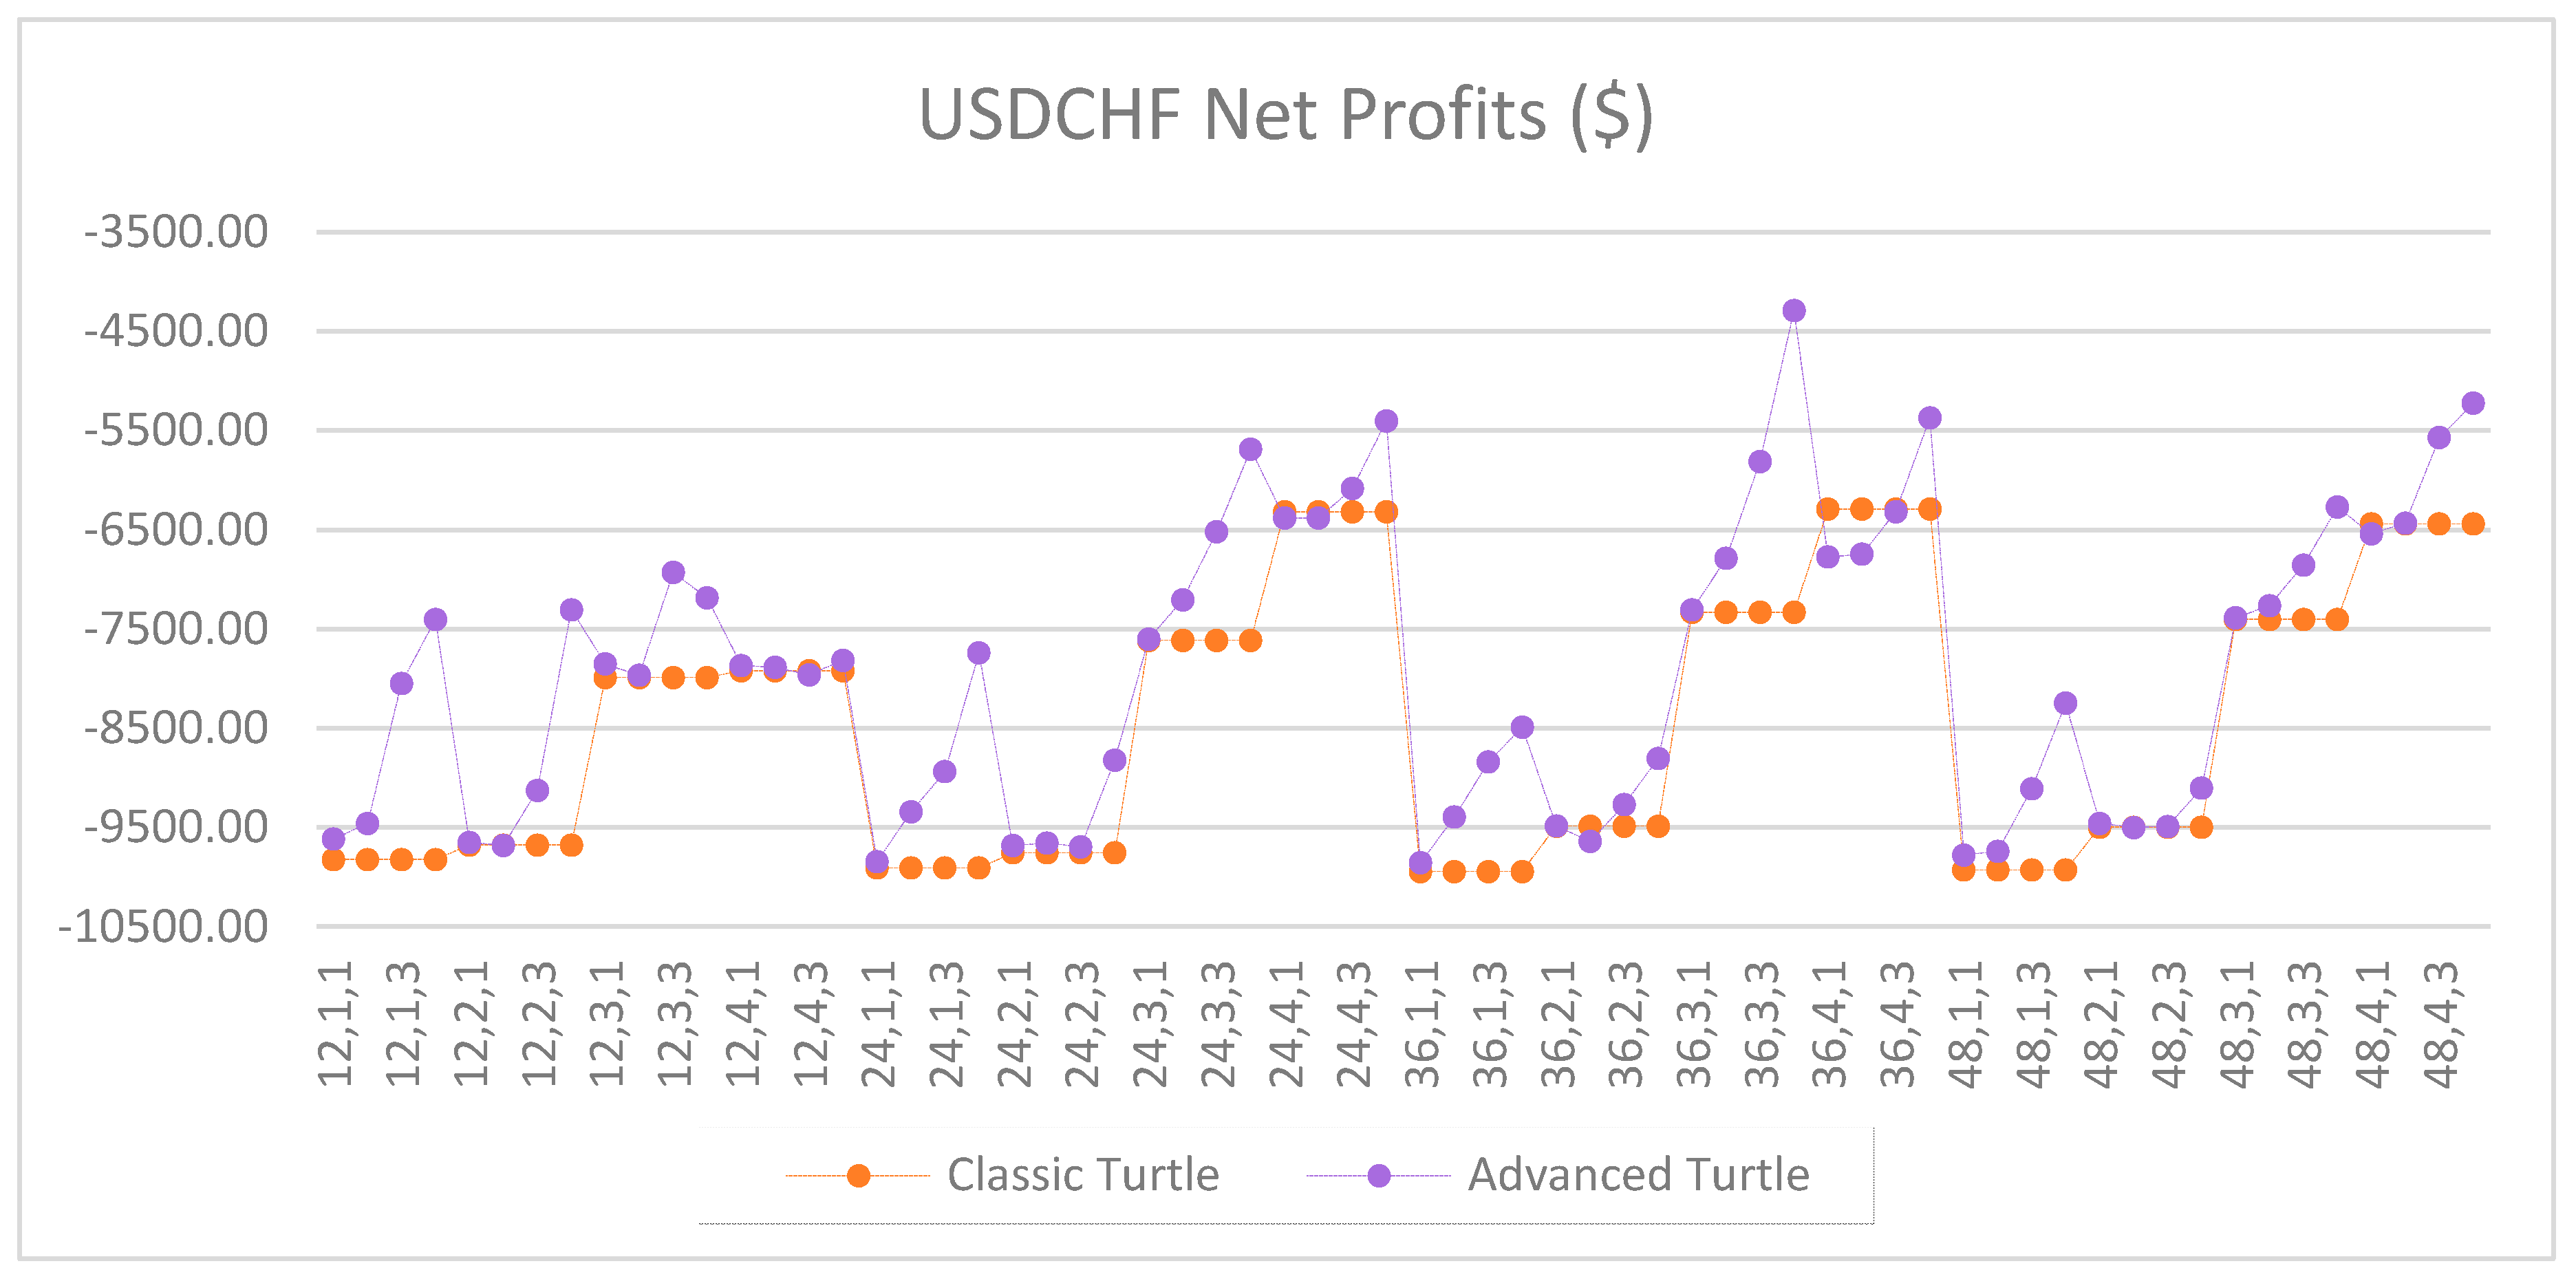
Figure A39.
Net profits of USDCHF between the classic and the advanced Turtle systems for every combination of N, X, Y for the slow parameters (80, 160).
Figure A39.
Net profits of USDCHF between the classic and the advanced Turtle systems for every combination of N, X, Y for the slow parameters (80, 160).
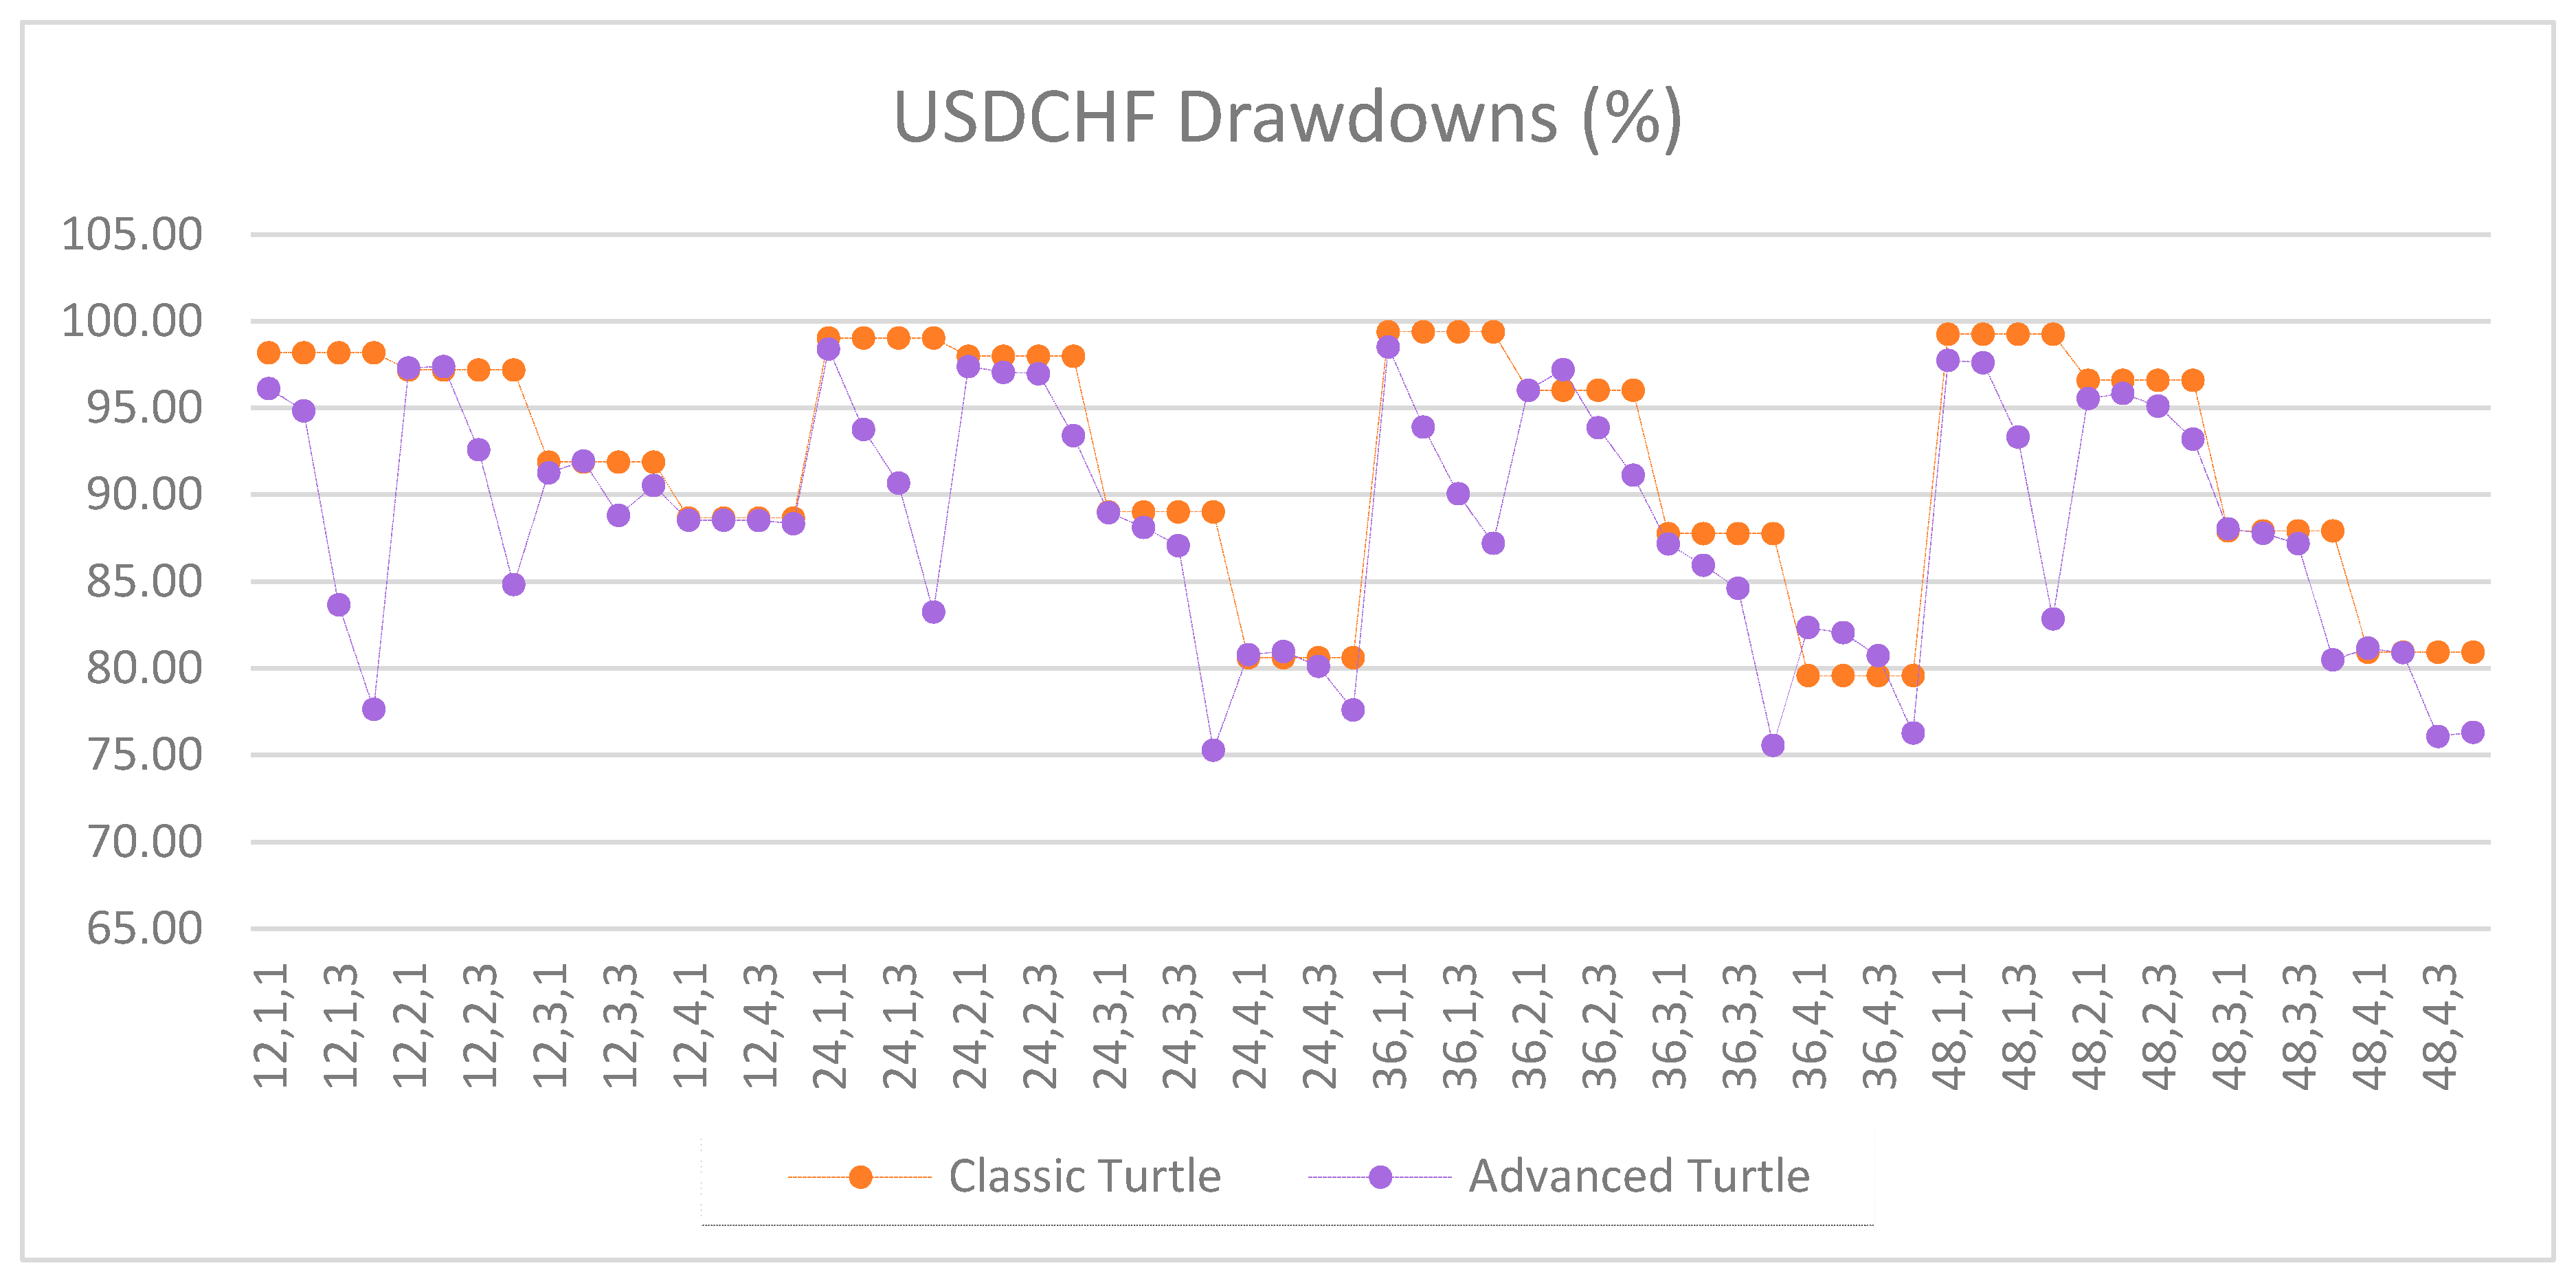
Figure A40.
Drawdowns of USDCHF as percentage of equity between the classic and the advanced Turtle systems for every combination of N, X, Y for the slow parameters (80, 160).
Figure A40.
Drawdowns of USDCHF as percentage of equity between the classic and the advanced Turtle systems for every combination of N, X, Y for the slow parameters (80, 160).
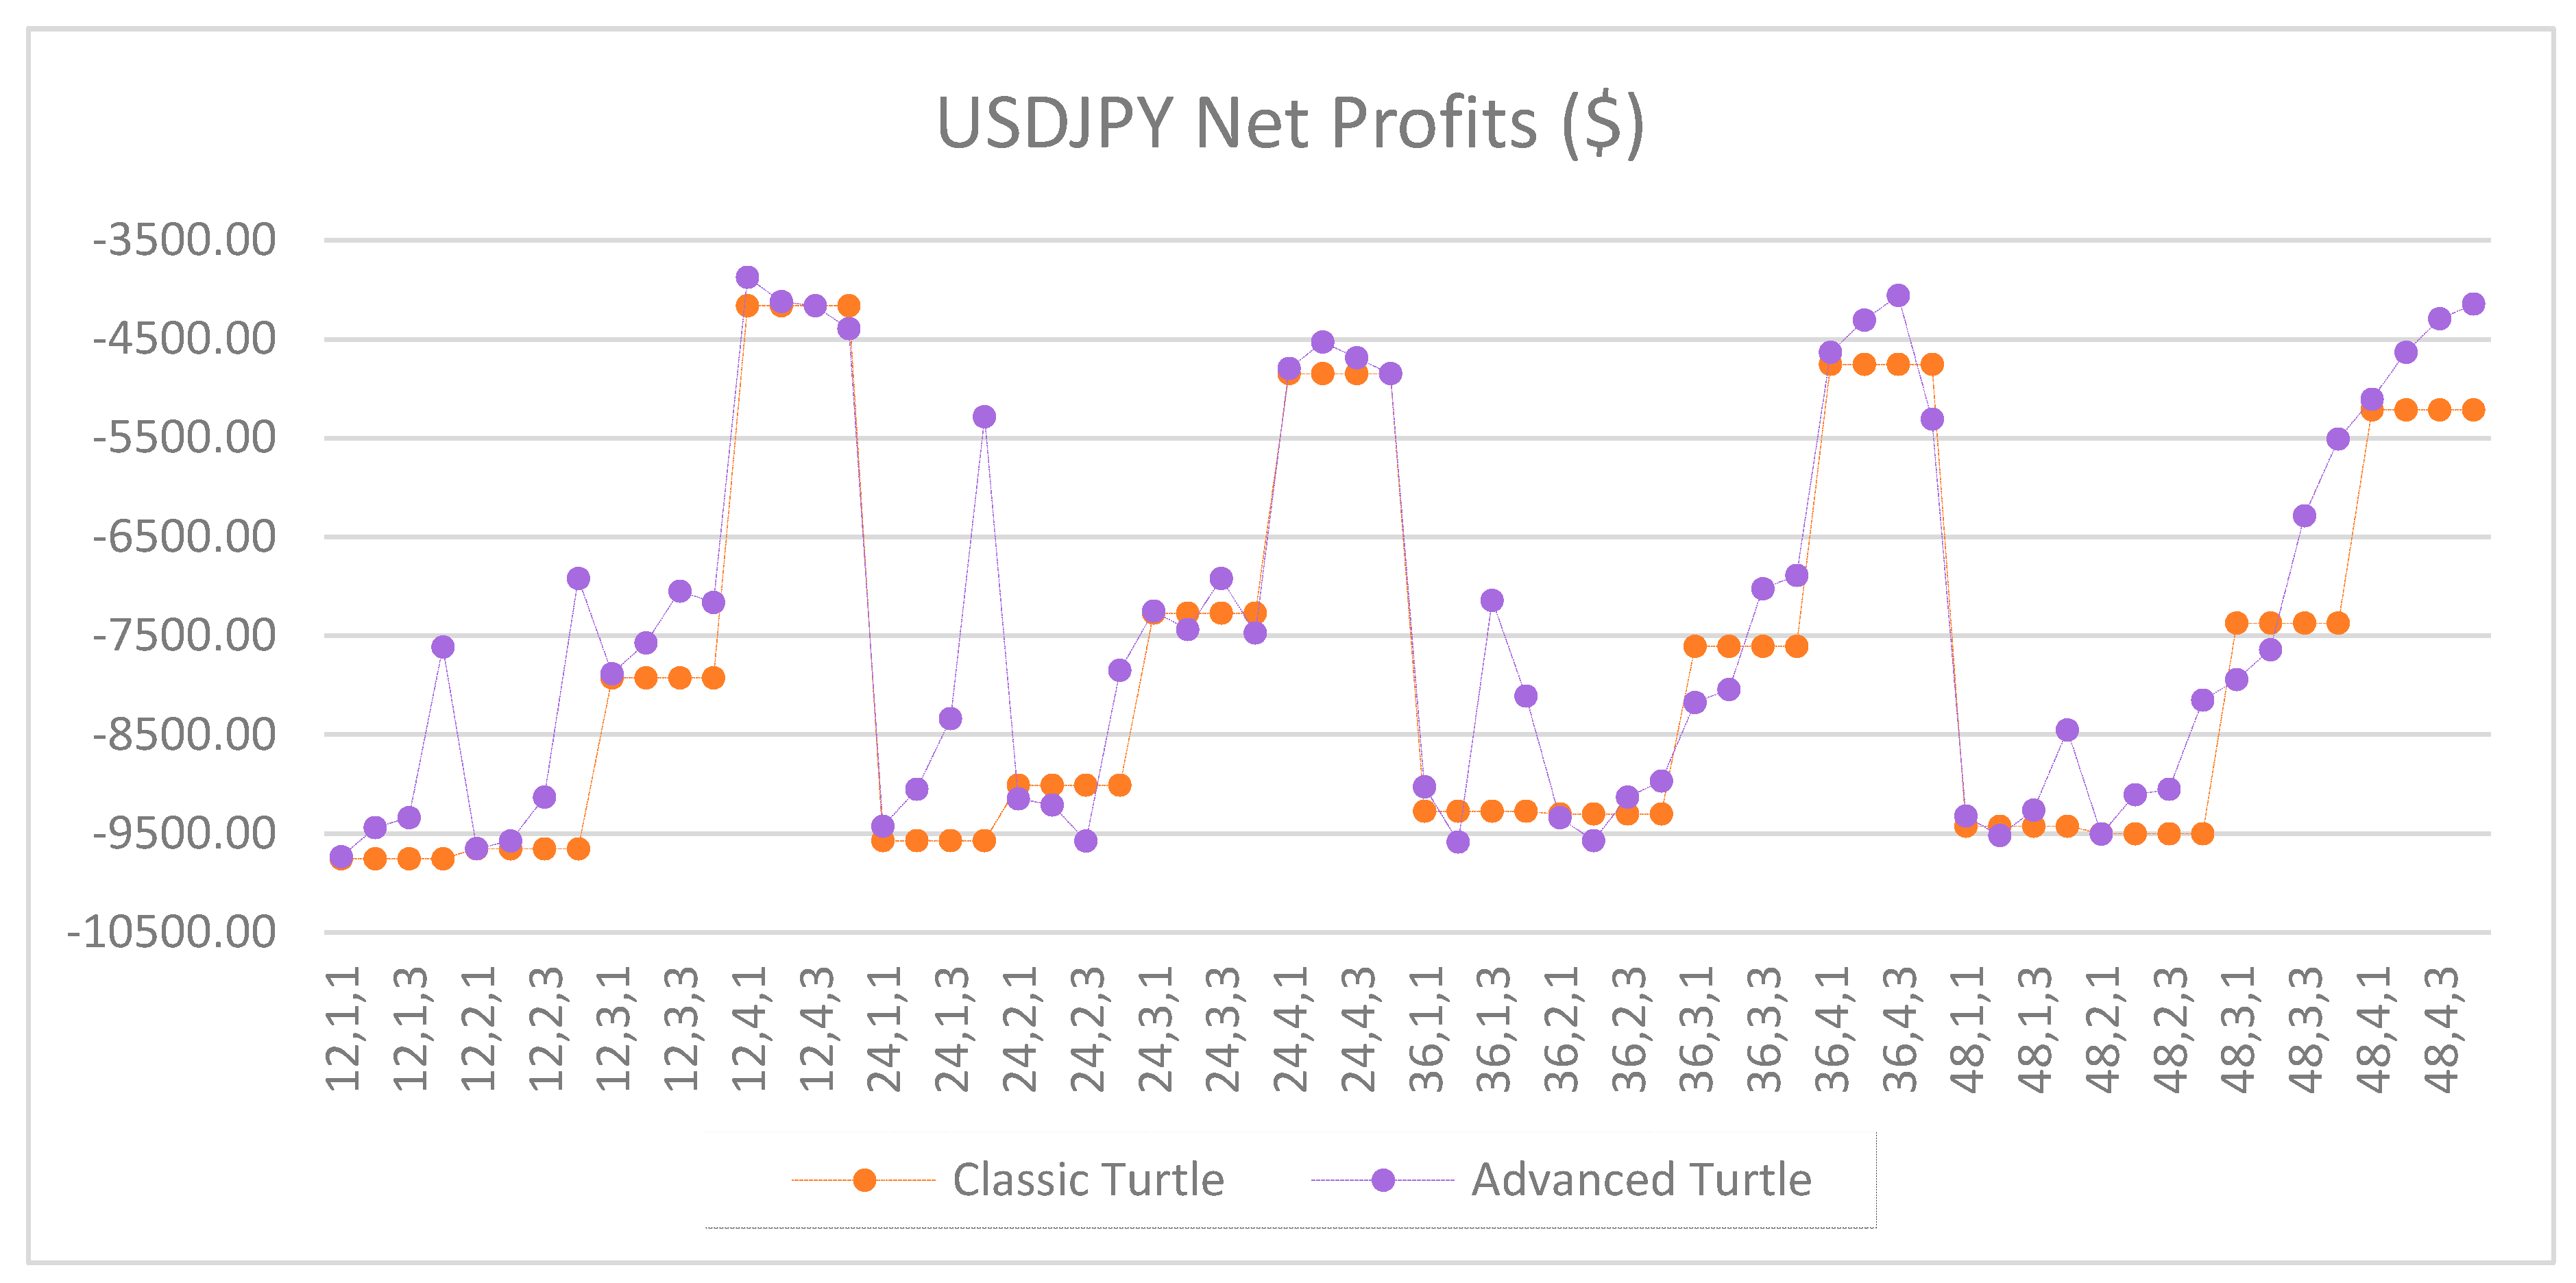
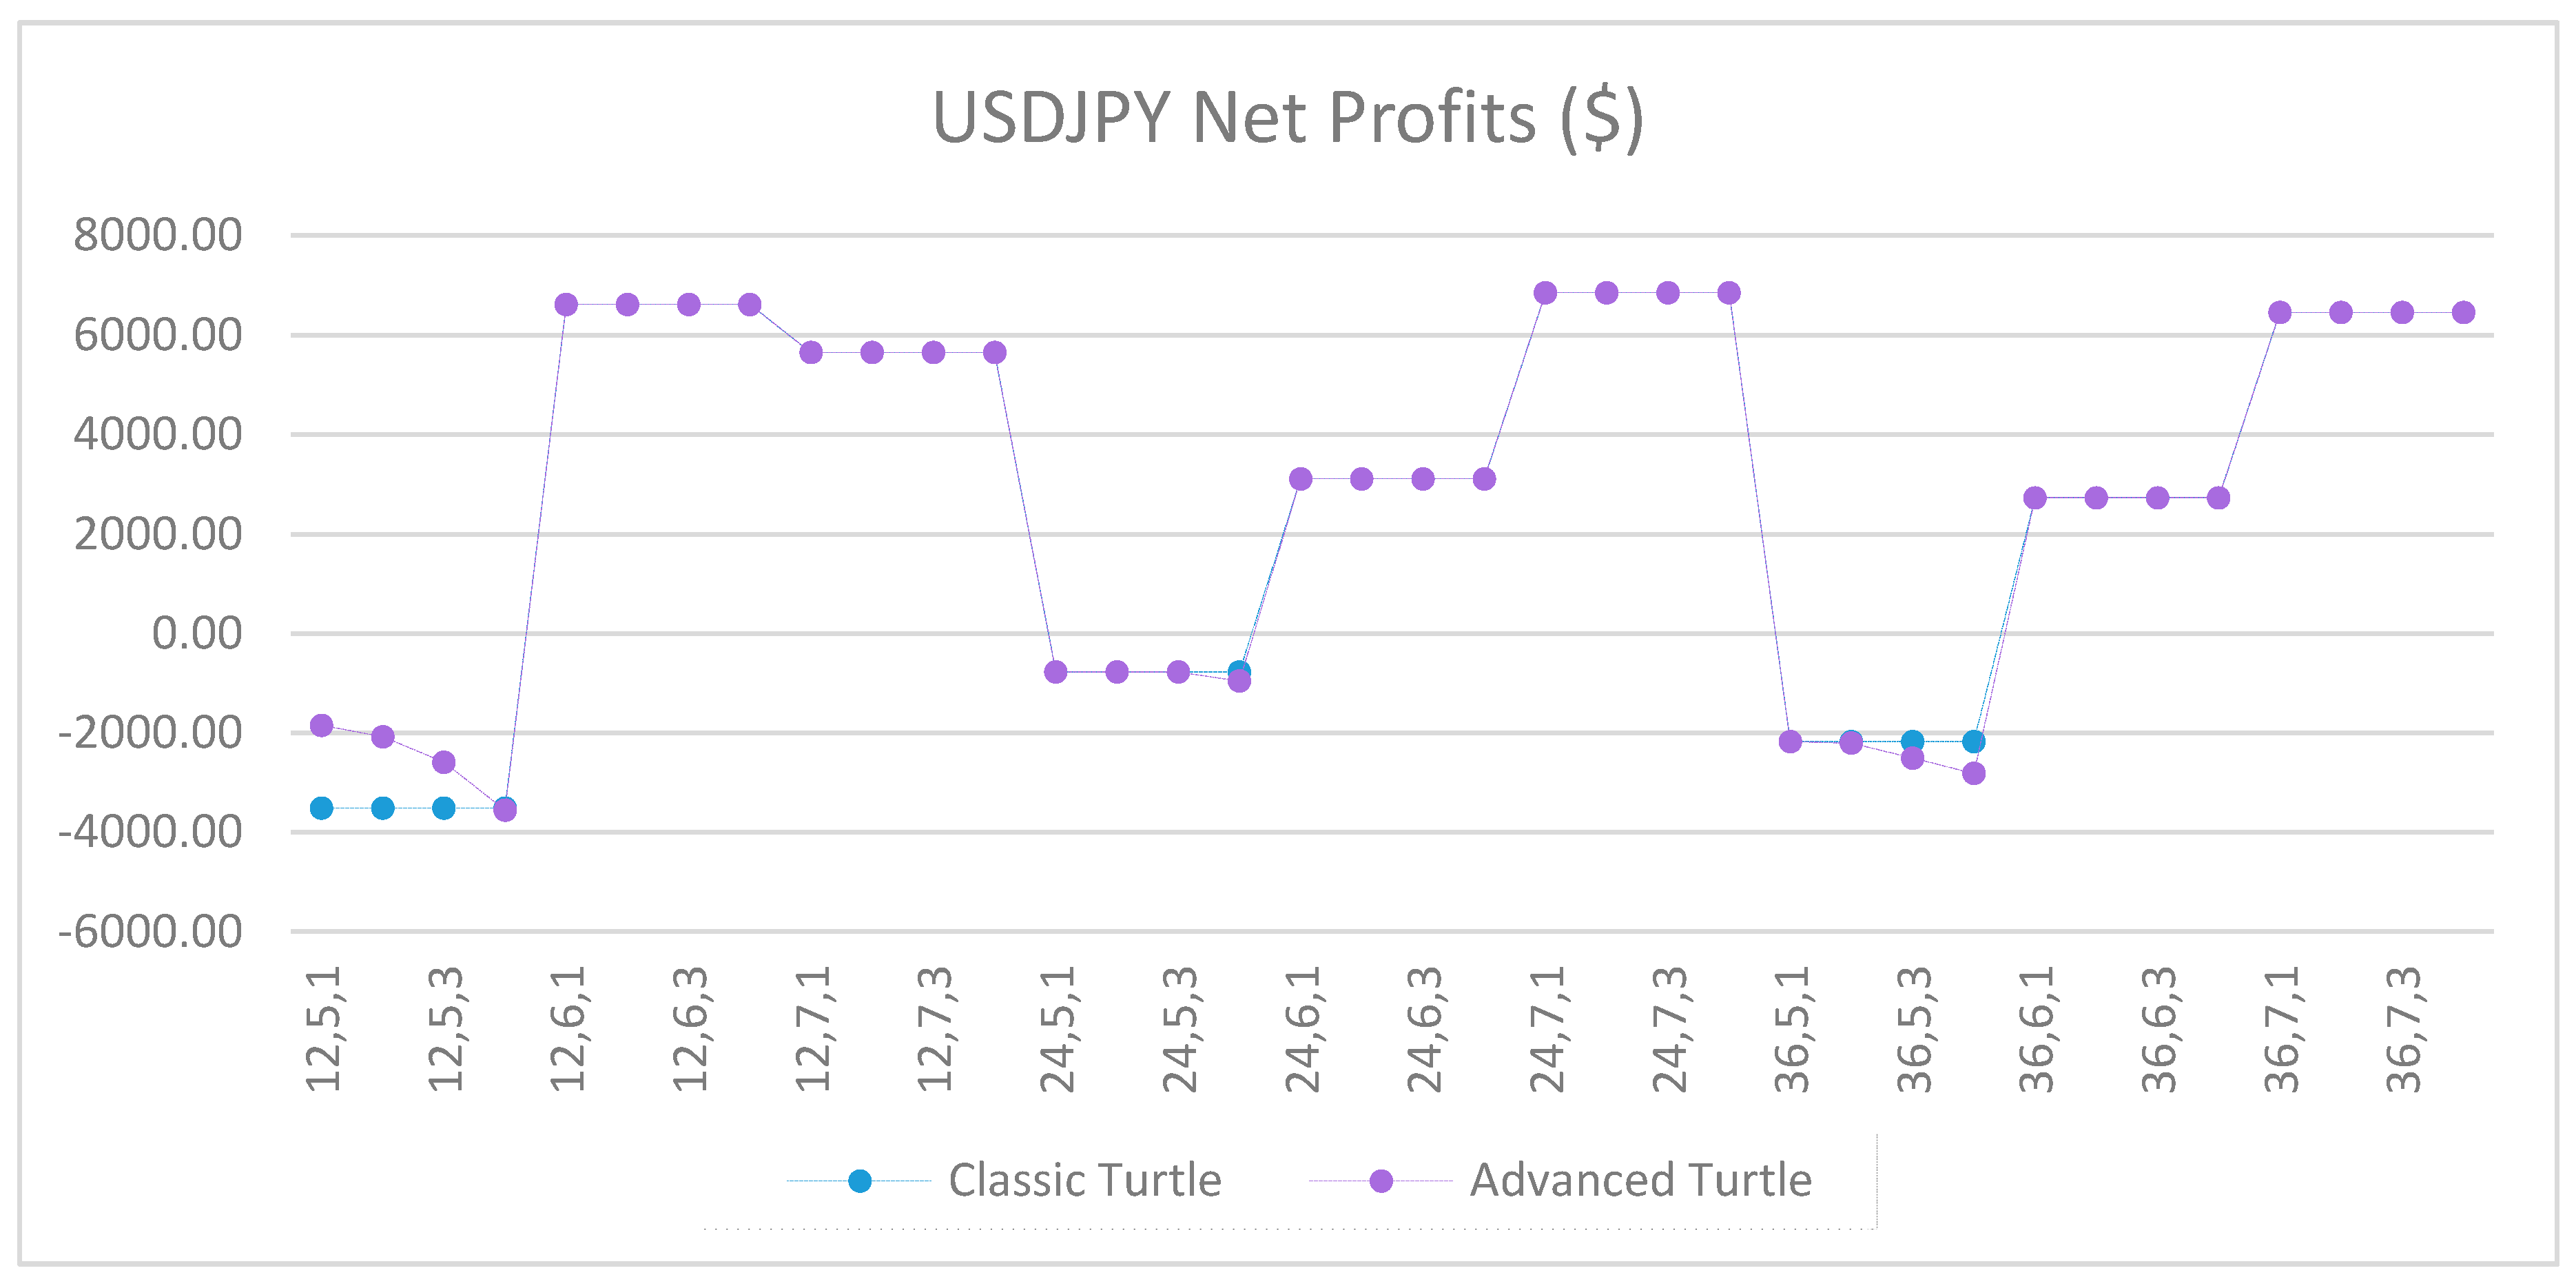
Figure A41.
Net profits of USDJPY between the classic and the advanced Turtle systems for every combination of N, X, Y for the slow parameters (80, 160).
Figure A41.
Net profits of USDJPY between the classic and the advanced Turtle systems for every combination of N, X, Y for the slow parameters (80, 160).
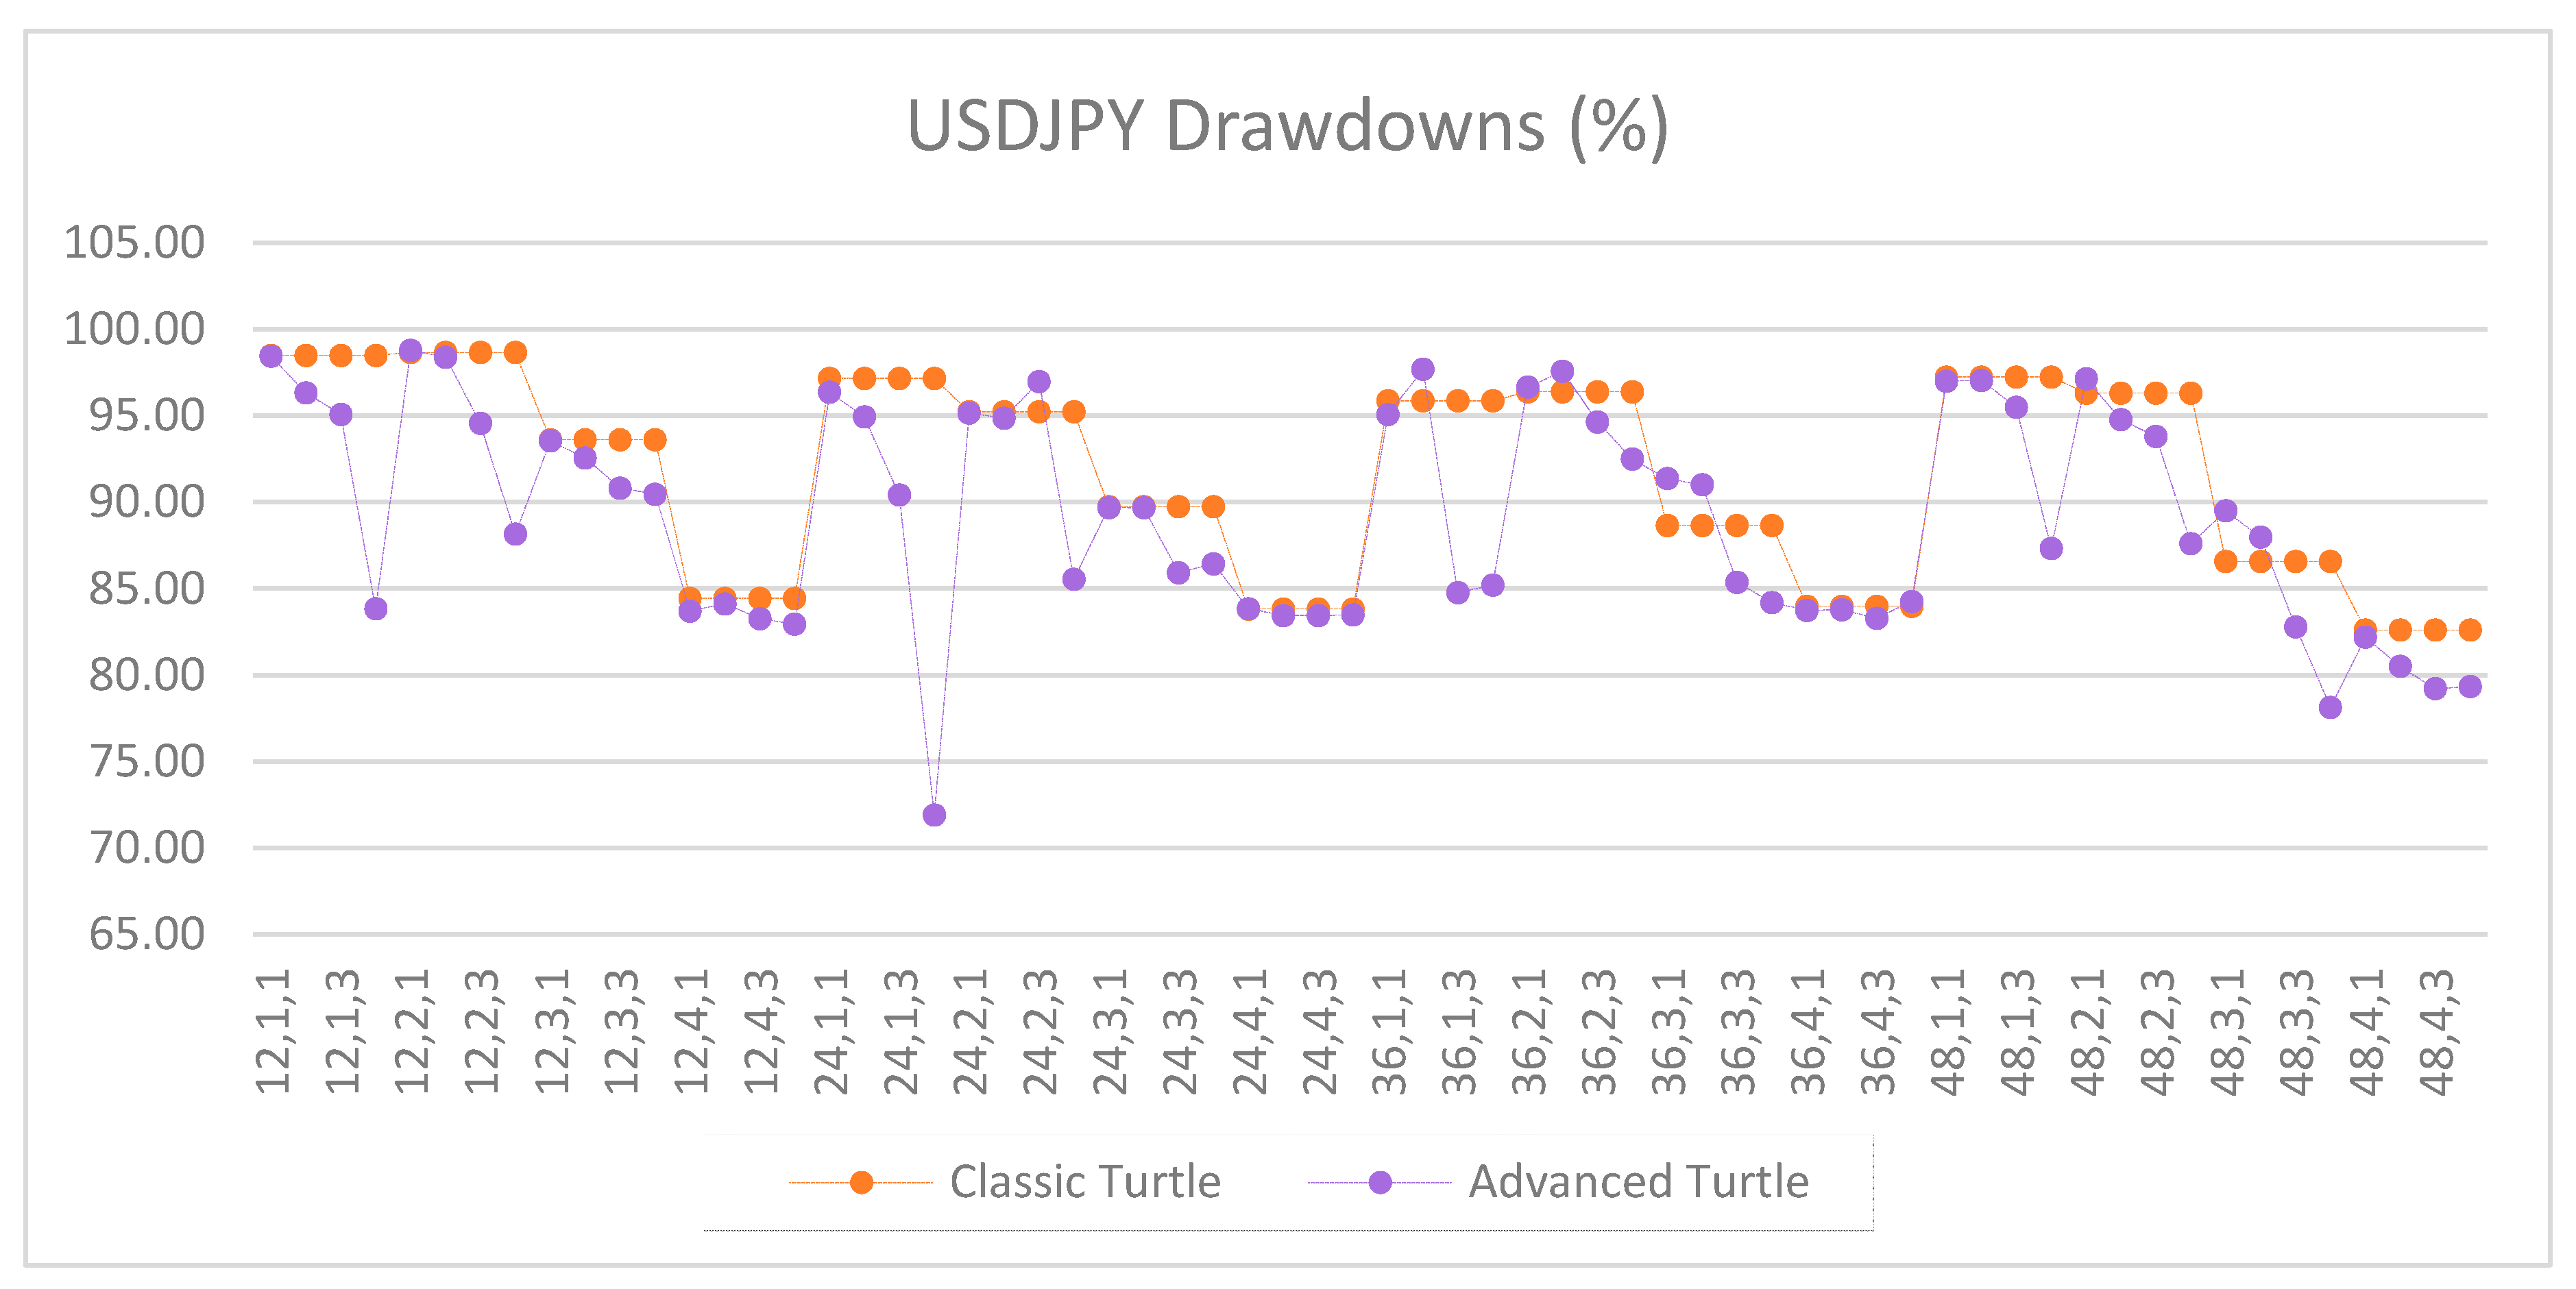
Figure A42.
Drawdowns of USDJPY as percentage of equity between the classic and the advanced Turtle systems for every combination of N, X, Y for the slow parameters (80, 160).
Figure A42.
Drawdowns of USDJPY as percentage of equity between the classic and the advanced Turtle systems for every combination of N, X, Y for the slow parameters (80, 160).
Figure A43.
Net profits of XAUUSD between the classic and the advanced Turtle systems for every combination of N, X, Y for the slow parameters (80, 160).
Figure A43.
Net profits of XAUUSD between the classic and the advanced Turtle systems for every combination of N, X, Y for the slow parameters (80, 160).
Figure A44.
Drawdowns of XAUUSD as percentage of equity between the classic and the advanced Turtle systems for every combination of N, X, Y for the slow parameters (80, 160).
Figure A44.
Drawdowns of XAUUSD as percentage of equity between the classic and the advanced Turtle systems for every combination of N, X, Y for the slow parameters (80, 160).
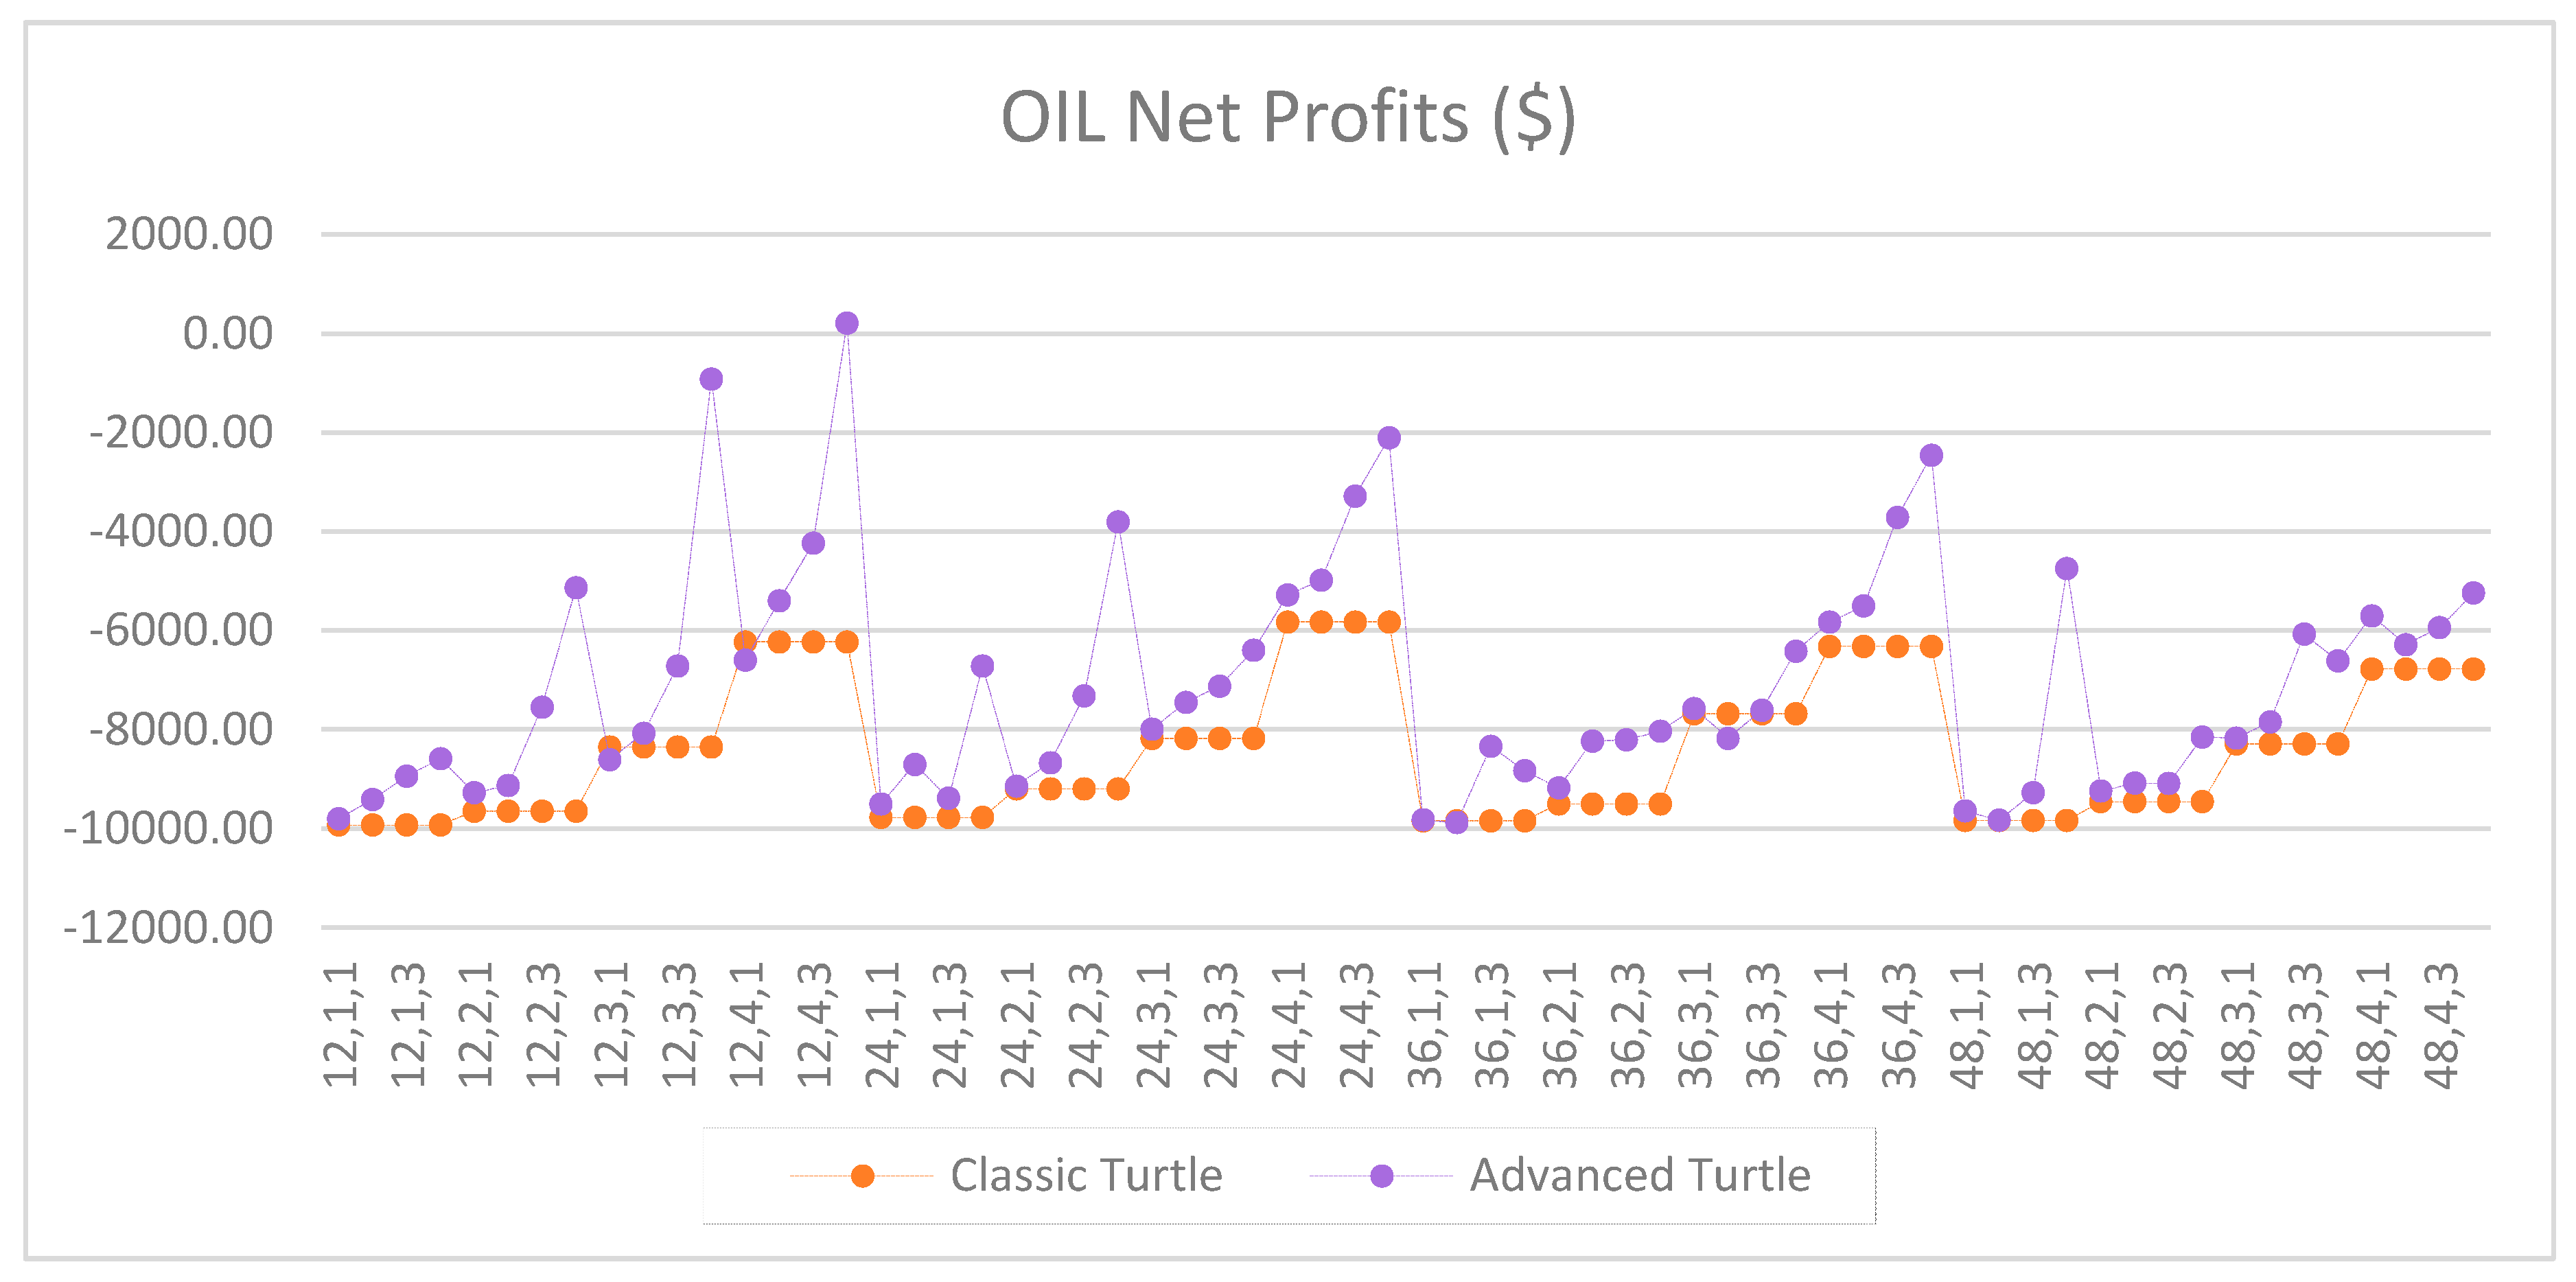
Figure A45.
Net profits of OIL between the classic and the advanced Turtle systems for every combination of N, X, Y for the slow parameters (80, 160).
Figure A45.
Net profits of OIL between the classic and the advanced Turtle systems for every combination of N, X, Y for the slow parameters (80, 160).
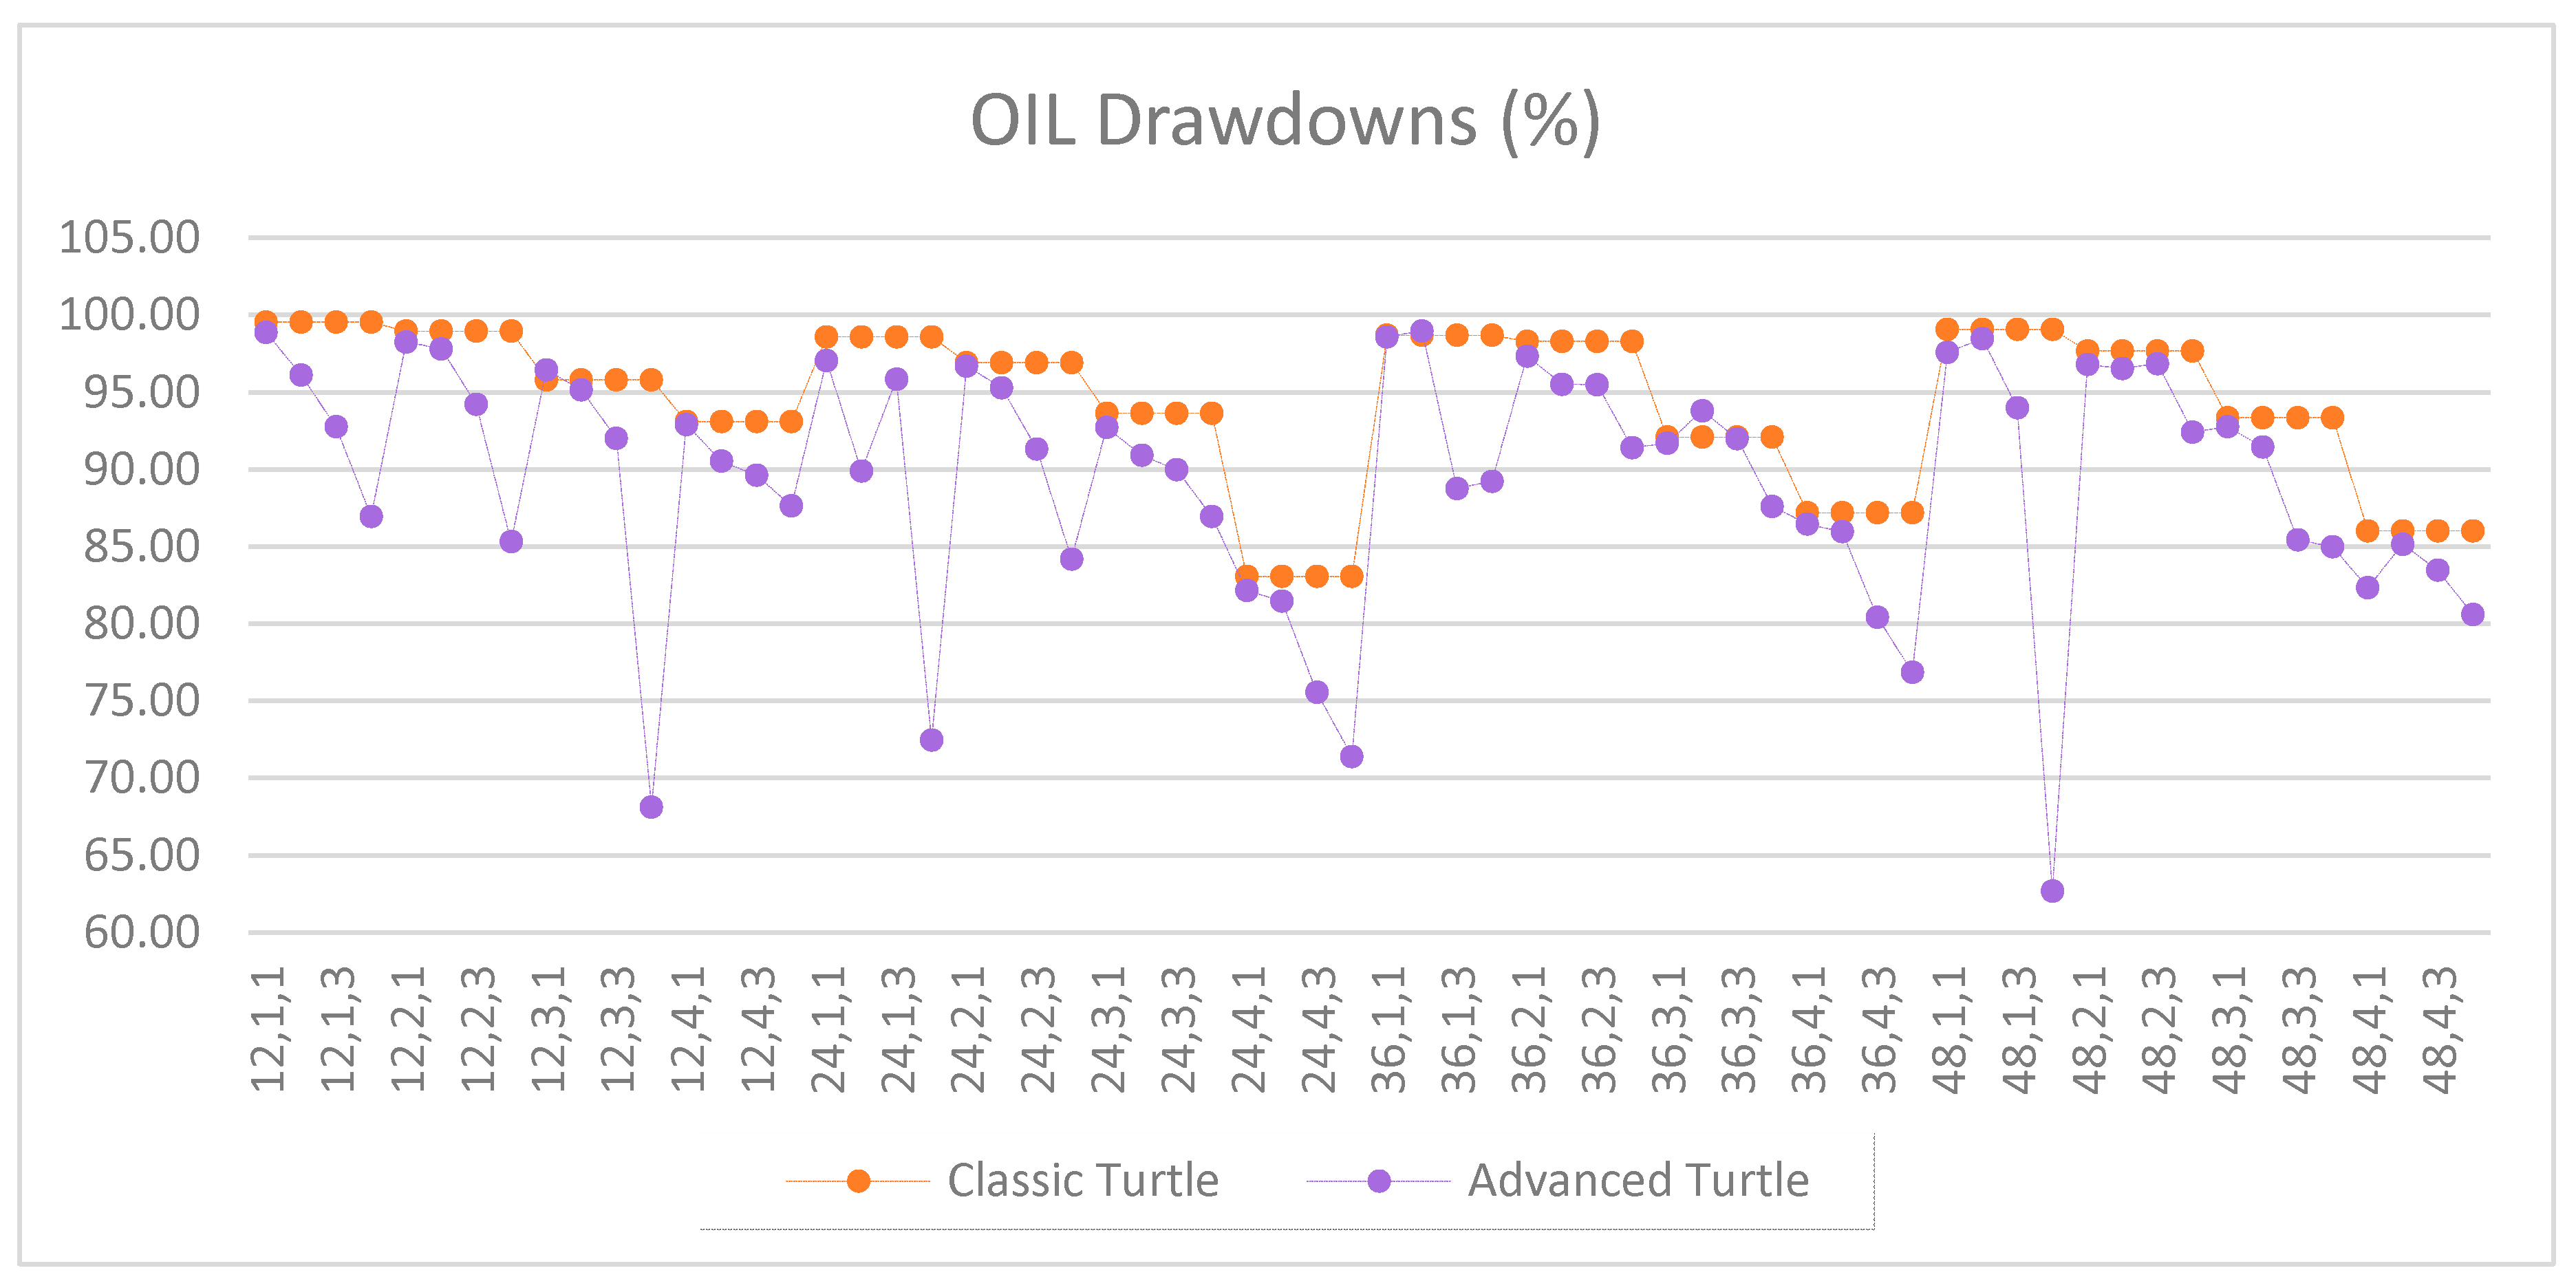
Figure A46.
Drawdowns of OIL as percentage of equity between the classic and the advanced Turtle systems for every combination of N, X, Y for the slow parameters (80, 160).
Figure A46.
Drawdowns of OIL as percentage of equity between the classic and the advanced Turtle systems for every combination of N, X, Y for the slow parameters (80, 160).
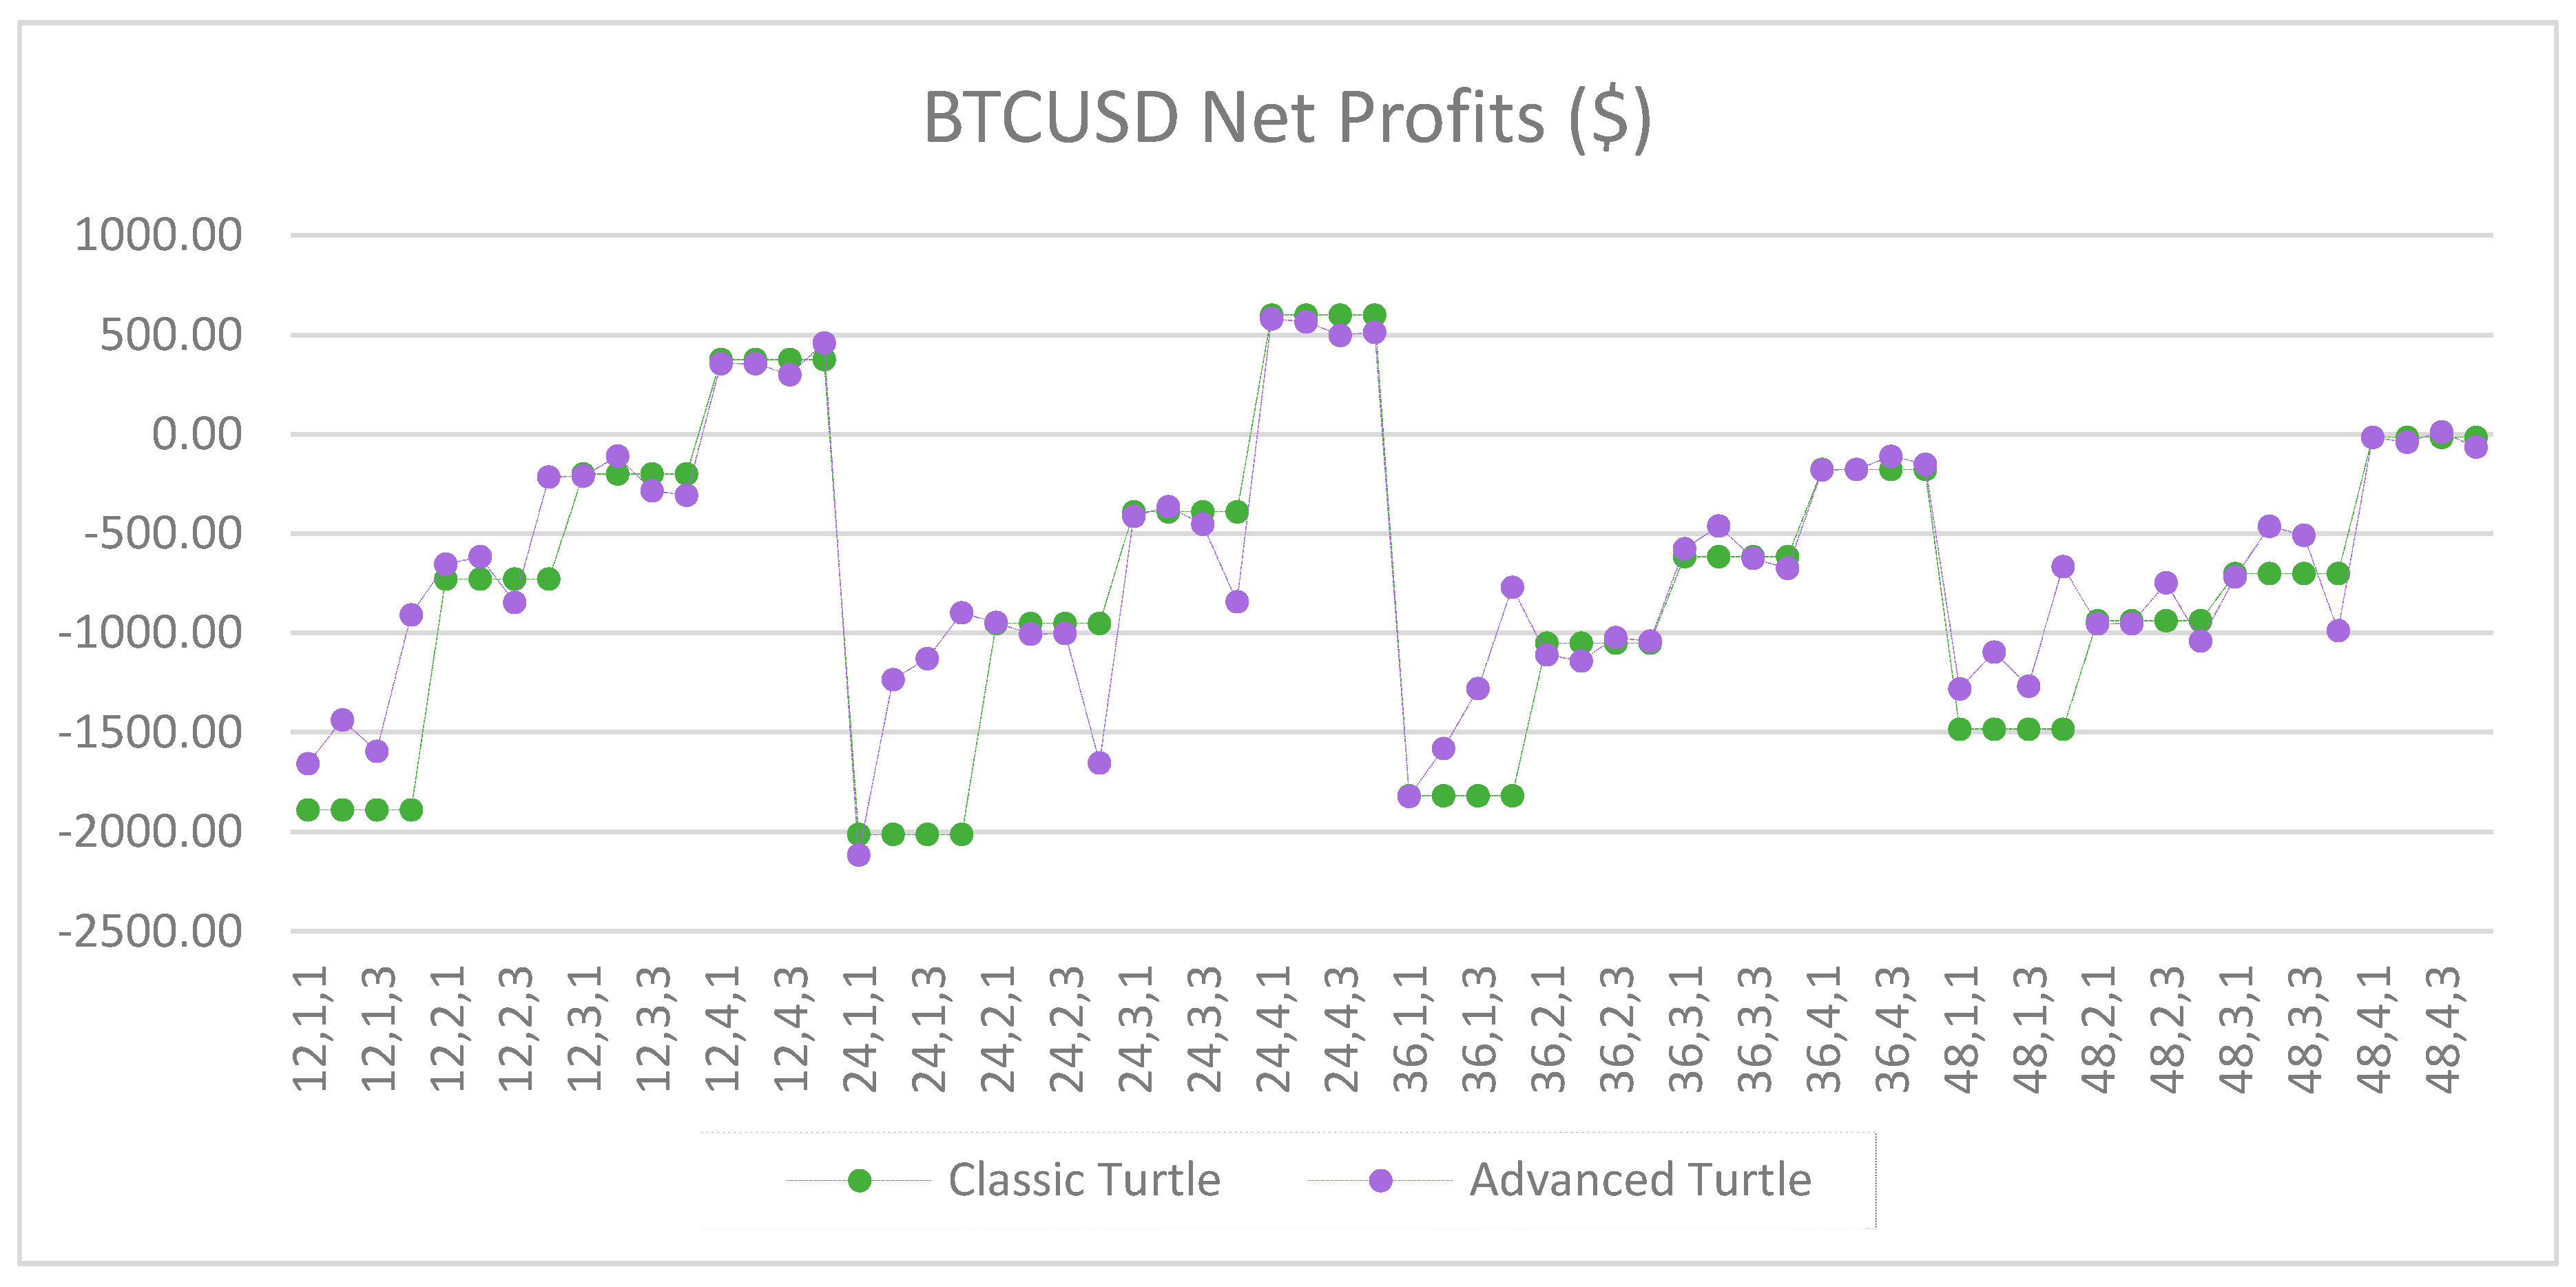
Figure A47.
Net profits of BTCUSD between the classic and the advanced Turtle systems for every combination of N, X, Y for the slow parameters (80, 160).
Figure A47.
Net profits of BTCUSD between the classic and the advanced Turtle systems for every combination of N, X, Y for the slow parameters (80, 160).
Figure A48.
Drawdowns of BTCUSD as percentage of equity between the classic and the advanced Turtle systems for every combination of N, X, Y for the slow parameters (80, 160).
Figure A48.
Drawdowns of BTCUSD as percentage of equity between the classic and the advanced Turtle systems for every combination of N, X, Y for the slow parameters (80, 160).
Figure A49.
Net profits of BTCUSD between the classic and the advanced Turtle systems for every combination of N, X, Y for the slow parameters (80, 160), where X ≥ 5.
Figure A49.
Net profits of BTCUSD between the classic and the advanced Turtle systems for every combination of N, X, Y for the slow parameters (80, 160), where X ≥ 5.
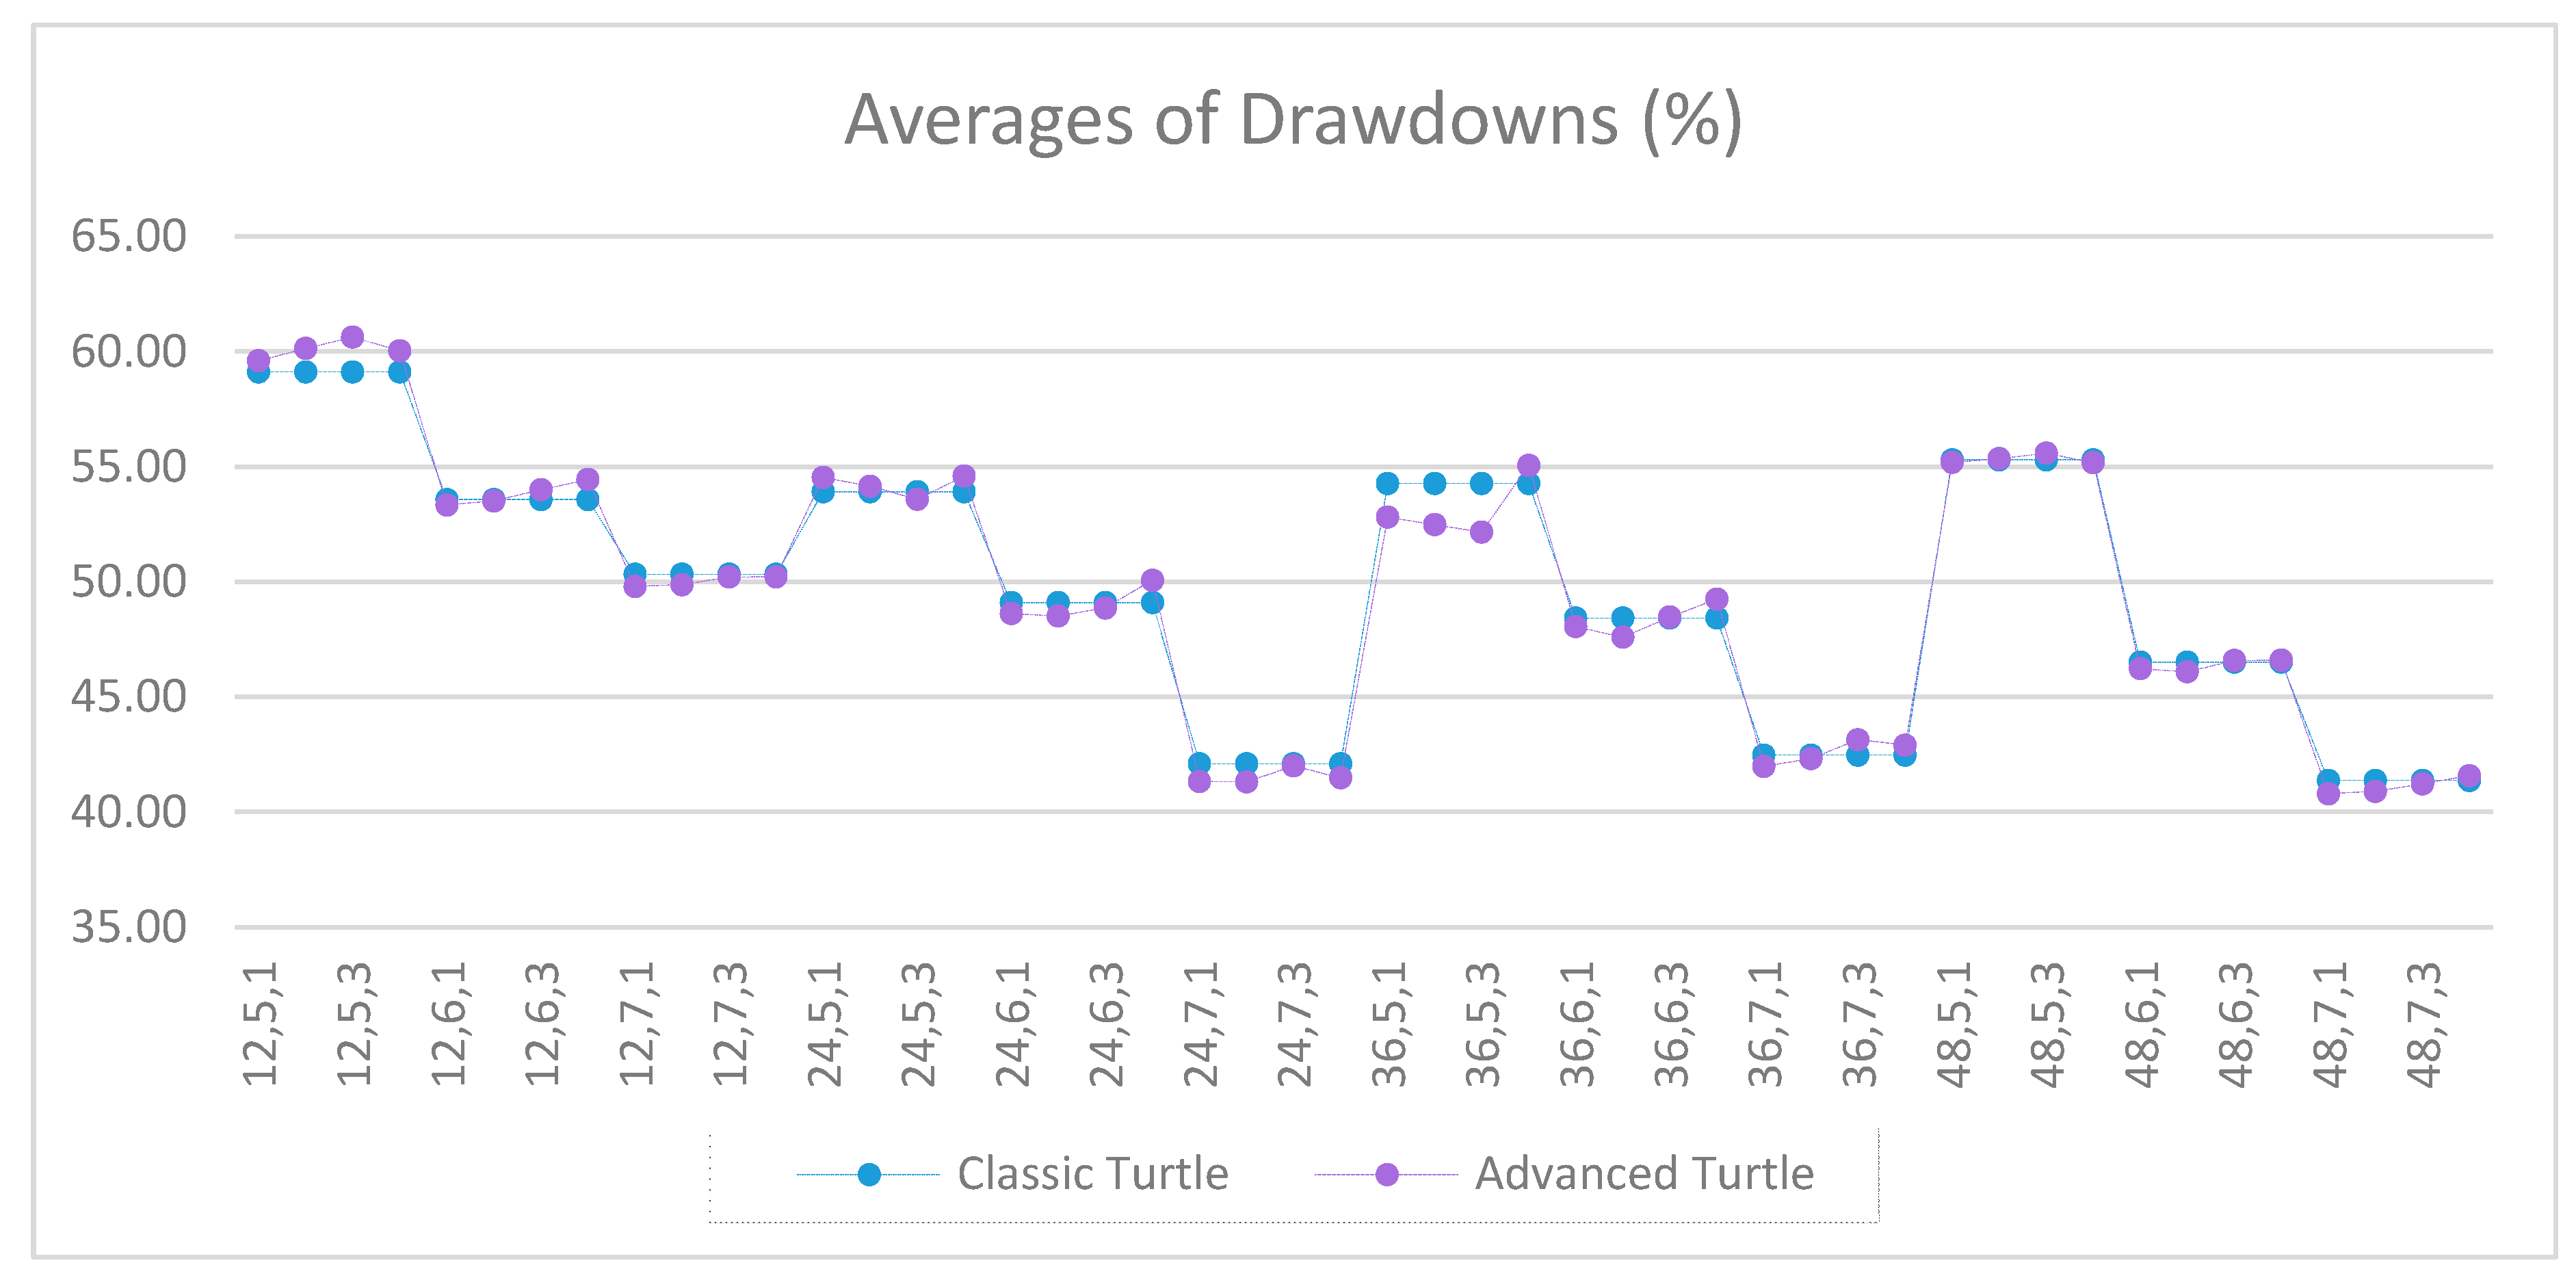
Figure A50.
Drawdowns of BTCUSD as percentage of equity between the classic and the advanced Turtle systems for every combination of N, X, Y for the slow parameters (80, 160), where X ≥ 5.
Figure A50.
Drawdowns of BTCUSD as percentage of equity between the classic and the advanced Turtle systems for every combination of N, X, Y for the slow parameters (80, 160), where X ≥ 5.
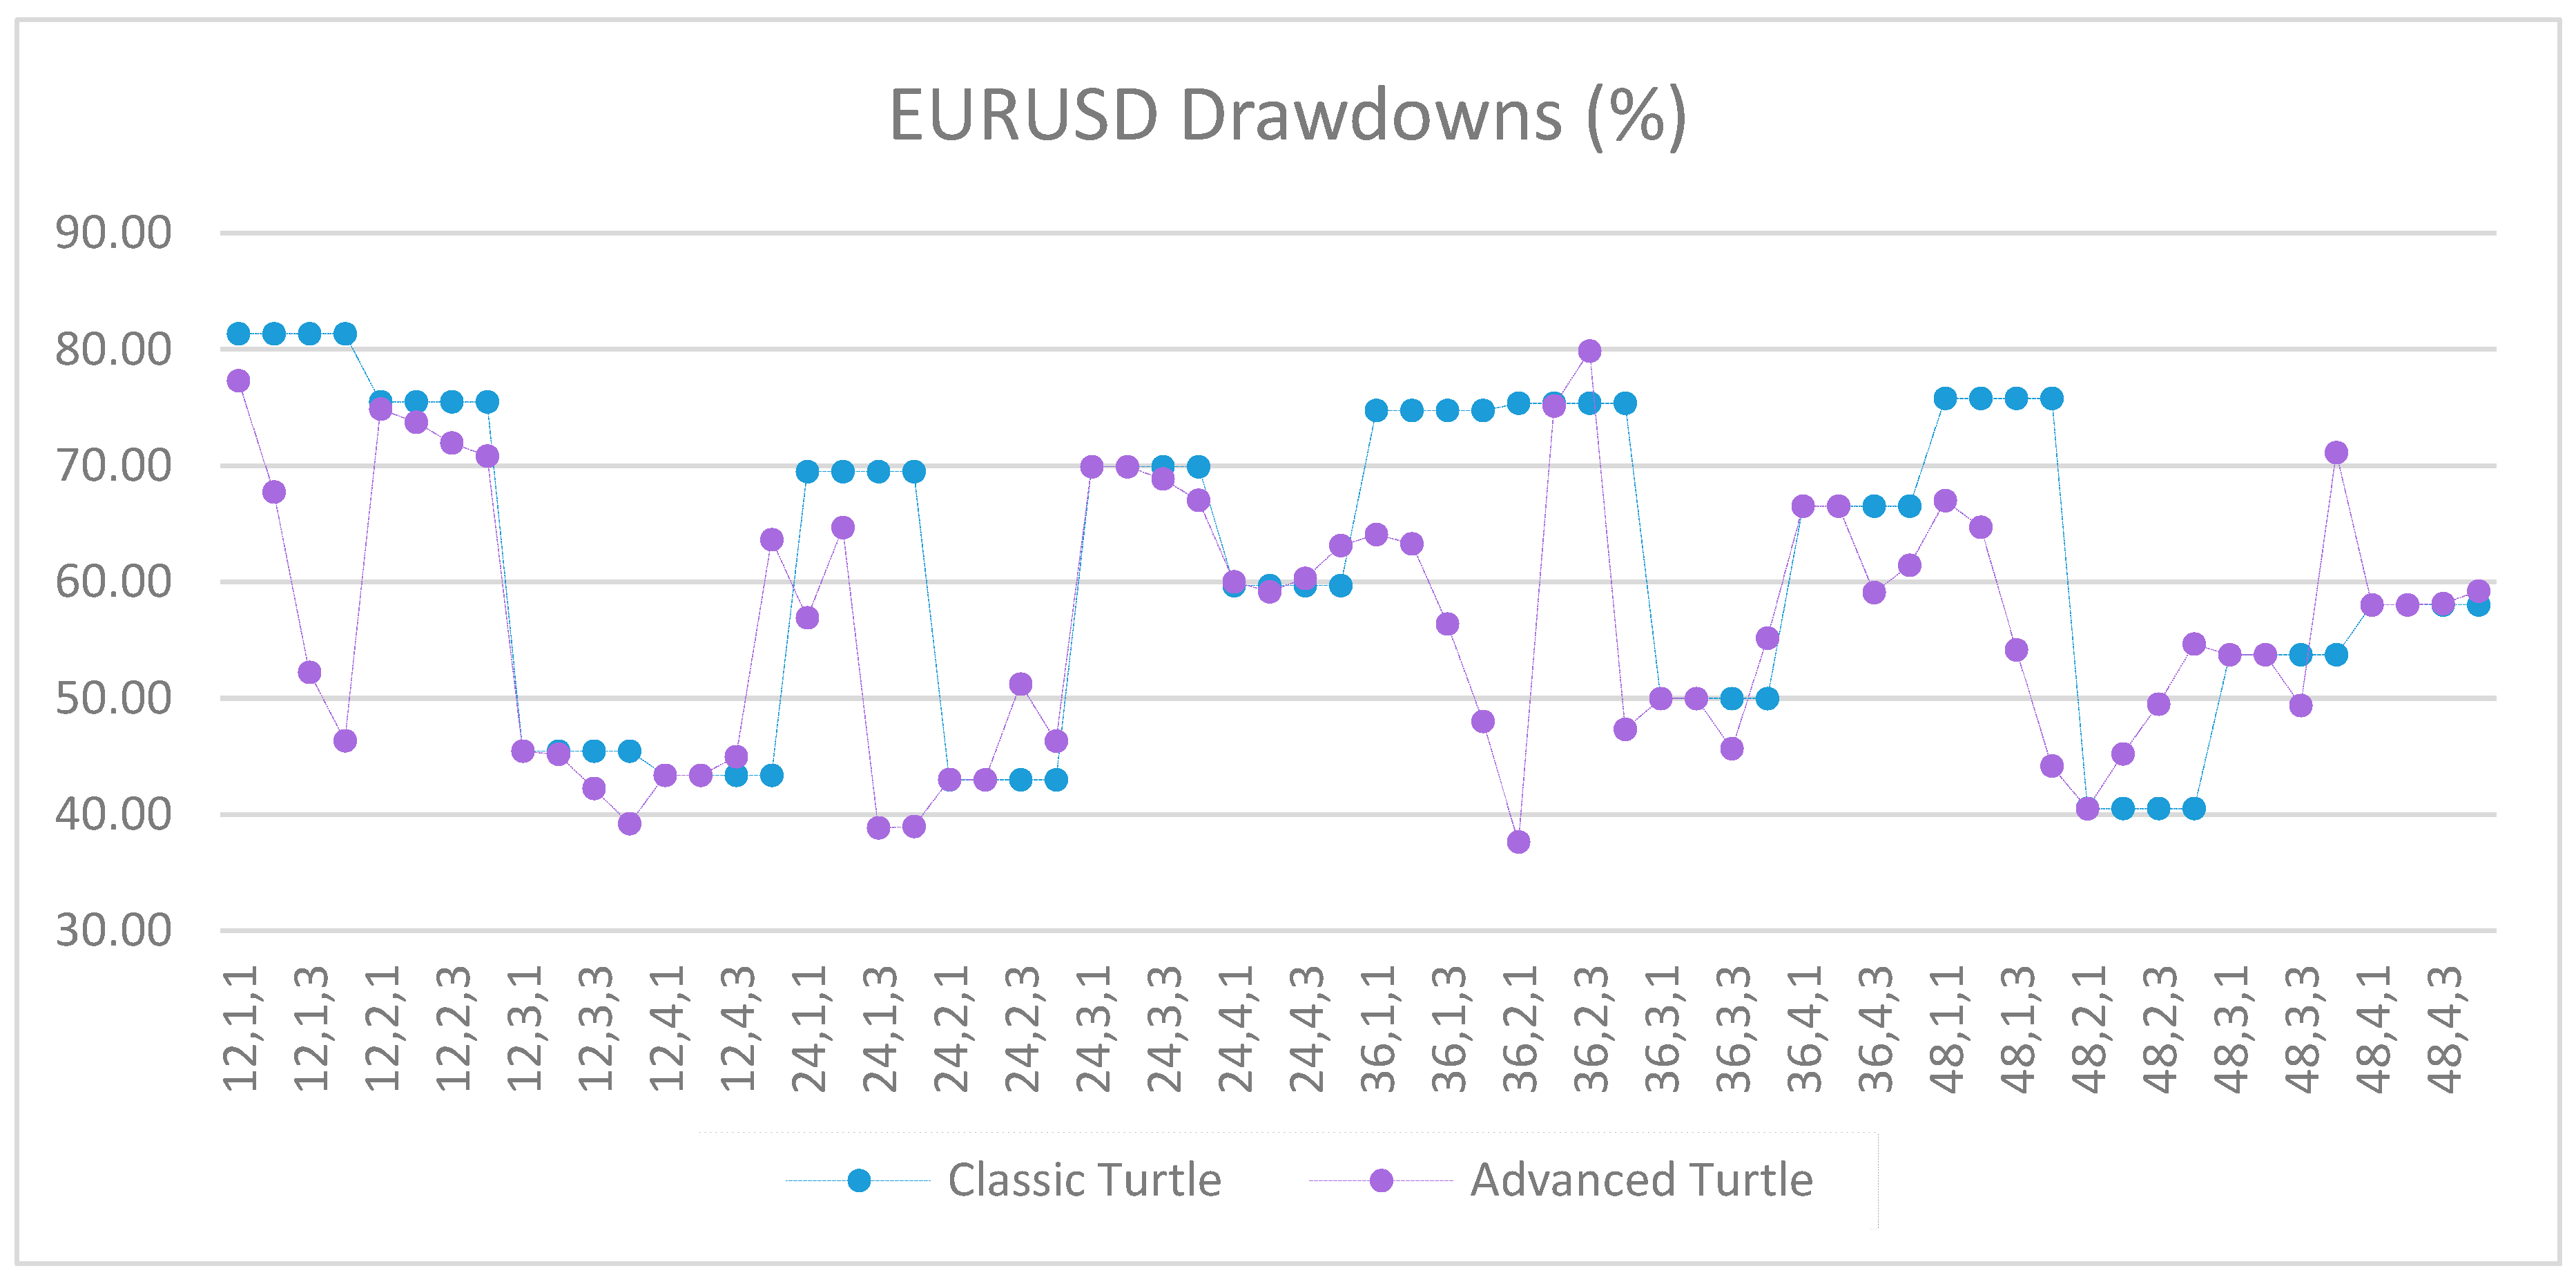
Figure A51.
Net profits of EURUSD between the classic and the advanced Turtle systems for every combination of N, X, Y for the slow parameters (80, 160), where X ≥ 5.
Figure A51.
Net profits of EURUSD between the classic and the advanced Turtle systems for every combination of N, X, Y for the slow parameters (80, 160), where X ≥ 5.
Figure A52.
Drawdowns of EURUSD as percentage of equity between the classic and the advanced Turtle systems for every combination of N, X, Y for the slow parameters (80, 160), where X ≥ 5.
Figure A52.
Drawdowns of EURUSD as percentage of equity between the classic and the advanced Turtle systems for every combination of N, X, Y for the slow parameters (80, 160), where X ≥ 5.
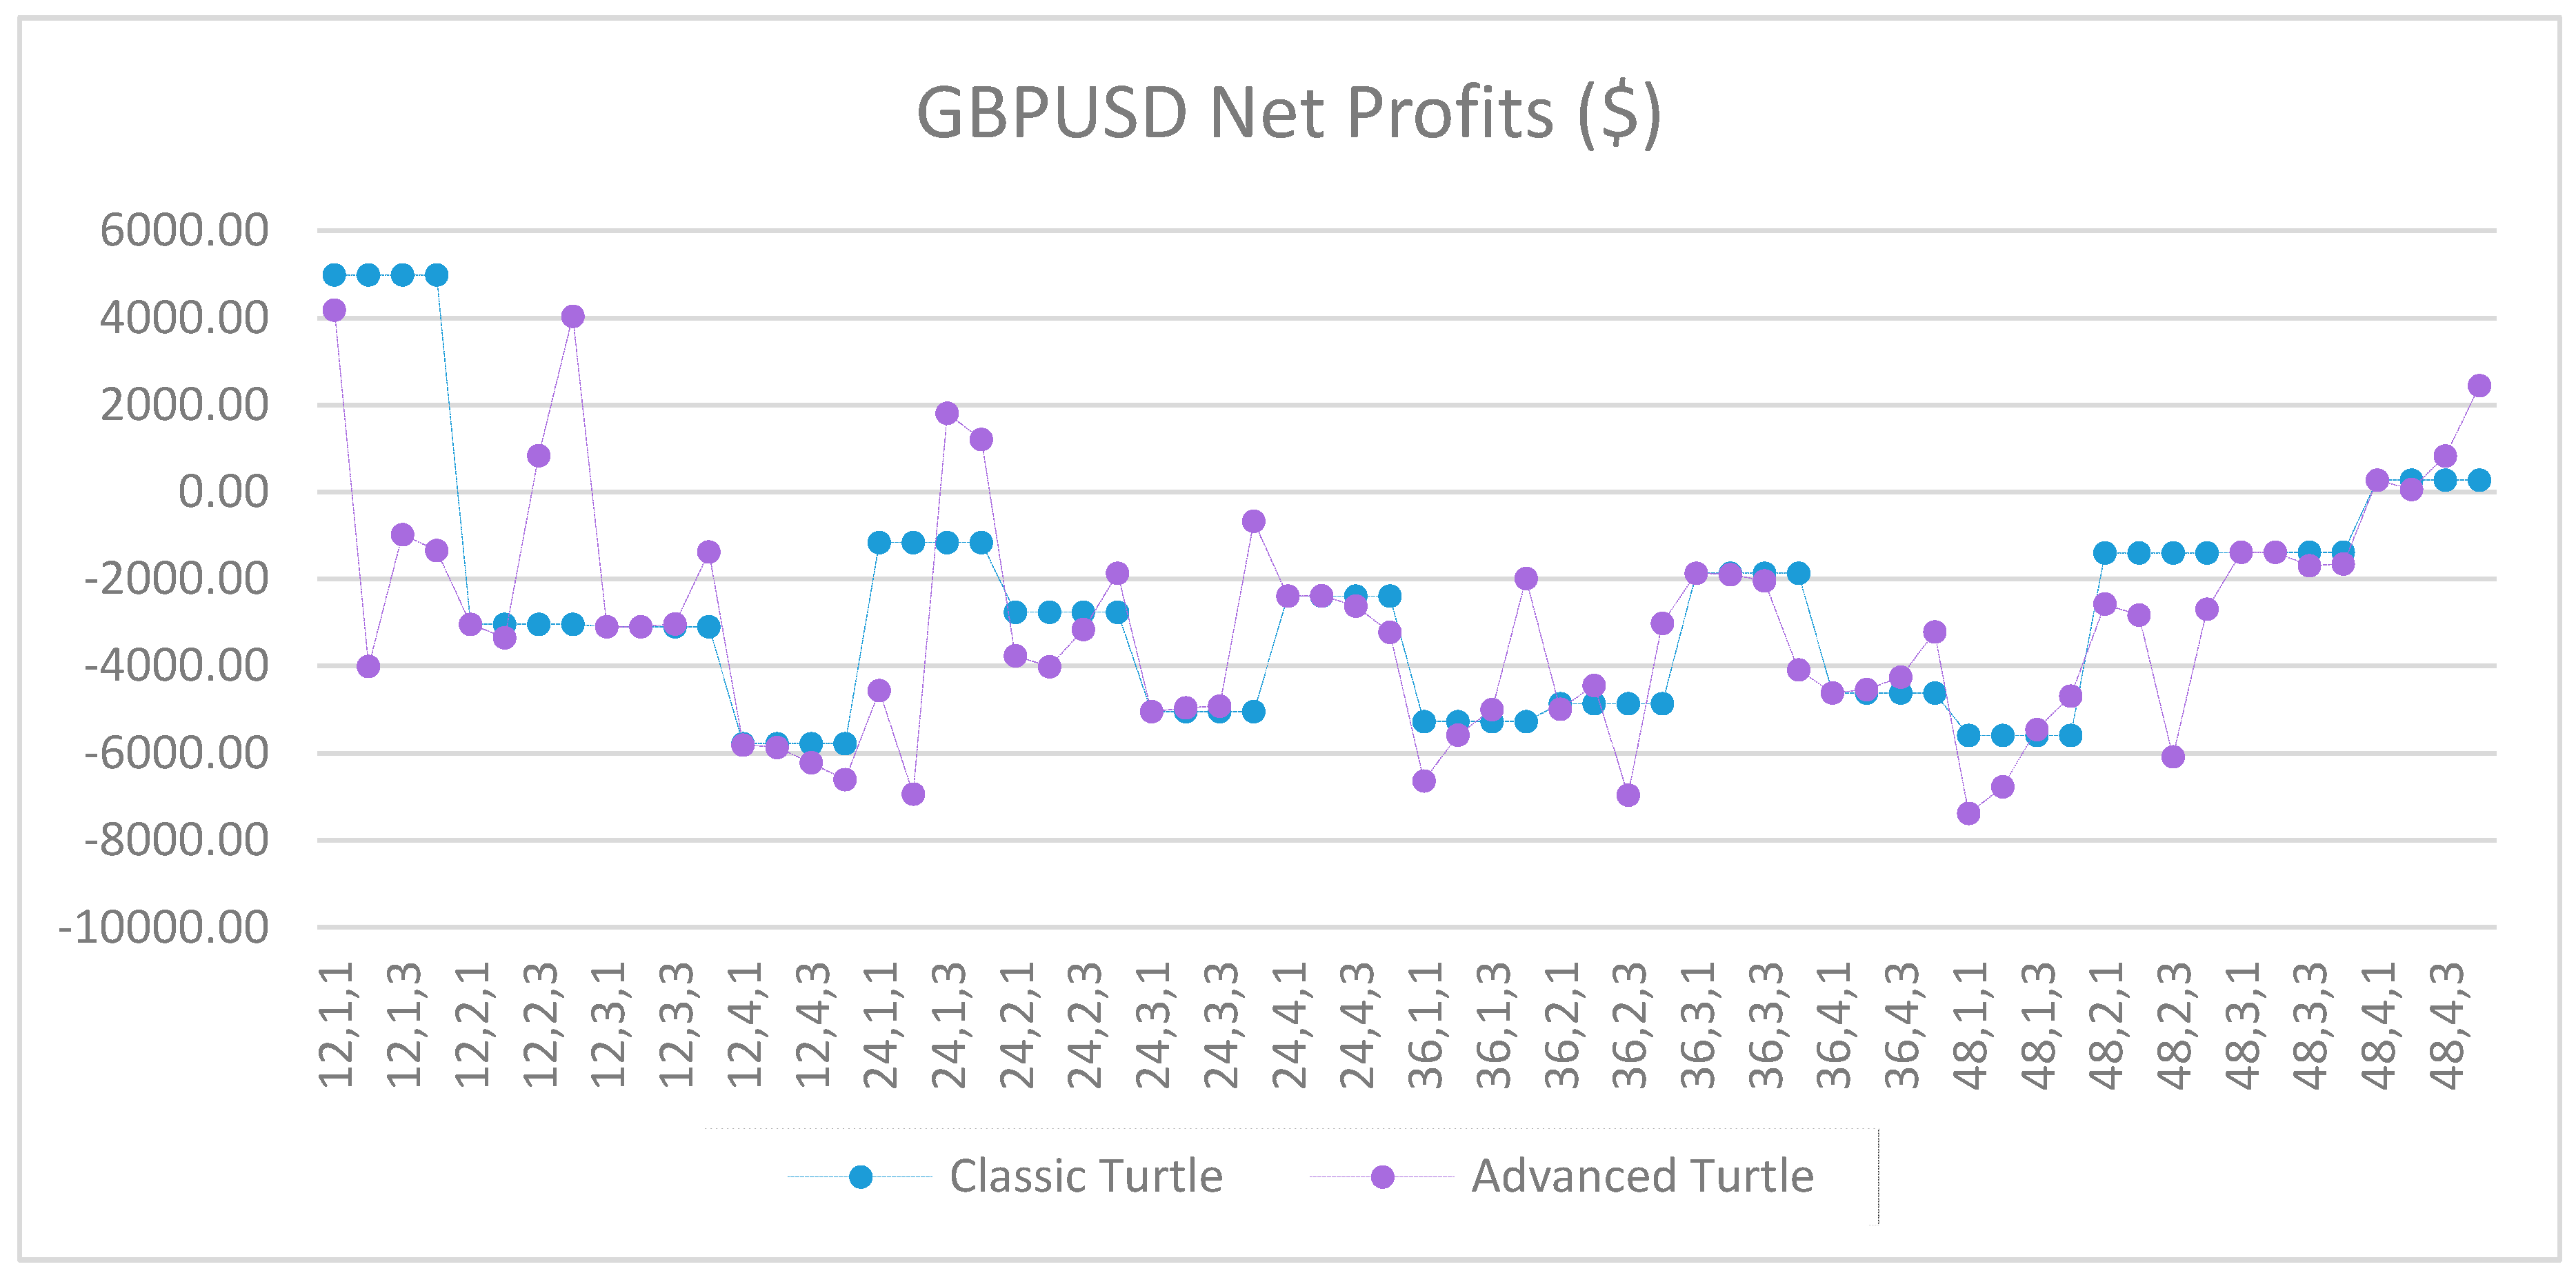
Figure A53.
Net profits of GBPUSD between the classic and the advanced Turtle systems for every combination of N, X, Y for the slow parameters (80, 160), where X ≥ 5.
Figure A53.
Net profits of GBPUSD between the classic and the advanced Turtle systems for every combination of N, X, Y for the slow parameters (80, 160), where X ≥ 5.
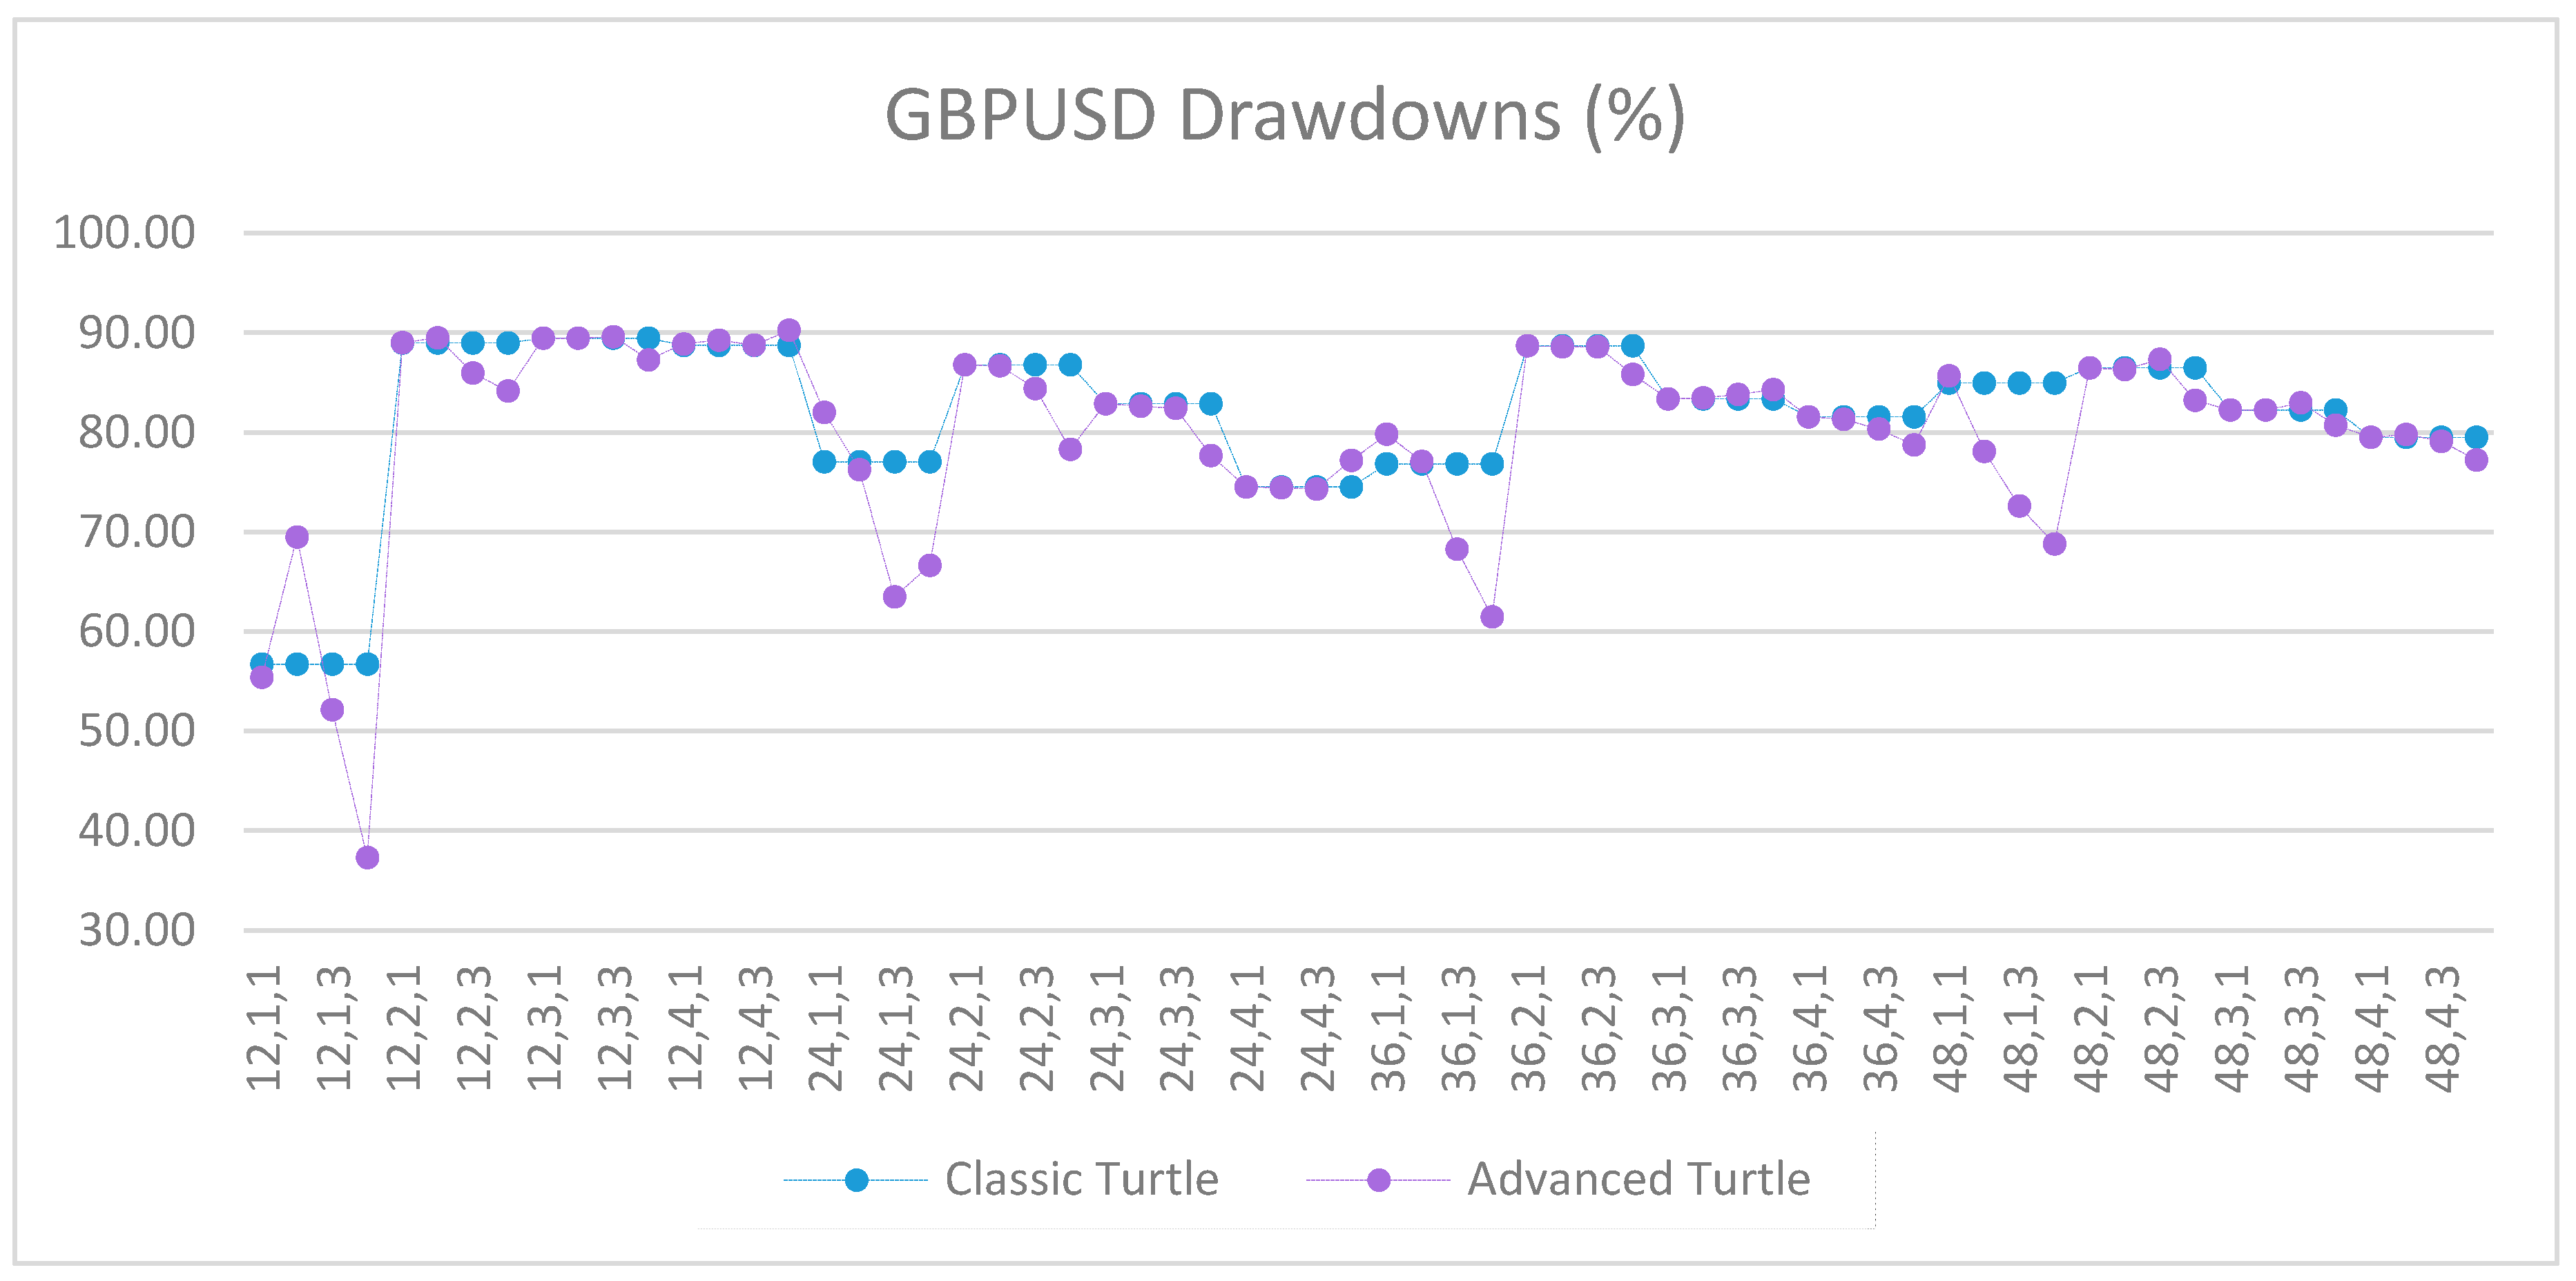
Figure A54.
Drawdowns of GBPUSD as percentage of equity between the classic and the advanced Turtle systems for every combination of N, X, Y for the slow parameters (80, 160), where X ≥ 5.
Figure A54.
Drawdowns of GBPUSD as percentage of equity between the classic and the advanced Turtle systems for every combination of N, X, Y for the slow parameters (80, 160), where X ≥ 5.
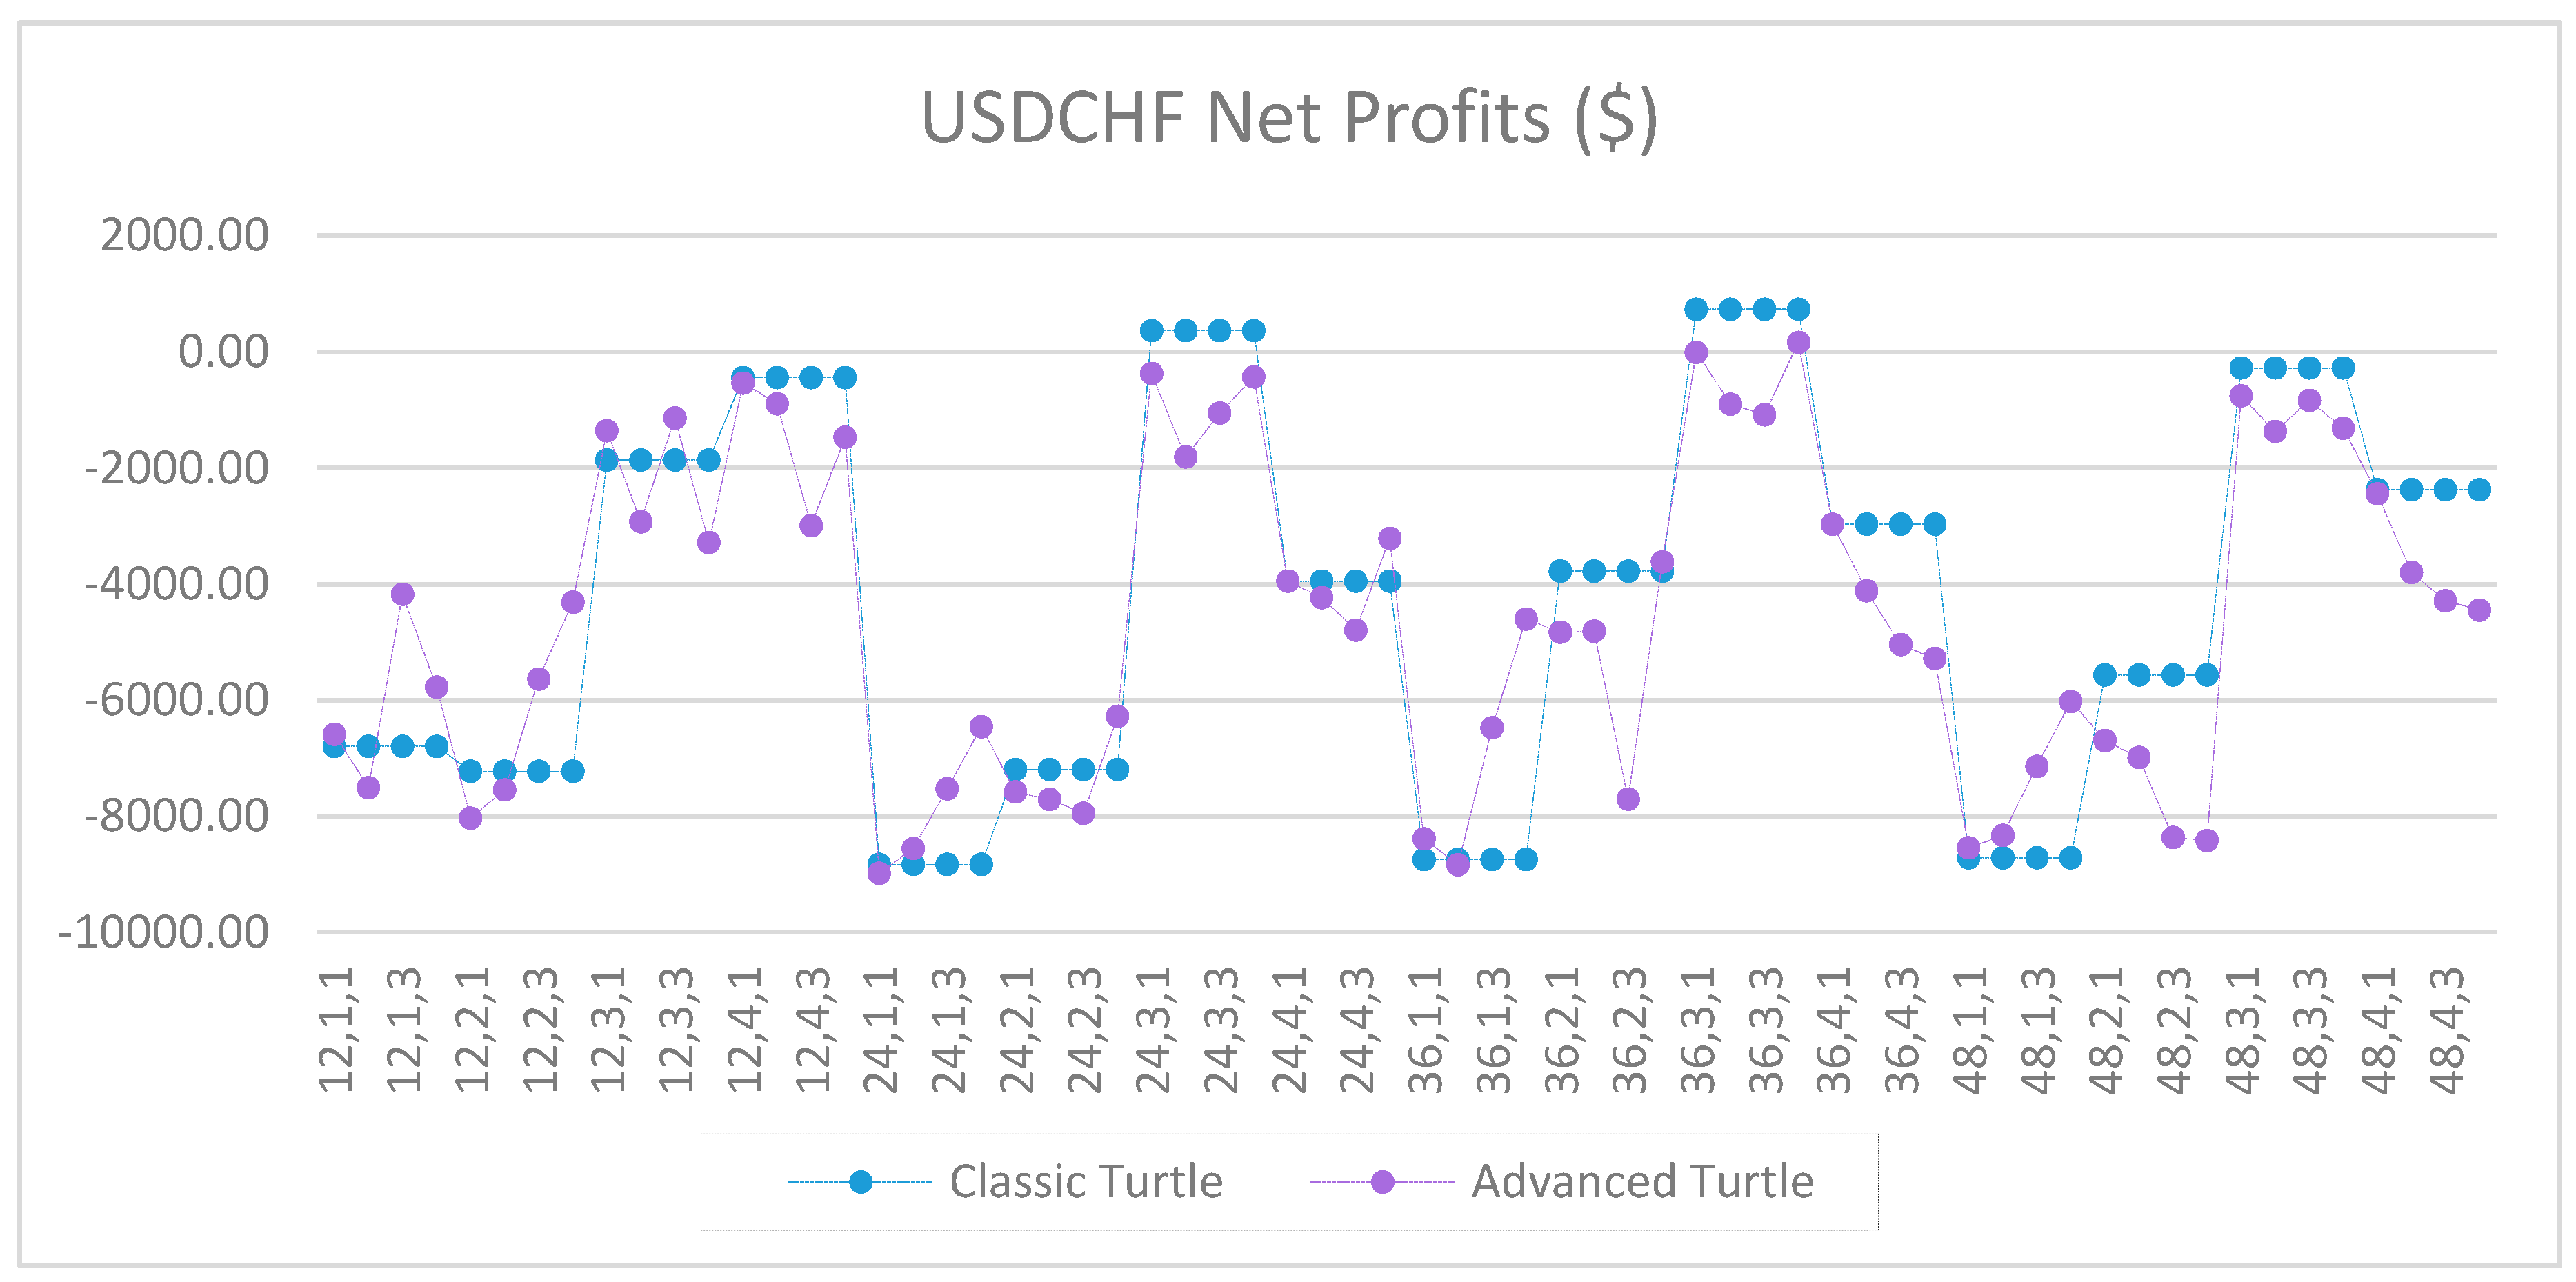
Figure A55.
Net profits of USDCHF between the classic and the advanced Turtle systems for every combination of N, X, Y for the slow parameters (80, 160), where X ≥ 5.
Figure A55.
Net profits of USDCHF between the classic and the advanced Turtle systems for every combination of N, X, Y for the slow parameters (80, 160), where X ≥ 5.
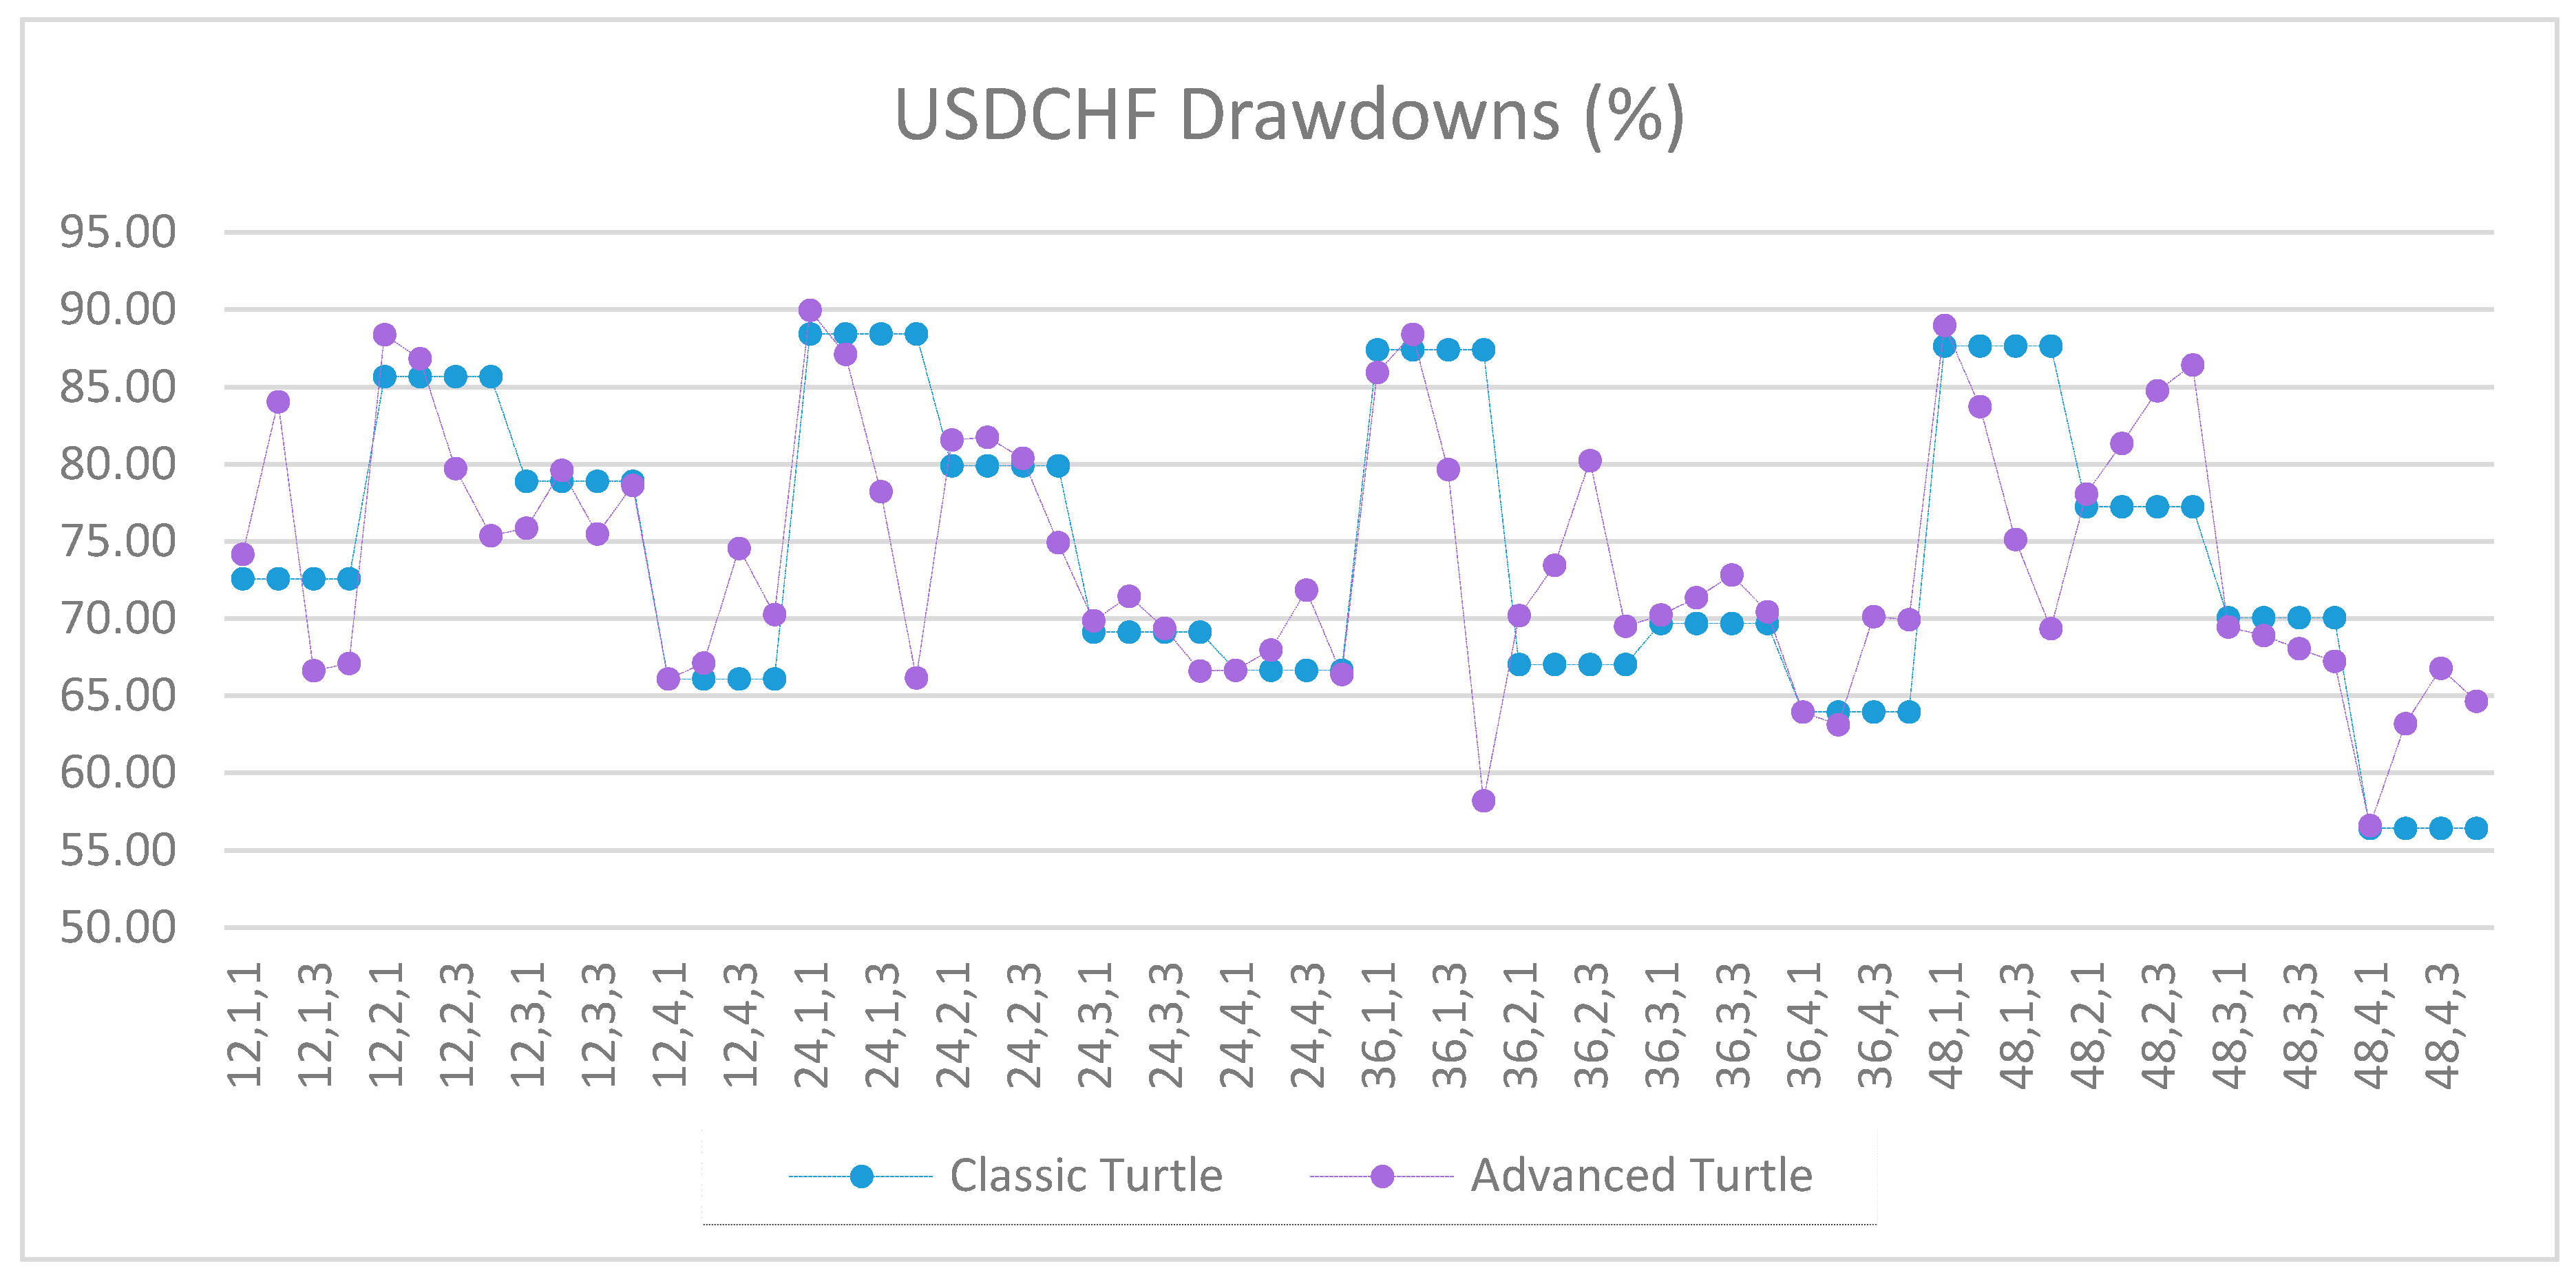
Figure A56.
Drawdowns of USDCHF as percentage of equity between the classic and the advanced Turtle systems for every combination of N, X, Y for the slow parameters (80, 160), where X ≥ 5.
Figure A56.
Drawdowns of USDCHF as percentage of equity between the classic and the advanced Turtle systems for every combination of N, X, Y for the slow parameters (80, 160), where X ≥ 5.
Figure A57.
Net profits of USDJPY between the classic and the advanced Turtle systems for every combination of N, X, Y for the slow parameters (80, 160), where X ≥ 5.
Figure A57.
Net profits of USDJPY between the classic and the advanced Turtle systems for every combination of N, X, Y for the slow parameters (80, 160), where X ≥ 5.
Figure A58.
Drawdowns of USDJPY as percentage of equity between the classic and the advanced Turtle systems for every combination of N, X, Y for the slow parameters (80, 160), where X ≥ 5.
Figure A58.
Drawdowns of USDJPY as percentage of equity between the classic and the advanced Turtle systems for every combination of N, X, Y for the slow parameters (80, 160), where X ≥ 5.
Figure A59.
Net profits of XAUUSD between the classic and the advanced Turtle systems for every combination of N, X, Y for the slow parameters (80, 160), where X ≥ 5.
Figure A59.
Net profits of XAUUSD between the classic and the advanced Turtle systems for every combination of N, X, Y for the slow parameters (80, 160), where X ≥ 5.
Figure A60.
Drawdowns of XAUUSD as percentage of equity between the classic and the advanced Turtle systems for every combination of N, X, Y for the slow parameters (80, 160), where X ≥ 5.
Figure A60.
Drawdowns of XAUUSD as percentage of equity between the classic and the advanced Turtle systems for every combination of N, X, Y for the slow parameters (80, 160), where X ≥ 5.
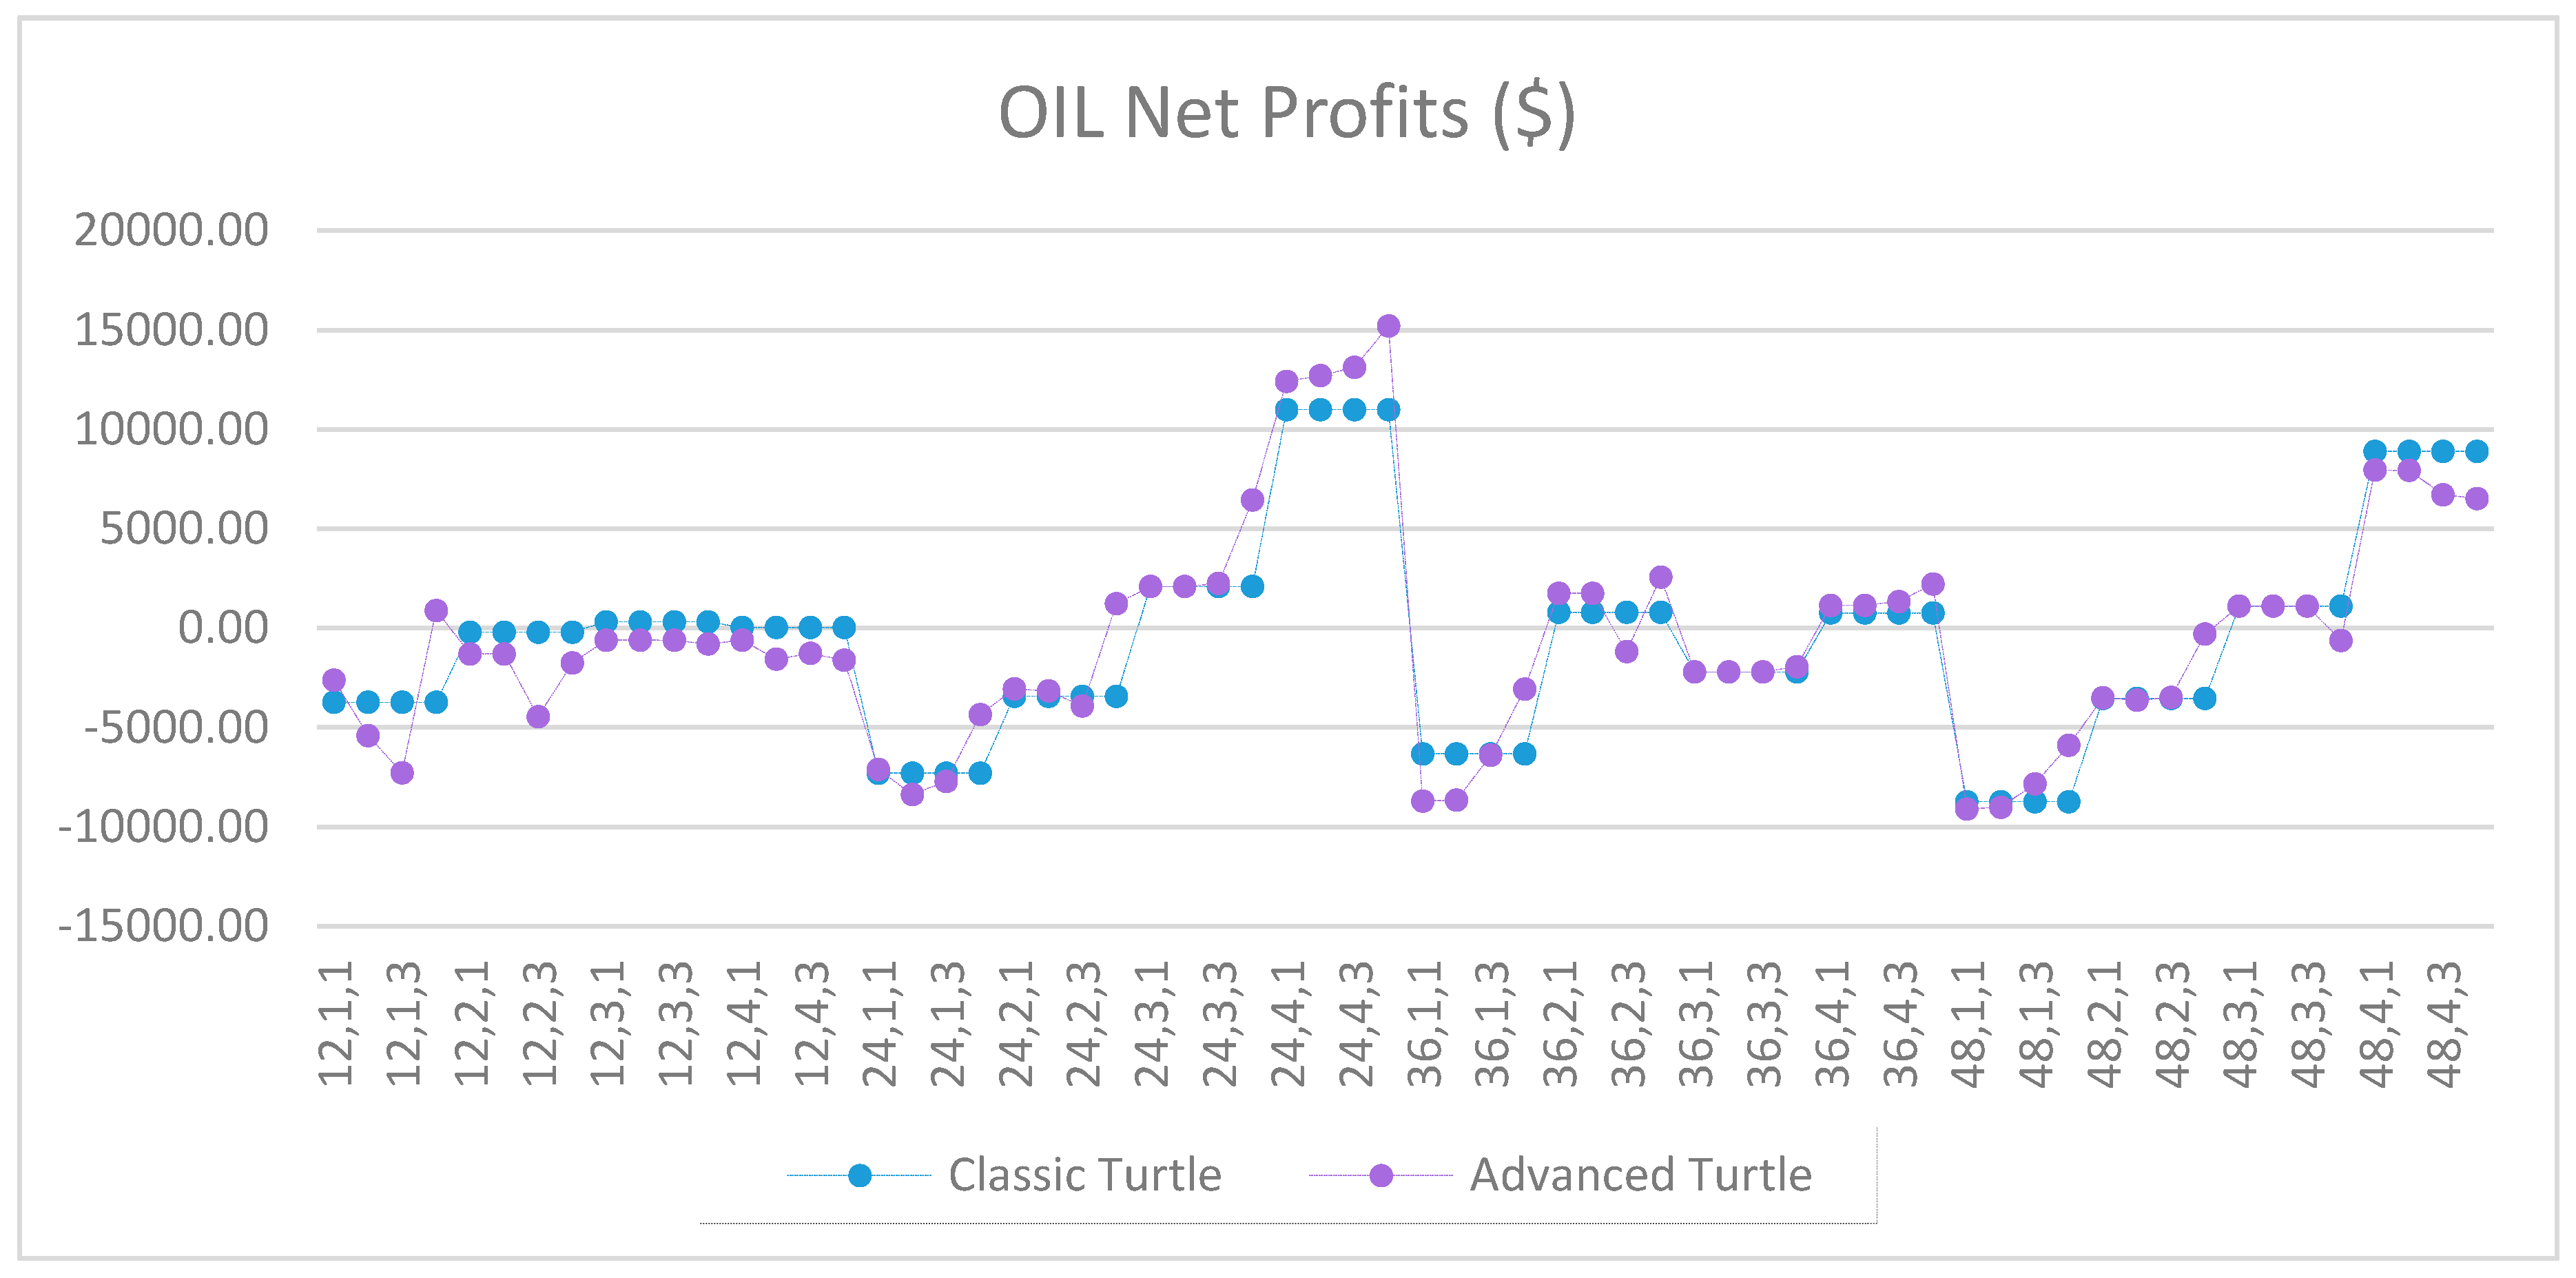
Figure A61.
Net profits of OIL between the classic and the advanced Turtle systems for every combination of N, X, Y for the slow parameters (80, 160), where X ≥ 5.
Figure A61.
Net profits of OIL between the classic and the advanced Turtle systems for every combination of N, X, Y for the slow parameters (80, 160), where X ≥ 5.
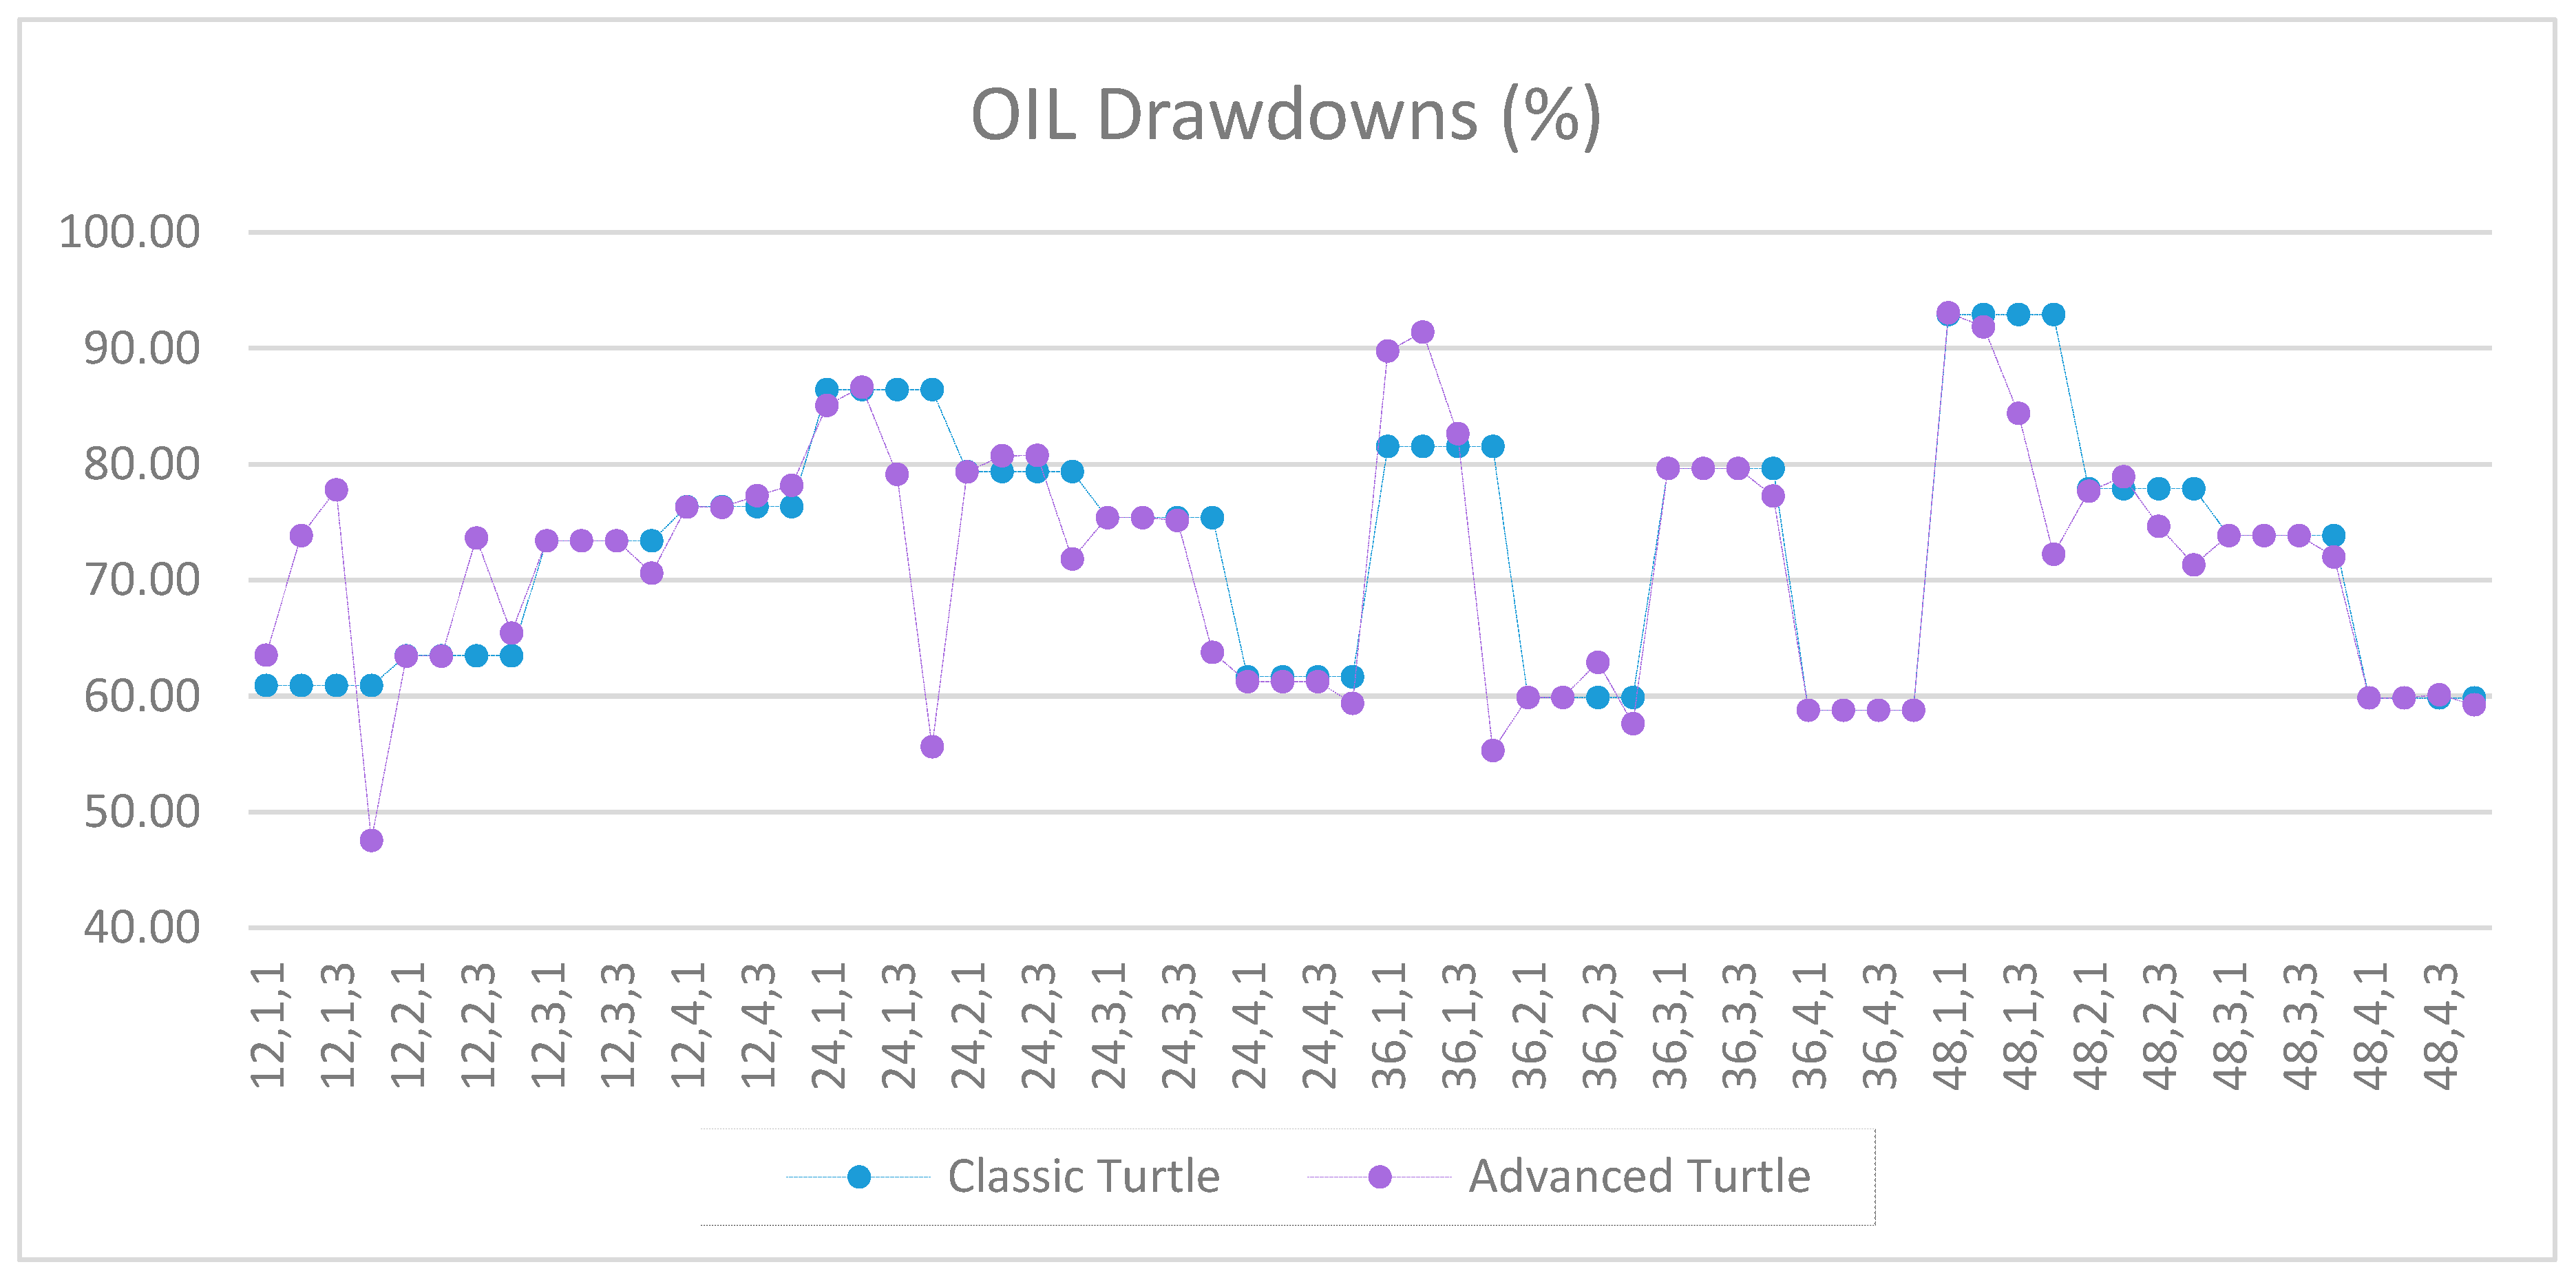
Figure A62.
Drawdowns of OIL as percentage of equity between the classic and the advanced Turtle systems for every combination of N, X, Y for the slow parameters (80, 160), where X ≥ 5.
Figure A62.
Drawdowns of OIL as percentage of equity between the classic and the advanced Turtle systems for every combination of N, X, Y for the slow parameters (80, 160), where X ≥ 5.
Figure A63.
Net profits of BTCUSD between the classic and the advanced Turtle systems for every combination of N, X, Y for the slow parameters (80, 160), where X ≥ 5.
Figure A63.
Net profits of BTCUSD between the classic and the advanced Turtle systems for every combination of N, X, Y for the slow parameters (80, 160), where X ≥ 5.
Figure A64.
Drawdowns of BTCUSD as percentage of equity between the classic and the advanced Turtle systems for every combination of N, X, Y for the slow parameters (80, 160), where X ≥ 5.
Figure A64.
Drawdowns of BTCUSD as percentage of equity between the classic and the advanced Turtle systems for every combination of N, X, Y for the slow parameters (80, 160), where X ≥ 5.


