Abstract
This study empirically analyzes the impact of the financial structure and misery index on economic growth in Pakistan. We adopted Autoregressive-Distributed Lag (ARDL) for a co-integration approach to the data analysis and used time series data from 1989 to 2017. We used GDP as the dependent variable; the Financial Development index (FDI) and misery index as the explanatory variables; and remittances, real interest, and trade openness as the control variables. The empirical results indicate the existence of a long-term relationship among the included variables in the model and the FD index, misery index, interest rate, trade openness, and remittances as the main affecting variables of GDP in the long run. The government needs appropriate reform in the financial sector and external sector in order to achieve a desirable level of economic growth in Pakistan. The misery index is constructed based on unemployment and inflation, which has a negative implication on the economic growth, and the government needs policies to reduce unemployment and inflation.
1. Introduction
Financial development has been extensively studied in the empirical literature. A well-determined financial system deals with risk diversification and effective wealth allocation. A higher level of financial development may result in higher savings and ultimately, in high returns. Financial development can be measured in different ways, for example, by including several factors, such as the size, depth, access, and accuracy of the financial system. It can also be measured by investigating the enacting actions of banks and different markets. There are many issues related to the economic growth and financial development associations that have been studied in the literature (Hye and Dolgopolova 2011); however, the measurement of financial development remains unresolved.
Aggarwal et al. (2011) studied the linkages between remittances and financial development in the context of developing countries. They found that higher financial development was likely to have a weaker fringe effect on growth. As is obvious, economic development is associated with information creation, possible investment, and capital allocation; firms monitoring and exercising corporate governance; the diversification and supervision of risk; the deployment of savings; and enabling the exchange of goods and services. All of the above functions have an effect on savings and investment choices, and technical revolution, which eventually subsidizes economic growth (see Brown 1994; Nyakerario 2007; Nyamongo et al. 2012). Financial development and economic growth have been widely researched topics in recent years. Researchers have attempted to find out how the development and structure of a monetary segment of the economy may affect economic growth and which factors affect the national savings, capital accumulation, and revenue growth of different economies.
In this context, the misery index (MI) is used to measure the economic well-being, which shows the condition of a country. The increasing index directs the waning economic wealth, which has an impact on the living standard of its populations. The MI is a combination of the unweighted sum of unemployment and the inflation rate, which is an indicator of the macroeconomic condition of different countries. This is the first effort to develop a single statistical tool to find the level of the economic malady of the populations. Arthur Okun defined the MI, and it has been further extended by others, assuming that higher rates of the misery index generate important economic and social shocking difficulties. We can say that the MI is used to measure the welfare of the economy. An increase in the MI shows the commonness of deteriorated economic and public well-being of a country. Economic development is well-discussed in the literature; however, some factors, including the misery index, have not addressed political instability, and the misery index is the primary source of the major impediment of economic development in society (Asteriou and Siriopoulos 2000). Pakistan’s political instability (PI) has severely hurt its economic growth for the last 60 years, despite its great resources, military, and civil rules, as these did not facilitate efficient and independent institutions to function appropriately (Irshad 2017; Hoque et al. 2018). A decrease in the misery index and any increase in government effectiveness and/or the rule of law, result in political stability in the region (Agheli 2017).
Remittances from overseas exchange are a significant source of earnings for emerging economies. Remittances are a dominant pointer of economic condition for the receiving countries. According to Ratha (2003), remittance is the second most prominent source of overseas finance after foreign direct investment (FDI). Remittances are considered the best constant source of finance in emerging economies from overseas as compared to FDI, foreign aid, and international obligation. The literature shows that remittances in emerging economies have increased at a higher rate. Ratha (2016) has indicated that remittances are sent via either formal or informal networks or channels. According to (Nyamongo et al. 2012; Aggarwal et al. 2011), foreign remittances, which are sent through an official channel, have a more significant influence on the financial sector, especially in cases where the receiver of the money opens an account with banks, or when they visit the banks, as they may ask about bank loan procedures and products from which they also receive an advantage. There is a higher presumption of financial development if the result in the financial sector is significant. Overall, financial development is believed to have an essential role in the economic growth of a country.
Another fundamental question and subject of interest and discussion, is whether trade liberalization also stimulates long-term economic growth. The main finding of previous research is that rules on trade openness are helpful to enhancing economic growth, although the exact real effect of trade is quite far from being undeniable. Some of the literature argues that the significance of trade openness may not be realized, or may be limited, due to country asset liking or imperfect market incorporation (McCallum 1995), and the uncertainty of larger international trade indicates that the economy has a relative disadvantage (Grossman and Helpman 1991). Blackburn and Hung (1998), in their theoretical model, also prophesied that international trade and financial development both improve productivity growth. In the literature, there is also an opinion that financial and economic development may grow autonomously of one another. This is the neutrality assumption presented by (Lucas 1988).
To achieve our results, in the light of limited, contradictory, and unsatisfying results of earlier studies, this study: (a) proposes to construct a financial development index (FDI) for Pakistan using different enchanting indicators; (b) attempts to find out the impact of the misery index (MI) on the economic growth of Pakistan, which has been used for the first-time for Pakistan; (c) examines the effect of remittances on the economic growth of Pakistan in order to see whether it has positive and significant effects; and (d) seeks to find out whether trade openness has a role in the economic growth process of Pakistan. In short, the roles of remittances, the financial development index, the misery index, the real interest rate, and trade openness are not discussed in early literature, so this study aims to fill this gap. Furthermore, unlike previous studies, the current research covers the points mentioned above using data from 1989 to 2017. The study is implemented using the autoregressive distributed lag (ARDL) approach to cointegration. Because of the non-availability of data before 1989, the data chosen is taken from the period 1989 to 2017.
This study consists of the following sections. The second section presents a relevant review of the literature on financial development and economic growth, the misery index and economic growth, remittances and economic growth, and trade openness and economic growth. The third section details the model specification, variables, and data source, and the fourth section presents the econometric results and discussion. Finally, the fifth section gives the conclusion and some remarks on policies for remittances and the misery index.
2. Literature Review
2.1. Financial Development and Growth
Arguments about the quality of financial development and economic growth are thriving and enticing some empirical and theoretical studies that describe the fundamental connection between them (Ang 2008; Murinde 2012). The primary discussion revolves around facilitating either financial development and economic growth or economic growth that elucidates the growth of the financial segment. The primary argument is the supply leading hypothesis, which proclaims that economic growth and financial development have a positive effect. The followers of this hypothesis argue that the results turn financial development into economic growth, which is caused by enhancement of the proficiency of capital accretion or rate of investment and also increased savings in the form of financial assets, leading to the economic development presented by King and Levine (1993). The second assumption is a demand-following view, which proclaims that financial progress responds to changes in the real sector. This means that finance plays a significant role in economic growth. Finance is simply an outcome of the growth of the economy, as argued by Robinson (1952).
Sehrawat and Giri (2017) investigated the impact among various macroeconomic variables and growth for the period 1982–2014 and constructed the financial development index (FDI) for the Indian economy. They found a significant relationship between growth and the FDI. Jalil and Feridun (2011) examined the correlation between the financial sector development and economic growth of Pakistan from 1975–2008. The said authors used a composite monetary intensity indicator principal component analysis (PCA) and autoregressive distributed lag (ARDL) approach to cointegration. The study shows that financial development is the reason for economic growth. Hye and Dolgopolova (2011) examined the impact of financial development on the economic growth of China using the Johansen-Juselius cointegration approach by constructing the FDI. The results confirm the existence of a long-term relationship between the FDI and economic progress. Shahbaz and Rahman (2012) concluded that financial development is the main source that can be used to attract foreign direct investment and achieve economic prosperity in Pakistan.
The association between financial sector development, trade, and growth in Pakistan from 1961 to 2005 was empirically studied by Khan and Qayyum (2007). The study used the methodology of ARDL bounds testing of the cointegration procedure proposed by Pesaran et al. (2001) and found that both trade and financial sector development have a positive and significance influence on economic growth in Pakistan in the long run. The linkage between financial development and economic growth for sub-Saharan countries was investigated by Ahmed (2010). The author found a long-term equilibrium relation between financial sector development and growth. Khan (2008) examined the financial development and economic growth of Pakistan using annual data from 1961 to 2005. He applied the ARDL methodology and concluded that, both in the long and short term, financial sector and investment exercise significantly impact economic growth. In short, it is concluded that the empirical literature diverges on the association between economic growth and financial development. The different outcomes concerning their association are due to the use of different indicators, methodologies, and interests in the economy.
2.2. Misery Index and Economic Growth
Inflation is the general rise in the price level of goods and services which have an ultimate impact on the life of an individual throughout their lifetime. The decrease in the purchase power of the money is directly associated with the well-being of people. Fischer (1983, 1993) examined that inflation and economic growth are negatively related. Unemployment and economic activities are positively correlated. The association among economic growth and unemployment was investigated in Jordan using Okun’s law of misery index from 1970 to 2008 by Kreishan (2011). The author found that decreasing economic growth cannot explain the unemployment problem in Jordan. Saboor et al. (2017) examined how the MI is correlated with crime and democracy, and both have an impact on economic growth in quasi-democracy when compared to the quasi-dictatorship in Pakistan from 1975 to 2013.
The effect of economic misery and human capital outflow using time series data from 1975–2015 of Pakistan was investigated by Ali et al. (2015). They concluded that economic misery increases human capital outflow. Arouri et al. (2014) examined the microeconomic factors of brain drain in Pakistan for the period 1972–2012 using the ARDL approach for analysis. They found that financial development and economic growth have a negative impact on brain drain as compared to inflation, unemployment, and trade openness, which is positively related with brain drain. Many studies provide literature on the MI and use it as economic misery (Shah 2006; Nasir and Saima 2010). Dadgar and Nazari (2018) studied the impact of economic growth and good governance on the misery index for Iran. They concluded that there is a negative relationship between the MI and economic growth. Furthermore, the relationship between good governance and the MI is positive. Tang and Lean (2009) concluded that there was a positive relationship between the misery index and growth of crime in the USA during the period 1960–2005. The influence of the MI on the US presidential performance was investigated by Adrangi and Macri (2019) using macroeconomic variables, and they concluded that the misery index has a significant impact on the US presidential performance. To summarize, we conclude that the misery index has a greater impact on the growth of a country. Therefore, in this study, our focus is to find out the relationship in the context of Pakistan.
2.3. Remittance and Economic Growth
The worker’s remittance’s contribution in developing economies has been established in recent years. Different empirical investigations have focused on the impact of inflows of remittance on the living standard of households and discovered a substantially positive impact on poverty improvement, health, and education development (Yang 2008; Adams and Page 2003; Hildebrandt and McKenzie 2005; Edwards and Ureta 2003). The empirical literature does not exhibit clear agreement concerning the implication of the relationship between remittances and economic growth. Specifically, information regarding the role of remittances in financial development is not well-understood. Few of the researchers claim that, if the remittances are sent through proper networks, it enhances the economic growth’s impact and stimulates the development of the financial sector (see Ojeda and NAID Center 2003; Terry 2005).
The influence of remittances on poverty in Pakistan has been studied by Irfan (2011). He used two types of data for his paper: first, Household Income and Expenditure Survey (HIES) survey data from 1996–1997 and 2006–2007 and secondly, time series data from 1975–2009. He used an OLS (Ordinary Least Squares) methodology to investigate the effect of remittances on poverty reduction. The author found a negative relation between poverty and remittances in Pakistan. The study of Shah and Fazli (2011) found a relationship between remittances, financial development, and GDP growth in Pakistan by using time series data for the period 1973–2010. They found that remittances are procyclical, which means that the level of remittances increases when the home country is in a stable transition period and in the case of recession, remittances tend to decline in the home country. They found that improvement in the financial sector also plays a significant role in increasing the remittances of the home country.
Karagöz (2009) studied the impact of remittances on economic growth for Turkey using annual time series data for the period 1970–2005. Two methodologies, cointegration and the OLS parameter, were implemented. He found that remittance inflows for Turkey are positive, but have a negative relation with economic development. The author also found that, in the past, Turkey got more remittances from migrants, but recently, most of the migrants from Turkey that work in Western Europe are not able to remit more due to strong financial restrictions by the host country. The impact of remittances on economic development and poverty was examined by Qayyum et al. (2008). They used annual data from 1973–2007. The ARDL methodology was utilized to examine the impact of remittances on economic development and poverty. This study found that remittances significantly affect economic development and poverty in Pakistan, which implies that remittances tend to decrease poverty in Pakistan.
The relationship between remittances, banking sector development, and GDP in Bangladesh, India, Pakistan, and Sri Lanka has been investigated by Noman and Uddin (2011). They used time series analysis separately for each country and concluded that there is a unidirectional causality running from remittances to banking sector growth in the case of Pakistan and Sri Lanka, whereas, in the case of India, this causality is running from development of the banking sector to remittances. The study of Siddique et al. (2012) suggests that remittances have a positive influence on economic growth for the three countries, including Bangladesh, Sri Lanka, and India. They used 25 years’ annual data and found that the impact of remittances in Bangladesh has a positive role in economic growth. In the case of India, there is no significant connection between economic growth and remittances. There is a bi-directional relationship between economic growth and remittances in the case of Sri Lanka. A Vector Auto Regressive (VAR) methodology has been utilized and concluded that the direct flow of remittances to the household was consumed based on basic necessities like shelter, food, education, and health. The indirect impact of remittances is through savings and investment made by the receiving household.
2.4. Trade Openness and Economic Growth
New trade theory developed in the late 1980s and early 1990s, mainly focused on studying the relationship between international trade and economic growth. The two views of gains from trade are, the static-view, which looks at the specific point of time from trade growth and the dynamic view, in which the economist also wants to know the instrument, how the trade effects the growth, and how these instruments grow over time, and to understand the link between trade openness and economic growth (see Romer 1986; Lucas 1988). The endogenous growth and transaction cost theory proposed by Williamson (1975) explained that open trade allows a country to reform the factor of production in areas in which it has comparative advantages. It also highlights that in the long run, greater stability can be attained by increasing specialization and lowering the cost of inputs. This argument is also supported in international product life cycle theory by Vernon (2017).
Trade openness can generate opportunity for technical development and use in assigning inputs, by removing the shield for import substitution business, which, as a result, affects the economic development, as shown by Solow (1957). Grossman and Helpman (1991) indicated that those countries which have a greater trade openness have higher skills to fascinate technological developments created in top states, and this fascination capability gives them the advantage of faster growth over countries having a lower trade openness. Edwards (1992) studied cross sectional data of 30 developing counties from 1970–1982 and found a positive and significant relationship between trade openness and economic growth. Similarly, Harrison (1996) examined the positive association between trade openness, different measures, and economic growth for the sample of 51 developing countries. Vamvakidis (2002) examined the effect of trade on GDP growth for 62 developing and developed economies from 1970 to 1990. The author found a significant relationship between trade share and the growth rate of GDP.
Adhikary (2011) examined the relationship between economic growth, FDI, capital formation, and trade openness for Bangladesh for the period 1986–2008 in a time series framework and found that capital formation and FDI have a positive and significant effect on economic growth. Comparatively, trade openness shows a significantly negative but fading influence on the growth rate of the economy. Likewise, the impact of trade liberalization and the financial development index (FDI) on the economic growth of India has been examined by Sehrawat and Giri (2017) using time series data for the period 1982–2014. The results found a long-term effect of trade liberalization and the financial development index (FDI) on economic growth in India. The study also applied the Granger Causality test and found that there is no uni-directional or bi-directional causality between trade openness and economic growth or between the financial development index (FDI) and economic growth for the Indian economy. Through trade openness, Konstantaras et al. (2018) found that the European Union’s 1995 free trade initiatives display trade asymmetry between Middle Eastern and North African countries and their Northern counterparts, which becomes more asymmetric, ratifying Prebisch-Singer’s empirical hypothesis. However, studies related to Pakistan’s experience of trade openness show a positive association between economic growth and trade liberalization, for example, Jawaid (2014); Shahbaz (2012); and Hye (2012).
3. Materials and Methods
3.1. Data and Variables
The financial structure, misery index, and economic growth of Pakistan using time series data over the period 1987–2017 is examined in this study. The data was collected from the World Development Indicators, State Bank of Pakistan, and World Economic Outlook Database IMF (International Monetary Fund). Changes in real GDP (annual real GDP per capita in constant dollars) are considered as an indicator of economic growth and taken as the dependent variable. Further, in this study, we construct the financial development index (FDI) based on financial development indicators by using the principal component analysis (PCA) method. The financial indicators include market capitalization, domestic credit to the private sector, total bank deposit liabilities, broad money, and domestic credit provided by the financial sector as a percentage of GDP. Other variables include personal remittances received as a percentage of GDP defined by the World Bank; trade openness, which is a combination of import plus export as a percentage of GDP; and the real interest rate. The misery index is a combination of the inflation rate (consumer price index) and unemployment and is used to measure the economic condition of a country.
3.2. Model Specification and Methodology
3.2.1. Model Specification
The main focus of this study is an exploration of the relation between financial development, the misery index, and economic growth in Pakistan. We have used a modified version of the growth model suggested by Sehrawat and Giri (2017):
where the dependent variable is GDP and the independent variables are the financial development index (FDI), misery index (MI), trade openness (OP), personal remittances as a percentage of GDP (REMIT), and real interest rate (RIR). The conversion of the model (1) into a linear form is shown as follows:
All variables are converted into natural logarithms, where is a constant, represents the long run unknown parameters, and is an error term. Equation (2) shows the long-term impact of different variables on economic growth.
3.2.2. Methodology
In this study, time series data are used. The macroeconomic time series data contain the problem of the unit root. To check the stationarity of data, we used the augmented Dickey-Fuller (ADF) unit root test. Further, the ARDL bounds testing approach to cointegration method was used to test the short- and long-term relationship. The pairwise causality test among variables was used for investigating the unidirectional and bidirectional relationship. Furthermore, to find stability of the model, the cumulative sum (CUSUM) test was used.
ARDL Approach to the Cointegration Procedure
The ARDL bounds testing approach to co-integration methodology was used to investigate the empirically short- and long-term relationship among variables. This method is comparatively recent and has several desirable features, like “no restrictions” of order of integration. Recent studies have used the Markov Switching ARDL method to capture the structural shocks (Tsagkanos et al. 2019). In this study, we follow simple linear ARDL due to the following advantages; the first advantage is that all the variables in ARDL do not need to be of the same order of integration, so it can be used when the variables are of different orders, such I(0) or I(1). The second advantage of ARDL is that it is more efficient for the small size of the sample data. The third advantage of ARDL is that it removes the omitted variable problem and autocorrelation by adding lags of variables. The fourth advantage of ARDL is that it is able to provide an unbiased estimation of long-term models without losing long-term information. However, to check the long-term relationship, we used the Pesaran and Shin (1998) methods, which allowed us to use both variables I(1) and I(0). Furthermore, through ARDL linear transformation, Error correction model (ECM) can be derived. Equation (2) becomes the following:
where presents the log of the gross domestic product, shows the log of the financial development index, represents the log of personal remittances, is the log of the misery index, is the log of trade openness, and is the log of the real interest rate. denotes a first difference operator, is a constant term, represents long-term coefficients, represents short-term coefficients, represents the error term, and i denotes the lag length. The following null hypotheses are tested against the alternative hypothesis for the long-term relationship:
- H0: γ1 to γ5 = 0 .... No-cointegration
- H1: γ1 to γ5 ≠ 0 .... Cointegration
In addition, the following null hypotheses are set to test the short-term relationship against the alternative:
- H0 = µ1 to µ5 = 0 …. No relationship
- H1 = µ1 to µ5 ≠ 0 …. Relationship exists
The F-statistic and critical value are the base on which we accepted and rejected the hypothesis. We used Pesaran et al. (2001), who proposed critical values, to make any conclusion about the cointegration. It indicates the existence of a long-term association among the variables if the F-statistic value is higher than the upper bounds of the critical value. Furthermore, the model passed through the diagnostic test CUSUM and the CUSUMSQ test.
3.3. Misery Index
Authur Okun developed the misery index in the 1960s by combining unemployment and inflation rates to understand the real picture of economic misery. In this paper, we follow the skin approach to the misery index by using Pakistani data from 1989–2017 by computing the sum of inflation and unemployment rate.
MI = Inflation + Unemployment
4. Results and Discussion
Descriptive statistics of all variables are shown in Table 1. All the variables are normally distributed. OP has the highest mean and median value, while the FDI has the lowest mean and median value and the MI has the second highest mean and median value. The MI has the highest standard deviation results, which show some possible high variations, while GDP has the lowest standard deviations, and OP is ranked third in the standard deviations. The correlation matrix results in Table 2 show that economic growth for Pakistan has a positive correlation with the financial development index, remittances, and real interest rate, but is negatively correlated with the misery index and openness. Remittances are positively correlated with the FDI. The misery index is also positively correlated with trade openness and the real interest rate, whereas trade openness and the real interest rate are positively correlated.

Table 1.
Descriptive statistics of all variables.
Table 2.
Correlation matrix.
4.1. Unit Root Test
Dickey and Fuller (1979) proposed the augmented Dickey Fuller (ADF) test to check the stationarity of the variables and it is used as a primary condition before conducting a test for cointegration in order to assure that none of the variables are of second order integration. In Table 3, the unit root test results are presented, which indicate that variables are integrated at an order of one.
Table 3.
Unit root test (augmented Dickey-Fuller test).
4.2. ARDL Bound Testing Cointegration
After confirming the stationarity of data, we used an ARDL bounds test to find out the long-term linkage between variables. The cointegration test of ARDL and diagnostic test of estimated model results are shown in Table 4. Furthermore, we took each variable as a dependent variable in the study. The computed value of the F-statistic is 5.51, which is higher than the upper bound value of the critical value at a 1% level of significance.
Table 4.
Autoregressive distributed lag (ARDL) result of co-integration.
Based on the F-statistic, the study confirms that long-term cointegration between the FDI, misery index, remittances, openness, and growth exits in the model.
4.3. Estimated Long-Run and Short-Run
We found a long-term association between economic growth and macroeconomic variables, whereas real GDP was taken as a dependent variable for economic growth. Using Equation (3), both the long run and short run are calculated and the results are illustrated in Table 4. Long-run results are reported in Table 5. The FDI coefficient is statistically significant at a 1%level and has a positive effect on economic development. It is clear that a 1% increase in the FDI increases the economic growth process to 0.06%. In comparison, a 1%increase in the misery index decreases the economic growth to 0.004%. It is statistically significant at 10%. Short-run mode elasticities of the FDI, misery index, and economic growth are shown in Table 6. The short-run coefficient shows the dynamic adjustment of variables towards long-run equilibrium. The error-correction term ECM (−1) has a negative (−0.207225) and statistically significant sign, which shows the desirable convergence property and each year, its convergence to the long run equilibrium by 20.72%.
Table 5.
Long-run estimated coefficient using the autoregressive distributed lag (ARDL) model (1, 0, 0, 1, 2, 2).
Table 6.
Short-run results using autoregressive distributed lag (ARDL).
The real interest rate and openness are statistically insignificant. To check model stability, various diagnostic tests were applied, as used in earlier studies (Qamruzzaman and Wei 2017). The results of the autocorrelation test show that there is no correlation between variables. The normality of data distribution was confirmed by the Jarque-Bera normality test. The Ramsey reset confirmed that the functional form of the model does not suffer from omitted variables. The Hetroskedasticity test confirmed that the model is free of the Heteroscedasticity problem. Finally, the Adjusted R square confirmed the model’s ability to explain the variance.
4.4. Stability Diagnostic Test
To find the stability of the parameter, we also conducted cumulative sum (CUSUM) and cumulative sum of square (CUSMUSQ) tests for the model in the short run and long run. The plots of both are given below in Figure 1 and Figure 2. The stability test confirmed that the models are properly specified as both CUSUM and CUSMUSQ lie between a 5% level of significance and have an impact on Pakistan’s economic growth.

Figure 1.
Represents the cumulative sum (CUSUM).
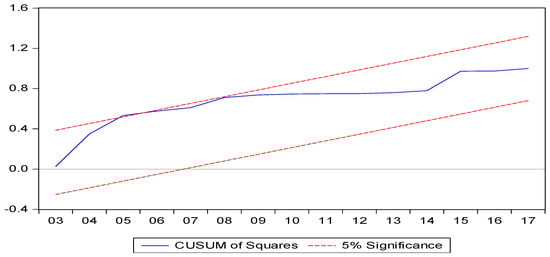
Figure 2.
Represents the cumulative sum of square (CUSUMSQ).
Table 7 indicates that the pairwise grander causality test and the results show that the GDP and FDI have unidirectional causality and GDP causes the FDI. The MI and FDI do not have any casualty relationship, while the MI and GDP have a unidirectional casualty and MI causes GDP.
Table 7.
Pairwise Granger causality tests.
In summary, the empirical findings of this study have been tested through different estimation techniques to show the robustness of the results, and it can be concluded that no problems of autocorrelation, normality, and Heteroscedasticity are found. Overall, the model is well-predicted, and the empirical findings are sufficiently reliable for policy recommendations. The result of this study supports Dadgar and Nazari (2018) finding that the misery index reduces economic growth and higher growth could be the best strategy to minimize the effect of the misery index.
5. Conclusions
This study empirically analyses the financial structure, misery index, and economic growth of Pakistan’s economy. Financial development has been extensively analyzed in empirical literature from different aspects, and different methods have been adopted in the literature, yet some issues are unsolved, so this study has tried to cover those aspects to fill the research gap. The study proposed a new index for financial development and the misery index to show the impact on economic growth for Pakistan. The study uses economic growth as the dependent variable, while the financial development index and misery index are used as independent variables and the real interest rate, trade openness, and remittances are taken as control variables. The data is taken from the period 1989 to 2017 and we applied ARDL to a coo-integration approach as the main method for the data estimations. The empirical results show three steps of ARDL: initially, the ADF test was used to obtain the lag-values that were used for the bound test. The bounds test provided information about whether a long-term relationship exists.
Our result shows the existence of a long-term relationship between the variables. The short-run estimation shows that in the short term, the FDI at a level has no relationship with growth, while at first lag, it has a negative relationship with GDP. Remittances are positive and display a significant relation with GDP at a 10% level using the level value, which indicates that it contributes to the GDP. However, the lag value of remittances is negative and significantly related to GDP. The misery index holds a negative implication for economic growth as it is a combination of unemployment and inflation and both have a negative implication for economic growth in the short run. Openness demonstrates a positive effect on economic growth in the short run as the increase of trade liberalization boosts economic growth. Comparatively, the real interest rate has a negative effect on economic growth, as a higher interest rate impedes the development process and thus economic growth. The co-integration equation coefficient has a negative and significant association, which is desirable according to the conventional ARDL approach, and it indicates that the model is stable and has a convergence property. Since a long-term relationship among included variables exists in the model and the results show that the FDI is positively and significantly associated with economic growth, similarly, remittances are positively and significantly associated with economic growth. The misery index indicates the negative effect on economic growth, while openness has a positive and significant association with economic growth, while the interest rate has a negative implication for economic growth in the long run.
Policy Recommendations and Study Limitations
This study suggests some policy recommendations. First of all, the government needs to improve financial structure reform, which will result in an increase in GDP and foreign remittances, and boost the economy of Pakistan. Besides, the government needs a policy to reduce inflation and unemployment, which is one of the core objectives of macroeconomic policy. This study also has some limitations as it only covers the aspect of Pakistan, and there are also data limitations as it only covers the period from 1989 due to the unavailability of data from previous years. Some factors of the FDI, including market capitalization data, are unavailable for Pakistan. This study can be extended in the future to more than one country using the panel data case.
Author Contributions
M.H.S. was the author behind the main idea and objectives of the paper. The authors jointly compiled and completed the data set for the research. Econometric work was jointly completed using Eviews software and the authors met at conferences to discuss the findings and perform further econometric work. The analysis of the results was conducted jointly. M.H.S. completed the first finished draft of the paper. N.W. reviewed the paper. S.A., K.A., and S.U. jointly completed further econometric estimations and revised the paper twice.
Funding
This Article is funded by innovative research project of international Education School of Zhongnan University of economics and law.
Conflicts of Interest
The authors declare no conflict of interest.
References
- Adams, Richard H., and John Page. 2003. International Migration, Remittances, and Poverty in Developing Countries. World Bank Publications. Washington, DC: World Bank, vol. 3179. [Google Scholar]
- Adhikary, Bishnu Kumar. 2011. FDI, trade openness, capital formation, and economic growth in Bangladesh: A linkage analysis. International Journal of Business and Management 6: 16. [Google Scholar] [CrossRef]
- Adrangi, Bahram, and Joseph Macri. 2019. Does the Misery Index Influence a US President’s Political Re-Election Prospects? Journal of Risk and Financial Management 12: 22. [Google Scholar] [CrossRef]
- Aggarwal, Reena, Asli Demirgüç-Kunt, and Maria Soledad Martínez Pería. 2011. Do remittances promote financial development? Journal of Development Economics 96: 255–64. [Google Scholar]
- Agheli, Lotfali. 2017. Political Stability, Misery Index and Institutional Quality: Case Study of Middle East and North Africa. Икономичecки Изcлeдвaния 26: 30–46. [Google Scholar]
- Ahmed, Abdullahi D. 2010. Financial liberalization, financial development and growth linkages in Sub-Saharan African countries: An empirical investigation. Studies in Economics and Finance 27: 314–39. [Google Scholar] [CrossRef]
- Ali, Amjad, Nooreen Mujahid, Yahya Rashid, and Muhammad Shahbaz. 2015. Human capital outflow and economic misery: Fresh evidence for Pakistan. Social Indicators Research 124: 747–64. [Google Scholar] [CrossRef]
- Ang, James B. 2008. A survey of recent developments in the literature of finance and growth. Journal of Economic Surveys 22: 536–76. [Google Scholar] [CrossRef]
- Arouri, Mohamed, Yahya Rashid, Muhammad Shahbaz, and Frédéric Teulon. 2014. Short and Long Run Determinants of Brain Drain: Evidence from Pakistan. No. 2014-113. Pairs: IPAG Business School. [Google Scholar]
- Asteriou, Dimitrios, and Costas Siriopoulos. 2000. The role of political instability in stock market development and economic growth: The case of Greece. Economic Notes 29: 355–74. [Google Scholar] [CrossRef]
- Blackburn, Keith, and Victor T. Y. Hung. 1998. A theory of growth, financial development and trade. Economica 65: 107–24. [Google Scholar]
- Brown, Richard P. C. 1994. Migrants’ remittances, savings and investment in the South Pacific. International Labour Review 133: 347. [Google Scholar]
- Dadgar, Yadollah, and Rouhollah Nazari. 2018. The impact of economic growth and good governance on misery index in Iranian economy. European Journal of Law and Economics 45: 175–93. [Google Scholar] [CrossRef]
- Dickey, David A., and Wayne A. Fuller. 1979. Distribution of the estimators for autoregressive time series with a unit root. Journal of the American Statistical Association 74: 427–31. [Google Scholar]
- Edwards, Alejandra Cox, and Manuelita Ureta. 2003. International migration, remittances, and schooling: Evidence from El Salvador. Journal of Development Economics 72: 429–61. [Google Scholar]
- Edwards, Sebastian. 1992. Trade orientation, distortions and growth in developing countries. Journal of Development Economics 39: 31–57. [Google Scholar] [CrossRef]
- Fischer, Stanley. 1983. Inflation and Growth. Cambridge: National Bureau of Economic Research. [Google Scholar]
- Fischer, Stanley. 1993. The role of macroeconomic factors in growth. Journal of Monetary Economics 32: 485–512. [Google Scholar] [CrossRef]
- Grossman, Gene M., and Elhanan Helpman. 1991. Innovation and Growth in the Global Economy. Cambridge: MIT Press. [Google Scholar]
- Harrison, Ann. 1996. Openness and growth: A time-series, cross-country analysis for developing countries. Journal of Development Economics 48: 419–47. [Google Scholar] [CrossRef]
- Hildebrandt, Nicole, and David J. McKenzie. 2005. The Effects of Migration on Child Health in Mexico. Washington, DC: The World Bank. [Google Scholar]
- Hoque, Mohammad Enamul, Tahmina Akhter, and Noor Azuddin Yakob. 2018. Revisiting endogeneity among foreign direct investment, economic growth and stock market development: Moderating role of political instability. Cogent Economics & Finance 6: 1492311. [Google Scholar]
- Hye, Qazi Muhammad Adnan, and Irina Dolgopolova. 2011. Economics, finance and development in China: Johansen-Juselius co-integration approach. Chinese Management Studies 5: 311–24. [Google Scholar]
- Hye, Qazi Muhammad Adnan. 2012. Long term effect of trade openness on economic growth in case of Pakistan. Quality & Quantity 46: 1137–49. [Google Scholar]
- Irfan, Mohammad. 2011. Remittances and Poverty Linkages in Pakistan: Evidence and Some Suggestions for Further Analysis. Working Papers & Research Reports. Islamabad: Pakistan Institute of Development Economics. [Google Scholar]
- Irshad, Hira. 2017. Relationship Among Political Instability, Stock Market Returns and Stock Market Volatility. Studies in Business and Economics 12: 70–99. [Google Scholar] [CrossRef]
- Jalil, Abdul, and Mete Feridun. 2011. Impact of financial development on economic growth: Empirical evidence from Pakistan. Journal of the Asia Pacific Economy 16: 71–80. [Google Scholar] [CrossRef]
- Jawaid, Syed Tehseen. 2014. Trade openness and economic growth: A lesson from Pakistan. Foreign Trade Review 49: 193–212. [Google Scholar] [CrossRef]
- Karagöz, Kadir. 2009. Workers’remittances And Economic Growth: Evidence Fromturkey. Journal of Yaşar University 4: 1891–908. [Google Scholar]
- Khan, Muhammad Arshad. 2008. Financial development and economic growth in Pakistan: Evidence based on autoregressive distributed lag (ARDL) approach. South Asia Economic Journal 9: 375–91. [Google Scholar] [CrossRef]
- Khan, Muhammad Arshad, and Abdul Qayyum. 2007. Trade Liberalisation, Financial Development and Economic Growth. Islamabad: Pakistan Institute of Development Economics. [Google Scholar]
- King, Robert G., and Ross Levine. 1993. Finance, entrepreneurship and growth. Journal of Monetary Economics 32: 513–42. [Google Scholar] [CrossRef]
- Konstantaras, Konstantinos, Dionisis Philippas, and Costas Siriopoulos. 2018. Trade asymmetries in the Mediterranean basin. The Journal of Economic Asymmetries 17: 13–20. [Google Scholar] [CrossRef]
- Kreishan, Fuad M. 2011. Economic growth and unemployment: An empirical analysis. Journal of Social Sciences 7: 228–31. [Google Scholar] [CrossRef]
- Lucas, Robert E., Jr. 1988. On the mechanics of economic development. Journal of Monetary Economics 22: 3–42. [Google Scholar] [CrossRef]
- McCallum, John. 1995. National borders matter: Canada-US regional trade patterns. The American Economic Review 85: 615–23. [Google Scholar]
- Murinde, Victor. 2012. Financial development and economic growth: Global and African evidence. Journal of African Economies 21: i10–i56. [Google Scholar] [CrossRef]
- Nasir, Iqbal, and Nawaz Saima. 2010. Investment, inflation and economic growth nexus. The Pakistan Development Review 48: 863–74. [Google Scholar]
- Noman, Abdullah M., and Gazi Salah Uddin. 2011. Remittances and banking sector development in South Asia. International Journal of Banking and Finance 8: 46–55. [Google Scholar]
- Nyakerario, I. 2007. Liberalization, Stock market development and investment efficiency in Africa. International Review of Business Research Papers 3: 183–91. [Google Scholar]
- Nyamongo, Esman Morekwa, Roseline N. Misati, Leonard Kipyegon, and Lydia Ndirangu. 2012. Remittances and banking sector development in Sub Saharan African. Journal of Economics and Business 64: 240–60. [Google Scholar] [CrossRef]
- Ojeda, Raul Hinojosa, and NAID Center. 2003. Transnational migration, remittances and development in North America: Globalization lessons from the OaxaCalifornia transnational village/community modeling project. Paper presented at the a Conference on Remittances as a Development Tool in Mexico organized by the Multilateral Investment Fund (MIF) of the Inter-American Development Bank (IDB), Mexico City, Mexico, October 28. [Google Scholar]
- Pesaran, H. Hashem, and Yongcheol Shin. 1998. Generalized impulse response analysis in linear multivariate models. Economics Letters 58: 17–29. [Google Scholar] [CrossRef]
- Pesaran, M. Hashem, Yongcheol Shin, and Richard J. Smith. 2001. Bounds testing approaches to the analysis of level relationships. Journal of Applied Econometrics 16: 289–326. [Google Scholar] [CrossRef]
- Qamruzzaman, Md, and Jianguo Wei. 2017. Financial innovation and economic growth in Bangladesh. Financial Innovation 3: 19. [Google Scholar] [CrossRef]
- Qayyum, Abdul, Muhammad Javid, and Umaima Arif. 2008. Impact of remittances on economic growth and poverty: Evidence from Pakistan. Munich: MPRA. [Google Scholar]
- Ratha, Dilip. 2003. Workers’ Remittances: An Important and Stable Source of External Development Finance. Rochester: SSRN. [Google Scholar]
- Ratha, Dilip. 2016. Migration and Remittances Factbook 2016, 3rd ed. Washington, DC: World Bank. [Google Scholar] [CrossRef]
- Robinson, Joan. 1952. The Generalization of the General Theory. In The Rate of Interest, and Other Essays. London: Macmillan, pp. 67–142. [Google Scholar]
- Romer, Paul M. 1986. Increasing returns and long-run growth. Journal of Political Economy 94: 1002–37. [Google Scholar] [CrossRef]
- Saboor, Abdul, Shumaila Sadiq, Atta Ullah Khan, and Gulnaz Hameed. 2017. Dynamic reflections of crimes, quasi democracy and misery index in Pakistan. Social Indicators Research 133: 31–45. [Google Scholar] [CrossRef]
- Sehrawat, Madhu, and A. K. Giri. 2017. Financial structure, interest rate, trade openness and growth: Time series analysis of Indian economy. Global Business Review 18: 1278–90. [Google Scholar] [CrossRef]
- Shah, Anwar. 2006. Fiscal decentralization and macroeconomic management. International Tax and Public Finance 13: 437–62. [Google Scholar] [CrossRef]
- Shah, Khalid, and Rabbi Fazli. 2011. How economic hardship and financial deepening affect the inflow of remittances to Pakistan: Empirical findings based on a bounds test model. Sarhad Journal of Agriculture 27: 111–18. [Google Scholar]
- Shahbaz, Muhammad. 2012. Does trade openness affect long run growth? Cointegration, causality and forecast error variance decomposition tests for Pakistan. Economic Modelling 29: 2325–39. [Google Scholar] [CrossRef]
- Shahbaz, Muhammad, and Mohammad Mafizur Rahman. 2012. The dynamic of financial development, imports, foreign direct investment and economic growth: Cointegration and causality analysis in Pakistan. Global Business Review 13: 201–19. [Google Scholar] [CrossRef]
- Siddique, Abu, E. Antony Selvanathan, and Saroja Selvanathan. 2012. Remittances and economic growth: Empirical evidence from Bangladesh, India and Sri Lanka. Journal of Development Studies 48: 1045–62. [Google Scholar] [CrossRef]
- Solow, Robert M. 1957. Technical change and the aggregate production function. The Review of Economics and Statistics 39: 312–20. [Google Scholar] [CrossRef]
- Tang, Chor Foon, and Hooi Hooi Lean. 2009. New evidence from the misery index in the crime function. Economics Letters 102: 112–15. [Google Scholar] [CrossRef]
- Terry, Donald F. 2005. Beyond Small Change: Making Migrant Remittances Count. Washington, DC: Inter-American Development Bank (IDB). [Google Scholar]
- Tsagkanos, Athanasios, Costas Siriopoulos, and Konstantina Vartholomatou. 2019. Foreign direct investment and stock market development: Evidence from a “new” emerging market. Journal of Economic Studies 46: 55–70. [Google Scholar] [CrossRef]
- Vamvakidis, Athanasios. 2002. How robust is the growth-openness connection? Historical evidence. Journal of Economic Growth 7: 57–80. [Google Scholar] [CrossRef]
- Vernon, Raymond. 2017. International investment and international trade in the product cycle. In International Business. Abington: Routledge, pp. 99–116. [Google Scholar]
- Williamson, Oliver E. 1975. Markets and Hierarchies. New York: Free Press. [Google Scholar]
- Yang, Dean. 2008. International migration, remittances and household investment: Evidence from Philippine migrants’ exchange rate shocks. The Economic Journal 118: 591–630. [Google Scholar] [CrossRef]
© 2019 by the authors. Licensee MDPI, Basel, Switzerland. This article is an open access article distributed under the terms and conditions of the Creative Commons Attribution (CC BY) license (http://creativecommons.org/licenses/by/4.0/).