Asymmetric Mean Reversion in Low Liquid Markets: Evidence from BRVM


Abstract
:1. Introduction
2. Model
3. Data and Summary Statistics
4. Estimation Results
4.1. Mean Reversion on the Overall Sample
4.2. Dynamics of Mean Reversion
5. Conclusions
Author Contributions
Funding
Acknowledgments
Conflicts of Interest
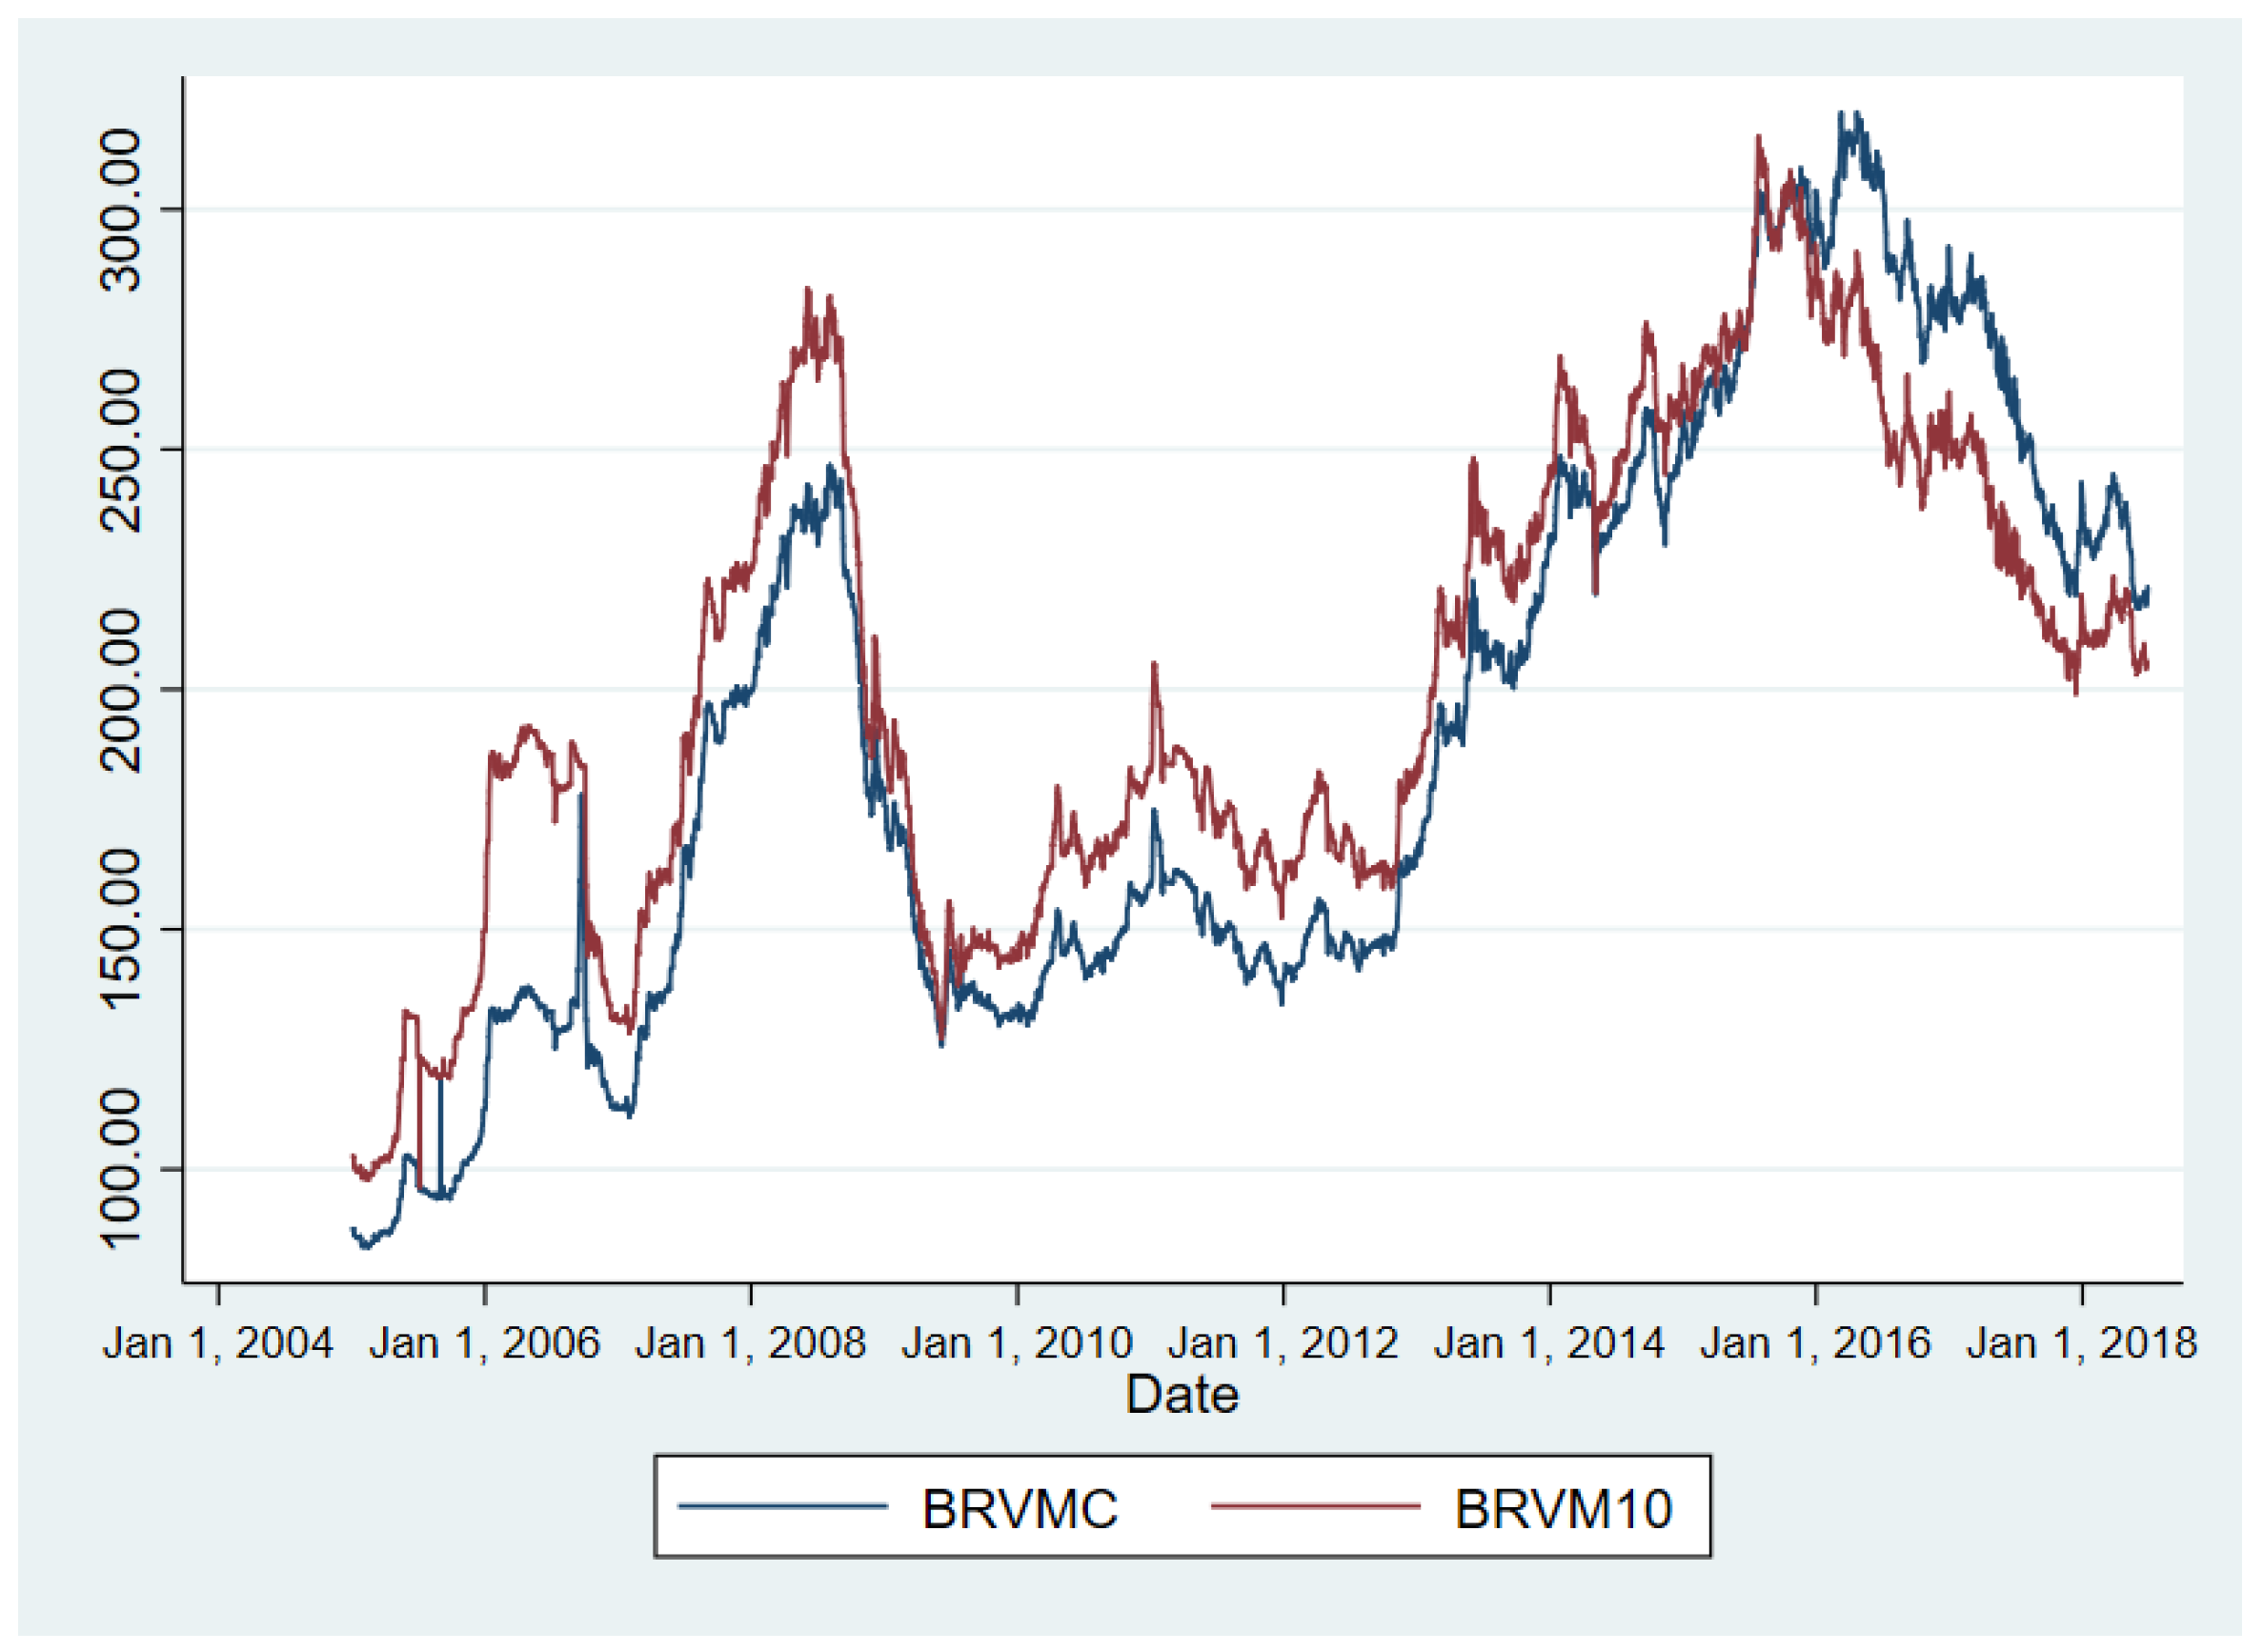
Appendix A. The BRVM Main Indices
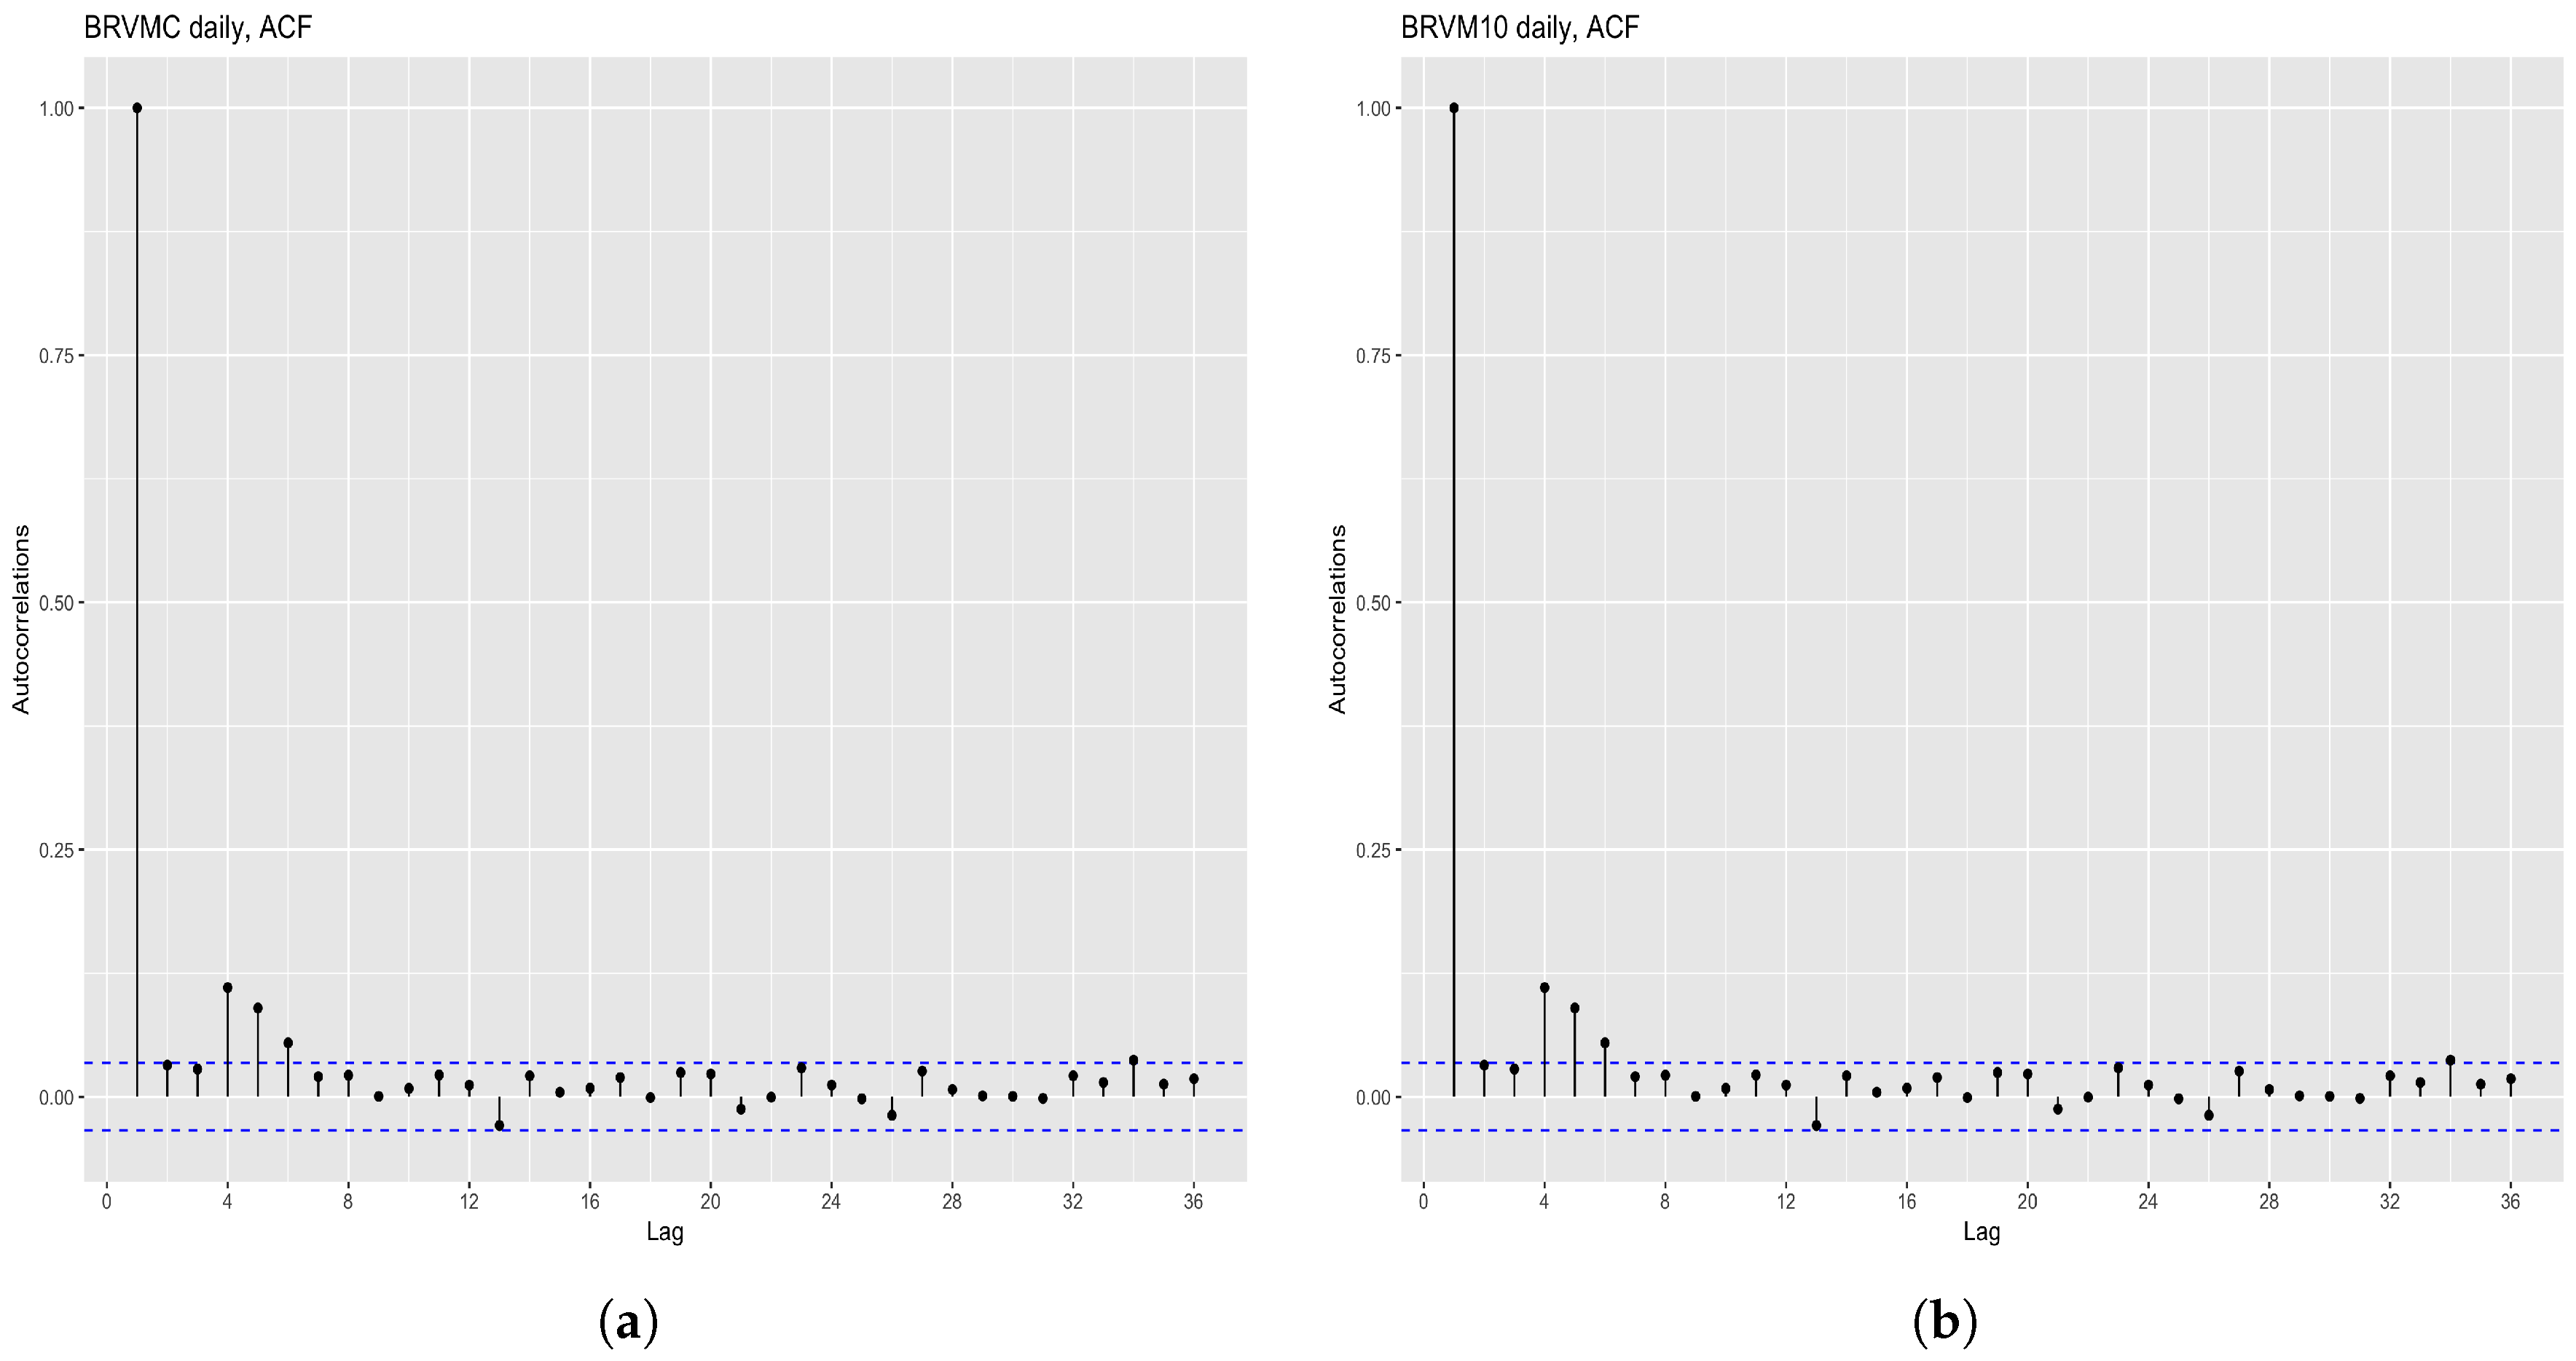
Appendix B. Correlogram

| BRVM C | BRVM 10 | |||||||
|---|---|---|---|---|---|---|---|---|
| Lag 1 | Lag 4 | Lag 5 | Lag 6 | Lag 1 | Lag 4 | Lag 5 | Lag 6 | |
| LL | 11,255.22 | 11,243.42 | 11,276.25 | 11,277.33 | 10,495.79 | 10,490.59 | 10,493.63 | 10,531.81 |
| AIC | −6.82 | −6.81 | −6.82 | −6.82 | −6.36 | −6.35 | −6.35 | −6.37 |
| BIC | −6.80 | −6.77 | −6.79 | −6.78 | −6.34 | −6.32 | −6.31 | −6.33 |
| SIC | −6.82 | −6.81 | −6.82 | −6.82 | −6.36 | −6.35 | −6.35 | −6.37 |
| HQ | −6.81 | −6.79 | −6.81 | −6.81 | −6.35 | −6.34 | −6.34 | −6.36 |
Appendix C. Stationary Test
| Lag | Type 1 | Type 2 | Type 3 | |||
|---|---|---|---|---|---|---|
| ADF | p-Value | ADF | p-Value | ADF | p-Value | |
| BRVMC return | ||||||
| 0 | ||||||
| 1 | ||||||
| 2 | ||||||
| 3 | ||||||
| 4 | ||||||
| 5 | ||||||
| 6 | ||||||
| 7 | ||||||
| 8 | ||||||
| BRVM10 return | ||||||
| 0 | ||||||
| 1 | ||||||
| 2 | ||||||
| 3 | ||||||
| 4 | ||||||
| 5 | ||||||
| 6 | ||||||
| 7 | ||||||
| 8 | ||||||
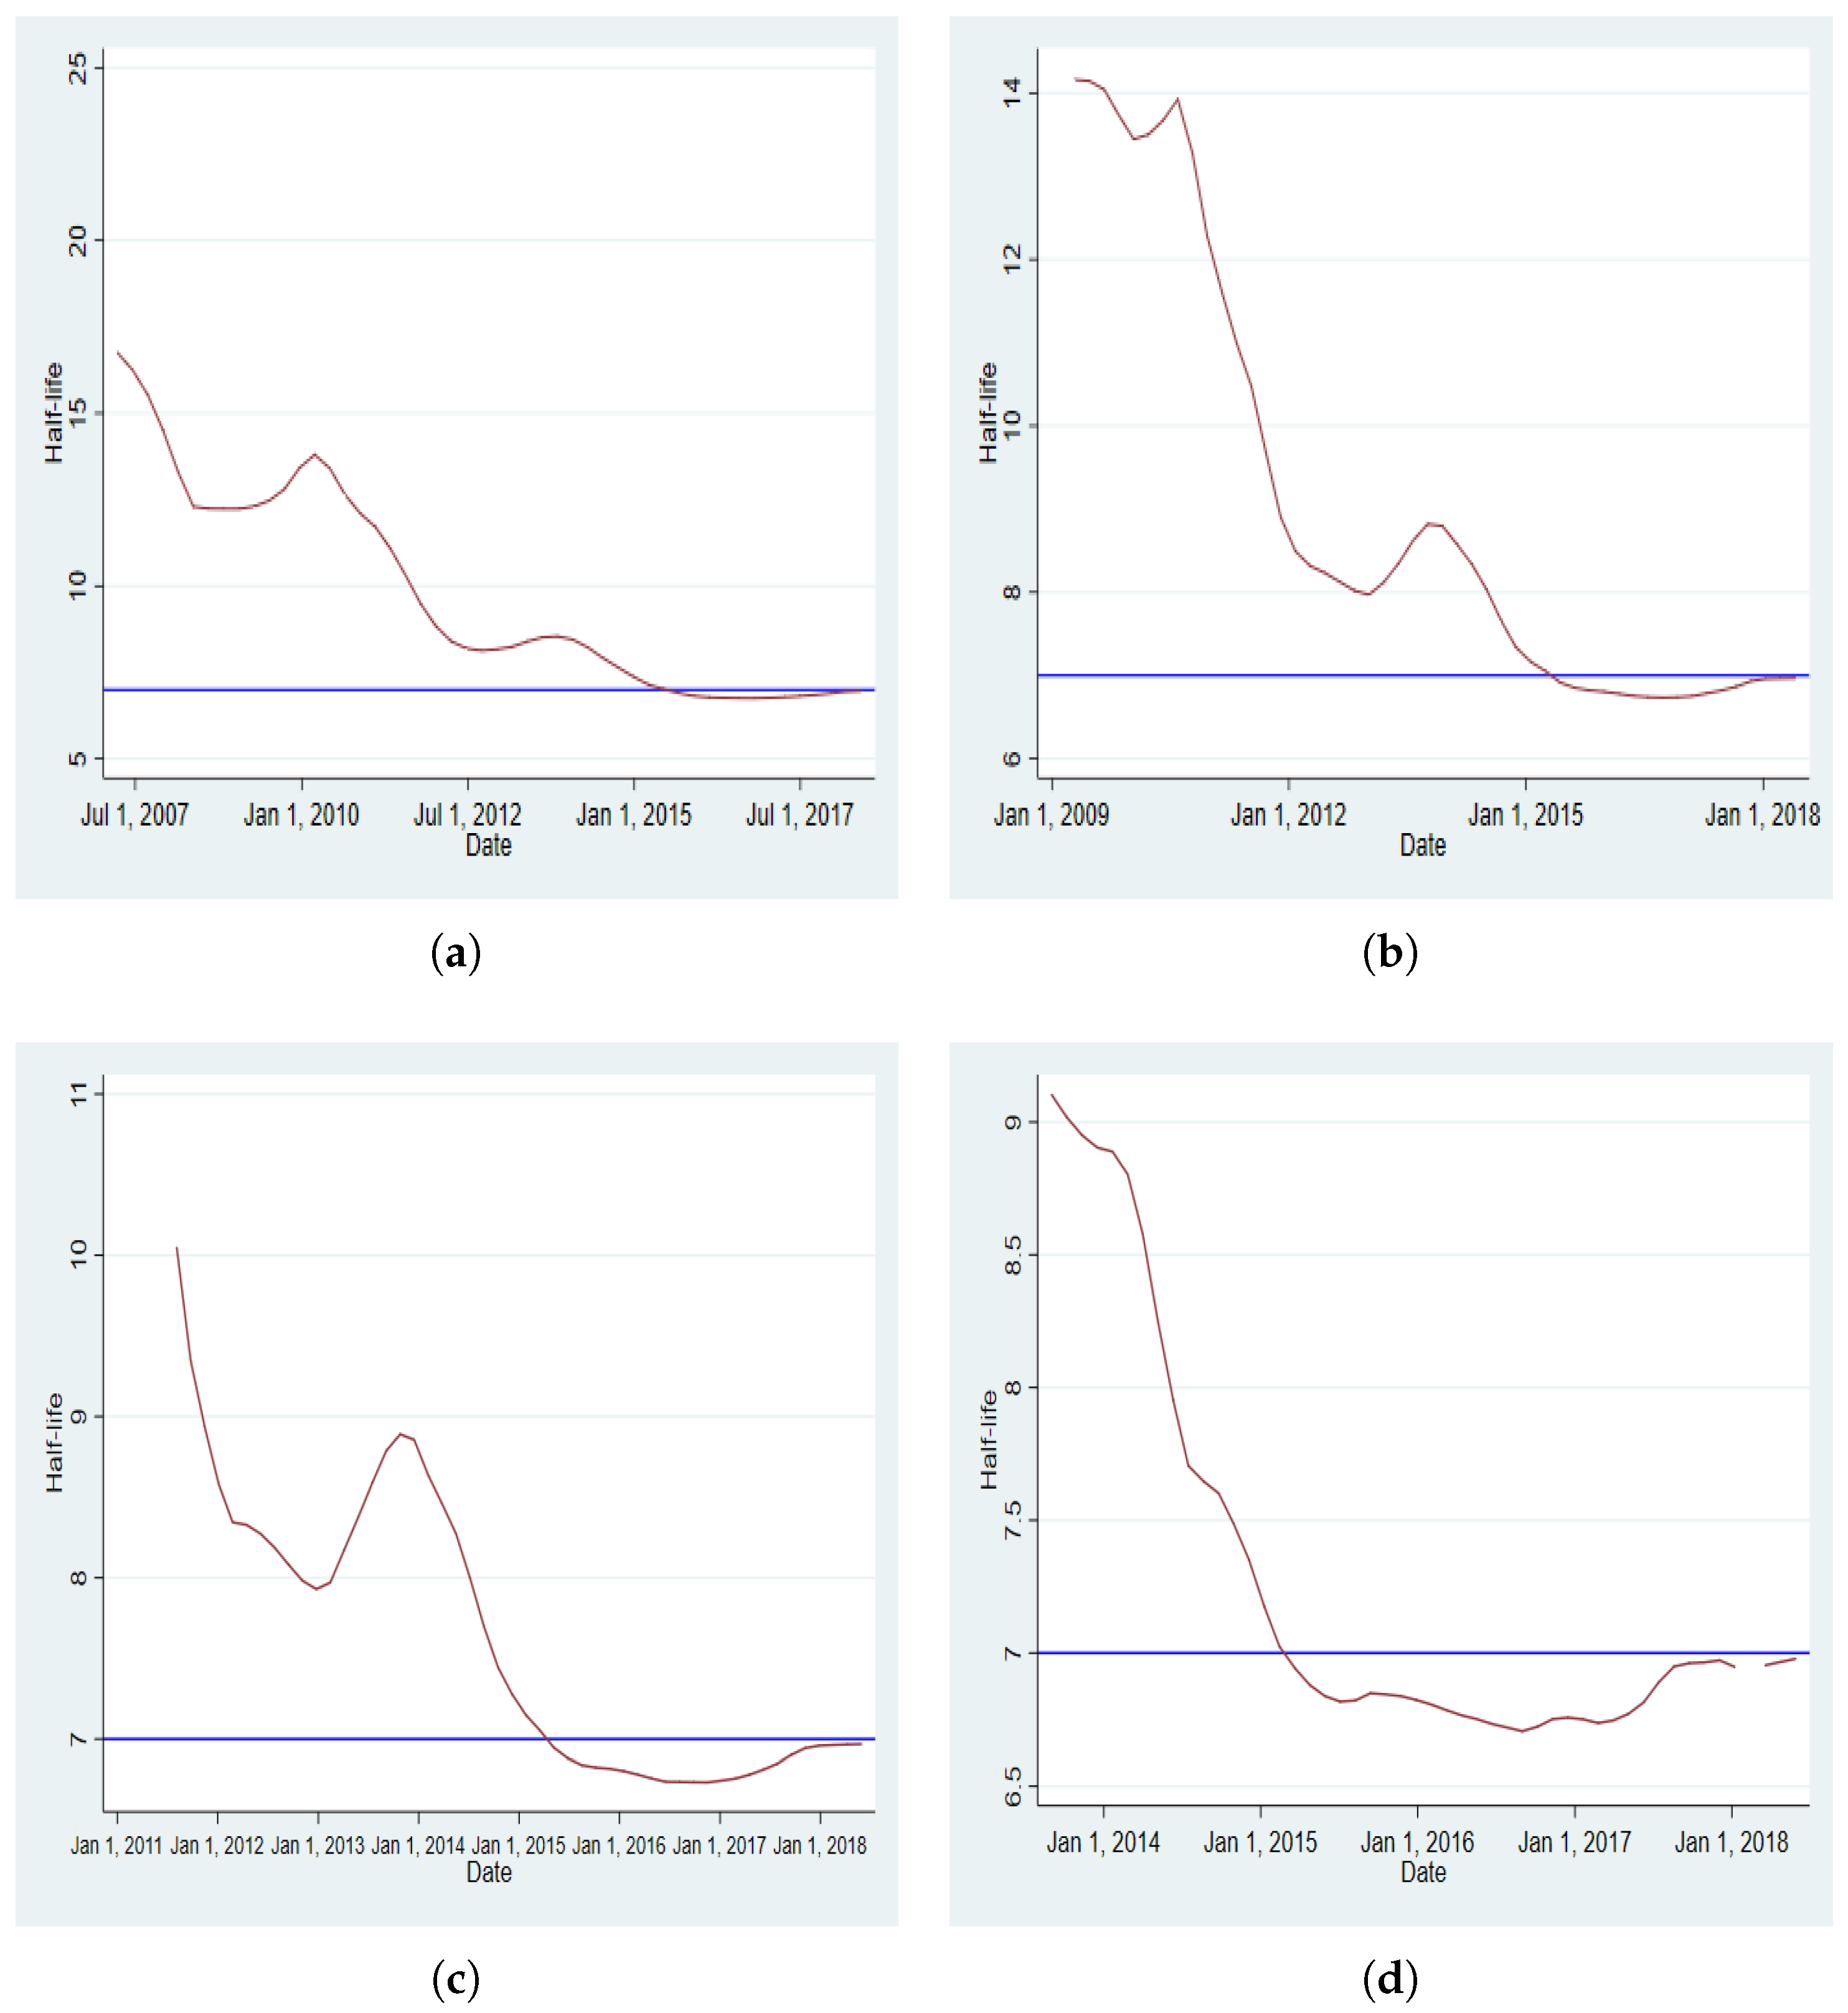
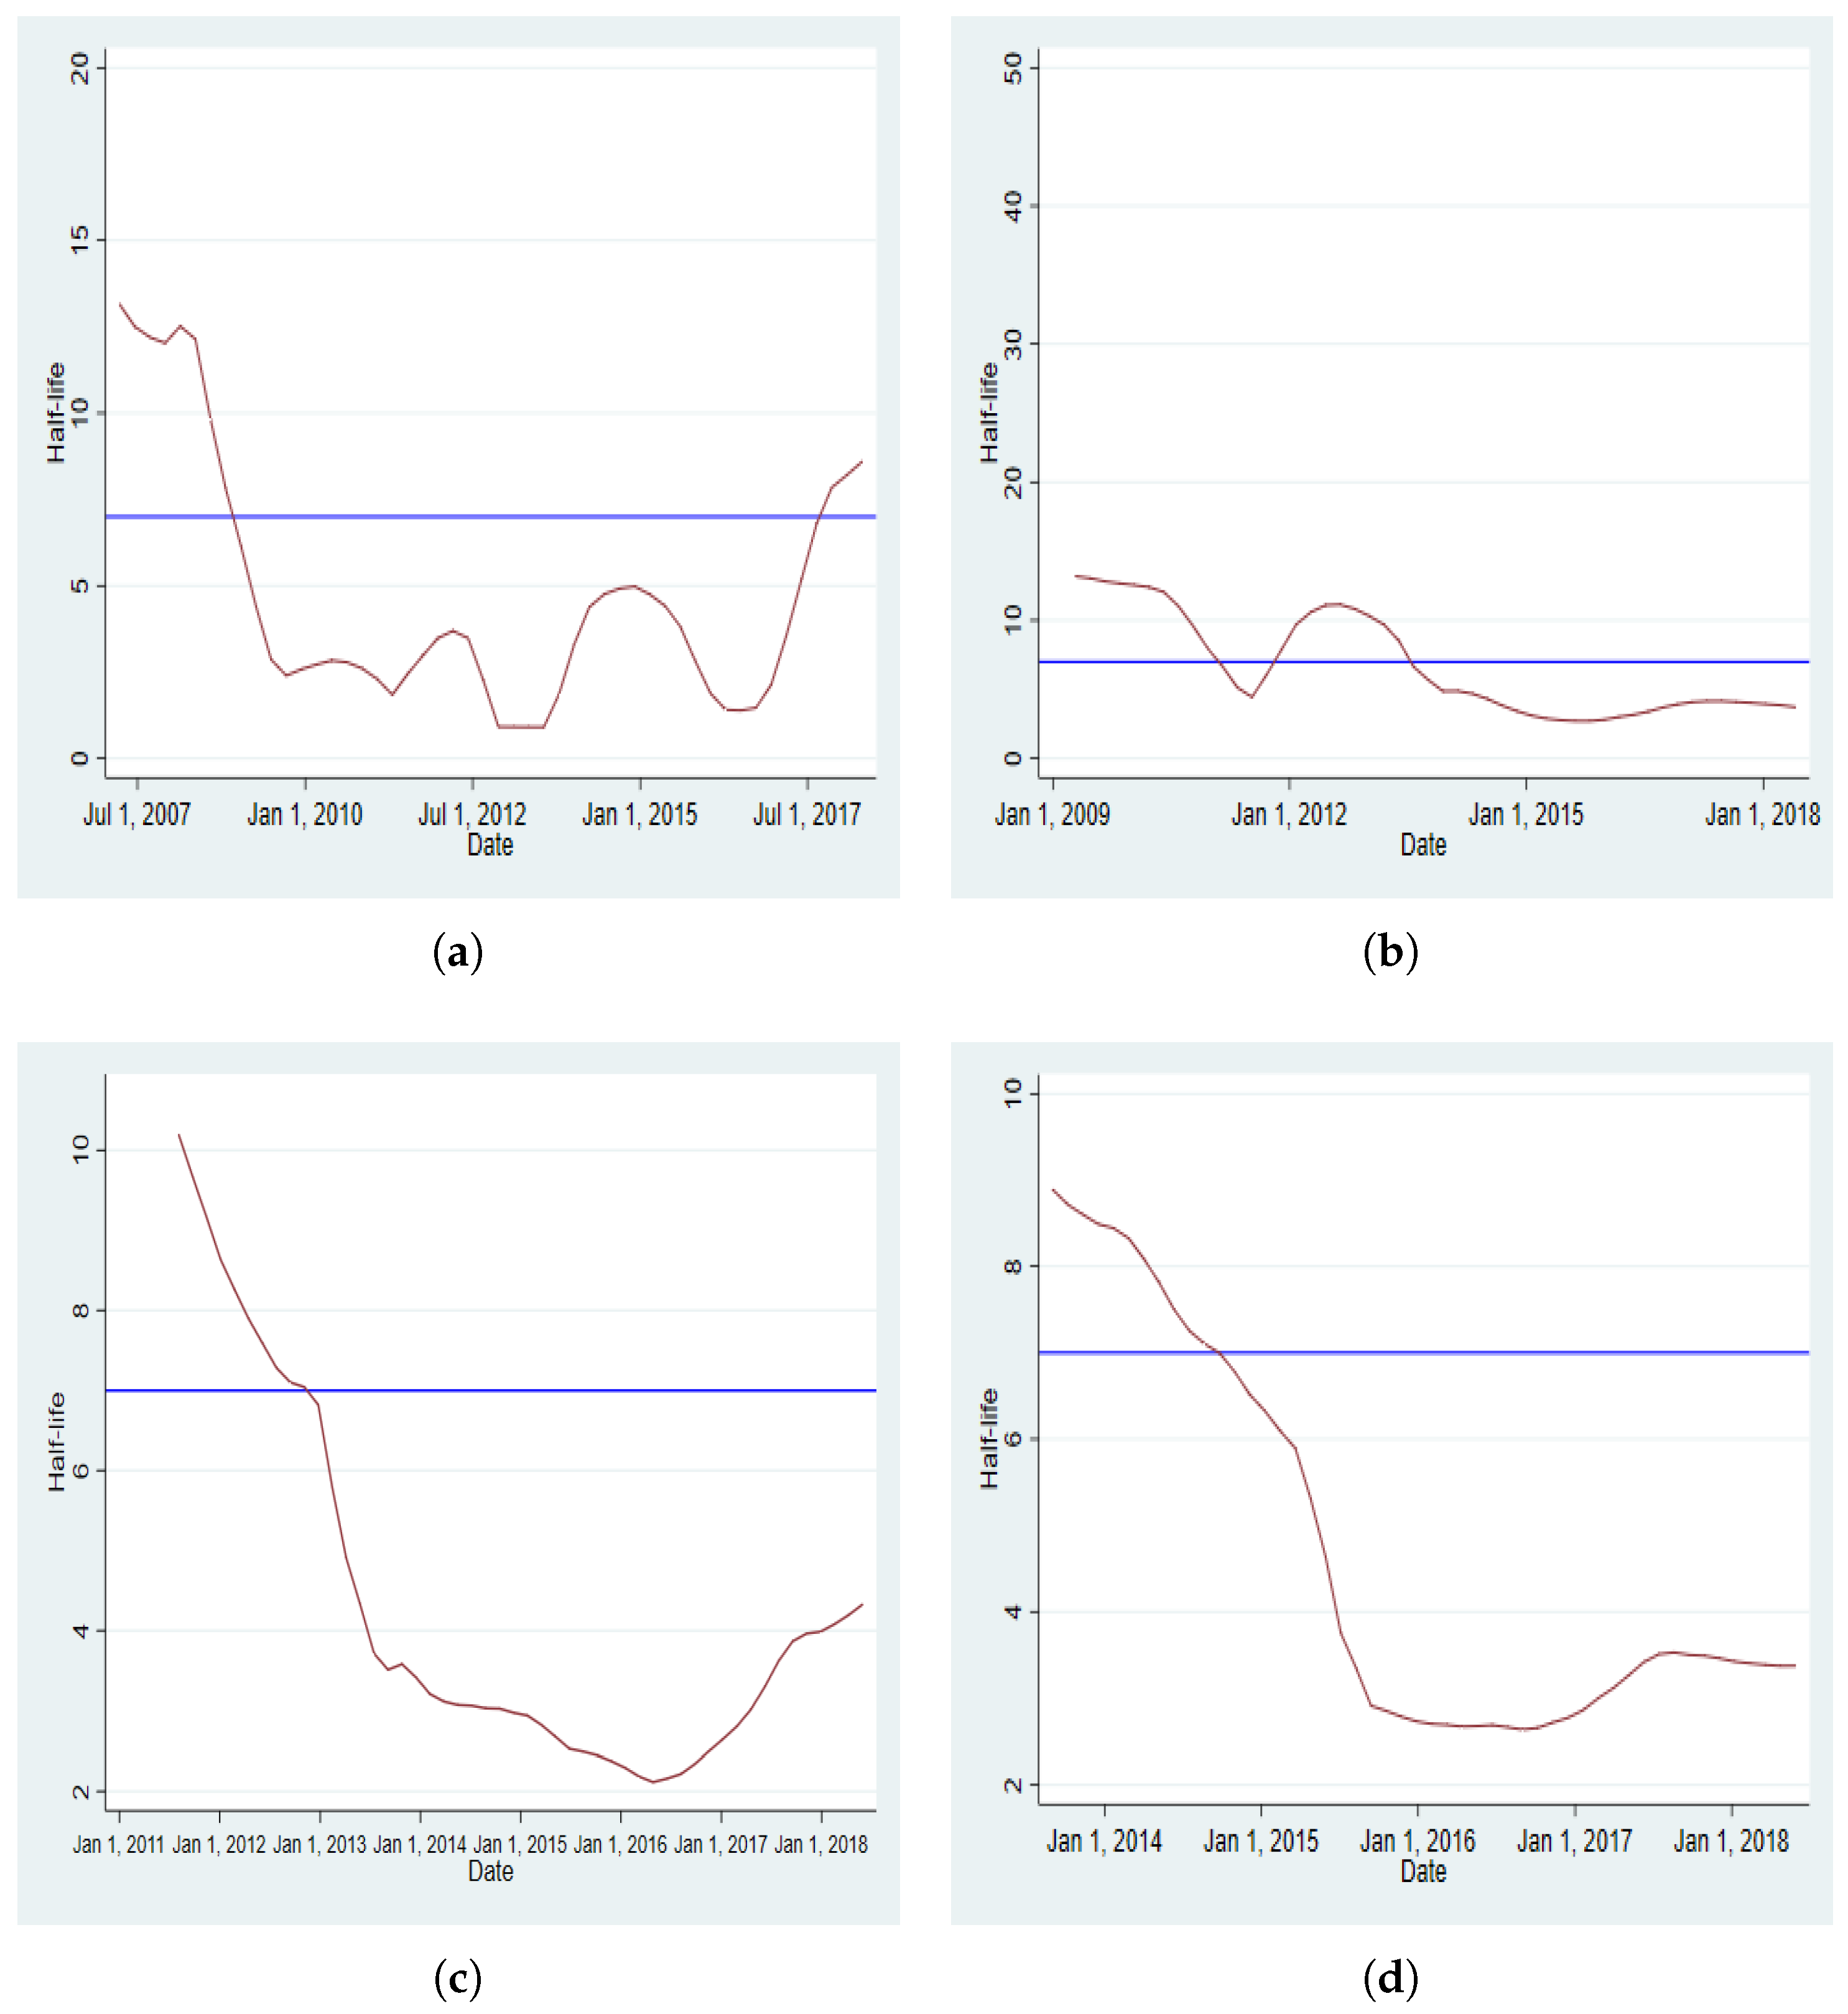
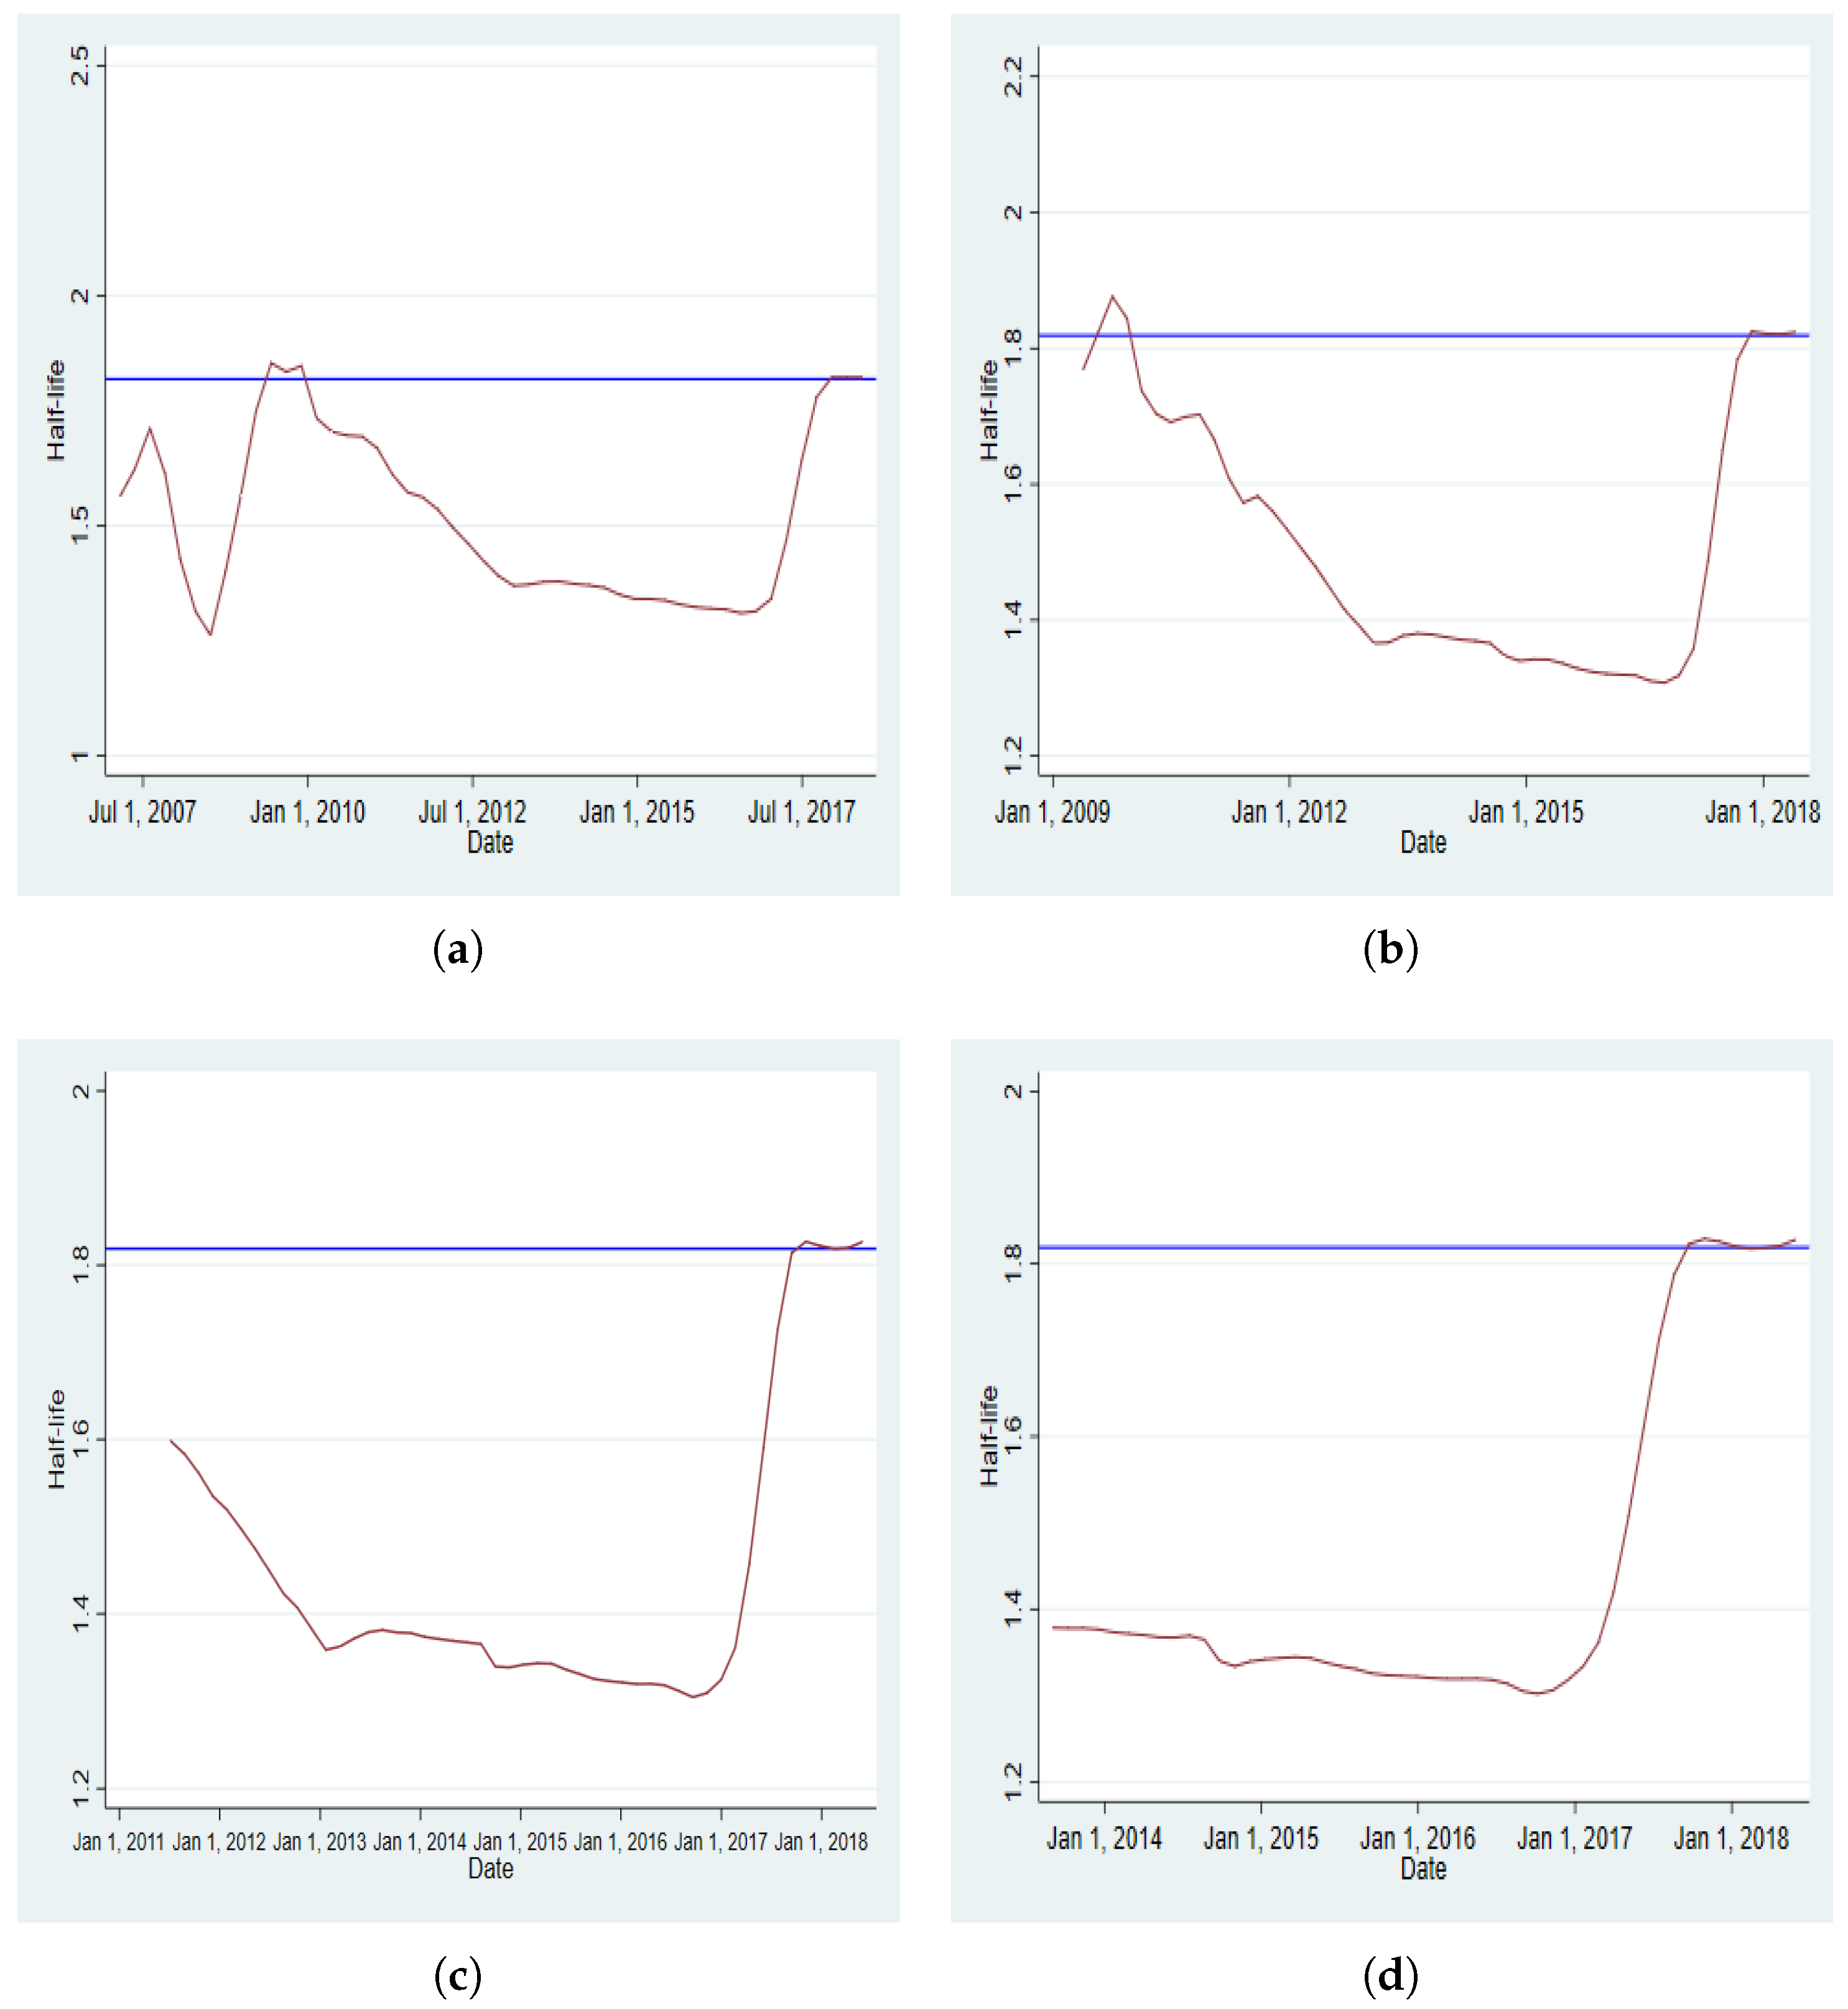
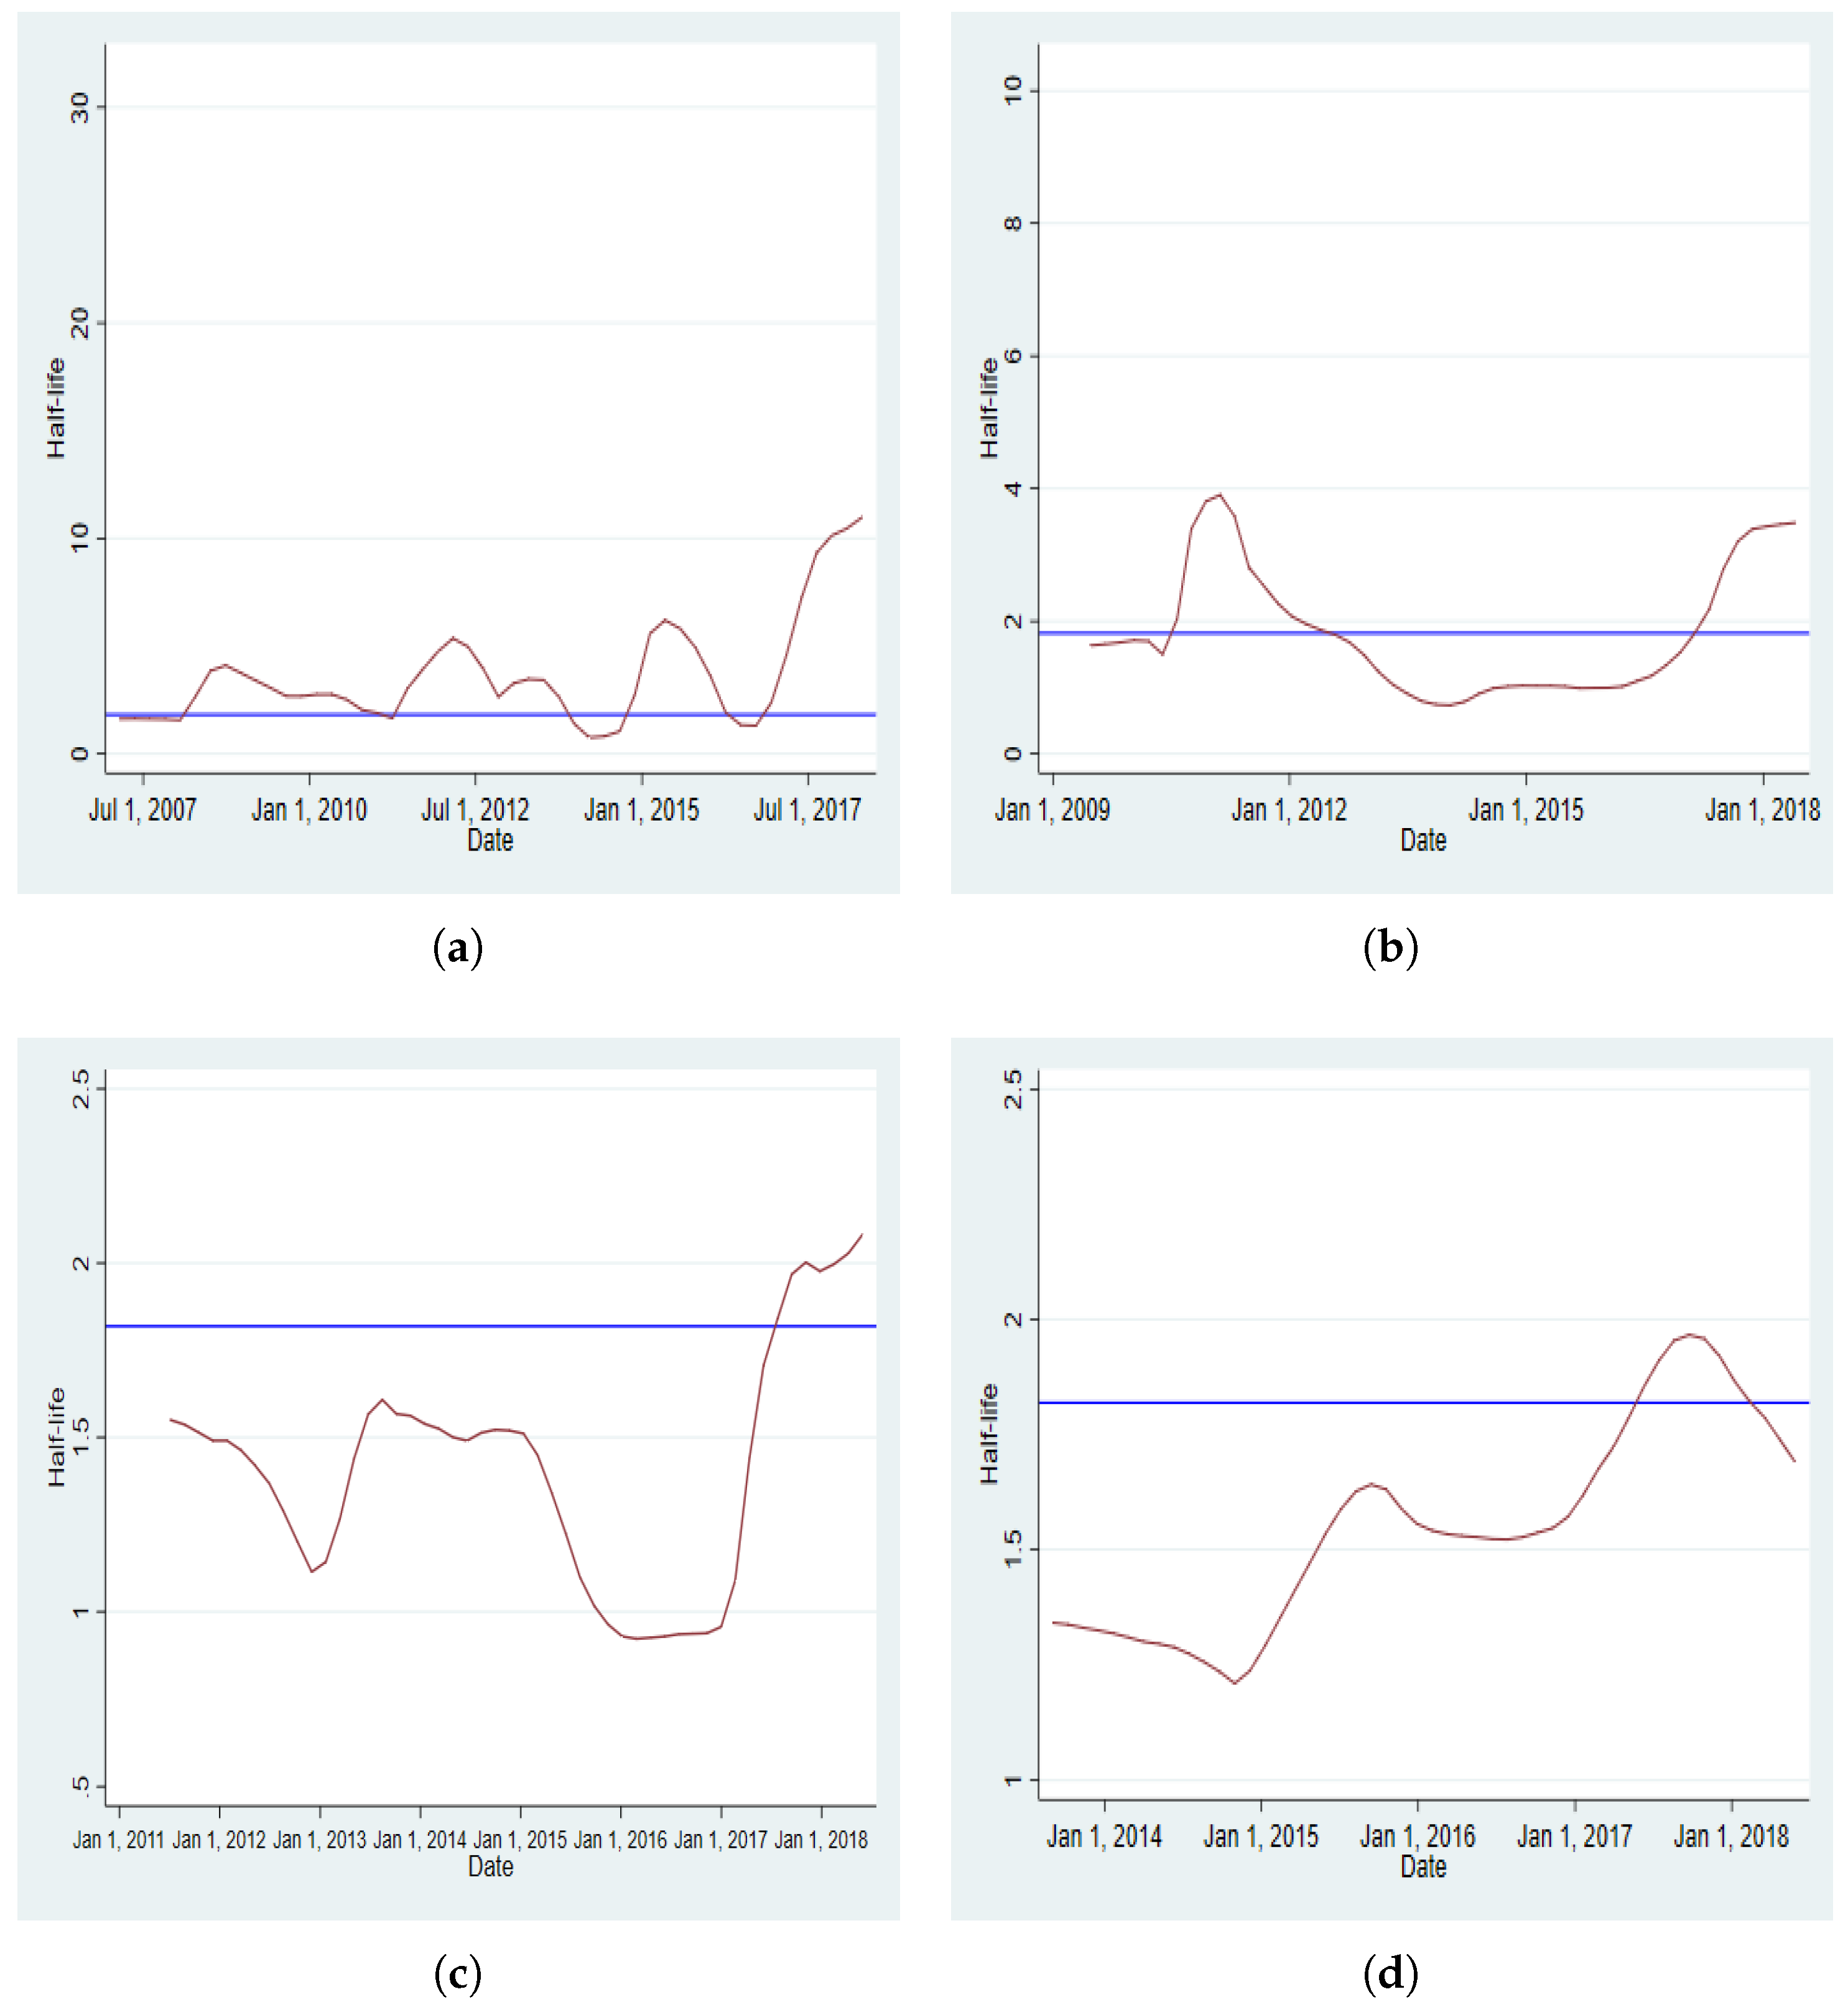
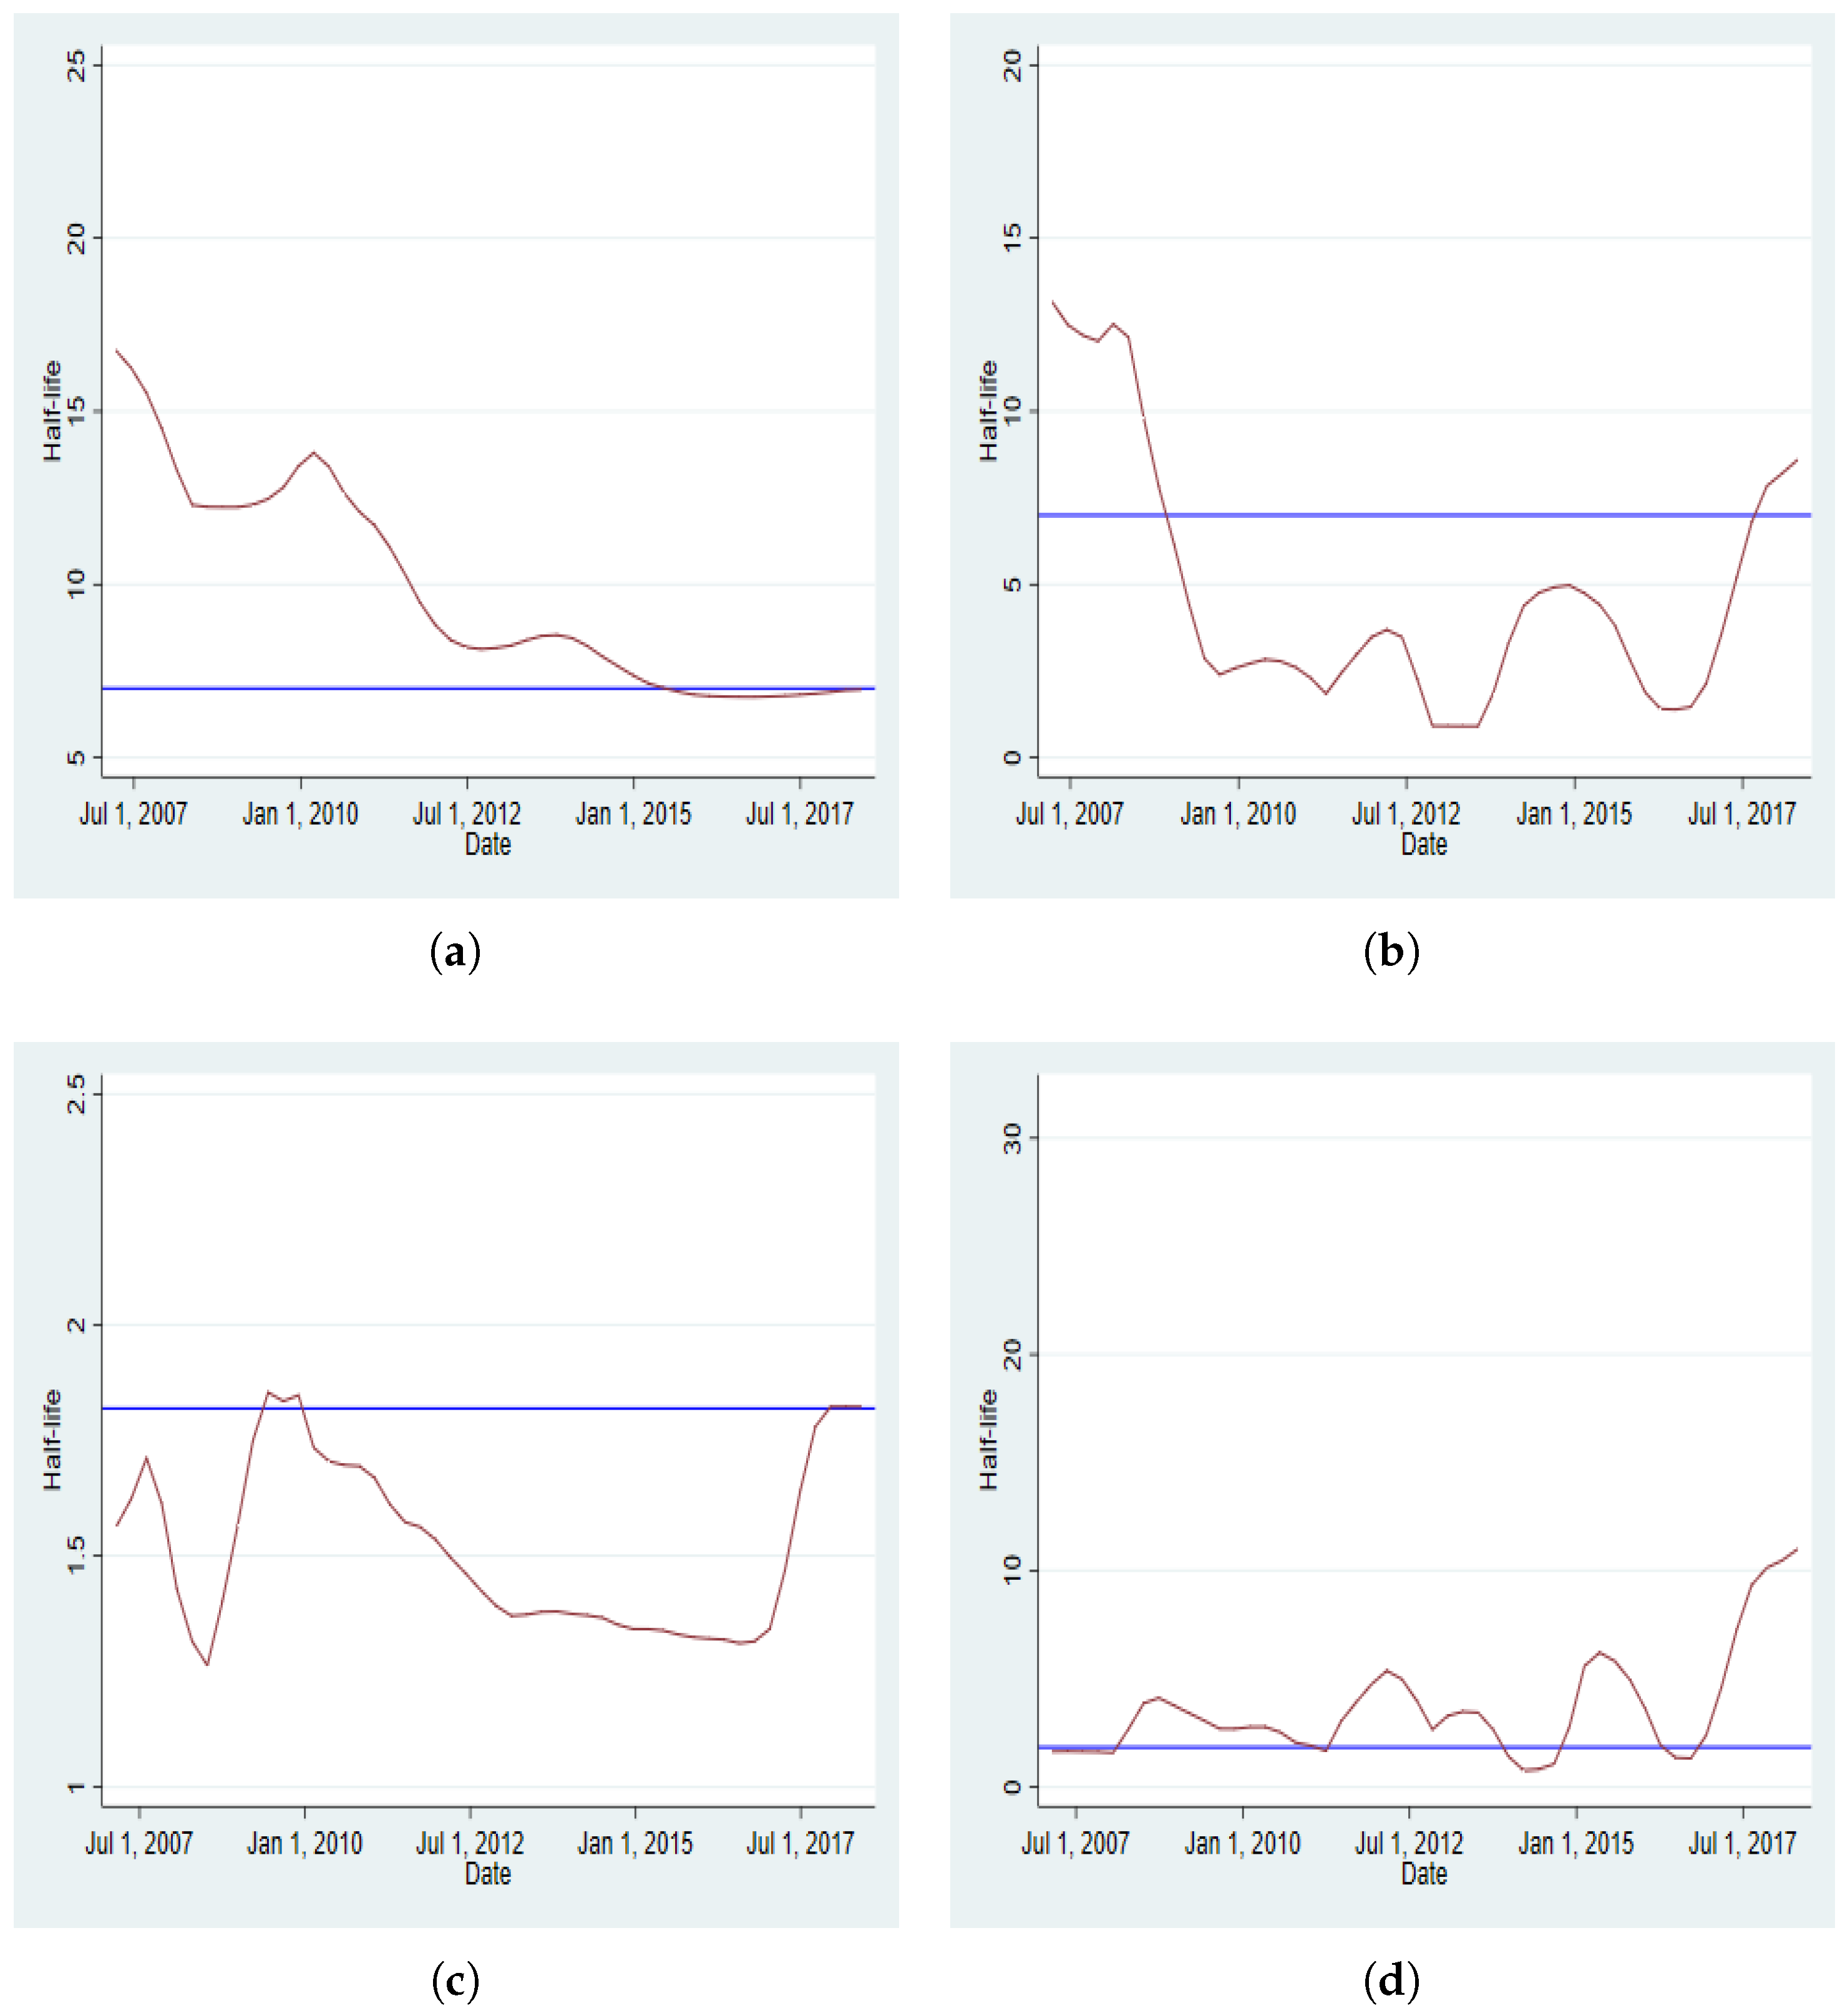
Appendix D. Dynamics of Half-Time
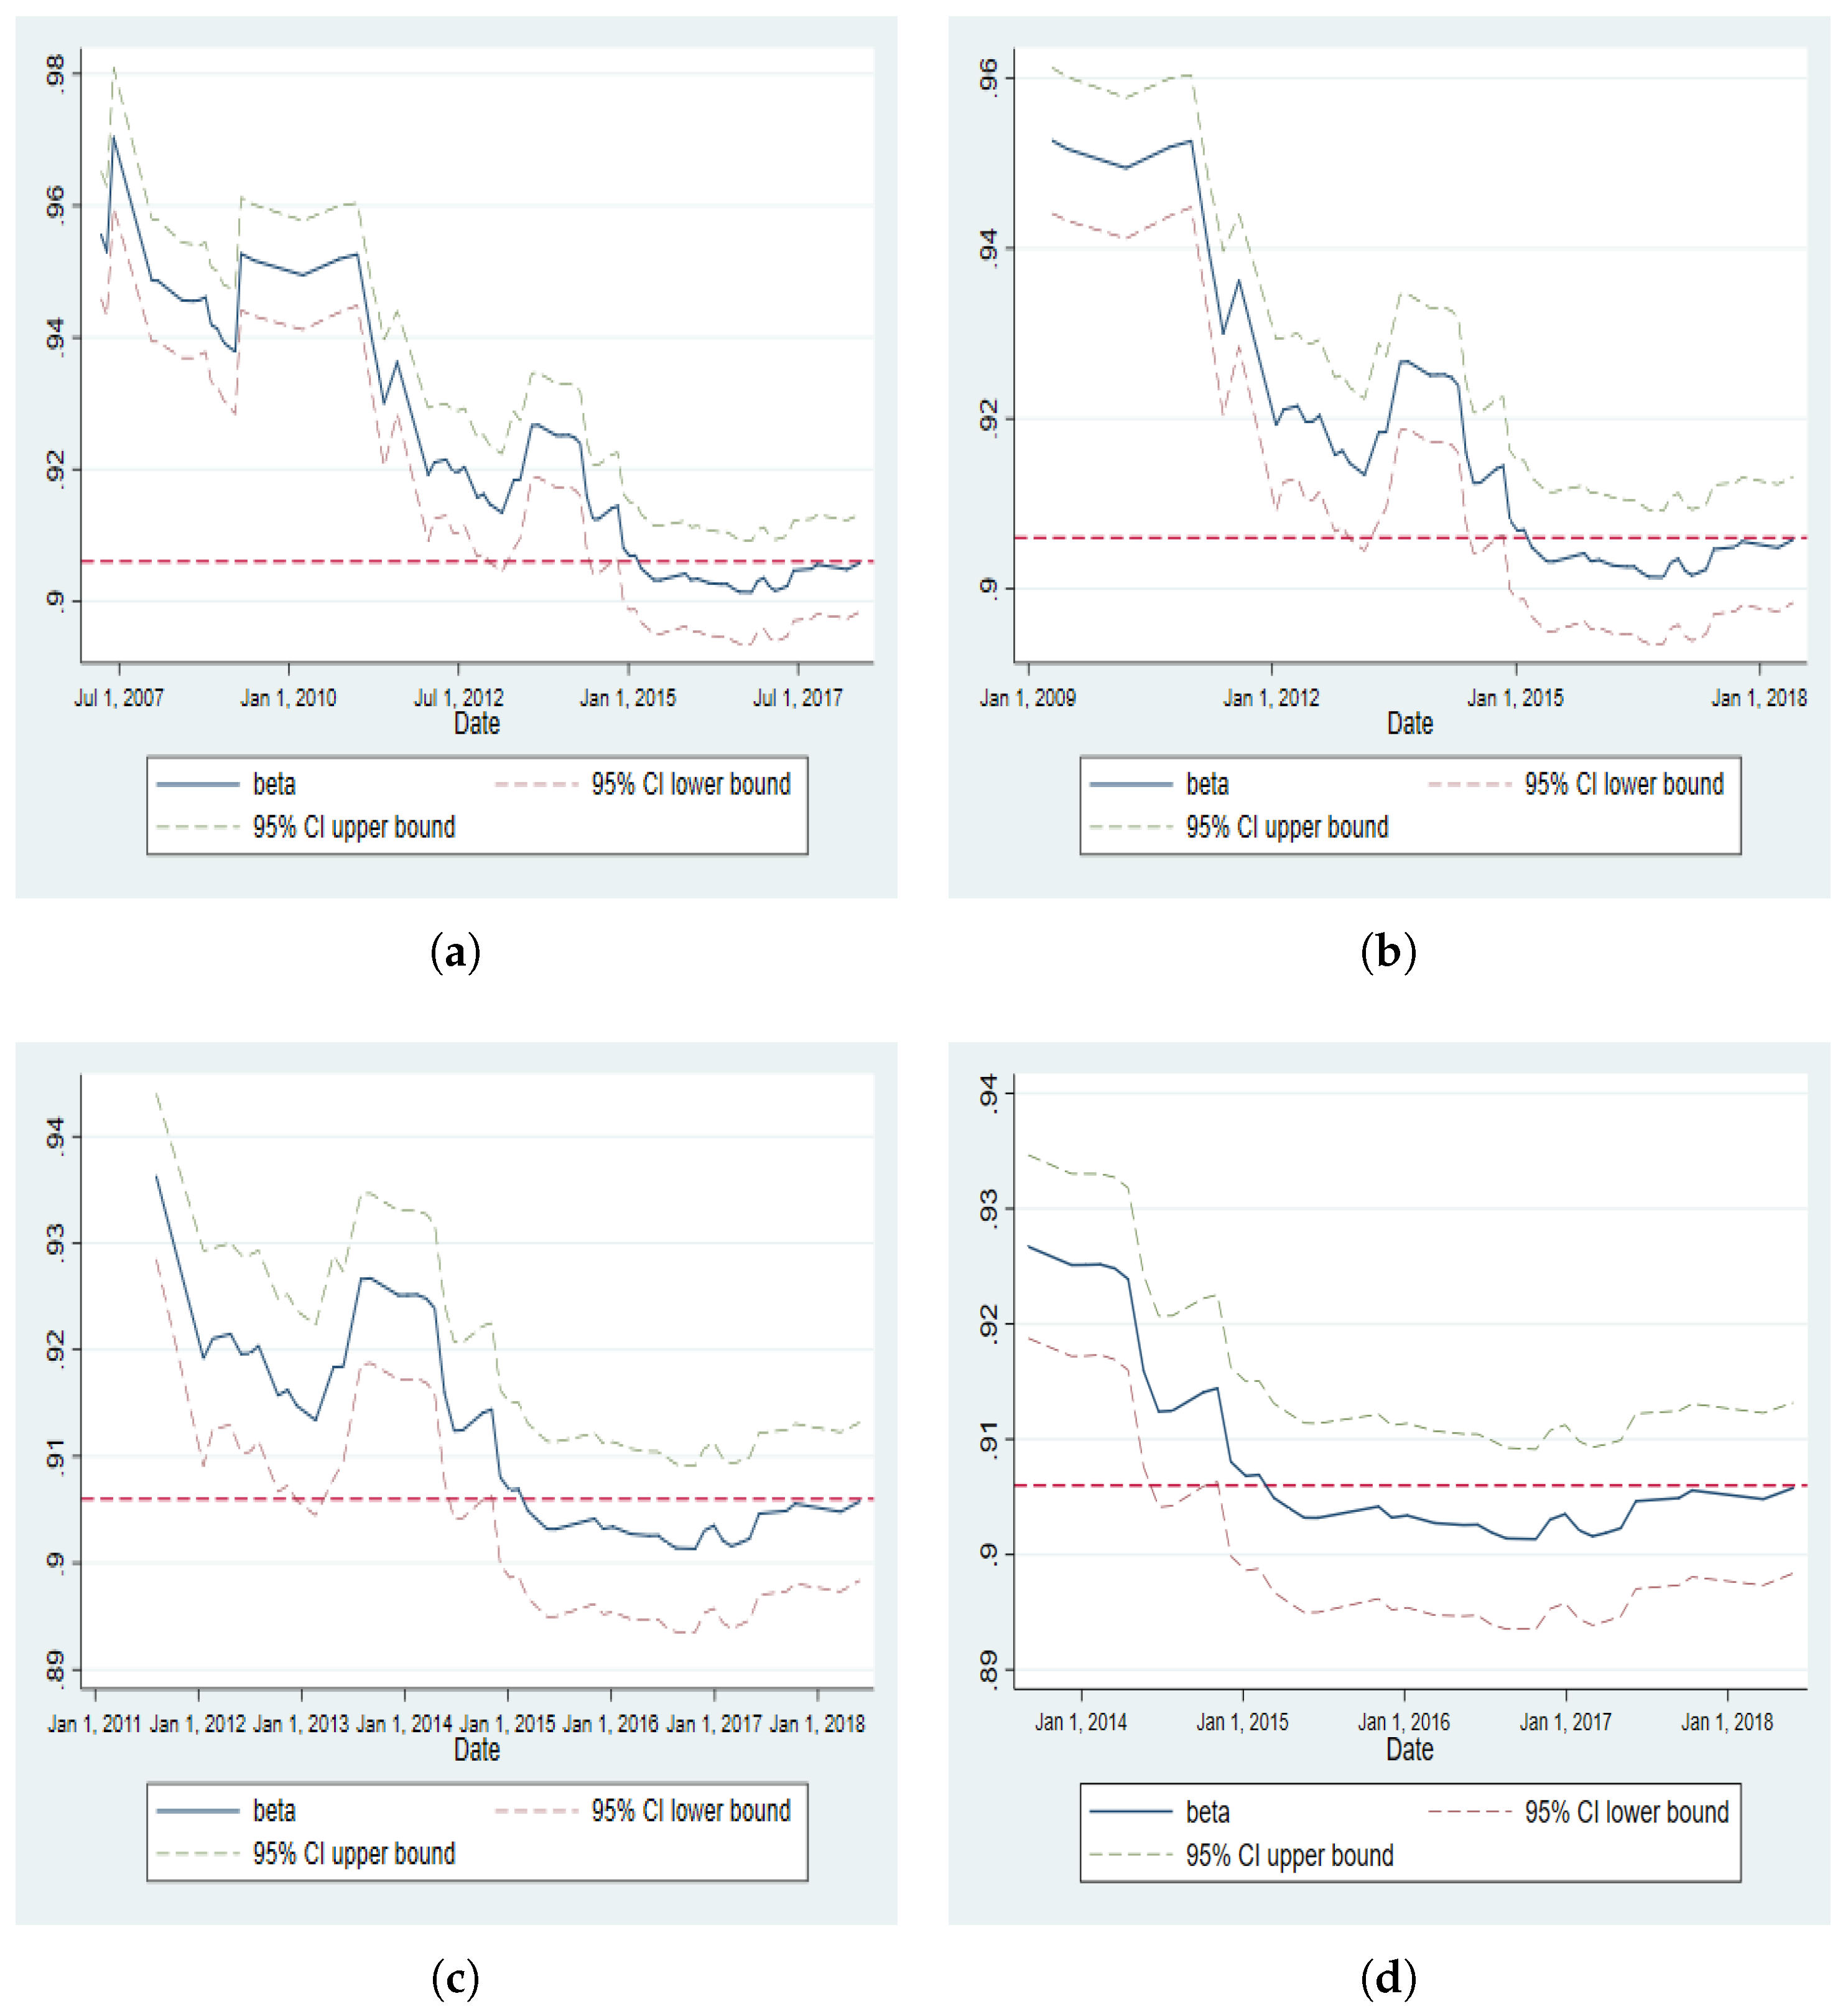
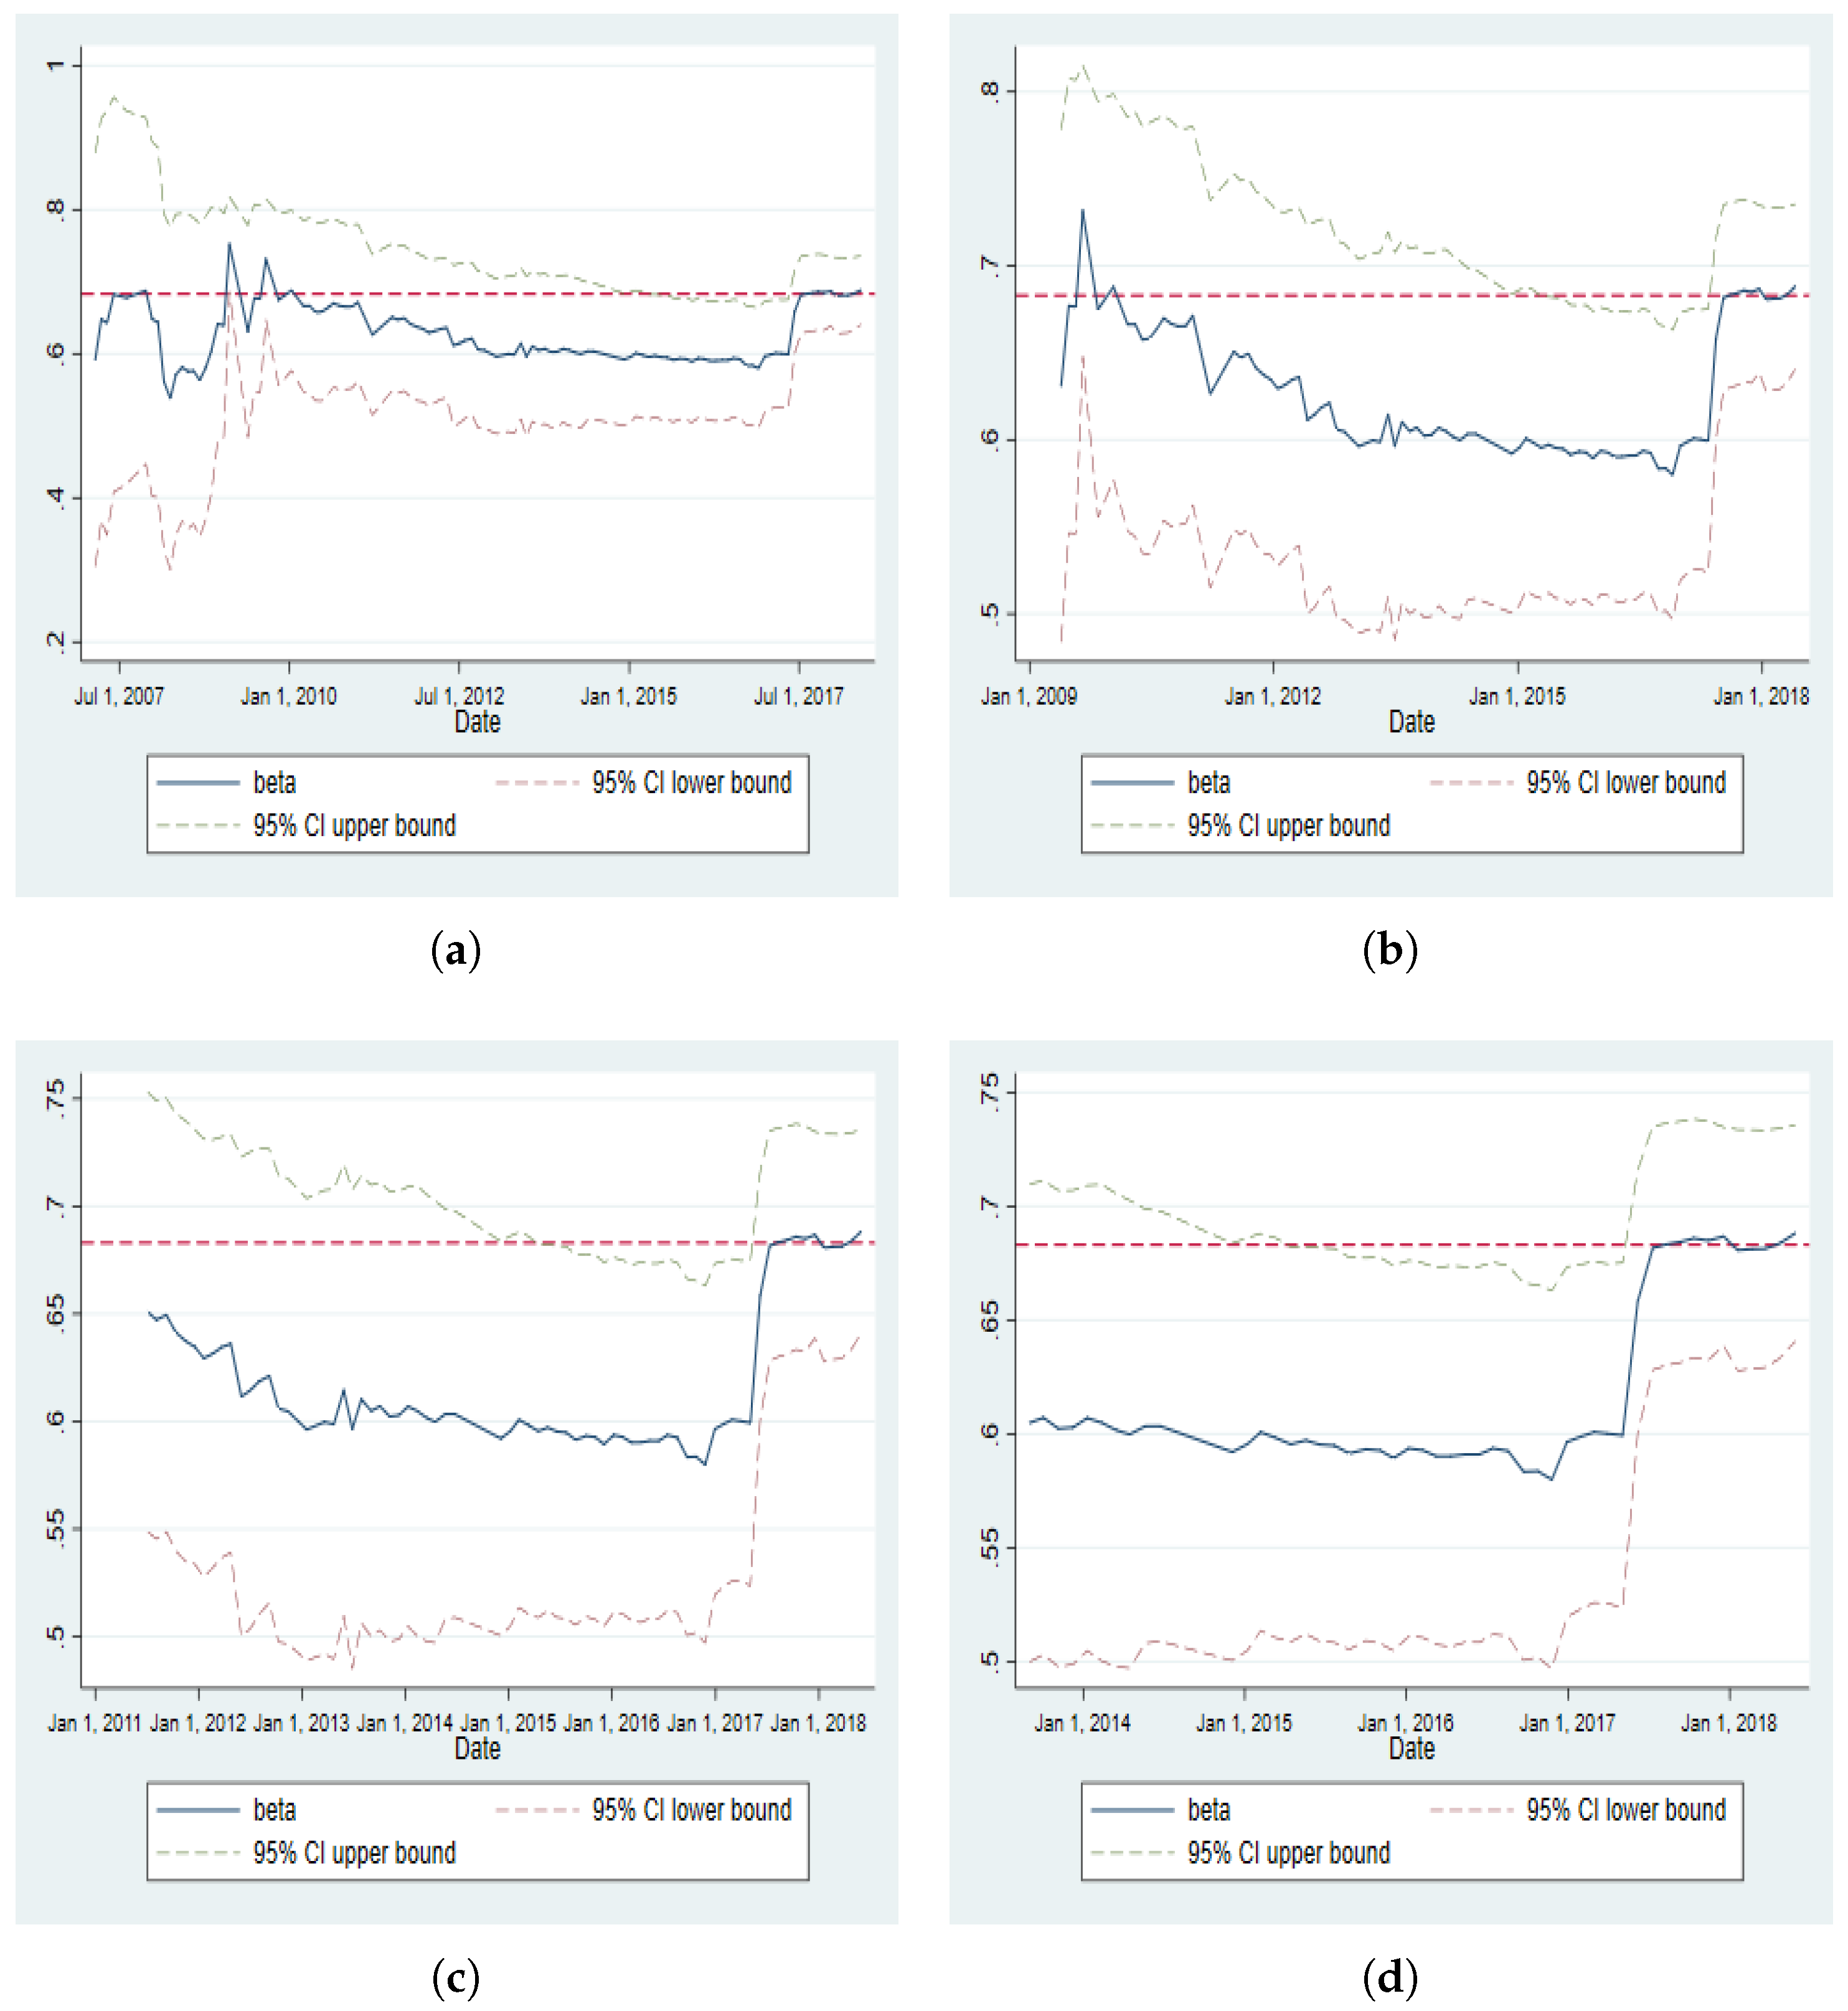
Appendix E. Dynamics of the Persistence Parameter in EGARCH
References
- Ahmed, Rizwan Raheem, Jolita Vveinhardt, Dalia Streimikiene, and Zahid Ali Channar. 2018. Mean reversion in international markets: Evidence from GARCH and half-life volatility models. Economic Research-Ekonomska Istrǎzivanja 31: 1198–217. [Google Scholar] [CrossRef]
- Akaike, Hirotogu. 1998. Information theory and an extension of the maximum likelihood principle. In Selected Papers of Hirotugu Akaike. Berlin: Springer, pp. 199–213. [Google Scholar]
- Anoruo, Emmanuel, and Luis Gil-Alana. 2011. Mean reversion and long memory in African stock market prices. Journal of Economics and Finance 35: 296–308. [Google Scholar] [CrossRef]
- Bali, Turin G., and K. Ozgur Demirtas. 2007. Testing mean reversion in financial market volatility: Evidence from S&P 500 index futures. The Journal of Futures Markets 28: 1–33. [Google Scholar] [CrossRef]
- Bollerslev, Tim. 1986. Generalized autoregressive conditional heteroskedasticity. Journal of Econometrics 31: 307–27. [Google Scholar] [CrossRef]
- Corbet, Shaen, and Paraskevi Katsiampa. 2018. Asymmetric mean reversion of Bitcoin price returns. International Review of Financial Analysis. In press. [Google Scholar] [CrossRef]
- Dickey, David, and Wayne Fuller. 1981. Likelihood ratio statistics for autoregressive time series with a unit root. Econometrica: Journal of the Econometric Society 49: 1057–72. [Google Scholar] [CrossRef]
- Engle, Robert. 2001. Garch 101: The use of arch/garch models in applied econometrics. Journal of Economic Perspectives 15: 157–68. [Google Scholar] [CrossRef]
- Engle, Robert. 1982. Autoregressive conditional heteroscedasticity with estimates of the variance of United Kingdom inflation. Econometrica: Journal of the Econometric Society 50: 987–1007. [Google Scholar] [CrossRef]
- Fama, Eugene. 1965. The behavior of stock-market prices. The Journal of Business 38: 34–105. [Google Scholar] [CrossRef]
- Hannan, Edward, and Barry Quinn. 1979. The determination of the order of an autoregression. Journal of the Royal Statistical Society. Series B (Methodological) 41: 190–95. [Google Scholar] [CrossRef]
- Kuttu, Saint. 2018. Asymmetric mean reversion and volatility in african real exchange rates. Journal of Economics and Finance 42: 575–90. [Google Scholar] [CrossRef]
- Mlambo, Chipo, and Nicholas Biekpe. 2007. The efficient market hypothesis: Evidence from ten African stock markets. Investment Analysts Journal 36: 5–17. [Google Scholar] [CrossRef]
- Nam, Kiseok, Chong Soo Pyun, and Stephen Avard. 2001. Asymmetric reverting behavior of short-horizon stock returns: An evidence of stock market overreaction. Journal of Banking & Finance 25: 807–24. [Google Scholar]
- Nam, Kiseok, Sei-Wan Kim, and Augustine C. Arize. 2006. Mean reversion of short-horizon stock returns: Asymmetry property. Review of Quantitative Finance and Accounting 26: 137–63. [Google Scholar] [CrossRef]
- Narayan, Paresh, and Arti Prasad. 2007. Mean reversion in stock prices: New evidence from panel unit root tests for seventeen european countries. Economics Bulletin 3: 1–6. [Google Scholar]
- Nelson, Daniel. 1991. Conditional heteroskedasticity in asset returns: A new approach. Econometrica: Journal of the Econometric Society 59: 347–70. [Google Scholar] [CrossRef]
- Oikarinen, Elias, and Felix Schindler. 2015. Momentum and mean reversion in regional housing markets: Evidence from variance ratio tests. International Journal of Strategic Property Management 19: 220–34. [Google Scholar] [CrossRef]
- Palwasha, Rana Imroze, Nawaz Ahmad, Rizwan Raheem Ahmed, Jolita Vveinhardt, and D. Štreimikienė. 2018. Speed of mean reversion: An empirical analysis of KSE, LSE and ISE indices. Technological and Economic Development of Economy 24: 1435–52. [Google Scholar] [CrossRef]
- Poterba, James, and Lawrence Summers. 1988. Mean reversion in stock prices: Evidence and implications. Journal of Financial Economics 22: 27–59. [Google Scholar] [CrossRef]
- Rapach, David, and Mark Wohar. 2006. Structural breaks and predictive regression models of aggregate US stock returns. Journal of Financial Econometrics 4: 238–74. [Google Scholar] [CrossRef]
- Schwarz, Gideon. 1978. Estimating thedimension of a model. Annals Of statistics 6: 461–64. [Google Scholar] [CrossRef]
- Spierdijk, Laura, Jacob Bikker, and Pieter Van den Hoek. 2012. Mean reversion in international stock markets: An empirical analysis of the 20th century. Journal of International Money and Finance 31: 228–49. [Google Scholar] [CrossRef]
- Tie, Jingzhi, and Qing Zhang. 2016. An optimal mean-reversion trading rule under a Markov chain model. Mathematical Control and Related Fields 6: 467–88. [Google Scholar] [CrossRef]
- Wu, Yi, and Nicole Lux. 2018. U.K. house prices: Bubbles or market efficiency? evidence from regional analysis. Journal of Risk and Financial Management 11: 54. [Google Scholar] [CrossRef]
| 1. | The markets studied in this paper are Egypt, Kenya, Zimbabwe, Morocco, Mauritius, Tunisia, Ghana, Namibia, Botswana and Côte d’Ivoire |
| 2. | It was the weak-form efficiency that was tested. |
| 3. | Appendix D provides the dynamics of the half-life for both BRVMC and BRVM10 indices using each of the four windows considered for each of the two schemes of rolling regression. In Appendix E, the dynamics of the persistence parameter (EGARCH coefficient) is plotted for both BRVMC and BRVM10 indices under the two schemes and for all four windows. The dynamics for all other coefficients of the models using the rolling regression under the two schemes and for all the windows are available upon request to the authors. |
| Indices | N | Mean | St. Dev. | Min | Pctl(25) | Pctl(75) | Max |
|---|---|---|---|---|---|---|---|
| BRVMC returns | 3299 | ||||||
| BRVM10 returns | 3299 |
| BRVMC Return | BRVM10 Return | |||
|---|---|---|---|---|
| + | − | + | − | |
| 2c | 426 | 356 | 409 | 373 |
| 3c | 232 | 176 | 214 | 179 |
| 4c | 117 | 101 | 103 | 89 |
| 5c | 62 | 64 | 64 | 49 |
| 6c | 42 | 33 | 45 | 28 |
| 7c | 22 | 20 | 28 | 21 |
| 8c | 15 | 12 | 19 | 11 |
| 9c | 11 | 6 | 11 | 6 |
| 10c | 9 | 2 | 7 | 1 |
| 11c | 5 | 1 | 4 | 0 |
| 12c | 4 | 1 | 4 | 0 |
| 13c | 3 | 0 | 2 | 0 |
| 14c | 3 | 0 | 2 | 0 |
| 15c | 1 | 0 | 0 | 0 |
| 16c | 1 | 0 | 0 | 0 |
| BRVMC | BRVM10 | |||
|---|---|---|---|---|
| Criteria | ANAR | ANARMA | ANAR | ANARMA |
| LL | ||||
| AIC | ||||
| BIC | ||||
| HQ | ||||
| SIC | ||||
| Parameters | BRVMC | BRVM10 |
|---|---|---|
| 0.00 ** | −0.00 ** | |
| 0.98 *** | 0.91 *** | |
| −0.93 *** | −0.87 *** | |
| −0.12 *** | −0.19 *** | |
| −0.87 *** | −2.88 ** | |
| 0.04 * | −0.01 | |
| 0.91 *** | 0.68 *** | |
| 0.23 *** | 0.26 *** | |
| Half-life (h2l) | 7.05 days | 1.8 days |
| Parameters | BRVMC | BRVM10 | ||||
|---|---|---|---|---|---|---|
| Model 1 | Model 2 | Model 3 | Model 1 | Model 2 | Model 3 | |
| 0.00 ** | 0.00 *** | −0.00 ** | 0.00 *** | |||
| 0.98 *** | −0.11 *** | −0.06 * | 0.91 *** | −0.14 * | ||
| −0.93 *** | 0.04 *** | −0.87 *** | ||||
| −0.12 *** | 0.17 * | −0.19 *** | ||||
| −0.87 *** | −0.85 *** | −2.88 ** | −2.83 ** | −2.81 ** | ||
| 0.04 * | ||||||
| 0.91 *** | 0.91 *** | 0.91 *** | 0.68 *** | 0.69 *** | 0.69 *** | |
| 0.23 *** | 0.21 *** | 0.26 *** | 0.26 *** | 0.26 *** | ||
| LL | 11,255.22 | 11,227.17 | 11,227.18 | 10,495.79 | 10,479.01 | 10,479.31 |
| AIC | −6.82 | −6.80 | −6.80 | −6.36 | −6.35 | −6.35 |
| BIC | −6.80 | −6.79 | −6.79 | −6.34 | −6.33 | −6.33 |
| SIC | −6.82 | −6.80 | −6.80 | −6.36 | −6.35 | −6.35 |
| HQ | −6.81 | −6.80 | −6.80 | −6.35 | −6.34 | −6.34 |
© 2019 by the authors. Licensee MDPI, Basel, Switzerland. This article is an open access article distributed under the terms and conditions of the Creative Commons Attribution (CC BY) license (http://creativecommons.org/licenses/by/4.0/).
Share and Cite
Gbenro, N.; Moussa, R.K. Asymmetric Mean Reversion in Low Liquid Markets: Evidence from BRVM. J. Risk Financial Manag. 2019, 12, 38. https://doi.org/10.3390/jrfm12010038
Gbenro N, Moussa RK. Asymmetric Mean Reversion in Low Liquid Markets: Evidence from BRVM. Journal of Risk and Financial Management. 2019; 12(1):38. https://doi.org/10.3390/jrfm12010038
Chicago/Turabian StyleGbenro, Nathaniel, and Richard Kouamé Moussa. 2019. "Asymmetric Mean Reversion in Low Liquid Markets: Evidence from BRVM" Journal of Risk and Financial Management 12, no. 1: 38. https://doi.org/10.3390/jrfm12010038
APA StyleGbenro, N., & Moussa, R. K. (2019). Asymmetric Mean Reversion in Low Liquid Markets: Evidence from BRVM. Journal of Risk and Financial Management, 12(1), 38. https://doi.org/10.3390/jrfm12010038