
Ship Energy Efficiency and Maritime Sector Initiatives to Reduce Carbon Emissions


Abstract
1. Introduction
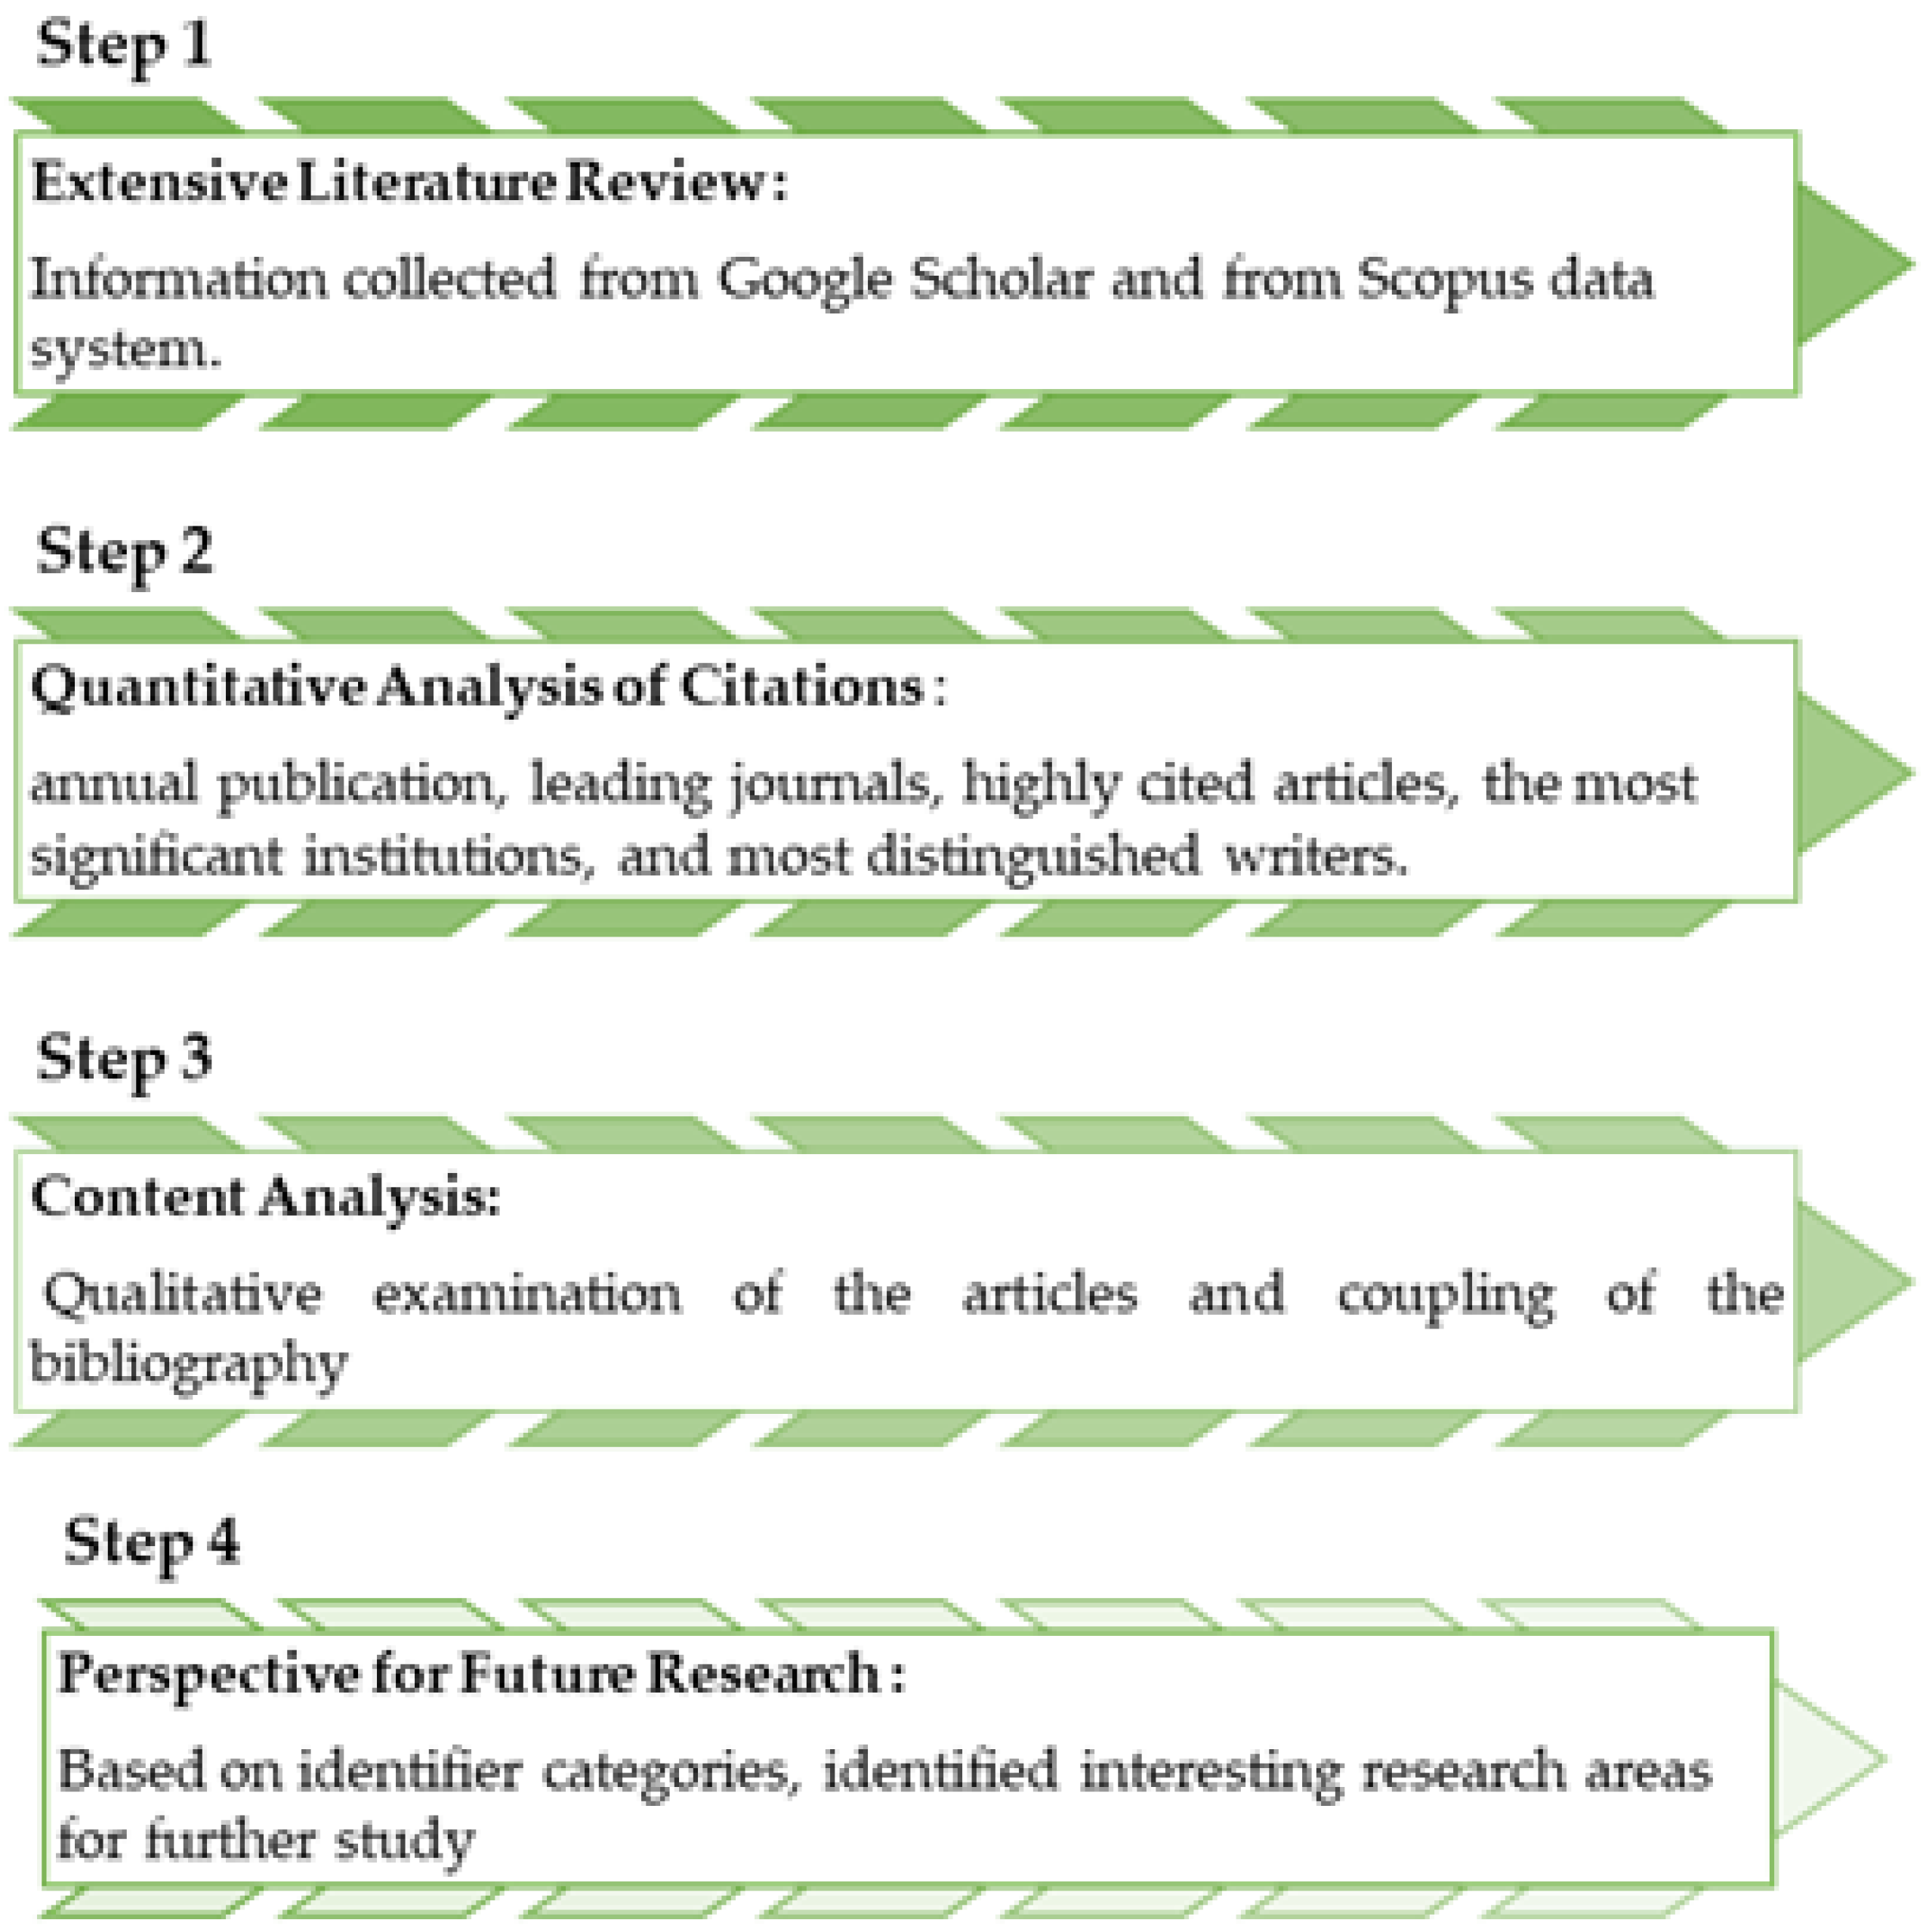
2. Research Methodology
- Step 1-
- Extensive Literature Review: Data compiled using a structured literature review; the final product included 329 studies taken from Google Scholar and the Scopus database system.
- Step 2-
- Quantitative Analysis of Citations: The authors used the open source bibliometrix package in the R software to conduct a citation-based analysis based on the reference list data of the 329 studies to establish the annual publications, standings of journals, institutions, and writers by amount of literature, current rank of articles, and ranking of countries.
- Step 3-
- Content Analysis: The VOSviewer program was used to assess the 329 research papers that were previously extracted in Step 1. An interactive tool called VOSviewer is used to create and display citations maps. However, by integrating the overall citation and total link strength, two bibliographic features in the VOSviewer, the 37 most pertinent publications were found. The structured literature review matrix approach was used to conduct content methods that rely on these 37 papers that were the most pertinent. The review matrix is a spreadsheet or database with rows and columns used to extract collected data about each published paper, book report, as well as other materials involved in the study of the literature. The matrix technique is described as a structure and a methodology for examining the literature.
- Step 4-
- Perspective for Future Research: The possible research areas for upcoming investigations were determined based on the synthesis of publications in each category.
3. Current Legislation and Policies to Meet the IMO’s 2050 Emission Targets
- By 2030, diminish carbon level by 40% relative to 2008.
- By 2050, we choose to reduce carbon emissions by 70%.
- Diminish GHG emissions from worldwide shipping as a minimum 50% by 2050 compared to 2008.
- To reach zero GHG emissions by 2100.
3.1. Energy Efficiency Design Index (EEDI)
3.2. Energy Efficiency Existing Ship Index (EEXI)
3.3. Energy Efficiency Operational Index (EEOI)
3.4. Ship Energy Efficiency Management Plan (SEEMP)
3.5. Carbon Intensity Index (CII)
3.6. Short, Medium, and Long-Term Actions
3.6.1. Short-Period Movements: 2018–2023
- Technical: In the case of existing ships, EEXI is a system that takes EEDI and applies it to current ships.
- Operational: Introduction of a mandatory CII with a ranking method ranging from A to E. The rule applies to all current vessels that meet a particular size requirement.
3.6.2. Medium-Period Movements and Long-Period Movements
3.7. Market-Based Measures (MBM)
- Financial motivations for the marine division to diminish its fuel use by contributing to more fuel-efficient ships, technology, and ship operations.
- Expanding emissions related to the maritime industry are being offset in other sectors.
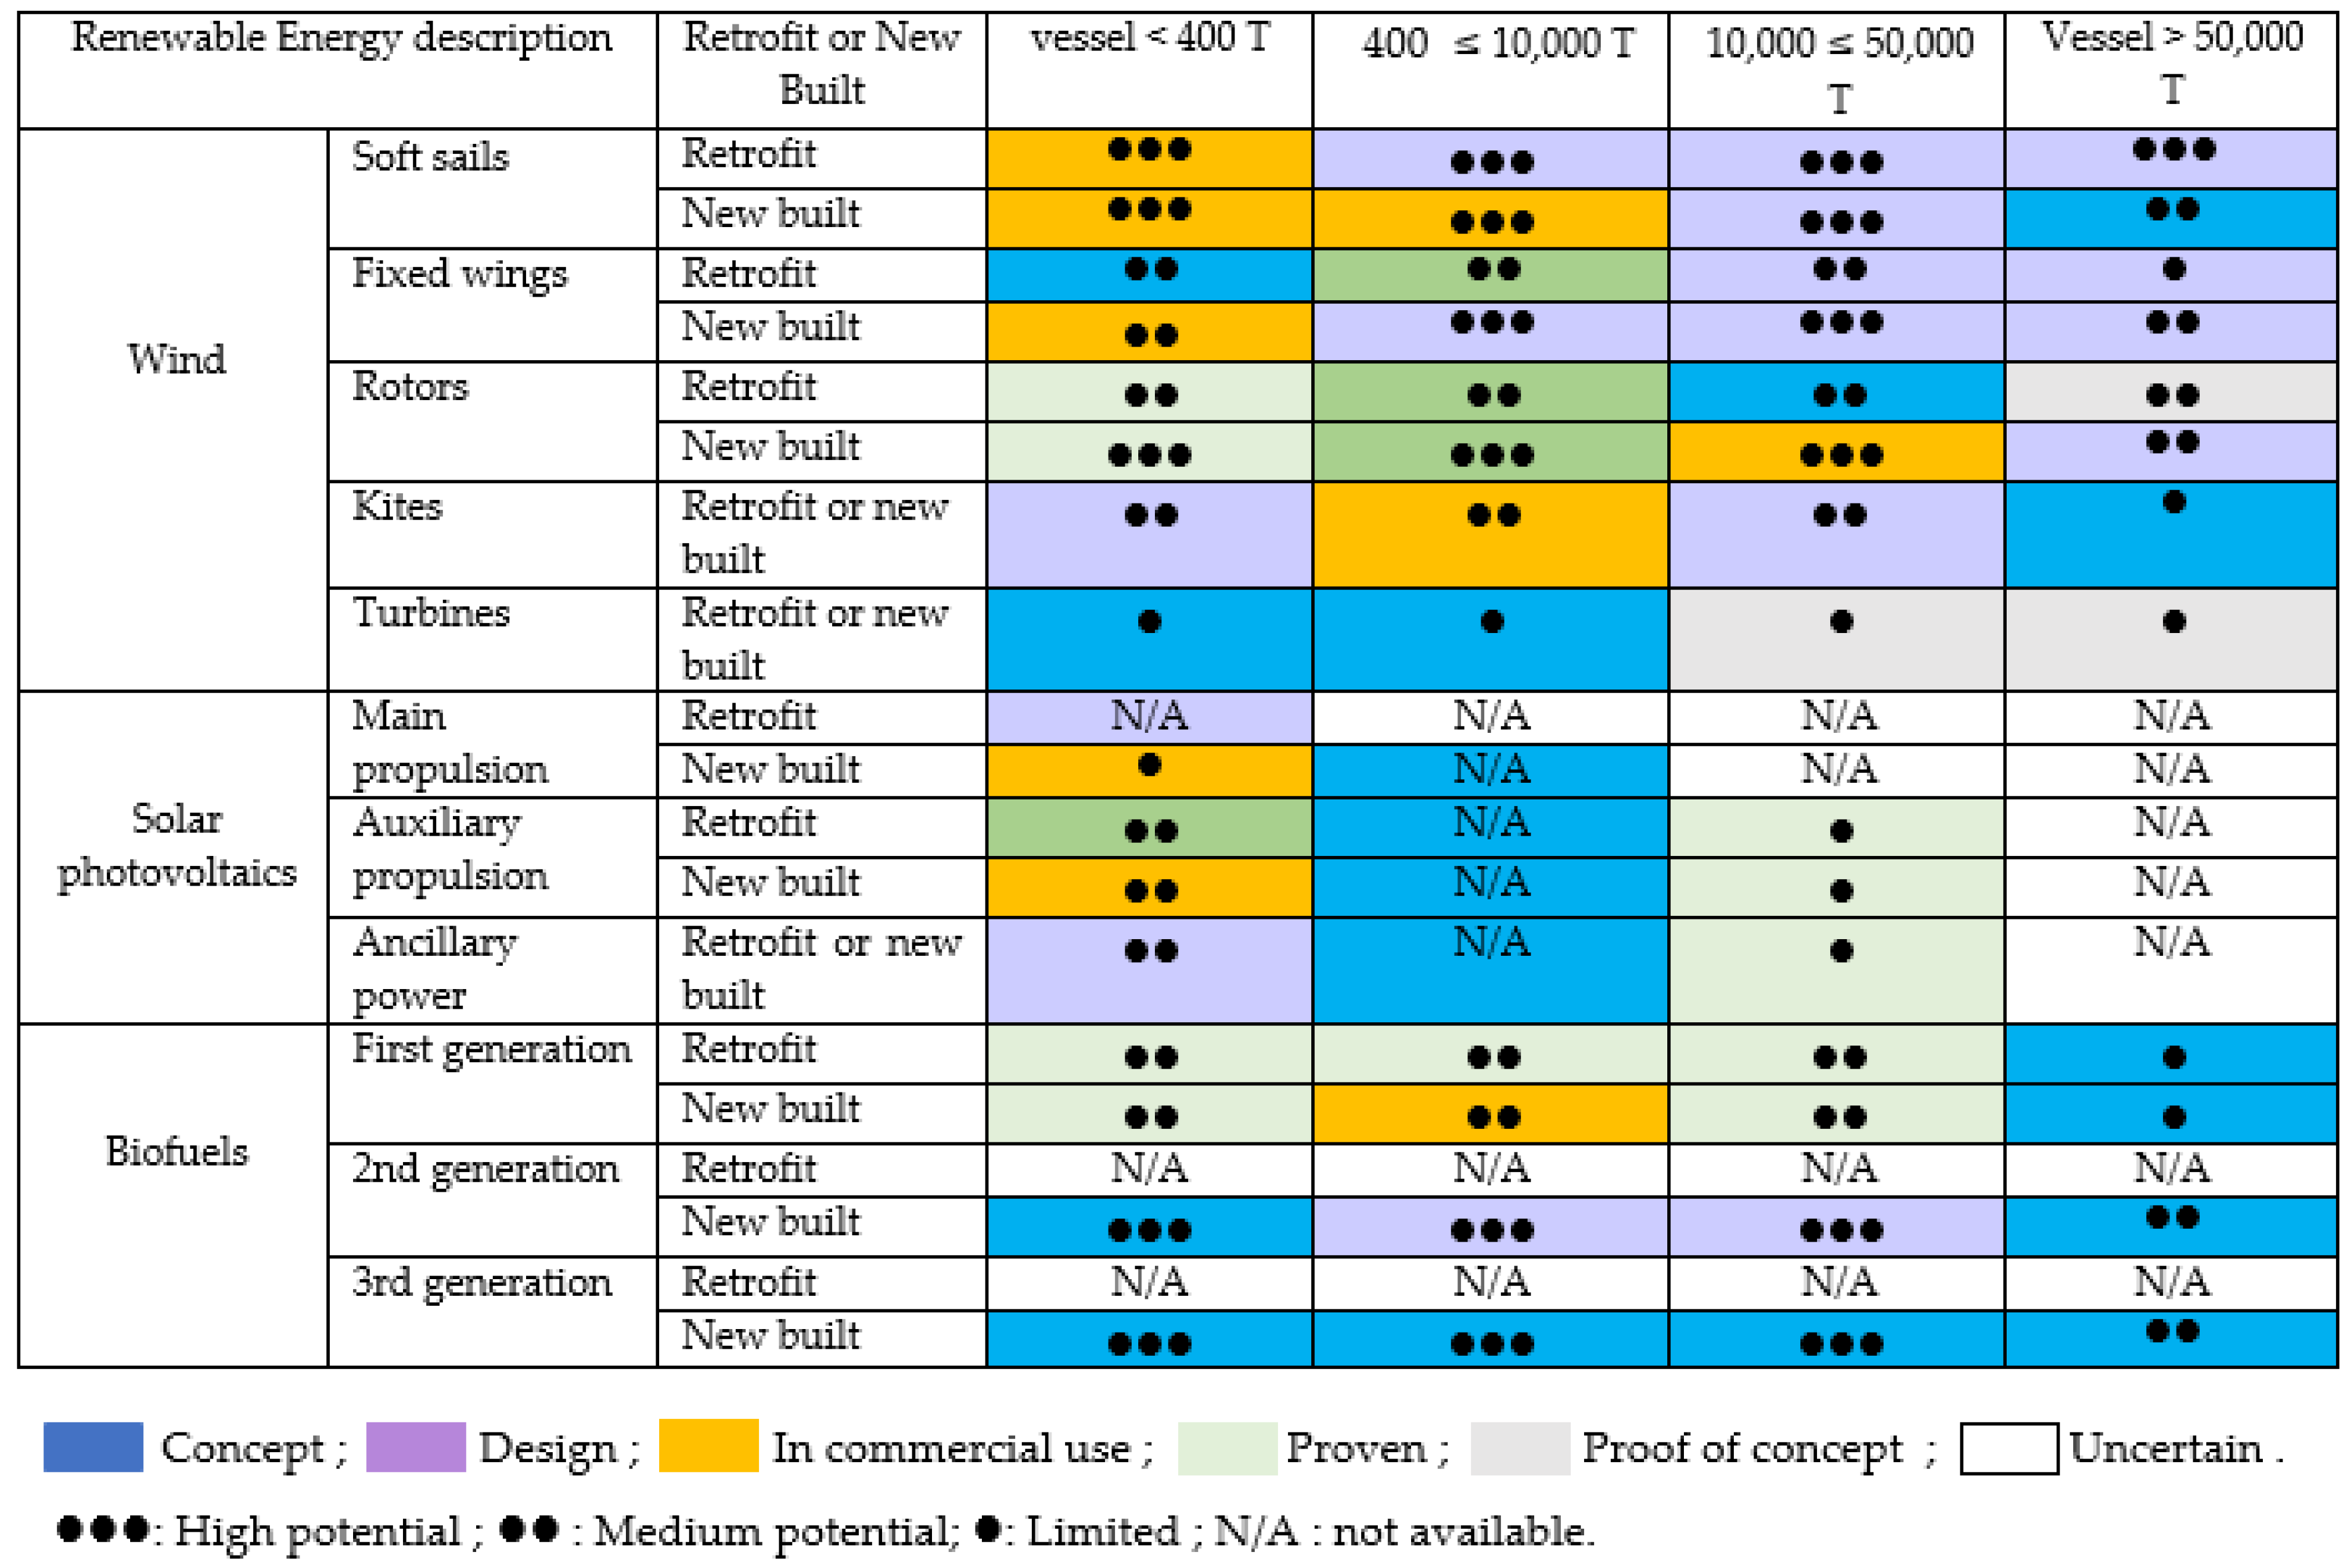
4. Degree of Ambition and Renewable Energy in Shipping
- The ship’s carbon intensity will decrease as more Energy Efficiency Design Index (EEDI) phases are implemented for new ships;
- To examine the energy efficiency design standards for vessels with the intention of strengthening them, with the required percentage change for every phase for each ship class;
- Reduction in the carbon intensity of international shipping;
- To cut emissions of carbon dioxide per transport job by at minimum 40% by 2030 for all shipping, with a goal of 70% by 2050;
- For emissions of greenhouse gases from global shipping to cease and drop.
- Weakness of marketing and commercial feasibility of such technologies.
- The low motivation for clean energy deployment is due to a gap in interests between charterers and operators.
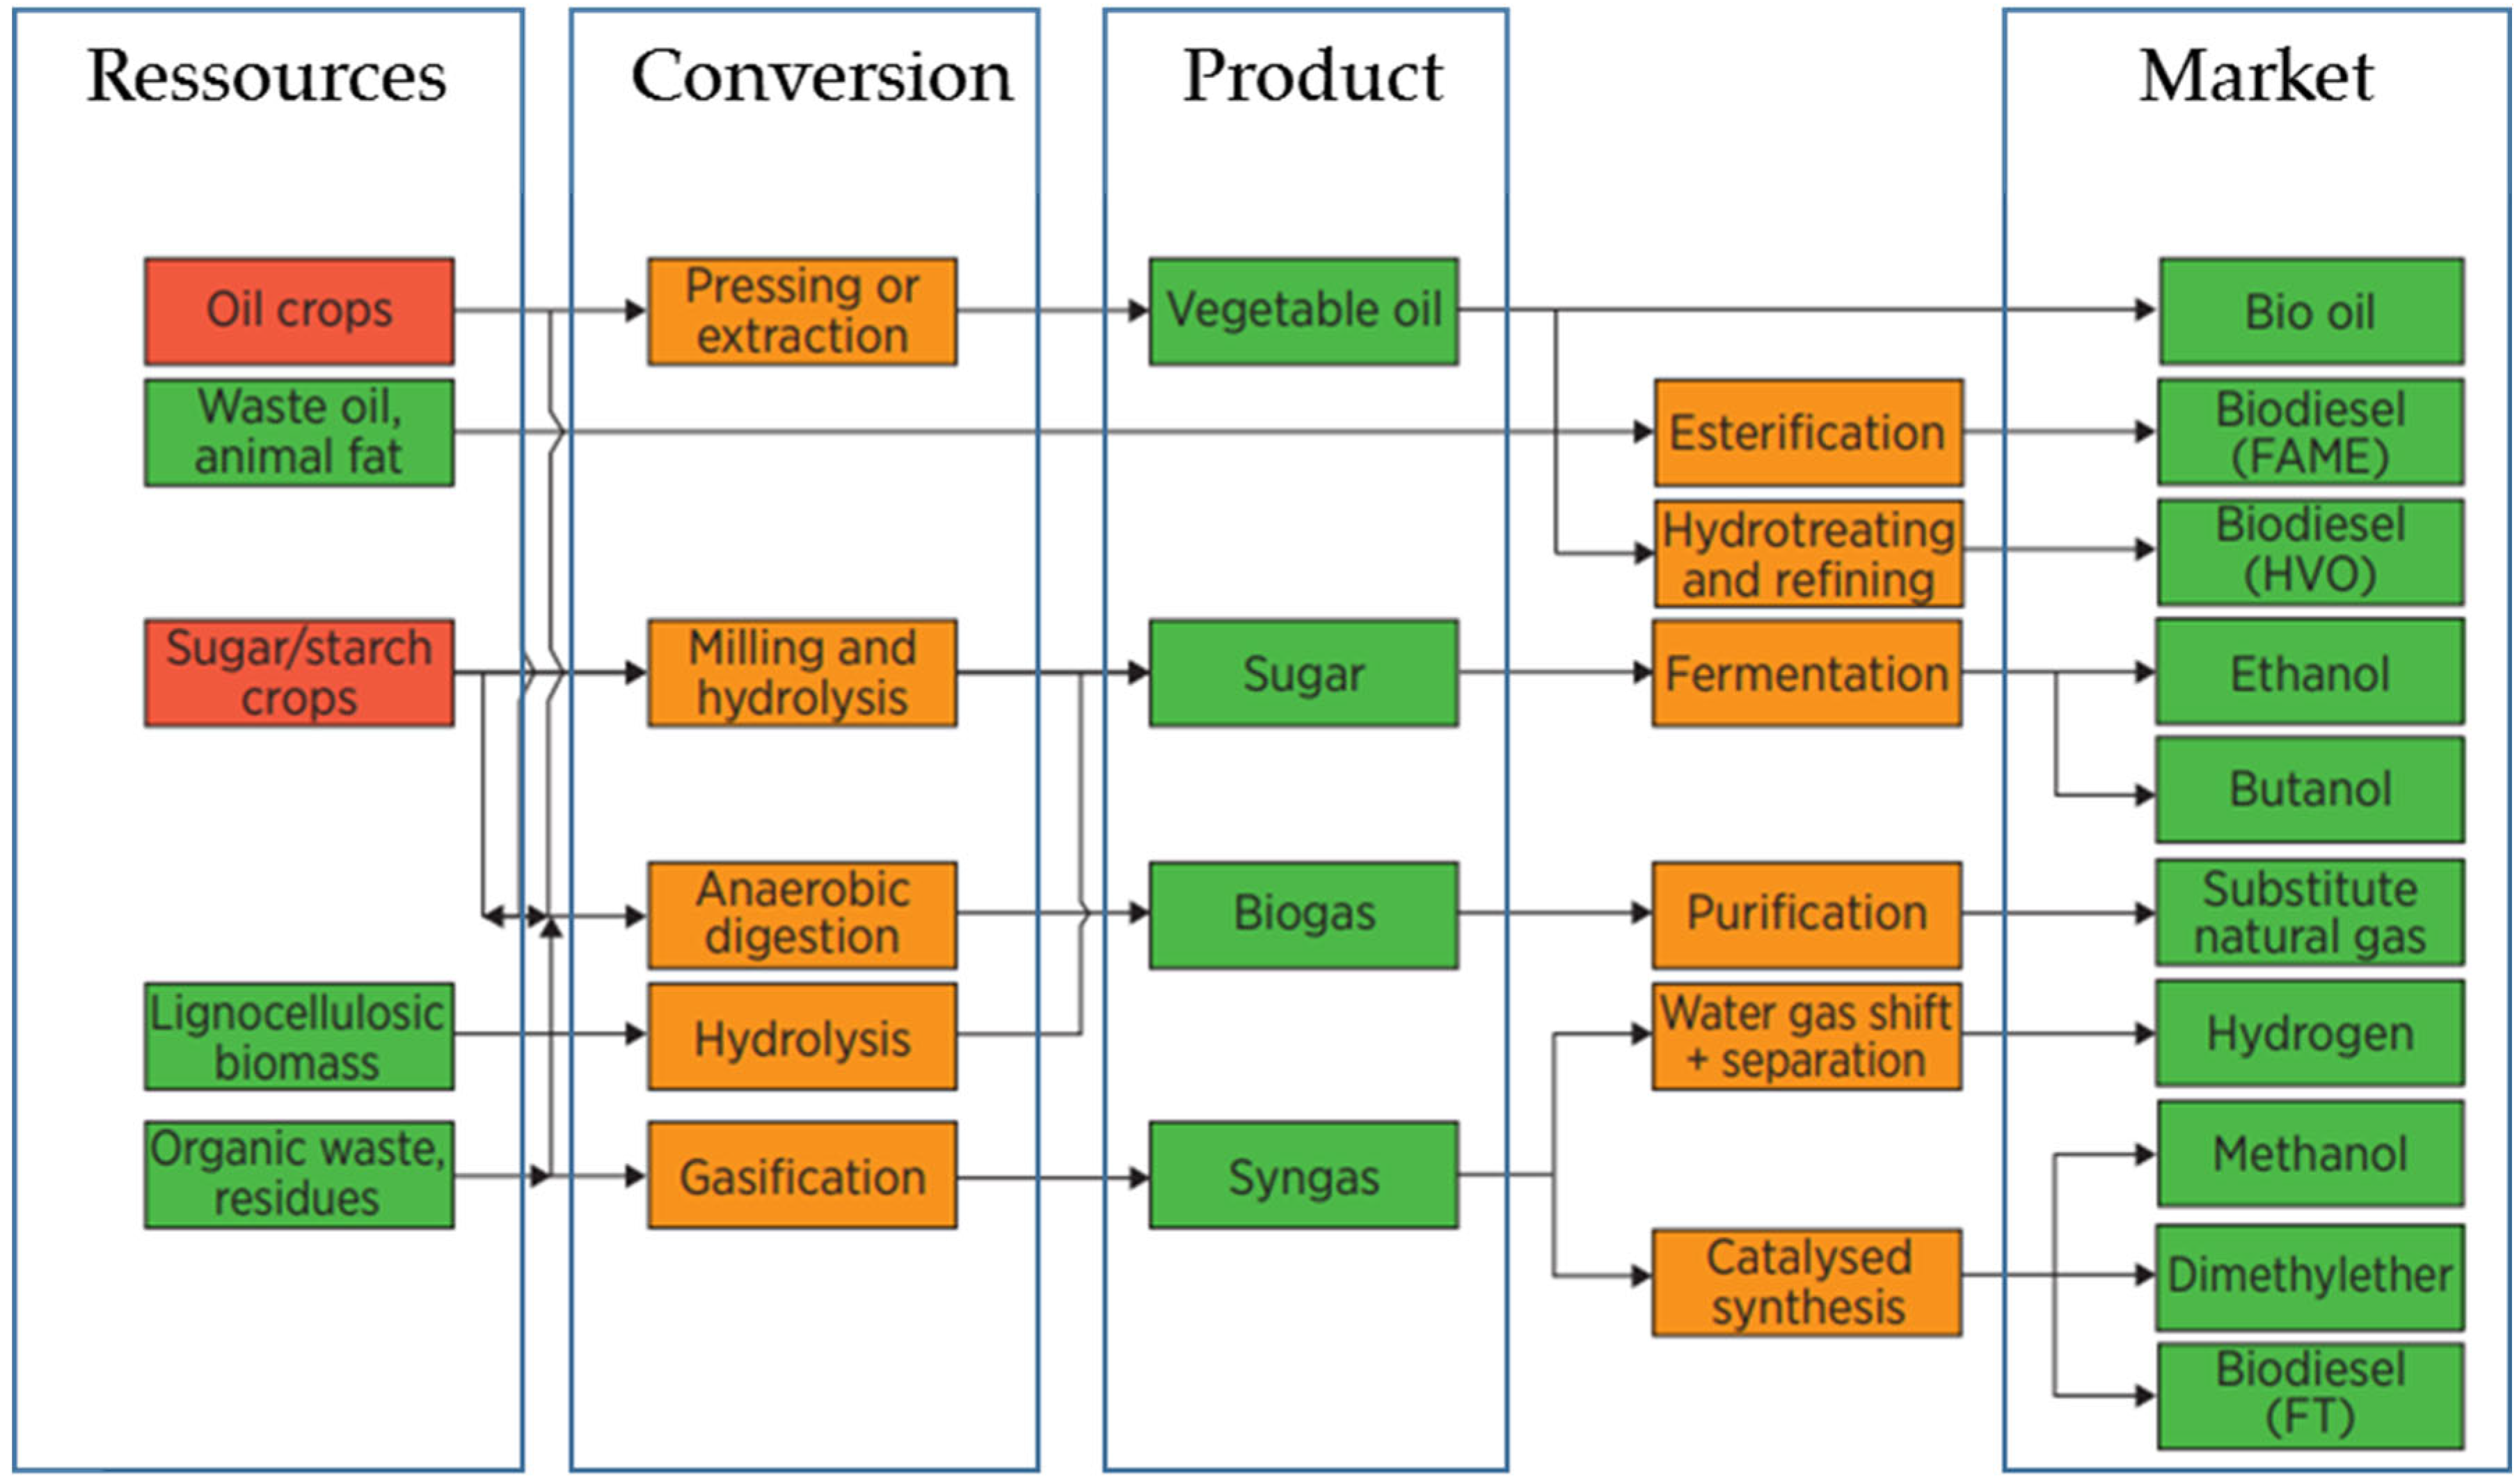
4.1. Biofuels, Natural Gas, and Hydrogen in Ship Propulsion
- First Generation: Sugar, fat, or starch directly derived from a plant serve as the biofuel’s carbon source. The crop is thought to conflict with food, either directly or indirectly.
- Second Generation: Carbon for biofuel comes from cellulose, hemicellulose, lignin, or pectin. Examples include agricultural, forestry residues, or purpose-grown non-food feedstocks.
- Third Generation: Aquatic autotrophic organisms provide the carbon for biofuel (e.g., algae). The feedstock is made from light, carbon dioxide, and nutrients, which “extend” the carbon resource accessible for biofuel synthesis.
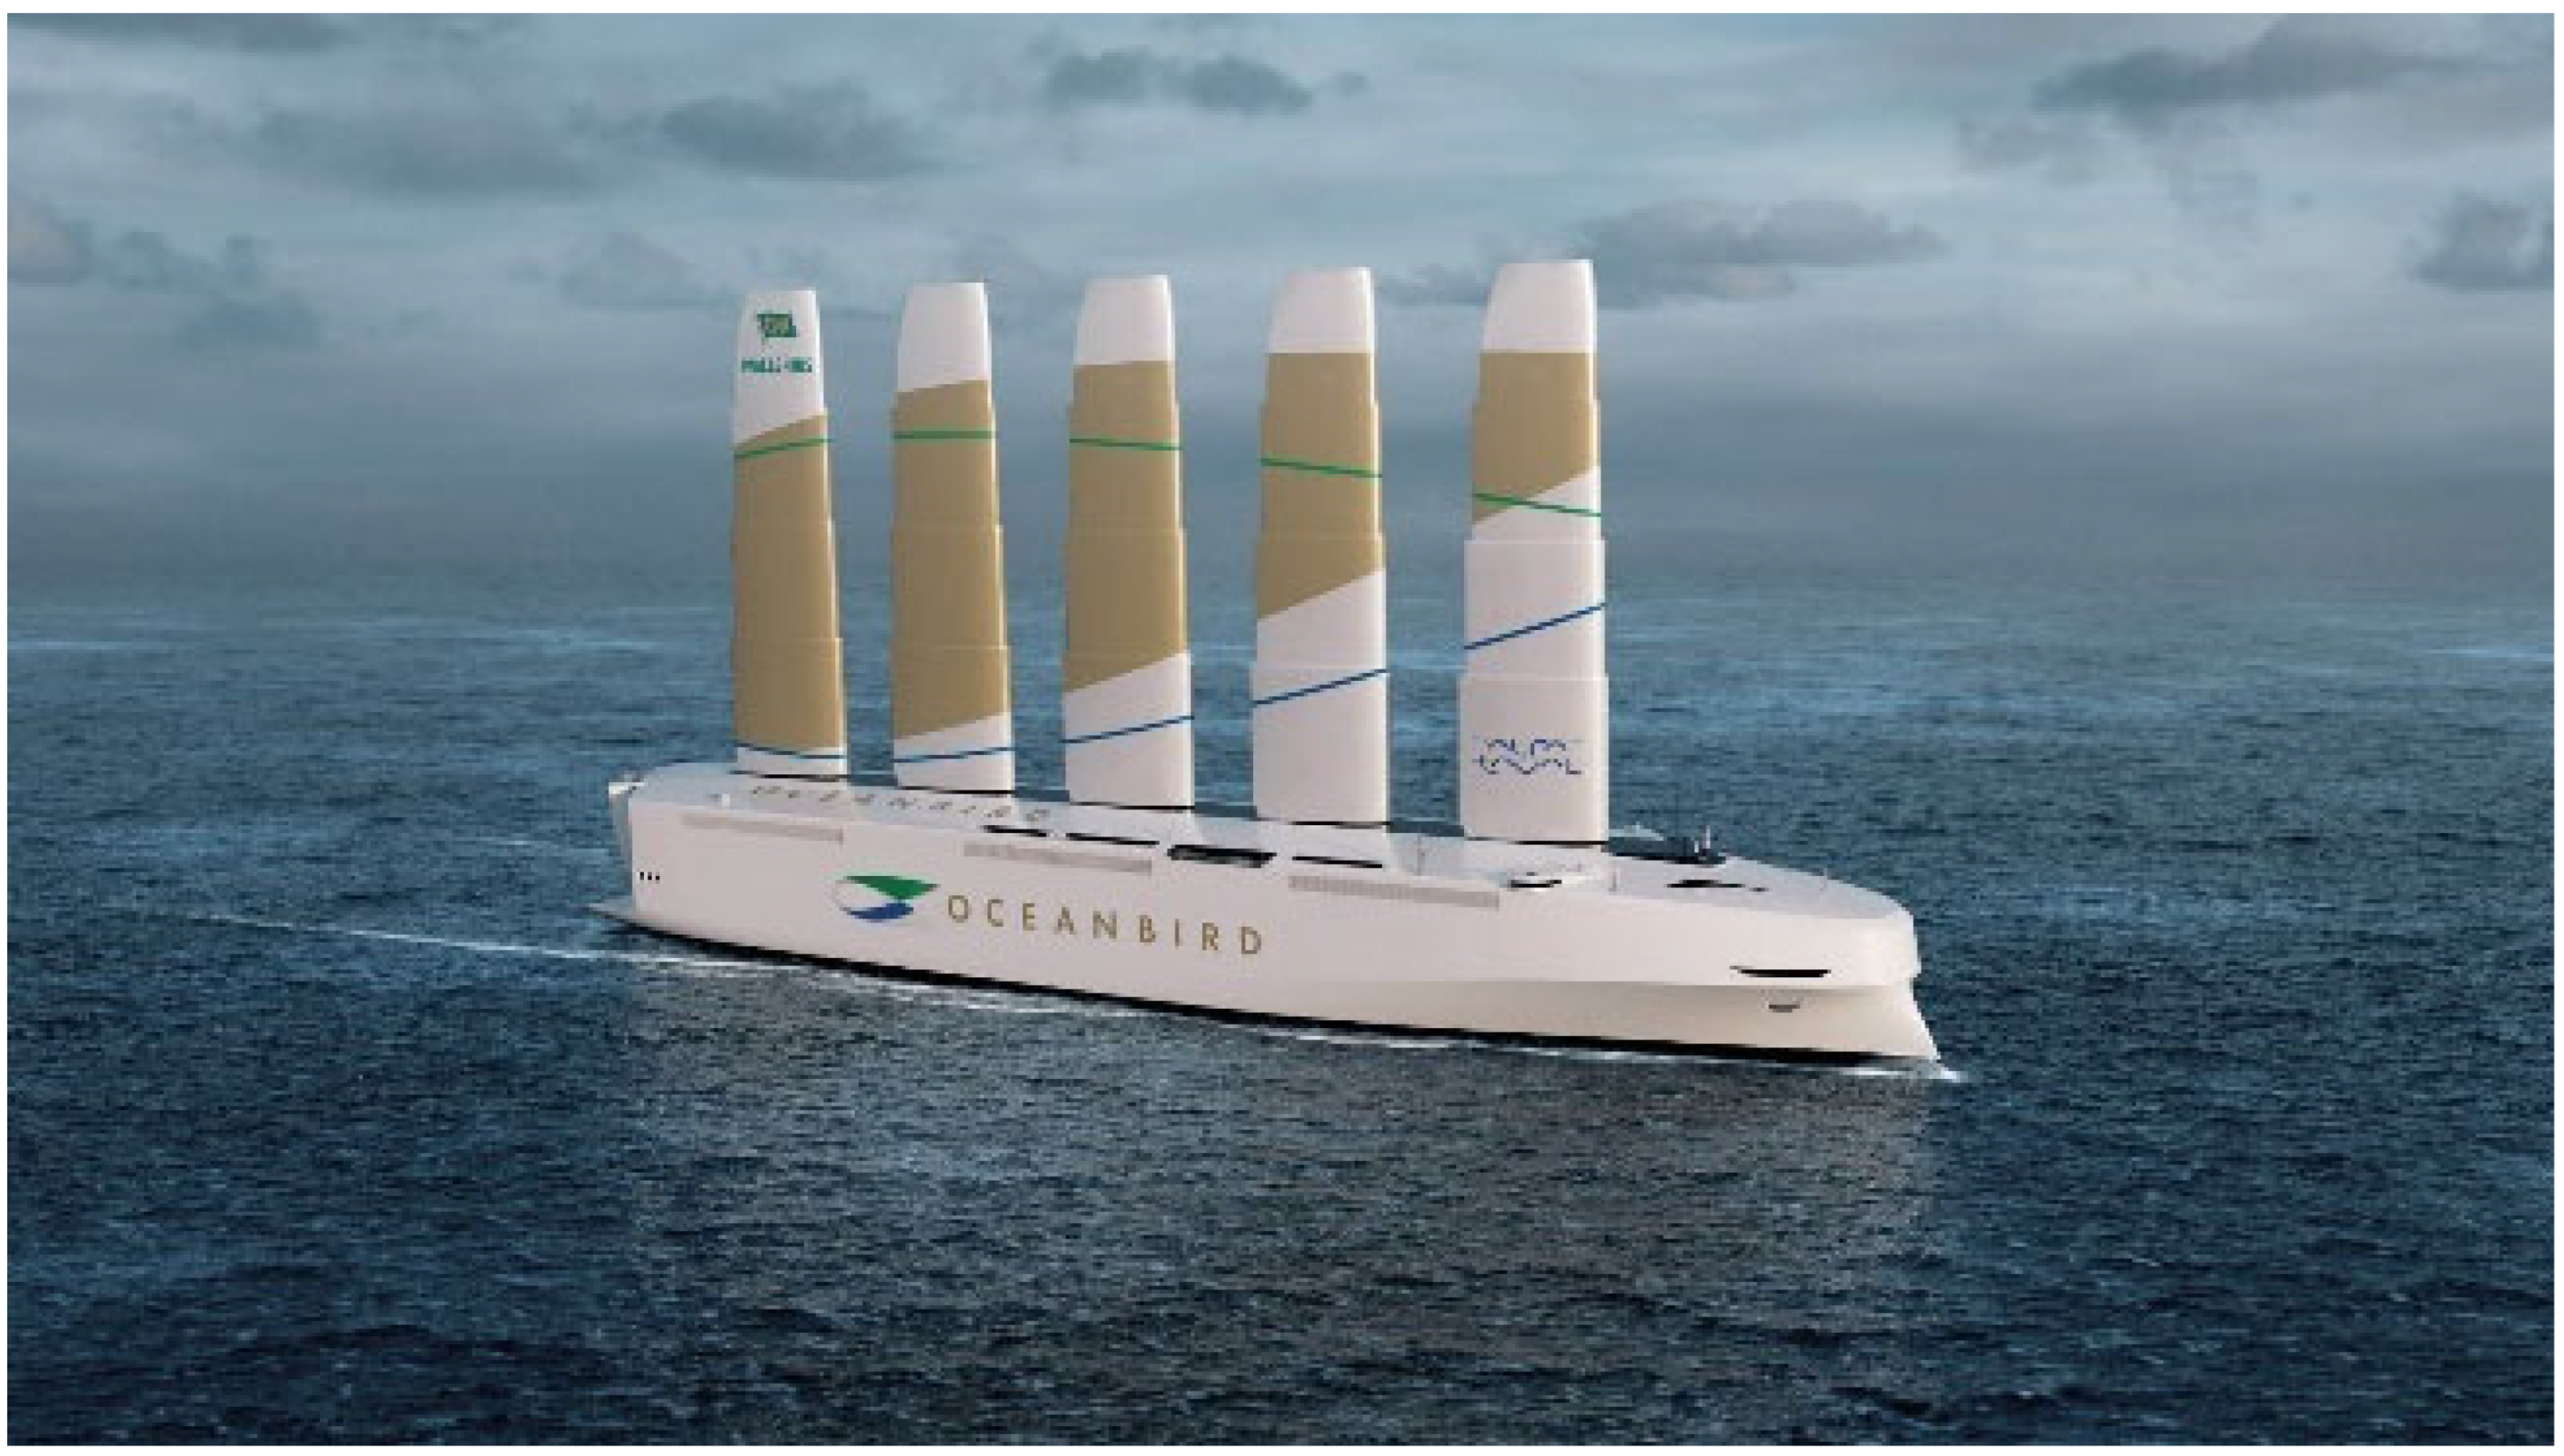
4.2. Wind Energy for Shipping Applications
4.2.1. Soft Sails, and Fixed Wings
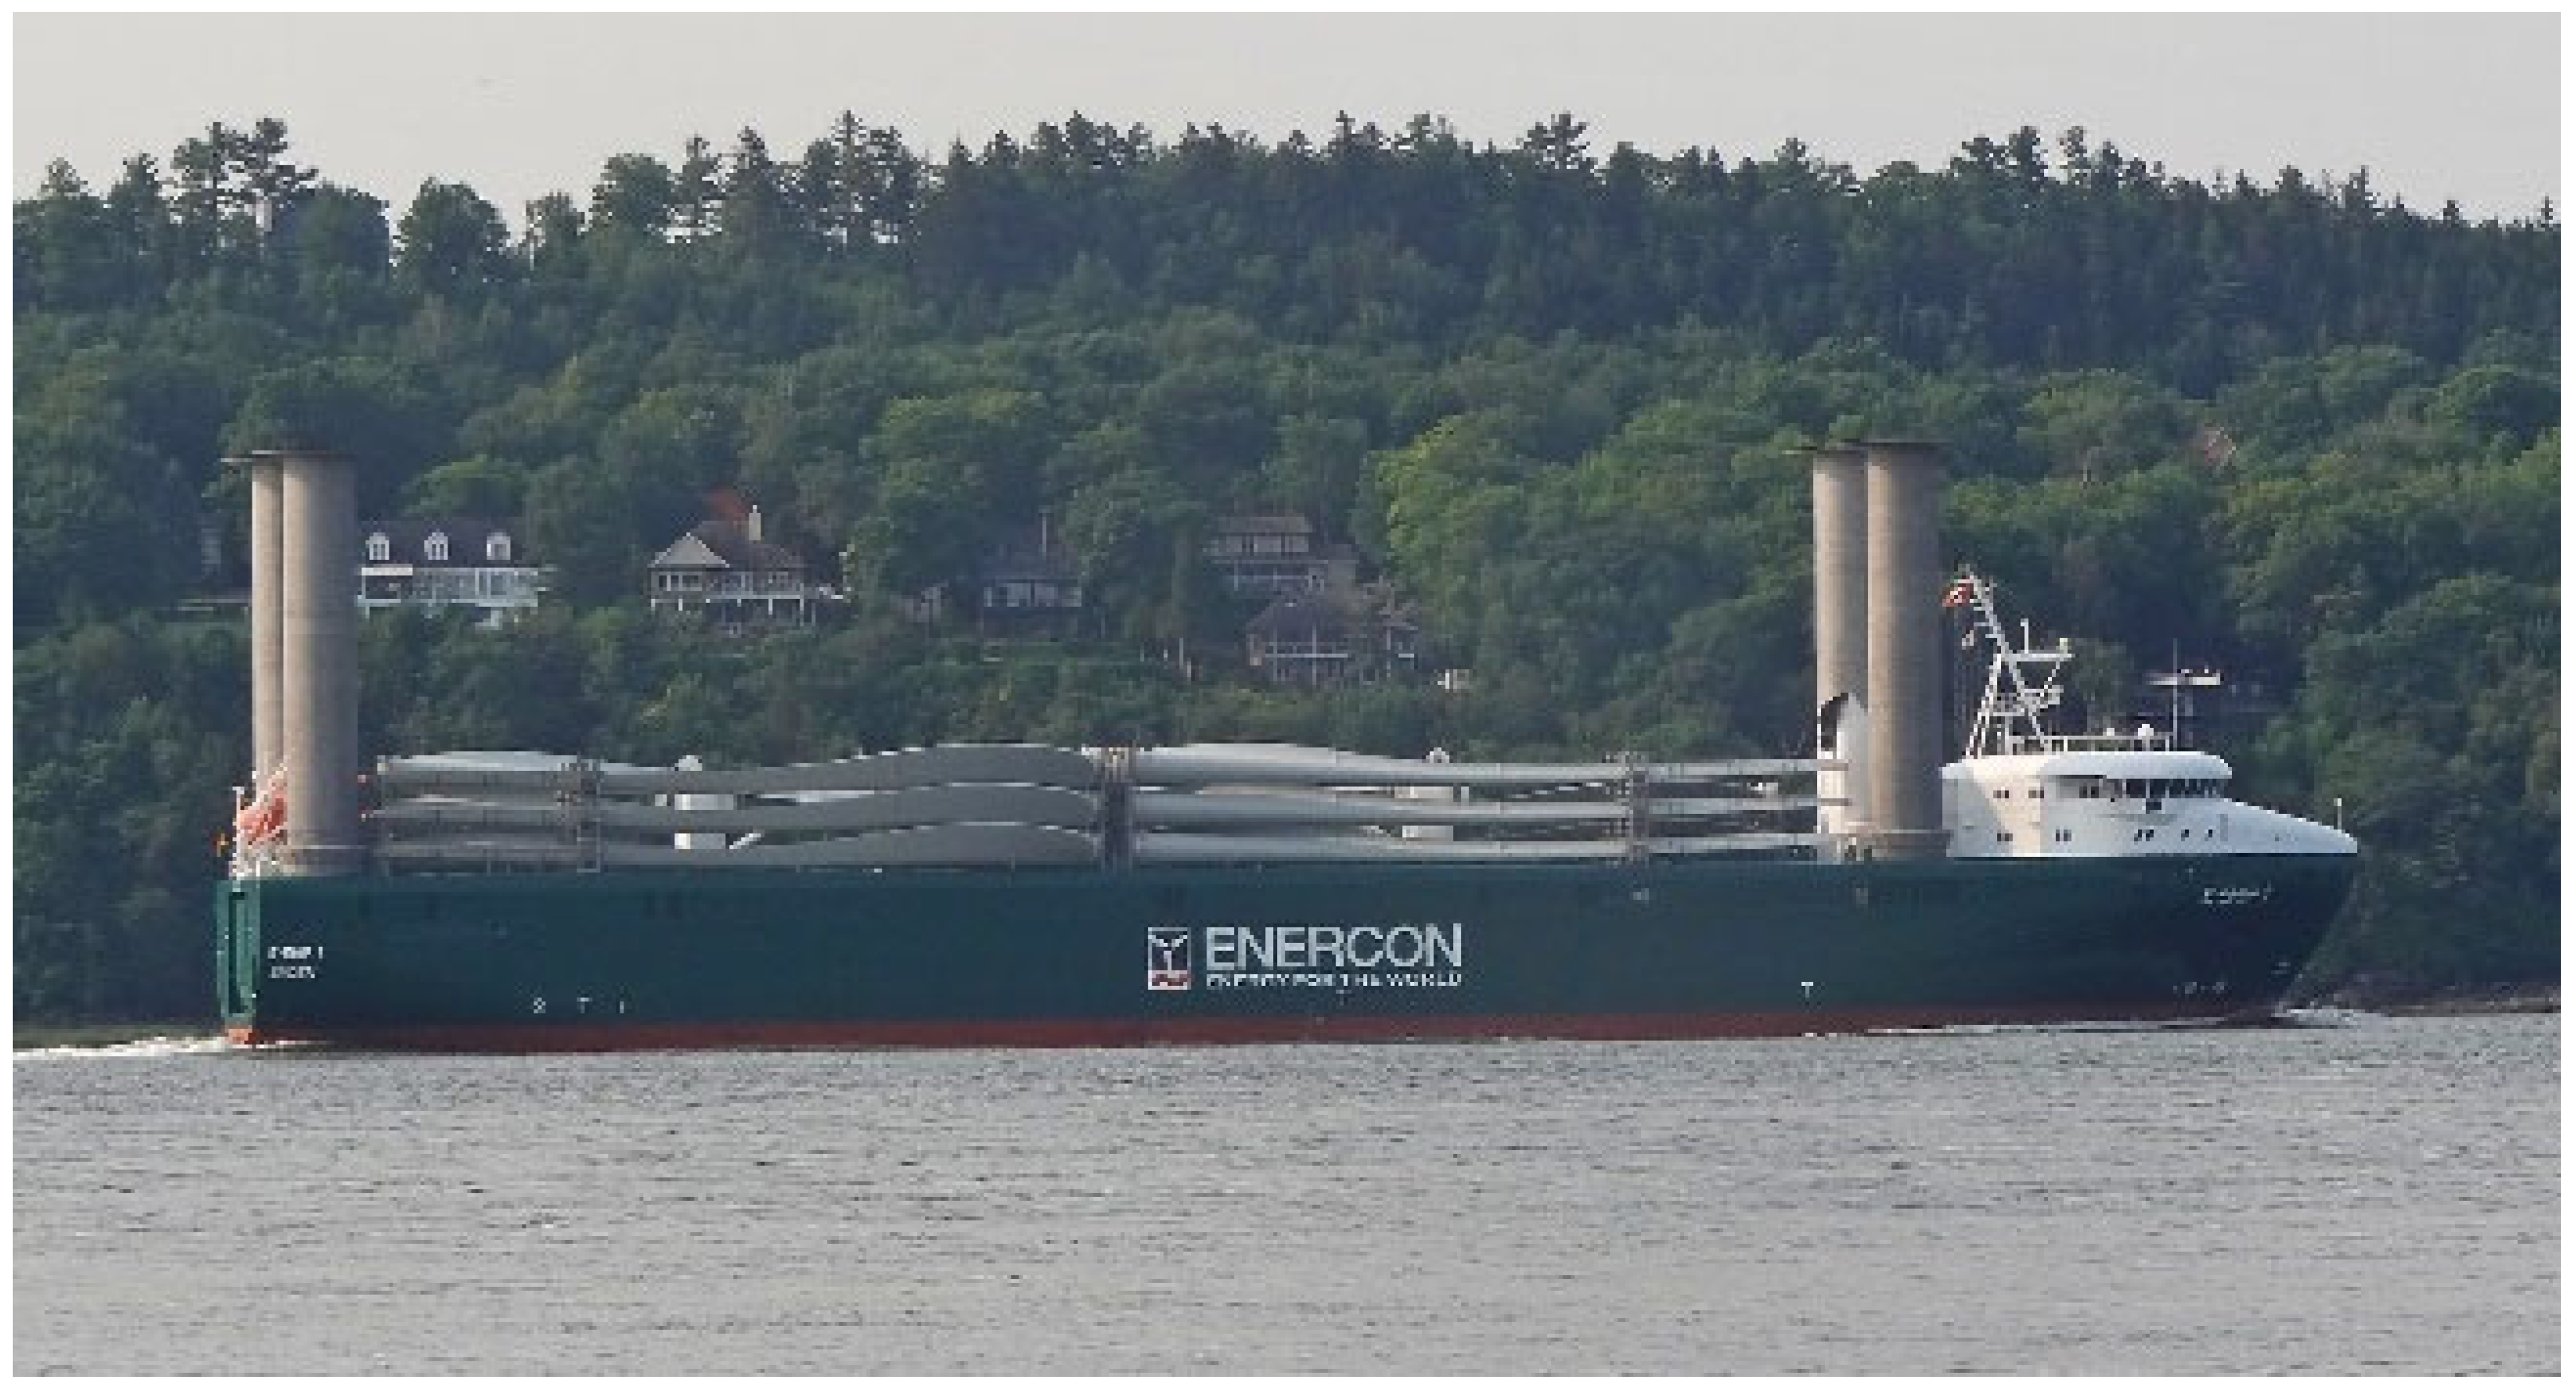
4.2.2. Rotors
4.2.3. Kite Sails
4.2.4. Solar Energy
4.2.5. Solar-Hybrid Systems in Shipping
5. Alternative Fuels
5.1. Hydrogen as Marine Fuel
5.2. Ammonia as Marine Fuel
5.3. Electricity Stored in Batteries
5.4. Risk to Humans and Commerical Value
6. Technological Maturity
6.1. The Role of Internal Combustion Engines (ICEs) in Decarbonization
6.2. Alternative Fuels in ICEs
6.2.1. Ammonia in ICEs
- Compared to other fuels, it has weak ignition and a slow flame propagation speed.
- Toxic and corrosive.
- Increased NOx emissions unless the combustion process is optimized, or after-treatment is used.
- It will be necessary to design regulations and policies for its usage as a marine fuel.
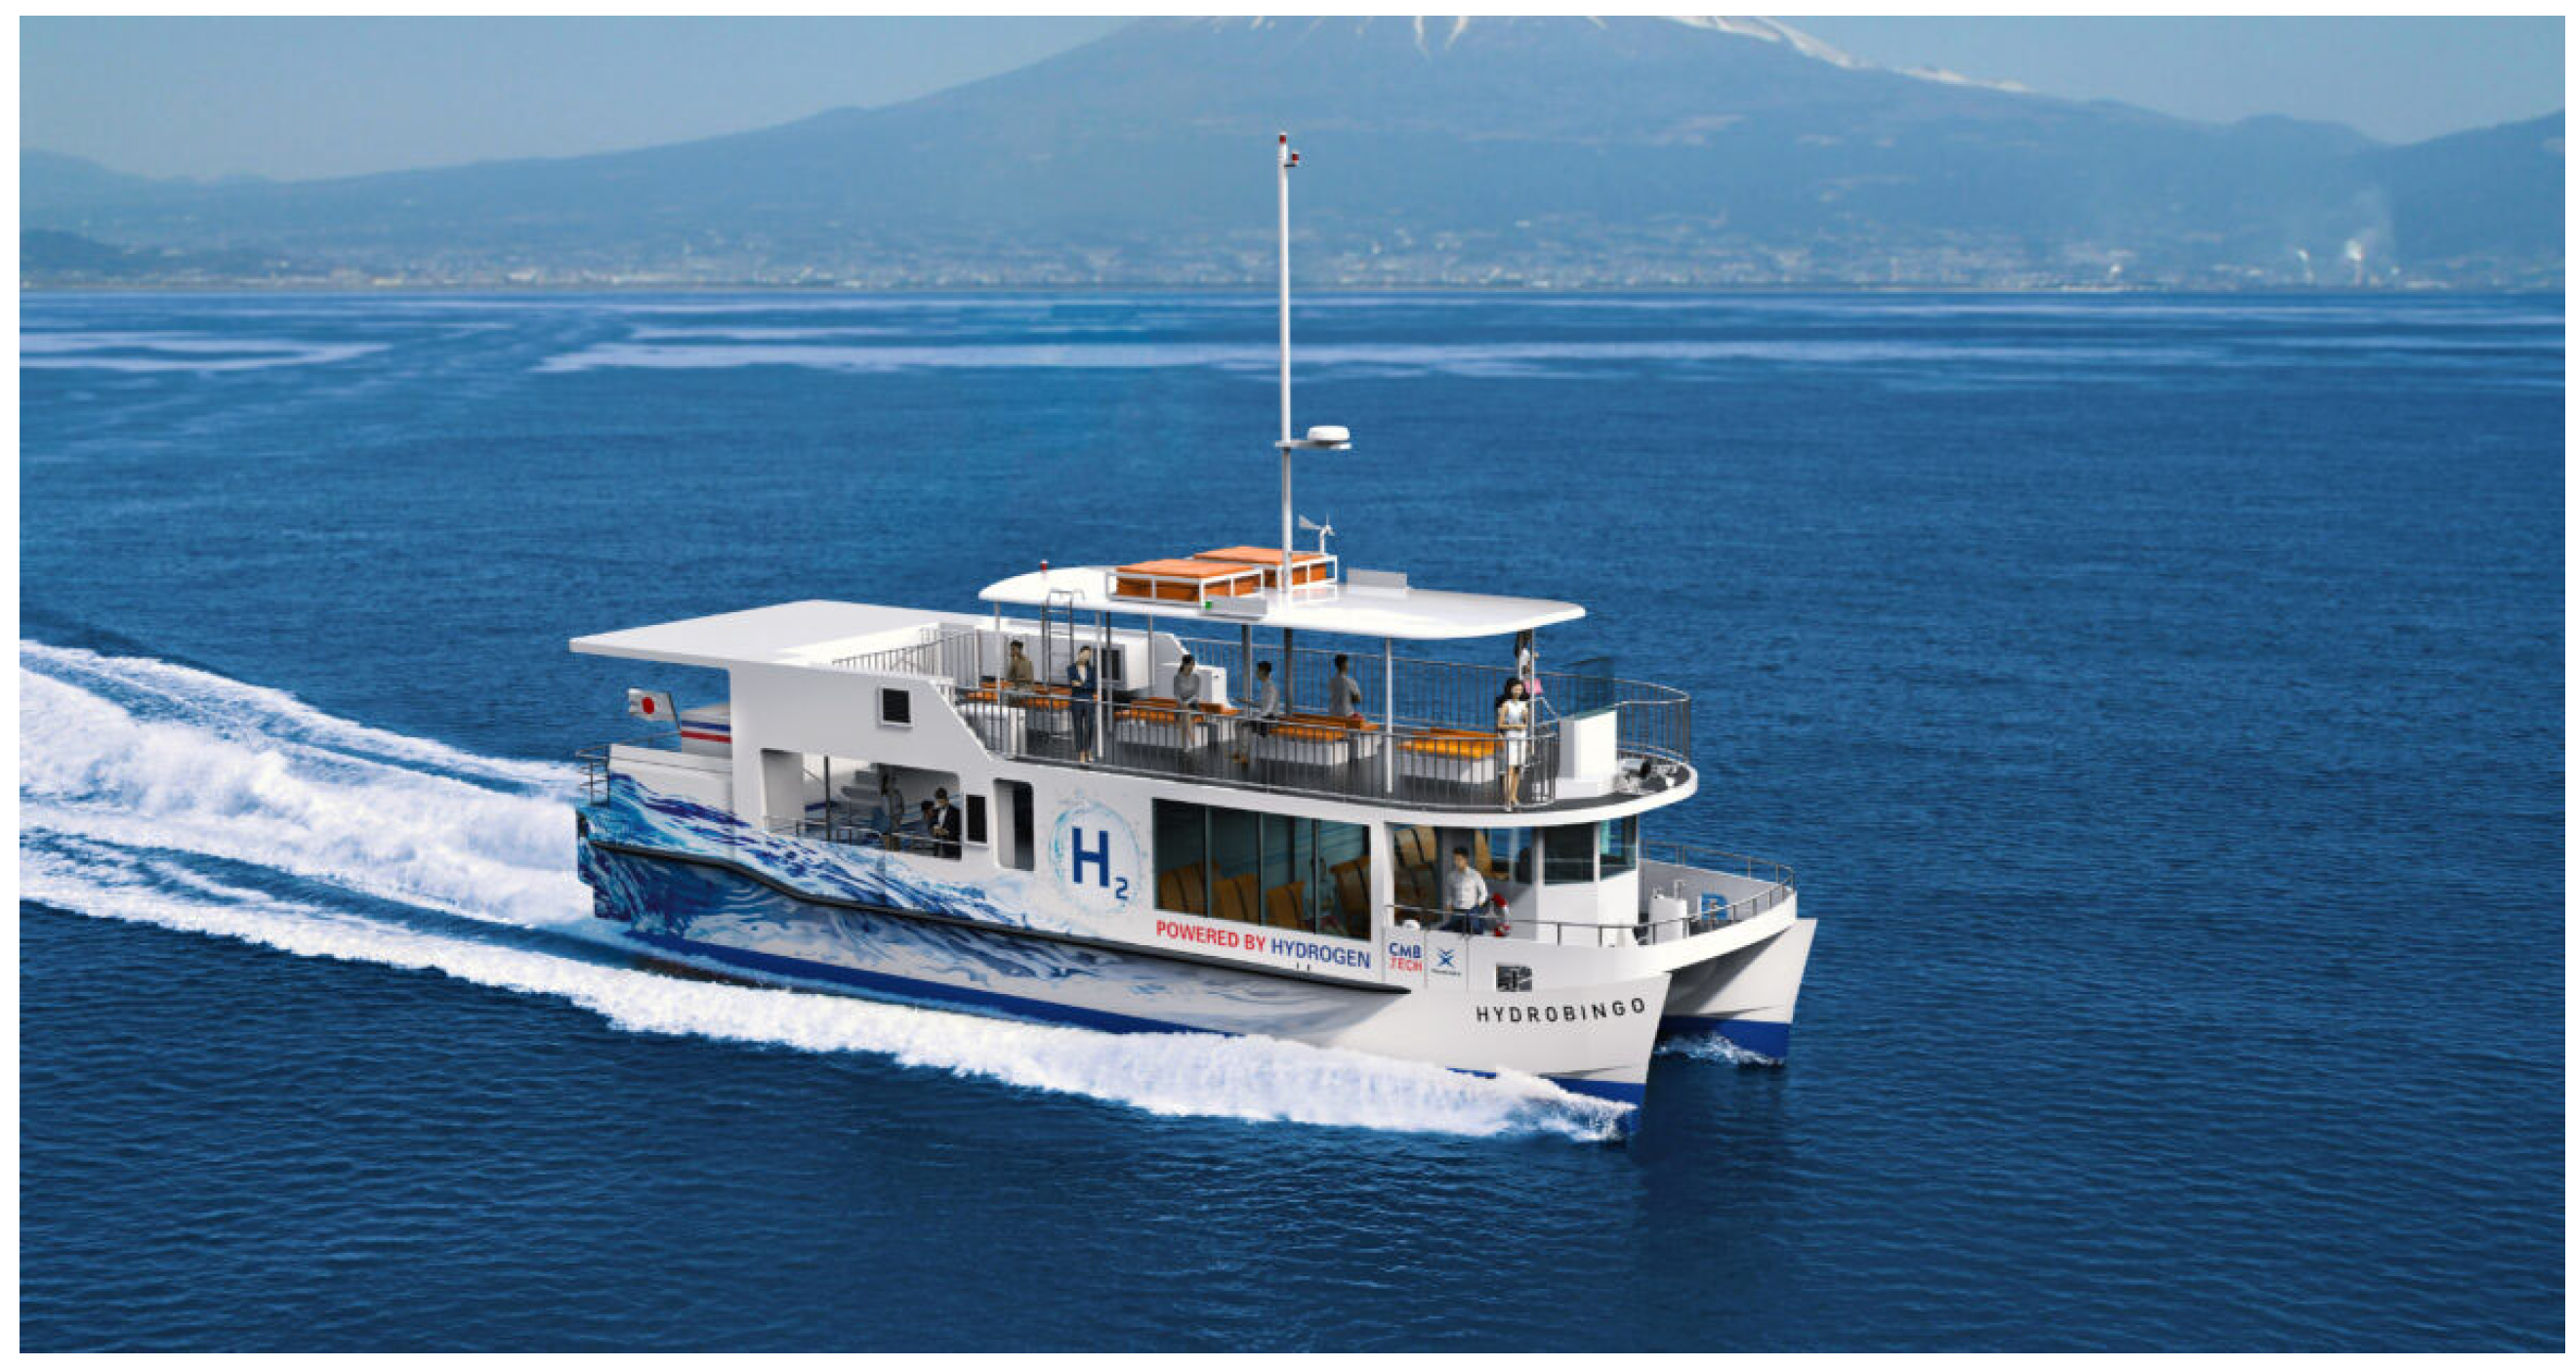
6.2.2. Hydrogen in ICEs
6.2.3. Methanol in ICEs
6.2.4. LNG in ICEs
6.3. Fuel Cell Systems for Maritime Applications
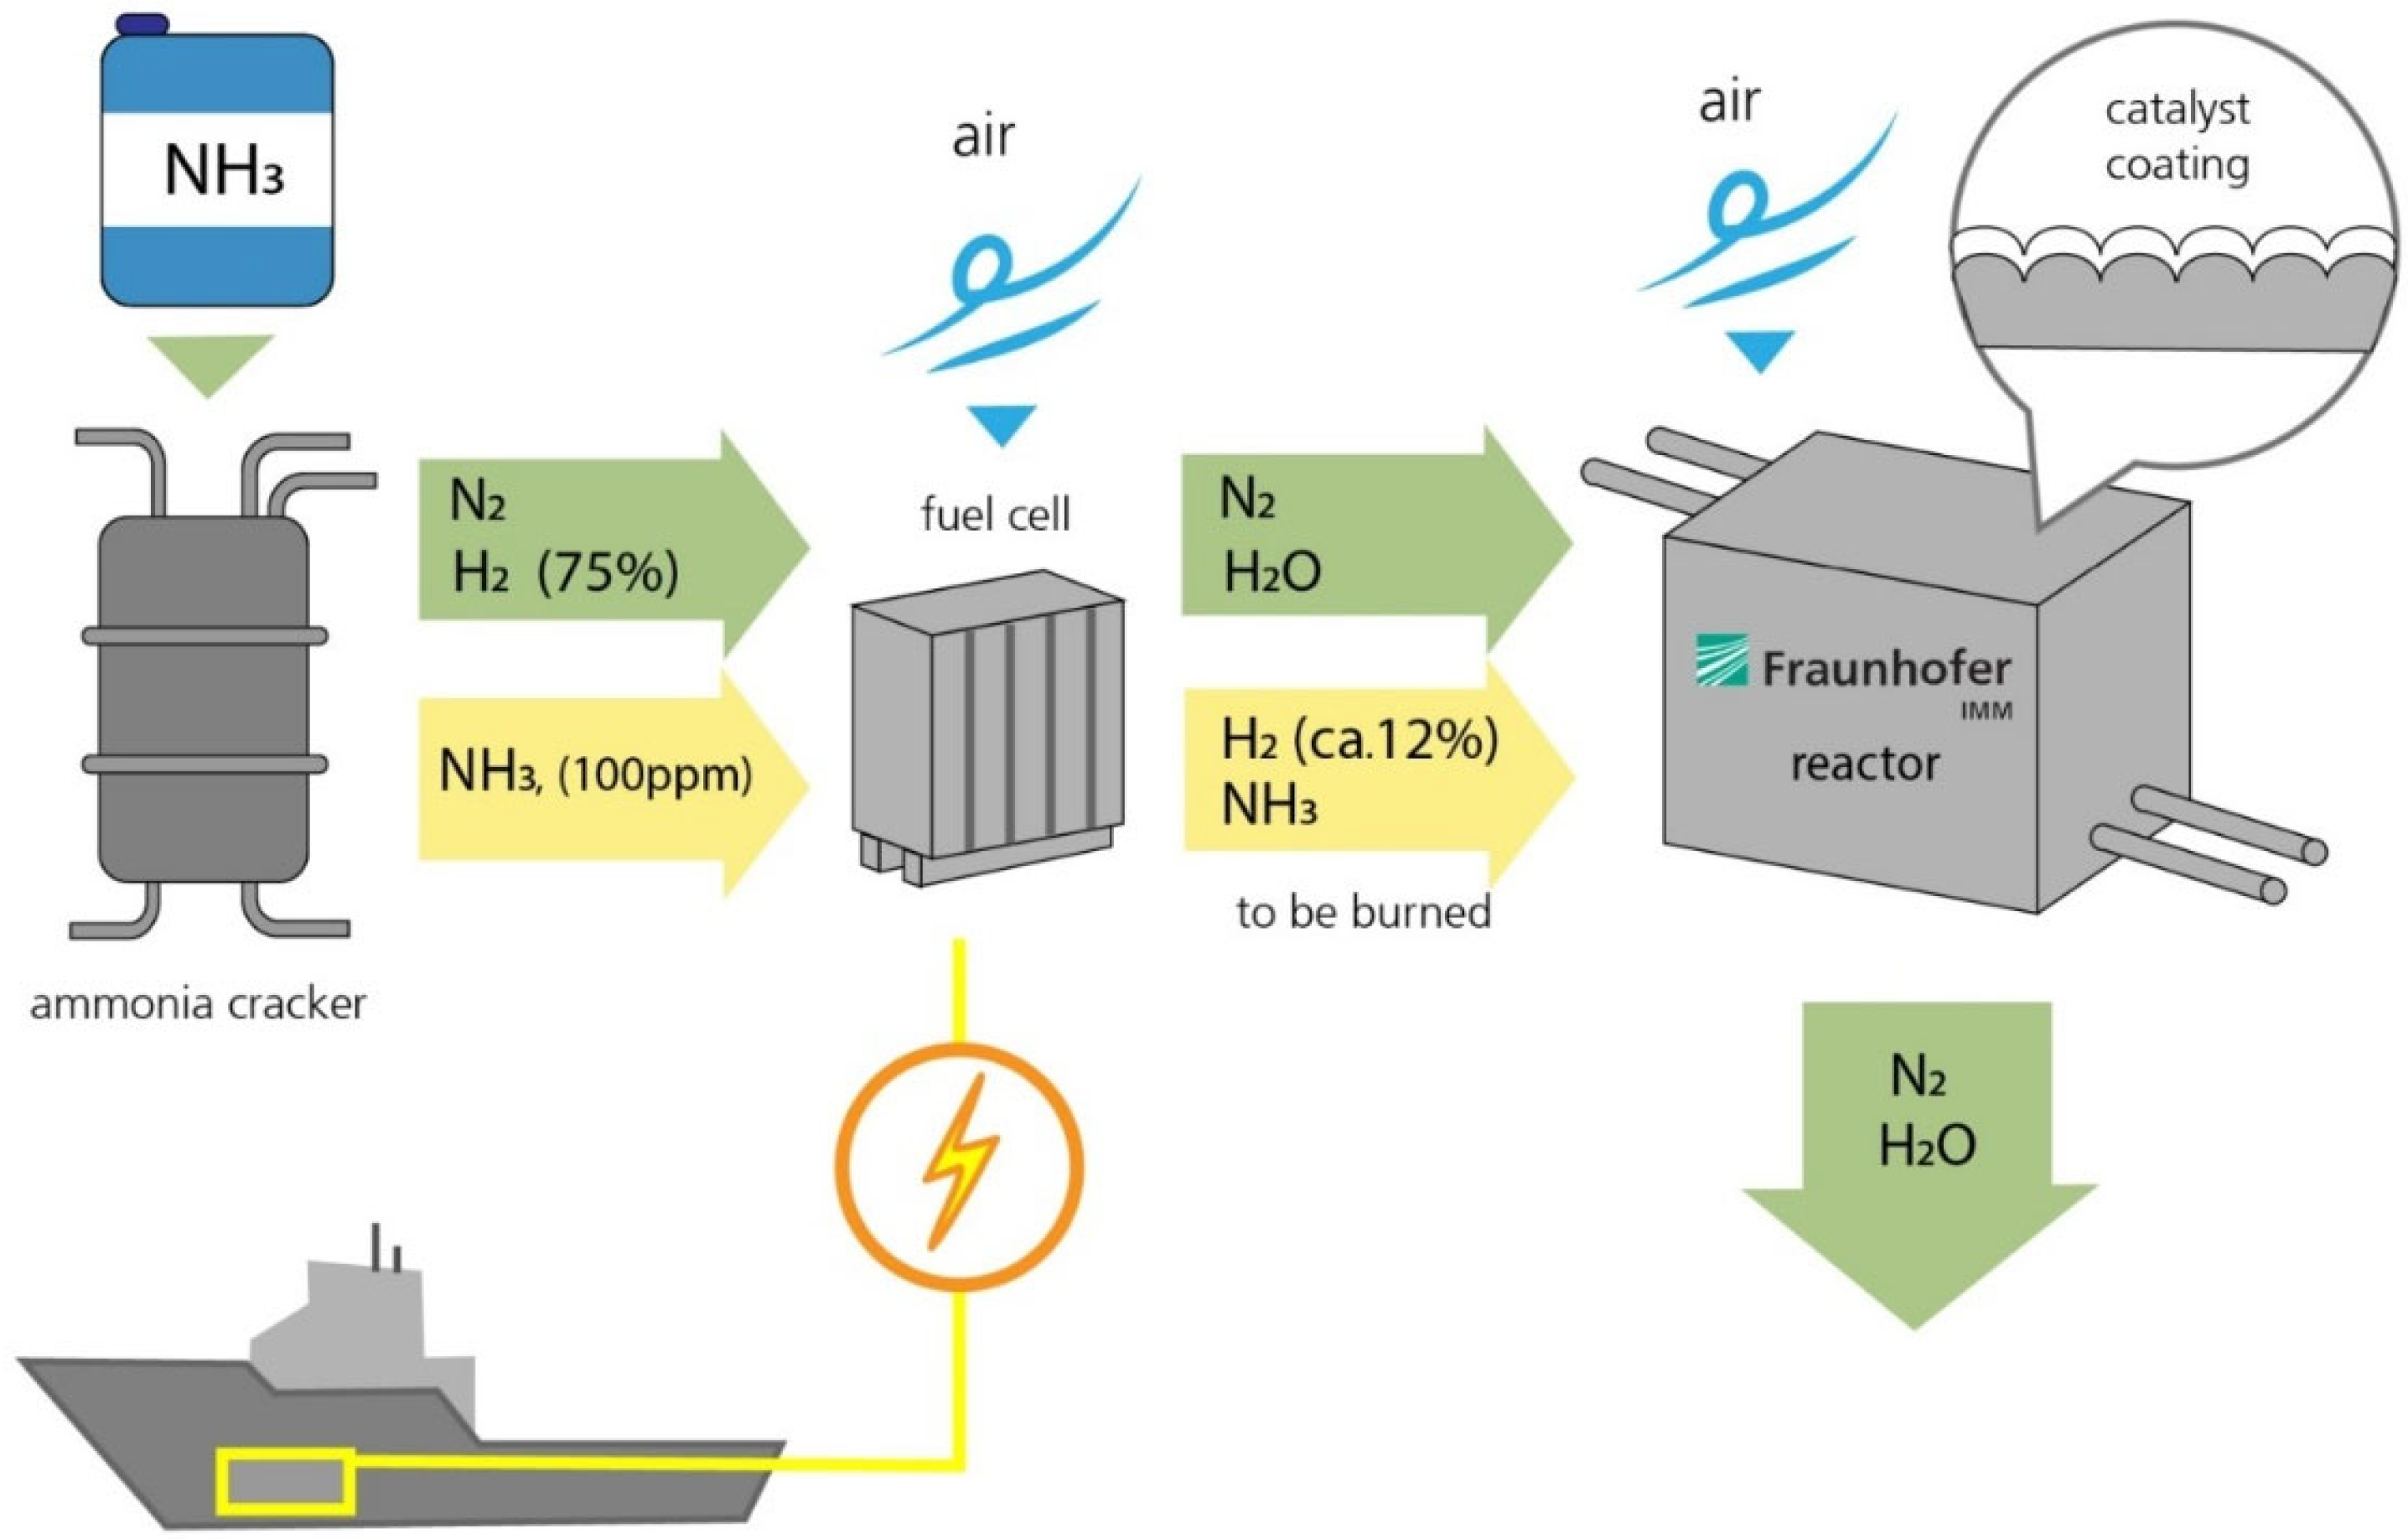
6.3.1. Ammonia as Fuel for Fuel Cells
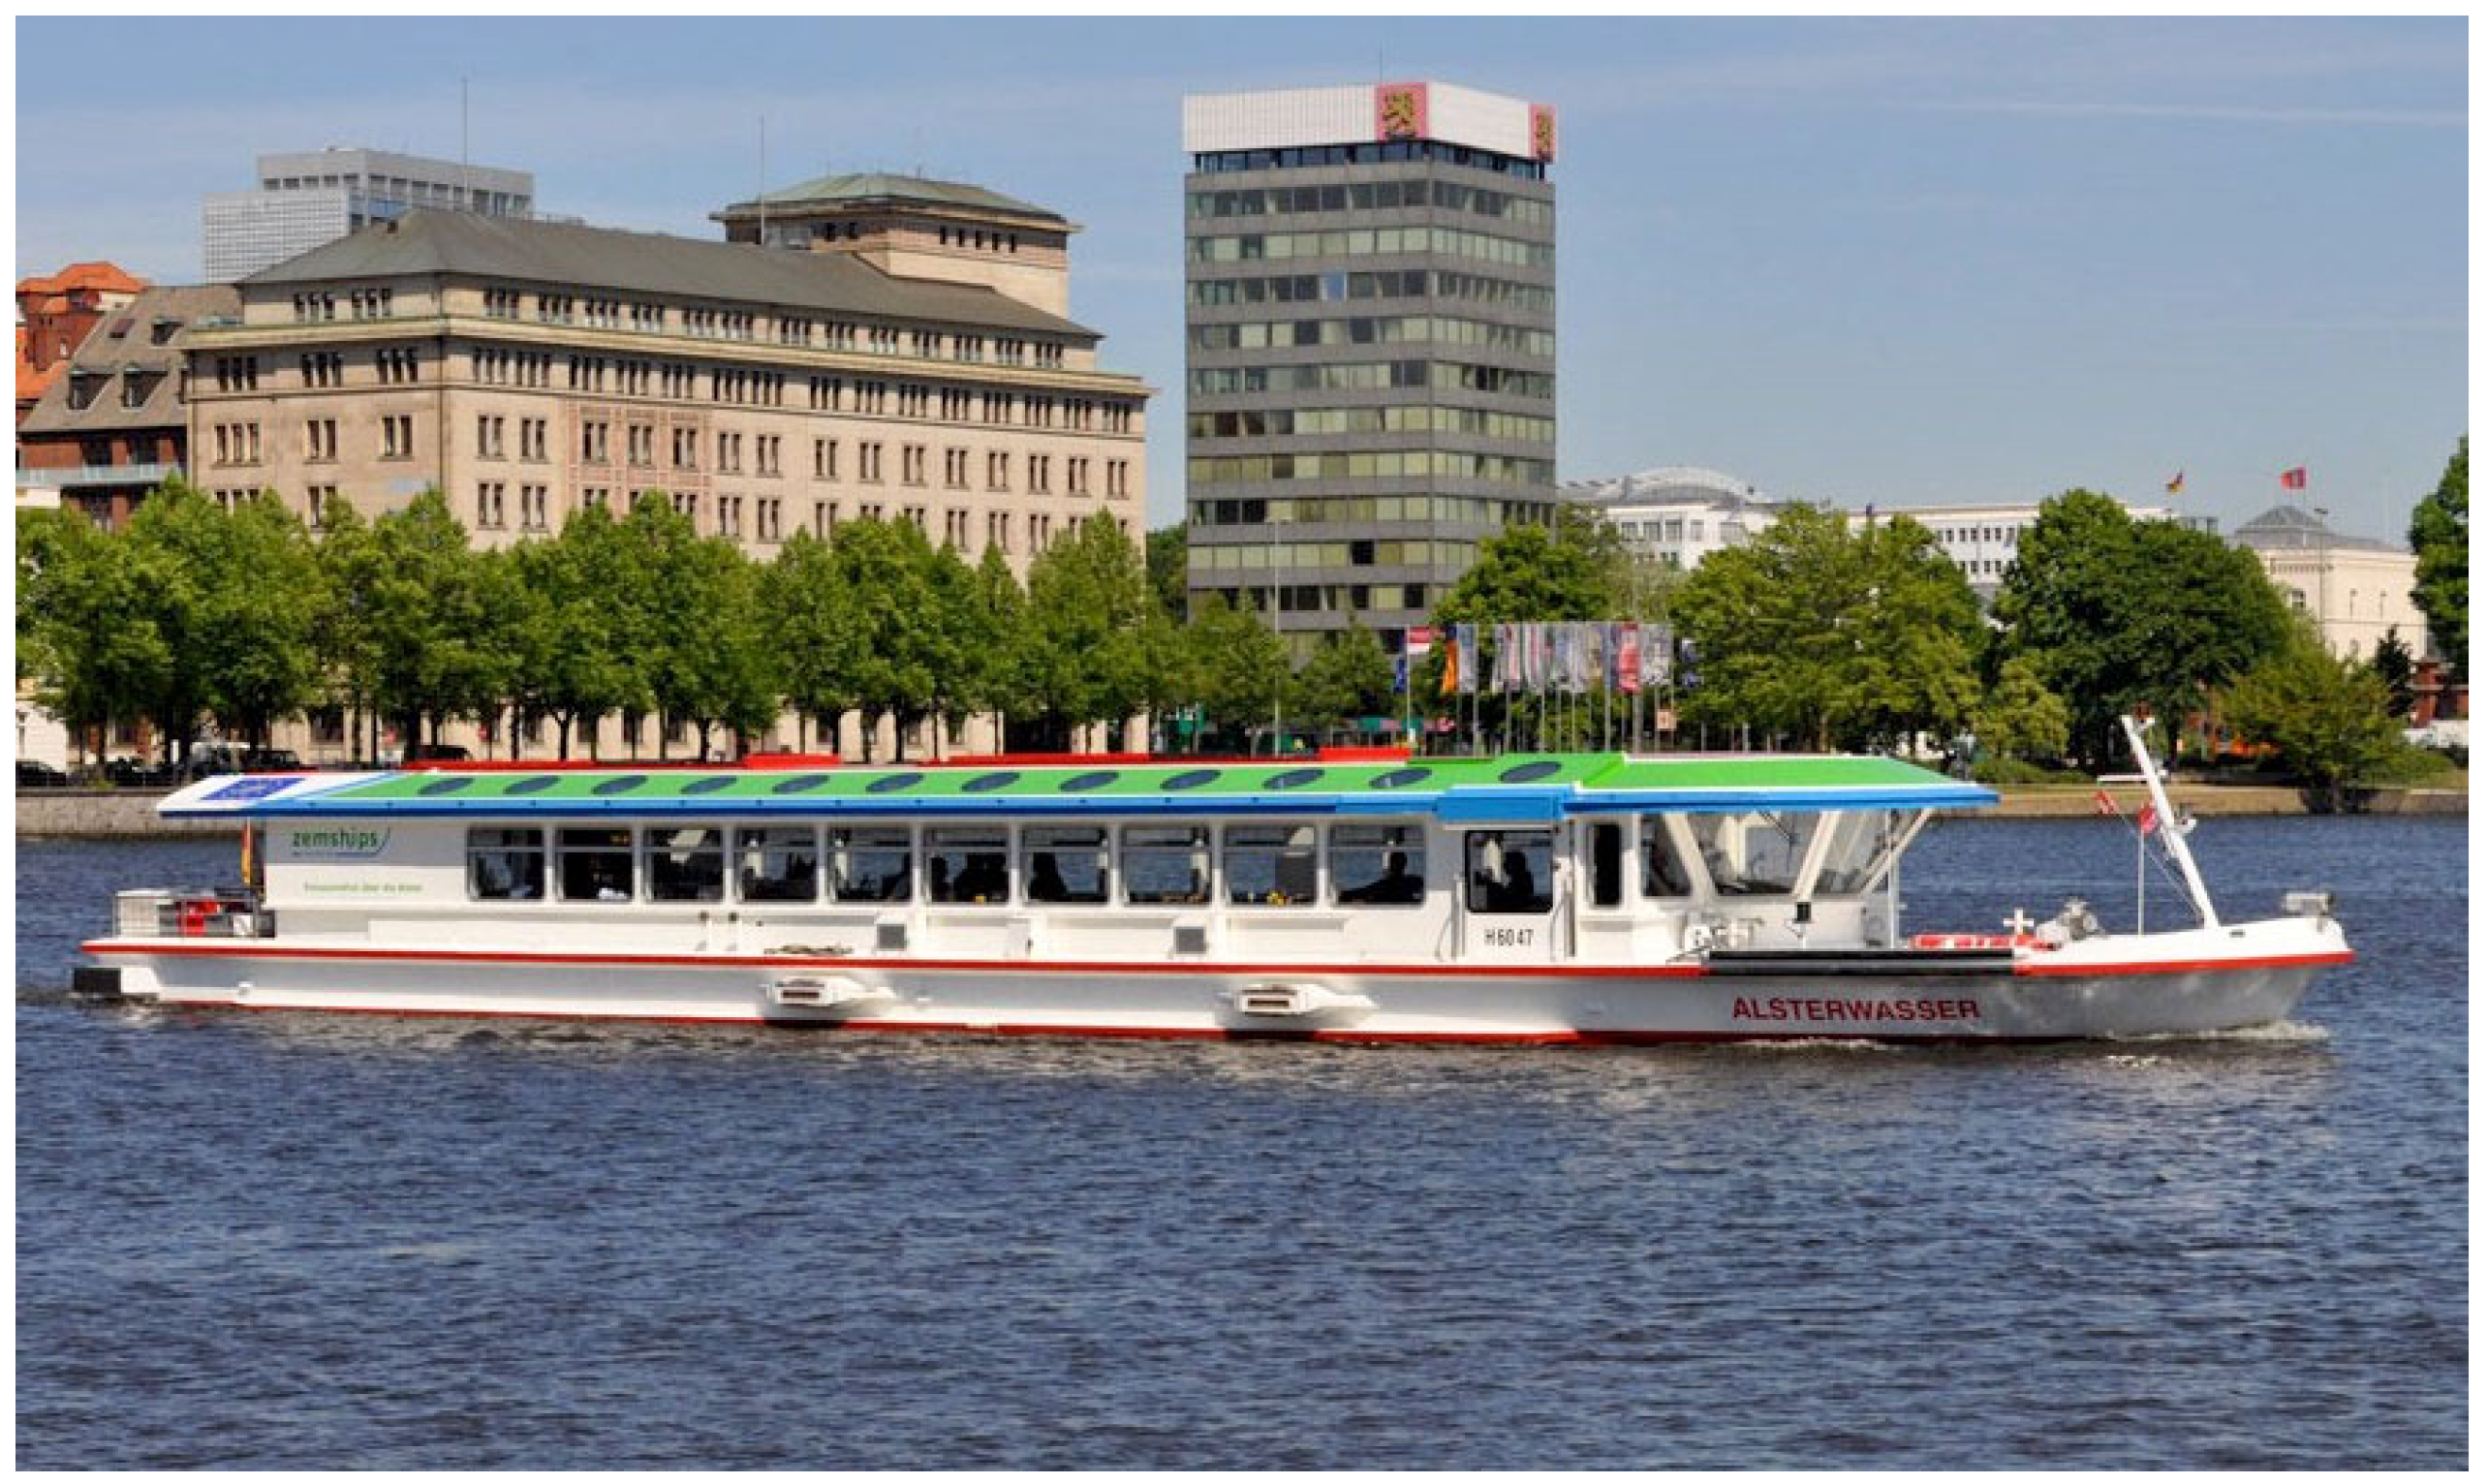
6.3.2. Hydrogen as Fuel for Fuel Cells
6.4. Electric and Hybrid Propulsion
6.5. Nuclear Propulsion
6.6. Batteries and Supercapacitors
6.7. Carbon Capture and Storage (CCS)
7. Technical and Operational Measures to Reduce Greenhouse Gases (GHGs) and Fuel Consumption
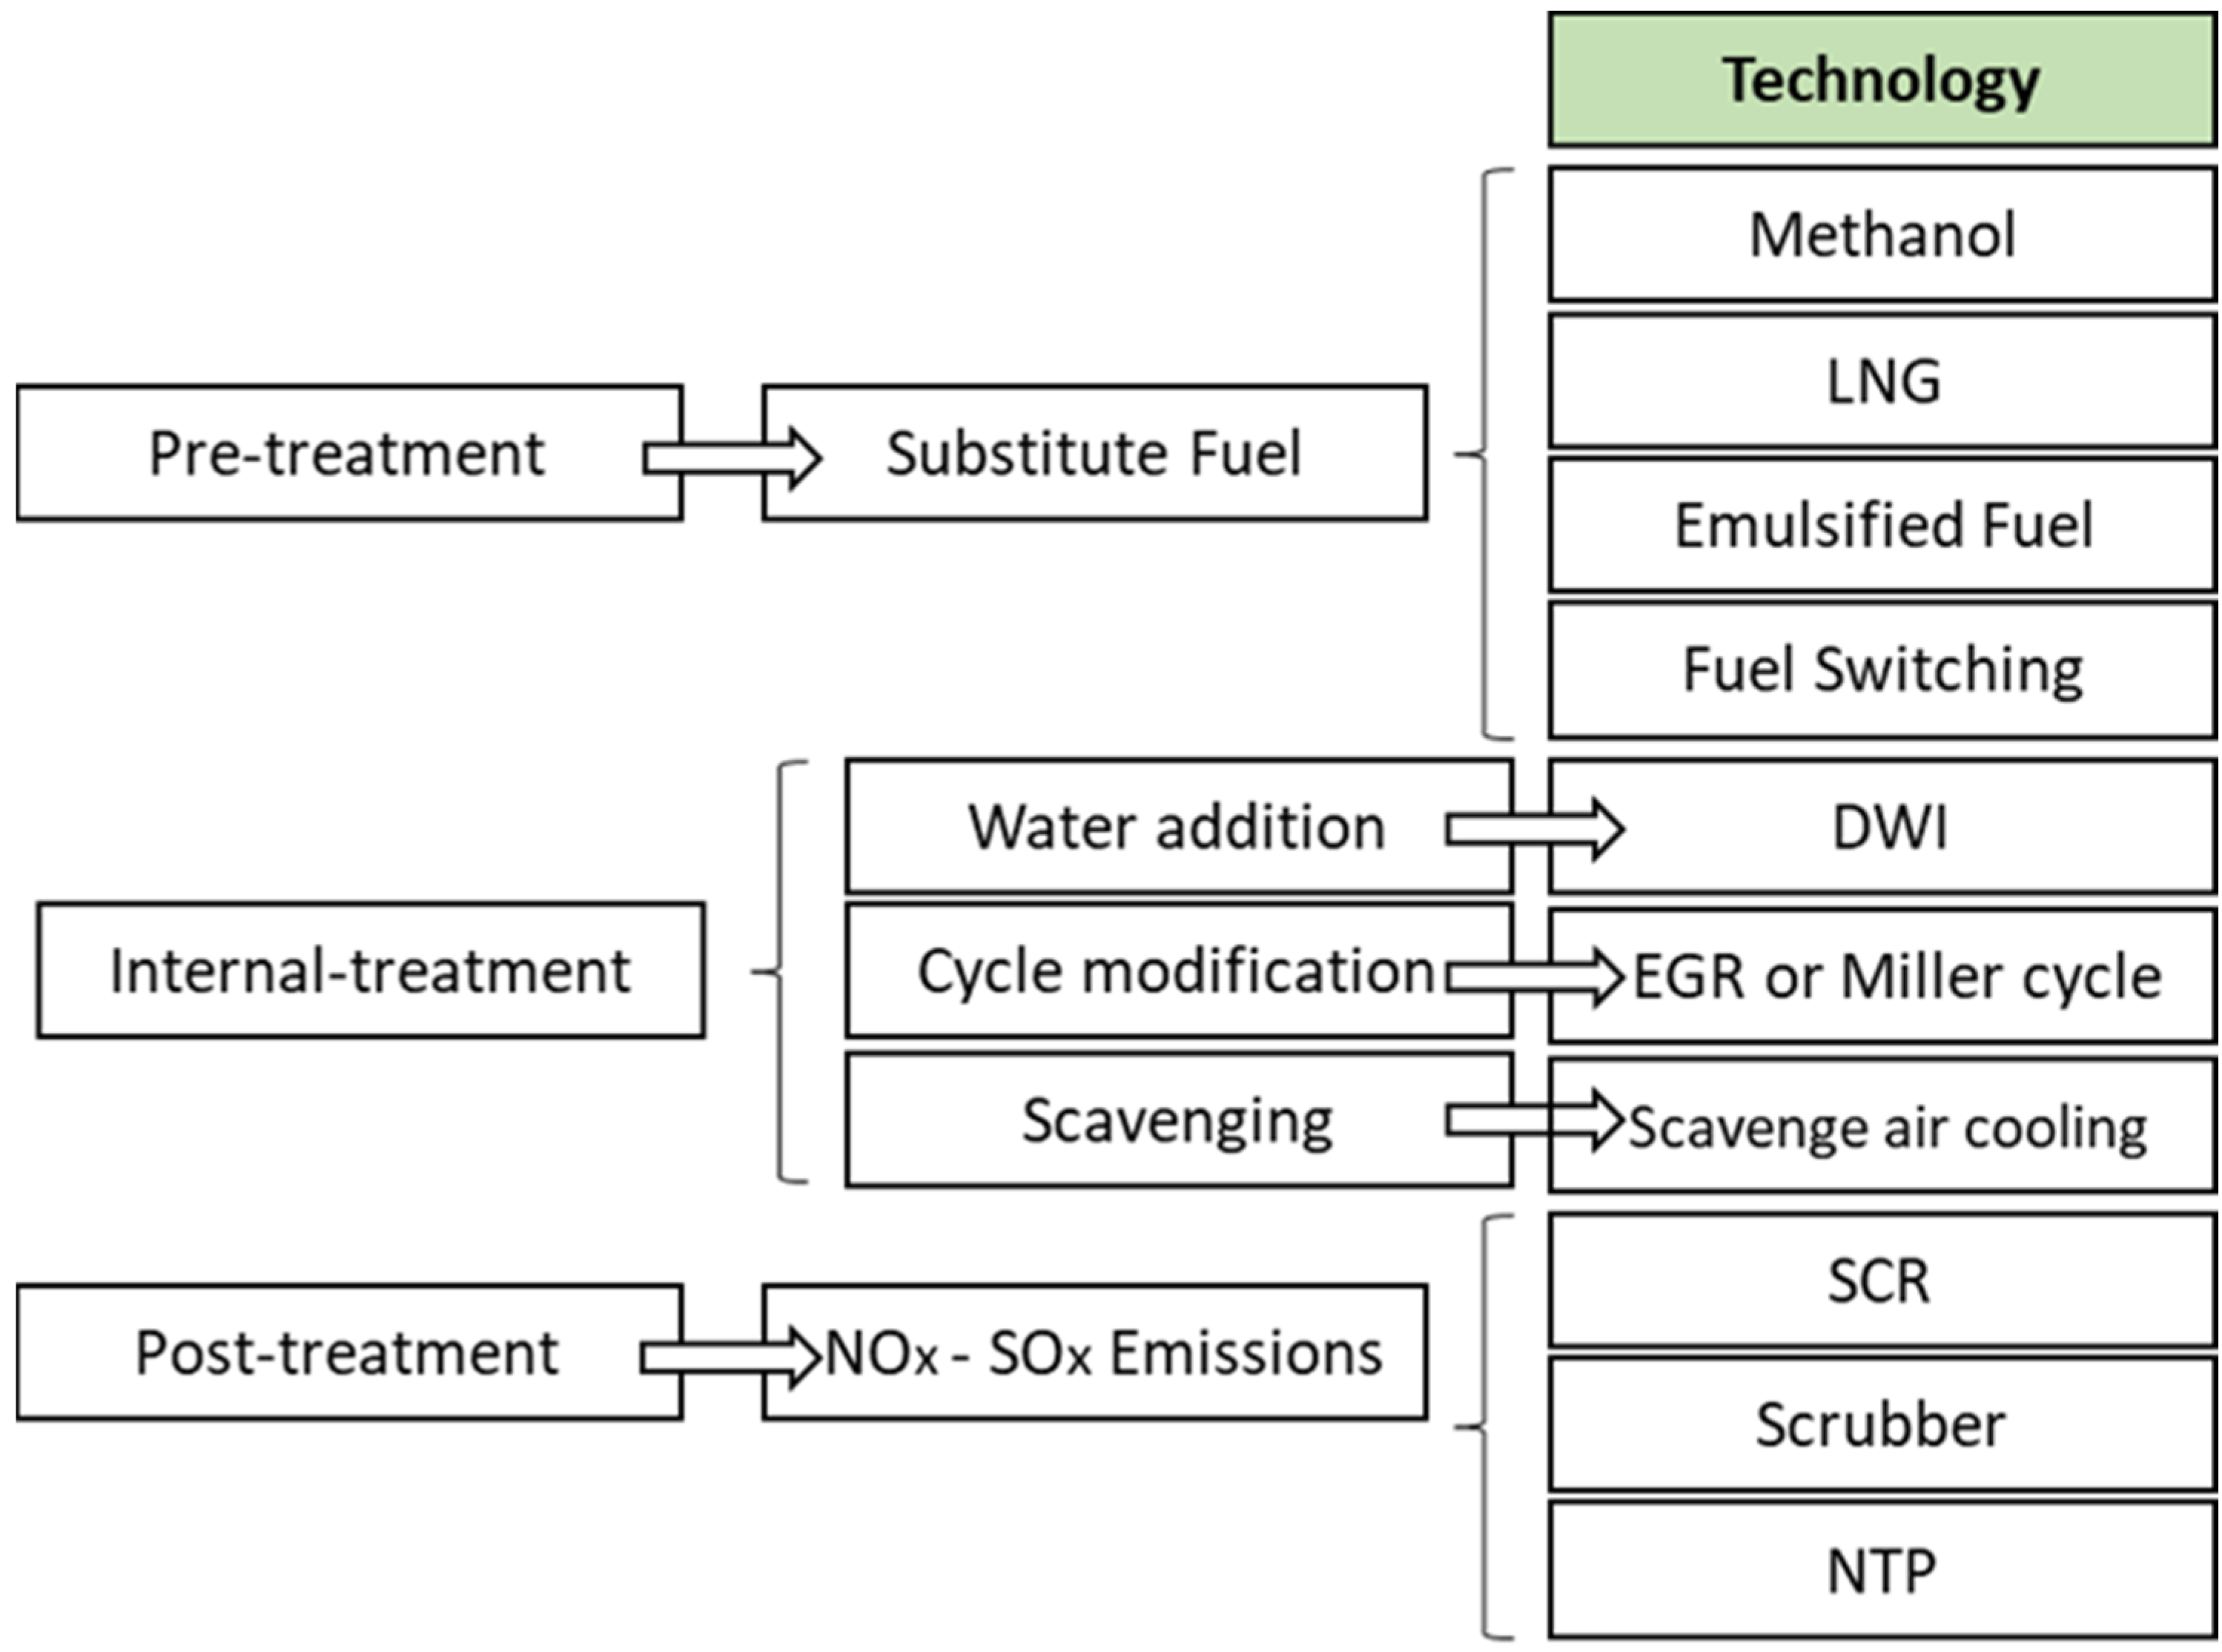
7.1. Technical Measures to Reduce GHG Emissions Using Pre-Treatment, Internal-Treatment, and Post-Treatment Solutions
7.1.1. Emulsified Fuel
7.1.2. Fuel Switching
7.1.3. Direct Water Injection (DWI)
7.1.4. Miller Cycle and Scavenge Air Cooling
7.1.5. Exhaust Gas Recirculation (EGR)
7.1.6. Selective Catalytic Reduction (SCR)
7.1.7. Non-Thermal Plasma (NTP)
7.1.8. Scrubber
7.2. Operational Measures to Reduce Fuel Consumption
7.2.1. Cargoship Speed
7.2.2. Vessel Design
7.2.3. Cleaning
7.2.4. Bulbous Bow
7.2.5. Low Profile Hull Openings
7.2.6. Reduced Ballast Operation
7.2.7. Air Lubrication
7.2.8. Propeller Design
- Propeller efficiency management (1–2%)
- Pulling thruster (<10%)
- Constant vs. variable speed operation (<5%)
- Propeller tip winglets (<4%)
- Propeller nozzle (<5%)
- Advanced propeller blade sections (<2%)
- Wing thrusters (<10%)
- Counter-rotating propeller (<12%)
- Propeller-rudder interactions (<4%)
7.2.9. Waste Heat Recovery System (WHRS)
7.2.10. Interceptor Trim Plates
7.2.11. Peak Shaving
7.2.12. Ship Operational Considerations–Weather Routing
7.2.13. Potential for Combined Carbon Removal
7.3. Government Policies Systems in Maritime Shipping
Shipping Industry Climate Risk and Opportunity
8. Perspective for Future Research
9. Trends, Challenges, and Conclusions
Author Contributions
Funding
Institutional Review Board Statement
Informed Consent Statement
Data Availability Statement
Conflicts of Interest
References
- Walker, T.R. Green Marine: An environmental program to establish sustainability in marine transportation. Mar. Pollut. Bull. 2016, 105, 199–207. [Google Scholar] [CrossRef] [PubMed]
- Balcombe, P.; Brierley, J.; Lewis, C.; Skatvedt, L.; Speirs, J.; Hawkes, A.; Staffell, I. How to decarbonise international shipping: Options for fuels, technologies and policies. Energy Convers. Manag. 2019, 182, 72–88. [Google Scholar] [CrossRef]
- Issa, M. Optimisation Opérationnelle, Écologique et Énergétique des Groupes Électrogènes Diesel. Ph.D. thesis, Rimouski, Université du Québec à Rimouski, Département de mathématiques, informatique et génie, Rimouski, QC, Canada, 2020; p. 252. [Google Scholar]
- Statista Research Department. Transport Volume of Seaborne Trade from 1990 to 2020. 2021. Available online: https://www.statista.com/statistics/264117/tonnage-of-worldwide-maritime-trade-since-1990/ (accessed on 15 January 2022).
- Statista Research Department. Number of Ships in the World Merchant Fleets as of January 2021, by Type. 2021. Available online: https://www.statista.com/statistics/264024/number-of-merchant-ships-worldwide-by-type/#statisticContainer (accessed on 15 January 2022).
- Issa, M.; Ibrahim, H.; Ilinca, A.; Hayyani, M. A Review and Economic Analysis of Different Emission Reduction Techniques for Marine Diesel Engines. Open J. Mar. Sci. 2019, 9, 148–171. [Google Scholar] [CrossRef]
- Issa, M.; Ibrahim, H.; Lepage, R.; Ilinca, A. A review and comparison on recent optimization methodologies for diesel engines and diesel power generators. J. Power Energy Eng. 2019, 7, 31. [Google Scholar] [CrossRef]
- Issa, M.; Beaulac, P.; Ibrahim, H.; Ilinca, A. Marinization of a Two-Stage Mixed Structured Packing Scrubber for Sox Abatement and CO2 Capture. Int. J. Adv. Res. 2019, 7, 73–82. [Google Scholar] [CrossRef]
- Energy Transitions Commission. The First Wave. A Blueprint for Commercial-Scale Zero-Emission Shipping Pilots; A Special Report by the Energy Transitions Commission for the Getting to Zero Coalition; Energy Transitions Commission: London, UK, 2020. [Google Scholar]
- Lindstad, E.; Rialland, A. LNG and cruise ships, an easy way to Fulfil regulations—Versus the need for reducing GHG emissions. Sustainability 2020, 12, 2080. [Google Scholar] [CrossRef]
- Issa, M.; Ilinca, A. 49 Petrodiesel and. Petrodiesel Fuels Sci. Technol. Health Environ. 2021, 3, 1015. [Google Scholar]
- Konur, O. Biodiesel and Petrodiesel Fuels: Science, Technology, Health, and the Environment. In Biodiesel Fuels; CRC Press: Boca Raton, FL, USA, 2021; pp. 3–36. [Google Scholar]
- Shell; Deloitte. Decarbonising Shipping: All Hands on Deck; Shell: Hague, The Netherlands, 2020. [Google Scholar]
- Psaraftis, H.N. Green maritime transportation: Market based measures. In Green Transportation Logistics; Springer International Publishing: Cham, Switzerland, 2016; pp. 267–297. [Google Scholar]
- ITF. Decarbonising Maritime Transport. Pathways to Zero-Carbon Shipping by 2035; International Transport Forum: Paris, France, 2018. [Google Scholar]
- IMO. Brief History of IMO. 2017. Available online: https://www.imo.org/en/About/HistoryOfIMO/Pages/Default.aspx (accessed on 15 January 2022).
- IMO. UN Body Adopts Climate Change Strategy for Shipping IMO, 13 April 2018. Available online: https://www.imo.org/en/MediaCentre/PressBriefings/Pages/06GHGinitialstrategy.aspx (accessed on 15 January 2022).
- Bouman, E.A.; Lindstad, E.; Rialland, A.I.; Strømman, A.H. State-of-the-Art technologies, measures, and potential for reducing GHG emissions from shipping—A review. Transp. Res. Part D 2017, 52, 408–421. [Google Scholar] [CrossRef]
- Bradley, B.; Hoyland, R. Decarbonisation and Shipping: International Maritime Organization Ambitions and Measures, 4 November 2020. Available online: https://www.hilldickinson.com/insights/articles/decarbonisation-and-shipping-international-maritime-organization-ambitions-and (accessed on 15 January 2022).
- ICCT. The Energy Efficiency Design Index (EEDI) for New Ships; International Council on Clean Transportation: San Francisco, CA, USA, 2011. [Google Scholar]
- DNV GL. EEXI—Energy Efficiency Existing Ship Index. 2020. Available online: https://www.dnvgl.com/maritime/insights/ topics/eexi/index.html (accessed on 9 January 2022).
- Rutherford, D.; Mao, X.; Comer, B. Potential CO2 Reductions under the Energy Efficiency Existing Ship Index. November 2020. Available online: https://theicct.org/publications/marine-eexi-nov2020 (accessed on 15 January 2022).
- Pariotis, E.G.; Zannis, T.C.; Yfantis, E.A.; Roumeliotis, I.; Katsanis, J.S. Energy Saving Techniques in Ships—Technical and Operational Measures. In Proceedings of the International Conference Green Transportation, Athens, Greece, 4 June 2016. [Google Scholar]
- IMO. IMO Working Group Agrees Further Measures to Cut Ship Emissions. 23 October 2020. Available online: https://www. imo.org/en/MediaCentre/PressBriefings/pages/36-ISWG-GHG-7.aspx (accessed on 11 January 2022).
- Wärtsilä; DNV GL. Decarbonising Shipping. In Proceedings of the Joint Wärtsilä—DNV GL Webinar, Online, 3 November 2020. [Google Scholar]
- IMO. Market-Based Measures. International Maritime Organisation. 2019. Available online: https://www.imo.org/en/OurWork/Environment/Pages/Market-Based-Measures.aspx (accessed on 16 January 2022).
- Hirdaris, S.; Fai, C. Keynote Paper: The role of Technology in Green Ship Design. In Proceedings of the 11th International Marine Design Conference, Glasgow, UK, 11–14 June 2012. [Google Scholar]
- Reynolds, G. The History and Status of GHG Emissions Control in International Shipping. In Proceedings of the International Conference on Technologies, Operations, Logistics and Modelling for Low Carbon Shipping, Glasgow, UK, 22–24 June 2011. [Google Scholar]
- Jorgensen, R.N. Shipping Industry Needs to Talk Market-Based Measures. BiMCO. 2 March 2021. Available online: https: //www.bimco.org/news/priority-news/20210302-shipping-industry-needs-to-talk-market-based-measures (accessed on 16 January 2022).
- Lagouvardou, S.; Psaraftis, H.N.; Zis, T. A Literature Survey on market-based measures for the decarbonization of shipping. Sustainability 2020, 12, 3953. [Google Scholar] [CrossRef]
- Tanaka, H.; Okada, A. Effects of market-based measures on a shipping company: Using an optimal control approach for long-term modeling. Res. Transp. Econ. 2019, 73, 63–71. [Google Scholar] [CrossRef]
- Royal Academy of Engineering. Future Ship Powering Options, Exploring Alternative Methods of Ship Propulsion; Royal Academy of Engineering: London, UK, 2013; ISBN 978-1-909327-01-6. [Google Scholar]
- Blanco-Canqui, H.; Lal, R. Soil and crop response to harvesting corn residues for biofuel production. Sci. Geoderma 2007, 141, 355–362. [Google Scholar] [CrossRef]
- Ali, M.; Saleem, M.; Khan, Z.; Watson, I.A. The use of crop residues for biofuel production. In Biomass, Biopolymer-Based Materials, and Bioenergy; Woodhead Publishing: Sawston, UK, 2019; pp. 369–395. [Google Scholar]
- García-Olivares, A. Substitutability of electricity and renewable materials for fossil fuels in a post-carbon economy. Energies 2015, 8, 13308–13343. [Google Scholar] [CrossRef]
- Hannon, M.; Gimpel, J.; Tran, M.; Rasala, B.; Mayfield, S. Biofuels from algae: Challenges and potential. Biofuels 2010, 1, 763–784. [Google Scholar] [CrossRef] [PubMed]
- Thompson, H.; Corbett, J.J.; Winebrake, J.J. Natural gas as a marine fuel. Energy Policy 2015, 87, 153–167. [Google Scholar] [CrossRef]
- Mofor, L.; Nuttall, P.; Newell, A. Renewable Energy Options for Shipping; Technology Brief; IRENA Innovation and Technology Centre: Bonn, Germany, 2015. [Google Scholar]
- Hsieh, C.-W.C.; Felby, C. Biofuels for the Marine Shipping Sector; IEA Bioenergy: Paris, France, 2017. [Google Scholar]
- Konur, O. Biodiesel fuels: A scientometric review of the research. In Biodiesel Fuels; CRC Press: Boca Raton, FL, USA, 2021; pp. 225–248. [Google Scholar]
- Bengtsson, S.; Andersson, K.; Fridell, E. A comparative life cycle assessment of marine fuels: Liquefied natural gas and three other fossil fuels. Proc. Inst. Mech. Eng. Part M J. Eng. Marit. Environ. 2011, 225, 97–110. [Google Scholar] [CrossRef]
- Wang, S.; Notteboom, T. The adoption of liquefied natural gas as a ship fuel: A systematic review of perspectives and challenges. Transp. Rev. 2014, 34, 749–774. [Google Scholar] [CrossRef]
- CORDIS Risultati Della Ricercar de ll’UE. Available online: https://cordis.europa.eu/project/id/650195/reporting/it (accessed on 18 January 2022).
- Eco Marine Power. Wind and Solar Power for Ship. Available online: https://www.ecomarinepower.com/en/wind-and-solar-power-for-ships (accessed on 19 January 2022).
- Mihail–Vlad, V. Flettner Rotors. J. Mar. Technol. Environ. Year 2019, 2, 75. [Google Scholar]
- Talluri, L.; Nalianda, D.K.; Giuliani, E. Techno economic and environmental assessment of Flettner rotors for marine propulsion. Ocean. Eng. 2018, 154, 1–15. [Google Scholar] [CrossRef]
- Seddiek, I.S.; Ammar, N.R. Harnessing wind energy on merchant ships: Case study Flettner rotors onboard bulk carriers. Environ. Sci. Pollut. Res. 2021, 28, 32695–32707. [Google Scholar] [CrossRef]
- Enercon E-Ship 1. A Wind-Hybrid Commercial Cargo Ship. In Proceedings of the 4th Conference on Ship Efficiency, Hamburg, Germany, 23–24 September 2013. Available online: https://www.stg-online.org/onTEAM/shipefficiency/programm/06-STG_Ship_Efficiency_2013_100913_Paper.pdf (accessed on 19 January 2022).
- BBC. Kite to Pull Ship Across Atlantic. 22 January 2008. Available online: http://news.bbc.co.uk/2/hi/europe/7201887.stm (accessed on 19 January 2022).
- Montoya, L.T.C.; Lain, S.; Issa, M.; Ilinca, A. 4—Renewable Energy Systems. In Hybrid Renewable Energy Systems and Microgrids; Kabalci, E., Ed.; Academic Press: Cambridge, MA, USA, 2021; pp. 103–177. ISBN 9780128217245. [Google Scholar] [CrossRef]
- Kabalci, E. (Ed.) Hybrid Renewable Energy Systems and Microgrids; Academic Press: Cambridge, MA, USA, 2020. [Google Scholar]
- Setiawan, F.; Dewi, T.; Yusi, S. Sea Salt Deposition Effect on Output and Efficiency Losses of the Photovoltaic System; A case study in Palembang, Indonesia. J. Phys. Conf. Ser. 2019, 1167, 012028. [Google Scholar] [CrossRef]
- Smith, T.W.P.; Jalkanen, J.P.; Anderson, B.A.; Corbett, J.J.; Faber, J.; Hanayama, S.; O’Keeffe, E.; Parker, S.; Johansson, L.; Aldous, L.; et al. Third IMO GHG Study; International Maritime Organization: London, UK, 2015; pp. 1–327. [Google Scholar]
- Atkinson, G.M. Analysis of marine solar power trials on Blue Star Delos. J. Mar. Eng. Technol. 2016, 15, 115–123. [Google Scholar] [CrossRef]
- Yuan, Y.; Wang, J.; Yan, X.; Li, Q.; Long, T. A design and experimental investigation of a large-scale solar energy/diesel generator powered hybrid ship. Energy 2018, 165, 965–978. [Google Scholar] [CrossRef]
- EAFO. Alternative Fuels Used for Shipping. 2019. Available online: https://www.eafo.eu/shipping-transport/shippingoverview/af-for-shipping (accessed on 20 January 2022).
- DNV GL. Comparison of Alternative Marine Fuels; DVN GL: Høvik, Norway, 2019. [Google Scholar]
- Lloyd’s Register; UMAS. Techno-Economic Assessment of Zero-Carbon Fuels; Lloyd’s Register: London, UK; UMAS: London, UK, 2020. [Google Scholar]
- McKinlay, C.J.; Turnock, S.R.; Hudson, D.A. Route to zero emission shipping: Hydrogen, ammonia or methanol? Int. J. Hydrog. Energy 2021, 46, 28282–28297. [Google Scholar] [CrossRef]
- Raucci, C. The Potential of Hydrogen to Fuel International Shipping. Ph.D. Thesis, UCL (University College London), London, UK, 2017. [Google Scholar]
- Serra, P.; Fancello, G. Towards the IMO’s GHG goals: A critical overview of the perspectives and challenges of the main options for decarbonizing international shipping. Sustainability. 2020, 12, p. 3220, NH3FUEL Assocation. “NH3 Fuel Brochure.” 2010. Available online: https://nh3fuelassociation.org/wpcontent/uploads/2013/01/nh3brochuresept2010.pdf (accessed on 20 January 2022). [CrossRef]
- Hansson, J.; Brynolf, S.; Fridell, E.; Lehtveer, M. The potential role of ammonia as marine fuel—Based on energy systems modeling and multi-criteria decision analysis. Sustainability 2020, 12, 3265. [Google Scholar] [CrossRef]
- Minnehan, J.J.; Pratt, J.W. Practical Application Limits of Fuel Cells and Batteries for Zero Emission Vessels (No. SAND-2017-12665); Sandia National Lab (SNL-NM): Albuquerque, NM, USA, 2017. [Google Scholar]
- DNV GL Assessment of Selected Alternative Fuels and Technologies. 2019. Available online: https://www.dnv.com/maritime/publications/alternative-fuel-assessment-download.html (accessed on 20 January 2022).
- Kim, H.; Haugen, S.; Utne, I.B. Conflict between Environmental Performance and Human Safety. In ICTIS 2013: Improving Multimodal Transportation Systems-Information, Safety, and Integration; American Society of Civil Engineers: Reston, VA, Canada, 2013; pp. 1554–1559. [Google Scholar]
- Cowan, J. Preventing Loss of Propulsion After Fuel Switch to Low Sulfur Distillate Fuel. 2015. Available online: https://www.marinelink.com/news/preventing-propulsion394947 (accessed on 22 January 2022).
- Gard, A.S. Low Sulphur Fuel Changeover, Loss Prevention Circular No. 15–09. 2009. Available online: https://www.gard.no/Content/134078/No%2015-09%20Low%20sulphur%20fuel%20changeover.pdf (accessed on 22 January 2022).
- USCG Fuel Switching Safety (Maritime Safety Alert 11-01). U.S. Coast Guard. 2011. Available online: https://www.ukpandi.com/-/media/files/imports/13108/bulletins/7489---uscg-marine-safety-alert-11-01.pdf (accessed on 22 January 2022).
- International Institute of Marine Surveying. Norwegian Maritime Authority Issues Warning about Lithium-ion Power following Ferry Fire and Explosion. Available online: https://www.iims.org.uk/norwegian-maritime-authority-issues-warning-about-lithium-ion-power-following-ferry-fire-and-explosion/ (accessed on 22 January 2022).
- Opdal, O.A.; Hojem, J.F. Biofuels in Ships. ZERO Emission Resource Organisation. 2007. Available online: biofuels-in-ships.compressed.pdf (accessed on 22 January 2022).
- Bilousov, I.; Bulgakov, M.; Savchuk, V. Modern Marine Internal Combustion Engines: A Technical and Historical Overview; Series on Naval Architecture, Marine Engineering, Shipbuilding and Shipping 8; Springer: Cham, Switzerland, 2020. [Google Scholar]
- Hellenic Shipping News. Why the Internal Combustion Engine is Essential in Shipping’s Decarbonisation Mission. 14 December 2020. Available online: https://www.hellenicshippingnews.com/why-the-internal-combustion-engine-is-essential-in-shippings-decarbonisation-mission/ (accessed on 14 January 2022).
- Mørch, C.; Bjerre, A.; Gøttrup, M.; Sorenson, S.; Schramm, J. Ammonia/hydrogen mixtures in an SI-engine: Engine performance and analysis of a proposed fuel system. Fuel 2011, 90, 854–864. [Google Scholar] [CrossRef]
- Reiter, A.J.; Kong, S.-C. Demonstration of compression-ignition engine combustion using ammonia in reducing greenhouse gas emissions. Energy Fuels 2008, 22, 2963–2971. [Google Scholar] [CrossRef]
- Wärtsilä. Wärtsilä Advances Future Fuel Capabilities with First Ammonia Tests. 25 March 2020. Available online: https://www.wartsila.com/media/news/25-03-2020-wartsila-advances-future-fuel-capabilities-with-first-ammonia-tests-2670619 (accessed on 19 January 2022).
- White, C.M.; Steeper, R.R.; Lutz, A.E. The hydrogen-fueled internal combustion engine: A technical review. Int. J. Hydrog. Energy 2006, 31, 1292–1305. [Google Scholar] [CrossRef]
- Sharma, P.; Dhar, A. Effect of hydrogen supplementation on engine performance and emissions. Int. J. Hydrog. Energy 2018, 43, 7570–7580. [Google Scholar] [CrossRef]
- CMB.TECH. Projects-News-Marine. 2021. Available online: https://cmb.tech/news/hydrobingo-the-first-hydrogen-powered-ferry-has-been-presented (accessed on 19 February 2022).
- CMB.TECH. News-Fuel for the Future. December 2020. Available online: https://cmb.tech/news/fuel-for-the-future (accessed on 19 February 2022).
- Stępień, Z. A Comprehensive Overview of Hydrogen-Fueled Internal Combustion Engines: Achievements and Future Challenges. Energies 2021, 14, 6504. [Google Scholar] [CrossRef]
- Yfantis, E.A.; Katsanis, J.S.; Pariotis, E.G.; Zannis, T.C. Methanol as a Low-Carbon and Sulphur-Free Alternative Fuel for Shipping: Prospects and Challenges; Hellenic Institute of Marine Technology: Piraeus, Greece, 2018. [Google Scholar]
- Andersson, K.; Salazar, C.M. Methanol as a Marine Fuel; Report; Methanol Institute: Brussels, Belgium, 2015. [Google Scholar]
- MAN Diesel and Turbo. Using Methanol Fuel in the MAN B&W ME-LGI Series; MAN Diesel and Turbo: Copenhagen, Denmark, 2015. [Google Scholar]
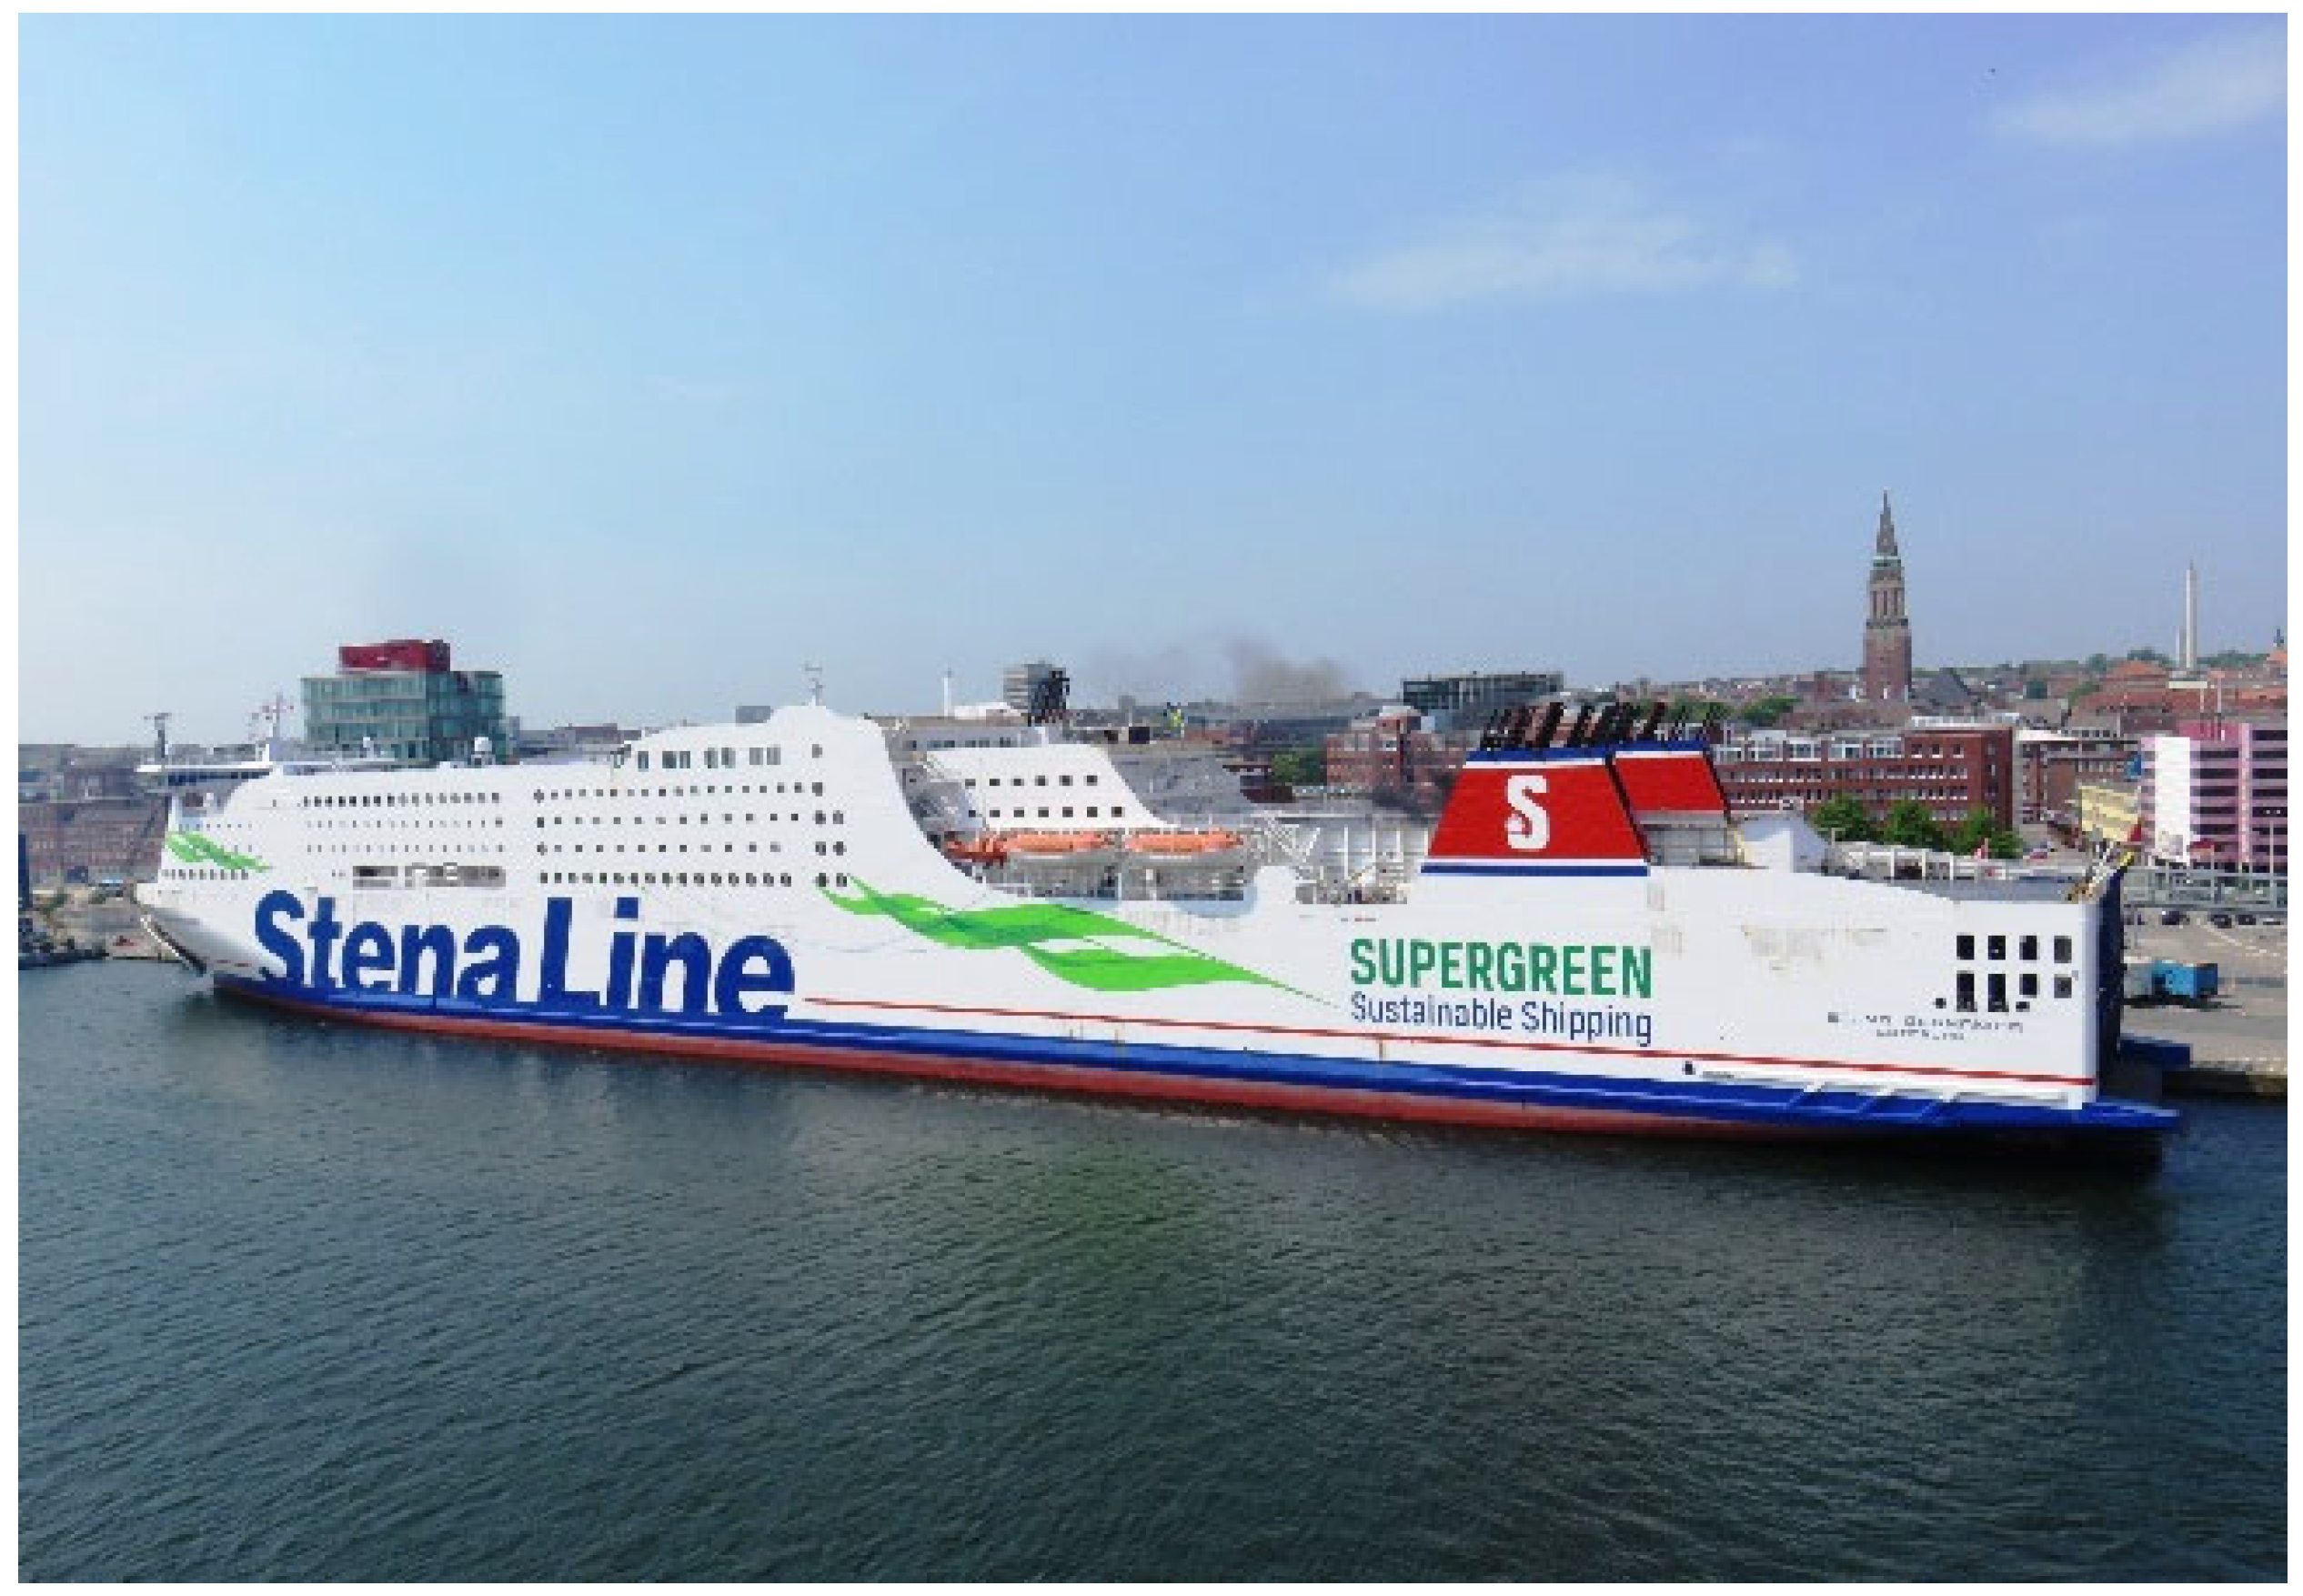
- European Business. The Link to Northern Europe. Available online: https://www.european-business.com/portraits/stena-line-gmbh-co-kg/the-link-to-northern-europe (accessed on 20 January 2022).
- FCBI ENERGY. Methanol as a Marine Fuel Report. October 2015. Available online: https://www.methanol.org/wp-content/uploads/2018/03/FCBI-Methanol-Marine-Fuel-Report-Final-English.pdf (accessed on 20 January 2022).
- Boretti, A. Advances in diesel-LNG internal combustion engines. Appl. Sci. 2020, 10, 1296. [Google Scholar] [CrossRef]
- Stena Germanica, Wikivoyage. Available online: https://de.wikivoyage.org/wiki/Datei:STENA_GERMANICA_5492.jpg (accessed on 24 October 2020).
- Lindstad, E.; Eskeland, G.S.; Rialland, A.; Valland, A. Decarbonizing maritime transport: The importance of engine technology and regulations for LNG to serve as a transition fuel. Sustainability 2020, 12, 8793. [Google Scholar] [CrossRef]
- Li, J.; Wu, B.; Mao, G. Research on the performance and emission characteristics of the LNG diesel marine engine. J. Nat. Gas Sci.Eng. 2015, 27, 945–954. [Google Scholar] [CrossRef]
- Staffell, I.; Scamman, D.; Abad, A.V.; Balcombe, P.; Dodds, P.E.; Ekins, P.; Shah, N.; Warda, K.R. The role of hydrogen and fuel cells in the global energy system. Energy Environ. Sci. 2019, 12, 463–491. [Google Scholar] [CrossRef]
- Van Biert, L.; Godjevac, M.; Visser, K.; Aravind, P.V. A review of fuel cell systems for maritime applications. J. Power Sources 2016, 327, 345–364. [Google Scholar] [CrossRef]
- O’Hayre, R.; Cha, S.-W.; Colella, W.; Prinz, F.B. Fuel Cell Fundamentals, 3rd ed.; Wiley: Hoboken, NJ, USA, 2016. [Google Scholar]
- Connecticut Hydrogen-Fuel Cell Coalition. Hydrogen and Fuel Cell Benefits. 2016. Available online: http://chfcc.org/resources/hydrogen-fuel-cell-benefits/ (accessed on 22 February 2022).
- Shell. Decarbonising Shipping: Setting Shell’s Course; Shell: Hague, The Netherlands, 2020. [Google Scholar]
- Pocard, N. Fuel Cell Price to Drop 70–80% as Production Volume Scales. 30 January 2020. Available online: https://blog.ballard.com/fuel-cell-price-drop (accessed on 22 February 2022).
- Environmental and Energy Study Institute. Fact Sheet—Fuel Cells. 5 November 2015. Available online: https://www.eesi.org/%20papers/view/fact-sheet-fuel-cells (accessed on 22 February 2022).
- Xing, H.; Stuart, C.; Spence, S.; Chen, H. Fuel cell power systems for maritime applications: Progress and perspectives. Sustainability 2021, 12, 1213. [Google Scholar] [CrossRef]
- Blue Growth. Available online: https://www.bluegrowth.org/Blue_Growth_Technology_Innovation/Hydrogen_Ferries_Cruise_Ships_Cargo_Vessels_Fuel_Cells/FCS_Alsterwasser_Alster_Touristik_Hydrogen_FuelCell_Ships_Hamburg_Riverboat.htm (accessed on 22 February 2022).
- Bischoff, M. Molten carbonate fuel cells: A high temperature fuel cell on the edge to commercialization. J. Power Sources 2006, 160, 842–845. [Google Scholar] [CrossRef]
- Çogenli, M.S.; Mukerjee, S.; Yurtcan, A.B. Membrane electrode assembly with ultra low platinum loading for cathode electrode of PEM fuel cell by using sputter deposition. Fuel Cells 2015, 15, 288–297. [Google Scholar] [CrossRef]
- FCS Alsterwaser. Available online: blue-growth.org (accessed on 19 October 2022).
- Dai, W.; Wang, H.; Yuan, X.-Z.; Martin, J.J.; Yang, D.; Qiao, J.; Ma, J. A review on water balance in the membrane electrode assembly of proton exchange membrane fuel cells. Int. J. Hydrog. Energy 2009, 34, 9461–9478. [Google Scholar] [CrossRef]
- Baschu, J.J.; Li, X. Carbon monoxide poisoning of proton exchange membrane fuel cells. Int. J. Energy Res. 2001, 25, 695–713. [Google Scholar] [CrossRef]
- Cheng, X.; Shi, Z.; Glass, N.; Zhang, L.; Zhang, J.; Song, D.; Liu, Z.-S.; Wang, H.; Shen, J. A review of PEM hydrogen fuel cell contamination: Impacts, mechanisms, and mitigation. J. Power Sources 2007, 165, 739–756. [Google Scholar] [CrossRef]
- Huijsmans, J.; Kraaij, G.; Makkus, R.; Rietveld, G.; Sitters, E.; Reijers, H. An analysis of endurance issues for MCFC. J. Power Sources 2000, 86, 117–121. [Google Scholar] [CrossRef]
- Kulkarni, A.; Giddey, S. Materials issues and recent developments in molten carbonate fuel cells. J. Solid State Electrochem. 2012, 16, 3123–3146. [Google Scholar] [CrossRef]
- Payne, R.; Love, J.; Kah, M. Generating electricity at 60% electrical efficiency from 1–2 kWe SOFC products. ECS Trans. 2009, 25, 231–239. [Google Scholar] [CrossRef]
- Massardo, A.F.; Lubelli, F. Internal reforming solid oxide fuel cell-gas turbine combined cycles (IRSOFC-GT): Part A—Cell model and cycle thermodynamic analysis. J. Eng. Gas Turbines Power 2000, 122, 27–35. [Google Scholar] [CrossRef]
- Leah, R.; Bone, A.; Selcuk, A.; Corcoran, D.; Lankin, M.; Dehaney-Steven, Z.; Selby, M.; Whalen, P. Development of highly robust, volume-manufacturable metal-supported SOFCs for operation below 600 °C. ECS Trans. 2011, 35, 351–367. [Google Scholar] [CrossRef]
- FuelCellWorks. Ammonia Fuel Cells for Deep-Sea Shipping—A Key Piece in the Zero-Emission Puzzle. Available online: https://fuelcellsworks.com/news/ammonia-fuel-cells-for-deep-sea-shipping-a-key-piece-in-the-zero-emission-puzzle/ (accessed on 25 February 2022).
- Fraunhofer-Gesellschaft. The World’s First High-Temperature Ammonia-Powered Fuel Cell for Shipping. March 2021. Available online: https://www.fraunhofer.de/en/press/research-news/2021/march-2021/worlds-first-hightemperature-ammonia-powered-fuel-cell-for-shipping.html (accessed on 9 March 2022).
- ShipFC. ShipFC project on first maritime fuel cell to run on green ammonia. Fuel Cells Bull. 2020, 2020, 5–6. [Google Scholar]
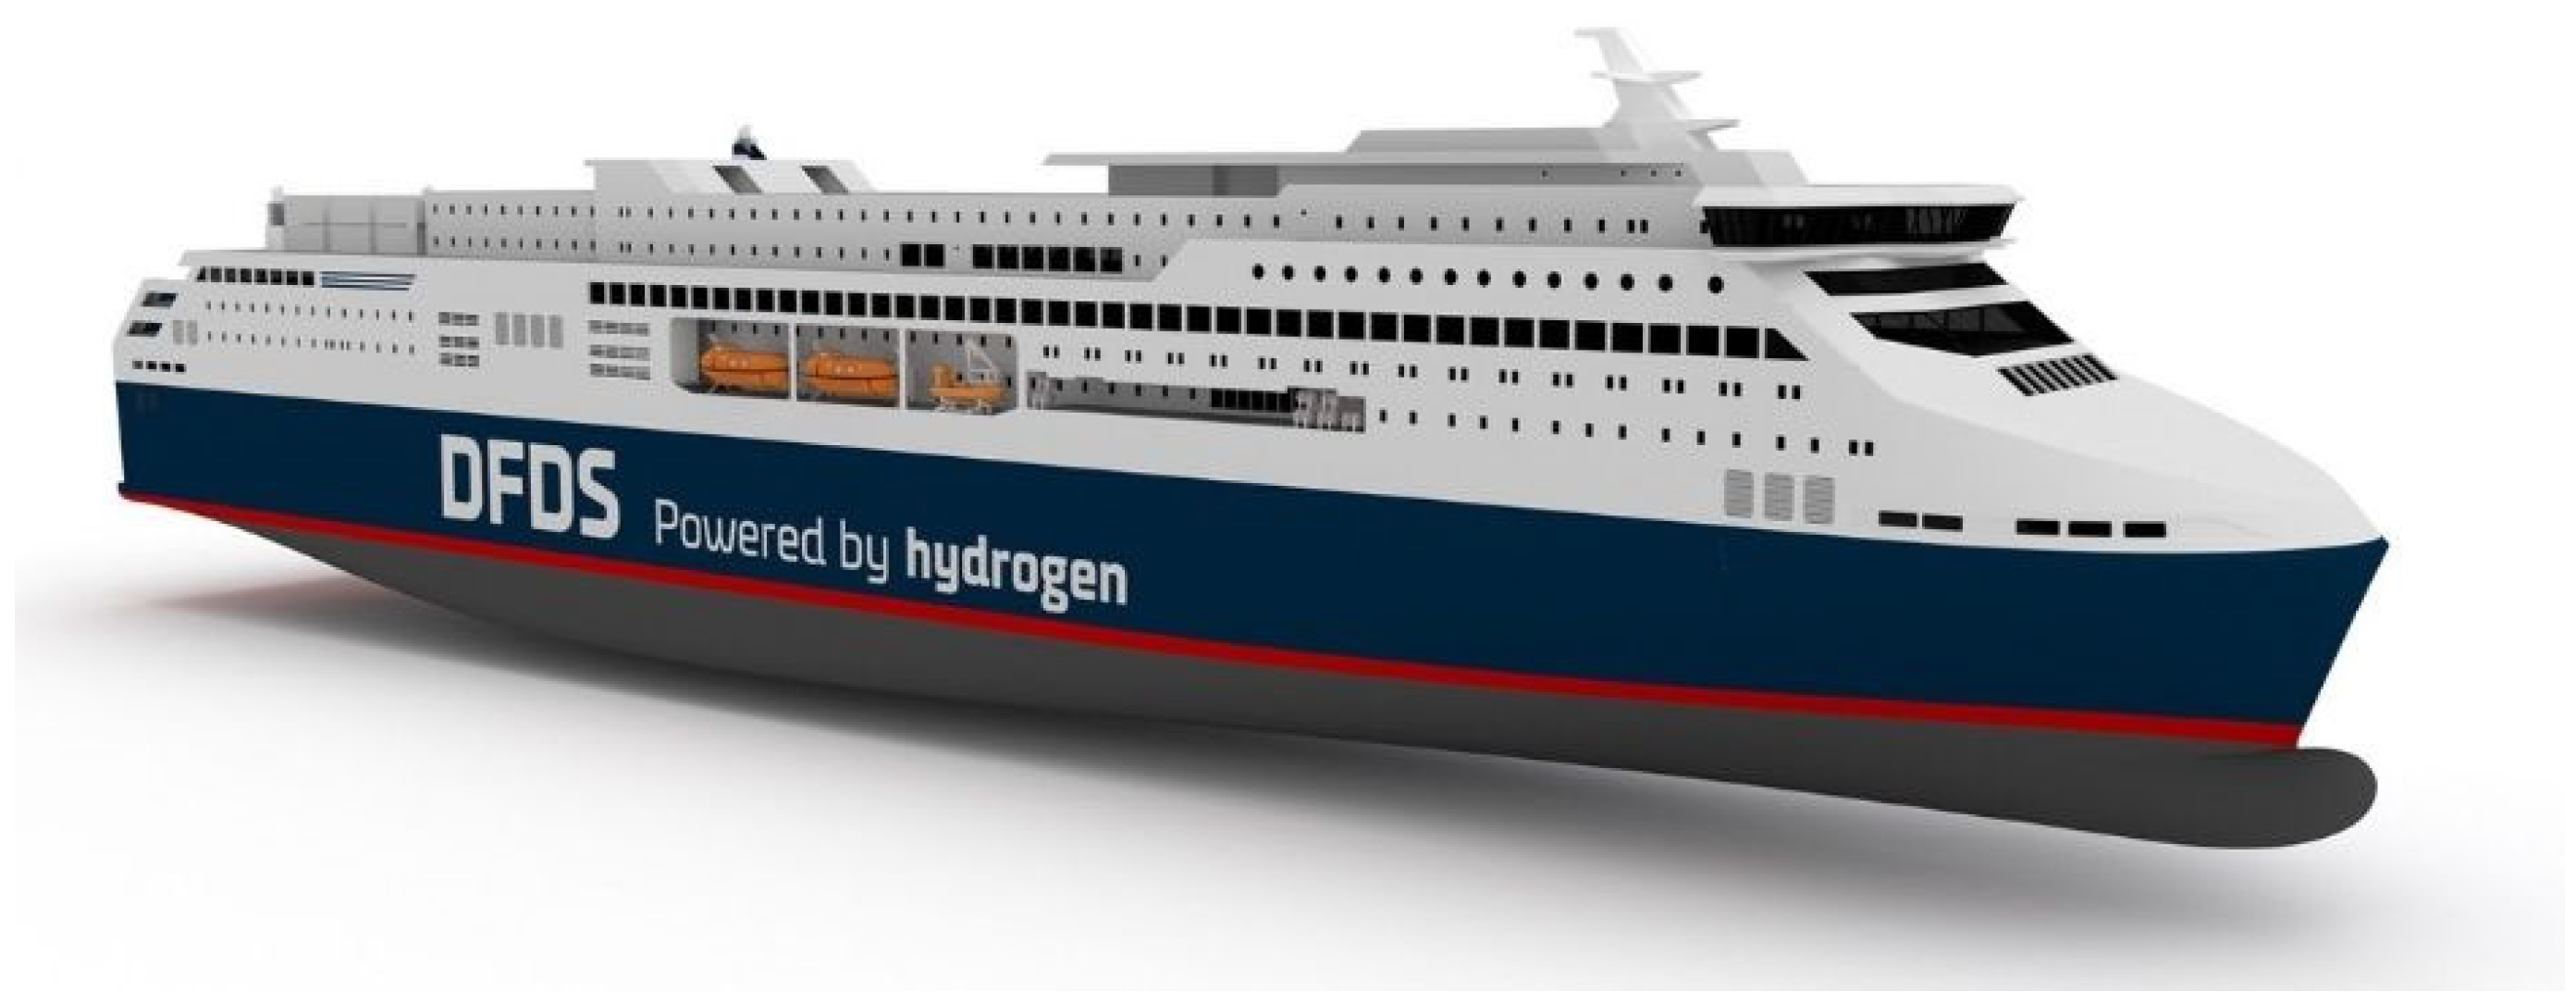
- DFDS; Seroff, N. Partnership Aims to Develop Hydrogen Ferry for Oslo-Copenhagen. 25 November 2020. Available online: https://www.dfds.com/en/about/media/news/hydrogen-ferry-for-oslo-copenhagen (accessed on 9 March 2022).
- Ahoutou, Y.; Ilinca, A.; Issa, M. Electrochemical Cells and Storage Technologies to Increase Renewable Energy Share in Cold Climate Conditions—A Critical Assessment. Energies 2022, 15, 1579. [Google Scholar] [CrossRef]
- Lundin, J. Flywheel in an All-Electric Propulsion System. Ph.D. Thesis, Uppsala University, Uppsala, Sweden, 2011. [Google Scholar]
- Balsamo, F.; Capasso, C.; Lauria, D.; Veneri, O. Optimal design and energy management of hybrid storage systems for marine propulsion applications. Applied Energy 2020, 278, 115629. [Google Scholar] [CrossRef]
- Lloyd’s Register; UMAS. Zero-Emission Vessels 2030: How Do We Get There? Lloyd’s Register: London, UK; UMAS: London, UK, 2018. [Google Scholar]
- Newman, N. Hybrid Ships Take to the High Seas. 17 January 2019. Available online: https://eandt.theiet.org/content/articles/2019/01/hybrid-ships-take-to-the-high-seas/ (accessed on 9 March 2022).
- DNV GL. Handbook for Maritime and Offshore Battery Systems; Guidance Paper; DNV GL: Høvik, Norway, 2016. [Google Scholar]
- World Nuclear Association. Nuclear-Powered Ships. November 2021. Available online: https://world-nuclear.org/information-library/non-power-nuclear-applications/transport/nuclear-powered-ships.aspx (accessed on 9 March 2022).
- Vergara, J.A.; McKesson, C.B. Nuclear Propulsion in High-Performance Cargo Vessels. Mar. Technol. 2002, 39, 1–11. [Google Scholar]
- Subramanian, S. The Cargo Industry’s Quest to Curb Carbon-Belching Ships. April 2020. Available online: https://www.wired.com/story/cargo-industry-decarbonize-carbon-belching-ships/ (accessed on 9 March 2022).
- World Nuclear Association. Hydrogen Production and Uses. November 2021. Available online: https://www.world-nuclear.org/information-library/energy-and-the-environment/hydrogen-production-and-uses.aspx (accessed on 28 February 2022).
- Gravina, J.; Blake, J.I.; Shenoi, R.A.; Turnock, S.R.; Hirdaris, S. Concepts for a modular nuclear powered containership. Bloomberg New Energy Finance. Lithium-Ion Battery Costs and Market: Squeezed Margins Seek Technology Improvements and New Business Models. 5 July 2017. Available online: https://data.bloomberglp.com/bnef/sites/14/2017/07/BNEF-Lithium-ion-battery-costs-and-market.pdf (accessed on 9 March 2022).
- Bloomberg New Energy Finance. Battery Pack Prices Cited Below $100/kWh for the First Time in 2020, While Market Average Sits at $137/kWh. 16 December 2020. Available online: https://about.bnef.com/blog/battery-pack-prices-cited-below-100-kwh-for-the-first-time-in-2020-while-market-average-sits-at-137-kwh/ (accessed on 9 March 2022).
- Lloyd’s Register; UMAS. Zero-Emission Vessels: Transition Pathways; Lloyd’s Register: London, UK, 2019. [Google Scholar]
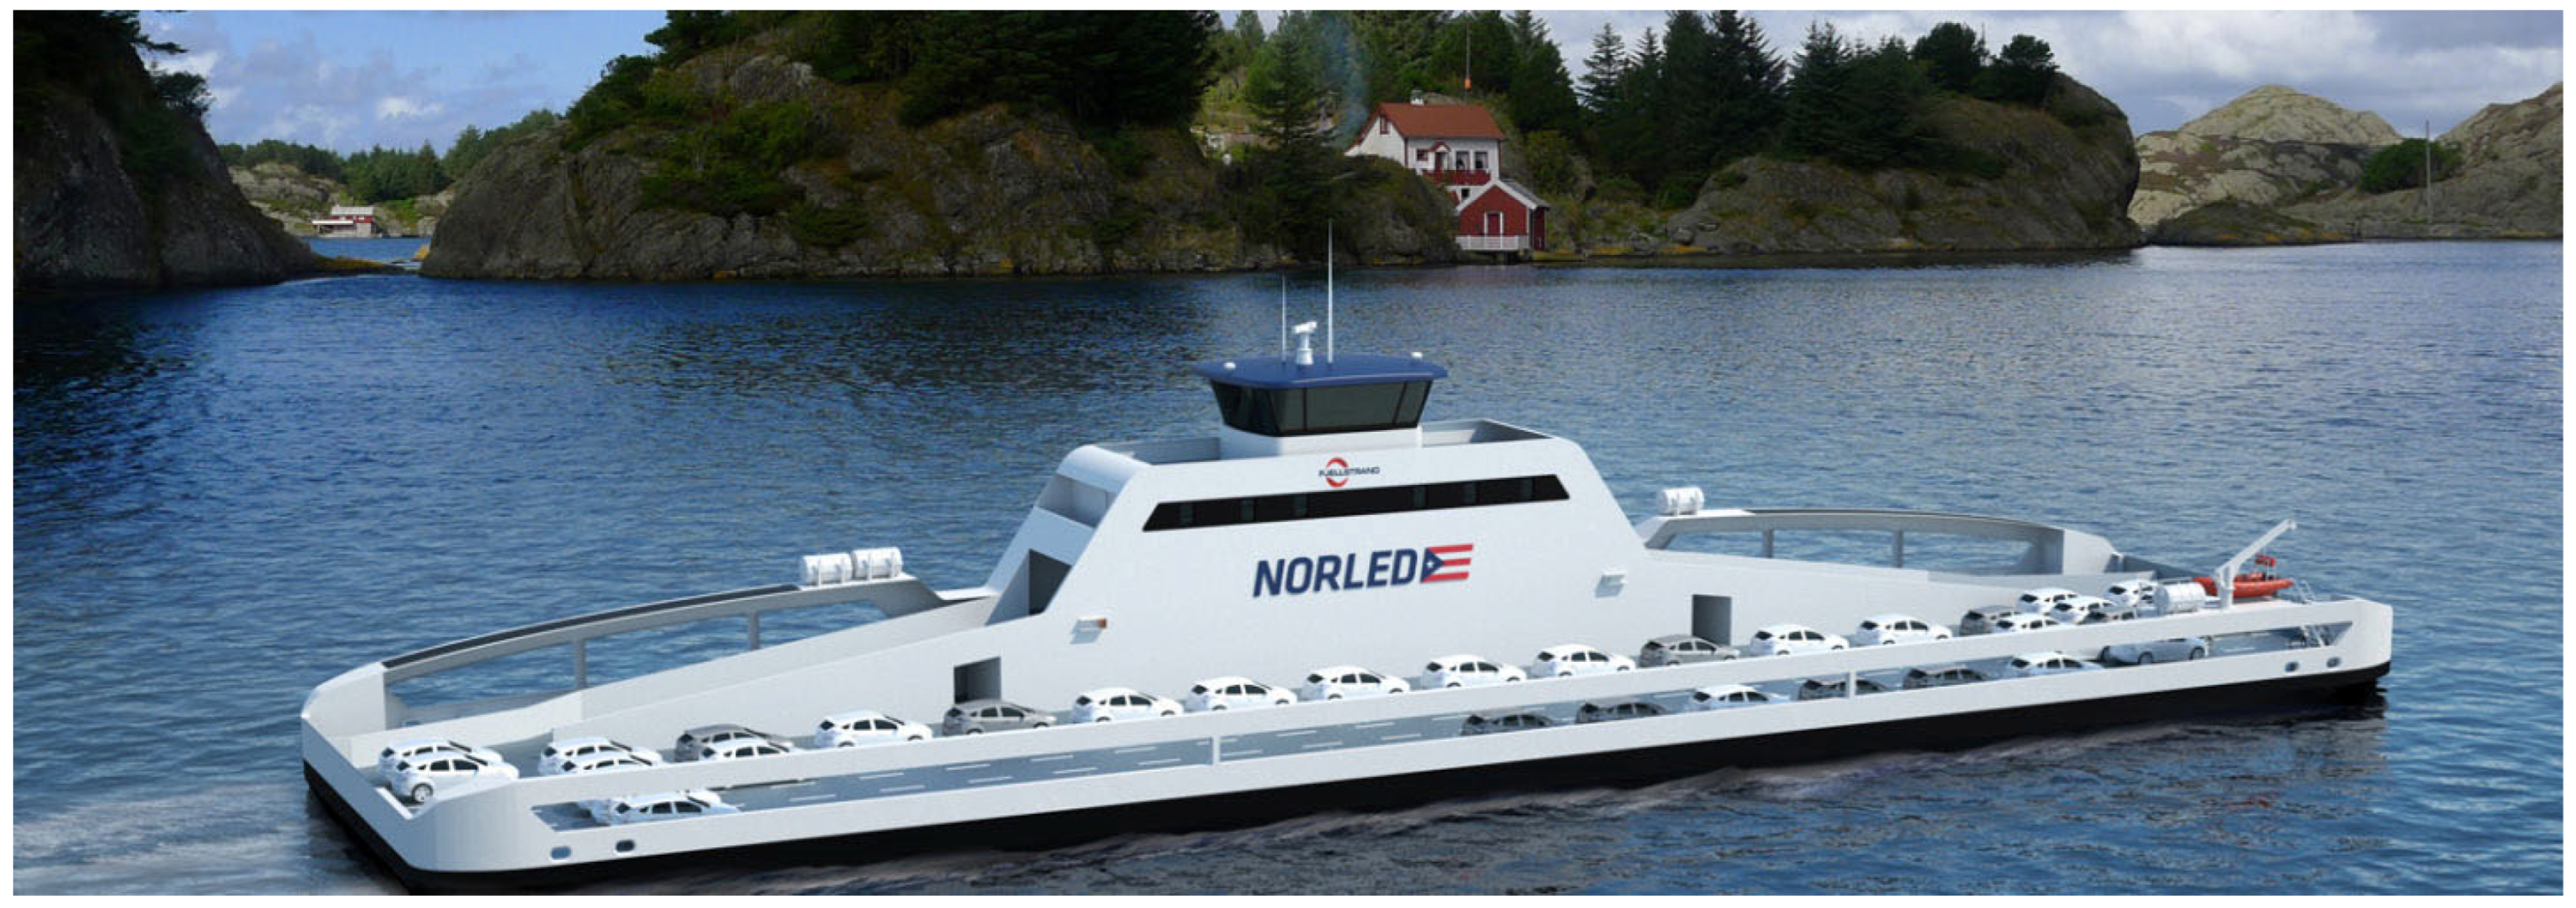
- Marine Insight. ZeroCat 120—World’s First Electric Ferry Receives Ship of the Year 2014 Award. 16 January 2017. Available online: https://www.marineinsight.com/shipping-news/dnv-gl-classed-ampere-worlds-first-fully-electric-vessel-receives-seatrade-award/ (accessed on 9 March 2022).
- Passenger Ship Technology. Commuter Craft Prototype Creates No Emissions. 2012. Available online: https://www.stirlingdesign.fr/presses/articles/stirling_design_lorient_passenger-ship-technology_10_2012.pdf (accessed on 9 March 2022).
- Phys.org. Novel Photocatalyst Effectively Turns Carbon Dioxide into Methane Fuel with Light. 2 February 2021. Available online: https://phys.org/news/2021-02-photocatalyst-effectively-carbon-dioxide-methane.html (accessed on 9 March 2022).
- Exxon Mobil. Searching the Globe for Global Solutions: CCS. 13 August 2020. Available online: https://energyfactor.exxonmobil.eu/science-technology/co2-capture/?gclid=CjwKCAiAsaOBBhA4EiwAo0_AnGo3Nq0ej8p-s6bgrcmlsLLF3fZ-tOfXdqbeRw_37GeYCHz6JNdHQxoC4UgQAvD_BwE (accessed on 9 March 2022).
- The Zerocat 120. Available online: https://www.greencarcongress.com/2013/01/zerocat-20130111.html (accessed on 19 October 2022).
- Lin, B.; Lin, C.Y. Compliance with international emission regulations: Reducing the air pollution from merchant vessels. Marine Policy 2006, 30, 220–225. [Google Scholar] [CrossRef]
- Seddiek, I.S.; Elgohary, M.M. Eco-friendly selection of ship emissions reduction strategies with emphasis on SOx and NOx emissions. Int. J. Naval Arch. Ocean Eng. 2014, 6, 737–748. [Google Scholar] [CrossRef]
- Ni, P.; Wang, X.; Li, H. A review on regulations, current status, effects and reduction strategies of emissions for marine diesel engines. Fuel 2020, 279, 118477. [Google Scholar] [CrossRef]
- Vu, P.H.; Nishida, O.; Fujita, H.; Harano, W.; Toyoshima, N.; Iteya, M. Reduction of NOx and PM from Diesel Engines by WPD Emulsified Fuel; SAE Technical Paper No. 2001-01-0152; SAE International: Warrendale, PA, USA, 2001. [Google Scholar]
- Zhou, S.; Liu, Y.; Zhou, J.X. A Study on Exhaust Gas Emission Control Technology of Marine Diesel Engine. Adv. Mater. Res. 2014, 864, 1804–1809. [Google Scholar] [CrossRef]
- Wartsila Engines. Wartsila 20DF Four-Stroke Dual-Fuel Engine; Report; Wartsila: Helsinki, Finland, 2017; Available online: https://cdn.wartsila.com/docs/default-source/product-files/engines/df-engine/brochure-o-e-w20df.pdf?utm_source=engines&utm_medium=dfengines&utm_term=w20df&utm_content=brochure&utm_campaign=msleadscoring (accessed on 9 March 2022).
- Bedford, F.; Rutland, C.; Dittrich, P.; Raab, A.; Wirbeleit, F. Effects of Direct Water Injection on DI Diesel Engine Combustion. SAE Pap. 2000, 1, 2938. [Google Scholar]
- Kovacs, D.; Eilts, P. Potentials of the Miller Cycle on HD Diesel Engines Regarding Performance Increase and Reduction of Emissions; No. 2015-24-2440; SAE International: Warrendale, PA, USA, 2015. [Google Scholar]
- Goldsworthy, L. Design of Ship Engines for Reduced Emission of Oxides Nitrogen. In Engineering a Sustainable Future Conference Proceeding; Australian Maritime College, Launceston: Newnham, Australia, 2002. [Google Scholar]
- Geist, M. Sulzer RTA-8T Engines: Compact Two Stroke for Tankers and Bulk Carriers; Report; Wartsila NSD Switzerland Ltd.: Winterthur, Switzerland, 1998. [Google Scholar]
- Hountalas, D.T.; Mavropoulos, G.C.; Binder, K.B. Effect of exhaust gas recirculation (EGR) temperature for various EGR rates on heavy duty DI diesel engine performance and emissions. Energy 2008, 33, 272–283. [Google Scholar] [CrossRef]
- Saravanan, S. Effect of exhaust gas recirculation (EGR) on performance and emissions of a constant speed DI diesel engine fueled with pentanol/diesel blends. Fuel 2015, 160, 217–226. [Google Scholar]
- Tripathi, G.; Dhar, A.; Sadiki, A. Recent advancements in after-treatment technology for internal combustion engines—An Overview. In Advances in Internal Combustion Engine Research. Energy, Environment, and Sustainability; Springer: Singapore, 2018; pp. 159–179. [Google Scholar]
- Yuan, X.; Liu, H.; Gao, Y. Diesel engine SCR control: Current development and future challenges. Emiss. Control. Sci. Technol. 2015, 1, 121–133. [Google Scholar] [CrossRef]
- Lu, X.; Geng, P.; Chen, Y. NOx emission reduction technology for marine engine based on Tier-III: A review. J. Therm. Sci. 2020, 29, 1242–1268. [Google Scholar] [CrossRef]
- Wang, Z.; Kuang, H.; Zhang, J.; Chu, L.; Ji, Y. Nitrogen oxide removal by non-thermal plasma for marine diesel engines. RSC Adv. 2019, 9, 5402–5416. [Google Scholar] [CrossRef]
- Wang, P.; Gu, W.; Lei, L.; Cai, Y.; Li, Z. Micro-structural and components evolution mechanism of particular matter from diesel engines with non-thermal plasma technology. Appl. Therm. Eng. 2015, 91, 1–10. [Google Scholar] [CrossRef]
- Chae, J.O. Non-thermal plasma for diesel exhaust treatment. J. Electrost. 2003, 57, 251–262. [Google Scholar] [CrossRef]
- Manivannan, N.; Balachandran, W.; Beleca, R.; Abbod, M. Non-thermal plasma technology for the abatement of NOx and SOx from the exhaust of marine diesel engine. J. Clean Energy Technol. 2014, 2, 233–236. [Google Scholar] [CrossRef]
- Fridell, E.; Salo, K. Measurements of abatement of particles and exhaust gases in a marine gas scrubber. Proc. Inst. Mech. Eng. Part M J. Eng. Marit. Environ. 2016, 230, 154–162. [Google Scholar] [CrossRef]
- Lee, B.K.; Mohan, B.R.; Byeon, S.H.; Lim, K.S.; Hong, E.P. Evaluating the performance of a turbulent wet scrubber for scrubbing particulate matter. J. Air Waste Manag. Assoc. 2013, 63, 499–506. [Google Scholar] [CrossRef]
- Lee, C.-Y.; Lee, H.L.; Zhang, J. The impact of slow ocean steaming on delivery reliability and fuel consumption. Transp. Res. Part E 2015, 76, 176–190. [Google Scholar] [CrossRef]
- Maloni, M.; Paul, J.A.; Gligor, D.M. Slow steaming impacts on ocean carriers and shippers. Marit. Econ. Logist. 2013, 15, 151–171. [Google Scholar] [CrossRef]
- Eide, M.S.; Endresen, Ø.; Skjong, R.; Longva, T.; Alvik, S. Cost-Effectiveness assessment of CO2 reducing measures in shipping. Marit. Policy Manag. 2009, 36, 367–384. [Google Scholar] [CrossRef]
- Rosenthal, E. Cargo Skippers Cry, “slow speed ahead”. Int. Her. Trib. 2010, 1, 4. [Google Scholar]
- Yfantis, E.; Pariotis, E.; Zannis, T.; Katsanis, J.; Roumeliotis, I. CO2 Emissions from Ships: Reduction Methods and Technologies. In Proceedings of the International Conference “Energy in Transportation 2016”, Athens, Greece, 12 November 2016. [Google Scholar]
- Issa, M.; Ibrahim, H.; Hosni, H.; Ilinca, A.; Rezkallah, M. Effects of Low Charge and Environmental Conditions on Diesel Generators Operation. Energy 2020, 1, 137–152. [Google Scholar] [CrossRef]
- Lu, Y.; Chang, X.; Hu, A.-K. A hydrodynamic optimization design methodology for a ship bulbous bow under multiple operating conditions. Eng. Appl. Comput. Fluid Mech. 2016, 10, 330–345. [Google Scholar] [CrossRef]
- Siemens. Advanced Hydrodynamic Simulations for Vessel Performance and Safety. Available online: https://www.plm.automation.siemens.com/global/en/industries/marine/hydrodynamics.html (accessed on 29 March 2022).
- Willsher, J. The Effect of Biocide Free Foul Release Systems on Vessel Performance; International Paint Ltd.: London, UK, 2008. [Google Scholar]
- TheNavalArch. Bulbous Bows—History and Design. 9 May 2020. Available online: https://thenavalarch.com/bulbous-bowshistory-and-design/ (accessed on 3 February 2022).
- Almeida, R. Part 1: How to Design a More Efficient Ship. 4 January 2012. Available online: https://gcaptain.com/part-design-efficient-ship/#:~{}:text=Finding%20the%20optimum%20length%20and,negative%20effect%20on%20total%20resistance (accessed on 9 February 2022).
- Babicz, J. Wärtsilä Encyclopedia of Ship Technology, 2nd ed.; Wärtsilä: Helsinki, Finland, 2015. [Google Scholar]
- Fotopoulos, A.G.; Margaris, D.P. Computational analysis of air lubrication system for commercial shipping and impacts on fuel consumption. Computation 2020, 8, 38. [Google Scholar] [CrossRef]
- ABS. Air Lubrication Technology; American Bureau of Shipping: Houston, TX, USA, 2019. [Google Scholar]
- GCaptain. Floating on Air-DK Group Receives First Order for Air Cavity System, 5 March 2012. Available online: https://gcaptain.com/floating-group-receives-order/ (accessed on 29 March 2022).
- Hamed, A. Multi-objective optimization method of trimaran hull form for resistance reduction and propeller intake flow improvement. Ocean. Eng. 2022, 244, 110352. [Google Scholar] [CrossRef]
- Roshan, F.; Dashtimanesh, A.; Tavakoli, S.; Niazmand, R.; Abyn, H. Hull–propeller interaction for planing boats: A numerical study. Ships Offshore Struct. 2021, 16, 955–967. [Google Scholar] [CrossRef]
- Knutsson, D.; Larsson, L. Large area propellers. In Proceedings of the SMP’11 Symposium on Marine Propulsors, Hamburg, Germany, 15–17 June 2011. [Google Scholar]
- Song, S.; Demirel, Y.K.; Atlar, M. Penalty of hull and propeller fouling on ship self-propulsion performance. Appl. Ocean. Res. 2020, 94, 102006. [Google Scholar] [CrossRef]
- Zeraatgar, H.; Ghaemi, M.H. The analysis of overall ship fuel consumption in acceleration manoeuvre using hull-propeller-engine interaction principles and governor features. Pol. Marit. Res. 2019, 26, 162–173. [Google Scholar] [CrossRef]
- Senary, K.; Tawfik, A.; Hegazy, E.; Ali, A. Development of a waste heat recovery system onboard LNG carrier to meet IMO regulations. Alex. Eng. J. 2016, 55, 1951–1960. [Google Scholar] [CrossRef]
- Zhu, S.; Zhang, K.; Deng, K. A review of waste heat recovery from the marine engine with highly efficient bottoming power cycles. Renew. Sustain. Energy Rev. 2020, 120, 109611. [Google Scholar] [CrossRef]
- Singh, D.V.; Pedersen, E. A review of waste heat recovery technologies for maritime applications. Energy Convers. Manag. 2016, 111, 315–328. [Google Scholar] [CrossRef]
- MAN Diesel and Turbo. Thermo Efficiency System for Reduction of Fuel Consumption and CO2; MAN Diesel and Turbo: Copenhagen, Denmark, 2014. [Google Scholar]
- Wärtsilä. Boosting Energy Efficiency, Energy Efficiency Catalogue; Wärtsilä: Helsinki, Finland, 2008. [Google Scholar]
- Siemens. SISHIPCIS Boost Hybrid Propulsion with Waste Heat Recovery, Product Sheet: Completely Integrated Solutions for Cargo Vessels; Siemens: Munich, Germany, 2009. [Google Scholar]
- Baldi, F.; Gabrielii, C. A feasibility analysis of waste heat recovery systems for marine applications. Energy 2015, 80, 654–665. [Google Scholar] [CrossRef]
- Sprouse, C.I.; Depcik, C. Review of organic Rankine cycles for internal combustion engine exhaust waste heat recovery. Appl. Therm. Eng. 2013, 51, 711–722. [Google Scholar] [CrossRef]
- Jian, Z.; Shiqiang, Z.; Xizhang, C. Impact upon navigation conditions of river reach between the two dams by peak shaving at Three Gorges hydropower station. Procedia Eng. 2012, 28, 152–160. [Google Scholar] [CrossRef]
- Godjevac, M.; Mestemaker, B.T.W.; Visser, K.; Lyu, Z.; Boonen, E.J.; van der Veen, F.; Malikouti, C. Electrical energy storage for dynamic positiong operations: Investigation of three application case. In Proceedings of the 2017 IEEE Electric Ship Technologies Symposium (ESTS), Arlington, VA, USA, 15–17 August 2017; IEEE: Piscataway, NJ, USA, 2017; pp. 182–186. [Google Scholar]
- Mutarraf, M.U.; Terriche, Y.; Niazi, K.A.K.; Vasquez, J.C.; Guerrero, J.M. Energy storage systems for shipboard microgrids—A review. Energies 2018, 11, 3492. [Google Scholar] [CrossRef]
- Vessel Performance Optimisation (VPO). Peak Shaving Improves Energy Efficiency up to 20 Percent. 25 June 2019. Available online: https://vpoglobal.com/2019/06/25/peak-shaving-improves-energy-efficiency-up-to-20-per-cent/ (accessed on 29 March 2022).
- Moller-Maersk, A.P. 2018 Sustainability Report; A.P. Moller-Maersk: Copenhagen, Denmark, 2018. [Google Scholar]
- Zis, T.P.; Psaraftis, H.N.; Ding, L. Ship weather routing: A taxonomy and survey. Ocean. Eng. 2020, 213, 107697. [Google Scholar] [CrossRef]
- Veneti, A.; Makrygiorgos, A.; Konstantopoulos, C.; Pantziou, G.; Vetsikas, I.A. Minimizing the fuel consumption and the risk in maritime transportation: A bi-objective weather routing approach. Comput. Oper. Res. 2017, 88, 220–236. [Google Scholar] [CrossRef]
- Simonsen, M.H.; Larsson, E.; Mao, W.; Ringsberg, J.W. State-of-the-art within ship weather routing. In Proceedings of the International Conference on Offshore Mechanics and Arctic Engineering, St. John's, NL, Canada, 31 May–5 June 2015; American Society of Mechanical Engineers: New York, NY, USA, 2015; Volume 56499, p. V003T02A053. [Google Scholar]
- United Nations Conference on Trade and Development, UNCTAD, Geneva, Review of Maritime Transport. 7 November 2016. Available online: https://unctad.org/system/files/official-document/rmt2016_en.pdf (accessed on 5 October 2022).
- DNV GL. Low Carbon Shipping towards 2050. 2017. Available online: https://www.dnv.com/Publications/low-carbon-shipping-towards-2050-93579#:~:text=Shipping%20will%20be%20expected%20to,into%20a%20low%20carbon%20future. (accessed on 7 October 2022).
- Brewer, T.L. Black carbon emissions and regulatory policies in transportation. Energy Policy 2019, 129, 1047–1055. [Google Scholar] [CrossRef]
- Wisdom Events. Bio-LNG to Overtake Traditional LNG? 2017. Available online: https://www.thormarinetrading.com/news-posts/bio-lng-overtake-traditional-lng/ (accessed on 1 September 2022).
- European Commission (EC). Reducing Emissions from the Shipping Sector. 2016. Available online: https://climate.ec.europa.eu/eu-action/transport-emissions/reducing-emissions-shipping-sector_en#delivering-the-european-green-deal-with-maritime-transport (accessed on 5 October 2022).
- US Environmental Protection Agency (EPA)–Part II. Control of Emissions From New Marine Compression-Ignition Engines at or Above 30 Liters per Cylinder, 30 April 2010. Federal Register/Vol.75, No.83. Available online: https://www.govinfo.gov/content/pkg/FR-2010-04-30/pdf/2010-2534.pdf (accessed on 5 October 2022).
- Brewer, T.L. Arctic Black Carbon from Shipping: A Club Approach to Climate and Trade Governance; Issue Paper; ICTSD: Geneva, Switzerland, 2015; p. 4. [Google Scholar]
- Brewer, T.L. Black Carbon Problems in Transportation: Technological Solutions and Governmental Policy Solutions. In Proceedings of the MIT CEEPR Conference, Paris, France, 7 June 2017. [Google Scholar]
- Romppanen, S. Arctic climate governance via EU law on black carbon? Rev. Eur. Comp. Int. Environ. Law 2018, 27, 45–54. [Google Scholar] [CrossRef]
- Hou, L.; Geerlings, H. Dynamics in sustainable port and hinterland operations: A conceptual framework and simulation of sustainability measures and their effectiveness, based on an application to the Port of Shanghai. J. Clean. Prod. 2016, 135, 449–456. [Google Scholar] [CrossRef]
- Scott, M.; Van Huizen, J.; Jung, C. The Bank of England’s Response to Climate Change. Quarterly Bulletin, 2017, Q2. ISSN2399-4568. Available online: https://www.bankofengland.co.uk/-/media/boe/files/quarterly-bulletin/2017/the-banks-response-to-climate-change.pdf?la=en&hash=7DF676C781E5FAEE994C2A210A6B9EEE44879387 (accessed on 5 October 2022).
- Resolution MEPC.280(70), Annex 6 (2016). Effective Date of Implementation of the Fuel Oil Standard In Regulation 14.1.3 of MARPOL ANNEX VI. Available online: https://www.classnk.or.jp/hp/pdf/activities/statutory/soxpm/resmepc280-70.pdf (accessed on 5 October 2022).
- Garcia, B.; Foerster, A.; Lin, J. Net zero for the international shipping sector? An Analysis of the Implementation and Regulatory Challenges of the IMO Strategy on Reduction of GHG Emissions. J. Environ. Law 2021, 33, 85–112. [Google Scholar] [CrossRef]
- Board, F.S. Task Force on Climate-Related Financial Disclosures: 2019 Status Report. Available online: https://apo.org.au/organisation/97616 (accessed on 6 October 2022).
- Principles for Responsible Investment 2019. TCFD-Based Reporting to Become Mandatory for PRI Signatories in 2020. Available online: https://www.unpri.org/news-and-press/tcfd-based-reporting-to-become-mandatory-for-pri-signatories-in-2020/4116.article (accessed on 6 October 2022).
- Task Force on Climate-Related Finacial Disclosures. The Use of Scenario Analysis in Disclosure of Climate-related Risks and Opportunities. 2017. Available online: https://www.tcfdhub.org/scenario-analysis/ (accessed on 6 October 2022).
- Rust, S.; IPE. European Commission Unveils Sustainable Finance Legislative Proposals. 2018. Available online: https://www.ipe.com/european-commission-unveils-sustainable-finance-legislative-proposals-/10024869.article (accessed on 6 October 2022).
- Hainz, C.; Wackerbauer, J.; Stitteneder, T. Economic Policy Goals of the Sustainable Finance Approach: Challenges for SMEs. In Proceedings of the CESifo Forum, Munich, Germany, 3 May 2021; Ifo Institut-Leibniz-Institut für Wirtschaftsforschung an der Universität München: Munich, Germany, 2021; Volume 22, No. 03, pp. 30–33. [Google Scholar]
- Schütze, F.; Stede, J. The EU sustainable finance taxonomy and its contribution to climate neutrality. J. Sustain. Financ. Invest. 2021, 1–33. [Google Scholar] [CrossRef]
- Shi, W.; Xiao, Y.; Chen, Z.; McLaughlin, H.; Li, K.X. Evolution of green shipping research: Themes and methods. Marit. Policy Manag. 2018, 45, 863–876. [Google Scholar] [CrossRef]
- Munim, Z.H.; Dushenko, M.; Jimenez, V.J.; Shakil, M.H.; Imset, M. Big data and artificial intelligence in the maritime industry: A bibliometric review and future research directions. Marit. Policy Manag. 2020, 47, 577–597. [Google Scholar] [CrossRef]


| Consequences | Pollutants | ||
|---|---|---|---|
| SOX | NOX | CO2 | |
| Greenhouse effect | - | - | ✓ |
| Ozone-ground level | - | ✓ | - |
| Acid rain | ✓ | ✓ | - |
| Linked-up with: | |||
| Fuel combustion | ✓ | ✓ | ✓ |
| Cargo handling | - | - | - |
| Ships equipment | - | - | - |
| Incinerators | ✓ | ✓ | ✓ |
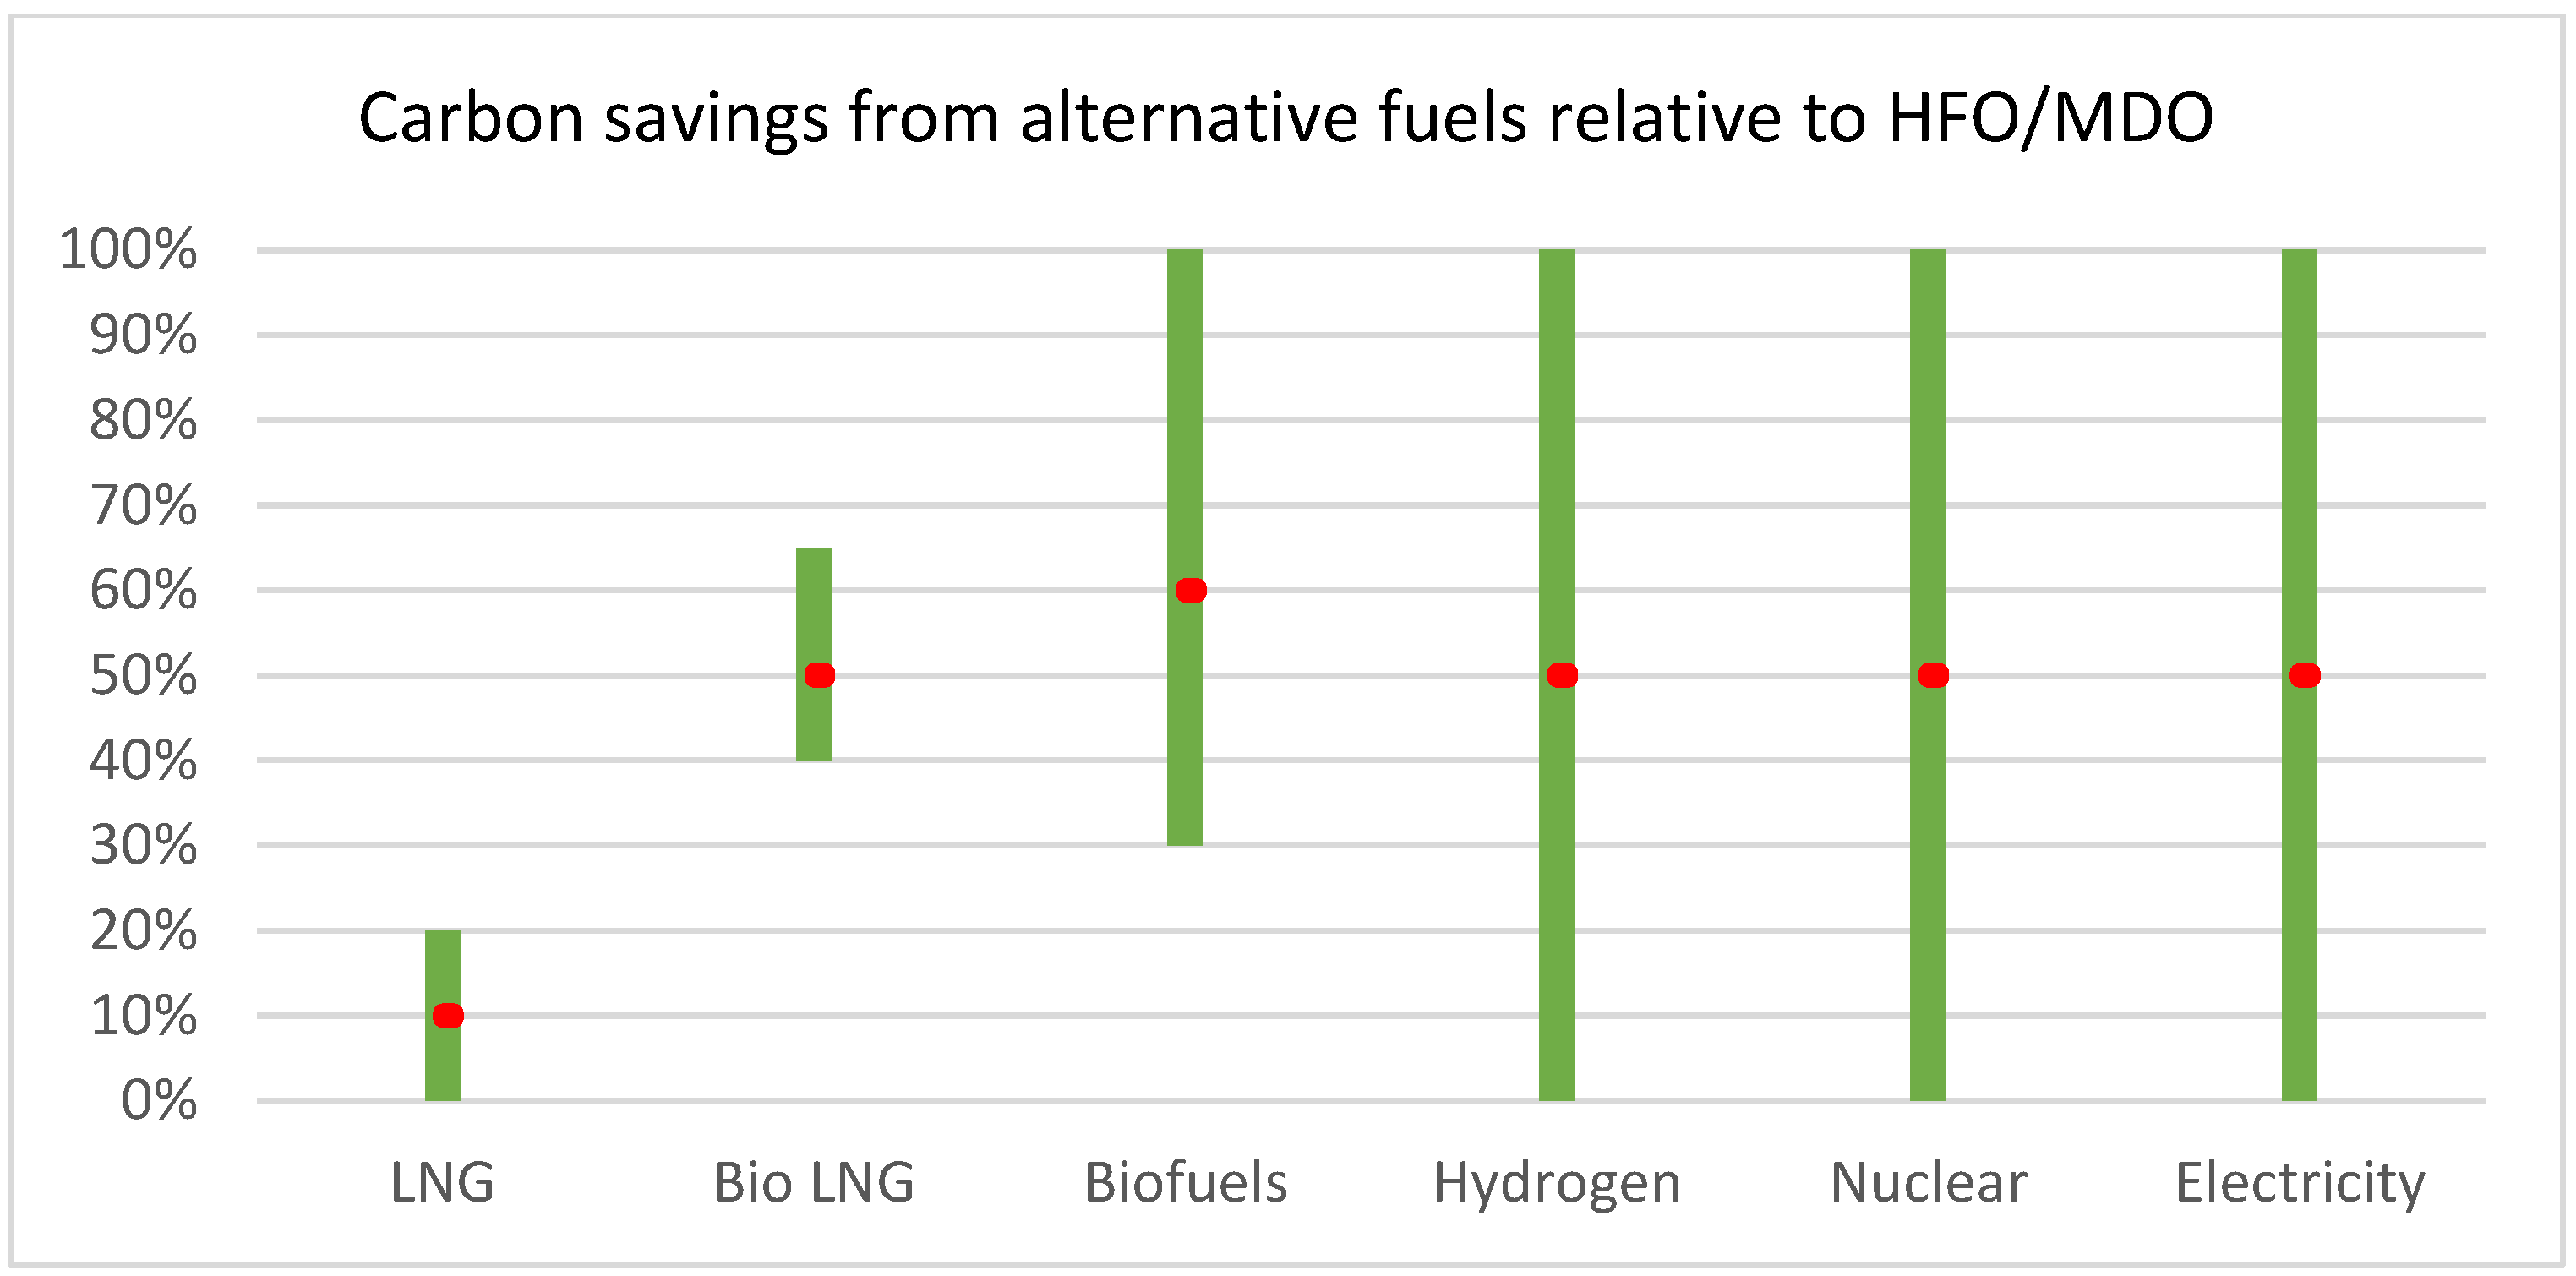
| Types of Alternative Fuels | CO2 Emissions Reductions |
|---|---|
| LNG | 0–20% |
| Ammonia | 0–100% |
| Biofuels | 25–100% |
| Hydrogen | 0–100% |
| Fuel cells | 2–20% |
| Wind | 1–32% |
| Solar | 0–12% |
| Nuclear | 0–100% |
| Electricity | 0–100% |
| Alternative Fuels | Advantages | Disadvantages |
|---|---|---|
| LNG |
|
|
| Hydrogen |
|
|
| Ammonia |
|
|
| Biofuels |
|
|
| Electricity stored in batteries |
|
|
| Fuel Cell Type | Project/Vessel Name | Fuel | Capacity |
|---|---|---|---|
| Solid Oxide Fuel Cell | Felicitas subproject 2 | LNG | 250 kW |
| METHAPU Undine | Methanol | 20 kW | |
| SchIBZMS Forester | Diesel | 100 kW | |
| High Temperature Proton Exchange Membrane Fuel Cells (HT-PEMFC) | RiverCell | Methanol | 250 kW |
| Pa-X-ell MS Mariella | Methanol | 2 × 30 kW | |
| RiverCell ELEKTRA | H2 | 3 × 100 kW | |
| MF Vågen | H2 | 12 kW | |
| Molten Carbonate Fuel Cell (MCFC) | MC WAP | Diesel | 150/500 kW |
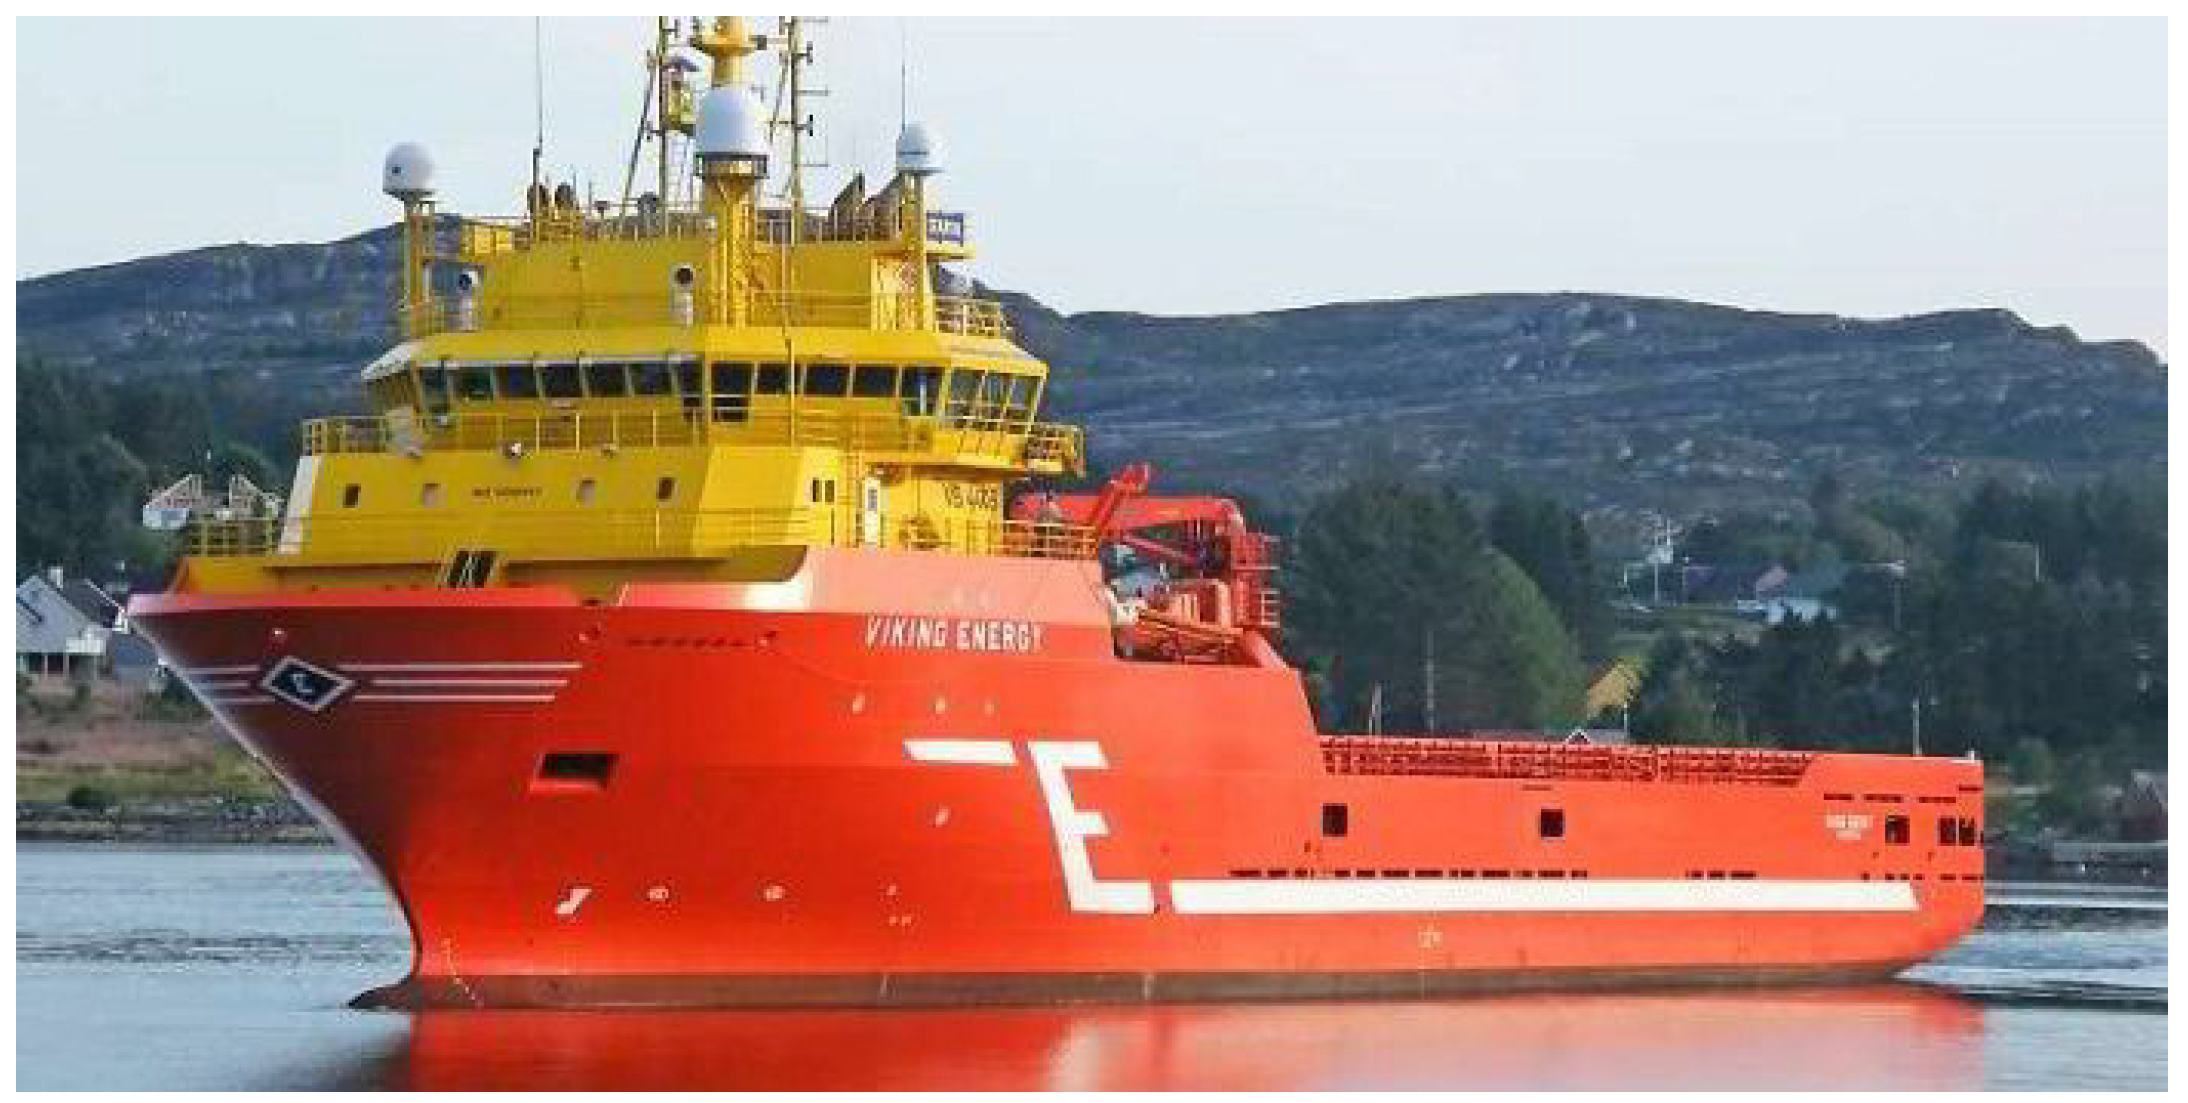
| FelloShip Viking Lady | LNG | 320 kW | |
| US SSFC | Diesel | 625 kW | |
| Alkaline Fuel Cell (AFC) | Hydra | Metal hybride | 6.9 kW |
| HydroCell Oy | Metal hybride | 30 kW | |
| Low-temperature proton exchange membrane fuel cell | Elding | H2 | 10 kW |
| Zemship Alsterwasser | H2 | 96 kW | |
| Hydrogenesis | H2 | 12 kW | |
| SF-BREEZE | H2 | 120 kW | |
| Cobalt 233 Zet | H2 | 50 kW | |
| US SSFC | Diesel | 500 kW |
Publisher’s Note: MDPI stays neutral with regard to jurisdictional claims in published maps and institutional affiliations. |
© 2022 by the authors. Licensee MDPI, Basel, Switzerland. This article is an open access article distributed under the terms and conditions of the Creative Commons Attribution (CC BY) license (https://creativecommons.org/licenses/by/4.0/).
Share and Cite
Issa, M.; Ilinca, A.; Martini, F. Ship Energy Efficiency and Maritime Sector Initiatives to Reduce Carbon Emissions. Energies 2022, 15, 7910. https://doi.org/10.3390/en15217910
Issa M, Ilinca A, Martini F. Ship Energy Efficiency and Maritime Sector Initiatives to Reduce Carbon Emissions. Energies. 2022; 15(21):7910. https://doi.org/10.3390/en15217910
Chicago/Turabian StyleIssa, Mohamad, Adrian Ilinca, and Fahed Martini. 2022. "Ship Energy Efficiency and Maritime Sector Initiatives to Reduce Carbon Emissions" Energies 15, no. 21: 7910. https://doi.org/10.3390/en15217910
APA StyleIssa, M., Ilinca, A., & Martini, F. (2022). Ship Energy Efficiency and Maritime Sector Initiatives to Reduce Carbon Emissions. Energies, 15(21), 7910. https://doi.org/10.3390/en15217910