Article

Physiological and Transcriptomic Analyses Reveal the Effects of Elevated Root-Zone CO2 on the Metabolism of Sugars and Starch in the Roots of Oriental Melon Seedlings

1
College of Horticulture, Shenyang Agricultural University, Shenyang 110866, China
2
Key Laboratory of Protected Horticulture Ministry of Education, Shenyang 110866, China
3
National & Local Joint Engineering Research Center of Northern Horticultural Facilities Design & Application Technology, Shenyang 110866, China
*
Authors to whom correspondence should be addressed.
Int. J. Mol. Sci. 2022, 23(20), 12537; https://doi.org/10.3390/ijms232012537
Submission received: 27 September 2022 / Revised: 16 October 2022 / Accepted: 17 October 2022 / Published: 19 October 2022
(This article belongs to the Special Issue Stress Physiology and Molecular Biology of Fruit Crops)

Abstract

:
Root-zone CO2 is a major factor that affects crop growth, development, nutrient uptake, and metabolism. Oriental melon is affected by root-zone gases during growth, the microstructure, sugar and starch contents, enzymatic activities related to sugar and starch metabolism, and gene expression in the roots of oriental melon seedlings were investigated under three root-zone CO2 concentrations (CK: 0.2%, T1: 0.4%, T2: 1.1%). Elevated root-zone CO2 altered the cellular microstructure, accelerated the accumulation and release of starch grains, disrupted organelle formation, and accelerated root senescence. The sugar and starch contents and metabolic activity in the roots increased within a short duration following treatment. Compared to the control, 232 and 1492 differentially expressed genes (DEGs) were identified on the 6th day of treatment in T1 and T2 plants, respectively. The DEGs were enriched in three metabolic pathways. The majority of genes related to sucrose and starch hydrolysis were upregulated, while the genes related to sucrose metabolism were downregulated. The study revealed that oriental melon seedlings adapt to elevated root-zone CO2 stress by adjusting sugar and starch metabolism at the transcriptome level and provides new insights into the molecular mechanism underlying the response to elevated root-zone CO2 stress.

1. Introduction

CO2 concentration in soils is usually determined by soil CO2 production and the diffusivity of soils [1], which leads to variations in the CO2 concentration at different depths, soil water content, and seasons [2,3]. Owing to the respiration of plant roots and the activities of microorganisms in soils, the concentration of CO2 around plant roots is higher than the atmospheric CO2 concentration [4]. In particular, the concentration of CO2 in soils increases rapidly in agricultural production during waterlogging, soil hardening, and other adverse environmental conditions, which leads to hypoxia in plant roots [5]. The alterations in crop growth and development under elevated root-zone CO2 have been widely studied, and the results demonstrated that an increase in rhizospheric CO2 concentration can either promote or inhibit crop growth [6,7] depending on a variety of factors, including the type of crop, nutrient uptake, abiotic stresses, concentration of CO2, and the periodicity in the variations in CO2 concentration [8,9,10]. The majority of these studies have focused on the changes in crop growth; however, the effect of elevated root-zone CO2 on the underlying mechanism remains to be elucidated.
A previous study reported elevated root-zone CO2 in soils can affect the surrounding plants and soil microorganisms [11], and the CO2 that enters plants is utilized during metabolism [12]. The fixation of plant roots in the soil facilitates the uptake and transport of water and mineral nutrients, and is essential for plant metabolism [13,14]. Plants with larger roots have a greater ability to utilize photosynthetic products under elevated root-zone CO2, and the photosynthetic products that are allocated to the roots can effectively promote root growth and development [15]. Previous studies on tomato, lettuce, and pepper have demonstrated that elevated root-zone CO2 promotes root growth and increases biomass [8,9]. As the products of plant metabolism, sugar and starch are essential factors regulating plant growth, maturation, and senescence [16,17]. These products can also act as signals that influence the cell- and tissue-specific expression of certain genes [18]. It has been reported that the application of high concentrations of CO2 with aerated solutions inhibits the root respiration of chickpea and faba bean plants, impedes growth, and subsequently leads to the accumulation of sugar in the root tip cells [19]. However, another study demonstrated that high concentrations of CO2 in soils can significantly reduce the starch content in plant roots [20]. These findings indicate that elevated root-zone CO2 has varying effects on the contents of sugar and starch in the root tip cells of crops; however, the mechanism underlying these effects remain to be elucidated.
The oriental melon (Cucumis melo var. makuwa Makino) is an annual crop belonging to the Cucurbitaceae family and is widely cultivated in some eastern Asian countries [21]. The quality and yield of oriental melon are often reduced owing to poor root aeration during cultivation. Rhizospheric hypoxia and elevated root-zone CO2 are some of the commonly encountered stresses in agricultural production [5]. Previous studies have demonstrated that the effect of elevated root-zone CO2 on crops is more pronounced than that of oxygen depletion, especially in terms of root biomass accumulation [22]. The effects of rhizospheric hypoxia on crop growth and development have been studied extensively [5,19,23]. Previous studies on elevated root-zone CO2 have primarily focused on the growth physiology and nutrient uptake of crops; however, there is a scarcity of studies on the alterations in the contents of metabolites, including sugar and starch, especially at the transcriptomic level.
Therefore, this study aimed to investigate the alterations in the accumulation and metabolism of starch and sugar in the root system of oriental melon seedlings under elevated root-zone CO2. Three different root-zone concentrations of CO2 were selected for treatment, and the previously designed automatic root-zone gas control device was used [24]. The physiological indices of root growth, root cell microstructure, sugar and starch contents, and the activities of enzymes related to sugar and starch metabolism in the roots were determined. Finally, the differences in the physiological indicators of root growth were compared across different time intervals. The time intervals when significant differences were observed were selected for transcriptomic analysis, identification of differentially expressed genes (DEGs), and verification of the key genes with qRT-PCR. The results obtained herein provide novel insights for further studies on the accumulation and metabolism of sugar and starch in plant roots for alleviating the damage resulting from elevated root-zone CO2.

2. Results

2.1. Elevated Root-Zone CO2 Affects Root Growth and Vigor

The results demonstrated that the root growth indices tended to increase with the prolongation of treatment duration (Table 1). The total root length, root surface area, root volume, root vigor, and number of root tips increased significantly following exposure to elevated root-zone CO2 on the 3rd and 6th days of treatment, compared to those of the control. However, these factors decreased significantly when the duration of treatment was prolonged in the T1 and T2 treatment groups. Elevated root-zone CO2 decreased the root surface area on the 6th day of T1 and T2 treatment groups compared to that of the control. In addition, the total root volume of the seedlings in the T1 group increased while that of the T2 seedling decreased significantly on the 9th day of treatment compared to that of the control. The number of root tips with a diameter of 0.0–0.5 mm was significantly higher in T1 seedlings but significantly lower in T2 plants compared to that of the control. Compared to those of the control, all the indices of root growth decreased significantly on the 12th and 15th days of exposure to elevated root-zone CO2, and the number of root tips with a diameter of 0.0–0.5 mm decreased by 26.5% and 14.54% in T1 and T2 plants, respectively, while the number of root tips with a diameter of 0.5–2.0 mm decreased by 18.32% and 6.83% in T1 and T2 plants, respectively (p < 0.05). The findings revealed that elevated root-zone CO2 inhibits root growth with the prolongation of treatment time and consequently regulates root phenotypes via adaptive adjustment of the growth and development of root tips.

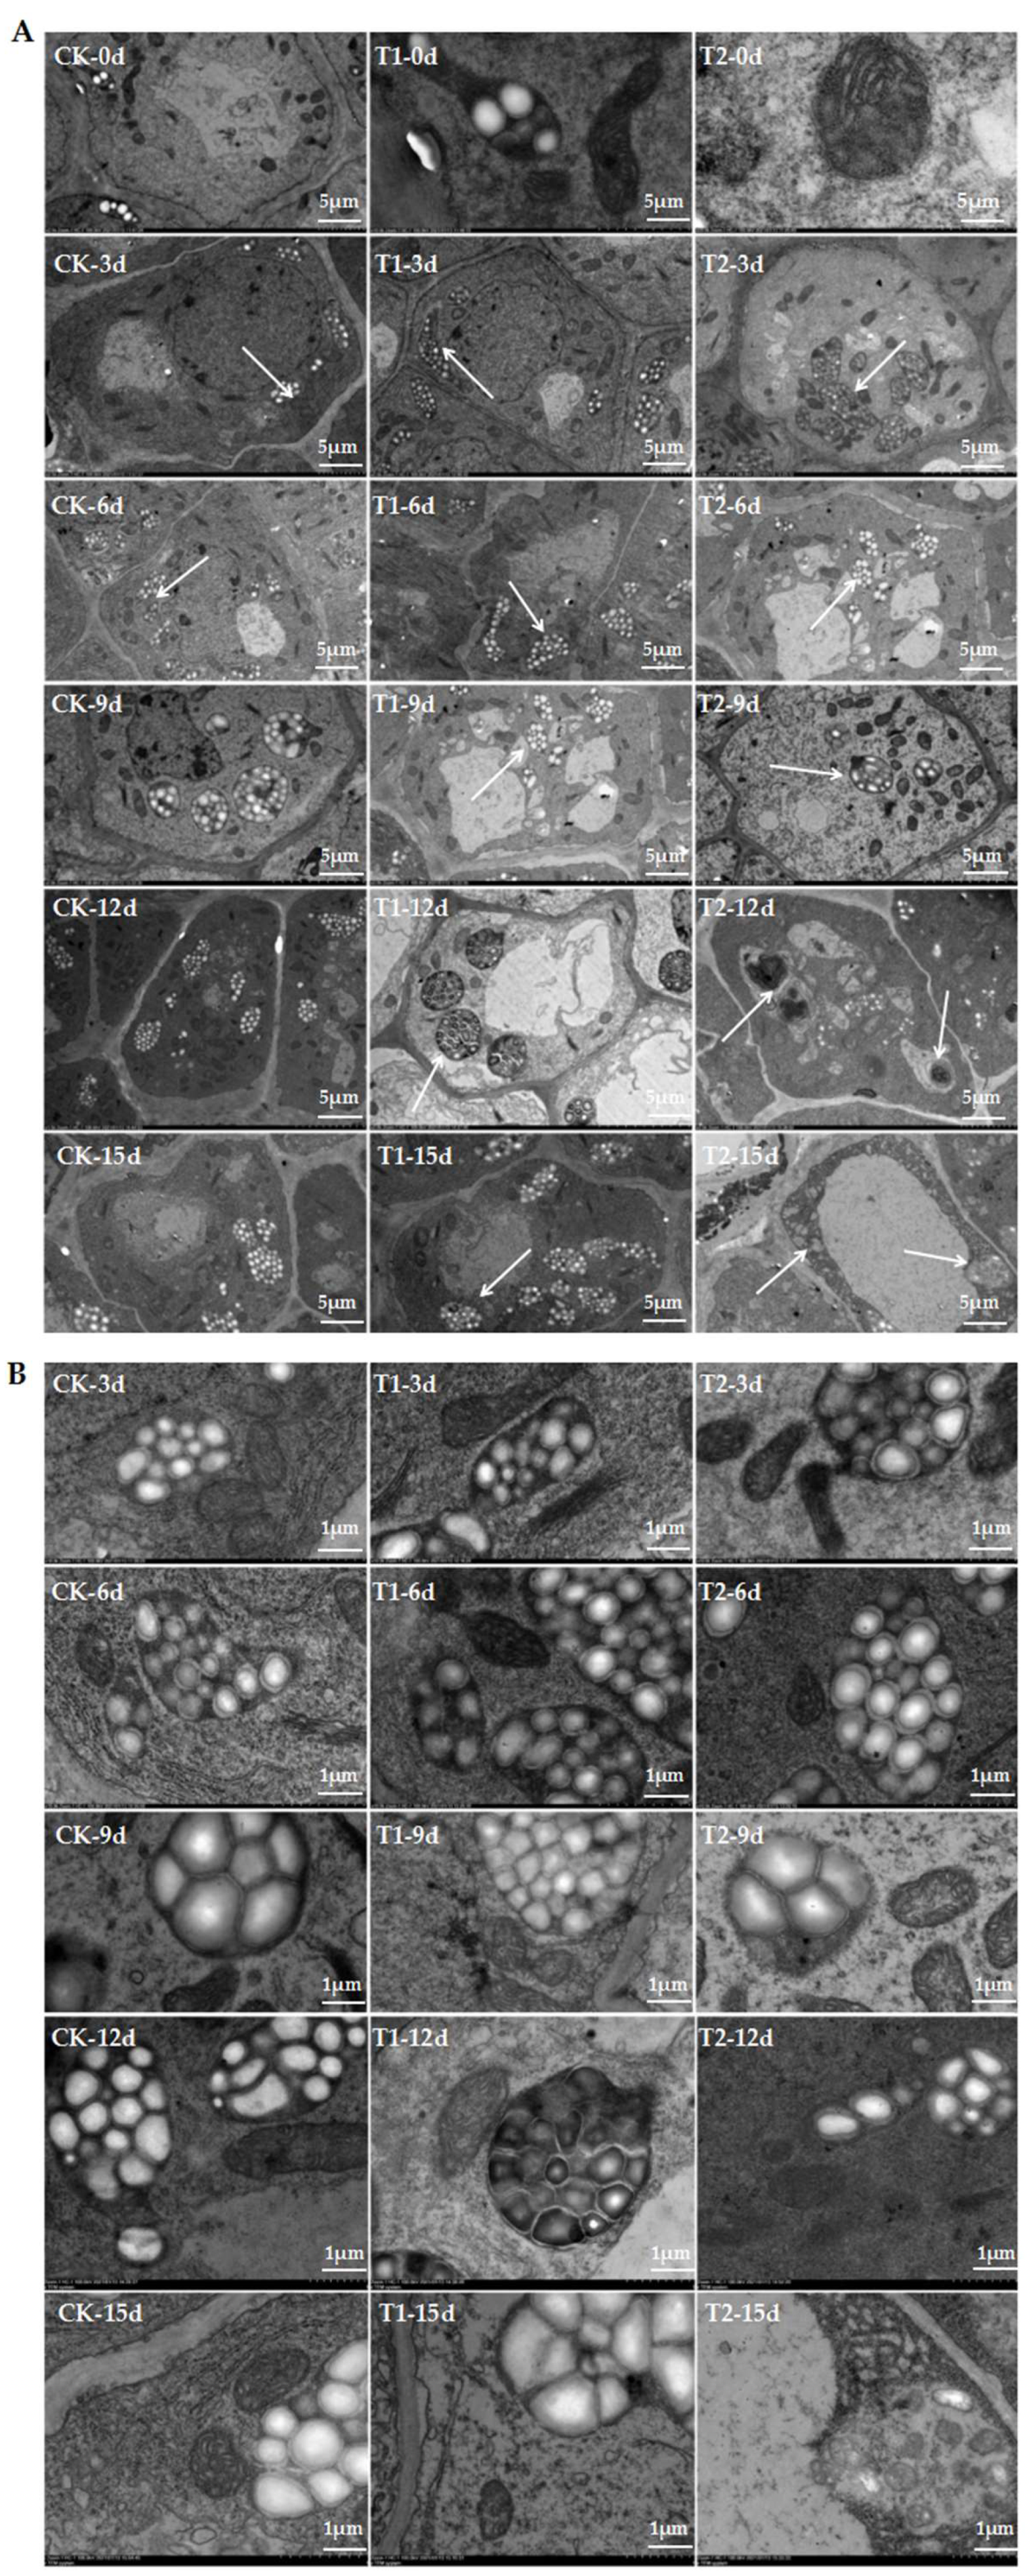
2.2. Elevated Root-Zone CO2 Affected Cellular Ultrastructure of Root Tips

The complete cell diagram depicting the ultrastructure of the root tip cells of oriental melon seedlings in the treatment and control groups is provided in Figure 1. The diagram demonstrates that the cellular structures altered significantly at the beginning of treatment in the T1 and T2 seedlings. Additionally, the mitochondria were in an active state of division at the beginning of treatment, and the number of starch grains gradually increased in the root tip cells compared to that of the control group (Figure 1A—0 d, 3 d, 6 d; Figure 1B—0 d, 3 d, 6 d). The mitochondrial membrane started dissolving and the starch grains were released with the prolongation of treatment time. The number of organelles in the T1 and T2 seedlings reduced significantly compared to that of the CK group on the 9th day of treatment. The accumulation of starch grains in the T1 group increased gradually, while the root tip cells of the T2 plants released the starch grains at the same time. The number of starch grains in T1 cells increased markedly after the 12th day of treatment, and the number of organelles, including mitochondria and Golgi, decreased markedly, while the T2 cells released the majority of starch grains at the same time and the organelles disappeared. Comparison of Figure 1A,B revealed that exposure to elevated root-zone CO2 induced the rapid accumulation of starch grains in root tip cells, while higher concentrations of CO2 induced the rapid release of starch grains and dissolution of organelles. The findings revealed that exposure to elevated root-zone CO2 affected the senescence of root tip cells and the time of release of starch grains, which could be related to sugar and starch metabolism in root tip cells, and can subsequently lead to morphological alterations in roots.

2.3. Quality Analysis of Transcriptome Sequencing Data

Quality analysis of the transcriptome sequencing data revealed significant differences among the T1, T2, and CK treatment groups on the 6th day of treatment. We therefore employed the RNA sequencing (RNA-seq) approach for analyzing the samples on the 6th day of treatment. The results of quality analysis of the original data are provided in Table 2. The quality of the library was evaluated and the gene structure level was analyzed. A total of 385.32 million original fragments and 192.66 million paired-end sequence fragment reads were obtained after filtering. The clean reads were mapped to the reference genome of the melon reference genome using the Hierarchical Indexing for Spliced Alignment of Transcripts (HISAT) and Bowtie software. Statistical analyses revealed that 93.07–94.12% of the clean reads were located in the reference melon genome. As the clean reads comprised random cDNA fragments, several random primer sequences showed preference for the 5 end of the reads. We therefore detected the distribution of base types for determining the separation of AT and GC. The GC contents determined in this study are enlisted in Table 2.

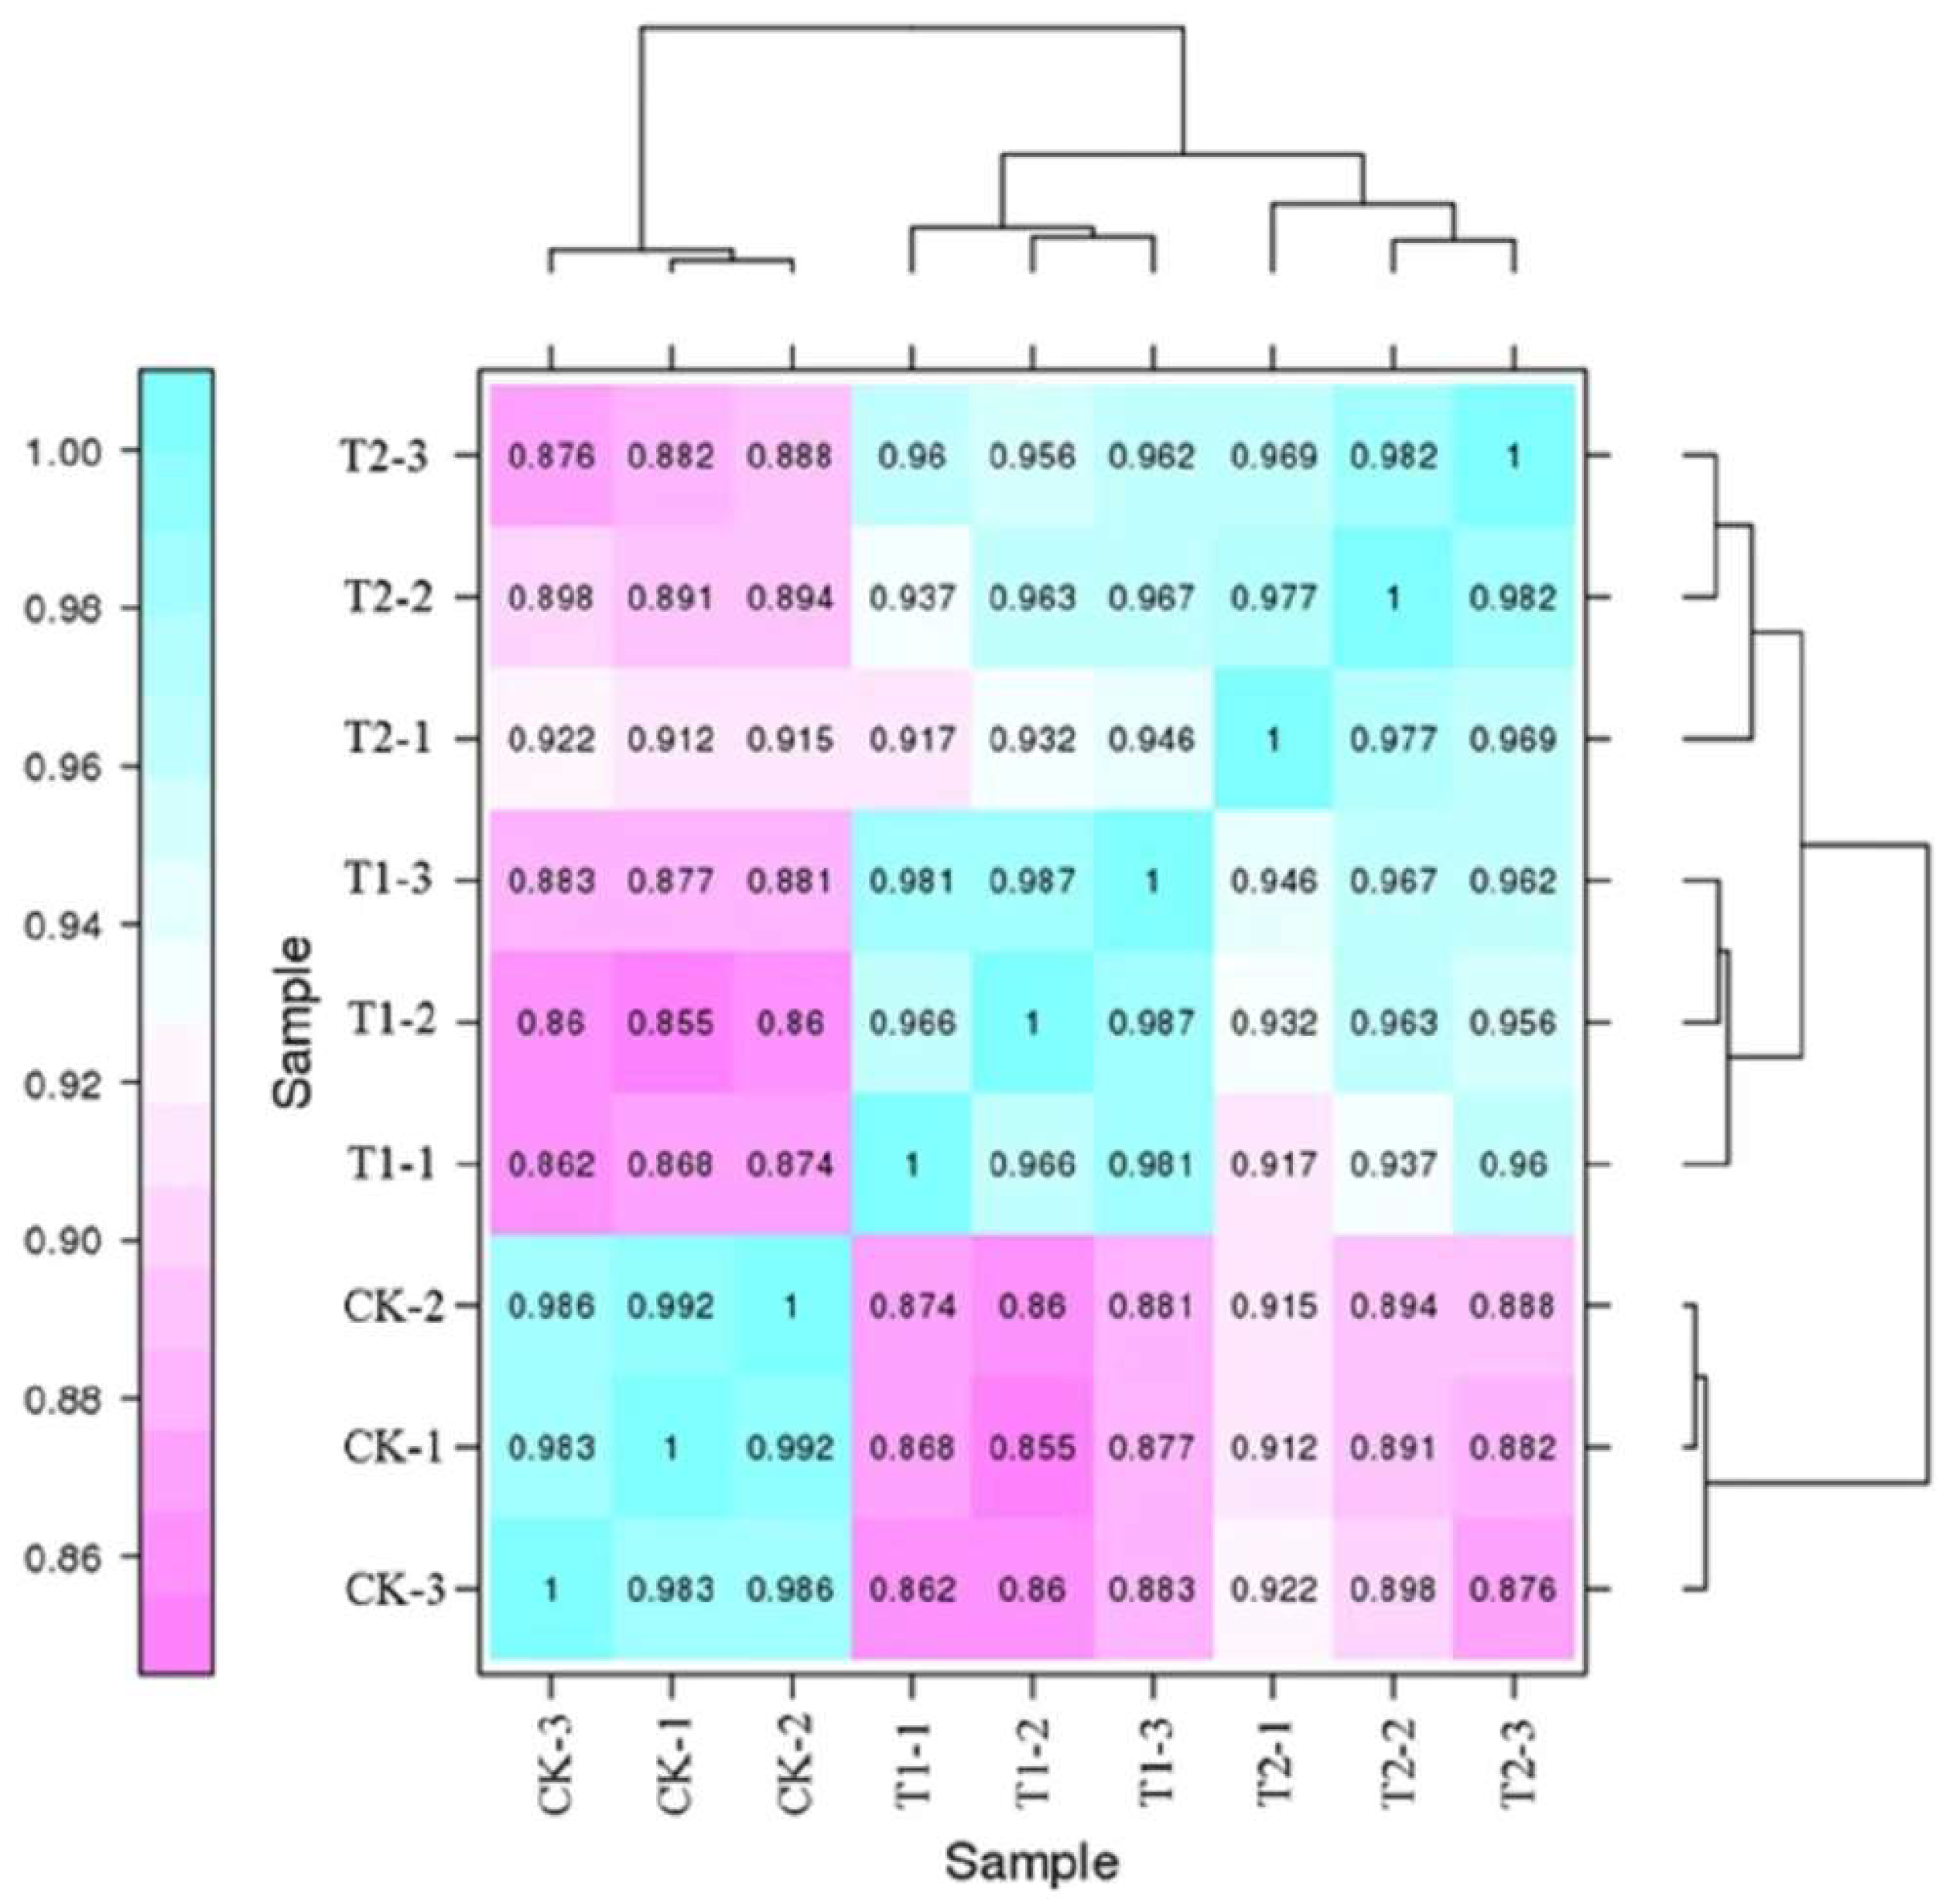
2.4. Sample Correlation Analysis

A statistical chart depicting the correlation among the nine groups of genes is provided in Figure 2, and the colors indicate the correlation between the samples. Heat map analysis revealed that the correlation coefficients between the treatments at same concentrations of CO2 were close to 1, and the correlation between the T1 and T2 samples was also high. The results demonstrated that the gene expression level in the roots of oriental melon seedlings was similar under elevated root-zone CO2 stress, and the underlying mechanism was subsequently analyzed.

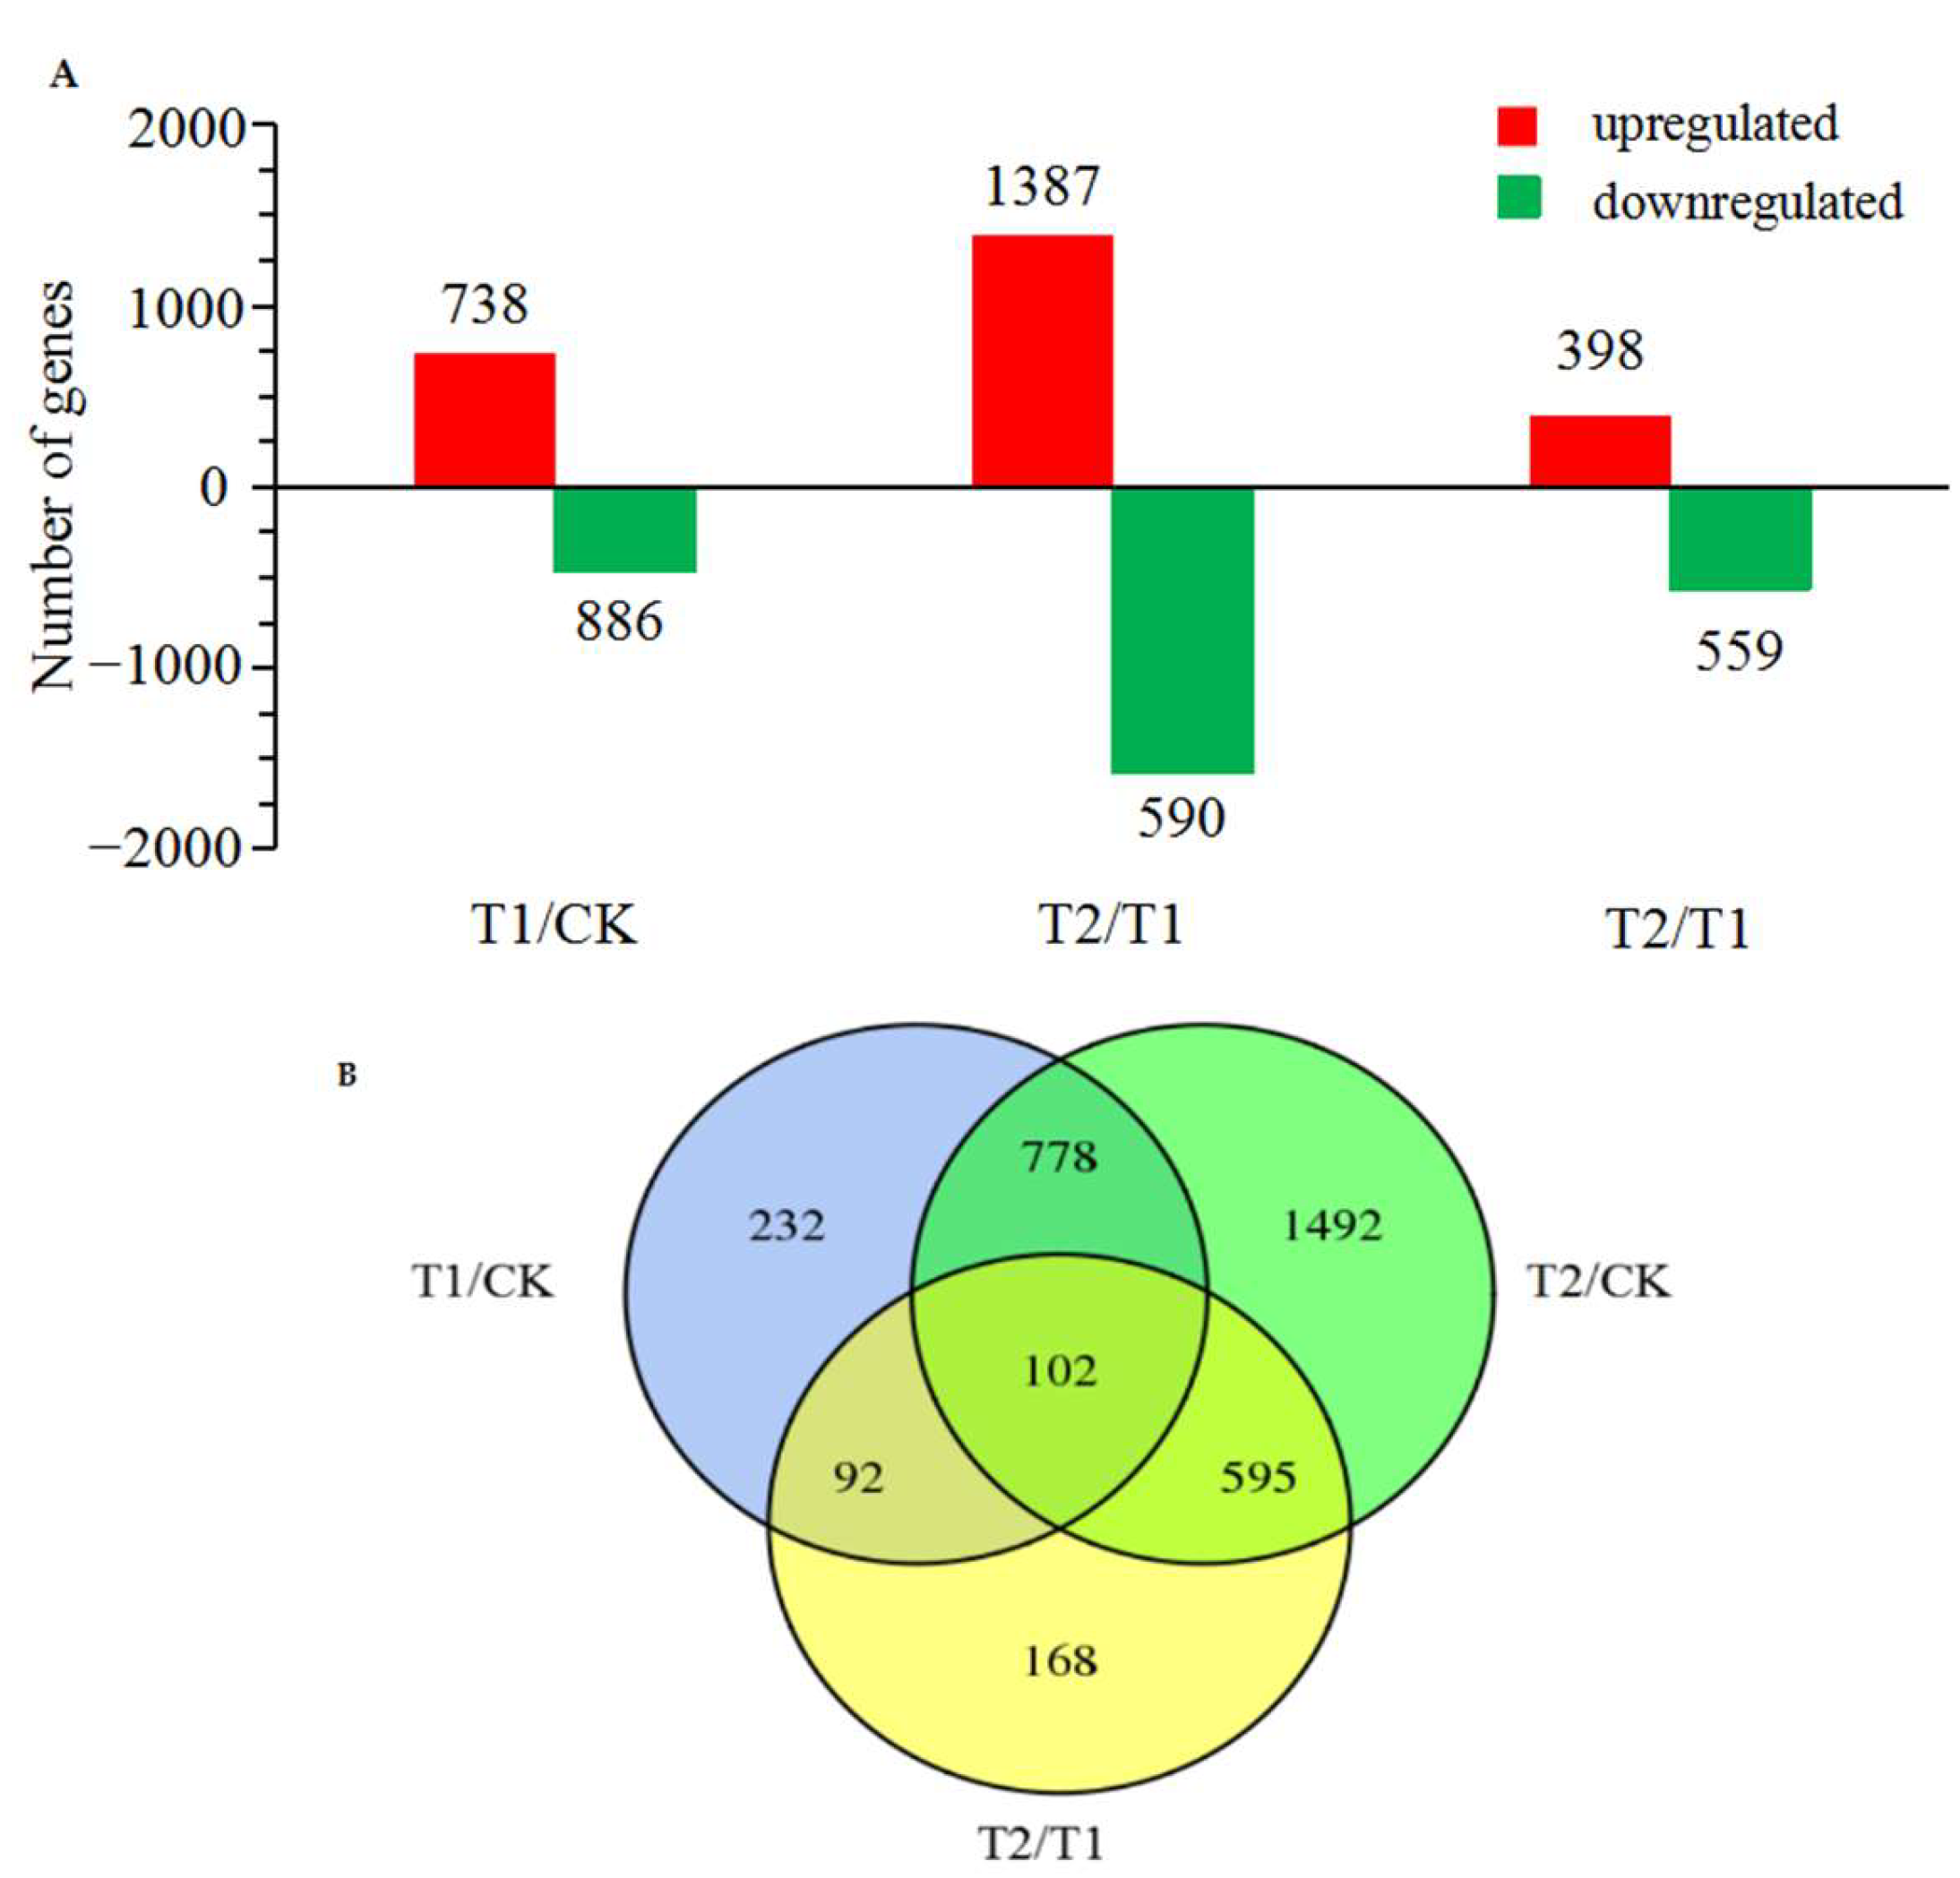
2.5. Screening of DEGs

The DEGs in the different treatment groups were analyzed and two gene libraries were identified by comparison, which included a total of 4171 DEGs, as depicted in Figure 3. A total of 1204 DEGs were significantly differently expressed in the T1 group, of which 738 DEGs were upregulated and 886 were downregulated. The number of DEGs was higher in the T2 plants, in which a total of 2967 genes were differentially expressed, of which 1387 and 1580 DEGs were upregulated and downregulated, respectively. Compared with the T1 group, a total of 398 upregulated DEGs and 559 downregulated DEGs were identified in the T2 group. A total of 232 DEGs were identified in the T1 group, while 1492 genes were significantly differently expressed in the T2 group compared to those of the CK group. The results demonstrated that gene expression varied in the roots of oriental melon seedlings under different root-zone concentrations of CO2 on the 6th day, and the number of DEGs in the T2 group was significantly higher than that of the T1 and CK groups. The findings revealed that alterations in the growth and metabolism of the roots of melon seedlings following exposure to elevated root-zone CO2 could be attributed to differential gene expression, which alters the metabolism of root cells at the transcriptomic level and consequently affects the activity of the entire plant.

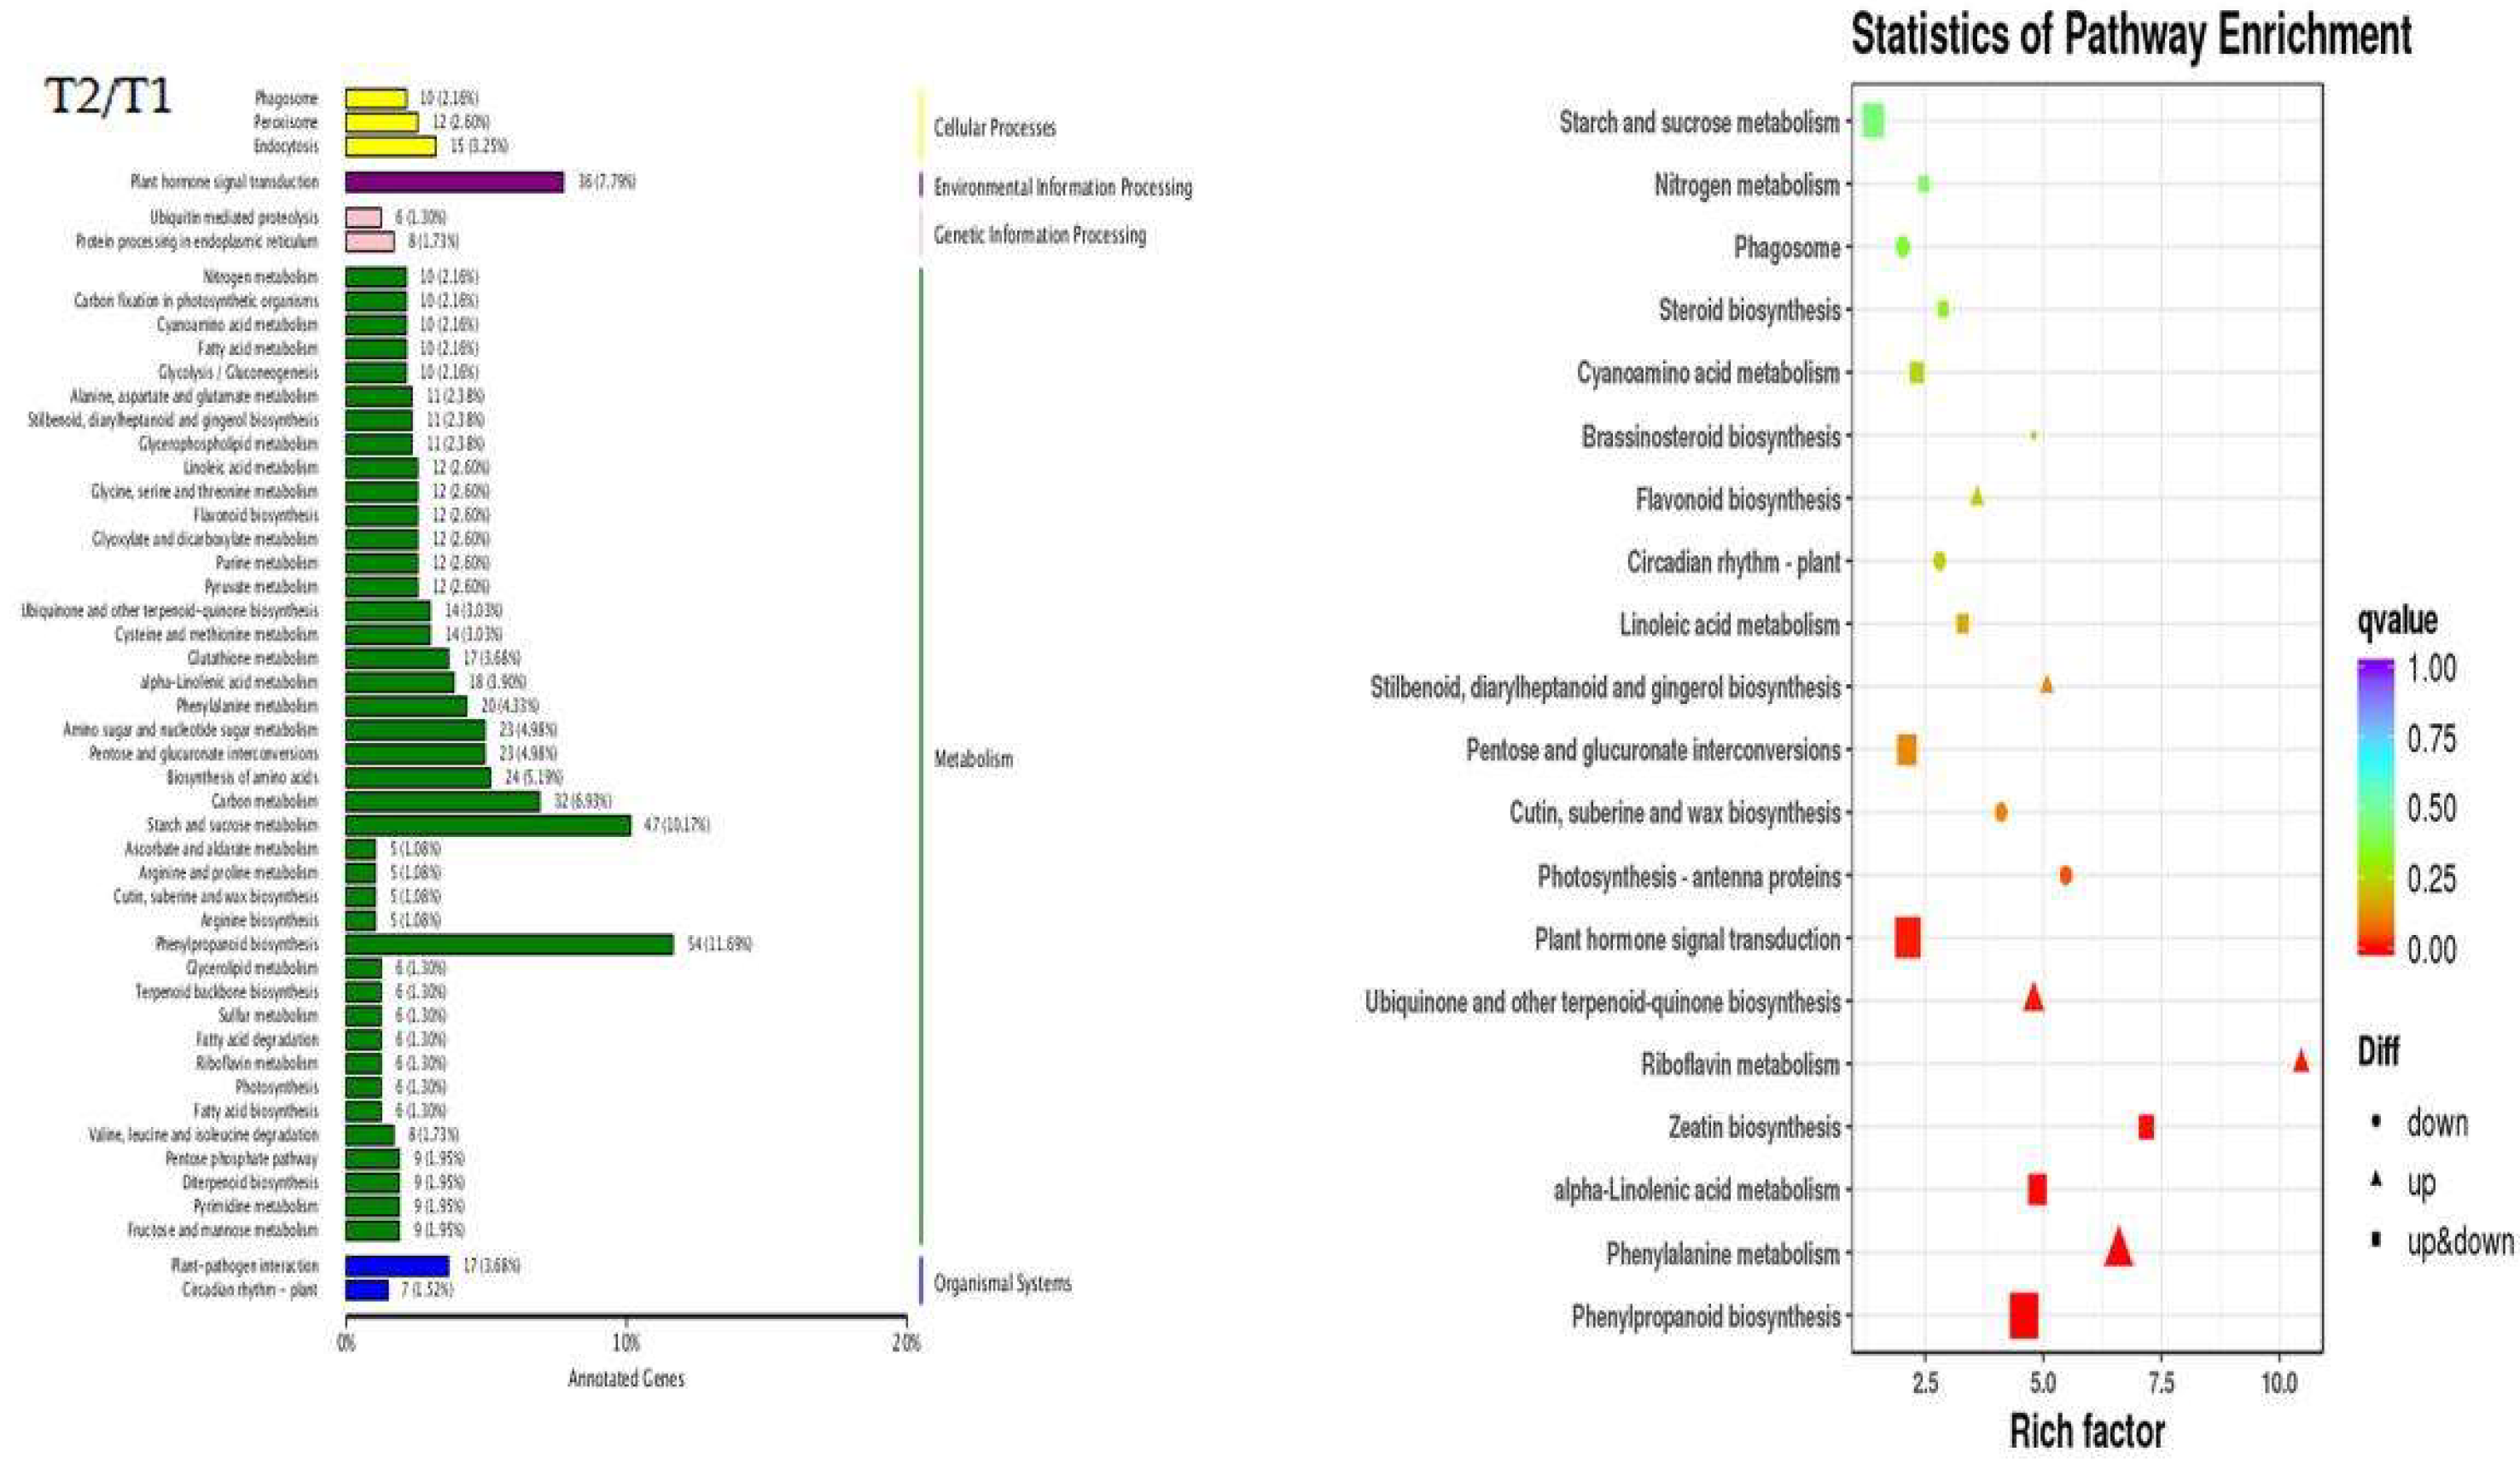
2.6. Kyoto Encyclopedia of Genes and Genomes (KEGG) Pathway Analysis of DEGs

The significantly enriched KEGG pathways of the identified DEGs and the enrichment levels of the DEGs were determined by KEGG pathway analysis (Figure 4). A total of 208 and 464 DEGs of T1 and T2 plants, respectively, identified by comparison of the T1/CK, T2/CK, and T1/T2 groups were annotated to 82 and 107 metabolic pathways, respectively, by KEGG pathway analysis. The 170 genes in the T1/T2 groups were significantly enriched in 74 KEGG metabolic pathways. The right panel in Figure 4 depicts the 20 most significantly enriched metabolic pathways. Analysis of the significantly enriched metabolic pathways in both the treatment groups revealed that the T1/CK, T2/CK, and T1/T2 groups were significantly enriched in three pathways, namely “phenyl propanoid biosynthesis”, “plant hormone signal transduction”, and “starch and sucrose metabolism”. The “amino acid biosynthesis” pathway in T1/T2 and T2/CK was also significantly enriched. The former two pathways, namely “phenyl propanoid biosynthesis” and “plant hormone signal transduction”, are associated with plant resistance to stress. As the significantly enriched pathways are related to starch and sucrose metabolism, the findings indicated that elevated root-zone CO2 stress was the primary reason underlying the alterations in the contents of sugar and starch in the roots at the gene level. Apart from the “phenyl propanoid biosynthesis” and “starch and sucrose metabolism” pathways, the DEGs in the T1 group were also enriched in the “linoleic acid metabolism” (KO00591) and “α-linolenic acid metabolism” (KO00592) pathways, while the DEGs in the T2 group were enriched in the “L-phenylalanine metabolism” (KO00360) and “flavonoid biosynthesis” (KO00941) pathways. These findings indicated that the seedlings of oriental melon could also respond to elevated root-zone CO2 stress via the aforementioned metabolic pathways. We therefore speculated that the accumulation of starch grains in root tip cells could be related to the post-transcriptional pathways that were enriched in the DEGs.

2.7. DEGs Involved in Sugar and Starch Metabolism

A total of eight genes related to starch and glucose metabolism were identified by transcriptome analysis (Table 3), including CmBAM (MELO3C006362.2), CmTS (MELO3C005751.2), catalytic subunit of SNF1-related protein kinase (SNFK1; α-KIN1, designated as CmSNFK1 (MELO3C026210.2)), CmTPS (MELO3C025673.2), CmSS (MELO3C017942.2), CmAMY (MELO3C017002.2), CmNI (MELO3C006727.2) and CmSPS (MELO3C020357.2). CmBAM, CmTS, and CmSNFK1 were upregulated in the T1 and T2 seedlings, while CmAMY was downregulated in the T1 and T2 plants, and the expression of CmTPS, CmSS, and CmNI was upregulated in the T2 group. The expression of CmSPS was downregulated in T2 plants compared to that of the T1 seedlings. The results demonstrated that the transcription levels of the genes related to starch and sucrose hydrolysis were generally upregulated, while the transcription levels of the genes related to sucrose synthesis were downregulated following exposure to elevated root-zone CO2. The findings also indicated that elevated root-zone CO2 stress regulates sugar and starch metabolism in the roots of oriental melon seedlings at the transcriptome level for adapting to adverse conditions. Additionally, the upregulation of genes related to trehalose synthesis and the CmSNFK1 gene revealed that the plant could adapt to adverse conditions by activating the sugar signaling pathways and regulating the expression of genes related to the metabolism of sugar and starch.

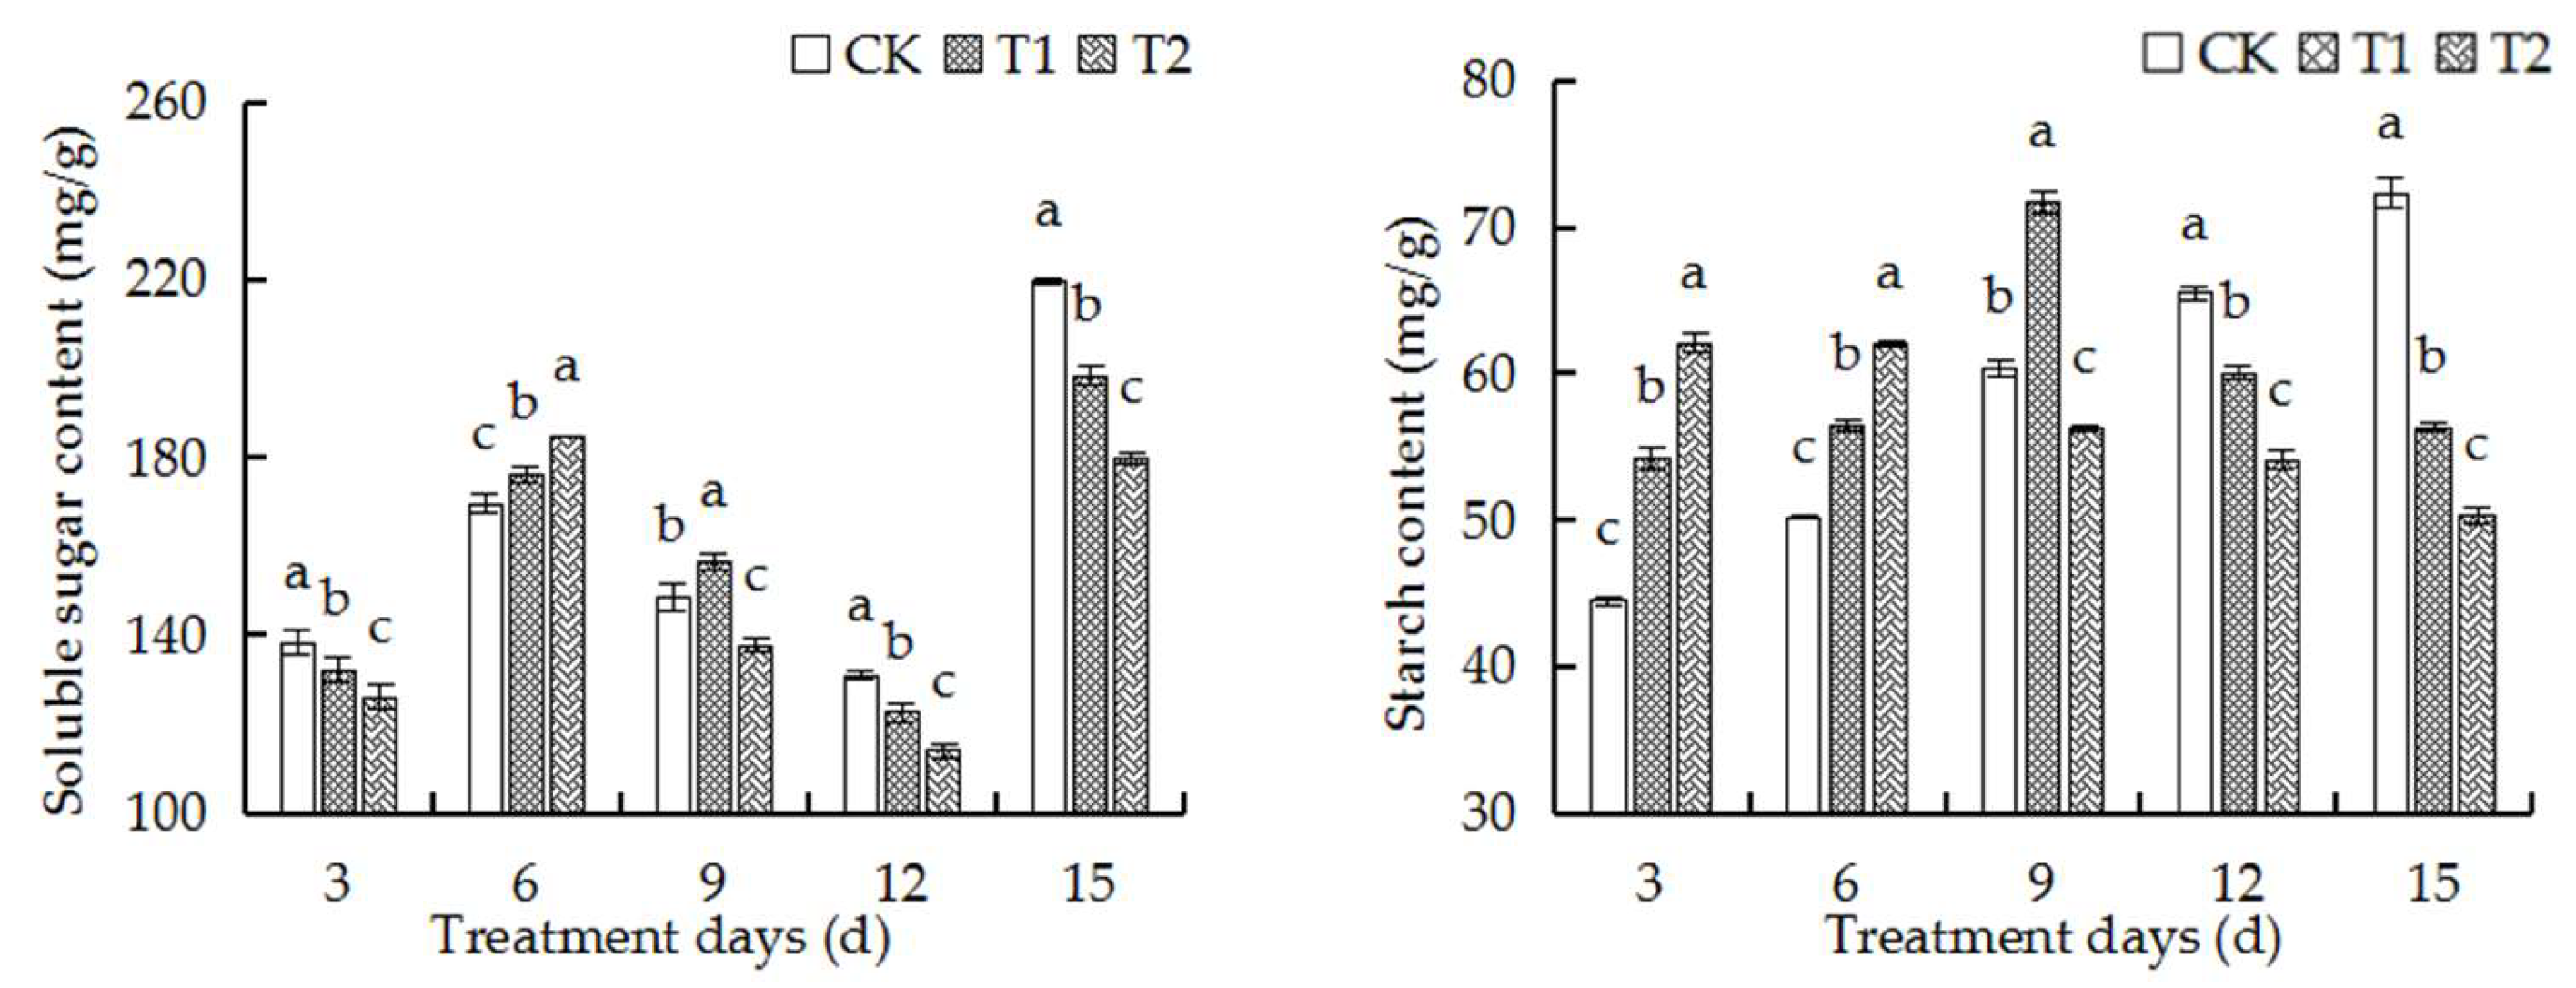
2.8. Elevated Root-Zone CO2 Affected Contents of Soluble Sugars and Starch in Roots

Analyses of the ultrastructure of root tip cells and regulation of the identified DEGs at the transcriptional level revealed that elevated root-zone CO2 induced the rapid formation of starch grains in root tip cells. We therefore investigated the contents of starch and soluble sugars in the root tip cells. The contents of soluble sugars and starch in the roots of oriental melon seedlings initially increased and decreased later on with the prolongation of treatment duration, as depicted in Figure 5. The contents of soluble sugars and starch increased significantly at first in both the T1 and T2 treatment groups compared to those of the control group. Compared to those of the control group, the contents of soluble sugar and starch were significantly increased in the T1 group but significantly reduced in the T2 group on the 9th day of treatment. The contents of soluble sugars and starch in the T1 and T2 groups decreased significantly after the 12th day of treatment compared to those of the control group. The findings revealed that the inhibitory effect of elevated root-zone CO2 on the contents of soluble sugars and starch was enhanced as the concentration of CO2 was increased and was consistent with the alterations in root phenotype.

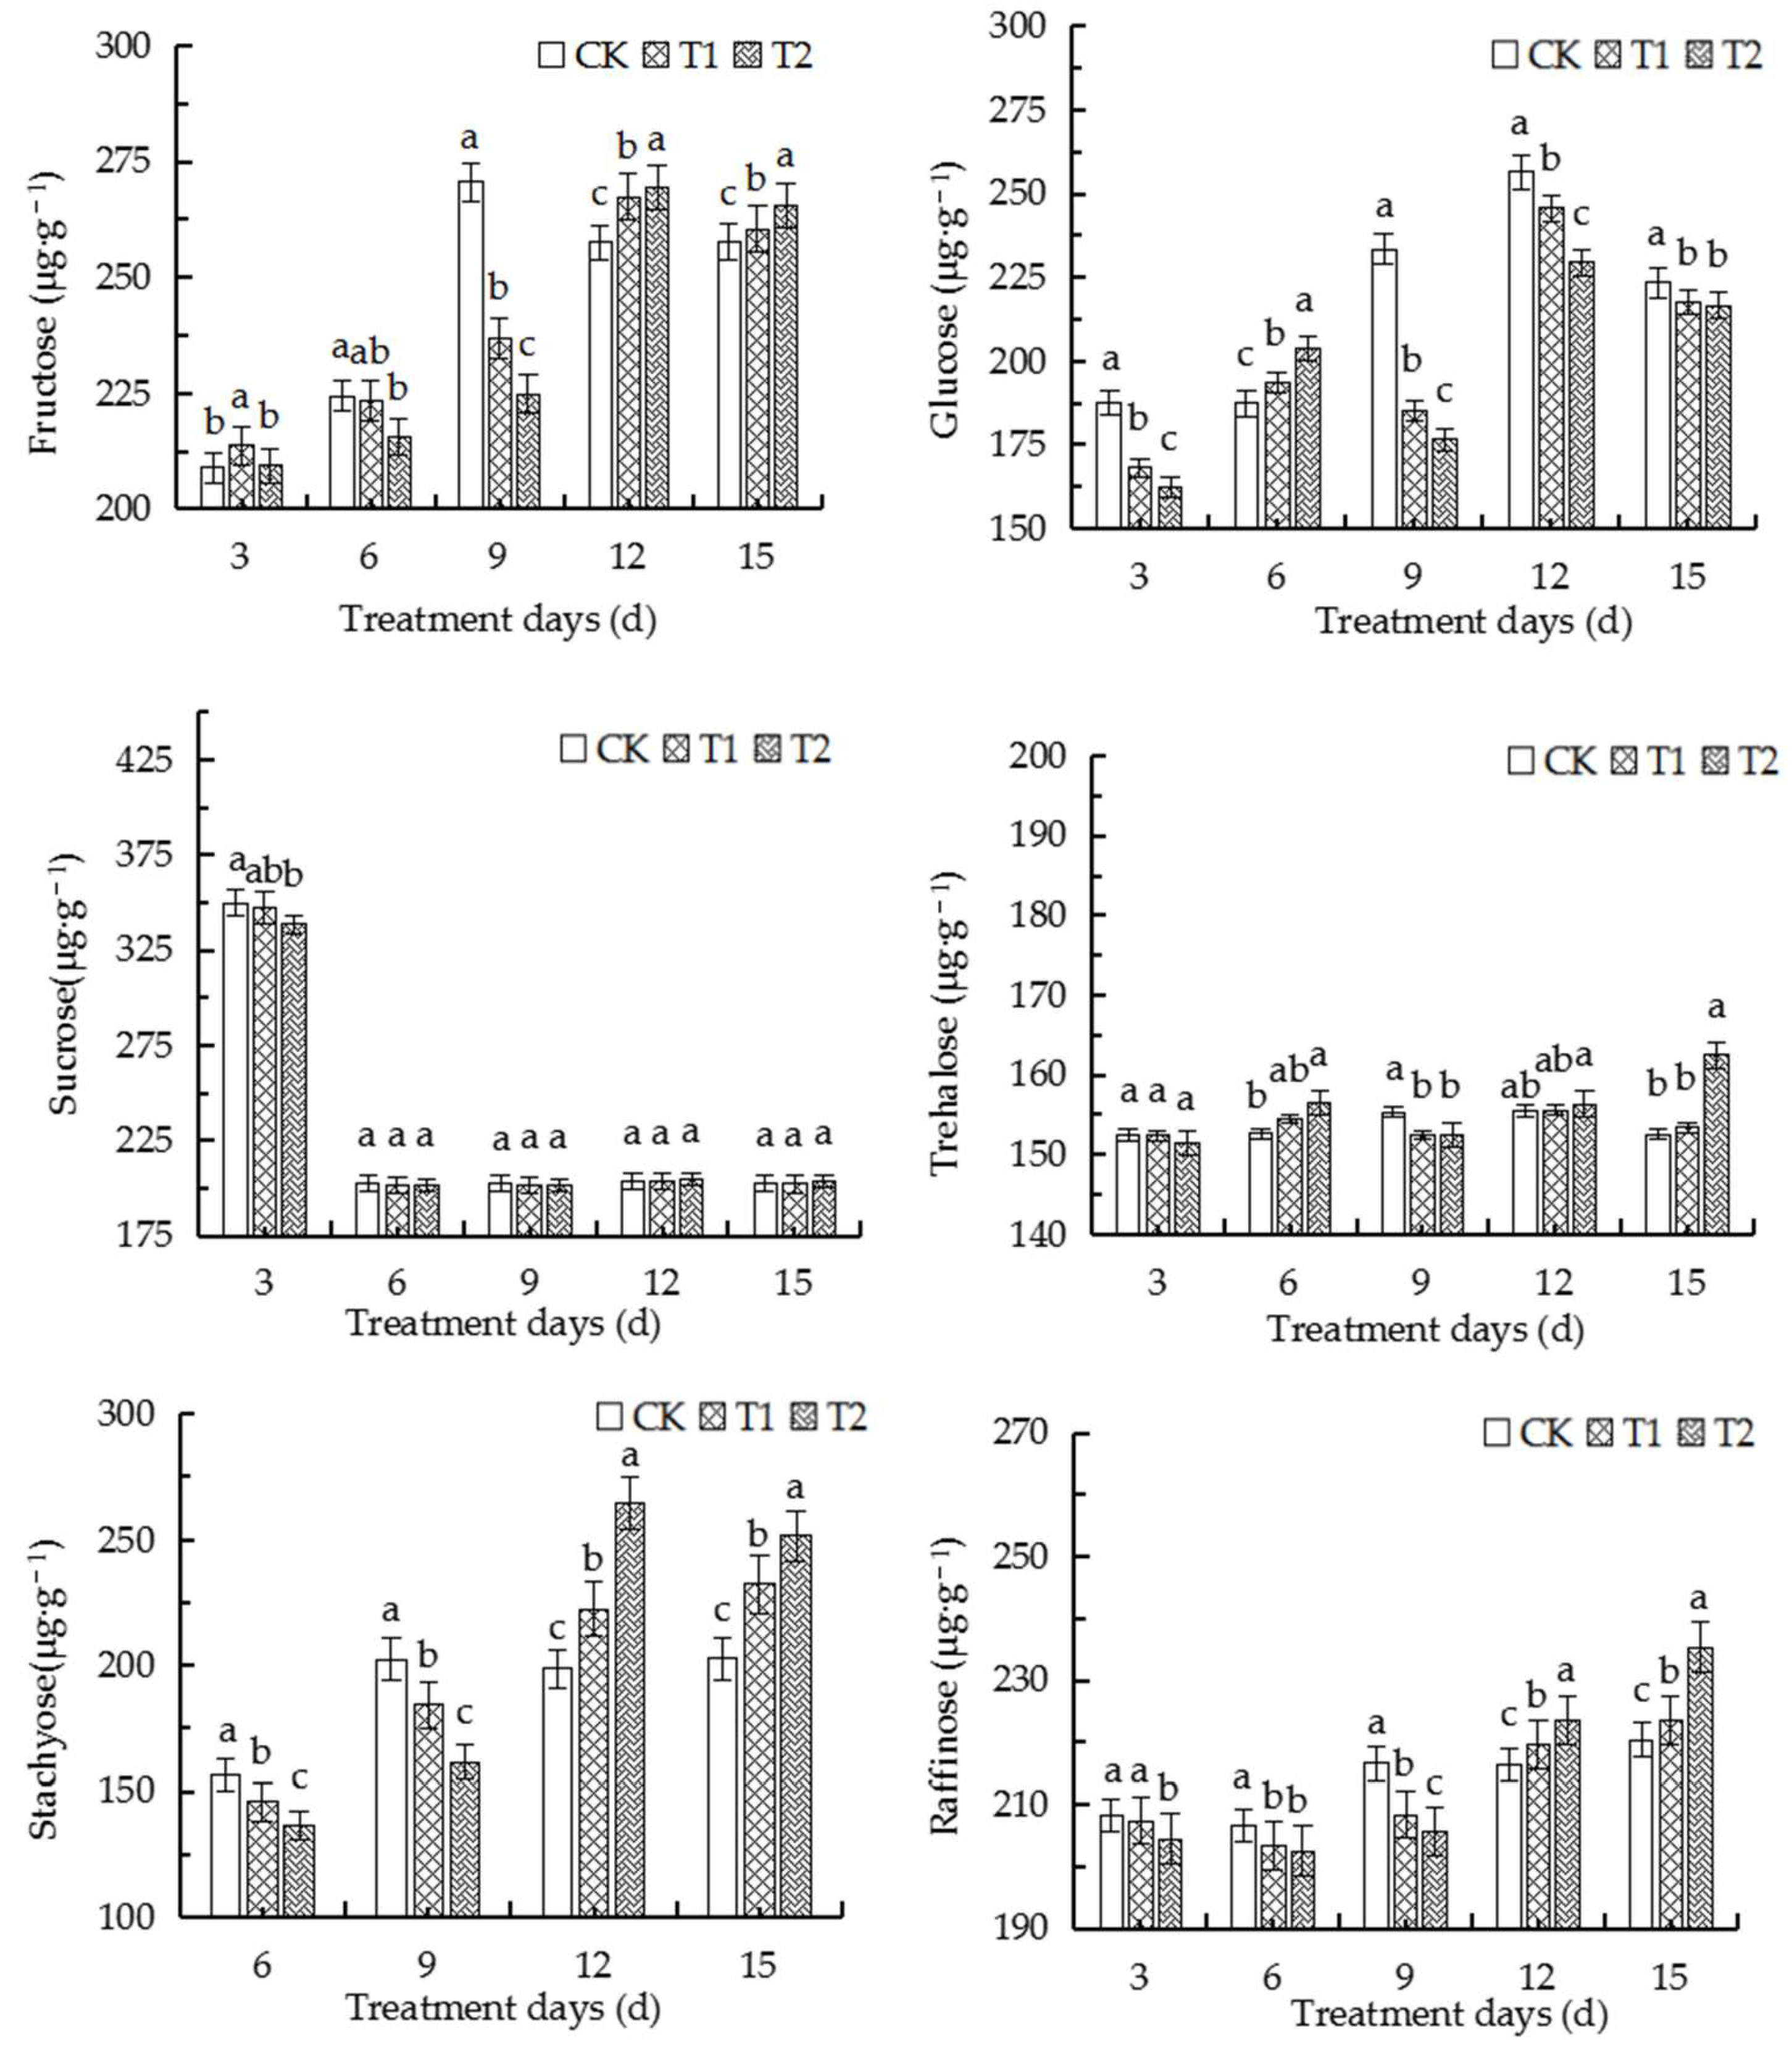
2.9. Elevated Root-Zone CO2 Affected the Contents of Different Sugars in Roots

Sucrose, raffinose, and stachyose are involved in long-distance transport in Cucurbitaceae. Stachyose is the main photosynthetic product and transport substance in oriental melon, while sucrose and raffinose also account for a certain proportion. We therefore determined the contents of several monosaccharides in the seedlings of oriental melon. As depicted in Figure 6, the content of fructose following exposure to elevated root-zone CO2 decreased initially and increased later on with the prolongation of treatment duration compared to that of the control. The contents of fructose, trehalose, stachyose, and raffinose in the T1 and T2 groups decreased significantly on the 9th day of treatment compared to those of the control but were significantly higher than those of the control after the 12th day of treatment. However, the glucose contents of the T1 and T2 groups reached a peak on the 6th day of treatment and were significantly higher than that of the control, but decreased gradually thereafter. The findings confirmed that glucose plays a vital role in the alterations in the total soluble sugar content. The sucrose content increased on the 3rd day of treatment and decreased thereafter, but remained unaltered as the duration of treatment was prolonged or the concentration of CO2 was increased. The results indicated that sucrose synthesis and transportation were inhibited in root tip cells after the 6th day of treatment. The findings also revealed that elevated root-zone CO2 initially increased monosaccharide transportation from source to sink and the loading demands of oriental melon.

2.10. Elevated Root-Zone CO2 Affected Activities of Enzymes Related to Sugar and Starch Metabolism in Roots

The acid invertase (AI) activity of the T1 and T2 groups increased from the 6th and 9th days, respectively, of exposure to elevated root-zone CO2 compared to that of the control (Figure 7). However, the activity of neutral invertase (NI) in the roots of the both the treatment groups was significantly higher than that of the control as the duration of treatment was prolonged. The activity of sucrose phosphate synthase (SPS) varied under different concentrations of CO2, and peaked on the 9th and 6th days of treatment in the T1 and T2 groups, respectively. The activity of sucrose synthase in the decomposition direction (SSI) increased gradually and significantly as the concentration of CO2 was increased. The activity of α-amylase was significantly lower than that of the control on the 6th day of treatment but gradually increased thereafter with the prolongation of treatment duration. The activity of β-amylase increased significantly on the 6th and 9th days of treatment in the T1 and T2 groups, respectively, and remained stable thereafter. The activity of trehalose synthase (SSI) increased initially but decreased later on, which was consistent with the changes in the activity of SPS. The enzymatic activities in both the treatment groups were weaker than those of the control group on the 15th day of treatment, while the activity of trehalose phosphate synthesis (TPS) gradually increased on the whole. The alterations in the enzymatic activities were consistent with the changes in the contents of soluble sugars and starch, which indicated that elevated root-zone CO2 affected the metabolism of sugars and starch in the roots at the gene level.

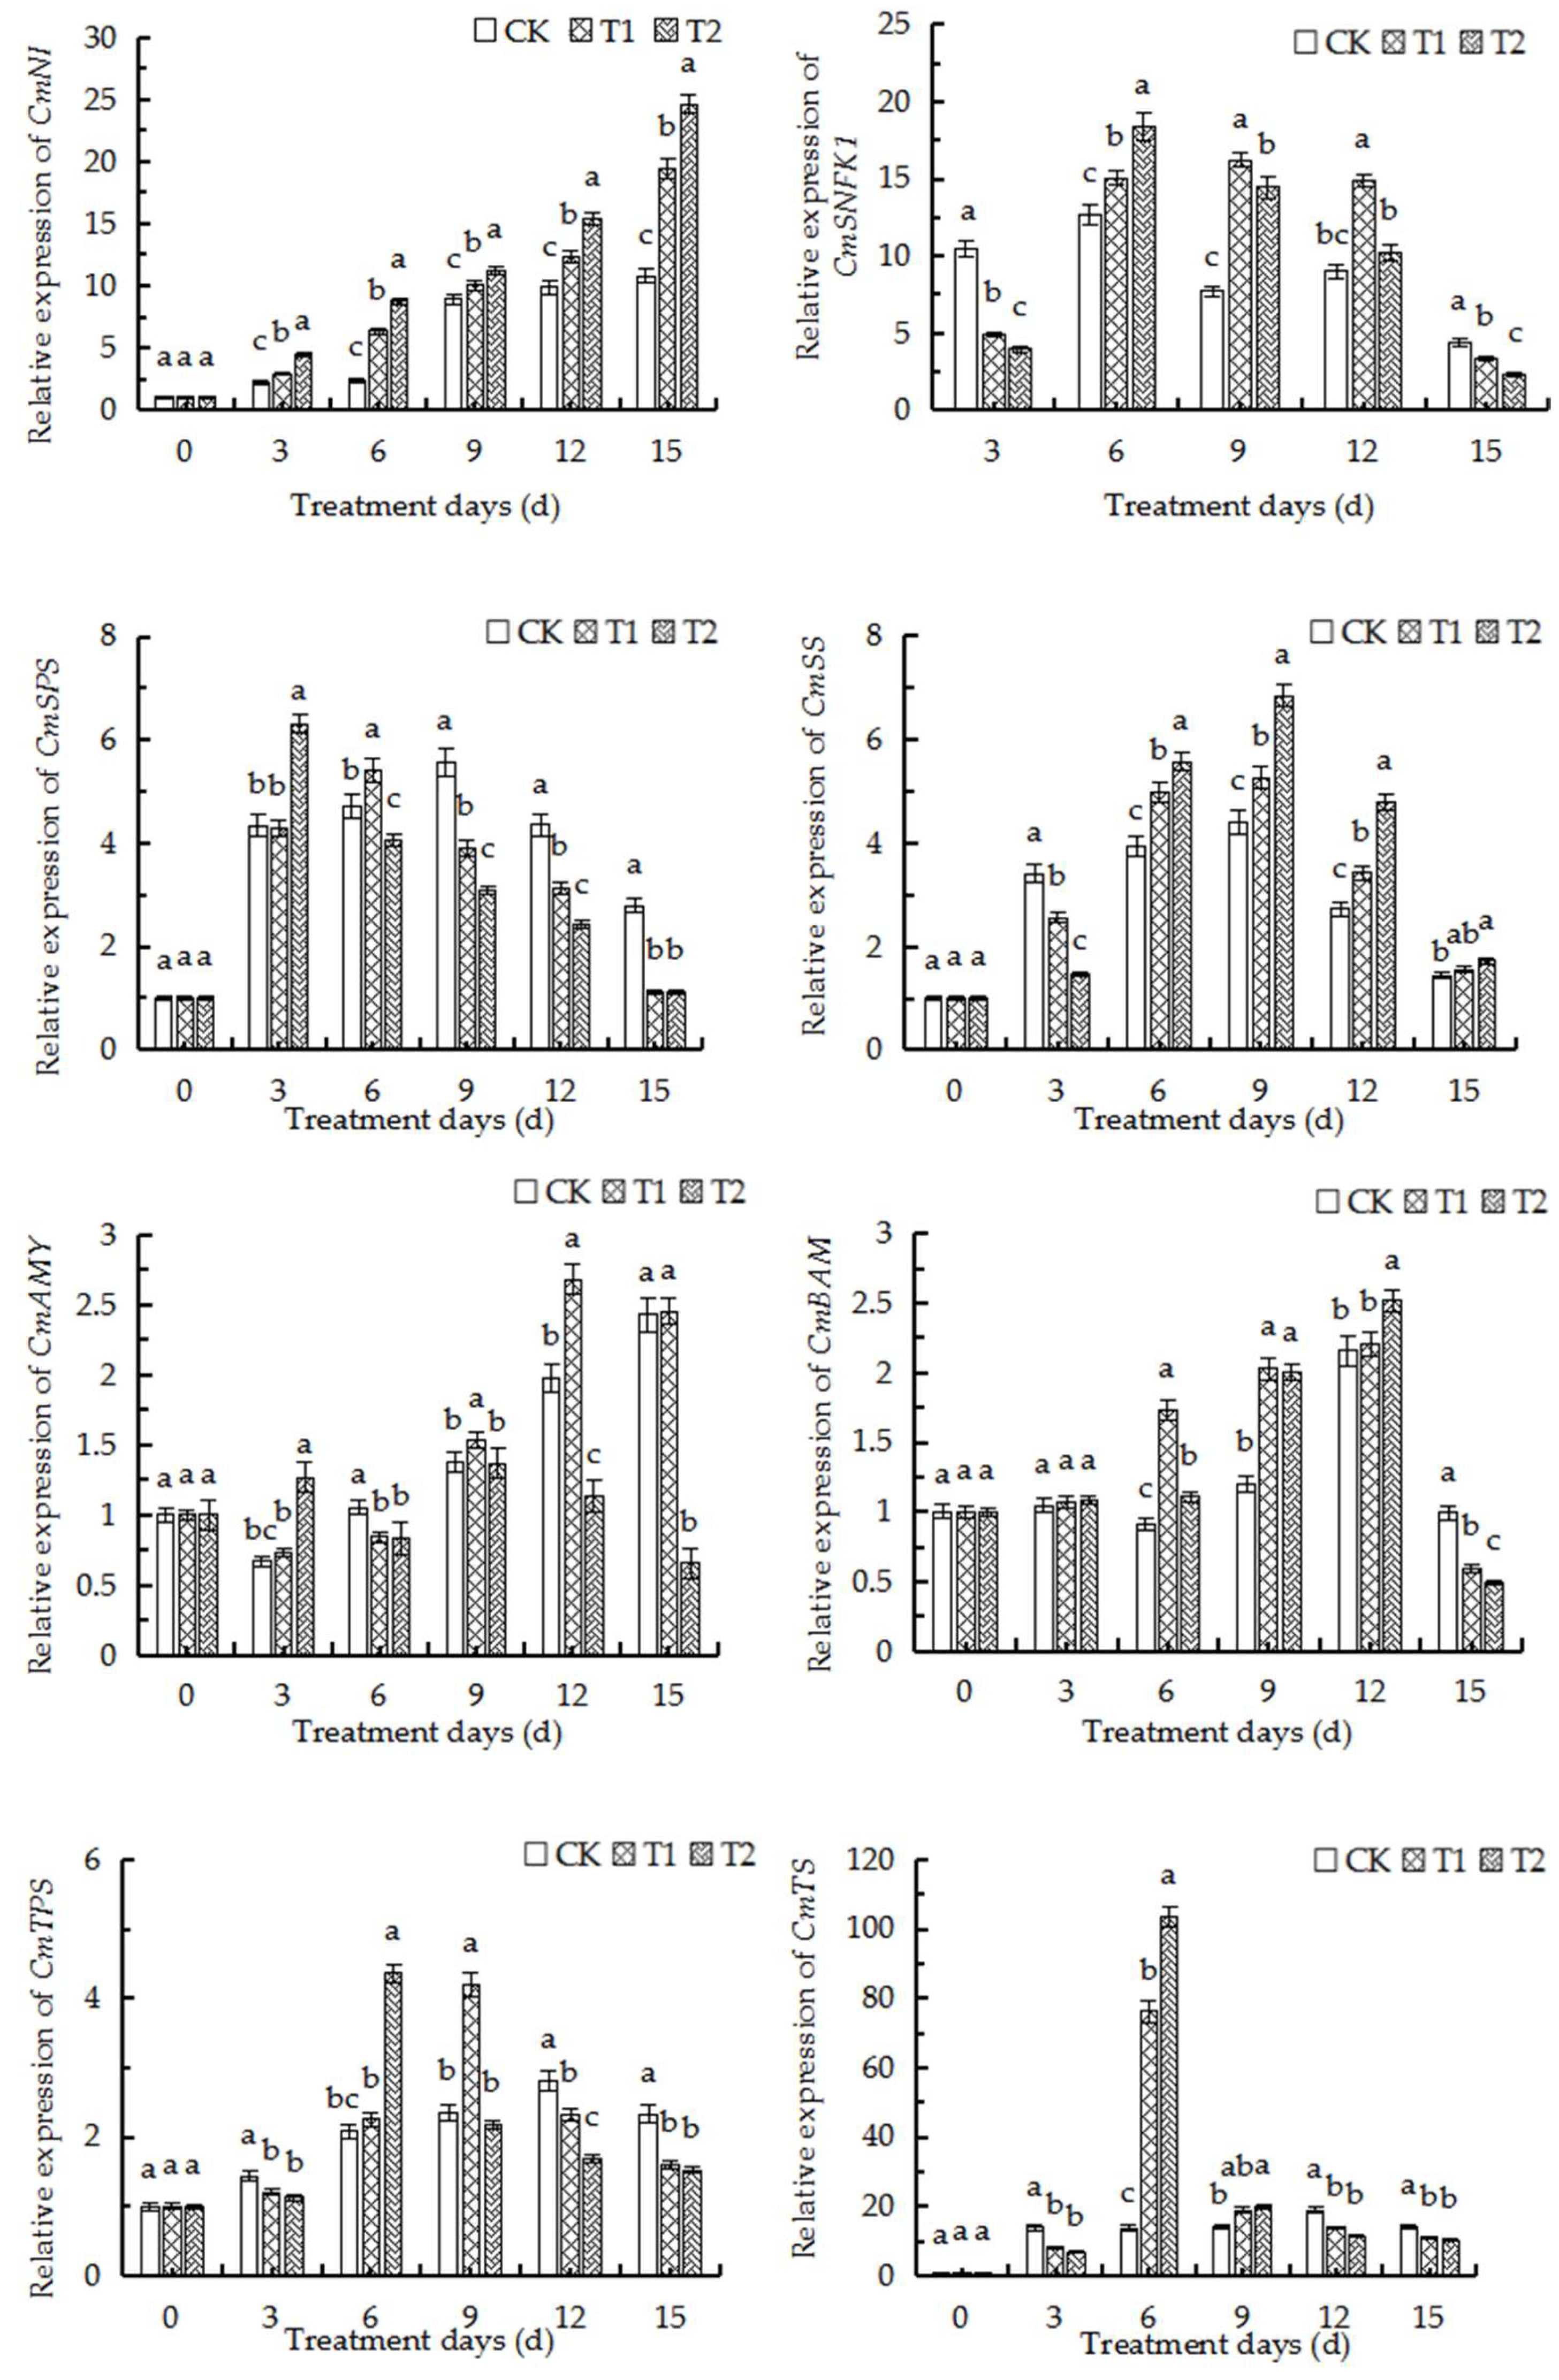
2.11. qRT-PCR Analysis of Major Genes Related to Sugar and Starch Metabolism

The expression of genes related to sugar metabolism in the roots was further determined by analyzing the expression of related genes in combination with transcriptome analysis during treatment (Figure 8). qRT-PCR analysis of gene expression in the roots of oriental melon seedlings under three different concentrations of root-zone CO2 revealed that the relative expression levels of the CmSPS genes, which are related to sucrose synthesis, decreased significantly on the 6th and 9th days of treatment in the T1 and T2 groups, respectively, compared to those of the control. However, the expression of CmSS and CmNI genes, which are related to the decomposition of sucrose, was upregulated on the 6th day after treatment with high concentrations of CO2, and the relative expression levels increased with an increase in the concentration of CO2. The expression of CmAMY, which is related to the hydrolysis of starch, was high at elevated root-zone CO2 on the 3rd day of treatment but decreased on the 6th day, while the expression of CmBAM increased significantly from the 6th day of treatment. The expression levels of CmSNFK1, an SNRK1 gene closely related to the T6P signaling pathway in response to adverse conditions, also increased significantly on the 6th day of treatment. The findings revealed that the contents of sucrose in the roots of oriental melon seedlings were sufficient during the first three days of treatment in the T1, T2, and CK groups. The active hydrolysis of the sucrose and starch in roots increases the content of soluble sugars, and the accumulation of the hydrolysates triggers the synthesis of T6P, which subsequently inhibits the SnRK protein kinase. With the consumption of sucrose, T6P was converted to trehalose under the activity of CmTS, which activated the T6P-SnRK protein kinase signaling pathway. This in turn enhanced the expression of CmSNFK1, which subsequently accelerated the transport of carbohydrates in plants during days 9–15 of treatment. The activities of CmSPS and CmTPS were subsequently inhibited, which established a new carbohydrate balance in the roots.

3. Discussion

3.1. Elevated Root-Zone CO2 Affected Root Growth and Accumulation of Sugars and Starch

The development of roots is an essential agronomic trait in plant growth [25], and a strong root system is the key to plant productivity. The rich epidermal structure of the roots facilitates communication between plants and the soil environment, which provides sufficient water and nutrients for plants [26]. The species of plants, composition of soils, and nutrients greatly influence the spatial structure of the roots, including the number and length of lateral roots [27]. In this study, we observed that elevated root-zone CO2 promoted the development and growth of roots of oriental melon seedlings in the first 6 days of treatment, indicated by an increase in total root length, number of root tips, larger root surface area, increased accumulation of root biomass, and increased root activity (Table 1). These findings were consistent with the results of previous studies which reported that elevated root-zone CO2 promotes the growth and development of the roots of lettuce in tropical regions [10]. However, the results of this study demonstrated that elevated root-zone CO2 decreased root growth in the seedlings or oriental melon with the prolongation of treatment duration, while the degree of inhibition was positively correlated with the concentration of CO2. This phenomenon improved the root vigor and enhanced the metabolism and absorptive capacity in the short term, but they were significantly inhibited thereafter. This was probably attributed to the fact that elevated root-zone CO2 significantly alters the pH of root cells with the prolongation of treatment duration, which subsequently suppresses the membrane function of root cells and disrupts osmotic regulation and balance [28].
Analysis of the ultrastructure of root tip cells revealed that the cell membranes, organelles, and cell walls gradually dissolved under elevated root-zone CO2 (Figure 1). The accumulation of starch grains and mitochondrial division increased rapidly on the 3rd day of treatment with 1.1% root-zone CO2 in the T2 group. The starch grains were rapidly released on the 6th day of treatment while the mitochondrial membrane began dissolving and breaking up on the 9th day of treatment in the T2 group. In addition, large cavities were observed on the cell surface, and cellular physiological functions were lost on the 15th day of treatment. However, the accumulation of starch grains was observed on the 6th day of treatment with 0.4% root-zone CO2 in the T1 group, and the mitochondria and starch grains were intact on the 9th day of treatment. Cytolysis was observed in the T1 treatment group on the 15th day of treatment, but the extent of cytolysis was lower than that of T2 plants. Previous studies have demonstrated that the synthesis and degradation of starch are regulated by redox signals [29], and the synthesis of starch is closely related to the mitochondrial metabolism in non-photosynthetic tissues [30]. These findings indicated that the formation of starch grains in root tip cells under elevated root-zone CO2 was related to mitochondrial activity in this study. In addition, the results of transcriptome analysis revealed that the expression of genes related to sugar and starch metabolism was upregulated, and the genes were enriched in several pathways related to sugar metabolism. This further indicated that the differences in the root growth of oriental melon seedlings under elevated root-zone CO2 could be attributed to the alterations in the levels of starch metabolism. The results demonstrated that although the root growth phenotype was not inhibited by 1.1% CO2, the interior of the root tip cells exhibited signs of senescence, which was not conducive to the growth and development of melon seedlings. However, the root tip cells of the T1 group, which was treated with 0.4% CO2, remained active on the 9th day of treatment.

3.2. Elevated Root-Zone CO2 Affected the Metabolism of Sugar and Starch in the Roots

The development, stress response, and yield formation of plants are influenced by sugar metabolism. The metabolism of sugars primarily promotes plant growth and the synthesis of essential compounds, including proteins, cellulose, and starch, by generating a generating a series of sugars as metabolites, and acts as signal molecules to regulate transcription factors and other gene expression [31,32,33]. Sugar signaling pathways interact with stress pathways to regulate plant metabolism. Sugars indirectly regulate carbohydrate metabolism under abiotic stress, which contributes to plant growth and development [34,35,36]. Several environmental factors, including drought, cold, and salinity, have been shown to alter carbohydrate metabolism [37,38,39]. The results of this study demonstrated that alterations in the contents of soluble sugars and starch in the roots are attributed to the adaptation of the basic physiological indices of roots at different root-zone CO2 concentrations (Figure 5). In this study, the content of soluble sugars increased with an increase in the concentration of CO2 from days 0 to 6 for adapting to the elevated root-zone CO2, which was consistent with the increased tolerance of plants under low oxygen concentrations [30,40,41]. However, the starch content increased with an increase in the concentration of CO2 from days 0 to 9 (Figure 5), which could be attributed to the fact that the carbon source in the root tip cells were sufficient and induced the absorption of CO2 by the roots, and the malic acid content in the roots increased temporarily, which led to the accumulation of starch [42]. The findings could also be explained by the compensatory response to elevated soil CO2 stress. In a previous study, Lake et al. proposed a root-to-leaf signaling mechanism under elevated root-zone CO2 stress, which explained that the roots of plants are stimulated to produce hormones under elevated root-zone CO2 stress, and a signal is transmitted to the leaves for inducing stomatal closure. As a compensatory mechanism to root-zone CO2 stress, the starch in the root system can be hydrolyzed into soluble sugars [43]. Increased exposure to root-zone CO2 resulting from the prolongation of treatment duration significantly reduces the pH of the root sap, which negatively affects root tip cells and markedly reduces the starch content. However, previous studies have demonstrated that the expression of genes related to the conversion of starch and sucrose in the source-sink relationship is affected by sugar signaling pathways. The T6P sugar signaling pathway plays an important role in promoting AGPase redox activation in response to the conversion of sucrose [44,45]. In this study, the activity of TPS, the T6P synthesis ability, and the upregulation of starch synthesis decreased after the 9th day of treatment with elevated root-zone CO2, while the contents of α-hydrolase and β-amylase in the catabolic direction increased compared to those of the control, which consequently decreased the accumulation of starch (Figure 7).
The enhanced activity of AI in melon can result in the formation of hexoses, which serve as a carbon source for the rapid growth of plant tissues [46]. Glucose and fructose are the main hexose sugars in the rapidly expanding young tissues of melon, which often have very high invertase activity [47,48]. The results of this study demonstrated that the activity of NI increased significantly under elevated root-zone CO2, and the increase in the activity of NI was more significantly pronounced with the prolongation of treatment time and an increase in the concentration of CO2. The activity of SS generally increased, but it decreased with the prolongation of treatment time (Figure 7). This finding was consistent with the results of previous studies on rice [49], wheat [50], and corn [51]. In this study, SS played an important role in root growth on days 0–6 of treatment. The activity of SS increased with an increase in the concentration of CO2. The activity of SPS was significantly lower than that of the control after the 6th day of treatment and decreased with an increase in the concentration of CO2; however, the activity of SPS in the T2 treatment group increased significantly compared to that of the control on the 3rd day of treatment (Figure 4). As depicted in Figure 5, the sucrose content increased to a peak and decreased later on but remained steady over the remaining duration of treatment and at different CO2 concentrations. The contents of fructose and glucose increased simultaneously at first but declined later on (Figure 6). The findings indicated that the direction of sucrose decomposition in root tip cells gradually became more pronounced compared to sucrose synthesis after the 3rd day of treatment, which consequently increased the sucrose consumption and decreased the sucrose accumulation, and caused a gradual reduction in the content of soluble sugars. On the other hand, the contents of T6P and TS initially increased and then decreased later on. The contents of T6P and TS increased significantly on the 6th day of treatment with 1.1% CO2 while the content of trehalose increased significantly on the 6th day of treatment as the concentration of CO2 increased. The findings revealed that the trehalose synthesis signal was stimulated in plants under elevated root-zone CO2 over days 0–6 of treatment, which resulted in the accumulation of trehalose. The observation was closely related to the alterations in sucrose content and was consistent with the results of a study on grape under cold stress [52]. Another study on cottonseed reported that the contents of sugar and stachyose generally increases from the 6th day of treatment, and the alterations in the contents of sugars and stachyose were similar at different treatment concentrations. The contents of sugars and stachyose increased significantly after the 9th day of treatment compared to those of the control, which could indicate that elevated root-zone CO2 increased the transportation and loading demand of melon from source to sink from the 6th day of treatment, thereby forming a new metabolic balance. Elevated root-zone CO2 induced a series of changes in the sugar metabolism of roots and thereby directly affected the material metabolism of the roots. This phenomenon provided a physiological and biochemical basis for the morphological and structural adaptation of the roots of oriental melon seedlings.
The findings of this study revealed that the metabolism of sugars and starch in the roots of oriental melon seedlings undergoes a series of changes under elevated root-zone CO2, which subsequently promotes the accumulation and transformation of carbohydrates in the short term. Alterations in sugar metabolism adjust the cellular balance of carbon and water metabolism and aid in stress adaptation. However, the balance between the supply and demand of carbohydrates is disrupted after long-term treatment, including a reduction in photosynthetic capacity, cellular pH, and other adverse factors, which subsequently inhibits plant growth. The results of transcriptome analysis (Figure 4) and KEGG pathway analysis revealed that the DEGs were significantly enriched in three KEGG pathways, including “sugar and starch metabolism”. This pathway is involved in the defense response of melon seedlings and was the most significantly enriched metabolic pathways, which indicated that the metabolism of sugars and starch plays an important role in the defense response of oriental melon seedlings. Quantitative analysis of the relevant genes identified by transcriptome analysis revealed that all the genes related to sucrose decomposition were upregulated from days 0 to 6 (Figure 8). The elevation of root-zone CO2 upregulated the expression of the related genes to varying degrees. Of these, the expression of CmNI, CmAI, and CmSSI was significantly altered on the 3rd day of treatment, while the overall expression levels of CmSPS, CmTPS, and CmTS were first upregulated and then downregulated. The expression of CmSPS was significantly downregulated in the T1 and T2 treatment groups after the 9th day of treatment compared to that of the control group, and the expression of CmSPS was downregulated at higher concentrations of CO2. The expression levels of CmTPS and CmTS were significantly higher in the T1 and T2 groups than those of the control group on the 6th day of treatment, while the expression levels decreased after the 9th day of treatment. Analysis of gene expression in the roots of melon seedlings by qRT-PCR under the three different root-zone concentrations of CO2 revealed that the variations in gene expression were fundamentally similar to the alterations in enzymatic activity and was consistent with the results of transcriptome analysis. The activity of SPS is regulated via phosphorylation. SPS and invertase cooperatively control the long-distance transportation and metabolism of sucrose in the sink tissues [53]. Previous reports have suggested that the highly conserved SNFK1 is involved in the redox regulation of AGPase and the signal transduction pathways that mediate the synthesis of starch from sugar [36]. It has also been reported that trehalose and its precursor T6P regulate plant metabolism and gene expression. In addition, the synthesis, decomposition, and regulation of trehalose and T6P play an important signaling role in regulating plant growth, development, and adapting to stress [54]. In this study, the expression of CmSNFK1, which is closely related to T6P signaling in response to adverse conditions, increased significantly on the 6th day of treatment. This finding indicated that the melon seedlings were rich in sucrose, which served as a sufficient carbon source under elevated root-zone CO2 from days 0 to 3 of treatment. CmNI, CmAI, and CmSS actively regulated the activities of enzymes related to the hydrolysis of sucrose and starch, and increased the content of soluble sugars. The accumulation of their hydrolysis products triggered the synthesis of T6P, which in turn inhibited the SnRK protein kinase and promoted the consumption and utilization of carbon sources by the roots to regulate the carbon and nitrogen imbalance caused by elevated root-zone CO2 stress. The findings were consistent with those of previous studies which reported that alterations in the levels of T6P in plants affect the response of Arabidopsis sp. to sugar, which indicated that T6P plays an important role in regulating sugar metabolism and can also alter and regulate plant growth and carbon utilization [55]. The utilization of the carbon content in roots decreases following the destruction of root tip cells by the acidic environment, which subsequently activates the T6P-SnRK protein kinase signaling pathway and increases the expression of CmSNFK1. In this study, the carbon consumption of the root system was gradually reduced, the activity of SPS, TPS, NR, and other enzymes increased, and the source-sink transportation of carbon was accelerated for establishing a new carbon and nitrogen balance.

4. Materials and Methods

4.1. Plant Material and Growth Conditions

The experiments were conducted in a solar greenhouse in the scientific research base of Shenyang Agricultural University, Shenyang, Liaoning, China. The Yumeiren cultivar of oriental melon (Hengyuan Seed Industry, Changchun, Jilin, China) was selected as the plant material, and an aeroponics system was used for cultivation. When the seedlings grow three leaves, the healthy seedlings with uniform growth that were free of pests and diseases were selected for planting. The substrate was washed from the roots of the seedlings and the seedlings were transplanted to the planting holes of the cultivation bed containing cotton substrate.
The seedlings were treated with an automatic root-zone CO2 concentration treatment system based on the root-zone CO2 treatment method by Chen et al., 2020. (Figure 9) [24]. The root-zone CO2 cultivation and treatment system mainly comprised a CO2-air mixing system, a CO2 concentration monitoring system, and an aeroponic cultivation system. Three weeks after transplantation, three different root-zone CO2 concentrations (0.2%, 0.4% and 1.1%) were supplied to separate bins. Continuous elevated CO2 treatment lasted for 15 days. The CO2 concentrations of 0.2%, 0.4% and 1.1% were controlled using premixed CO2–air mixtures from compressed air and high-purity CO2 cylinders. The gas was mixed by adjusting the intake of CO2 and air and maintained the CO2 concentration at the preset CO2 level. The gas mixture was introduced through a pipe inserted near the root. There were three bins for each root-zone CO2 concentration treatment. The root-zone CO2 concentration of the seedlings could be monitored by CO2 and an oxygen sensor located in the cultivation bed. The computer data-acquisition module collected the data from CO2 and the oxygen sensor in the cultivation bed and then transmitted the data to the computer control module to ensure the CO2 concentration in the cultivation bed was at the pre-set CO2 level. The computer simultaneously carried out the real-time monitoring, data recording, and storage. All experiments were performed in a greenhouse kept at the same temperature.

4.2. Measurement of Plant Growth Indices

Samples were collected from day 0, and on every 3rd day until the 15th day of treatment. The plants at the same stage of growth in the different groups (CK, T1, and T2) were selected, and the root volume, activity, and morphology were determined. The data obtained from three independent experiments were averaged, and three biological replicates were considered. The root volume was determined using the drainage method. The root vigor was measured by the triphenyltetrazolium chloride (TTC) method.

4.3. Analysis of Root Morphology

The intact roots were scanned using a Wanshen LA-S scanner (Hangzhou, China), and a series plant image analyzer, and quantitative analysis was achieved with the matching system.

4.4. Observation of Ultrastructure of Root Tip Cells

The samples were prepared as previously described by Chen et al. [25] and observed using a JEX-100CX II transmission electron microscope (JEOL Ltd., Tokyo, Japan).

4.5. Determination of Sugar and Starch Contents

The contents of soluble sugars and starch were determined by the anthranilic sulfuric acid method with 0.1 g of the root samples. The contents of sugars were determined by high performance liquid chromatography (HPLC) using 1.0 g of the root samples. Briefly, 5–6 mL of 80% ethanol was added to the samples, and the samples were immersed in a water bath at 80 °C for 1 h. The process was repeated thrice and the extracts were combined. The extracts were allowed to cool and subsequently centrifuged at 8000 rpm for 10 min. The obtained supernatant was poured into an evaporating pan and dried in a water bath at 80–90 °C. The evaporated sugars were dissolved in 1 mL of ultrapure water. The solution was filtered using a 0.22 μm water filtration membrane, and the supernatant was added to the sample bottle. Standard samples of various sugars (Shanghai Yuanye Biotechnology Co., Ltd. Shanghai, China) were prepared at concentrations of 0.2, 0.4, 0.8, 1, 2, and 4 mg/mL. HPLC was performed using a Waters 600E HPLC (Waters, Milford, CT, USA)system attached with a Waters 2410 (Waters, Milford, CT, USA) Differential Refractometer. A carbohydrate column was used and the temperature of the column was set to 30 °C. The mobile phase comprised acetonitrile and ultrapure water at a ratio of 70% to 30%, and the Waters Millennium Software (version 32) was used for process control and data analysis.

4.6. Determination of Activities of Enzymes Related to Sugar and Starch Metabolism

The activities of neutral invertase (NI) [56], sucrose synthase in the decomposition direction (SSI) [57], α-amylase, and β-amylase were determined using a Solarbio Kit (Beijing Solebo Technology Co., Ltd., Beijing, China). The activities of sucrose phosphate synthase (SPS), trehalose synthetase (TS), and trehalose phosphate synthetase (TPS) were detected using a plant sucrose phosphate synthetase, trehalose synthetase, and trehalose hexaphosphate synthetase ELISA Kit, respectively (Jiangsu Boshen Biotechnology Co., Ltd., Taixing, China).

4.7. Analysis of Transcriptome Sequencing Data

The alterations in the physiological indices and sugar contents in the T1 and T2 groups exhibited an opposite trend to those of the CK group until the 6th day of treatment. The CK, T1, and T2 groups were selected for subsequent analyses, and 2 cm of the root tips on the 6th day of treatment were selected for RNA-seq analysis. Three biological replicates were performed for each treatment (for a total of 9 samples). The three replicates for each sample were designated as CK-1, CK-2, CK-3, T1, and T2 as the same as above.
For RNA-seq analysis, the total RNA was first extracted using an NEBNext UltraTM RNA Library Extraction Kit (NEB, Ipswich, MA, USA) and the integrity of the RNA was detected using an RNA Nano 6000 Analysis Kit (Agilent Technologies, Santa Clara, CA, USA) and an Agilent Bioanalyzer 2100 System (Agilent Technologies, Santa Clara, CA, USA). The RNA samples were subsequently clustered and sequenced, and the M-MuLV reverse transcriptase and random primers were used for synthesis. Reverse transcription was performed using DNA polymerase I and RNase H. The gene fragments were amplified using Universal and Index(X) primers and Phusion DNA polymerase, and cDNA used as the template. The quality and quantity of the library were verified after quality testing, and the raw data were filtered to obtain the clean data.
The HISAT2 tool was used for comparing the genome sequences of melon with the obtained mapped data for further analysis, and the DEGs were subsequently identified. The number of mapped reads and transcript lengths of the samples were normalized using String Tie (version 1.3.3). The results were summarized with Gffcompare for determining the gene expression levels based on the values of FPKM.

4.8. Analysis of Expression of Genes Related to Sugar and Starch Metabolism

The accuracy of the sequencing results and the regularity of expression were verified by qRT-PCR. The primer sequences are enlisted in Table 4 (designed by Beijing SaiBaiSheng Technology Co., Ltd., Beijing, China). The cDNA was synthesized using a qRT-PCR reverse transcription kit (provided by Kangwei Century Biotechnology Co., Ltd., Beijing, China). Amplification was performed using the Trans Start Top Green qPCR Super Mix of Bio-Rad CFX96 (Bio-Rad, Hercules, CA, USA). The conditions of PCR were as follows: initial denaturation at 94 °C for 2 min, followed by 45 cycles of denaturation at 94 °C for 5 s, extension at 60 °C for 15 s, and annealing at 72 °C for 10 s. The expression level of the product was calculated using the 2∆∆CT method (p < 0.05)

4.9. Data Processing and Statistical Analysis

The data were presented as the mean ± Standard Error (SE). Analysis of variance (ANOVA) and significance analysis were performed using DPS software, version 17.10. Significance analysis was performed by Duncan’s multiple range test at p < 0.05 and Origin version 9.0 (OriginLab Corporation, Northampton, MA, USA). Microsoft Excel 2010 was used for mapping the data and statistical analysis.

5. Conclusions

In this study, the effect of elevated root-zone CO2 on the seedlings of oriental melon cultivated in an aeroponics system was investigated. The findings revealed that elevated root-zone CO2 promoted the growth and vigor of roots of melon seedlings within a short time, increased the contents of sugar and starch in the roots, and improved the activity of the metabolic enzymes. However, the values of all the aforementioned indicators decreased with the prolongation of treatment time, and the growth and metabolism of the seedlings were subsequently inhibited. Transcriptome analysis revealed that the expression of genes related to sugar and starch metabolism declined significantly under elevated root-zone CO2 over time. The inhibition of gene expression could be attributed to the fact that elevated root-zone CO2 stress affected the carbohydrate metabolism of oriental melon at the gene level for triggering the defense stress response of seedlings and accelerating the aging of root tip cells, which subsequently altered the accumulation and metabolism of sugars and starch in the roots.

Author Contributions

Conceptualization, L.G. and W.W.; methodology, L.G. and W.W.; validation, Y.L. (Yiling Liu); formal analysis, L.G. and C.X.; investigation, L.G. and X.H.; data curation, L.G., Y.L. (Yanan Li) and Y.L. (Yiling Liu); writing—original draft preparation, L.G., W.W. and Y.L. (Yiling Liu); writing—review and editing, H.Q., C.X. and Y.L. (Yiling Liu); supervision, H.Q.; funding acquisition, Y.L. (Yiling Liu). All authors have read and agreed to the published version of the manuscript.

Funding

This work was supported by the National Natural Science Foundation of China (31101582), the China Agriculture Research System (CARS-25), and the Shenyang Science and Technology Project (22-317-2-07).

Conflicts of Interest

The authors declare no conflict of interest.

References

  1. Bouma, T.J.; Nielsen, K.L.; Eissenstat, D.M.; Lynch, J.P. Soil CO2 concentration does not affect growth or root respiration in bean or citrus. Plant Cell Environ. 2010, 12, 1495–1505. [Google Scholar] [CrossRef] [Green Version]
  2. Duenas, C.; Fernandez, M.C.; Cartetero, J.; Liger, E.; Perez, M. Emission of CO2 from some soils. Chemosphere 1995, 30, 1875–1889. [Google Scholar] [CrossRef]
  3. Johnson, D.; Geisinger, D.; Walker, R.; Newman, J.; Vose, J.; Elliot, K.; Ball, T. Soil pCO2, soil respiration, and root activity in CO2-futnigated and nitrogen-fertilized ponderosa pine. Plant Soil 1994, 165, 129–138. [Google Scholar] [CrossRef]
  4. Hamada, Y.; Tanaka, T. Dynamics of carbon dioxide in soil profiles based on long-term field observation. Hydrol. Process. 2001, 50, 1829–1845. [Google Scholar] [CrossRef]
  5. Boru, G.; Vantoai, T.; Alves, J. Responses of soybean to oxygen deficiency and elevated root-zone carbon dioxide concentration. Ann. Bot. 2003, 91, 447–453. [Google Scholar] [CrossRef]
  6. Cramer, M.D.; Shane, M.W.; Lambers, H. Physiological changes in white lupin associated with variation in root-zone CO2 concentration and cluster-root P mobilization. Plant Cell Environ. 2005, 28, 1203–1217. [Google Scholar] [CrossRef]
  7. Cramer, M.D.; Titus, C.H.A. Elevated root-zone dissolved inorganic carbon can ameliorate aluminium toxicity in tomato seedlings. New Phytol. 2001, 152, 29–39. [Google Scholar] [CrossRef]
  8. Leibar-Porcel, E.; McAinsh, M.R.; Dodd, I.C. Elevated root-zone dissolved inorganic carbon alters plant nutrition of lettuce and pepper grown hydroponically and aeroponically. Agronomy 2020, 10, 403. [Google Scholar] [CrossRef] [Green Version]
  9. Cramer, M.D.; Lips, S.H. Enriched rhizosphere CO2 concentrations can ameliorate the influence of salinity on hydroponically grown tomato plants. Physiol. Plant. 2010, 94, 425–432. [Google Scholar] [CrossRef]
  10. He, J.; Qin, L.; Lee, S.K. Root morphology, plant growth, nitrate accumulation and nitrogen metabolism of temperate lettuce grown in the tropics with elevated root-zone CO2 at different root-zone temperatures. Am. J. Plant Sci. 2016, 7, 1821–1833. [Google Scholar] [CrossRef]
  11. He, W.; Moonis, M.; Chung, H.; Yoo, G. Effects of high soil CO2 concentrations on seed germination and soil microbial activities. Int. J. Greenh. Gas Control 2016, 53, 117–126. [Google Scholar] [CrossRef]
  12. Grossiord, C.; Mareschal, L.; Epron, D. Transpiration alters the contribution of autotrophic and heterotrophic components of soil CO2 efflux. New Phytol. 2012, 194, 647–653. [Google Scholar] [CrossRef] [PubMed]
  13. Hodge, A.; Berta, G.; Doussan, C.; Merchan, F.; Crespi, M. Plant root growth, architecture and function. Plant Soil 2009, 321, 153–187. [Google Scholar] [CrossRef]
  14. Robinson, D.; Hodge, A.; Fitter, A. Constraints on the Form and Function of Root Systems. In Root Ecology; Springer: Berlin/Heidelberg, Germany, 2003; pp. 1–31. [Google Scholar]
  15. He, J.; Austin, P.T.; Nichols, M.A.; Lee, S.K. Effects of elevated root-zone CO2 and air temperature on photosynthetic gas exchange, nitrate uptake and total reduced nitrogen content in aeroponically grown lettuce plants. J. Exp. Bot. 2010, 61, 3959–3969. [Google Scholar] [CrossRef] [Green Version]
  16. Koch, K.E. Carbohydrate-modulated gene expression in plants. Annu. Rev. Plant Physiol. Plant Mol. Biol. 1996, 45, 509–540. [Google Scholar] [CrossRef] [Green Version]
  17. Jang, J.C.; Sheen, J. Sugar sensing in higher plants. Trends Plant Sci. 1997, 2, 208–214. [Google Scholar] [CrossRef] [Green Version]
  18. Sabine, K.; Edouard, P.; Kleczkowski, L.A. Functional dissection of sugar signals affecting gene expression in arabidopsis thaliana. PLoS ONE 2014, 9, e100312. [Google Scholar]
  19. Munir, R.; Konnerup, D.; Khan, H.A. Sensitivity of chickpea and faba bean to root-zone hypoxia, elevated ethylene, and carbon dioxide. Plant Cell Environ. 2019, 42, 85–97. [Google Scholar] [CrossRef] [Green Version]
  20. He, W.; Yoo, G.; Moonis, M.; Kim, Y.; Chen, X. Impact assessment of high soil CO2 on plant growth and soil environment: A greenhouse study. Peer J. 2019, 7, e6311. [Google Scholar] [CrossRef] [Green Version]
  21. Kesh, H.; Kaushik, P. Advances in melon (Cucumis melo L.) breeding: An update. Sci. Hortic. 2021, 282, 110045. [Google Scholar] [CrossRef]
  22. Lake, J.A.; Steven, M.D.; Smith, K.L.; Lomax, B.H. Plant responses to elevated CO2 levels in soils: Distinct CO2 and O2-depletion effects. Int. J. Greenh. Gas Control 2017, 64, 333–339. [Google Scholar] [CrossRef]
  23. Kolb, R.M.; Dolder, H.; Cortelazzo, A.L. Effects of anoxia on root ultrastructure of four neotropical trees. Protoplasma 2004, 224, 99–105. [Google Scholar] [CrossRef] [PubMed]
  24. Chen, X.; Yin, Z.; Yin, Y.; Xu, C.; Wang, W.; Liu, Y.; Li, T. Effects of elevated root-zone CO2 on root morphology and nitrogen metabolism revealed by physiological and transcriptome analysis in oriental melon seedling roots. Int. J. Mol. Sci. 2020, 21, 803. [Google Scholar] [CrossRef] [Green Version]
  25. Malamy, J. Intrinsic and environmental factors regulating root system growth. Plant Cell Env. 2005, 28, 67–77. [Google Scholar] [CrossRef] [PubMed]
  26. Zürcher, E.; Müller, B. Cytokinin synthesis, signaling, and function-advances and new insights. Int. Rev. Cell Mol. Biol. 2016, 324, 1–38. [Google Scholar] [PubMed]
  27. Malamy, J.E. Intrinsic and environmental response pathways that regulate root system architecture. Plant Cell Environ. 2010, 28, 67–77. [Google Scholar] [CrossRef] [PubMed]
  28. Greenway, H.; Armstrong, W.; Colmer, T.D. Conditions leading to high CO2 (>5 kPa) in waterlogged–flooded soils and possible effects on root growth and metabolism. Ann. Bot. 2006, 98, 9–32. [Google Scholar] [CrossRef] [Green Version]
  29. Comparot-Moss, S.; Kotting, O.; Stettler, M. A Putative Phosphatase, LSF1, Is required for normal starch turnover in Arabidopsis leaves. Plant Physiol. 2010, 152, 685–697. [Google Scholar] [CrossRef] [Green Version]
  30. Geigenberger, P. Response of plant metabolism to too little oxygen. Curr. Opin. Plant Biol. 2003, 6, 247–256. [Google Scholar] [CrossRef]
  31. Ruan, Y.L. Sucrose metabolism: Gateway to diverse carbon use and sugar signaling. Annu. Rev. Plant Biol. 2014, 65, 33–67. [Google Scholar] [CrossRef]
  32. Zeeman, S.C.; Smith, S.M.; Smith, A.M. The diurnal metabolism of leaf starch. Biochem. J. 2007, 401, 13–28. [Google Scholar] [CrossRef] [PubMed]
  33. Trethewey, R.N.; Smith, A.M. Starch Metabolism in Leaves. In Photosynthesis; Springer: Dordrecht, The Netherlands, 2000; pp. 205–231. [Google Scholar]
  34. Rosa, M.; Prado, C.; Podazza, G.; Interdonato, R.; González, J.A.; Hilal, M.; Prado, F.E. Soluble sugars metabolism, sensing and abiotic stress: A complex network in the life of plants. Plant Signal. Behav. 2009, 4, 388–393. [Google Scholar] [CrossRef] [PubMed] [Green Version]
  35. Loreti, E.; de Bellis, L.; Alpi, A.; Perata, P. Why and how do plant cells sense sugars. Ann. Bot. 2001, 88, 803–812. [Google Scholar] [CrossRef] [Green Version]
  36. Gupta, A.K.; Kaur, N. Sugar signalling and gene expression in relation to carbohydrate metabolism under abiotic stresses in plants. J. Biosci. 2005, 30, 761–776. [Google Scholar] [CrossRef]
  37. Wang, H.; Gong, M.; Xin, H.; Tang, L.; Dai, D.; Gao, Y.; Liu, C. Effects of chilling stress on the accumulation of soluble sugars and their key enzymes in Jatropha curcas seedlings. Physiol. Mol. Biol. Plants 2018, 24, 857–865. [Google Scholar]
  38. Wang, Y.; Feng, Y.; Yan, M.; Yu, J.; Zhou, X.; Bao, J.; Wu, C. Effect of saline–alkali stress on sugar metabolism of jujube fruit. Horticulturae 2022, 8, 474. [Google Scholar] [CrossRef]
  39. Yd, A.; Qiang, Z.A.; Lc, A.; Xy, A.; Wei, Z.B.; Bo, Z.C. Effect of drought stress on sugar metabolism in leaves and roots of soybean seedlings. Plant Physiol. Biochem. 2020, 146, 1–12. [Google Scholar]
  40. Albrecht, G.; Mustroph, A.; Fox, T.C. Sugar and fructan accumulation during metabolic adjustment between respiration and fermentation under low oxygen conditions in wheat roots. Physiol. Plant. 2010, 120, 93–105. [Google Scholar] [CrossRef]
  41. Mustroph, A.; Albrecht, G. Tolerance of crop plants to oxygen deficiency stress: Fermentative activity and photosynthetic capacity of entire seedlings under hypoxia and anoxia. Physiol. Plant. 2010, 117, 508. [Google Scholar] [CrossRef]
  42. Centeno, D.C.; Osorio, S.; Nunes-Nesi, A.; Bertolo, A.L.F.; Carneiro, R.T.; Araújo, W.L.; Steinhauser, M.C.; Michalska, J.; Rohrmann, J.; Geigenberger, P. Malate plays a crucial role in starch metabolism, ripening, and soluble solid content of tomato fruit and affects postharvest softening. Plant Cell 2011, 23, 162–184. [Google Scholar] [CrossRef] [Green Version]
  43. Lake, J.; Walker, H.J.; Cameron, D.D.; Lomax, B.H. A novel root-to-shoot stomatal response to very high CO2 levels in the soil: Electrical, hydraulic and biochemical signalling. Physiol. Plant. 2016, 159, 433–444. [Google Scholar] [CrossRef] [PubMed]
  44. Mohammadkhani, N.; Heidari, R. Drought-induced accumulation of soluble sugars and proline in two maize varieties. World Appl. Sci. J. 2008, 3, 448–453. [Google Scholar]
  45. Moore, B.D.; Sheen, J. Plant sugar sensing and signaling-a complex reality. Trends Plant Sci. 1999, 4, 250. [Google Scholar] [CrossRef]
  46. Baslam, M.; Mitsui, T.; Sueyoshi, K. Recent advances in carbon and nitrogen metabolism in C3 plants. Int. J. Mol. Sci. 2020, 22, 318. [Google Scholar] [CrossRef] [PubMed]
  47. Gao, Z.; Petreikov, M.; Zamski, E. Carbohydrate metabolism during early fruit development of sweet melon (Cucumis melo). Physiol. Plant. 1999, 106, 1–8. [Google Scholar]
  48. Lingle, S.E.; Dunlap, J.R. Sucrose metabolism in netted muskmelon fruit during development. Plant Phvsioh. 1987, 84, 386–389. [Google Scholar] [CrossRef] [Green Version]
  49. Ricard, B.; Rivoal, J.; Spiteri, A. Anaerobic stress induces the transcription and translation of sucrose synthasein rice. Plant Physiol. 1991, 95, 669–674. [Google Scholar] [CrossRef] [Green Version]
  50. Crespi, M.D.; Zabaleta, E.J.; Pontis, H.G. Sucrose synthase expression during cold acclimation in wheat. Plant Physiol. 1991, 96, 887–891. [Google Scholar] [CrossRef] [Green Version]
  51. Sringer, B.; Werr, W.; Stralinger, P. The shrunken gene on chromosome of Zea mays L. is expressed in various plant tissues and encodes an anaerobic protein. Mol. Gen. Genet. 1986, 205, 461–468. [Google Scholar] [CrossRef]
  52. Fernandez, O.; Vandesteene, L.; Feil, R.; Baillieul, F.; Lunn, J.E.; Clément, C. Trehalose metabolism is activated upon chilling in grapevine and might participate in Burkholderia phytofirmans induced chilling tolerance. Planta 2012, 236, 355–356. [Google Scholar] [CrossRef]
  53. Lester, G.E.; Arias, L.S.; Gomez-Lim, M. Muskmelon fruit soluble acid invertase and sucrose phosphate synthase activity and polypeptide profiles during growth and maturation. J. Am. Soc. Hortic. Sci. 2001, 126, 33–36. [Google Scholar] [CrossRef] [Green Version]
  54. Schluepmann, H.; Van Dijken, A.; Aghdasi, M.; Wobbes, B.; Paul, M.; Smeekens, S. Trehalose mediated growth inhibition of Arabidopsis seedlings is due to trehalose-6-phosphate accumulation. Plant Physiol. 2004, 135, 879–890. [Google Scholar] [CrossRef] [PubMed] [Green Version]
  55. Gómez, L.D.; Gilday, A.; Feil, R.; Lunn, J.E.; Graham, I.A. AtTPS1-mediated trehalose 6-phosphate synthesis is essential for embryogenic and vegetative growth and responsiveness to ABA in germinating seeds and stomatal guard cells. Plant J. 2010, 64, 1–13. [Google Scholar] [CrossRef] [PubMed]
  56. Huang, Y.W.; Nie, Y.X.; Wan, Y.Y.; Chen, S.Y.; Sun, Y.; Wang, X.J.; Bai, J.G. Exogenous glucose regulates activities of antioxidant enzyme, soluble acid invertase and neutral invertase and alleviates dehydration stress of cucumber seedlings. Sci. Hortic. 2013, 162, 20–30. [Google Scholar] [CrossRef]
  57. Dziedzoave, N.T.; Graffham, A.J.; Westby, A. Influence of variety and growth environment on β-amylase activity of flour from sweet potato (Ipomea batatas). Food Control 2010, 21, 162–165. [Google Scholar] [CrossRef]
Figure 1. Elevated root-zone CO2 concentration on cellular ultrastructure of oriental melon seedling roots (A). Ultrastructure changes in root tips after treatment of high root-zone CO2. The magnification is 2.0 K. Scale bar: 5.0 µm. The white arrows in CK-3d, T1-3d and T2-3d indicated that the start of the formation of starch grains within the cells. The white arrows in CK-6d, T1-6d and T2-6d indicated that the content of starch grains under T2 treatment was significantly higher than that of CK and T1. The white arrows in T1-9d and T2-9d indicated that the number of organelles began to dissolve and disappear. The white arrows in T1-12d and T2-12d indicated that there were fewer organelles in T2 than in T1 on the 12th day. The white arrows in T1-15d and T2-15d indicated that the organelles in T2 were completely dissolved compared with T1. Day 0 means no treatment. On the 3rd day, it was observed that the number of mitochondria was significantly increased, and the number of starch grains under T1 was larger than that of the T2 treatment. On the 6th day, it was observed that the starch grains under the CK group (control check, elevated root-zone CO2 concentration 0.2%) began to accumulate, accompanied by the increase in mitochondria, while the amyloid membrane of T2 began to rupture and dissolve, then the starch grains were released. On the 9th day, starch grains treated with the increase in root-zone CO2 concentration began to accumulate in the inner cells of the roots, the number of mitochondria was significantly reduced and cavities appeared, while the starch grains under T2 treatment of the amyloplasts were mostly released. On the 12th day of treatment, the mitochondria in the apical cells were deformed, the number of inner cristae decreased and the edges were blurred. On the 15th day, only a small number of recognizable organelles remained in the apical cells under T1 treatment, the starch grains of T2 root tip cells were released, and starch grains of the CK group began to be released but mitochondria could still be found. (B) Ultrastructure changes in root tips after elevated root-zone CO2 treatment for 3, 6, 9, 12 and 15 days. The magnification is 1.0 K. Scale bar: 1.0 µm.
Ijms 23 12537 g001
Figure 2. Heat map of gene expression correlation among processed samples. Different colors represent the magnitude of the values: closer to blue means higher correlation between samples, and closer to purple means lower correlation between samples. CK-1, CK-2 and CK-3 represent three sample replicates of the control group, T1 and T2 as above.
Ijms 23 12537 g002
Figure 3. Distribution of the number of up-regulated and down-regulated differentially expressed genes (DEGs) between treatments (A). Red indicates upregulation, green indicates downregulation. (B) DEG distribution of samples in T1/CK, T2/CK and T2/T1. The criteria of|Log2FoldChange| ≥ 1 and false-discovery rate (FDR) ≤ 0.05 were used to indicate the significance of differentially expressed genes (DEGs).
Ijms 23 12537 g003
Figure 4. Functional classification and enrichment analysis of DEG in KEGG (left). The x-axis represents the number of annotated DEGs under each pathway and its proportion to the total number of genes; The y-axis represents the name of the KEGG pathway, namely cellular processes, environmental information processing, genetic information processing, metabolism and biological systems. Enrichment analysis of differential gene KEGG pathway (right). The x-axis represents the enrichment factor and the y-axis represents the KEGG pathway. The color indicates the significant level of DEGs, and the size of the dot indicates the number of DEGs enrichment.
Ijms 23 12537 g004aIjms 23 12537 g004b
Figure 5. Effects of high root-zone CO2 on soluble sugar content and starch content of oriental melon seedling roots. Triplicate biological replicates were performed. The error bars indicate the standard error (SE) of the mean. Significant differences are represented by different lowercase letters (a, b and c represent p < 0.05).
Ijms 23 12537 g005
Figure 6. Alterations in the sugar content in the roots of oriental melon seedlings, including fructose, glucose, sucrose, trehalose, stachyose, and raffinose, following treatment with high root-zone CO2. The biological replicates were performed in triplicate. The error bars indicate the standard error (SE) of the mean. The different lowercase letters indicate significant differences (a, b, and c represent p < 0.05).
Ijms 23 12537 g006
Figure 7. The activity of the enzymes related to sugar and starch metabolism in the roots under elevated root-zone CO2, including AI, NI, SPS, SSI, α-amylase, β-amylase, TS, and TPS. The biological replicates were performed in triplicate. The error bars indicate the standard error (SE) of the mean. The different lowercase letters represent significant differences (a, b, and c represent p < 0.05).
Ijms 23 12537 g007
Figure 8. qRT-PCR analysis of major genes related to sugar and starch metabolism. The relative expression of CmNI, CmSNFK1, CmSPS, CmSS, CmAMY, CmBAM, CmTPS and CmTS genes in oriental melon seedling roots on the 6th day under elevated root-zone CO2 treatments were measured. Significant differences between treatments and control are marked with lowercase letters (a, b and c represent p < 0.05).
Ijms 23 12537 g008
Figure 9. Root-zone CO2 cultivation and treatment equipment (quoted Chen et al., 2020 [24]).
Ijms 23 12537 g009
Table 1. Root growth indices and root vigor at different root-zone concentrations of CO2.
Root Growth IndicesTreatment GroupsDays of Treatment (Day)
3691215
Total root length (cm)CK843.67 ± 1.53 c1107.33 ± 2.08 c1476.11 ± 2.21 a1597 ± 1.32 a1724.15 ± 2.65 a
T1903.21 ± 1.24 b1175.55 ± 2.65 a1333.67 ± 3.06 b1396.67 ± 1.65 b1522.67 ± 3.06 b
T21099.54 ± 1.21 a1127.33 ± 2.08 b1256.33 ± 2.52 c1322.24 ± 2.02 c1456.65 ± 2.03 c
Total root surface area (cm2)CK206.33 ± 2.52 c466.33 ± 1.53 a906 ± 1.23 a1467.67 ± 1.53 a1564.33 ± 1.35 a
T1296.67 ± 3.21 b462.33 ± 2.58 b864 ± 3.61 b1434.33 ± 3.52 b1493.67 ± 4.04 b
T2436 ± 2.65 a455.67 ± 3.06 b714.67 ± 2.52 c1304.33 ± 0.58 c1363 ± 3.02 c
Total root volume (cm3)CK0.87 ± 0.03 c1.33 ± 0.04 b1.55 ± 0.02 b2.64 ± 0.02 a2.93 ± 0.02 a
T11.04 ± 0.01 b1.37 ± 0.01 b1.63 ± 0.01 a2.37 ± 0.02 b2.37 ± 0.02 b
T21.26 ± 0.02 a1.42 ± 0.01 a1.37 ± 0.01 c1.73 ± 0.02 c2.05 ± 0.03 c
Root vigor
(μg·g−1·h−1)
CK12.66 ± 0.14 c13.67 ± 0.17 c15.08 ± 0.14 a5.98 ± 0.16 a16.45 ± 0.17 a
T113.46 ± 0.12 b14.86 ± 0.18 b14.56 ± 0.11 b15.26 ± 0.12 b15.76 ± 0.14 b
T214.97 ± 0.12 a17.58 ± 0.11 a13.13 ± 0.13 c13.07 ± 0.12 c12.99 ± 0.12 c
Total root tip numberCK867 ± 1.53 c1163 ± 2.08 c1446 ± 2.09 a1543 ± 1.53 a1685 ± 3.12 a
T11006 ± 1.28 b1277 ± 1.53 ab1403 ± 1.04 a1499 ± 1.35 b1543 ± 1.53 b
T21222 ± 4.74 a1424 ± 3.21 a1295 ± 3.21 c1323 ± 3.21 c1312 ± 2.65 c
0–0.5 mm root tip numberCK255 ± 1.21 c276 ± 2.08 c246 ± 1.52 b265 ± 1.15 a244 ± 1.53 a
T1337 ± 1.73 a354 ± 1.44 a274 ± 2.04 a235 ± 1.97 b221 ± 1.54 b
T2280 ± 1.09 b310 ± 1.14 b221 ± 1.11 c181 ± 0.54 c158 ± 1.73 c
0.5–2.0 mm root tip numberCK489 ± 1.21 c516 ± 2.28 c667 ± 1.44 a681 ± 1.71 a713 ± 1.62 a
T1544 ± 2.05 b551 ± 1.15 b598 ± 1.61 b620 ± 1.34 b657 ± 2.04 b
T2590 ± 2.00 a655 ± 1.25 a567 ± 0.26 c580 ± 0.88 c602 ± 1.53 c
CK: CO2 concentration in greenhouse soil (0.2%, control check); T1: elevated root-zone CO2 concentration treatment of 0.4%; T2: elevated root-zone CO2 concentration treatment of 1.1%. Duncan’s multiple range tests were conducted: Significant differences between control and treatments are marked with lowercase letters (a, b and c represent p < 0.05).
Table 2. Summary of transcriptome sequencing data.
Sample
Name
Clean ReadsClean Bases% ≥Q30Mapped ReadsUnique Mapped ReadsGC Content
CK-120,972,3836,281,865,34892.95%39,476,959 (94.12%)38,780,024 (92.45%)43.84%
CK-221,989,4926,587,534,17892.62%41,278,506 (93.86%)40,506,664 (92.10%)44.19%
CK-319,324,2965,782,784,58892.88%36,309,424 (93.95%)35,665,517 (92.28%)43.79%
T1-121,680,0976,481,877,99292.94%40,640,140 (93.73%)39,880,455 (91.97%)44.48%
T1-222,140,8656,624,929,87892.68%41,229,200 (93.11%)40,478,885 (91.41%)44.45%
T1-321,089,8956,312,995,22092.76%39,347,813 (93.29%)38,609,369 (91.54%)44.37%
T2-121,309,5516,376,761,95293.05%39,664,868 (93.07%)38,978,316 (91.46%)44.52%
T2-221,762,2846,517,388,23092.82%40,803,032 (93.75%)40,125,589 (92.19%)43.96%
T2-322,392,0786,709,294,35892.91%42,016,764 (93.82%)45,076,178 (92.90%)44.39%
Clean Reads: the total number of pair-end reads in Clean Data; Clean Bases: the total number of bases in Clean Data; ≥Q30%: the percentage of bases with a Clean Data quality value of 30 or more. Mapped Reads: reads that are compared to the melon reference genome, which is the sum of all reads for each sample; Unique Mapped Reads: reads that are compared to the unique position of the melon reference genome; GC content: the percentage of G and C bases in Clean Data.
Table 3. DEGs related to sugar and starch metabolism.
Comparison between TreatmentsGene IDGene NameFDRLog2Fold ChangeRegulation
T1/CKMELO3C006362.2BAM1.29 × 10351.549877695up
MELO3C005751.2TS2.22 × 10651.073184869up
MELO3C026210.2SNFK11.76 × 10451.019037441up
MELO3C017002.2AMY2.21 × 107−1.237429382down
T2/CKMELO3C006362.2BAM1.39 × 10171.210496866up
MELO3C005751.2TS03.029269697up
MELO3C025673.2TPS5.77 × 101851.669152326up
MELO3C017942.2SS7.66 × 10551.17349538up
MELO3C026210.2SNFK13.87 × 10−941.44586252up
MELO3C006727.2NI1.02 × 10551.130833392up
MELO3C017002.2AMY2.21 × 107−1.237429382down
T2/T1MELO3C025673.2TPS5.77 × 101851.669152326up
MELO3C005751.2TS03.029269697up
MELO3C006727.2NI1.02 × 10551.130833392up
MELO3C020357.2SPS1.86 × 108−1.040248354down
FDR: statistical value of significant difference; Log2Fold Change: logarithmic value of multiple of differential expression; Regulation: relative expression status of gene compared to CK.
Table 4. Specific primers used for qRT-PCR.
Gene ID Sequence (5–3)
ActinFAAGGCAAACAGGGAGAAGATGA
RAGCAAGGTCGAGACGTAGGATA
MELO3C017002.2FCCCAACCTTTTGTCCGTAGAG
RCAATCCAATTTATTATCCGCTGT
MELO3C013887.2FTGATGATGCCGTTGGACAGT
RCCGTGCTTTTTAGCCATTTCT
MELO3C017942.2FTTTACTCGTAGCCCCAGCGT
RAATGGCGGCAGAACAATAGC
MELO3C020357.2FCGTGCTCGGCGTGGAGTA
RGGAGAGGACCCATCGCTTGTA
MELO3C005751.2FAACAGAAGTCAGCCTCCCCTT
RTGATGCGATTTCACGGTATAGAT
MELO3C025673.2FATTGGCGTGATAAAGTTGTTTTG
RATATAGCGCACACAAGTGCATGA
MELO3C026210.2FGAAATGCGTCGAAGAAGGCT
RTCGTGTTGTCCCAACGGTGT
MELO3C006727.2FCTTTATGTCTGTCGGAGGGTT
RGCTTCACAATACGCTCTATGCACT
F: Forward. R: Reverse.
Publisher’s Note: MDPI stays neutral with regard to jurisdictional claims in published maps and institutional affiliations.

