Article

Effect of Heat Starvation Stress on Physiological Immunity and Metabolism of Mizuhopecten yessoensis

1
Key Laboratory of Marine Biological Resources and Ecology, Liaoning Ocean and Fisheries Science Research Institute, Dalian 116023, China
2
College of Fisheries and Life Science, Dalian Ocean University, Dalian 116023, China
3
National Marine Environment Monitoring Center, Dalian 116023, China
4
College of Marine Sciences and Technology and Environment, Dalian Ocean University, Dalian 116023, China
*
Author to whom correspondence should be addressed.
Sustainability 2022, 14(20), 13217; https://doi.org/10.3390/su142013217
Submission received: 4 September 2022 / Revised: 11 October 2022 / Accepted: 11 October 2022 / Published: 14 October 2022

Abstract

:
Mizuhopecten yessoensis is an economical maricultural bivalve mollusk in China and Japan. Due to the high mortality rate, academics have paid more attention to the effects of the environment recently. However, little is known about the physiological, immune, and metabolic effects of M. yessoensis under starvation stress at high temperatures. Herein, transcriptomic libraries of hemolymph and striated adductor muscle from feeding and starved M. yessoensis were constructed. The results showed that the immune indexes decreased in the concentration of M. yessoensis blood cells and liver lysozyme activity at 15 d, M. yessoensis fertility and liver ACP at 30 d of starvation stress, and T-AOC and BCA at 45 d of starvation stress. A total of 853.85 M clean reads were obtained from 20 libraries, with an average total mapping ratio of 83.38% to the reference genome. Based on an examination of the genes that differ in expression between the fasted and feeding groups, 27 up- and 41 down-regulated DEGs were identified in hemolymph, while the numbers in striated adductor muscle were 426 up- and 255 down-regulated. Determined by GO annotation and KEGG pathway mapping, annotations and categories of the DEGs presented diverse biological functions and processes. KEGG analysis showed that most downregulated DEGs in striated muscle were enriched in the pathways involved in metabolism. Genes encoding the enzymes, including eno, pgk, gapA, tpiA, fbp, pgi, and pgm in the gluconeogenesis pathway, were down-regulated, which was indicative of the negative effect of long-term starvation on gluconeogenesis. The down-regulation of PGD and tktA genes in the pentose phosphate pathway suggested that the carbohydrate decomposition and utilization were decreased in starved scallops. Together, the findings demonstrated the influences of food deprivation on carbohydrate metabolism and other processes in M. yessoensis. These results provide foundational information for further understanding of metabolism, especially carbohydrate metabolism of scallops under starvation, which may potentially benefit healthy aquaculture.

1. Introduction

Mizuhopecten yessoensis, natively distributed in the cold seas along the coasts of the north islands of Japan, the northern part of the Korean Peninsula, Sakhalin, and the Kuril Islands, has been wonderfully appreciated as a culinary delicacy of Northeast Asia [1]. Since being introduced into China in 1982, M. yessoensis has become one of the most favorite commercial species. However, the continuous massive death of Mizuhopecten yessoensis in summer has caused a heavy blow to the scallop breeding industry since 2007 [2]. The massive death of M. yessoensis was related to many factors, which were mainly germplasm degradation and ecological environment change. The rising water temperature and food shortage have a severe impact on cold-water shellfish. Studies have found that bait microalgae have different nutrient contents in different particle sizes as the nutritional basis of filter-feeding shellfish, and the utilization rate of filter-feeding shellfish was also different. Filter-feeding shellfish have two selective strategies for the cell size of feed microalgae: Quality selection type (scallops, etc.) and quantity selection type (clams, etc.). The cell size structure of microalgae affected the normal nutritional reserve and healthy growth of shellfish, and microalgae with a smaller cell size had a more significant impact on the quality selective type of shellfish [3,4]. Microalgae biomass in the M. yessoensis culture area of Changshan Islands was generally low, and picophytoplankton was in the majority. In addition to overloaded farming, the severe lack of effective food microalgae led to long-term low immunity of the scallop [5], frequent diseases, increased mortality, and water temperature stress, exacerbating the massive mortality of scallops [2].
Numerous researchers have probed pathogenic organisms and scallop immune mechanisms, because healthy aquaculture is closely related to breeding environmental factors [6,7]. Considering the aggravation of the impact of climate changes and human activities, as well as the expansion of the aquaculture scale and breeding density, we accepted the probable existence of food deprivation during some periods, which might affect the immune system and energy metabolism of the scallops. The studies on the Zhikong scallop (Chlamys farreri) [8], the Sydney rock oyster (Saccostrea glomerata) [9], and the white shrimp (Litopenaeus vannamei) [10] all pointed out the effects of starvation stress on the immune system of marine aquatic animals. On the subject of metabolism, the responses to starvation in the shrimp (Penaeus japonicus) [11], cuttlefish (Sepia officinalis) [12], and Pacific oyster (Crassostrea gigas) were investigated [13,14].
Previous studies on metabolism in bivalves during starvation presented data and information about the biochemical composition, which consisted of protein, glycogen, lipid, and total carbohydrate contents [13,14], the fatty acid dynamics in different tissues [15], the total hemocyte counts, functional parameters, and enzyme activities [8], and the expression level of genes concerning regulating metabolism and growth [16]. Profiting from the C. farreri reference genome reported, relevant information about genes involved in energy-producing reactions was provided, including those participating in the hydrolysis of phosphoryl arginine, glycolysis, and the TCA cycle [17]. However, insight into the metabolism of scallops under food deprivation is still limited and fragmented, and is mostly about the enzyme activities and content, while even the cloning and expression of related genes have rarely been reported [17].
Systematic analysis combining physiological status with omics provides ideas for the overall point of exploring the regulating effect and molecular mechanism in organisms. The reference genome of M. yessoensis has been constructed, and some topics including shell formation and immunomodulation [18], sex differentiation [19], and inbreeding depression have been investigated by transcriptomic analysis [20]. Carbohydrate metabolism is the most basic aspect of life. To our knowledge, there has been no previous report concerning the regulation of the metabolism pathway in this species under food deprivation. In this study, we starved the M. yessoensis to improve comprehension of the metabolism of scallops under long-term starvation based on the transcriptomic level for the first time: (1) Constructing the transcriptomes of hemolymph and striated adductor muscle to obtain the general cognition of the differentially expressed genes, and (2) focusing on the carbohydrate metabolism, especially the pathway of DEGs enriched.

2. Materials and Methods

2.1. Animals, Measurement, and Collection

The experimental samples of M. yessoensis (51.7 ± 5.6 g) were collected in June 2020 from Lvshun, Liaoning Province, China. The scallops were cleaned to ensure no contamination from other organisms. After acclimating for 6 days in aerated sand-filtered seawater, the scallops were divided into the feeding group and the starved group, and they were maintained in separated breeding sinks. The specification of the breeding sink was 2 m3, and the volume of water was 1.5 m3. Scallops in the feeding group were fed Chlorella vulgaris (2 × 10⁵ cells/mL) and Isochrysis galbana (3 × 10⁴ cells/mL) daily; in contrast, the starved group was not fed (during the test, the detection of microalgal cell abundance was performed using counting frame microscopy, and the density of microalgae in the natural seawater was within 104 cells/L). During the experiment, the water was exchanged every day, the seawater during the respite period was the seawater near the laboratory, and the salinity and temperature during the experiment were the same as the seawater conditions in the sea (30 ± 0.5 ppt, 20 ± 1 °C).
The starvation group (experimental group) and the feeding group (control group) were sampled after 15 d, 30 d, and 45 d of treatment, respectively. From each group, six scallops were randomly chosen. Blood was extracted from the closed-shell muscle sinusoids of scallops using a 1 mL syringe, mixed with anticoagulant 1% heparin, and centrifuged at 4 °C and 4000 rpm for 10 min. The supernatant was kept in storage at 80 °C, and then approximately 0.1 g of liver and closed-shell muscle were weighed. Furthermore, 1 mL of the extraction solution was added, fully ground, and centrifuged at 4 °C and 8000 rpm for 10 min, and the supernatant was taken for the measurement of blood cells and each immunoenzymatic activity.
The condition index was measured on the 30th and 45th days as follows: (1) The total weight was obtained by blotting the scallop with tissue paper and weighing it to the nearest 0.01 g; (2) after the scallop was opened, all tissues (without shell) as a whole part was blotted with tissue paper then weighed [21]. condition index (%) = [wet meat weight (g)/total weight (g)] × 100%.
Sampling for sequencing was performed on the 45th day of starvation. Taken from the adductor muscle using a sterile syringe, 1.5 mL of hemolymph was centrifuged for 1000× g at 4 °C. Following closely, ~0.5 g of the striated adductor muscle was dissected and put into RNAwait (Meilunbio, Dalian, China) overnight at 4 °C. The centrifuged hemocytes were also stored in RNAwait for 4 °C overnight. After 24 h, the new precooled RNA water was exchanged into the sample tube and all samples were stored at −20 °C until RNA extraction.
For biological duplicates, the condition index was measured in 10 scallops per group each time and the RNA sampling was collected from 5 scallops for each group.

2.2. Analysis of Biochemical Indicators

Blood cell density was measured using the hemocytometer. The hepatic lysozyme (LYM) activity was measured using the Nanjing Jiancheng lysozyme enzyme kit. The hepatic acid phosphatase (ACP) activity was measured using the Solarbio Acid Phosphatase Kit with LYM and ACP activities defined as 1 μmol phenol per minute per gram of tissue catalyzed at 37 °C. The plasma protein concentration (BAC) was determined by the Solarbio protein concentration kit. The total antioxidant capacity of plasma (T-AOC) was determined by the Solarbio total antioxidant capacity detection kit. Malondialdehyde (MDA) was detected using the Solarbio Malondialdehyde detection kit.

2.3. RNA Extraction, Library Construction and RNA-Seq

Total RNA was extracted from approximately 60 mg tissues using Trizol (Invitrogen, Carlsbad, CA, USA) based on the manufacturer’s protocol after being pulverized in liquid nitrogen. The total RNA was qualified and quantified with a Nanodrop and Agilent 2100 bioanalyzer (Thermo Fisher Scientific, Waltham, MA, USA). A total of twenty RNA-seq libraries were constructed from M. yessoensis, in which the hemolymph and strained adductor muscle of feeding scallops were sorted as control groups, and those of starved scallops as testing groups. Oligo (dT)-attached magnetic beads were used to purify the mRNA. After the operations of purifying fragmented mRNA, generating cDNA, and repairing and purifying product ends, the products were dissolved in an EB solution. Checking the distribution of fragments size and quantifying via QRT-PCR, the libraries were amplified and subjected to paired-end sequencing on the MGISEQ-2000 (BGISEQ, DNBSEQ-G400).

2.4. Data Preprocessing

The sequencing data were filtered with trimmomatic (v0.36) while SOAPnuke (v1.4.0) was used for statistics. Reads containing the sequencing adapter were removed, followed by those unknown base (N base) ratios higher than 5% and low-quality base ratios more than 20%. The obtained clean reads were stored and mapped to the M. yessoensis reference genome (https://www.ncbi.nlm.nih.gov/genome/?term=txid6573[Organism:noexp] (accessed on 17 October 2020)) with HISAT2 (v2.1.0), and rMATS (v3.2.5) was used to fuse genes. Following that, the clean reads were aligned to the coding gene set using bowtie2 (v2.2.5) software, and RSEM was used to calculate the gene expression level (v1.2.8). The Pearson correlation coefficient between each sample was calculated by the cor function in the R package (v3.6.3).

2.5. Differentially Expressed Genes

The clean reads were matched back and then the read count of each unigene in libraries was calculated and normalized to FPKM (fragments per kilo base of transcript per million mapped reads) [22,23]. The FPKM values were used to measure the gene expression between samples. The DESeq2 package was applied to identify the differentially expressed genes (DEGs), using p value ≤ 0.05 as the false discovery rate limit. In the analysis of terms and pathways interested in this study, a stringent Q value (adjusted p value) ≤ 0.05 and an absolute value of log2FoldChange ≥ 1 were set as thresholds for the significance of gene expression differences between groups.
Levene’s Test for Equality of Variances (t-test for Equality of Means) was used to analyze the effects of the duration of starvation on the fatness, blood cell concentration, and biochemical immune indexes of M. yessoensis, and the differences between the duration of starvation and the indexes in the experimental and control groups were analyzed by one-way ANOVA. One-way ANOVA was performed to confirm the normality and Chi-square of the data before analysis, and the significance level of each analysis was set at p < 0.05.

2.6. Function Enrichment Analysis

The DEGs were annotated for GO and KEGG enrichment analysis. The DEGs function annotation was conducted based on the public database of Gene Ontology (GO, http://www.geneontology.org/ (accessed on 20 October 2020)) and Kyoto Encyclopedia of Genes and Genomes (KEGG, http://www.genome.jp/kegg/ (accessed on 20 October 2020)). Gene numbers for every term were calculated, then GO and KEGG enrichment analyses of DEGs were performed by Phyper (https://en.wikipedia.org/wiki/Hypergeometric_distribution (accessed on 23 October 2020)) based on a hypergeometric test.

3. Results

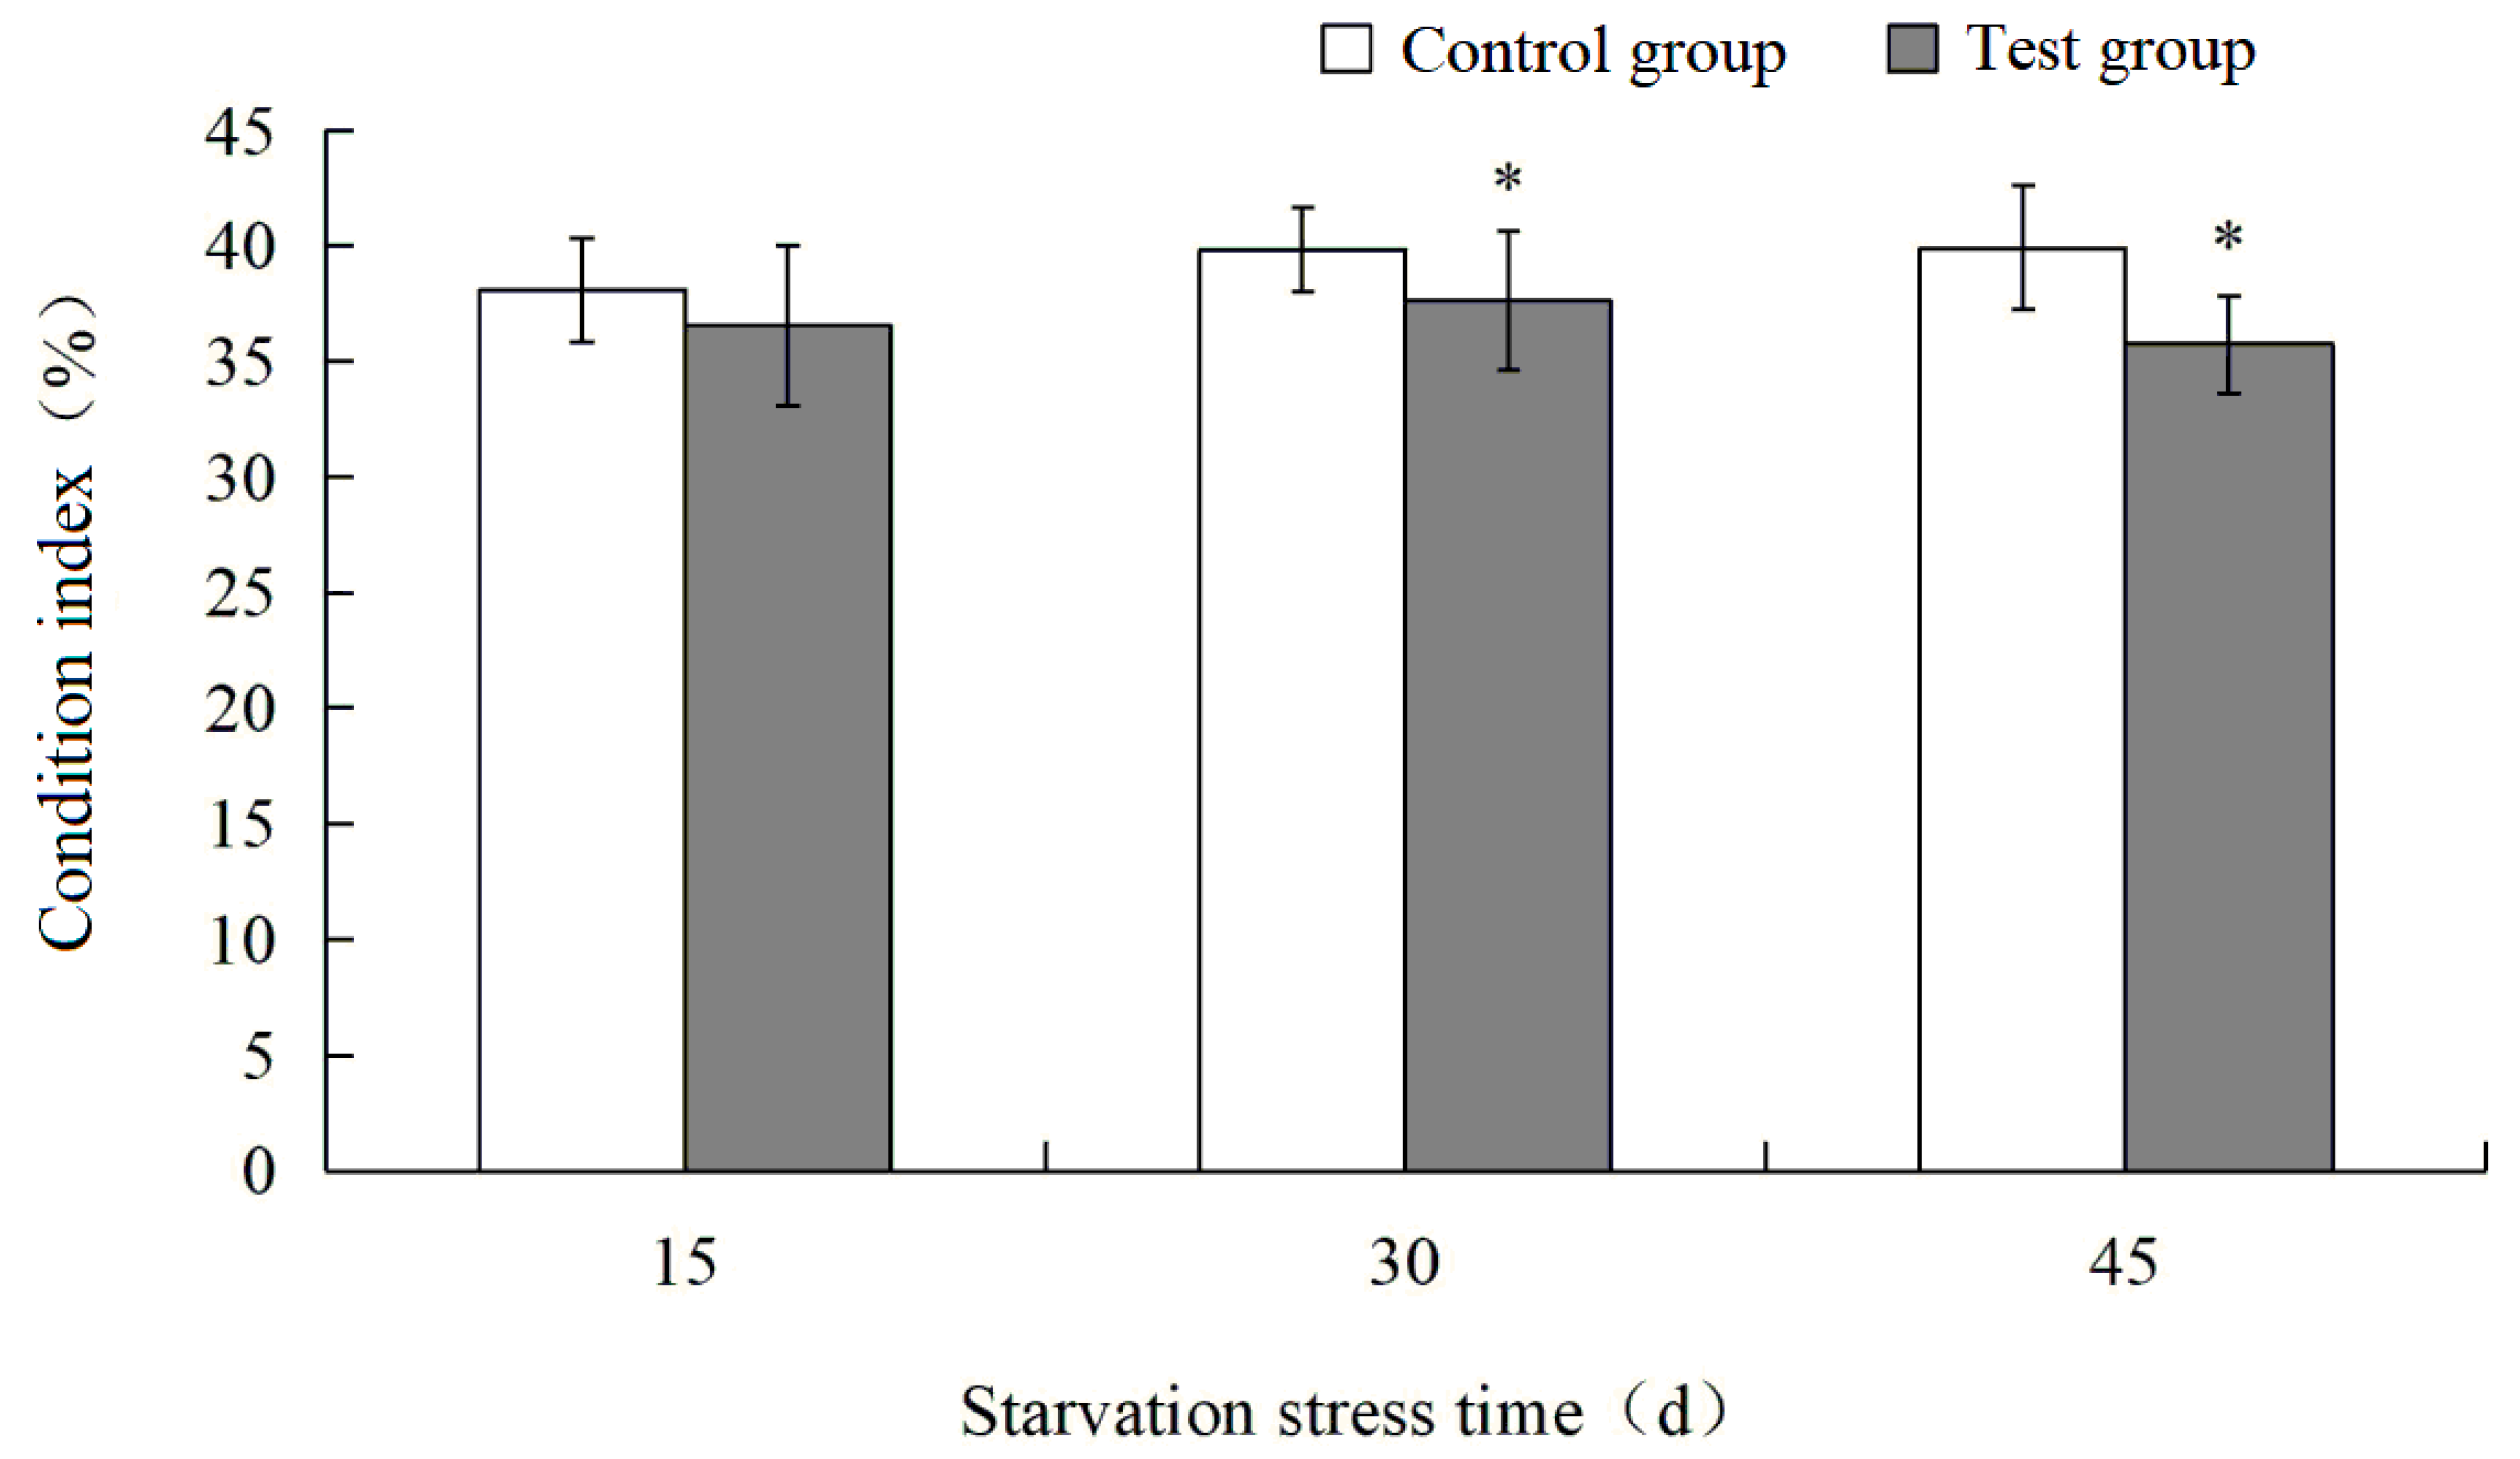
3.1. Effects of Starvation Stress on Condition Index of M. yessoensis

After 15 d of starvation stress, there was no significant difference in the condition index of M. yessoensis compared with the control group. The average weight and condition index of the control group were 53.60 ± 4.68 g and 38.27 ± 1.77%, and the average weight and condition index of the experimental group were 48.96 ± 4.98 g and 36.49 ± 2.68%. After 30 d of starvation stress, the mean body weight and condition index were 51.60 ± 3.67 g and 39.80 ± 1.34 g in the feeding group, and 48.24 ± 3.58 g and 37.61 ± 2.25% in the hungry group. After 45 d of starvation stress, the average weight and condition index of the fed group were 50.25 ± 5.77 g and 39.92 ± 2.15%, and the average weight and condition index of the hungry group were 47.99 ± 2.94 g and 35.75 ± 1.63%. The condition index of the experimental group was significantly decreased under starvation stress for 30 d and 45 d (p < 0.05). With the prolongation of starvation stress, the condition index of the control group and the experimental group were not significantly changed (Figure 1).

3.2. Effects of Starvation Stress on Biochemical Indexes of M. yessoensis

The blood cell concentrations of M. yessoensis under starvation stress for 15 d, 30 d, and 45 d were significantly lower than those of the control group. With the prolongation of starvation stress, the blood cell concentration of the control group firstly decreased and then increased significantly (p < 0.05). Although the blood cell concentration of the experimental group firstly decreased and then increased, the difference was not significant compared with the same group (Figure 2).
The ACP in the liver of M. yessoensis under starvation stress was lower than that in the control group for 15 d, but no significant difference was noticed. After 30 d and 45 d of starvation stress, the ACP in the liver of M. yessoensis in the experimental group was significantly lower than that in the control group (p < 0.05). With the prolongation of starvation stress, the ACP in the liver of M. yessoensis in the control group firstly increased and then decreased significantly, that is, it was significantly higher than 15 d at 30 d, and it was still significantly higher than 15 d at 45 d although it was significantly lower than 30 d. Similar to the control group, it first increased and then decreased, except that it decreased to a level that was not substantially different from 30 d to 45 d (Figure 3).
The lysozyme activities of M. yessoensis liver under starvation stress were significantly lower than those of the control group for 15 d, while the lysozyme activities of the experimental group were still lower than those of the control group under starvation stress for 30 d and 45 d, but the differences between the two were not significant. With the prolongation of starvation stress, the lysozyme activity of the control group exhibited a declining trend, but it did not reach a significant level, while the experimental group maintained a stable state (Figure 4).
When starved for 15 d, the plasma T-AOC level of M. yessoensis in the experimental group was higher than in the control group, but the difference did not reach a meaningful level. When starved for 30 d, the experimental group was lower than the control group, and the difference did not reach a significant level. When starved for 45 d, the experimental group was significantly lower than the control group (p < 0.05). With the prolongation of starvation stress, the control group showed an upward trend, while the experimental group showed a downward trend, but the changes were not significant (Figure 5).
There was no significant difference in MDA content between the M. yessoensis and the control group under starvation stress for 15 d, 30 d, and 45 d. With the prolongation of starvation stress, both the control group and the experimental group showed a trend of increasing at first and then decreasing, and the content of MDA in the experimental group at 30 d and 45 d of starvation was significantly higher than that at 15 d of starvation (p < 0.05) (Figure 6).
There was no significant difference between the plasma BCA of M. yessoensis and the control group after 15 d and 30 d of starvation stress, but it was significantly lower than the control group after 45 d of starvation stress (p < 0.05). With the prolongation of starvation stress, the BCA values of the control group and the experimental group showed a downward trend, and the BCA values of the two groups were significantly higher at 15 d than at 30 d and 45 d (Figure 7).

3.3. Sequence Analysis

A total of 20 libraries were conducted and named as follows: FHL1–5, FSM1–5, SHL1–5, and SSM1–5 for hemolymph and striated adductor muscles from feeding scallops and hemolymph and striated adductor muscles from starved scallops, respectively. Upon filtering low-quality reads from 925.47 M total raw reads, a mean of 6.40 Gb clean bases was obtained for each library, with a GC content of 40.85–44.40%. Q30 of the libraries ranged from 89.74% to 90.97%. As we aligned 853.85 M clean reads with the reference genome, the average total mapping and the unique mapping ratio were 83.38% and 42.68%, respectively. Raw sequence reads are available at the NCBI Sequence Read Archive with the accession code PRJNA724002 (See Table S1).

3.4. Differentially Expressed Genes

Expression levels of DEGs were well correlated among biological duplicates within groups, and the Pearson correlation coefficients are shown in Figure 8. Data from all samples were used for subsequent statistics. The analysis of gene expression levels revealed the changes between the starved group and the feeding group. Compared with the feeding groups, 68 differentially expressed genes were obtained in hemolymph from starved samples, including 27 up-regulated and 41 down-regulated. Meanwhile, in striated adductor muscles, 681 differentially expressed genes were identified in the starved group, with 426 up-regulated and 255 down-regulated among them (See Supplementary Files). The volcano plot reflected the asymmetry in gene expression (Figure 9).

3.5. GO Functional Analysis of DEGs

A Gene Ontology functional annotation was carried out to analyze the DEGs in terms of the three GO processes (Figure 10). The numbers of terms in functional categories of biological processes (BP), cellular components (CC), and molecular functions (MF) were 8, 7, and 5 for DEGs of hemolymph in starved scallops compared to the feeding group. In the BP category, the DEGs were significantly enriched in terms of the cellular process, metabolic process, and biological regulation. In the CC process, the membrane, membrane part, and cell were the most abundant terms. In the MF category, binding and catalytic activity were the most represented GO terms. Among the DEGs classified by GO categories, the term up-regulated was particularly represented in the membrane, membrane part, binding, and catalytic activity. In addition, the down-regulated DEGs were mainly enriched in terms of the cellular process, metabolic process, biological regulation, cell, membrane, membrane part, binding, and catalytic activity.
For the comparison of DEGs in striated adductor muscles between the starved group and the feeding group, there were 17, 14, and 10 terms for the classification of BP, CC, and MF, respectively, which obtained more annotation terms than those in hemolymph. As shown in the distributions of level2 GO terms in Figure 10, the cellular process, metabolic process, cell, membrane, membrane part, organelle, binding, and catalytic activity were the main level 2 terms represented, and the number of up-regulated DEGs was higher than that of down-regulated. Correspondingly, their abundance was dominated by up-regulated and down-regulated DEGs, which were enriched in the same categories of terms.

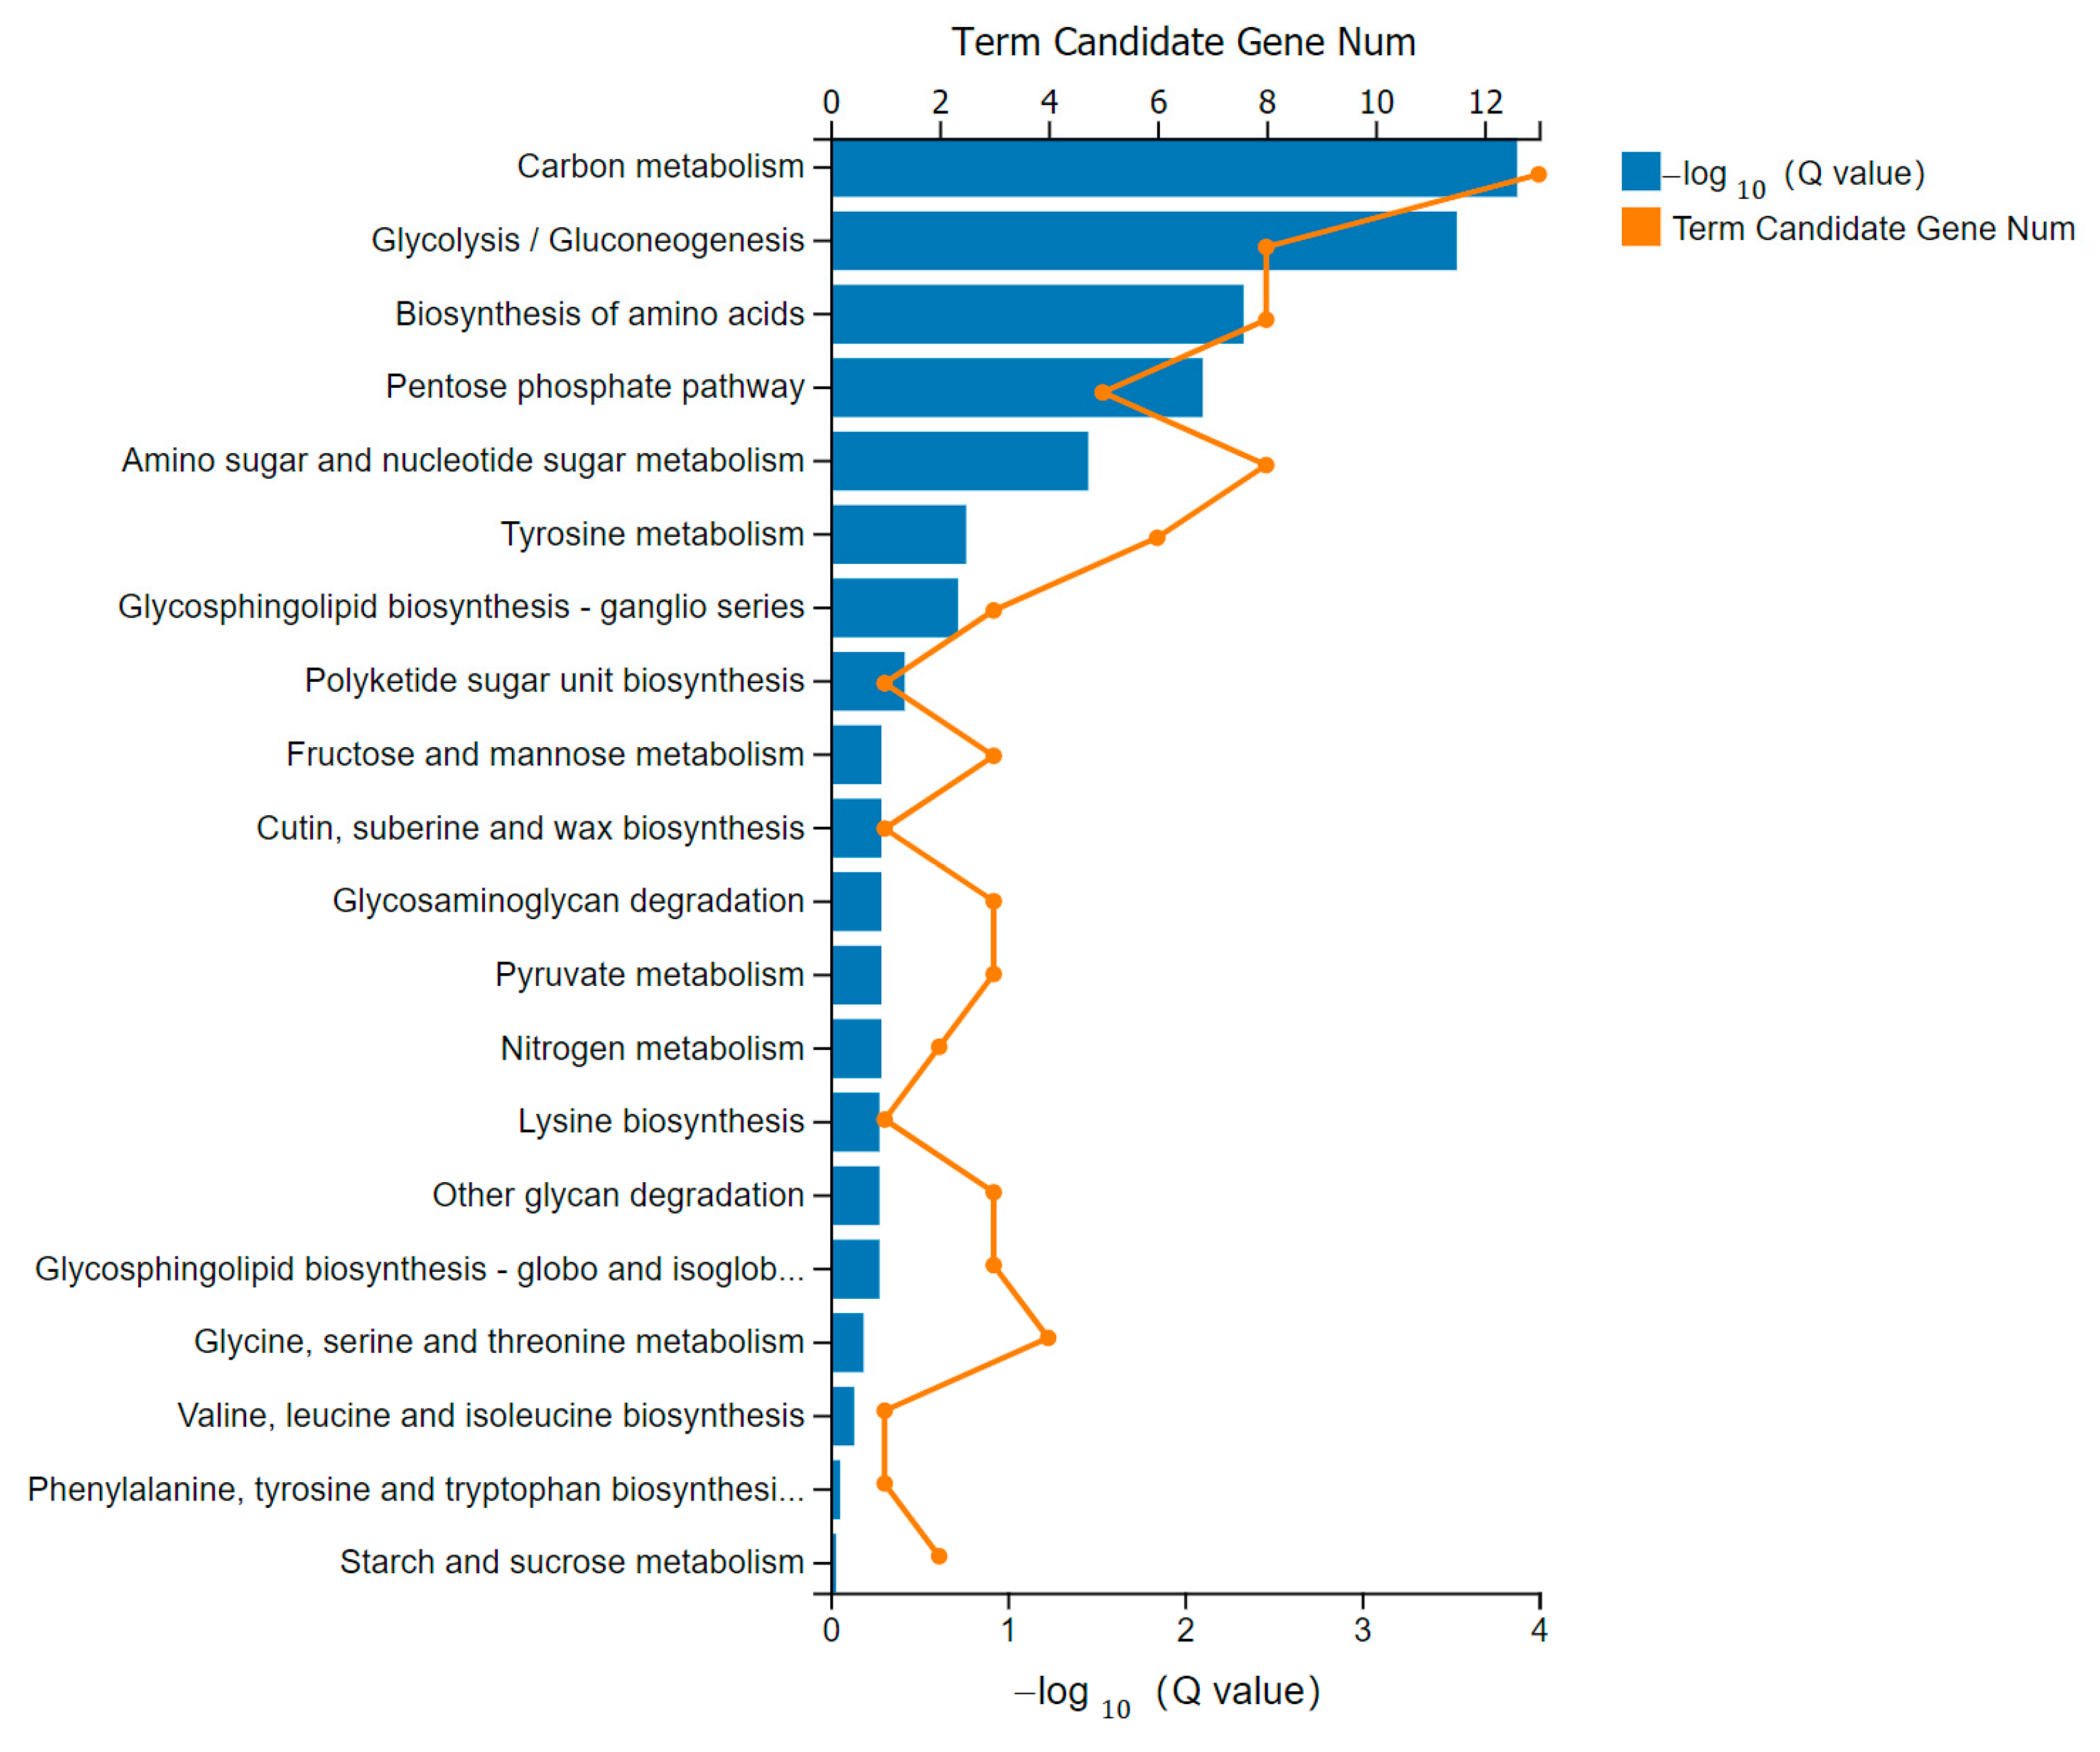
3.6. KEGG Pathway Analysis of DEGs

For further investigation into the functions of the DEGs, KEGG pathway analysis was carried out to reveal the biochemical pathway. As a result, in the comparison of hemolymph between starved and feeding groups, the largest numbers of DEGs were those associated with global and overview maps, signal transduction, folding/sorting and degradation, transport catabolism, and the endocrine system. Meanwhile, some pathways mapped only one DEG, including cell motility, membrane transport, replication and repair, transcription, metabolism of cofactors and vitamins, metabolism of other amino acids, environmental adaptation, the excretory system, the nervous system, and the sensory system. From up-regulated DEGs, the PI3K-Akt signaling pathway and thyroid hormone signaling pathway were mostly enriched, while the biosynthesis of amino acids and protein processing in the endoplasmic reticulum were enriched from down-regulated DEGs (Figure 11).
In striated adductor muscle, the most represented categories for DEGs were signal transduction, translation, global and overview maps, and the endocrine system. As mapped to the KEGG pathway, the up-regulated DEGs were enriched in ribosome biogenesis in eukaryotes, RNA transport, and spliceosome, and the down-regulated DEGs showed the most abundance associated with pathways of carbon metabolism, glycolysis/gluconeogenesis, biosynthesis of amino acids, amino sugar, and nucleotide sugar metabolism. As the results showed, most of the pathways’ enriched down-regulated genes were related to metabolism, demonstrating the negative effect of starvation on the striated adductor muscle.

3.7. Metabolism Pathway Enrichment and Representative Pathway in Striated Muscle

The DEGs enriched in metabolism pathways of KEGG categories in striated adductor muscle are shown in Figure 12. Among them, the candidate gene numbers of carbon metabolism, glycolysis/gluconeogenesis, biosynthesis of amino acids, pentose phosphate pathway, amino sugar, and nucleotide sugar metabolism were more than others; meanwhile, they were significantly enriched with Q value < 0.05.
As the key pathway of carbohydrate metabolism, glycolysis/gluconeogenesis attracted our attention, and the DEGs linked to the pathway were focused on (Figure 13). The expression of genes encoding pgm, pgi, fbp, tpiA, gapA, pgk, and eno showed significant down-regulation, covering almost all enzymes in the pathway.
Figure 14 shows the fold change of expression of DEGs involved in the pentose phosphate pathway. The expression of genes encoding pgm, pgi, tktA, PGD, and fbp all showed significant down-regulation, The down-regulation of PGD and tktA genes in the pentose phosphate pathway suggested that carbohydrate decomposition and utilization were decreased in starved scallops.

4. Discussion

At present, the shortage of bait microalgae in M. yessoensis culture areas is indisputable [4], and many studies have demonstrated that high temperatures and hunger stress can lead to a slowdown in shellfish metabolism and excretion, energy storage, and enzyme activity [14]. In this study, it was found that the immune indexes of M. yessoensis decreased to varying degrees due to hunger stress, and the blood cell concentration and liver lysozyme activity of scallops began to be significantly lower than that of the control group after 15 days of hunger stress. After 30 days of hunger stress, the scallop condition index and liver ACP began to be significantly lower than in the control group. After 45 days of hunger stress, Scallop T-AOC and BCA began to be significantly lower than the control group, indicating that food shortages can indeed lead to a decrease in M. yessoensis immunity levels. During the trial, some physiological immune indicators of M. yessoensis in the control group fluctuated significantly, which may be the normal stress response of scallops to high temperatures, but the immune level of microalgae can be improved by supplementing the bait microalgae and resisting high-temperature stress. Li studied the changes in the total number of blood cells, blood cell phagocytosis, acid phosphatase, and peroxide dismutase in M. yessoensis under different starvation durations (5, 10, 15, 20, 30 d) under the conditions of 17 °C, and found that the total number of blood cells of M. yessoensis decreased significantly at 20 days of starvation, and the activity of acid phosphatase showed a trend of first rising slightly and then decreasing, and starvation began to decline significantly at 25 days [24], which was basically consistent with the results of this study, because the experiment was carried out during the high-temperature period. The level of various immunoenzymes drops rapidly, so M. yessoensis have a significant decline in immune capacity after 2 weeks under hunger stress, and the damage to the immune system will be exacerbated under high temperatures.
Considering the natural condition and aquaculture environment, food deprivation is not an uncommon pressure for some bivalves, and influences including a reduction in metabolic and excretion rates and the decline in tissue energy reserves and enzyme activities have been demonstrated in past years [14]. The scallops typically possess smooth adductor muscle and striated adductor muscle. The striated adductor muscle facilitates repetitive opening and closing of the valve, contributing to the rapid ejection of water from the mantle cavity and enabling the scallop to swim [25], the process of which reflects striated adductor muscle serving as the primary organ of energy, glycogen storage, and mobilization [17]. The samples collected in this study were from the cross-striated muscles for the purpose to step forward to a better understanding of carbohydrate metabolism under starvation. We took an interest in key genes involved in glycolysis/gluconeogenesis, the citrate cycle, glycogen biosynthesis and degradation, and the pentose phosphate pathway.
Data analysis in the striated adductor muscle revealed no appreciable up- or down-regulation in the expression of genes encoding essential enzymes in the citrate cycle and glycogen biosynthesis/degradation, including citrate synthase (gltA), isocitrate dehydrogenase (icd), 2-oxoglutarate dehydrogenase complex (odghc) (for the citrate cycle), glycogen synthase (GYS), and glycogen phosphorylase (glgP) (for glycogen biosynthesis and degradation). Consequently, it could be conjectured that the related metabolic pathways in muscle were not significantly affected, or the main concerning reaction took place in other tissues. In contrast, the key enzymes participating in glycolysis/gluconeogenesis and the pentose phosphate pathway deserved more attention, of which the down-regulated DEGs were enriched by KEGG orthology.
The expressions of genes encoding the enzymes mentioned above were also concerned in hemolymph. As a result, only 68 DEGs were identified, of which there were no gene-encoding enzymes participating in carbohydrate metabolism among them. The comparison showed no significant up- or down-regulation appeared in the expression of the genes above between the starved and feeding groups. Compared to the data in striated muscle, the information about hemolymph indicated its basic functions of transportation and buffering, with no significant regulation of carbohydrate metabolism caused by starvation.

4.1. DEGs in Pathway of Glycolysis/Gluconeogenesis

Fructose-1,6-bisphosphatase [FBP/fbp, or fructose 1,6-diphosphatase, FDPase [26], a key enzyme of gluconeogenesis, hydrolyses D-fructose-1,6-bisphosphate to fructose-6-phosphate and inorganic Pi in the presence of divalent ions [27], of which fructose-6-phosphate is an indispensable precursor in many biosynthetic pathways. Two isoenzymes were detected in mammals, and the muscle enzyme took part in glycogen synthesis [28]. Up to now, only one FBP isoenzyme has been found in invertebrates [27,29] and the FBP has been isolated from the mantle muscle of squids [30], skeletal muscle of crabs [31], flight muscle of bumble-bees [32], and foot muscle of snails [27]. The first report on the cloning and expression of fbp in bivalves showed that the gene was highly expressed in the gonad, hepatopancreas, and gill in Pinctada fucatamartensii, but hardly expressed in adductor muscle [29]. In this study, the FBP gene was found in the striated adductor muscle of each sampled individual, and the expression level was down-regulated under long-term starvation. Meanwhile, a report on giant scallops (Placopecten magellanicus) found that the inhibition of FDP (fbp) by AMP in adductor muscle was temperature-dependent [33]. Therefore, we kept the water temperature, dissolved oxygen, salinity, and pH suitable for the growth of scallops during the experiment, to avoid the influence of other environmental factors as far as possible. Herein, it is reasonable to conclude that the differential expression of genes involved in carbohydrate metabolism was regulated as the response to food deprivation.
The enzyme glyceraldehyde 3-phosphate dehydrogenase (GAPDH/gapA) is a key intermediate component of glycolysis and gluconeogenesis, known mainly as a “housekeeping” protein [34]. In addition to transforming the reversible conversion of glyceraldehyde-3-phosphate and glycerate-1,3-bisphosphate as an intersection point for multiple pathways of energy metabolism, GAPDH participates in many nuclear events including DNA replication, RNA transport, gene transcription, endocytosis, and apoptosis [35,36,37]. The expression of GAPDH was found to be associated with temperature variation, exposure to hypoxic or anoxic conditions, nitrosative stress, and nutritional stress [38,39,40,41]. In a proteomic analysis of Oncorhynchus mykiss, the concentrations of three isomers of GAPDH were affected by short-term starvation, and the three isomers were most likely dimers of GAPDH. The attention of two isomers was reduced by starvation, which might indicate increased protein catabolism. Meanwhile, the concentration of another isomer increased due to starvation, thought to be an increase in glycolysis to replenish cellular energy stores being supplied by the increased level of catabolism [42]. On the contrary, little is known about the expression of the protein or transcript in bivalves in conditions of food deprivation. In our study, the transcript expression of gapA was down-regulated in the adductor muscle of the starvation group. As the response of the gene in the carbohydrate metabolism pathway, the expression level of gapA changed, and whether starvation would lead to subcellular function changes of the protein remains to be further investigated. In addition, gapA was often used as a housekeeping gene for RT-PCR to measure the expression level of others based on the cognition of its basically constant expression. Our data showed a significantly lower expression level of the transcripts for gapA in the starved group, which verified gapA was not suitable for internal reference, especially in the case of abnormal glucose metabolism or hypoxia (related to the citrate cycle) conditions.
Several other enzymes were related to glycolysis/gluconeogenesis, including enolase (ENO/eno), phosphoglycerate kinase (PGK/pgk), glucose-6-phosphate isomerase (GPI/pgi), phosphoglucomutase (PGM/pgm), and triosephosphate isomerase (TPI/tpiA, TIM), the transcript expressions of which were also down-regulated in scallops under starvation. ENO, an enzyme that participates in metabolism, physiological, and pathological processes, has been found to play an essential role in the regulation of transcription, apoptosis, and cell differentiation [43]. In the pathway of glycolysis/gluconeogenesis, ENO catalyzes the conversion of glycerate-2P and phosphoenolpyruvate, and has been reported to participate in the stress response in plants and animals [44,45]. In a study of cDNA cloning and expression analysis of ENO from Fenneropenaeus chinensis, both the mRNA level and protein expression were significantly up-regulated at 24 h post-WSSV infection, which suggested the enzyme ENO is involved in response to WSSV infection [46]. In glycolysis and gluconeogenesis, PGK catalyzes the conversion of glycerate-1,3P2 and glycerate-3P. In addition, PGK is involved in different functions not associated with energy metabolism, including pathogenesis, interaction with nucleic acids, cell death, and viral replication. Cataloguing as a moonlighting protein, the activity of PGK is regulated or influenced by the presence of mono- and divalent ions, various nucleotides, redox state, and non-coding RNAs [47]. Due to the high conservation, PGK gene showed good potential for analyzing evolutionary relationships in some clades. The phylogenetic analysis of the PGK sequence in marsupial species showed high bootstrap support-based dichotomies, concordant with expectations from previous morphological and molecular work [48]. PGM catalyzes the reversible transfer of a phosphate group between C-1 and C-6 of glucose. The phosphorylated sugars may enter different catabolic pathways or anabolic pathways, which suggests PGM is a key enzyme in directing the metabolic flux toward polymer synthesis or catabolic pathways [49]. In the plant, the expression level of the gene encoding PGM was down-regulated under zinc stress, showing the effect of heavy metals on the balance of sugar metabolism in Ricinus communis [50]. In invertebrates, the silencing of PGM1 and PGM2 expression was reported to inhibit trehalose metabolism and lead to impaired chitin synthesis in Nilaparvata lugens [51]. GPI, also known as the moonlighting protein, participates in various activities as a neuroleukin, autocrine motility factor, serine proteinase inhibitor, and differentiation and maturation factor [52]. During the process of glycolysis/gluconeogenesis, GPI plays an important role in the reversible isomerization of D-glucose 6-phosphate and D-fructose 6-phosphate [53]. In view of the multi-function of GPI, previous reports focused on its involvement in the stress response in many species. In the investigation of the effect of low salinity stress on GPI in Takifugu rubripes, the relative mRNA expression level differed among low-salinity groups, indicating the response of GPI to low salinity [54]. TPI catalyzes the interconversion of glycerone-P and glyceraldehyde-3P in glycolytic pathway/gluconeogenesis and plays a role in phospholipid biosynthesis. The enzyme also helps to maintain the a-glycerophosphate cycle necessary for flight [55]. This gene was involved before the prokaryotic-eukaryotic divergence billion years ago [56] and was found to be important in response to external factors in organisms [57]. In studies on shrimps, TPI was found to facilitate the replication of WSSV [58], and the silence of TPI-like type genes caused the metabolic disorder affecting normal life activities in Litopenaeus Vannamei [59].
In this work, the expression of the genes discussed above showed down-regulation under food deprivation for 45 days, suggesting the negative effect of starvation on the involved carbohydrate metabolism. In addition, GAPDH, ENO, PGK, and GPI were all demonstrated to participate in various functions besides glycolysis and gluconeogenesis, and the down-regulation of transcripts might imply the influence of starvation on other processes.

4.2. Judgement of Regulation Direction

In striated adductor muscle under starvation for 45 days, the expressions of DEGs enriched in the glycolysis/gluconeogenesis pathway were most down-regulated. Only for gpmA did the genes show upregulation. In the metabolic pathway of multi-enzyme systems, there are typically one or more enzymes catalyzing irreversible reactions, which determine the reaction direction of the pathway. There are three irreversible steps in the pathway of glycolysis, including reactions of glucose to glucose-6P, fructose-6P to fructose-1,6P2, and phosphoenolpyruvate to pyruvate catalyzed by hexokinase (hk), 6-phosphofructokinase (pfkA), and pyruvate kinase (pyk), respectively. In gluconeogenesis, the key enzymes involved in the corresponding reverse reactions are glucose-6-phosphatase (G6PC), fructose-1,6-bisphosphatase (fbp), and phosphoenolpyruvate carboxykinase (pckA).
Our data showed that the gene expression levels of hk, pfkA, and pyk were relatively stable and showed no statistically significant difference. As the rate-limiting enzyme of glycolysis, pfkA catalyzes the slowest and determines the reaction rate of the metabolic pathway. Based on the gene expression of pfkA and two other key enzymes, we concluded that no significant regulation appeared in glycolysis in the striated adductor muscle of scallops under starvation. On the other hand, the gene encoding fbp, which catalyzes the reaction of fructose-1,6P2 with fructose-6P only in gluconeogenesis, showed significant down-regulation, consistent with the trend of other DEGs in the pathway. With the effect on the metabolic pathway, the regulation trend for the concerned enzymes would be consistent or internally related, and it was hard to facilitate the regulation of the key enzymes to be different from others in the same pathway; therefore, we confirmed that the down-regulated DEGs reflected the decline in gluconeogenesis but not glycolysis.
The process of glycolysis generates ATP while gluconeogenesis contains a series of reactions in consuming ATP. In the stress of starvation, there is no exogenous food for the scallops, and the decrease in gluconeogenesis reduces energy consumption to a certain extent. Correspondingly, the DEGs in the pathway of gluconeogenesis were all significantly down-regulated in striated muscles in our study. DEGs have been proven to participate in the stress response in some organisms. However, we inferred that the DEGs coordinated and regulated as a whole chain or net in the pathway, rather than the abnormal expression of the single gene due to food deprivation. With no significant differential expression in hemolymph, the DEGs down-regulated in striated adductor muscle likely reflected the adaptation mechanism of M. yessoensis in starvation in order to maintain survival requirements and the basic metabolic balance.

4.3. DEGs Involved in Pentose Phosphate Pathway

We also paid attention to the pentose phosphate pathway, an essential branch of carbohydrate metabolism, which plays an irreplaceable role in biosynthesis. As the only pathway to convert glucose into ribose-5P, the pentose phosphate pathway produces a variety of necessary materials for biosynthesis and metabolism, such as NADPH for the biosynthesis of fatty acids and cholesterol, and ribose-5P for nucleotide synthesis. In comparison with the feeding group, the gene encoding 6-phosphogluconate dehydrogenase (PGD/gnd) and transketolase (tkt) in this pathway was expressed differentially in striated adductor muscle from starved scallops.
As a key enzyme in this pathway, PGD catalyzes the irreversible formation of ribose-5P and NADPH from gluconate-6P. PGD was found to be involved in the conversion of food energy into NADPH used for biosynthesis and growth in Salmo gairdneri [60], and another study in Penaeus monodon growth also suggested that when the dietary carbohydrates were more suitable to support rapid growth, the enzyme of PGD involved in NADPH generation increased preferentially [61]. Ktk, an enzyme in the non-oxidative branch of the pentose phosphate pathway, connects glyceraldehyde-3P, xylulose-5P, and ribose-5P as the intermediates. The decrease in the enzyme activity would affect the synthesis of ribose-5P and NADPH, while glycolysis/gluconeogensis was also modified by the decrease in glyceraldehyde-3P. In this study, the down-regulated PGD and ktkA genes in the pentose phosphate pathway indicated a decrease in ribose-5P and NADPH, pointing to the negative effect on the synthesis of nucleotide and amino acid biosynthesis. Correspondingly, the down-regulation of DEGs was enriched in the biosynthesis of amino acids, which caused a decline in this pathway. Furthermore, the decline of the pentose phosphate pathway might further affect the maintenance of carbon homeostasis, providing reduced molecules for anabolism, and even defeating oxidative stress [55].
In this experiment, there was no carbohydrate source for the growth of the scallops. The down-regulation of the genes meant a decrease in the production of ribose-5P and NADPH, which caused the decline of carbohydrate decomposition and utilization. These results might explain the weakened biosynthesis and metabolism in starved scallops to some extent.

4.4. Genes Encoding Filament Protein of Striated Adductor Muscle Structure

The condition index we measured declined after food deprivation for 45 days. Loss of body mass during starvation is inevitable, and animals differ in how to ratio various fuel resources (mainly proteins, carbohydrates and lipids) thus being ill-equipped to account for shifts in body composition under starvation [62]. Research on the anti-starvation strategies of the Chinese mitten crab (Eriocheir Sinensis) showed a depletion of the energy stored under short-term (7 days) starvation and consumption of the hepatopancreas under long-term (42 days) starvation [63].
The condition indexes on the 45th day under food deprivation showed no significant decrease from that of the 30th day. There was no previous study on the ‘starvation phases’ of scallops, and little was known about the progression. Based on the slight decline of the condition index on the 45th day, we speculated that an adaptive mechanism responding to food deprivation was formed in the scallops to achieve internal balance. Due to the interest in the metabolism of this stage, the hemolymph and striated adductor muscle were collected and sequenced, then the carbohydrate metabolism was focused on. Furthermore, skeletal muscles serve as critical protein reserves in some animals during starvation, so we paid special attention to the expression of genes encoding filament proteins for striated adductor muscle.
The transcripts expression of beta-actin, tropomyosin, and troponin (genes of troponin I, troponin T, troponin C) for thin filament protein and myosin, paramyosin, and twitchins-like for thick filament protein showed no significant differences in strained adductor muscle and hemolymph under starvation. Moreover, the transcripts of gelsolin (gelsolin-like protein 1, gelsolin-like protein 2), profilin (profilin-like, profilin-4-like), and thymosins-like were also identified, without significant differential expression between starved and feeding groups. These results indicated that starvation under 20 °C for 45 days in our experiment did not lead to the consumption of the basic filament proteins of striated adductor muscle.

5. Conclusions

In this study, it was found that the immune indexes of M. yessoensis decreased to varying degrees due to hunger stress, and the blood cell concentration and liver lysozyme activity of scallops began to drop significantly lower than that of the control group after 15 days of hunger stress. After 30 days of hunger stress, the scallop condition index and liver ACP began to drop significantly lower than in the control group. After 45 days of hunger stress, scallop T-AOC and BCA began to drop significantly lower than the control group, indicating that food shortages can indeed lead to a decrease in M. yessoensis immunity levels. For M. yessoensis, as a cold-water species, starvation will greatly reduce its ability to adapt to high temperatures, immune levels will decline, and if the high-temperature period in the summer coincides with a shortage of bait, there will be a large-scale mortality phenomenon. In this study, the transcriptomics analysis was firstly conducted in M. yessoensis under long-term starvation. In hemolymph, only 68 DEGs were identified, and the gene-encoding enzymes participating in carbohydrate metabolism showed no significant up- or down-regulation, indicating the basic functions of transportation and buffering. In the striated adductor muscle, the primary organ of energy, glycogen storage, and mobilization, a number of DEGs were enriched in the pathways of metabolism. Our analysis suggested the decline of gluconeogenesis and the pentose phosphate pathway under starvation. The down-regulation of genes encoding multi-function proteins could likely imply the influence of starvation on various fundamental processes in scallops. This work shed light on the understanding of the influence of starvation challenges and provided information for further research on the metabolism of M. yessoensis, as well as a reference for healthy aquaculture.

Supplementary Materials

The following supporting information can be downloaded at: https://www.mdpi.com/article/10.3390/su142013217/s1, Table S1: Statistics and comparison results of M. yessoensis transcriptomic sequencing. Supplemental Files: up-regulated and down-regulated genes.

Author Contributions

Conceptualization, X.B.; data curation, W.L.; formal analysis, Y.L. and S.L.; investigation, S.Z.; project administration, W.L.; software, Y.L.; supervision, L.S.; validation, L.S.; writing—original draft, X.B.; writing—review and editing, L.S. All authors have read and agreed to the published version of the manuscript.

Funding

This research was funded by the outstanding young scientific and technological personnel of Dalian (2019RJ09), Liaoning revitalization talents program (XLYC1907109), and Modern agro-industry technology research system (CARS-49).

Institutional Review Board Statement

The experiment followed the guidelines and regulations of experimental animal management practices of Liaoning Academy of Agricultural Sciences, and the protocols used were reviewed and approved by the Liaoning Ocean and Fishery Science Institute.

Data Availability Statement

The data that support the findings of this study are available from the corresponding author upon reasonable request.

Acknowledgments

We would like to thank Yongjia Pan for guidance in the use of software and data uploading. We are also grateful to Shenzhen BGI Ltd. for the assistance in sequencing and bioinformatic analyses.

Conflicts of Interest

The authors declare that the research was conducted in the absence of any commercial or financial relationships that could be construed as a potential conflict of interest.

References

  1. Nagashima, K.; Sato, M.; Kawamata, K.; Nakamura, A.; Ohta, T. Genetic Structure of Japanese Scallop Population in Hokkaido, Analyzed by Mitochondrial Haplotype Distribution. Mar. Biotechnic. 2005, 7, 1–10. [Google Scholar] [CrossRef] [PubMed]
  2. Yu, Z.A.; Li, D.C.; Wang, X.Y.; Wang, Q.Z.; Li, H.L.; Teng, W.M.; Liu, X.F.; Zhou, Z.C. Reason of Massive of Japanese Scallop Pationopecten yessoenisis in Raft Cultivation in Coastal Changhai County. Ocean. Sci. J. 2019, 38, 420–427. [Google Scholar] [CrossRef]
  3. Song, L.; Wu, J.; Du, J.; Li, N.; Wang, K.; Wang, P. Comparison of Two Methods to Assess the Size Structure of Phytoplankton Community Assemblages, in Liaodong Bay, China. J. Ocean Univ. China 2019, 18, 1207–1215. [Google Scholar] [CrossRef]
  4. Song, L.; Bi, X.D.; Fu, J.; Song, G.J.; Wu, J.H.; Liu, Y.; Liu, S.X. Characteristics of eukaryotic microalgae and their environmental correlation in the northern Yellow Sea. China Environ. Sci. 2021, 41, 1336–1344. [Google Scholar] [CrossRef]
  5. Song, L.; Bi, X.D.; Song, G.J.; Du, J.; Wu, J.H.; Wang, Z.S.; Hu, C.K. Size-fractionated eukaryotic microalgae and its influencing factors Dachangshan Island and its adjacent waters. China Environ. Sci. 2020, 40, 2627–2634. [Google Scholar] [CrossRef]
  6. Chauvaud, L.; Thouzeau, G.; Paulet, Y.-M. Effects of environmental factors on the daily growth rate of Pecten maximus juveniles in the Bay of Brest (France). J. Exp. Mar. Biol. Ecol. 1998, 227, 83–111. [Google Scholar] [CrossRef]
  7. Liu, Y.; Saitoh, S.-I.; Maekawa, K.; Mochizuki, K.-I.; Tian, Y. Impact of short-term climate effects and sea ice coverage variation on Japanese scallop aquaculture in Saroma Lake, Japan. Aquac. Res. 2018, 49, 1752–1767. [Google Scholar] [CrossRef]
  8. Xu, B.; Chen, M.; Yang, H.; Zhao, S. Starvation-induced Changes of Hemocyte Parameters in the Zhikong Scallop Chlamys farreri. J. Shellfish Res. 2008, 27, 1195–1200. [Google Scholar] [CrossRef]
  9. Butt, D.; Aladaileh, S.; O’Connor, W.; Raftos, D.A. Effect of starvation on biological factors related to immunological defence in the Sydney rock oyster (Saccostrea glomerata). Aquaculture 2007, 264, 82–91. [Google Scholar] [CrossRef]
  10. Lin, Y.-C.; Chen, J.-C.; Man, S.N.C.; Morni, W.Z.W.; Suhaili, A.S.N.; Cheng, S.-Y.; Hsu, C.-H. Modulation of innate immunity and gene expressions in white shrimp Litopenaeus vannamei following long-term starvation and re-feeding. Results Immunol. 2012, 2, 148–156. [Google Scholar] [CrossRef] [PubMed]
  11. Cuzon, G.; Cahu, C.; Aldrin, J.F.; Messager, J.L.; Stéphan, G.; Mével, M. Starvation effect on metabolism of Penaeus japonicus. Proc. World Maric. Soc. 2009, 11, 410–423. [Google Scholar] [CrossRef]
  12. Speers-Roesch, B.; Callaghan, N.I.; MacCormack, T.J.; Lamarre, S.G.; Sykes, A.V.; Driedzic, W.R. Enzymatic capacities of metabolic fuel use in cuttlefish (Sepia officinalis) and responses to food deprivation: Insight into the metabolic organization and starvation survival strategy of cephalopods. J. Comp. Physiol. B 2016, 186, 711–725. [Google Scholar] [CrossRef] [Green Version]
  13. Moran, A.; Manahan, D. Physiological recovery from prolonged ‘starvation’ in larvae of the Pacific oyster Crassostrea gigas. J. Exp. Mar. Biol. Ecol. 2004, 306, 17–36. [Google Scholar] [CrossRef]
  14. Liu, W.; Li, Q.; Gao, F.; Kong, L. Effect of starvation on biochemical composition and gametogenesis in the Pacific oyster Crassostrea gigas. Fish. Sci. 2010, 76, 737–745. [Google Scholar] [CrossRef]
  15. Telahigue, K.; Hajji, T.; Rabeh, I.; El Cafsi, M. The Effect of Starvation on the Biochemical Composition of the Digestive Gland, the Gonads and the Adductor Muscle of the Scallop Flexopecten glaber. Food Nutr. Sci. 2013, 4, 405–413. [Google Scholar] [CrossRef] [Green Version]
  16. Zhang, H.; Shi, Y.; He, M. Molecular identification of an insulin growth factor binding protein (IGFBP) and its potential role in an insulin-like peptide system of the pearl oyster, Pinctada fucata. Comp. Biochem. Physiol. Part B Biochem. Mol. Biol. 2017, 214, 27–35. [Google Scholar] [CrossRef] [PubMed]
  17. Li, Y.; Sun, X.; Zhihui, Y.; Xun, X.; Zhang, J.; Guo, X.; Jiao, W.; Zhang, L.; Liu, W.; Wang, J.; et al. Scallop genome reveals molecular adaptations to semi-sessile life and neurotoxins. Nat. Commun. 2017, 8, 1721. [Google Scholar] [CrossRef] [PubMed] [Green Version]
  18. Mao, J.; Zhang, W.; Zhang, X.; Tian, Y.; Wang, X.; Hao, Z.; Chang, Y. Transcriptional changes in the Japanese scallop (Mizuhopecten yessoensis) shellinfested by Polydora provide insights into the molecular mechanism of shell formation and immunomodulation. Sci. Rep. 2018, 8, 17664. [Google Scholar] [CrossRef] [PubMed] [Green Version]
  19. Zhou, L.; Liu, Z.; Dong, Y.; Sun, X.; Wu, B.; Yu, T.; Zheng, Y.; Yang, A.; Zhao, Q.; Zhao, D. Transcriptomics analysis revealing candidate genes and networks for sex differentiation of yesso scallop (Patinopecten yessoensis). BMC Genom. 2019, 20, 671. [Google Scholar] [CrossRef] [PubMed] [Green Version]
  20. Zhao, L.; Li, Y.; Lou, J.; Yang, Z.; Liao, H.; Fu, Q.; Guo, Z.; Lian, S.; Hu, X.; Bao, Z. Transcriptomic Profiling Provides Insights into Inbreeding Depression in Yesso Scallop Patinopecten yessoensis. Mar. Biotechnol. 2019, 21, 623–633. [Google Scholar] [CrossRef]
  21. Karayücel, S.; Çelik, M.Y.; Karayücel, I.; Öztürk, R.; Eyüboğlu, B. Effects of stocking density on survival, growth and biochemical composition of cultured mussels (Mytilus galloprovincialis, Lamarck 1819) from an offshore submerged longline system. Aquac. Res. 2013, 46, 1369–1383. [Google Scholar] [CrossRef]
  22. Mortazavi, A.; Williams, B.A.; McCue, K.; Schaeffer, L.; Wold, B. Mapping and quantifying mammalian transcriptomes by RNA-Seq. Nat. Methods 2008, 5, 621–628. [Google Scholar] [CrossRef] [PubMed]
  23. Trapnell, C.; Williams, B.A.; Pertea, G.; Mortazavi, A.; Kwan, G.; van Baren, M.J.; Salzberg, S.L.; Wold, B.J.; Pachter, L. Transcript assembly and quantification by RNA-Seq reveals unannotated transcripts and isoform switching during cell differentiation. Nat. Biotechnol. 2010, 28, 511–515. [Google Scholar] [CrossRef] [PubMed] [Green Version]
  24. Li, S.L.; Li, W.J.; Fu, C.D.; Yu, Z.A.; Teng Wm Liu, Z.Y. Immune response of Japanese scallop Patinopecten yessoensis to starvation. Fish. Sci. 2011, 30, 441–444. [Google Scholar] [CrossRef]
  25. Chantler, P.D. Chapter 4 Scallop adductor muscles: Structure and function. Dev. Aquacult. Fish. Sci. 2006, 35, 229–316. [Google Scholar] [CrossRef]
  26. Grün, E.; Heyne, D. Perinatal development of glucose-6-phosphatase and fructose-1,6-diphosphatase activities in pig liver. Acta Biol. Med. Ger. 1982, 41, 593–600. [Google Scholar] [PubMed]
  27. Lozinska-Gabska, M.; Dziewulska-Szwajkowska, D.; Szalagan, E. Isolation of fructose-1,6-bisphosphatase from the foot muscle of a snail Helix aspersa maxima. Zool. Pol. 2003, 48, 81–91. [Google Scholar]
  28. Gleeson, T.T. Post-Exercise Lactate Metabolism: A Comparative Review of Sites, Pathways, and Regulation. Annu. Rev. Physiol. 1996, 58, 565–581. [Google Scholar] [CrossRef]
  29. Lai, Z.X.; Liu, Y.; Wang, Q.H.; Zheng, Z.; Deng, Y.W. cDNA cloning of FBP Gene in Pinctada fucata martensii and its response to temperature stress. Prog. Fish. Sci. 2019, 40, 106–114. [Google Scholar]
  30. Storey, K.; Baldwin, J.; Hochachka, P. Squid muscle fructose diphosphatase and its role in the control of F6P-FDP cycling. Comp. Biochem. Physiol. Part B: Comp. Biochem. 1975, 52, 165–168. [Google Scholar] [CrossRef]
  31. Behrisch, H.W. On the subunit structure of seasonal isoenzymes of fructose 1,6-diphosphatase from muscle of the Alaskan king crab Paralithodes camtschatica. Comp. Biochem. Physiol. Part B: Comp. Biochem. 1975, 51, 317–321. [Google Scholar] [CrossRef]
  32. Storey, K. Purification and properties of fructose diphosphatase from bumblebee flight muscle Role of the enzyme in control of substrate cycling. Biochim. Biophys. Acta (BBA) Enzym. 1978, 523, 443–453. [Google Scholar] [CrossRef]
  33. O’Doherty, P.; Feltham, L. Thermal regulation of gluconeogenesis in the giant scallop, Placopecten magellanicus (Gmelin). Comp. Biochem. Physiol. Part B: Comp. Biochem. 1971, 39, 163–165. [Google Scholar] [CrossRef]
  34. Barber, R.D.; Harmer, D.W.; Coleman, R.A.; Clark, B.J. GAPDH as a housekeeping gene: Analysis of GAPDH mRNA expression in a panel of 72 human tissues. Physiol. Genom. 2005, 21, 389–395. [Google Scholar] [CrossRef] [PubMed] [Green Version]
  35. Dastoor, Z.; Dreyer, J.L. Potential role of nuclear translocation of glyceraldehyde-3-phosphate dehydrogenase in apoptosis and oxidative stress. J. Cell Sci. 2001, 114, 1643–1653. [Google Scholar] [CrossRef] [PubMed]
  36. Sirover, M.A. Emerging new functions of the glycolytic protein, glyceraldehyde-3-phosphate dehydrogenase, in mammalian cells. Life Sci. 1996, 58, 2271–2277. [Google Scholar] [CrossRef]
  37. Sirover, M.A. On the functional diversity of glyceraldehyde-3-phosphate dehydrogenase: Biochemical mechanisms and regulatory control. Biochim. Biophys. Acta (BBA) Gen. Subj. 2011, 1810, 741–751. [Google Scholar] [CrossRef] [PubMed]
  38. Smith, R.W.; Cash, P.; Ellefsen, S.; Nilsson, G.E. Proteomic changes in the crucian carp brain during exposure to anoxia. Proteomics 2009, 9, 2217–2229. [Google Scholar] [CrossRef]
  39. Jayasundara, N.; Tomanek, L.; Dowd, W.W.; Somero, G.N. Proteomic analysis of cardiac response to thermal acclimation in the eurythermal goby fish Gillichthys mirabilis. J. Exp. Biol. 2015, 218, 1359–1372. [Google Scholar] [CrossRef] [Green Version]
  40. Varó, I.; Cardenete, G.; Hontoria, F.; Monroig, Ó.; Iglesias, J.; Otero, J.J.; Almansa, E.; Navarro, J.C. Dietary Effect on the Proteome of the Common Octopus (Octopus vulgaris) Paralarvae. Front. Physiol. 2017, 8, 309. [Google Scholar] [CrossRef] [PubMed] [Green Version]
  41. Camacho-Jiménez, L.; Leyva-Carrillo, L.; Peregrino-Uriarte, A.B.; Duarte-Gutiérrez, J.L.; Tresguerres, M.; Yepiz-Plascencia, G. Regulation of glyceraldehyde-3-phosphate dehydrogenase by hypoxia inducible factor 1 in the white shrimp Litopenaeus vannamei during hypoxia and reoxygenation. Comp. Biochem. Physiol. Part A: Mol. Integr. Physiol. 2019, 235, 56–65. [Google Scholar] [CrossRef] [PubMed]
  42. Baumgarner, B.L.; Bharadwaj, A.S.; Inerowicz, D.; Goodman, A.S.; Brown, P.B. Proteomic analysis of rainbow trout (Oncorhynchus mykiss) intestinal epithelia: Physiological acclimation to short-term starvation. Comp. Biochem. Physiol. Part D: Genom. Proteom. 2013, 8, 58–64. [Google Scholar] [CrossRef]
  43. Liu KCFan, M.X.; Zhang, C.Y.; Cai, F.C.; Li, Q.Y.; Chen, M.M.; Jiang, Y.; Hu, W.B.; Lin, F. Phylogenetic analysis of enolase gene family in different species. Appl. Ecol. Environ. Res. 2019, 17, 11537–11550. [Google Scholar]
  44. Leu, J.-H.; Chang, C.-C.; Wu, J.-L.; Hsu, C.-W.; Hirono, I.; Aoki, T.; Juan, H.-F.; Lo, C.-F.; Kou, G.-H.; Huang, H.-C. Comparative analysis of differentially expressed genes in normal and white spot syndrome virus infected Penaeus monodon. BMC Genom. 2007, 8, 120. [Google Scholar] [CrossRef] [PubMed] [Green Version]
  45. Shen-Miller, J.; Lindner, P.; Xie, Y.; Villa, S.; Wooding, K.; Clarke, S.G.; Loo, R.R.O.; Loo, J.A. Thermal-Stable Proteins of Fruit of Long-Living Sacred Lotus Nelumbo nucifera Gaertn var. China Antique. Trop. Plant Biol. 2013, 6, 69–84. [Google Scholar] [CrossRef] [Green Version]
  46. Li, X.; Meng, X.; Luo, K.; Luan, S.; Cao, B.; Kong, J. cDNA cloning and expression analysis of a phosphopyruvate hydratase gene from the chinese shrimp Fenneropenaeus chinensis. Fish Shellfish Immunol. 2017, 63, 173–180. [Google Scholar] [CrossRef]
  47. Rojas-Pirela, M.; Andrade-Alviárez, D.; Rojas, V.; Kemmerling, U.; Cáceres, A.J.; Michels, P.A.; Concepción, J.L.; Quiñones, W. Phosphoglycerate kinase: Structural aspects and functions, with special emphasis on the enzyme from Kinetoplastea. Open Biol. 2020, 10, 200302. [Google Scholar] [CrossRef]
  48. Colgan, D. Phylogenetic Studies of Marsupials Based on Phosphoglycerate Kinase DNA Sequences. Mol. Phylogenetics Evol. 1999, 11, 13–26. [Google Scholar] [CrossRef]
  49. Kvam, C.; Olsvik, E.S.; McKinley-McKee, J.; Saether, O. Studies on recombinant Acetobacter xylinum alpha-phosphoglucomutase. Biochem. J. 1997, 326, 197–203. [Google Scholar] [CrossRef] [Green Version]
  50. Gao, H.B.; Pei-Yi, Y.U.; Sun, Y.J.; Jiang, L.J. Analysis of carbon metabolism and differential expression of related enzyme genes in castor leaves under Pb and Zn stress. Plant Physiol. J. 2019, 55, 483–492. [Google Scholar]
  51. Pan, B.-Y.; Liu, Y.-K.; Wu, H.-K.; Pang, X.-Q.; Wang, S.-G.; Tang, B.; Xu, C.-D. Role of phosphoglucomutase in regulating trehalose metabolism in Nilaparvata lugens. 3 Biotech 2020, 10, 61. [Google Scholar] [CrossRef] [PubMed] [Green Version]
  52. Jeffery, C.J.; Bahnson, B.J.; Chien, W.; Ringe, A.D.; Petsko, G.A. Crystal Structure of Rabbit Phosphoglucose Isomerase, a Glycolytic Enzyme That Moonlights as Neuroleukin, Autocrine Motility Factor, and Differentiation Mediator. Biochemistry 2000, 39, 955–964. [Google Scholar] [CrossRef] [PubMed]
  53. Angira, D.; Natarajan, N.; Dedania, S.R.; Patel, D.H.; Thiruvenkatam, V. Characterization of P. aeruginosa Glucose 6- Phosphate Isomerase: A Functional Insight via In-Vitro Activity Study. Curr. Top. Med. Chem. 2020, 20, 2651–2661. [Google Scholar] [CrossRef] [PubMed]
  54. Mao, M.G.; Sun, X.R.; Jiang, J.L.; Sun, M.L.; Jie, G.U.; Jiang, Z.Q.; Lin, Y.E. The effect of acute low salinity stress on gpi gene in Takifugu rubripes. Acta Hydrobiol. Sin. 2019, 43, 771–777. [Google Scholar]
  55. Stincone, A.; Prigione, A.; Cramer, T.; Wamelink, M.M.C.; Campbell, K.; Cheung, E.; Olin-Sandoval, V.; Grüning, N.-M.; Krüger, A.; Tauqeer Alam, M.; et al. The return of metabolism: Biochemistry and physiology of the pentose phosphate pathway. Biol. Rev. 2015, 90, 927–963. [Google Scholar] [CrossRef]
  56. Tyshenko, M.G.; Walker, V.K. Towards a reconciliation of the introns early or late views: Triosephosphate isomerase genes from insects. Biochim. Biophys Acta. 1997, 1353, 131–136. [Google Scholar] [CrossRef]
  57. Anuar, T.S.; Azreen, S.N.; Salleh, F.; Moktar, N. Molecular epidemiology of giardiasis among Orang Asli in Malaysia: Application of the triosephosphate isomerase gene. BMC Infect. Dis. 2014, 14, 78. [Google Scholar] [CrossRef] [PubMed] [Green Version]
  58. Liu, F.; Li, S.; Liu, G.; Li, F. Triosephosphate isomerase (TPI) facilitates the replication of WSSV in Exopalaemon carinicauda. Dev. Comp. Immunol. 2017, 71, 28–36. [Google Scholar] [CrossRef] [PubMed]
  59. Liao, X.; Wang, C.; Wang, B.; Qin, H.; Hu, S.; Wang, P.; Sun, C.; Zhang, S. Comparative transcriptome analysis of Litopenaeus vannamei reveals that triosephosphate isomerase-like genes play an important role during decapod iridescent virus 1 infection. Front. Immunol. 2020, 11, 1904. [Google Scholar] [CrossRef] [PubMed]
  60. Walton, M.J. Metabolic effects of feeding a high protein/low carbohydrate diet as compared to a low protein/high carbohydrate diet to rainbow troutSalmo gairdneri. Fish Physiol. Biochem. 1986, 1, 7–15. [Google Scholar] [CrossRef] [PubMed]
  61. Niu, J.; Lin, H.-Z.; Jiang, S.-G.; Chen, X.; Wu, K.-C.; Tian, L.-X.; Liu, Y.-J. Effect of seven carbohydrate sources on juvenile Penaeus monodon growth performance, nutrient utilization efficiency and hepatopancreas enzyme activities of 6-phosphogluconate dehydrogenase, hexokinase and amylase. Anim. Feed Sci. Technol. 2012, 174, 86–95. [Google Scholar] [CrossRef]
  62. McCue, M.D. Starvation physiology: Reviewing the different strategies animals use to survive a common challenge. Comp. Biochem. Physiol. Part A Mol. Integr. Physiol. 2010, 156, 1–18. [Google Scholar] [CrossRef] [PubMed]
  63. Huang, X.; Feng, Y.; Duan, J.; Xiong, G.; Fan, W.; Liu, S.; Zhong, L.; Wang, K.; Geng, Y.; Ouyang, P.; et al. Antistarvation Strategies of E. Sinensis: Regulatory Networks under Hepatopancreas Consumption. Oxidative Med. Cell. Longev. 2020, 2020, 6085343. [Google Scholar] [CrossRef] [PubMed]
Figure 1. Effect of starvation stress on the condition index of M. yessoensis. The data are presented as the mean value ± standard deviation for each group (n = 10). * above columns indicate significant differences (p < 0.05).
Sustainability 14 13217 g001
Figure 2. Effect of starvation stress on the hemocytes of M. yessoensis. * above columns indicate significant differences (p < 0.05).
Sustainability 14 13217 g002
Figure 3. Effect of starvation stress on the ACP of M. yessoensis. Different Latin letters in the superscript indicate significant differences between different starvation stress times in the experimental groups. * above columns indicate significant differences (p < 0.05).
Sustainability 14 13217 g003
Figure 4. Effect of starvation stress on the Lysozyme of M. yessoensis. * above columns indicate significant differences (p < 0.05).
Sustainability 14 13217 g004
Figure 5. Effect of starvation stress on the T-AOC of M. yessoensis. * above columns indicate significant differences (p < 0.05).
Sustainability 14 13217 g005
Figure 6. Effect of starvation stress on the MDA of M. yessoensis. Different Latin letters in the superscript indicate significant differences between different starvation stress times in the experimental groups.
Sustainability 14 13217 g006
Figure 7. Effect of starvation stress on the BCA of M. yessoensis. Different Latin letters in the superscript indicate significant differences between different starvation stress times in the experimental groups. * above columns indicate significant differences (p < 0.05).
Sustainability 14 13217 g007
Figure 8. The Pearson correlation between samples.
Sustainability 14 13217 g008
Figure 9. Volcanic map of DEGs between starved and feeding groups (the top figure is for hemolymph and bottom is for striated adductor muscle). The x-axis indicates the fold change of gene expression between groups, and the y-axis indicates the statistically significant degree. The blue dots represent down-regulated genes (the expression level in starved group was significantly lower than that in feeding group) and red dots represent up-regulated genes (the expression level in starved group was significantly higher). The threshold set for Q value was 0.05.
Sustainability 14 13217 g009aSustainability 14 13217 g009b
Figure 10. Gene Ontology categorization of the DEGs in the transcriptomes from hemolymph and striated adductor muscle of M. yessoensis. HL, hemolymph; SM, striated adductor muscle.
Sustainability 14 13217 g010
Figure 11. KEGG functional enrichment of DEGs in hemolymph and striated adductor muscle. The x-axis represents the ratio of term candidate gene number and term gene number and the y-axis shows the terms of KEGG pathway. HL, hemolymph; SM, striated adductor muscle.
Sustainability 14 13217 g011
Figure 12. KEGG metabolism pathway enrichment of down-regulated DEGs in striated adductor muscle.
Sustainability 14 13217 g012
Figure 13. Log2 fold change of expression of DEGs involved in glycolysis/gluconeogenesis (Q value < 0.05, n = 5). Pgm, pgi, pfkA, fbp, tipA, gapA, pgk, gpmA, eno, and pyk are the abbreviations of genes encoding phosphoglucomutase, glucose-6-phosphate isomerase, 6-phosphofructokinase, fructose-1,6-bisphosphatase, fructose-bisphosphate aldolase, triosephosphate isomerase, glyceraldehyde 3-phosphate dehydrogenase, phosphoglycerate kinase, 2,3-bisphosphoglycerate-dependent phosphoglycerate mutase, enolase, and pyruvate kinase, respectively. SSM, striated muscle from starved group; FSM, striated muscle from feeding group.
Sustainability 14 13217 g013
Figure 14. Log2 fold change of expression of DEGs involved in pentose phosphate pathway (Q value < 0.05, n = 5).
Sustainability 14 13217 g014
Publisher’s Note: MDPI stays neutral with regard to jurisdictional claims in published maps and institutional affiliations.

