Article

Maillard and Hydrolytic Reactions in Subcritical Water Extraction of Bioactive Compounds from Licorice

1
Department of Nutrition and Food Hygiene, School of Public Health, Peking University, Beijing 100191, China
2
Beijing Key Laboratory of Functional Food from Plant Resources, College of Food Science & Nutritional Engineering, China Agricultural University, Beijing 100083, China
*
Author to whom correspondence should be addressed.
Molecules 2022, 27(20), 6851; https://doi.org/10.3390/molecules27206851
Submission received: 29 July 2022 / Revised: 6 September 2022 / Accepted: 8 October 2022 / Published: 13 October 2022
(This article belongs to the Special Issue Recent Development in Subcritical Water Extraction and Chromatography)

Abstract

:
Nowadays, subcritical water extraction (SWE) techniques are extensively investigated worldwide, while the thermal reactions that inevitably occur under subcritical water conditions are rarely studied. In order to investigate the behaviors of the different reactions during SWE of bioactive compounds from licorice, the Maillard reaction process was accessed via their products and the hydrolytic reaction was analyzed according to the kinetic parameters. In addition, the contents of total phenolics and flavonoids in the extracts obtained at the different temperatures were determined and total antioxidant capacities were evaluated by HPLC-ABTS+. The results showed that flavonoids and phenolics from licorice as well as new compounds generated via the Maillard reaction contributed to the antioxidant activity of the extracts. The fluorescence, color and absorbance of the extracts showed that the degree of the Maillard reaction increased with the rise of the extraction temperature. The kinetics of extraction for glycyrrhizic acid showed that it was firstly extracted by diffusion, and then was hydrolyzed into glycyrrhetinic acid 3-O-mono-β-D-glucuronide and glycyrrhetinic acid following a first-order mechanism. These findings could provide deep insights into the SWE process and a new method for producing glycyrrhetinic acid 3-O-mono-β-D-glucuronide and glycyrrhetinic acid.

1. Introduction

Licorice, the roots of Glycyrrhizia glaubra, has been widely used in medicine for treating phthisis (pulmonary tuberculosis), contagious hepatitis, and bronchitis because of its anti-inflammatory, anti-viral, anti-allergic, anti-oxidant, gastro-protective, and anti-cancerous properties [1]. Triterpene saponins and flavonoids have been demonstrated to be major constituents and show several pharmacological activities. Triterpenoid saponins are also sweet-tasting [2].
Water reaches a subcritical state as the temperature rises; during this period, water properties exhibit greater changes, including decreases in viscosity, surface tension, and dielectric constant and an increase in diffusivity, which results in a significant increase in the solubility of components with less polarity. Therefore, subcritical water extraction (SWE) technology possesses a series of advantages: more efficiency and selectivity, lower costs, and less pollution [3]. In fact, the full utilization of subcritical water technology is not only used for extraction but also for the chemical reaction that occurs due to the increasing self-ionization of water at higher temperatures [4,5]. It was expected that SWE technology can be used to extract bioactive compounds from licorice, i.e., single bioactive substances including glycyrrhizic acid and liquiritin [6,7]. The chemical reaction that takes place during SWE from licorice has been neglected. Examples of glycyrrhizic acid originally present in the matrices might be released and interacted, and new compounds might be generated [8,9]. Based on our previous research, it was speculated that the Maillard reaction might occur in subcritical water due to a reduced pH value as well as the formation of 5-hydroxymethyl furfural [10]. Therefore, only with a sufficient understanding of the SWE process can we utilize this technology with high efficiency and prepare high-value-added products directionally.
In order to compensate for the lack of research on what happens during the SWE process of multiple bioactive substances from licorice, we focused on the reaction process, including the Maillard reaction and thermal hydrolysis. We originally investigated the effect of the extraction temperature and time on the extraction behaviors of bioactive substances and its antioxidant activity by HPLC-ABTS+, and then analyzed the Maillard and hydrolysis reaction process under SW, especially hydrolysis reaction kinetic of glycyrrhizic acid, which has been firstly discovered that glycyrrhizic acid can transform into glycyrrhetinic acid 3-O-mono-β-D-glucuronide under SW (study design in Figure 1). This work clarifies the SWE process and provides a clue to preparing value-added substances extracted from licorice.

2. Results and Discussion

2.1. Subcritical Water Extraction

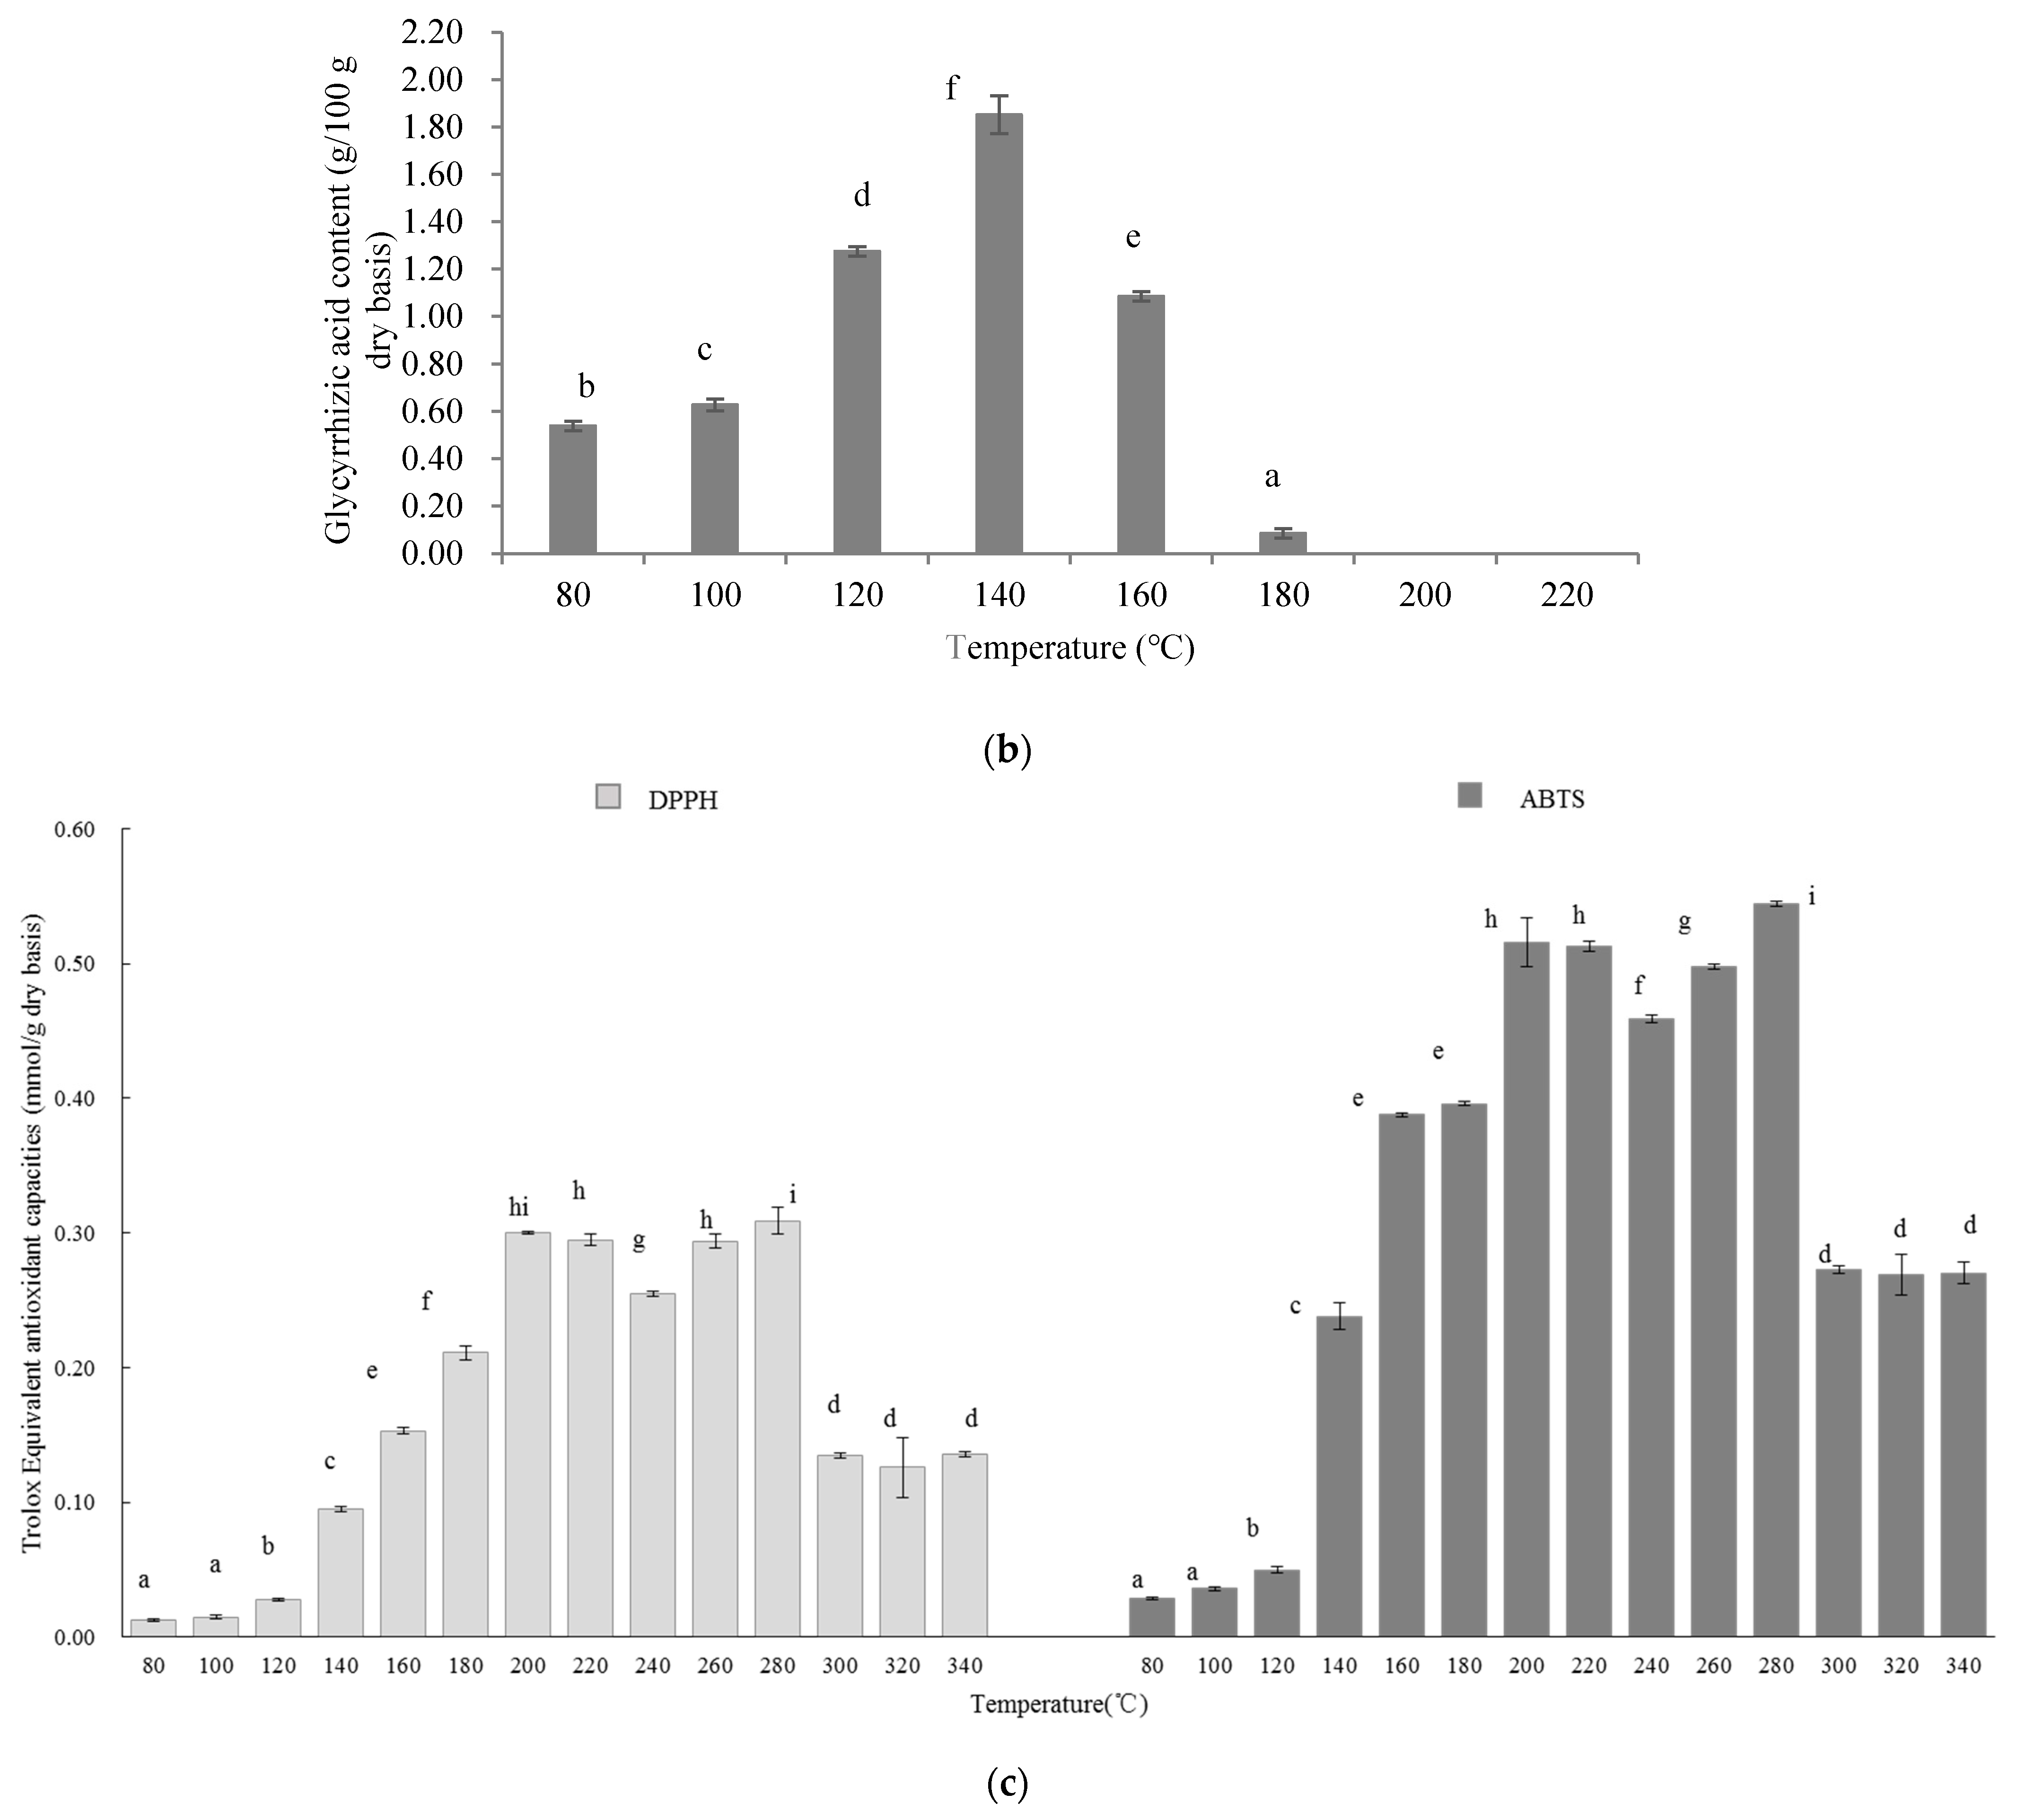
2.1.1. Effect of Extraction Temperature on the Content of Bioactive Compounds in the Extract

The SWE of bioactive compounds from licorice was carried out at different temperatures (80–340 °C) for 20 min with a solid-to-water ratio of 1:30 at pH 8 under 7 MPa. As described in Figure 2a, the effects of extraction temperature on the content of total phenolics and total flavonoids were significant (p < 0.05). Total phenolic content increased with a rise in temperature from 80 to 200 °C and then decreased. The maximum content of total phenolics was 4.213 g/100 g dry basis at 200 °C, which was 15-fold higher than that obtained at 80 °C. The content of total flavonoids increased significantly (p < 0.05) from 0.297 g/100 g dry basis at 80 °C to 2.021 g/100 g dry basis at 220 °C. With the rise in temperature, the water dielectric constant (which is normally 80) considerably decreases (to approximately 36.5 at 190 °C, 33 at 210 °C), presenting a behavior similar to organic solvents (such as methanol, whose dielectric constant is 32.6 at 25 °C) and allowing a faster extraction and a better extraction yield for phenolic compounds and flavonoids [11]. In addition, the major barrier to releasing polyphenol compounds from plant materials was the cell wall, rich in cellulose and pectin, and SW was used to facilitate cell-wall destruction [12]. The existing bonds (ester and/or ether bonds) between lignin and cellulose could be effectively hydrolyzed in SW; consequently, phenolic compounds were released [13]. Therefore, SW could enhance the extraction recovery of flavonoids and phenolics. However, the content of total phenolics and flavonoids started to decrease from 200 and 220 °C, respectively. It was speculated that these compounds further degraded and reacted with other components [11]. It was clearly observed that the maximum extraction yield of total flavonoids and phenolics depending on the temperatures were different, i.e., 220 vs. 200 °C. A possible reason may be that multiple single substances belong to total flavonoids and total phenolics with unique structures. Some kinds of phenolic compounds contain abundant phenolic hydroxyl groups, which lead to relatively more polarity than flavonoid compounds, which exhibit many (large) carbon atoms (≥15) and nonpolar functional groups such as -OCH3 (e.g., isorhamnetin) and -H (e.g., kaempferol) [14]. Therefore, it is possible that flavonoids show less polarity than some phenolics, which generates the maximum extraction yield of total flavonoids at higher temperatures. A similar phenomenon was reported by Kumaret al. (2011) [15]. In addition, our previous research reported that flavonoids in licorice contained flavanones (liquiritin apioside, liquiritin), chalcones (isoliquiritin apioside, licuraside), flavonols (isolicoflavonol), isoflavone (ononin), and flavone glycosides (licorice-glycoside A, licorice-glycoside B) [10]. The structures are listed in the Supplementary Materials of that study. It was observed that some flavonoids contain nonpolar side chains, such as alkyl groups (isolicoflavonol) and aglycones (licorice-glycoside A, licorice-glycoside B). According to other reports [16,17,18], there are some prenylated flavonoids with less polarity, including lupalbigenin, glabrene, gancaonin F, and gancaonin G, in licorice extracts, which are more stable than phenolics. Therefore, compared with the optimal extraction temperature for total phenolics, the optimal extraction temperature for total flavonoids was relatively higher.
As shown in Figure 2b, the glycyrrhizic acid content in the extract was affected significantly (p < 0.05) by the extraction temperature. With the rise in extraction temperature, glycyrrhizic acid content increased significantly (p < 0.05). The maximum content was 1.834 g/100 g dry basis at 140 °C. Further increasing the temperature led to a sharp decrease in the content, and no glycyrrhizic acid was detected over 200 °C, which was attributed to its instability and decomposition [19,20]. This decomposition could be reflected by glycyrrhetinic acid 3-O-mono-β-D-glucuronide and glycyrrhetinic acid formation (Figure 2b and Figure 5b,c). Glycyrrhetinic acid 3-O-mono-β-D-glucuronide, which does not exist naturally in licorice, is formed after cleaving the distal glycosidic bond of glycyrrhizic acid. In fact, the decomposition reaction of glycyrrhizic acid occurred at a certain temperature, coupled with some exposure time for sufficient energy. We observed that the decomposition of glycyrrhizic acid occurred above 100 °C, i.e., 100 °C for 70 min vs. 120 °C for 50 min, as indicated in our previous report in Food Chemistry [21]. In this study, the decrease in glycyrrhizic acid content was observed to begin from 140°C, as shown in Figure 2b. However, this does not mean that the decomposition occurred from 140 °C. As long as the accumulated energy is sufficient, extraction and decomposition may take place simultaneously. A possible reason for the decrease in glycyrrhizic acid above 140 °C in this study was the higher temperature, which provided sufficient energy for glycyrrhizic acid hydrolysis to occur rapidly, which then lead to the decomposition rate increasing beyond its accumulation rate.
Based on the previous report [10], the contents of total flavonoids and phenolics compounds were 2.037 and1.932 g/100 g dry basis by the traditional extraction with 50% ethanol at 80 °C for 5 h, which was equal with the contents in this research with subcritical water at 140 °C for 20 min. Under the same conditions, the content of glycyrrhizic acid in the extract was 1.834 g/100 g dry basis, which was 1.5 times that of the extract obtained with water at 80 °C for 5 h. Therefore, the extraction of bioactive substances with subcritical water showed the high efficiency and low energy consumption.

2.1.2. Effect of Extraction Temperature on the Total Antioxidant Activity of Licorice Extract

The total antioxidant activity of licorice extract was evaluated with DPPH and ABTS assays. As shown in Figure 2c, total antioxidant activity was significantly affected (p < 0.05) by extraction temperature, and the total antioxidant activity, evaluated by two assays, increased significantly (p < 0.05) with the rise in extraction temperature from 80 to 280 °C. The higher antioxidant activities of the extract were obtained between 200 and 280 °C. At 280 °C, the highest values were 0.544 mmol TEAC/g dry basis with an ABTS assay and 0.309 mmol TEAC/g dry basis with a DPPH assay, respectively.
Compared with the curve in Figure 2a,c, there were some differences between the content of total phenolics, total flavonoids, and total antioxidant activity from 240 to 280 °C. In order to estimate the relationship between the total antioxidant activity and the total phenolic and flavonoid content, correlation analysis was carried out (Table S1 Supplementary Materials). The linear correlation coefficients (R2 > 0.90) between 80 and 240 °C showed that there was a good relationship between the content of total flavonoids, phenolics, and the antioxidant capacity, which indicated that the antioxidant activity could be attributed to the phenolics and flavonoids in the extract. This result is in significant agreement with a previous report [22]. However, at higher temperature (>240 °C), phenolics and flavonoids were decomposed, and the extract still exhibited strong antioxidant activity. The R2 value between 240 and 280 °C was relatively low (R2 < 0.85), and there was even a negative correlation between total flavonoids, total phenolics and antioxidant capacity, which indicated that some non-phenolic compounds were generated at a higher temperature (>240 °C). They provided a more effective contribution to the antioxidant activity and were the main antioxidants [23].

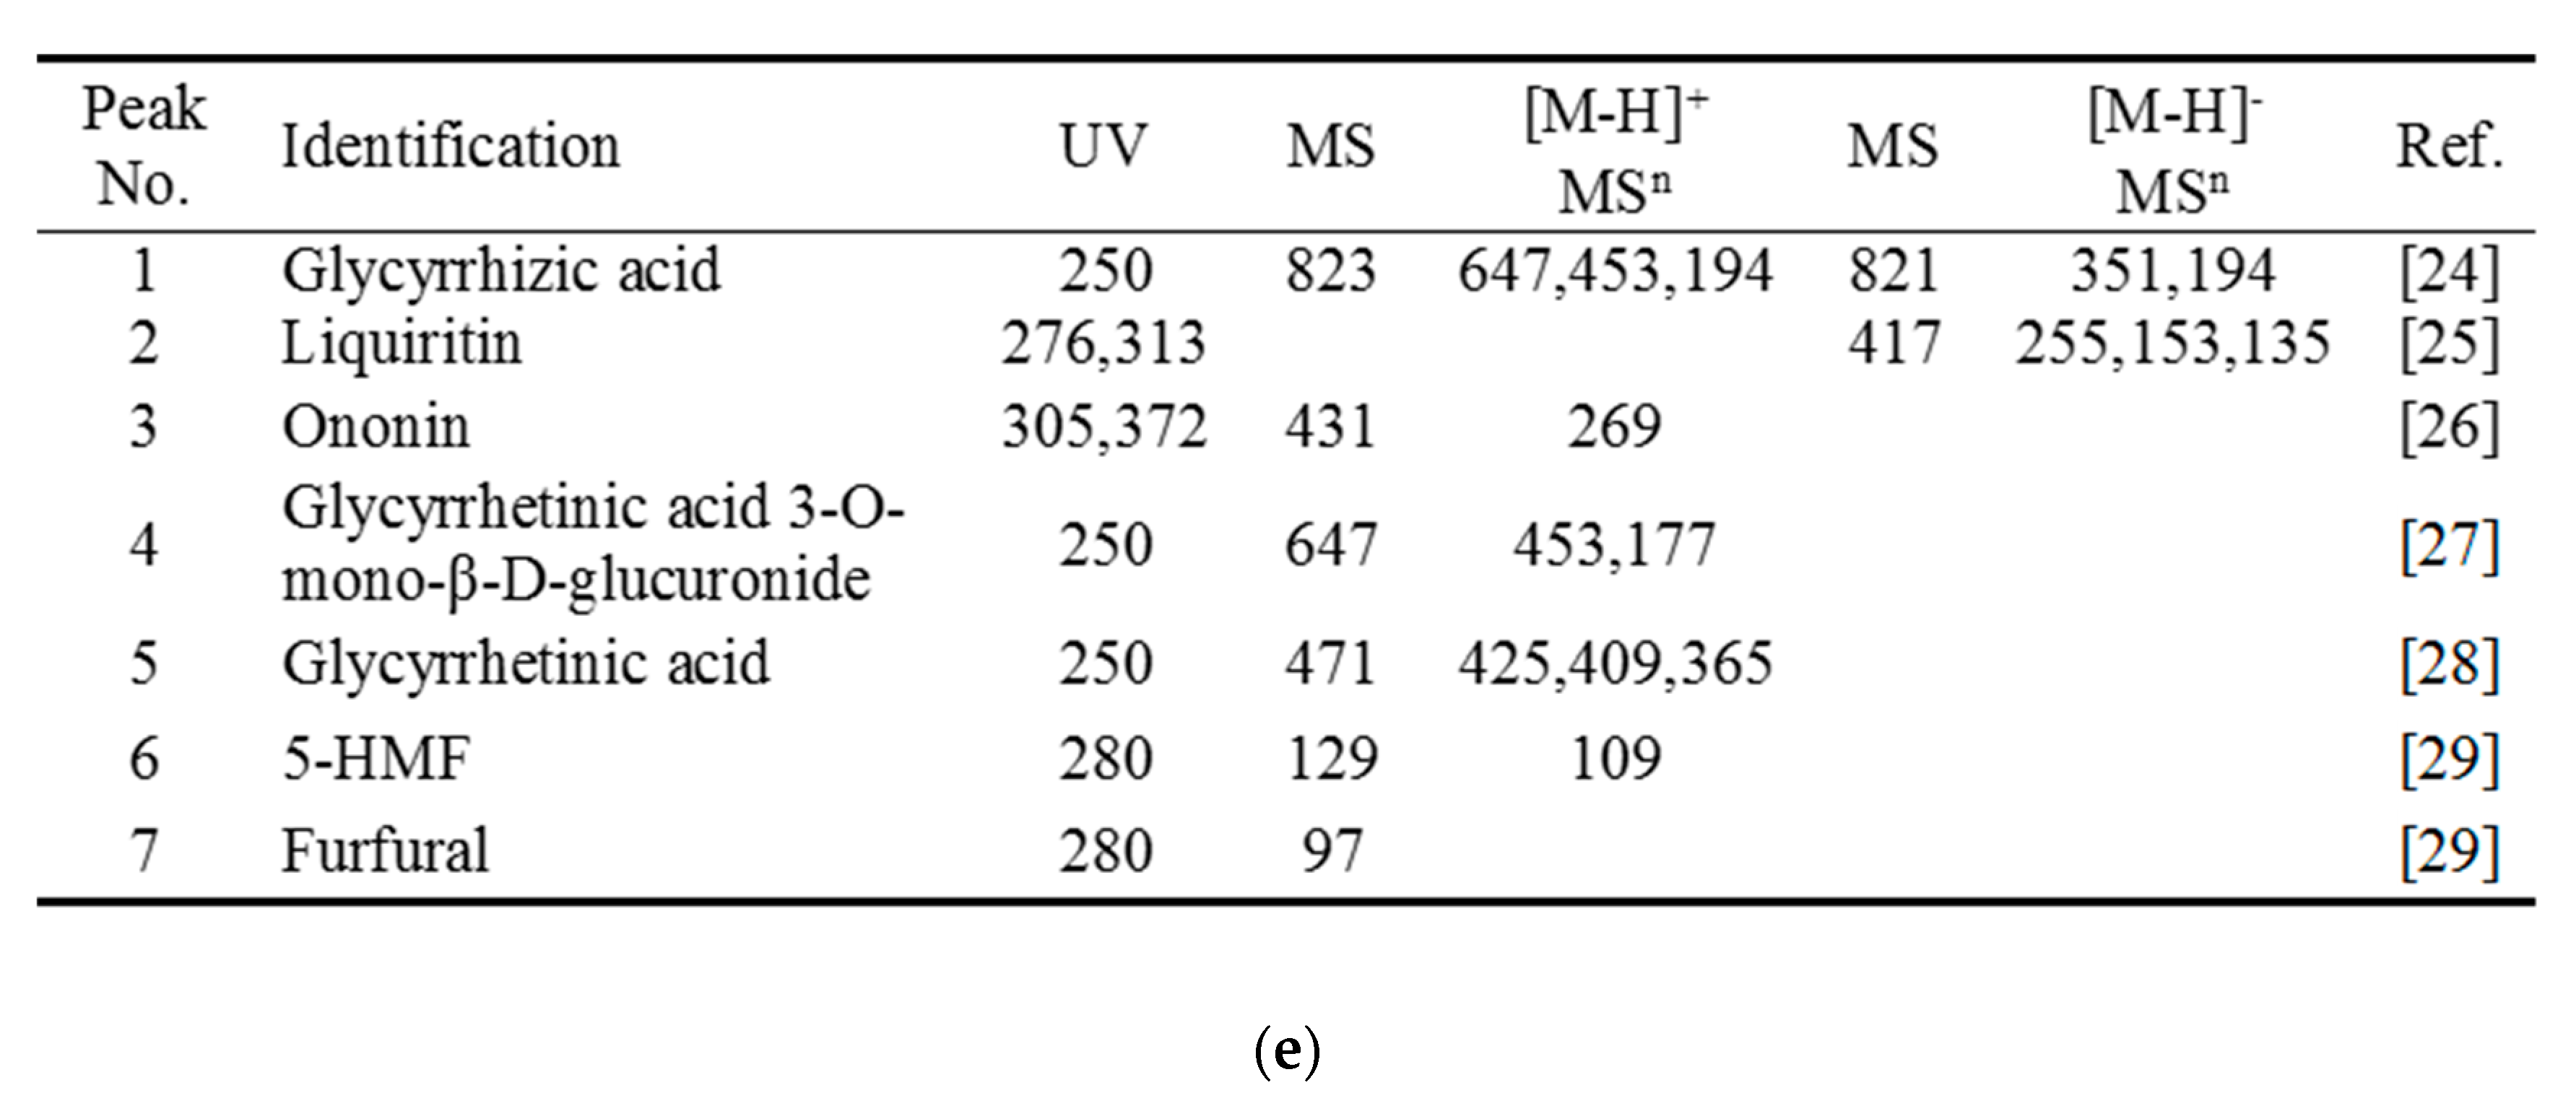
2.2. HPLC-ABTS+ Antioxidant Activity Evaluation and HPLC-MS/MS and UPLC-MS Identification of Bioactive Compounds in Licorice Extract

The antioxidant activities of the licorice extracts were evaluated with the HPLC-ABTS·+ technique, and the results are shown in Figure 3. At 100 °C, Compounds 1, 2, and 3 were clearly found. With the rise in extraction temperature, some compounds were newly generated, such as Compounds 6 and 7, and their chromatographic profile peak areas at 250 nm and 280 nm increased from 140 to 200 °C. Accordingly, their corresponding chromatographic profile peak areas at 734 nm also increased, indicating that Compounds 6 and 7 exhibited strong antioxidant activities. In addition, Compounds 4 and 5 were newly formed at 140 °C, and the chromatographic profile peak areas of Compounds 4 and 5 increased at 200 °C; however, Compound 1 could not be observed. At a higher temperature (280 °C), Compounds 1, 2, 3, 4, and 5 disappeared. This phenomenon could indicate that there were some reactions during the process of SWE.
The bioactive compounds in the licorice extract were identified with HPLC-MS/MS. The information of MS and UV is shown in Figure 3. These identified compounds were confirmed by comparing them with the standards using UPLC-MS/MS (Figure S1). In terms of these identified compounds, it is proposed that the Maillard reaction and hydrolysis of glycyrrhizic acid occurred in SW.

2.3. Analysis of Non-Specific Indicators of Maillard Reaction

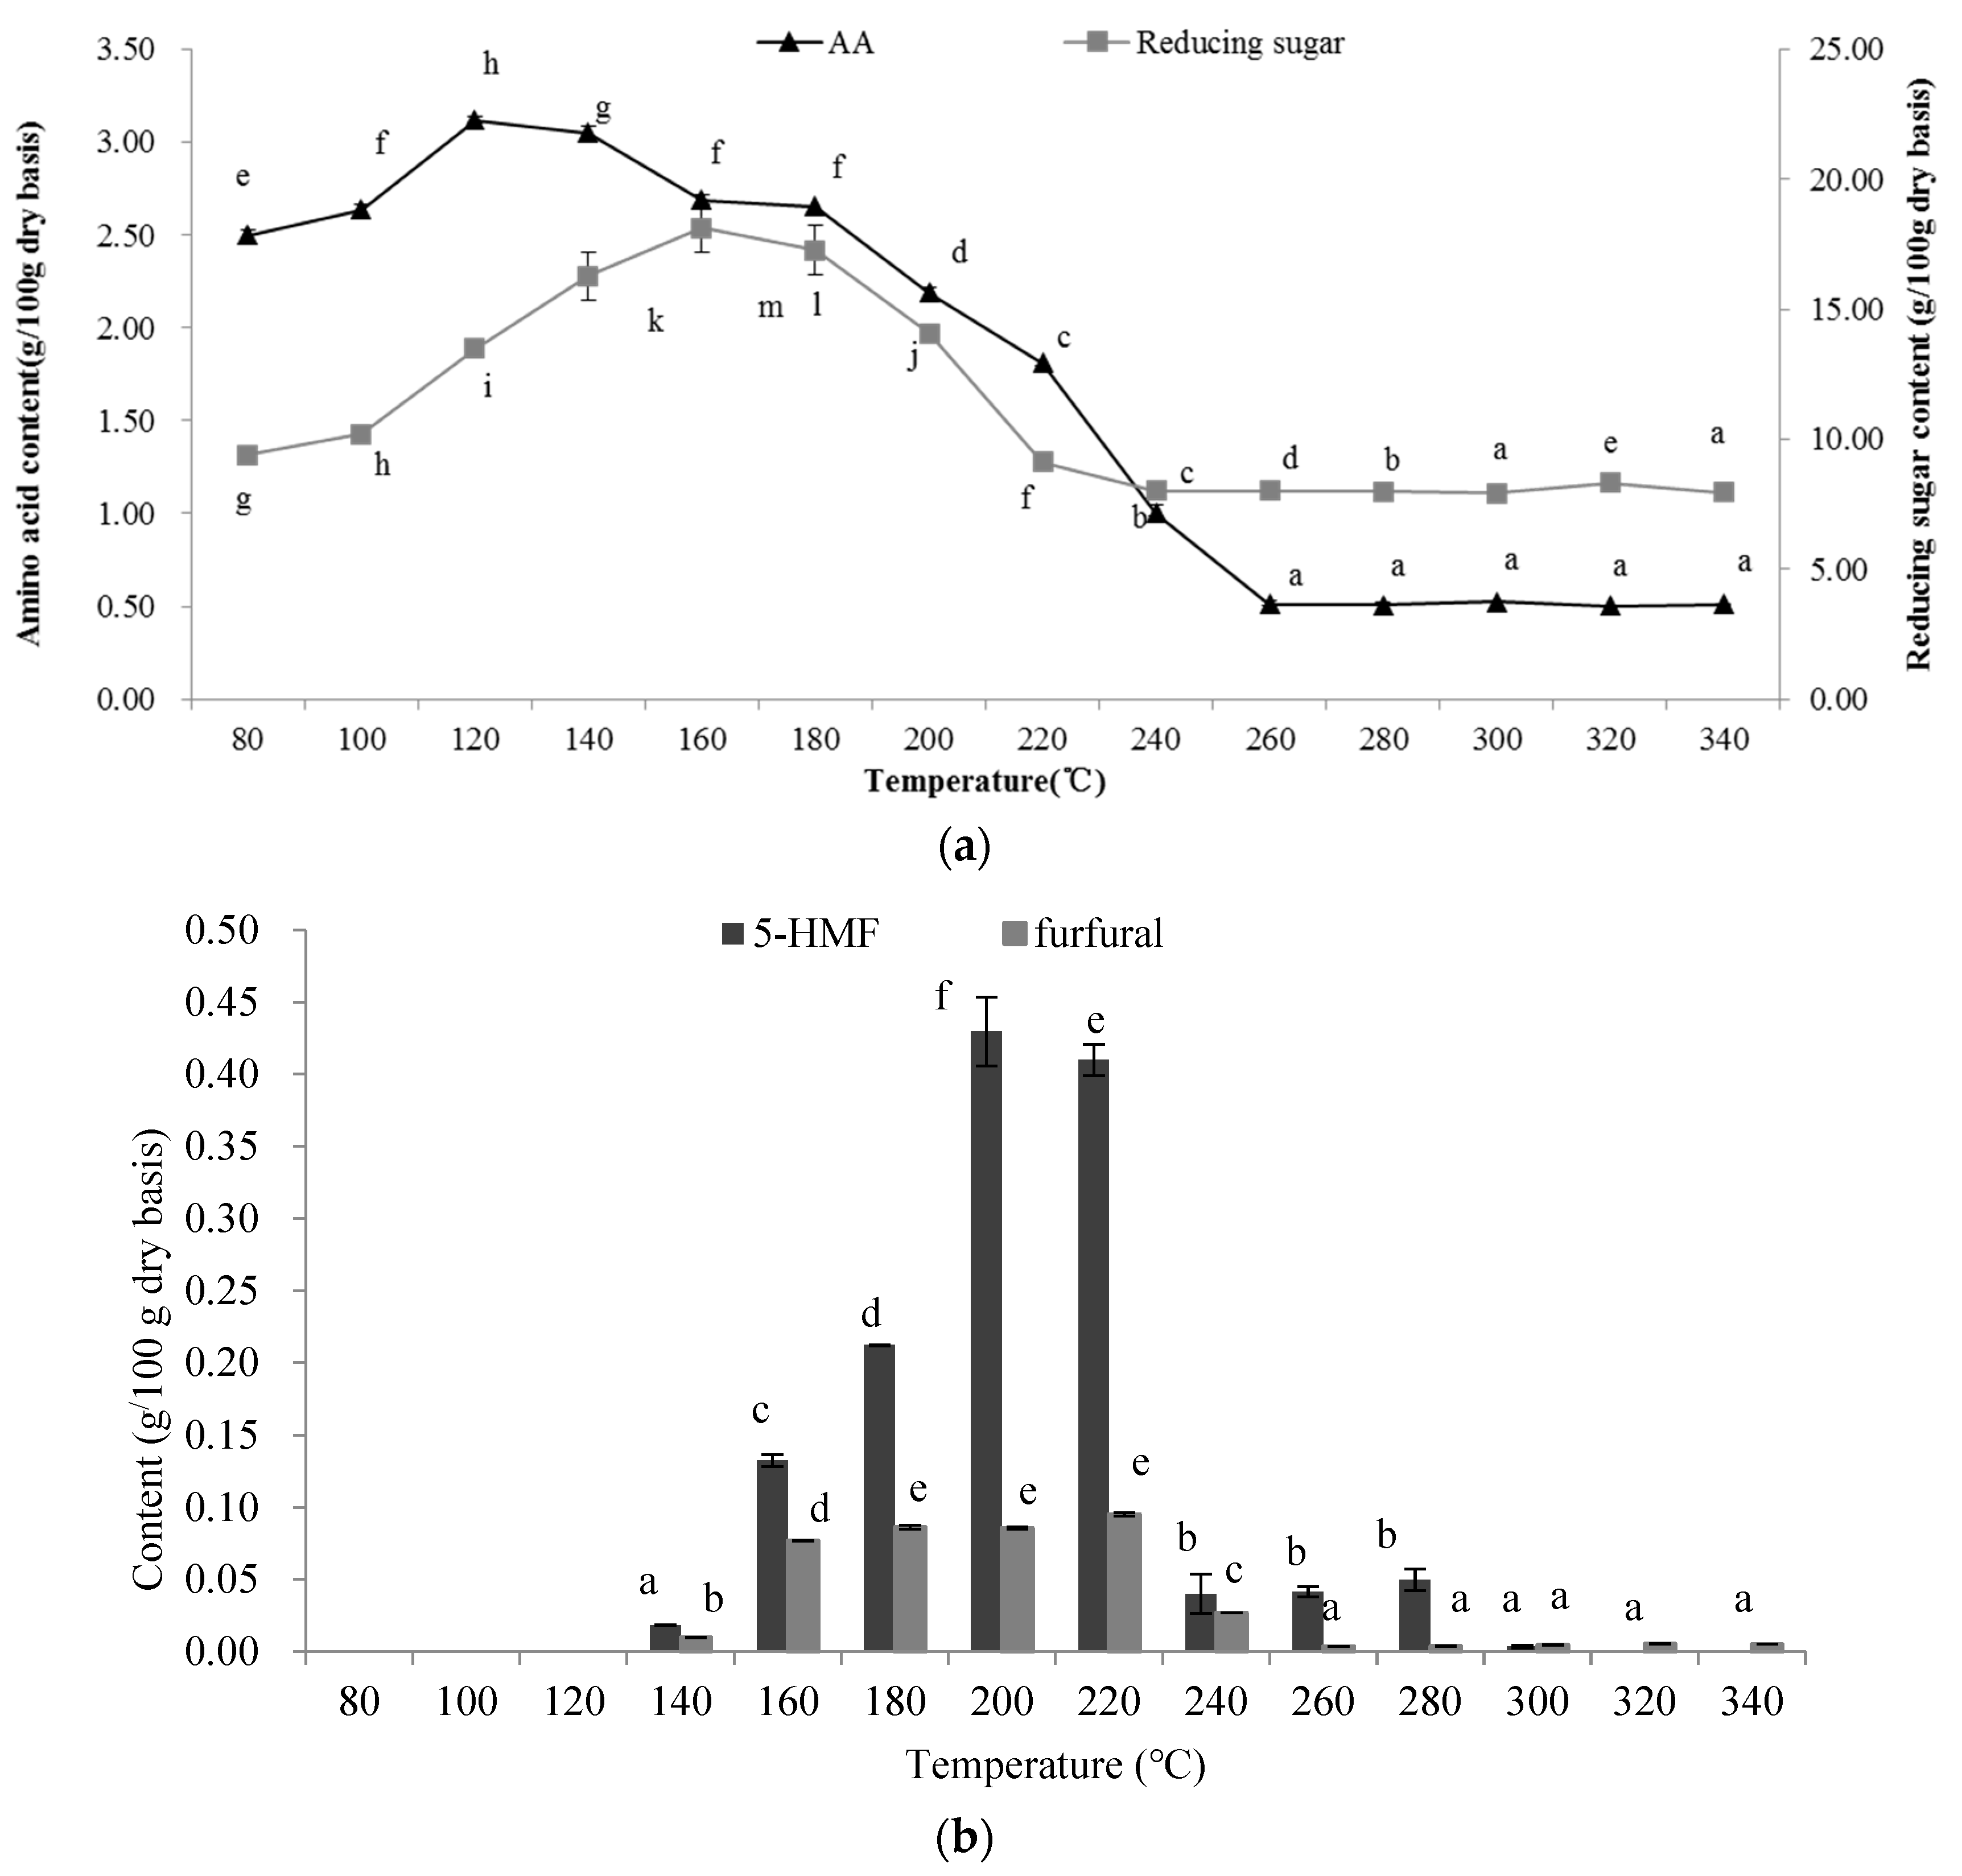
2.3.1. Total Reducing Sugars and Total Free Amino Acid Content

The Maillard reaction is initiated by the reducing-end carbonyl group and the free primary amine group, and most of these groups are derived from reducing sugars and free amino acids in foodstuffs, respectively. As shown in Figure 4a, the total reducing sugars and free amino acid concentrations were significantly (p < 0.05) affected by extraction temperature. Free amino acid content increased and reached a maximum level at 120 °C and then decreased sharply. The total reducing sugar content increased from 80 to 160 °C and then decreased at the higher temperature. The effects of the extraction temperature on the content of reducing sugars and free amino acid were determined by their solubility and consumption. On the one hand, licorice contains a large number of polysaccharides (such as cellulose and hemicellulose) and crude protein [19]. With the rise in temperature, the ionic product constant (Kw) of SW increases, which leads to a high concentration of H+ and OH catalyzing polysaccharide and protein that hydrolyzes into small molecular compounds such as monosaccharides and amino acids, respectively, so reducing sugars and amino acids were released [30]. Accordingly, with the rise in temperature, reducing sugars and free amino acids were inevitably involved in the Maillard reaction during SWE, leading to the reduction in their content. In addition, it was also observed that there was a certain degree of correlation between the fluorescence data and the amino acid content (R2= 0.788 for λEm 460, R2= 0.752 for λEm 528). Therefore, the Maillard reaction obviously occurred.

2.3.2. Color Measurement

The color of the extract is the result of colored natural products associated with the raw material and the color compounds generated during processing [31]. Therefore, it is useful to study browning in relation to variations in the color of the licorice extract. The results are shown in Table 1. For the value of L, the value decreased with the elevating temperature, and the L value was significantly lower at temperatures ranging from 80 °C to 120 °C than those above 120 °C (p < 0.05). As can be seen, the a* value increased with the elevating temperature. Compared with the relatively lower temperature, i.e., 80–120 °C, the a* value increased significantly from 180 °C (p < 0.05), while the changes in the a* value were insignificant at different temperatures from 180 °C to 340 °C (p > 0.05). The value of a* tended to increase with more severe treatment, where the a* value clearly shifted towards the red component, corresponding to Maillard reaction development [32]. As expected, the a* value in the red component increased with an elevating extraction temperature, which indicated that the higher the extraction temperature was, the greater the degree of Maillard reaction that developed. In addition, a negative correlation was presented between L* and a* (R2 = 0.878). The b* value always increased with elevating temperature. Compared with the b* value at 80 °C, the b* value significantly increased from 260 °C (p < 0.05), and the b* value at 280 °C was significantly larger than those at relatively lower temperatures from 80 °C to 140 °C (p < 0.05). The positive correlation between a* and b* (R2 = 0.746) was also testified. Therefore, the color alteration of the extract indicated the occurrence of the Maillard reaction during SWE. The YI value, the integrated index for the browning degree, kept increasing as the temperature increased, with a significant increase observed from 120 °C (p < 0.05), but this increase was insignificant above 180 °C (p > 0.05), which indicated a higher degree of Maillard reaction.

2.3.3. Absorbance Measurement

As described previously, the absorbance measurement was performed at 280, 360, and 420 nm, corresponding to early, advanced, and final Maillard reaction product appearance in the extract. As shown in Table 1, a significant (p < 0.05) increase in absorbance at 280 nm for the extract was observed from 120 to 180 °C, and the decrease occurred at a higher temperature (>180 °C). The value of A260 nm represents the primary products during the Maillard reaction, which revealed that the Maillard reaction likely occurred from 120 °C, and the decreasing values from 280 °C might be due to the primary products reacting with other substances, which we speculated was the point at which the Maillard reaction moved into the next stage. The absorbance at 360 nm for the extract increased from 120 to 220 °C (p < 0.05) and then sharply decreased (p < 0.05), which implied that advanced products were generated in the process and that degradation occurred at 220 °C. This phenomenon was in agreement with a report by Kim [33]. Brown color development (A420) is the easiest measurable consequence of a Maillard reaction, as it offers a visual estimation. As shown in Table 1, the browning intensity of the extracts increased significantly with the temperature which increased from 80 °C to 260 °C (p < 0.05). Compared with the A420 value at temperatures below 120 °C, it was obviously larger at other temperatures (p < 0.05), which was consistent with our visual observations.

2.4. Analysis of Specific Indicators of Maillard Reaction

2.4.1. Determination of Fluorescent Advanced Glycated End Products

As a result of the Maillard reaction, newly formed compounds exhibit a strong emission between the wavelengths of 400 and 600 nm when excited at a wavelength of 360 nm [23]. As shown in Table 1, the change trends between the two emission wavelengths are the same. Compared with the fluorescence values of the extracts obtained at temperatures below 140 °C, the fluorescence values increased significantly (p < 0.05) over 120 °C, indicating that the Maillard reaction might have occurred from 120 °C, and the level of fluorescence reached the maximum at 280 °C, indicating that the formation of fluorescent Maillard reaction products was favored at 280 °C, and the fluorescence values then decreased significantly (p < 0.05), due to the polymerization of advanced glycated end products and some reactions with other components [23].

2.4.2. Determination of 5-Hydroxymethyl Furfural and Furfural

The compound 5-Hydroxymethyl furfural(5-HMF) is an intermediate compound in the Maillard reaction process. As shown in Figure 4b, 5-HMF was not detected in the extract obtained at temperatures lower than 120 °C. However, elevating the extraction temperature gave rise to the formation of 5-HMF, which reached 0.429 g/100 g dry basis at 200 °C. These results are in agreement with previous findings, which indicate the occurrence of a Maillard reaction during SWE at higher extraction temperatures [34]. However, the 5-HMF content decreased over 200 °C, because 5-HMF, an intermediate product in the Maillard reaction, can also participate in the degradation, polymerization, and reactions with other components [11,32].
Furfural is another compound formed by the degradation of ascorbic acid, sugars, and Amadori compounds [35]. With the rise in temperature, the furfural content in the extract increased significantly (p < 0.05). A higher content was obtained between 160 and 220 °C. However, the furfural content decreased at temperatures higher than 220 °C because the furfural had a high activity and participated in further reactions. In the advanced stage of the Maillard reaction, a series of reactions took place, including cyclizations, dehydrations, retroaldolizations, rearrangements, isomerizations, and further condensations, which ultimately led to the formation of brown nitrogenous polymers and copolymers, known as melanoidins [36].

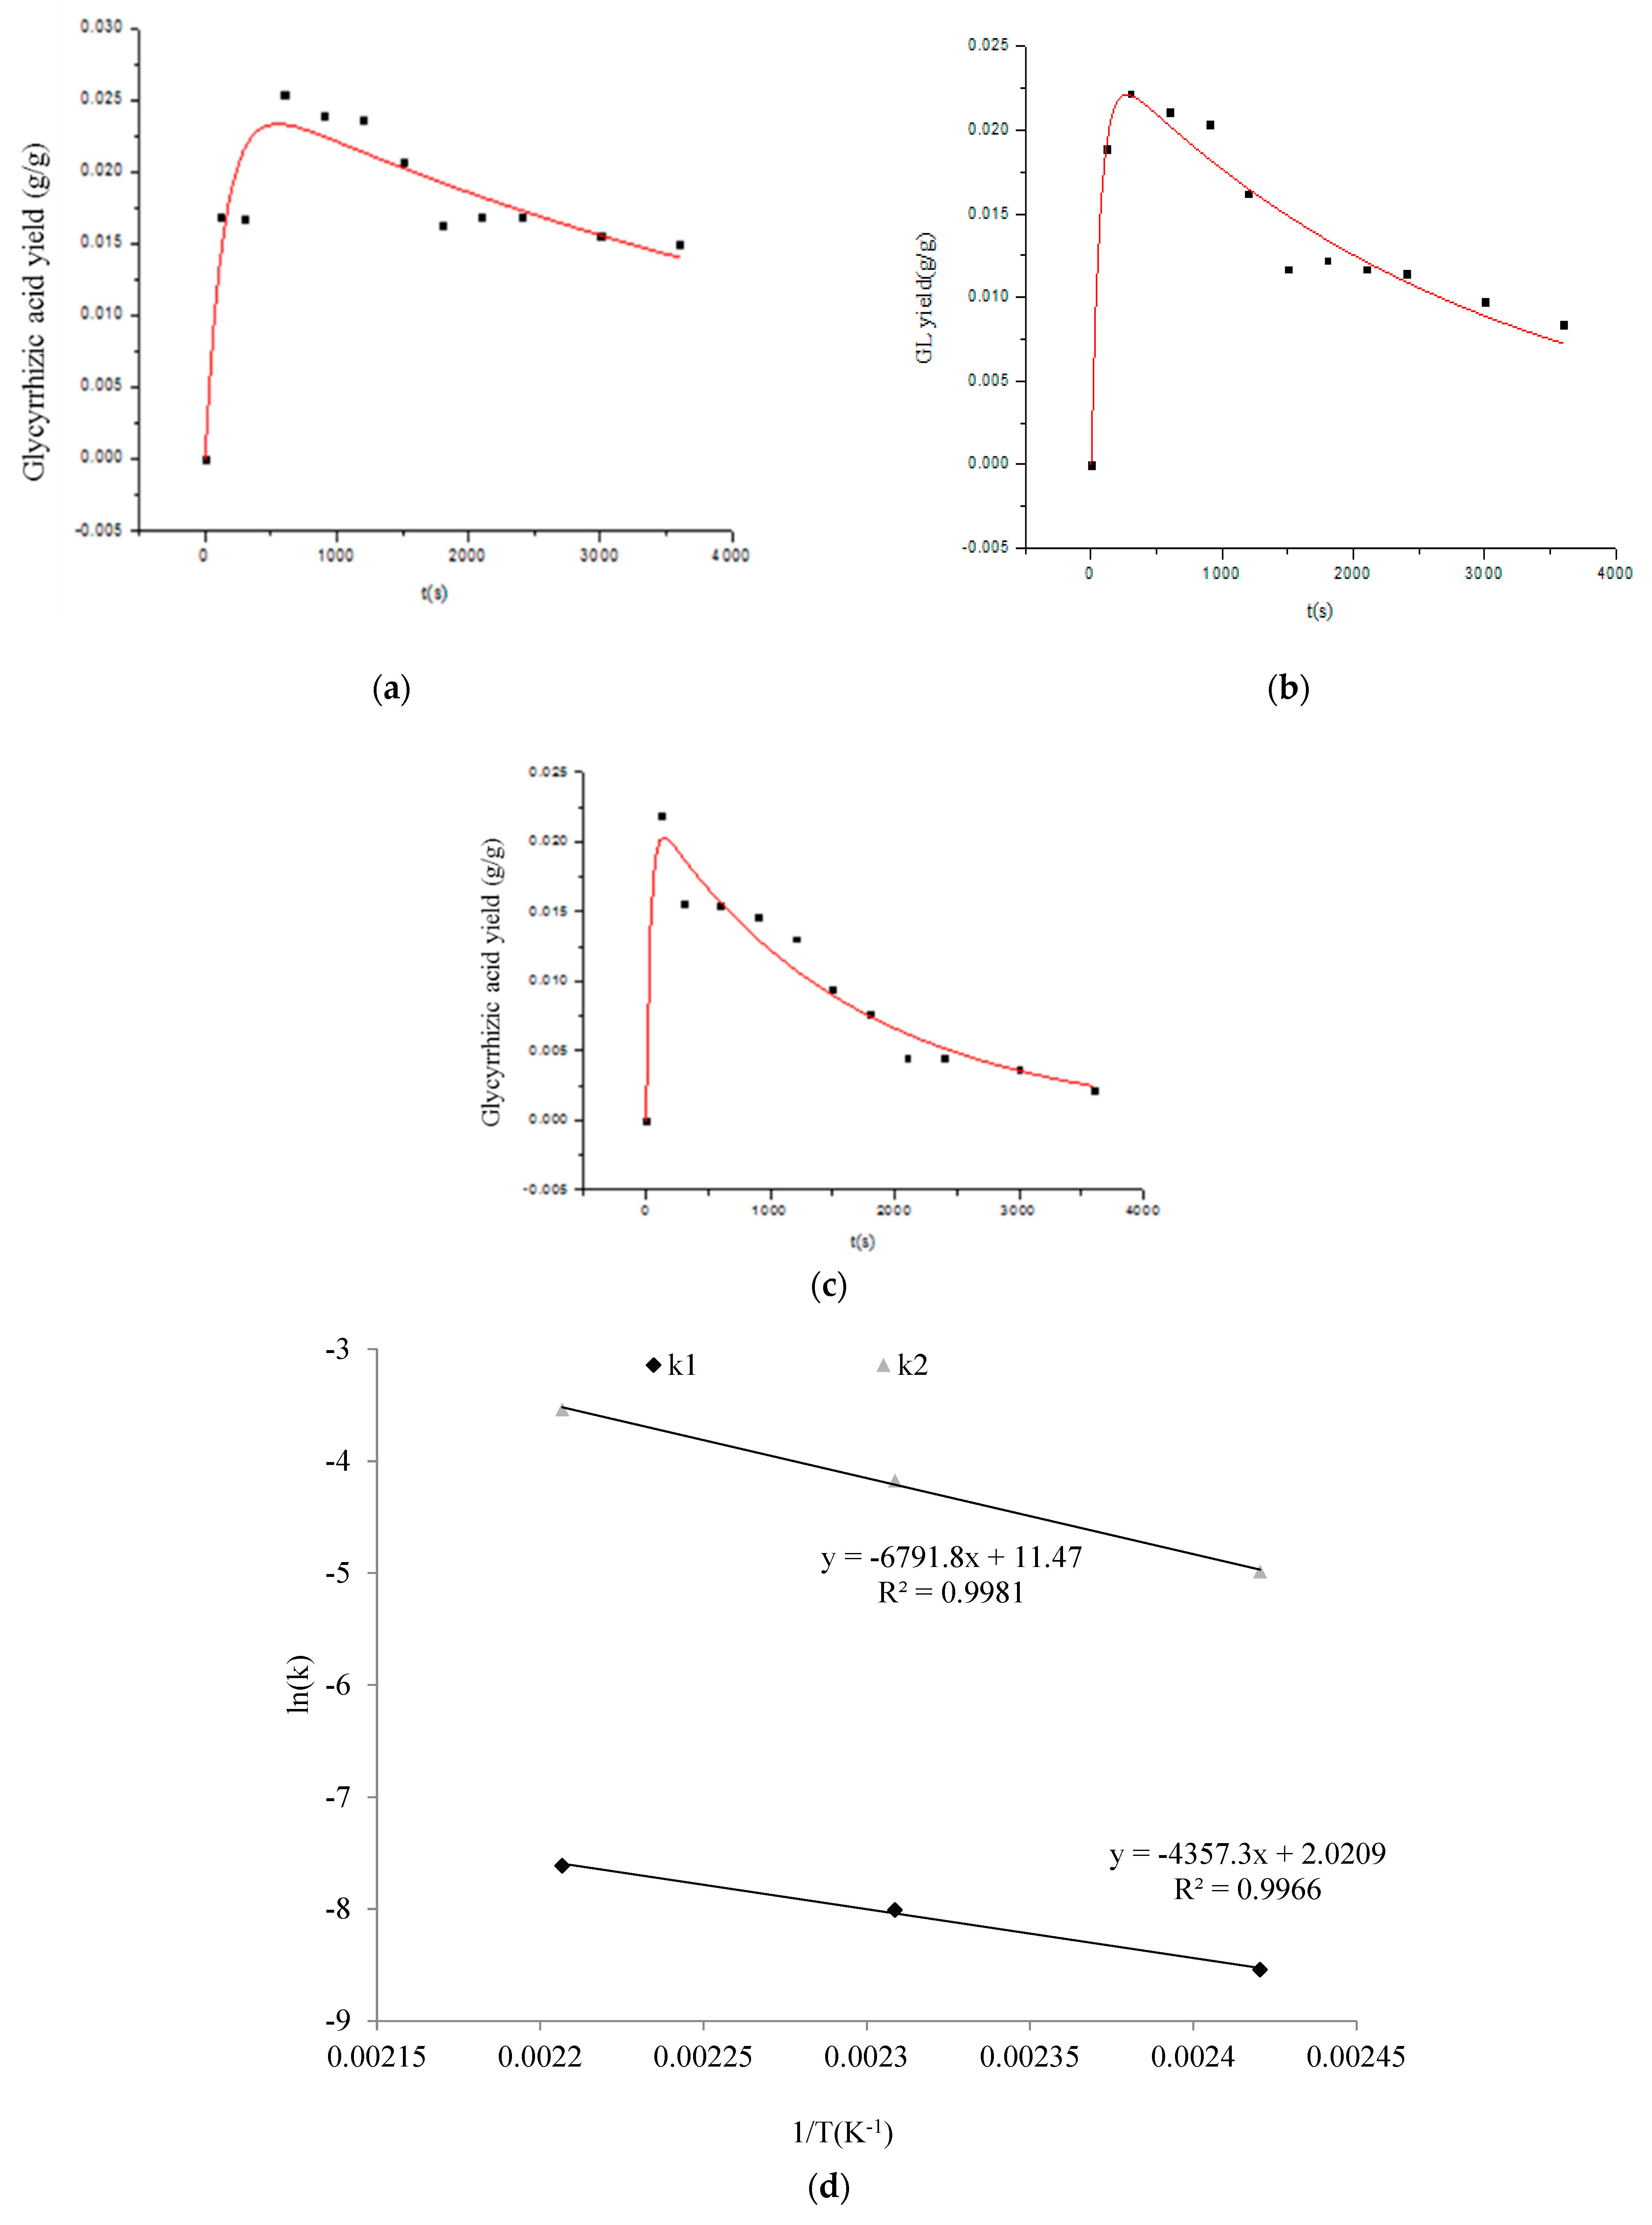
2.5. Thermal Hydrolysis of Glycyrrhizic Acid

The thermal hydrolysis of glycyrrhizic acid at different temperatures was demonstrated, and the results are shown in Figure 5a. Glycyrrhizic acid was hydrolyzed and formed glycyrrhetinic acid and glycyrrhetinic acid 3-O-mono-β-D-glucuronide in SW, and this study is the first to find these. Glycyrrhizic acid content increased before 10 min at 140 °C and before 5 min at 160 °C, which implies that the decomposition of glycyrrhizic acid hardly occurred. This result might be due to an amount of energy that is insufficient for breaking the glucosidic bond. SWE only promoted the accumulation of glycyrrhizic acid at a lower temperature over a short period. With the extension of the extraction time, glycyrrhizic acid content decreased significantly (p < 0.05), which implied the decomposition of glycyrrhizic acid. However, at a higher temperature (180 °C), glycyrrhizic acid decreased sharply (p < 0.05) at the beginning of the extraction, which indicated that glycyrrhizic acid was decomposed.
As shown in Figure 5b,c, the content of glycyrrhetinic acid 3-O-mono-β-D-glucuronide and glycyrrhetinic acid in the extract increased with the extension of extraction time at 140 and 160 °C. Glycyrrhetinic acid 3-O-mono-β-D-glucuronide content increased significantly (p < 0.05) after 5 min of extraction at 140 °C, reached a maximum value at 15 min, and then decreased due to its decomposition, hydrolyzing one molecule of glucuronic acid to form glycyrrhetinic acid. At 180 °C, the glycyrrhetinic acid 3-O-mono-β-D-glucuronide content of the extract obtained in 2 min decreased, due to its transformation and/or decomposition.
As shown in Figure 5c, glycyrrhetinic acid content increased over a short period at lower temperatures (140 °C and 160 °C). It was efficiently extracted from licorice with SW. The higher content of the extract obtained at 180 °C was due to the conversion from glycyrrhizic acid and glycyrrhetinic acid 3-O-mono-β-D-glucuronide. Therefore, the glycyrrhetinic acid yield in the extract was due to the GA in the licorice coupled with the transformation from glycyrrhizic acid and glycyrrhetinic acid 3-O-mono-β-D-glucuronide in the SW.

2.6. Kinetic Analysis

The kinetic analysis of glycyrrhizic acid extraction and hydrolysis in SW was based on consecutive steps. Glycyrrhizic acid was first extracted from inside of the licorice powder by diffusion following a first-order mechanism. Glycyrrhizic acid in the extract was then subjected to a hydrolytic reaction following the first-order mechanism due to the extension of the extraction time under a high temperature and pressure. Figure 6a–c shows the results of the time course of the glycyrrhizic acid yield from 2 to 60 min at different temperatures (140–180 °C). The experimental data were well (R2 > 0.85) correlated with the irreversible, consecutive, unimolecular-type first-order mechanism using Equation (9). The results showed that the extraction and hydrolytic rates increased with the rise in extraction temperature, which is in agreement with previous research [21]. As the temperature increased from 140 to 160 °C, k2 increased significantly (p < 0.05) from 0.00683 s−1 to 0.0141 s−1, which indicated that the energy barrier for cleaving the glycosidic bond was sufficient, which led to the fast hydrolytic reaction rate [21].
Figure 6d shows the Arrhenius plots for the SWE process. The Arrhenius plots with the pre-exponential factor and activation energy are shown in Figure 6d. The Arrhenius equations are expressed as follows:
ln k 1 = 36.17 R T + ln 7.55
ln k 2 = 54.46 R T + ln 9.6 × 10 4
Based on these values, an activation energy below 40 kJ/mol generally indicated a diffusion-controlled process, and higher values represented a chemical reaction process [37]. In terms of Ea, the diffusion-controlled process was governed by the mass transfer or diffusion of the aqueous phase from the solid reactant to the bulk solution. Accordingly, the obtained activation energy (36.17 kJ/mol) clearly indicated a diffusion control mechanism for the glycyrrhizic acid extraction process. The Ea value of the extraction was smaller compared to that of the hydrolysis, which indicated that the hydrolysis of glycyrrhizic acid requires more energy to cleave the glycosidic bond. These results could explain why a high extraction temperature was conducive to a hydrolytic reaction that overcomes the energy barrier.

3. Materials and Methods

3.1. Chemicals and Plant Material

3.1.1. Chemicals

The 1,1-Diphenyl-2-picrylhydrazyl (DPPH), 2,2’-Azinobis (3-ethylbenzothiazoline-6-sulfonic acid) diammonium salt (ABTS) and Folin–Ciocalteu reagent were obtained from Sigma (St. Louis, MI, USA). Standards of glycyrrhizic acid, ononin, glycyrrhetinic acid, and liquiritin were purchased from Winherb Medical Co., Ltd. (Shanghai, China). The 5-HMF and furfural were purchased from Aladdin Industrial Co., Ltd. (Shanghai, China). Glycyrrhetinic acid 3-O-mono-β-D-glucuronide (≥85%) was provided from the laboratory of biotechnology in College of Life Science of Beijing Institute of Technology. All the reagents (HPLC grade) were obtained from Merck (Shanghai, China).
Molecules 27 06851 i001

3.1.2. Plant Material

Licorice roots were obtained from Pufansheng Biotechnology Company (Inner Mongolia, Huhehaote, China) and ground to an average particle size below 0.4 mm by a high-speed mill (Model HY-200; Beijing Huanya Scientific Ltd., Beijing, China). Moisture content was determined by drying samples at 100 ± 0.5 °C to a constant weight, and the moisture measured was 4.05%. The lipid content was 5.23 ± 0.36% as determined by Soxhlet apparatus with hexane for 4 h. In addition, the essential oil in licorice was extracted with the hydro-distillation method based on the recommendation from the Pharmacopoeia of the People’s Republic of China, and the essential oil content was 0.04 ± 0.06%.

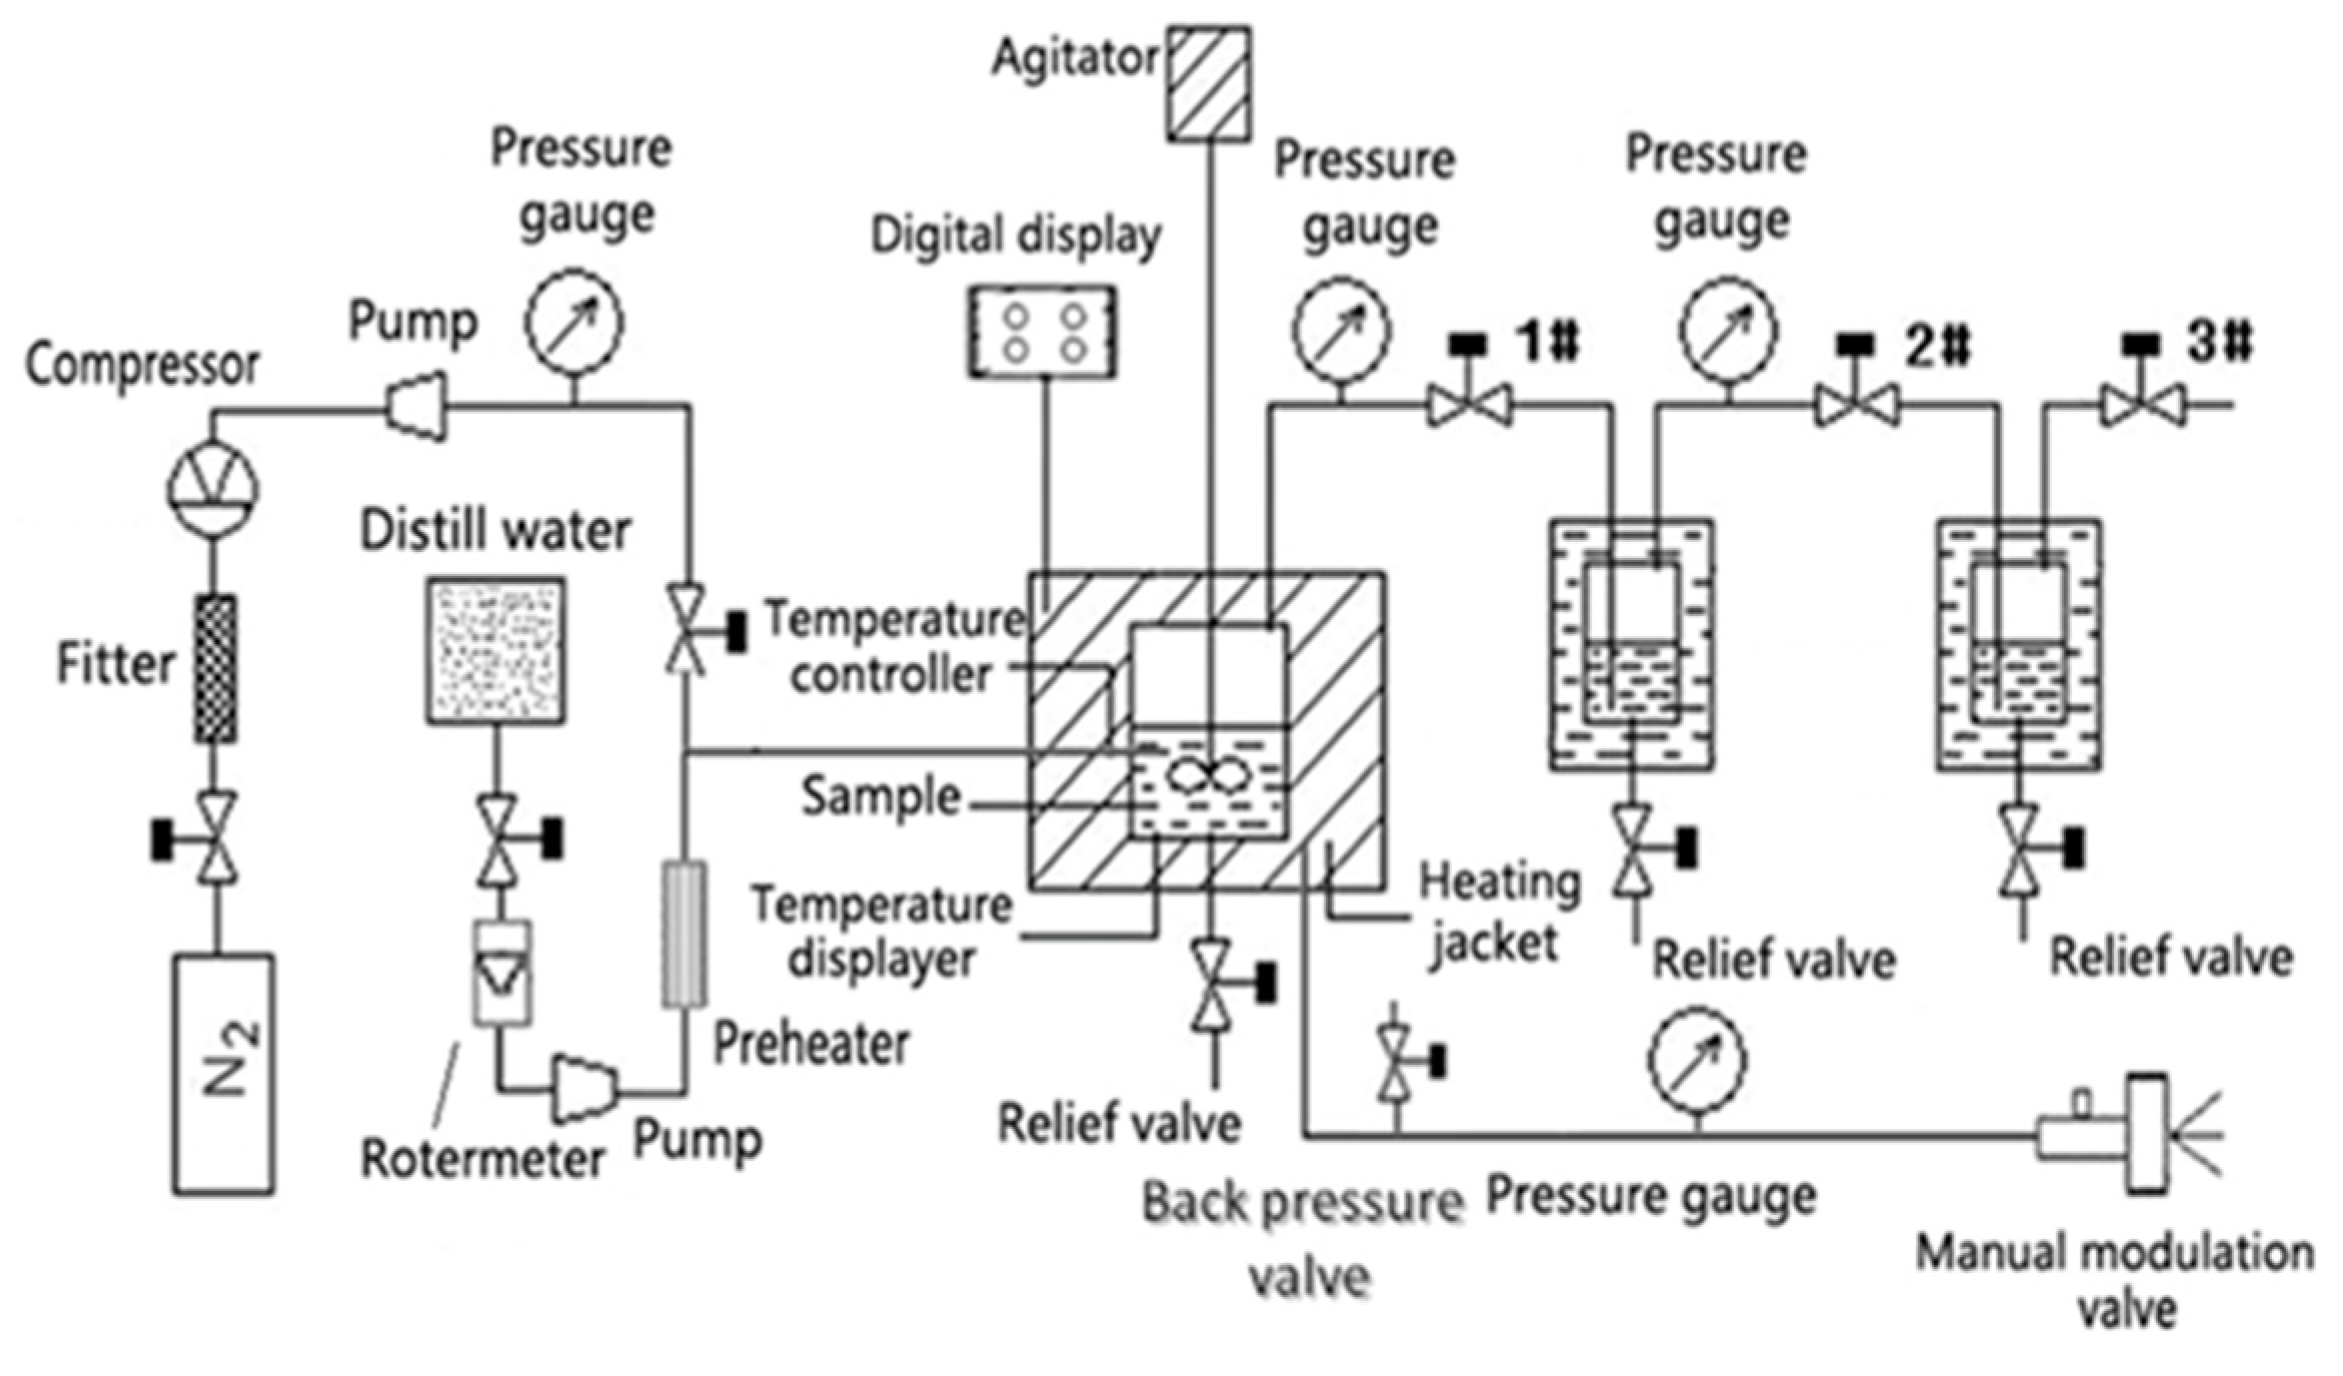
3.2. Apparatus and Extraction Procedure

SWE was carried out in an apparatus (Model CWYF-2; Sihai Instrument Inc. Nantong, China), and a schematic diagram is shown in Figure 7. According to Fan’s report [38], the extraction procedure was as follows: (1) A sample was loaded into a stainless steel vessel (inner volume: 300 mL) packed in an oven with a heating jacket connected to a temperature and pressure sensor, and the parameters were shown on the digital display meters. (2) After being tightly closed with a stainless steel cap, a constant flow rate of deionized water was purged via a syringe pump into the extraction vessel, while using nitrogen to remove dissolved oxygen before the extraction. A magnetic stirrer was activated to improve the mass transfer. Pressure was regulated by a back pressure regulating valve. Static extraction was performed (i.e., 20 min). (3) The extraction process was finished before depressurization took place.
SWE experiments were carried out under a constant pressure of 7.0 MPa, and each experiment lasted for 20 min under different temperatures (80–340 °C). Five grams of licorice powder was loaded for extraction with a solid-to-water ratio of 1:30 and a stirring speed of 150 rpm. The crude extract was collected and cooled down to ambient temperature, and then classified into three parts: aqueous solution, ethanolic solution, and residue. The phase isolation procedure was performed by the method reported by Fan et al. [10]. The cooling crude extract was centrifuged at 1500× g for 10 min, the supernatant (aqueous solution) was collected, then 30 mL of ethanol (60% v/v) was used to redissolve the sediment, which was insoluble in water, at room temperature. It was shaken and then centrifuged at 1500× g for 10 min. The supernatant (ethanolic solution) was separated and collected; the final sediment, which could have been wax, hemicellulose, and other undesired material, was discarded. The contents of bioactive compounds including total phenolics, total flavonoids, glycyrrhizic acid, glycyrrhetinic acid and Glycyrrhetinic acid 3-O-mono-β-D-glucuronide in the extracts were determined from the two parts (aqueous and ethanolic phase).

3.3. Determination of the Bioactive Compounds

3.3.1. The Total Phenolic and Total Flavonoid Content

The total phenolic content in the extract (including the aqueous and ethanolic phases) was estimated according to the method described by Singleton [39]. Briefly, 0.5 mL of diluted extract was mixed with 2.5 mL of Folin–Ciocalteu reagent (0.2 mol/L). After 10 min, 2 mL of a sodium carbonate solution (7.5%, w/v) was added. The mixture was vortexed and stood for 2 h at room temperature. The absorbance was measured at 760 nm spectrophotometrically. Results were calculated on the basis of the calibration curve of gallic acid and expressed as gallic acid equivalents (g GAE/100 g dry basis raw materials).
Total flavonoid content in the extract (including the aqueous and ethanolic phases) was determined by the aluminum chloride colorimetric method [40]. Briefly, 0.5 mL of a sample (appropriately diluted) was placed in a 10 mL graduated test tube, and 3.5 mL of distilled water and 0.3 mL of sodium nitrite (7.5 g/100 mL) were added and mixed. Three milliliters of an aluminum chloride solution (1 g/100 mL) was added 5 min later, and 2 mL of a sodium hydroxide solution (4 g/100 mL) was then added. The total volume was adjusted to 10 mL with distilled water and vibrated for 20 s. After 15 min, the absorbance was measured at 510 nm spectrophotometrically. Total flavonoid content was calculated from a calibration curve of rutin and expressed as rutin equivalent (g RE/100 g dry basis raw materials).

3.3.2. Determination of Glycyrrhizic Acid and Its Hydrolytic Products

The content of glycyrrhizic acid and its hydrolytic products was measured using HPLC-DAD (Agilent, American) with a Zorbax Eclipse Plus C18 column (250 × 4.6 mm, i.d., 5 μm) [21]. The mobile phase consisted of Solvent A (100% methanol) and Solvent B (1.0% acetic acid in an ammonium acetate solution) at a ratio of 80:20. The flow rate was 0.8 mL/min, the column temperature was kept at 35 °C, and the injector volume was 20 μL. The DAD wavelength was set at 250 nm.

3.4. Evaluation of Radical Scavenging Capacity

The scavenging capacity of the extract towards the DPPH· assay was monitored according to the methods of Ramadan (2003) [41]. The DPPH· solution was freshly prepared in methanol at a concentration of 1.75 × 10−hemol/L. About 2.0 mL of the DPPH· solution was added to 2.0 mL of the appropriately diluted extracts and vibrated for 20 s at room temperature. The absorbance of the mixture was spectrophotometrically recorded at 517 nm after reacting for 1 h in the dark. A control, in which the sample was replaced by methanol, was measured in the same way. The antioxidant activity of the extracts was calculated from the dose–response curves of Trolox, which were determined by the above-mentioned methods. All of the results were expressed as the Trolox equivalent antioxidant capacity (mmol TEAC/g dry basis raw materials).
The scavenging capacity of the extract towards the ABTS·+ assay were monitored according to the methods of Pellegrini (2001) [42]. Briefly, 10 mg of ABTS was diluted in 2.6 mL of a potassium persulfate solution (2.45 mM) and kept in the dark at 4 °C for 12 h, and the mixture was then diluted to an absorbance of 0.70 ± 0.02 to be used as an ABTS·+ work solution. A 1 mL sample (appropriately diluted) and a 3 mL ABTS·+ work solution were mixed and reacted for 60 min at room temperature. The absorbance was spectrophotometrically measured at 734 nm. A control, in which the sample was replaced by methanol, was measured in the same way. The antioxidant activity of the extracts was calculated from the dose–response curves of Trolox, which were determined by the above-mentioned methods. All of the results were expressed as the Trolox equivalent antioxidant capacity (mmol TEAC/g dry basis raw materials).

3.5. HPLC-ABTS+ and Mass Spectrometric Analysis of Bioactive Compounds in the Extracts

The bioactive compounds in the licorice extract were analyzed with HPLC-DAD. Chromatographic analysis was run using a reverse-phase Zorbax XDB C-18 (150 × 4.6 mm, i.d., 5 μm), and the extract was separated using two solutions, A (methanol) and B (1.0% acetic acid in water, v/v). Gradient elution was performed as follows: 0 min: 10% A; 8 min: 10% A; 15 min: 20% A; 28 min: 25% A; 35 min: 30% A; 40 min: 36% A; 45 min: 37% A; 50 min: 30% A; 58 min: 38% A; 70 min: 58% A; 100 min: 82% A; 105 min: 100% A; 107 min: 100% A. The flow rate was 0.9 mL/min, the temperature was kept at 35 °C, and the injector volume was 10 μL. The DAD wavelengths were set at 250, 280, and 360 nm, respectively.
While the bioactive compounds in the extract were separated in the column, an ABTS·+ work solution was delivered via a pulse pump (Waters Corporation, Milford, MA, USA) with a flow rate of 0.7 mL/min. The ABTS·+ work solution was mixed with the fractions from the column and reacted in the peak coil. The mixture was then transported into the DAD detector to monitor the absorbance at 734 nm, and signals of the positive and negative peaks were recorded [38].
In order to identify the active compounds in the extract, HPLC-MS/MS fitted with an electrospray ionization (ESI) source was used. The HPLC separation program of different fractions from the extract was the same as described above; total ion current (TIC) chromatograms were acquired in both positive and negative modes. The electrospray capillary voltage was set to 3500 V. Nitrogen was used as the nebulizing gas at a pressure of 30 psi with a flow rate of 9.0 L/min and drying gas temperature was 325 °C. The scan range of the mass spectrometry was m/z 50–1500.

3.6. Determination of Advanced Glycated End Products

In order to check the formation of the advanced glycation end products in the SWE extracts, the fluorescence of the extracts was measured using a fluorospectrophotometer (F-7000; Hitachi, Japan). Advanced glycation end products were analyzed according to the method reported by Plaza et al. (2010) with a minor modification [34]. The excitation wavelength (λEx) was 360/40 nm, and the emission wavelengths were 460/40 and 528/20 nm, respectively.

3.7. Analysis of Non-Specific Indicators of Maillard Reaction

3.7.1. Determination of Total Reducing Sugar Content

The total reducing sugar content was analyzed according to 3,5-dinitrosalicylicacid (DNS) colorimetric method [43]. Briefly, 0.5 mL of diluted extract was mixed with 0.5 mL of DNS reagent and placed in boiling water for 5 min; after the mixture was cooled to room temperature in a water bath, distilled water was added to a given volume of 5.0 mL. The absorbance was measured at 540 nm. D-Glucose was used as a standard, and the result was expressed in g/100 g dry basis raw materials.

3.7.2. Determination of Total Free Amino Acid Content

The total free amino acid content was analyzed according to the OPA assay reported by Chen et al. (2009) [44] and the Chinese Standard GB/T8314-87. Briefly, 1.0 mL of diluted extract was mixed with 0.5 mL of phosphate buffer (pH8.0) and 0.5 mL of 0.2% ninhydrin solution (containing 0.8 mg/mL SnCl2). The mixture was then heated in boiling water for 15 min, cooled to room temperature, and adjusted to 25 mL with distilled water. Absorbance at 568 nm was measured with a spectrophotometer. The result was expressed in l-glutamic acid equivalent, g/100 g dry basis raw materials.

3.7.3. Measurement of Color

It is widely accepted that the development of a brown color can be effectively used to monitor the occurrence of non-enzymatic browning reactions, including the Maillard reaction [32]. In fact, this color is the easiest way to measure the existence of MRPs, as it is a visual estimation. The color of the extract was determined using a Chroma Meter DC-P3 optical sensor (Beijing Xingguang Color-Measurement Instrument Co., Ltd., Beijing. China). One of the most common methods employed for color measurement related to browning intensity was proposed by Delgado-Andrade (2010) [33]. The yellowing index (YI) is calculated as follows:
YI = 142.86b*/L*

3.7.4. Absorbance Measurement

Melanoidins were estimated by means of the browning intensity of the extracted samples. Browning intensity was measured using a microplate spectrophotometer. According to a previous report [23], absorbance at 280, 360, and 420 nm was measured to monitor products in the early, more advanced, and final stages of the Maillard reaction (Shimadzu UV-1800, Kyoto, Japan).

3.8. Analysis of Specific Indicators of Maillard Reaction

The compound 5-Hydroxymethyl furfural is an important intermediate compound produced in the Amadori rearrangement of a Maillard reaction. The Maillard reaction products, 5-hydroxymethyl furfural (5-HMF) and furfural, were analyzed using HPLC-DAD (Agilent, American) with a Zorbax XDB C-18 column (250 × 4.6 mm, i.d., 5 μm). The injected volume was 20 μL, and the temperature and wavelength were set to 35 °C and 280 nm. The 5-HMF content was eluted with a mobile phase of methanol/water (10:90, v/v) at a constant flow of 0.6 mL/min, and furfural was eluted with a mobile phase of acetonitrile/water (2:98, v/v) at a constant flow of 1 mL/min [38].

3.9. Kinetic Analysis of Subcritical Water Extraction for Glycyrrhizic Acid

The glycyrrhizic acid extraction process could be viewed as an irreversible, consecutive, unimolecular-type first-order mechanism, in which glycyrrhizic acid is firstly extracted from licorice by diffusion following a first-order-like mechanism [45], and glycyrrhizic acid in the extract is then subjected to a hydrolytic reaction following a first-order mechanism due to the extension of extraction time under a high temperature and pressure [46]. Accordingly, the glycyrrhizic acid extraction process can be simplified into the following reaction scheme:Molecules 27 06851 i002
where, L and GL represent the content of glycyrrhizic acid in licorice and extract, respectively; H represents the content of the hydrolytic product in the extract; and k1 and k2 represent the rate constants for the extraction and hydrolytic steps, respectively.
The following simplified reaction models with a minor modification were used for estimating the rate constant for glycyrrhizic acid extraction and hydrolysis [41]:
d m L d t = k 1 m L
d m G L d t = k 1 m L k 2 m G L
d m H d t = k 2 m G L
where mL (g) and mGL (g) are the glycyrrhizic acid content in licorice and extract at time t, and mH (g) is the content of hydrolytic product in the extract at time t; t (s) is the extraction time; k1 and k2 (s−1) is the rate constant for glycyrrhizic acid extraction and hydrolysis.
After a rearrangement, Equation (2) was shown as Equation (5):
ln ( m L m L 0 ) = k 1 t   or   m L = m L 0 e k 1 t
mL0 (g) is the initial content of glycyrrhizic acid in licorice at time t = 0, where k1 (s−1) is the rate constant for glycyrrhizic acid extraction.
To investigate the variation in glycyrrhizic acid content, substitute Equation (2) into Equation (3):
d m G L d t = k 1 m L 0 e k 1 t k 2 m G L
By integration of Equation (6), the final variation in glycyrrhizic acid content was expressed as:
m G L = m L 0 k 1 k 2 k 1 ( e k 1 t e k 2 t )
Equation (7) was also expressed as the yield (g/g):
y i e l d G L = k 1 k 2 k 1 ( e k 1 t e k 2 t )
The extraction and hydrolytic rates were accurately described by first-order kinetics, the relationship between rate constants and the temperature was estimated by the Arrhenius law with Ea and A (Equation (9)), A is the pre-exponential factor and Ea is the activation energy:
k = A exp ( E a R T )
and, after a rearrangement:
ln k = E a R T + ln A
Accordingly, these kinetic parameters were estimated by plotting ln k versus T.

3.10. Statistical Analysis

All of the experiments and measurements were carried out in triplicate. Analysis of variance (ANOVA) was carried out by SPSS 16.0 software, and significant differences in means (p < 0.05) were determined using Duncan’s multiple-range test. The fitting equation was estimated with Origin 8.0.

4. Conclusions

The maximum contents of total flavonoids, phenolics and glycyrrhizic acid was extracted from licorice with subcritical water at 140 °C for 20 min. With the rise in temperature, the Maillard reaction occurred; thus, the Maillard reaction contributed to the antioxidant activity of the extract. In addition, the hydrolysis of glycyrrhizic acid occurred during the extraction process. Glycyrrhizic acid was first extracted by diffusion following a first-order mechanism and was then hydrolyzed following a first-order mechanism during SWE. It was discovered in this study that subcritical water can be used as a medium for hydrolyzing glycyrrhizic acid into glycyrrhetinic acid 3-O-mono-β-D-glucuronide and glycyrrhetinic acid. Therefore, SWE is not only an environmentally friendly processing technology but also a highly efficient method for producing bioactive compounds.

Supplementary Materials

The following supporting information can be downloaded at: https://www.mdpi.com/article/10.3390/molecules27206851/s1, Figure S1: UPLC-MS profiles of bioactive compounds in the liquorice extract and their corresponding standards, the scanning spectra of bioactive compounds. Figure S2: The structures of flavonoids in liquorice; Table S1: Correlation analysis between TP, TF contents and antioxidant activity of liquorice extracts in different range of temperature; Table S2: The effect of extraction temperature on the content of total flavonoids, total phenolics and total antioxidant activity.

Author Contributions

Conceptualization, R.F. and Y.G.; methodology, R.F.; investigation, R.F.; writing—original draft preparation, R.F.; writing—review and editing, R.F. and Y.G. All authors have read and agreed to the published version of the manuscript.

Funding

This research received no external funding.

Institutional Review Board Statement

The study did not require ethical approval.

Informed Consent Statement

Not applicable for studies not involving humans or animals.

Data Availability Statement

The data are not publicly available due to graduation thesis based on this relevant research results is still in the confidentiality period.

Conflicts of Interest

The authors declare no conflict of interest.

References

  1. Baek, S.Y.; Lee, E.H.; Oh, T.W.; Do, H.J.; Kim, K.-Y.; Park, K.-I.; Kim, Y.W. Network Pharmacology-Based Approaches of Rheum undulatum Linne and Glycyrriza uralensis Fischer Imply Their Regulation of Liver Failure with Hepatic Encephalopathy in Mice. Biomolecules 2020, 10, 437. [Google Scholar] [CrossRef] [Green Version]
  2. Zhang, Q.; Ye, M. Chemical analysis of the Chinese herbal medicine Gan-Cao (licorice). J. Chromatogr. A 2009, 1216, 1954–1969. [Google Scholar] [CrossRef]
  3. Sánchez-Camargo, A.D.P.; Pleite, N.; Herrero, M.; Cifuentes, A.; Ibáñez, E.; Gilbert-Lopez, B. New approaches for the selective extraction of bioactive compounds employing bio-based solvents and pressurized green processes. J. Supercrit. Fluids 2017, 128, 112–120. [Google Scholar] [CrossRef]
  4. Zhang, Y.; Zhang, Y.; Taha, A.A.; Ying, Y.; Li, X.; Chen, X.; Ma, C. Subcritical water extraction of bioactive components from ginseng roots (Panax ginseng CA Mey). Ind. Crop. Prod. 2018, 117, 118–127. [Google Scholar] [CrossRef]
  5. Marcet, I.; Álvarez, C.; Paredes, B.; Díaz, M. The use of sub-critical water hydrolysis for the recovery of peptides and free amino acids from food processing wastes. Review of sources and main parameters. Waste Manag. 2016, 49, 364–371. [Google Scholar] [CrossRef]
  6. Mukhopadhyay, M.; Panja, P. A novel process for extraction of natural sweetener from licorice (Glycyrrhiza glabra) roots. Sep. Purif. Technol. 2008, 63, 539–545. [Google Scholar] [CrossRef]
  7. Baek, J.Y.; Lee, J.M.; Lee, S.C. Extraction of nutraceutical compounds from licorice roots with subcritical water. Sep. Purif. Technol. 2008, 63, 661–664. [Google Scholar] [CrossRef]
  8. Song, B.; Buendia-Kandia, F.; Yu, Y.; Dufour, A.; Wu, H. Importance of lignin removal in enhancing biomass hydrolysis in hot-compressed water. Bioresour. Technol. 2019, 288, 121522. [Google Scholar] [CrossRef] [PubMed]
  9. Pavlovič, I.; Knez, Z.; Škerget, M. Hydrothermal Reactions of Agricultural and Food Processing Wastes in Sub- and Supercritical Water: A Review of Fundamentals, Mechanisms, and State of Research. J. Agric. Food Chem. 2013, 61, 8003–8025. [Google Scholar] [CrossRef] [PubMed]
  10. Fan, R.; Xiang, J.; Li, N.; Jiang, X.; Gao, Y. Impact of extraction parameters on chemical composition and antioxidant activity of bioactive compounds from Chinese licorice (Glycyrrhiza uralensis Fisch.) by subcritical water. Sep. Sci. Technol. 2016, 51, 609–621. [Google Scholar] [CrossRef]
  11. He, L.; Zhang, X.; Xu, H.; Xu, C.; Yuan, F.; Knez, Ž.; Novak, Z.; Gao, Y. Subcritical water extraction of phenolic compounds from pomegranate (Punica granatum L.) seed residues and investigation in to their antioxidant activities with HPLC-ABTS·+ assay. Food Bioprod. Process. 2012, 2, 215–223. [Google Scholar] [CrossRef]
  12. Ho, C.H.; Cacace, J.E.; Mazza, G. Mass transfer during pressurized low polarity water extraction of lignans from flaxseed meal. J. Food Eng. 2008, 89, 64–71. [Google Scholar] [CrossRef]
  13. Carr, A.G.; Mammucari, R.; Foster, N. A review of subcritical water as a solvent and its utilisation for the processing of hydrophobic organic compounds. Chem. Eng. J. 2011, 172, 1–17. [Google Scholar] [CrossRef]
  14. Ko, M.-J.; Cheigh, C.-I.; Chung, M.-S. Relationship analysis between flavonoids structure and subcritical water extraction (SWE). Food Chem. 2014, 143, 147–155. [Google Scholar] [CrossRef] [PubMed]
  15. Kumar, M.Y.; Dutta, R.; Prasad, D.; Misra, K. Subcritical water extraction of antioxidant compounds from Seabuckthorn (Hippophae rhamnoides) leaves for the comparative evaluation of antioxidant activity. Food Chem. 2011, 127, 1309–1316. [Google Scholar] [CrossRef] [PubMed]
  16. Fukai, T.; Wang, Q.H.; Kitagawa, T.; Kusano, K.; Nomura, T.; Iitaka, Y. Phenolic constituents of Glycyrrhiza. 2. Structure of 6 isoprenoid-substituted flavonoids, gancaoin-F, gancaonin-G, gancaonin-H, gancaonin-I, glycyrol, and isoglycyrol from Xibei licorice (Glycyrrhiza sp.). Heterocycles 1989, 29, 1761–1772. [Google Scholar]
  17. Fukai, T.; Sheng, C.-B.; Horikoshi, T.; Nomura, T. Isoprenylated flavonoids from underground parts of Glycyrrhiza glabra. Phytochemistry 1996, 43, 1119–1124. [Google Scholar] [CrossRef]
  18. Lin, Y.; Kuang, Y.; Li, K.; Wang, S.; Ji, S.; Chen, K.; Song, W.; Qiao, X.; Ye, M. Nrf2 activators from Glycyrrhiza inflata and their hepatoprotective activities against CCl4-induced liver injury in mice. Bioorganic Med. Chem. 2017, 25, 5522–5530. [Google Scholar] [CrossRef] [PubMed]
  19. Ge, X.Z.; Lin, Q.; Gu, C.X.; Zhu, Y.; Jiang, N.; Zhao, B.; Wang, M.; Tian, P. Successive Extraction of Glycyrrhizic Acid and Liquiritin from Licorice with Cellulase and Pectinase. Asian J. Chem. 2012, 24, 4487–4493. [Google Scholar]
  20. Ong, E.S. Chemical assay of glycyrrhizin in medicinal plants by pressurized liquid extraction (PLE) with capillary zone electrophoresis (CZE). J. Sep. Sci. 2002, 25, 825–831. [Google Scholar] [CrossRef]
  21. Fan, R.; Li, N.; Xu, H.; Xiang, J.; Wang, L.; Gao, Y. The mechanism of hydrothermal hydrolysis for glycyrrhizic acid into glycyrrhetinic acid and glycyrrhetinic acid 3- O -mono-β- d -glucuronide in subcritical water. Food Chem. 2016, 190, 912–921. [Google Scholar] [CrossRef] [PubMed]
  22. Hasan, M.K.; Ara, I.; Mondal, M.; Kabir, Y. Phytochemistry, pharmacological activity, and potential health benefits of Glycyrrhiza glabra. Heliyon 2021, 7, e07240. [Google Scholar] [CrossRef] [PubMed]
  23. Echavarría, A.P.; Pagán, J.; Ibarz, A. Melanoidins Formed by Maillard Reaction in Food and Their Biological Activity. Food Eng. Rev. 2012, 4, 203–223. [Google Scholar] [CrossRef]
  24. Liu, Y.; Yang, J.; Cai, Z. Chemical investigation on Sijunzi decoction and its two major herbsPanax ginseng and Glycyrrhizauralensis by LC/MS/MS. J. Pharmaceut. Biomed. 2006, 41, 1642–1647. [Google Scholar] [CrossRef]
  25. Wang, J.; Wang, D.; Yu, J.; Liu, C.; Li, L.; Zhang, Y. Isolation of Liquiritigenin-4′-Apiosyl-Glucoside and Liquiritin from the Root of Glycyrrhiza uralensis by High-Performance Centrifugal Partition Chromatography. J. Chromatogr. Sci. 2013, 52, 310–314. [Google Scholar] [CrossRef] [Green Version]
  26. Shaw, L.-H.; Lin, L.-C.; Tsai, T.-H. HPLC–MS/MS Analysis of a Traditional Chinese Medical Formulation of Bu-Yang-Huan-Wu-Tang and Its Pharmacokinetics after Oral Administration to Rats. PLoS ONE 2012, 7, e43848. [Google Scholar] [CrossRef]
  27. Huang, H.; Yu, H.; Zhang, J.; Kang, L.; Feng, B.; Song, X.; Ma, B. Biotransformation of glycyrrhizin by Aspergillus niger. Biocatal. Biotransformation 2009, 27, 90–95. [Google Scholar] [CrossRef]
  28. Zhou, S.; Cao, J.; Qiu, F.; Kong, W.; Yang, S.; Yang, M. Simultaneous Determination of Five Bioactive Components in Radix Glycyrrhizae by Pressurised Liquid Extraction Combined with UPLC-PDA and UPLC/ESI-QTOF-MS Confirmation. Phytochem. Anal. 2013, 24, 527–533. [Google Scholar] [CrossRef]
  29. Herrero, M.; Castro-Puyana, M.; Rocamora-Reverte, L.; Ferragut, J.; Cifuentes, A.; Ibáñez, E. Formation and relevance of 5-hydroxymethylfurfural in bioactive subcritical water extracts from olive leaves. Food Res. Int. 2012, 47, 31–37. [Google Scholar] [CrossRef] [Green Version]
  30. Lvarez-Vias, M.; Rodríguez-Seoane, P.; Flórez-Fernández, N.; Torres, M.D.; Díaz-Reinoso, B.; Moure, A.; Domínguez, H. Subcritical Water for the Extraction and Hydrolysis of Protein and Other Fractions in Biorefineries from Agro-food Wastes and Algae: A Review. Food Bioprocess Technol. 2021, 14, 373–387. [Google Scholar] [CrossRef]
  31. Farroni, A.; Buera Mdel, P. Colour and surface fluorescence development and their relationship with Maillard reaction markers as influenced by structural changes during cornflakes production. Food Chem. 2012, 135, 1685–1691. [Google Scholar] [CrossRef] [PubMed]
  32. Delgado-Andrade, C.; Seiquer, I.; Haro, A.; Castellano, R.; Navarro, M.P. Development of the Maillard reaction in foods cooked by different techniques. Intake of Maillard-derived compounds. Food Chem. 2010, 122, 145–153. [Google Scholar] [CrossRef]
  33. Kim, J.-S.; Lee, Y.-S. Study of Maillard reaction products derived from aqueous model systems with different peptide chain lengths. Food Chem. 2009, 116, 846–853. [Google Scholar] [CrossRef]
  34. Plaza, M.; Amigo-Benavent, M.; del Castillo, M.D.; Ibáñez, E.; Herrero, M. Facts about the formation of new antioxidants in natural samples after subcritical water extraction. Food Res. Int. 2010, 43, 2341–2348. [Google Scholar] [CrossRef] [Green Version]
  35. Aalaei, K.; Rayner, M.; Sjöholm, I. Chemical methods and techniques to monitor early Maillard reaction in milk products; A review. Crit. Rev. Food Sci. Nutr. 2018, 59, 1829–1839. [Google Scholar] [CrossRef] [Green Version]
  36. Morales, F.; van Boekel, M. A study on advanced Maillard reaction in heated casein/sugar solutions: Fluorescence accumulation. Int. Dairy J. 1997, 7, 675–683. [Google Scholar] [CrossRef] [Green Version]
  37. Abdelmoez, W.; Ashour, E.; Naguib, S.M.; Hilal, A.; Al Mahdy, D.A.; Mahrous, E.A.; Abdel-Sattar, E. Kinetic and Thermodynamics studies for Castor Oil Extraction Using Subcritical Water Technology. J. Oleo Sci. 2016, 65, 477–485. [Google Scholar] [CrossRef] [Green Version]
  38. Fan, R.; Li, N.; Jiang, X.; Yuan, F.; Gao, Y. HPLC–DAD–MS/MS identification and HPLC–ABTS·+ on-line antioxidant activity evaluation of bioactive compounds in liquorice (Glycyrrhiza uralensis Fisch.) extract. Eur. Food Res. Technol. 2015, 240, 1035–1048. [Google Scholar] [CrossRef]
  39. Singleton, V.L.; Orthofer, R.; Lamuela-Raventós, R.M.; Lester, P. Analysis of total phenols and other oxidation substrates and antioxidants by means of Folin-Ciocalteu reagent. In Methods in Enzymology; Elsevier: Amsterdam, The Netherlands, 1999; Volume 299, pp. 152–178. [Google Scholar]
  40. Siddhuraju, P.; Becker, K. Antioxidant properties of various solvent extracts of total phenolic constituents from three different agroclimatic origins of drumstick tree (Moringa oleifera Lam.) leaves. J. Agric. Food Chem. 2003, 51, 2144–2155. [Google Scholar] [CrossRef]
  41. Ramadan, M.F.; Kroh, L.W.; Mörsel, J.T. Radical scavenging activity of black Cumin (Nigella sativa L), Coriander (Coriandrum sativum L), and Niger (Guizotia abyssinica Cass.) crude seed oils and oilfractions. J. Agric. Food Chem. 2003, 51, 6961–6969. [Google Scholar] [CrossRef]
  42. Pellegrini, N.; Visioli, F.; Buratti, S.; Brighenti, F. Direct Analysis of Total Antioxidant Activity of Olive Oil and Studies on the Influence of Heating. J. Agric. Food Chem. 2001, 49, 2532–2538. [Google Scholar] [CrossRef] [PubMed]
  43. Miller, G.L. Use of Dinitrosalicylic Acid Reagent for Determination of Reducing Sugar. Anal. Chem. 1959, 31, 426–428. [Google Scholar] [CrossRef]
  44. Chen, L.; Chen, Q.; Zhang, Z.; Wan, X. A novel colorimetric determination of free amino acids content in tea infusions with 2,4-dinitrofluorobenzene. J. Food Compos. Anal. 2009, 22, 137–141. [Google Scholar] [CrossRef]
  45. Fattah, R.A.; Mostafa, N.A.; Mahmoud, M.S.; Abdelmoez, W. Recovery of oil and free fatty acids from spent bleaching earth using sub-critical water technology supported with kinetic and thermodynamic study. Adv. Biosci. Biotechnol. 2014, 5, 261–272. [Google Scholar] [CrossRef] [Green Version]
  46. Reza, M.T.; Yan, W.; Uddin, M.H.; Lynam, J.G.; Hoekman, S.K.; Coronella, C.J.; Vásquez, V.R. Reaction kinetics of hydrothermal carbonization of loblolly pine. Bioresour. Technol. 2013, 139, 161–169. [Google Scholar] [CrossRef]
Figure 1. The study design of the thermal reactions in subcritical water extraction of bioactive compounds from licorice.
Molecules 27 06851 g001
Figure 2. The effect of extraction temperature on the content of total flavonoids, total phenolics (a) and glycyrrhizic acid (b) and the effect of extraction temperature on total antioxidant activity (c). The results are expressed as the mean ± standard deviation (n = 3); different letters indicate significant differences (p < 0.05) and the same letters indicate insignificant differences.
Molecules 27 06851 g002aMolecules 27 06851 g002b
Figure 3. HPLC-ABTS·+ chromatographic profiles and HPLC-MS/MS information regarding the extracts at different temperatures. (ad) was the chromatographic profiles at 100, 140, 200 and 280 °C; (e) the HPLC-MS/MS information [24,25,26,27,28,29].
Molecules 27 06851 g003aMolecules 27 06851 g003bMolecules 27 06851 g003c
Figure 4. The analysis of indicators of Maillard reaction in the extracts at different temperatures, (a) total reducing sugars and total amino acids contents; (b) 5-HMF and furfural contents. The results are expressed as the mean ± standard deviation (n = 3); different letters indicate significant differences (p < 0.05), and the same letters indicate insignificant differences.
Molecules 27 06851 g004
Figure 5. Thermal hydrolysis of glycyrrhizic acid under different temperatures and times, (a) the content of glycyrrhizic acid; (b) the content of GAMG; (c) the content of glycyrrhetinic acid. GAMG: glycyrrhetinic acid 3-O-mono-β-D-glucuronide.The results are expressed as the mean ± standard deviation (n = 3); different letters indicate significant differences (p < 0.05) and the same letters indicate insignificant differences.
Molecules 27 06851 g005aMolecules 27 06851 g005b
Figure 6. The kinetic parameters at different temperatures, (ac) the fitting curve of the extraction and hydrolytic rate constant at 140 °C, 160 °C, and 180 °C, respectively; (d) the Arrhenius plot.
Molecules 27 06851 g006
Figure 7. The schematic diagram of subcritical reaction system.
Molecules 27 06851 g007
Table 1. The fluorescence, color, and absorbance of licorice extracts obtained at different temperatures.
Temperature (°C)FluorescenceColorAbsorbance
λEx 360 nm,
λEm 460 nm
λEx 360 nm,
λEm 528 nm
L*a*b*Yellowing IndexA280nmA 360nmA 420nm
8022.021 ± 1.410 a2.512 ± 0.722 a21.992 ± 0.290 d1.981 ± 0.283 a10.345 ± 1.202 a67.301 ± 8.721 a0.126 ± 0.010 a0.032 ± 0.009 a0.003 ± 0.001 a
10022.200 ± 0.720 a2.521 ± 0.720 a20.991 ± 1.401 c3.502 ± 1.412 ab11.333 ± 0.472 ab77.182 ± 1.972 a0.132 ± 0.009 a0.039 ± 0.005 a0.004 ± 0.001 a
12020.801 ± 0.710 a2.503 ± 0.711 a17.923 ± 1.942 c3.740 ± 0.713 abc11.511 ± 0.012 abc92.292 ± 9.871 b0.466 ± 0.001 c0.154 ± 0.009 e0.019 ± 0.002 b
14051.201 ± 1.411 b12.512 ± 0.722 b13.362 ± 0.511 b5.090 ± 1.410 bcd11.201 ± 0.711 ab119.702 ± 3.002 c0.901 ± 0.008 f0.348 ± 0.003 h0.068 ± 0.002 c
16079.402 ± 1.401 c26.512 ± 0.714 c13.411 ± 0.582 b5.751 ± 0.851 cd11.923 ± 0.410 abcd127.302 ± 9.723 c1.309 ± 0.002 h0.463 ± 0.003 j0.145 ± 0.002 d
180115.300 ± 1.412 d41.221 ± 1.421 d11.770 ± 1.073 ab6.071 ± 1.362 d11.682 ± 1.122 abcd141.801 ± 0.711 d1.766 ± 0.005 m0.569 ± 0.001 k0.178 ± 0.001 e
200244.511 ± 2.111 e90.011 ± 1.412 g11.593 ± 0.423 ab6.522 ± 0.422 d12.061 ± 0.272 bcd148.811 ± 8.762 de1.704 ± 0.013 l0.571 ± 0.004 k0.201 ± 0.001 f
220346.012 ± 1.422 h120.012 ± 1.423 h10.692 ± 1.402 a6.331 ± 1.703 d11.881 ± 1.072 abcd159.192 ± 6.491 ef1.611 ± 0.008 k0.576 ± 0.009 k0.221 ± 0.009 g
240532.512 ± 3.513 j164.311 ± 2.82 j10.942 ± 0.733 a6.332 ± 0.621 d11.662 ± 0.801 abcd152.263 ± 0.110 def1.324 ± 0.002 i0.432 ± 0.011 i0.224 ± 0.011 g
260581.812 ± 1.423 k180.211 ± 1.401 k10.941 ± 0.361 a6.542 ± 2.020 d12.472 ± 0.662 bcd162.782 ± 3.211 f1.343 ± 0.001 j0.2875 ± 0.007 g0.230 ± 0.009 g
280684.502 ± 3.512 l202.012 ± 2.812 l12.050 ± 1.202 ab7.071 ± 1.232 d13.231 ± 0.181 d157.522 ± 13.532 ef1.101 ± 0.001 g0.233 ± 0.003 f0.222 ± 0.009 g
300484.311 ± 5.621 i134.212 ± 2.800 i11.223 ± 0.132 a7.282 ± 1.531 d12.682 ± 0.681 bcd161.701 ± 6.822 ef0.543 ± 0.003 e0.137 ± 0.004 d0.169 ± 0.015 e
320281.221 ± 1.415 g75.524 ± 0.712 e11.041 ± 0.131 a7.011 ± 1.423 d12.412 ± 1.833 bcd160.312 ± 4.712 ef0.399 ± 0.001 b0.099 ± 0.003 b0.138 ± 0.010 d
340264.502 ± 0.732 f70.511 ± 0.712 f11.692 ± 0.742 ab7.132 ± 0.183 d13.112 ± 0.331 cd160.412 ± 6.110 ef0.483 ± 0.005 d0.112 ± 0.009 c0.062 ± 0.002 c
The results are expressed as the mean ± standard deviation (n = 3); the different letters indicate that the difference was significant (p < 0.05) and the same letters indicate insignificant differences.
Publisher’s Note: MDPI stays neutral with regard to jurisdictional claims in published maps and institutional affiliations.

