Article

Life Cycle Analysis and Cost–Benefit Assessment of the Waste Collection System in Anyama, Cote d’Ivoire

Department of Policy and Planning Sciences, University of Tsukuba, Tsukuba 305-8573, Japan
*
Author to whom correspondence should be addressed.
Sustainability 2022, 14(20), 13062; https://doi.org/10.3390/su142013062
Submission received: 12 September 2022 / Revised: 27 September 2022 / Accepted: 28 September 2022 / Published: 12 October 2022

Abstract

:
Municipal solid waste collection system in Anyama is in a critical state and is compounded by high population density. Household residents need about 30 minutes’ walk to the designated waste collection point. Waste is dumped openly along the roadside, which serves as breeding grounds for chronic diseases, malaria, diarrhea, and acute respiratory disease. Could the perception and attitude of residents change if the distance between their homes and the collection points is reduced? This study evaluated the current waste management system in Anyama. Life Cycle Assessment (LCA) and cost–benefit analysis were conducted on four different waste collection scenarios, to propose an alternative, feasible, and integrated solid waste management system. Results showed that the kerbside recycling scenario has the highest benefit (5.8 billion CFA) compared to its cost (1.9 billion CFA), proving to be more economically sustainable. In environmental terms, the kerbside recycling scenario emitted lower emissions such as global warming potential (GWP 4967 tons) and carbon dioxide (CO2eq 550 tons). The kerbside recycling obviously had the highest potential for recycling and thus is more environmentally sustainable. Therefore, the kerbside scenario is the most suitable and recommended policy that should be adopted and implemented in Anyama. We recommend the introduction of waste banks specifically for recyclable waste and the setting up of more kerbside collection points in order to reduce the distance from households to collection points, thus improving residents’ attitude towards effective waste disposal.

1. Introduction

According to Bindra et al. [1], waste can be classified as municipal solid waste (MSW) [2], hazardous solid waste [3], biomedical waste [4], construction and demolition waste [5], and electronic waste [6]. Municipal solid waste refers to waste generated and collected by the municipality. Municipal solid waste can be categorized into six groups: food residue, wood waste, paper, textile, plastic, and rubber. Municipal solid waste collection has remained a significant environmental problem globally. While developed countries such as Japan, and the European Union, have made significant progress in improving their inefficient waste collection and management system, developing economies such as countries in Africa have not made tangible improvements in terms of solid waste management [7,8,9,10]. Municipal solid waste generation in Africa has instead increased significantly over the years. This increase poses health risks to disease outbreaks such as cholera, malaria, typhoid, etc. Cote d’Ivoire has been tackling waste management problems concerning those disease outbreaks [11,12,13].
Cote d’Ivoire’s municipal solid waste generation in 2015 was about 1,490,000 tons. In 2018, it rose to 1,650,000 tons, 9.4% [14,15]. Population growth has been linked to municipal solid waste generation [16]. In Abidjan, household waste and other municipal solid waste are commonly disposed of at public dumping sites [15]. This practice is a common practice in all areas in Cote d’Ivoire. Abidjan’s principal waste collection agency, the Agence National de Salubrite Urbaine (ANASUR), collects the waste from the dumping sites and transports it directly to the landfills [15]. The waste collection from the dumping is done weekly. However, in most cases, waste collection often encounters setbacks, leading to littering, air pollution, and the breeding of harmful bacteria. Consequently, this becomes a breeding ground for malaria-causing mosquitoes (Anopheles mosquitos), cholera, diarrhea, etc., and therefore posing significant health risks [11,17,18,19].
The existing method of waste collection (sanitary landfill) has some peculiar problems when viewing it from two perspectives. From the viewpoint of the municipality, the topography is too hilly and costly to build access roads, consequently delaying waste collection and transportation to the landfills. Furthermore, there is the problem of inadequate funding for purchasing new waste collection trucks and other essential facilities. From the perspective of the households, the distance between the official waste collection points and the households is significant, consequently diminishing the willingness of the residents to effectively disposed their waste. This results in residents littering their waste in the immediate surroundings, leading to waste decay and offensive odor.
Landfilled waste, especially demolition waste C&D, have recently become a disastrous phenomenon in urban areas and cities due to its high adverse impacts on our environment, economy and society [20]. Recycling, as a remedial action can be taken into consideration in order to mitigate solid waste impacts [20]. Among the important issues raised in the regard of waste collection, the lack of awareness of the exact amount of generated waste creates difficulties in the processes of collection, transportation, and disposal [21].
Due to the outbreak of the ongoing global coronavirus pandemic (COVID-19) at the beginning of 2020 and the consequent increase in medical waste, the need for an efficient and specific waste collection system to manage waste is strongly recommended [22].
Although research has been conducted to improve the current waste collection system, no Life Cycle Assessment (LCA) approach was used in their methodology [14,18,23,24,25,26,27,28]. Furthermore, few studies have been done to assess the real influence of the distance and terrain of the city of Anyama on garbage collection.
Life Cycle Assessment (LCA) can be defined as the methodological study of the likely environmental impacts of products throughout their total life cycles. The LCA is a system analysis tool used for assessing the overall environmental impacts of solid waste management (SWM) options within a given system boundary. It is progressively being applied, especially in decision-making and strategic planning. LCA applications are used mostly in developed countries (mainly in Europe), improving use in underdeveloped and developing countries. It has not been widely used for waste prevention activities, with its use restricted to solid waste types, household waste, and construction waste. The LCA depends on on-site conditions. The on-site conditions cover two key aspects: spatial variability and local environmental uniqueness. The LCA process can be divided into four main goals: (i) To generate understanding and describe any waste process; (ii) To collect data; (iii) To analyze the data and assess the impact; (iv) To generate and interpret the results. Despite efforts of the government to improve the waste collection system, little to no study has been conducted to explore the feasibility in Cote d’Ivoire, including Abidjan city. This critical aspect requires assessment to improve Anyama waste collection comprehensively. Therefore, the objectives of this study are to evaluate the current waste management system of Anyama and propose a feasible alternative and integrated solid waste collection system based on the life cycle approach. Could the perception and attitude of households change if the distance points to the collection points are reduced? How can the household be influenced to timely dispose of their waste? This study attempts to address these questions using the geographical information system (GIS) in conjunction with a field survey.

2. Materials and Methods
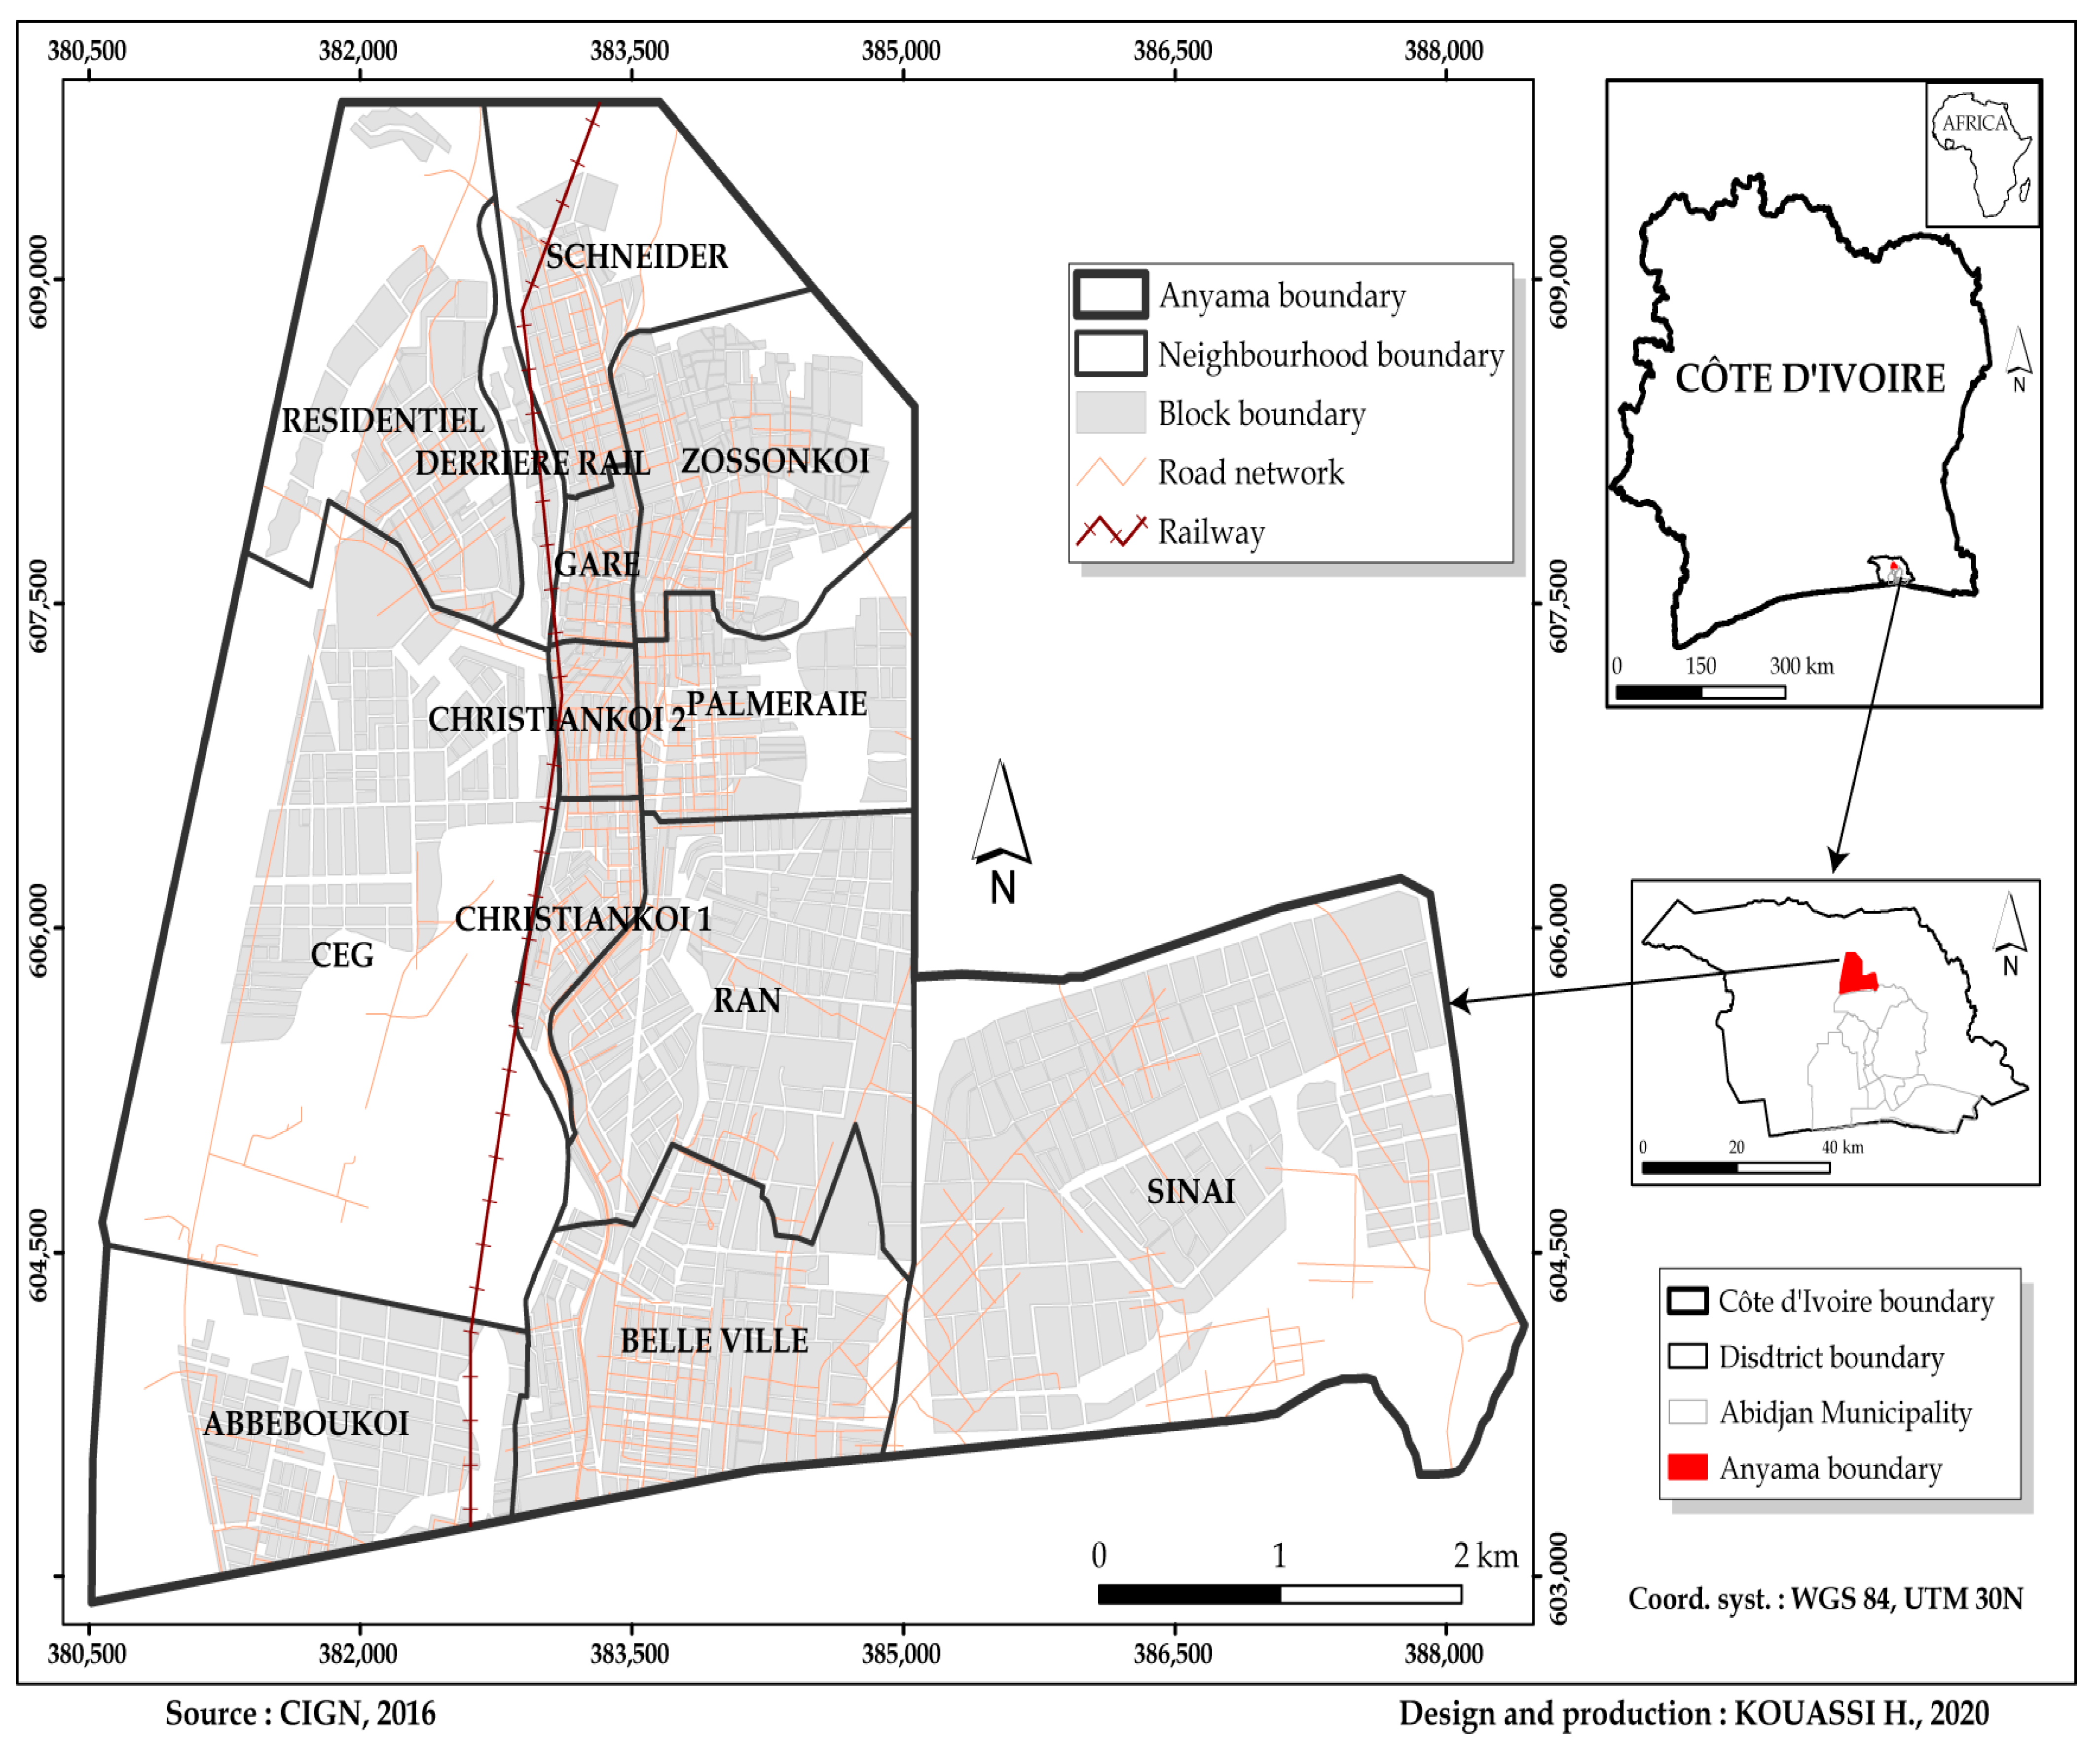
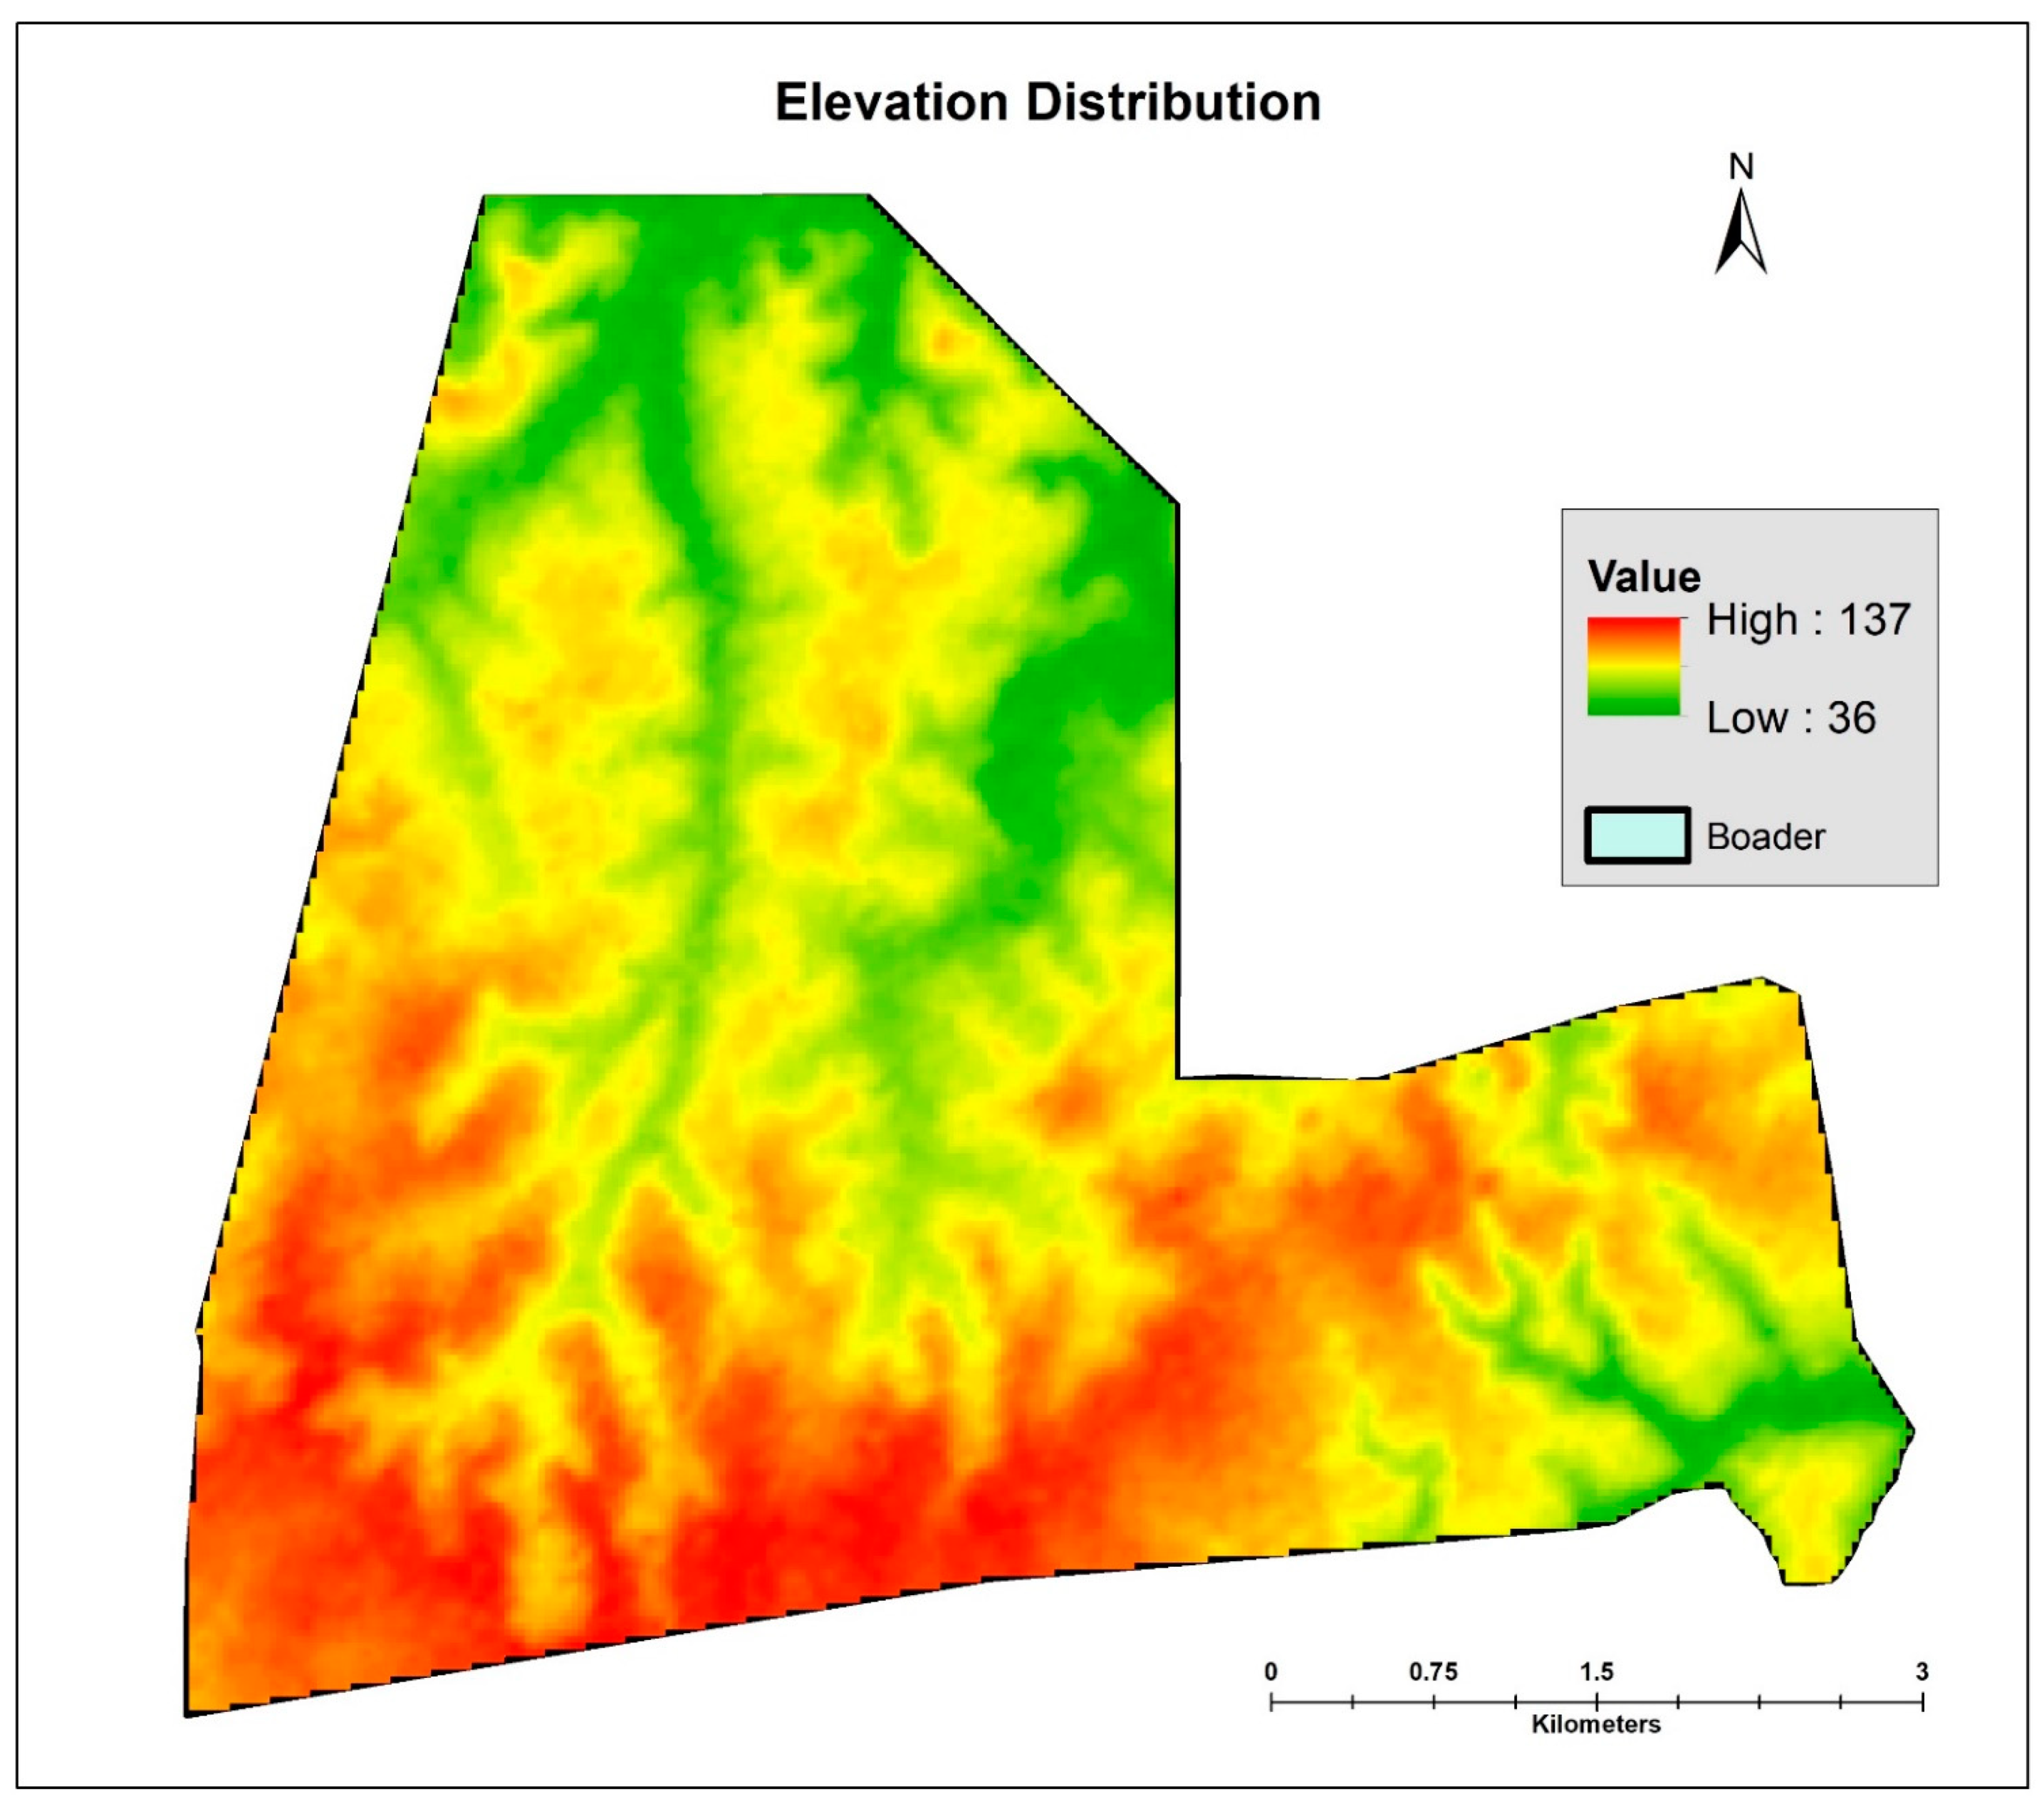
2.1. Study Area

Anyama is a southeastern city located 18.37 km from Abidjan. Abidjan is the eco-nomic capital of Côte d’Ivoire, and it represented 60% of the country’s Gross Domestic Product (GDP) in 2014 [19,28]. This GDP refers to the “Abidjan agglomeration,” including Anyama. Due to rapid urbanization, formerly defined boundaries have been altered [29]. Anyama, as one of these adjacent settlements, is currently considered a component of the capital city. This integration was possible due to its social and economic links to the rest of the agglomeration [30]. Anyama has a population of 146,000 inhabitants based on the last general census in 2014 [28]. The City of Anyama has experienced rapid development, fostered by its good accessibility (railway and asphalt road), proximity to the seaport, and Abidjan’s city [31]. The growth of Abidjan offered new opportunities and reinforced the situation of Anyama with the economic capital. Figure 1 shows the location map of the study area as an official part of the city of Abidjan.
Anyama has a livable surface (23.2 km2) with a rugged topography (rugged relief composed of deep valleys clogged with hummocks). Figure 2 shows a descriptive map of ANYAMA’S topography.

2.2. Data Collection

Primary data were collected by conducting a household survey in Anyama from August to November 2020. The survey was done through structured and semi-structured questionnaires. Each household was interviewed on their socioeconomic conditions related to waste management services. The Global Positioning Systems (GPS) devices were used to precisely map out the household coordinate positions. In the different neighborhoods, the assessment was left to the interviewer to evaluate each household’s standard of living based on the housing’s physical condition and appearance. In order to avoid interviewing nearby residents with similar responses, a block of at least five doors had to be marked for the households surveyed. Using the GPS, we pointed out the position of the interviewed household, the official waste collection points, and all open dumping sites found in Anyama.

2.3. Life Cycle Analysis

One of the most critical aspects faced in solid waste management is the cost of handling and treatment of the waste. Innovative methodologies have been developed using computer-based models. These methods have reduced handling costs significantly [32]. They have improved waste recovery and cost-saving. The main phases of the life cycle analysis are (i) goal and scope, (ii) inventory analysis, (iii) impact assessment, and (iv) interpretation. They focused on evaluating the best solutions for waste management trajectories by including essential information about sectoral waste contribution. These models also extend to a common platform where different attributes like the location of landfills, transportation avenues, and collection processes are collectively processed to obtain a holistic view of sustainable waste. Therefore, the LCA methodology in our analysis was used to evaluate the cost–benefit results of different waste collection scenarios and to propose a feasible secondary alternative and integrated solid waste management system in Anyama. The collection rates were applied considering a combination of the physical compositions of waste, previous studies in Cote d’Ivoire (Abidjan), Cote d’Ivoire Government policy, and assumptions based on the field data in Anyama. Subsequently, the different collection methods in the four scenarios below were assessed through the life cycle inventory software:
  • Scenario 1: Open dumping site from 1965–2016 (The previous landfill)
  • Scenario 2: Sanitary landfill (The existing waste management system)
  • Scenario 3: The Material Bank Collection Systems Recycling (MBCS)
  • Scenario 4: The Kerbside Recycling System.

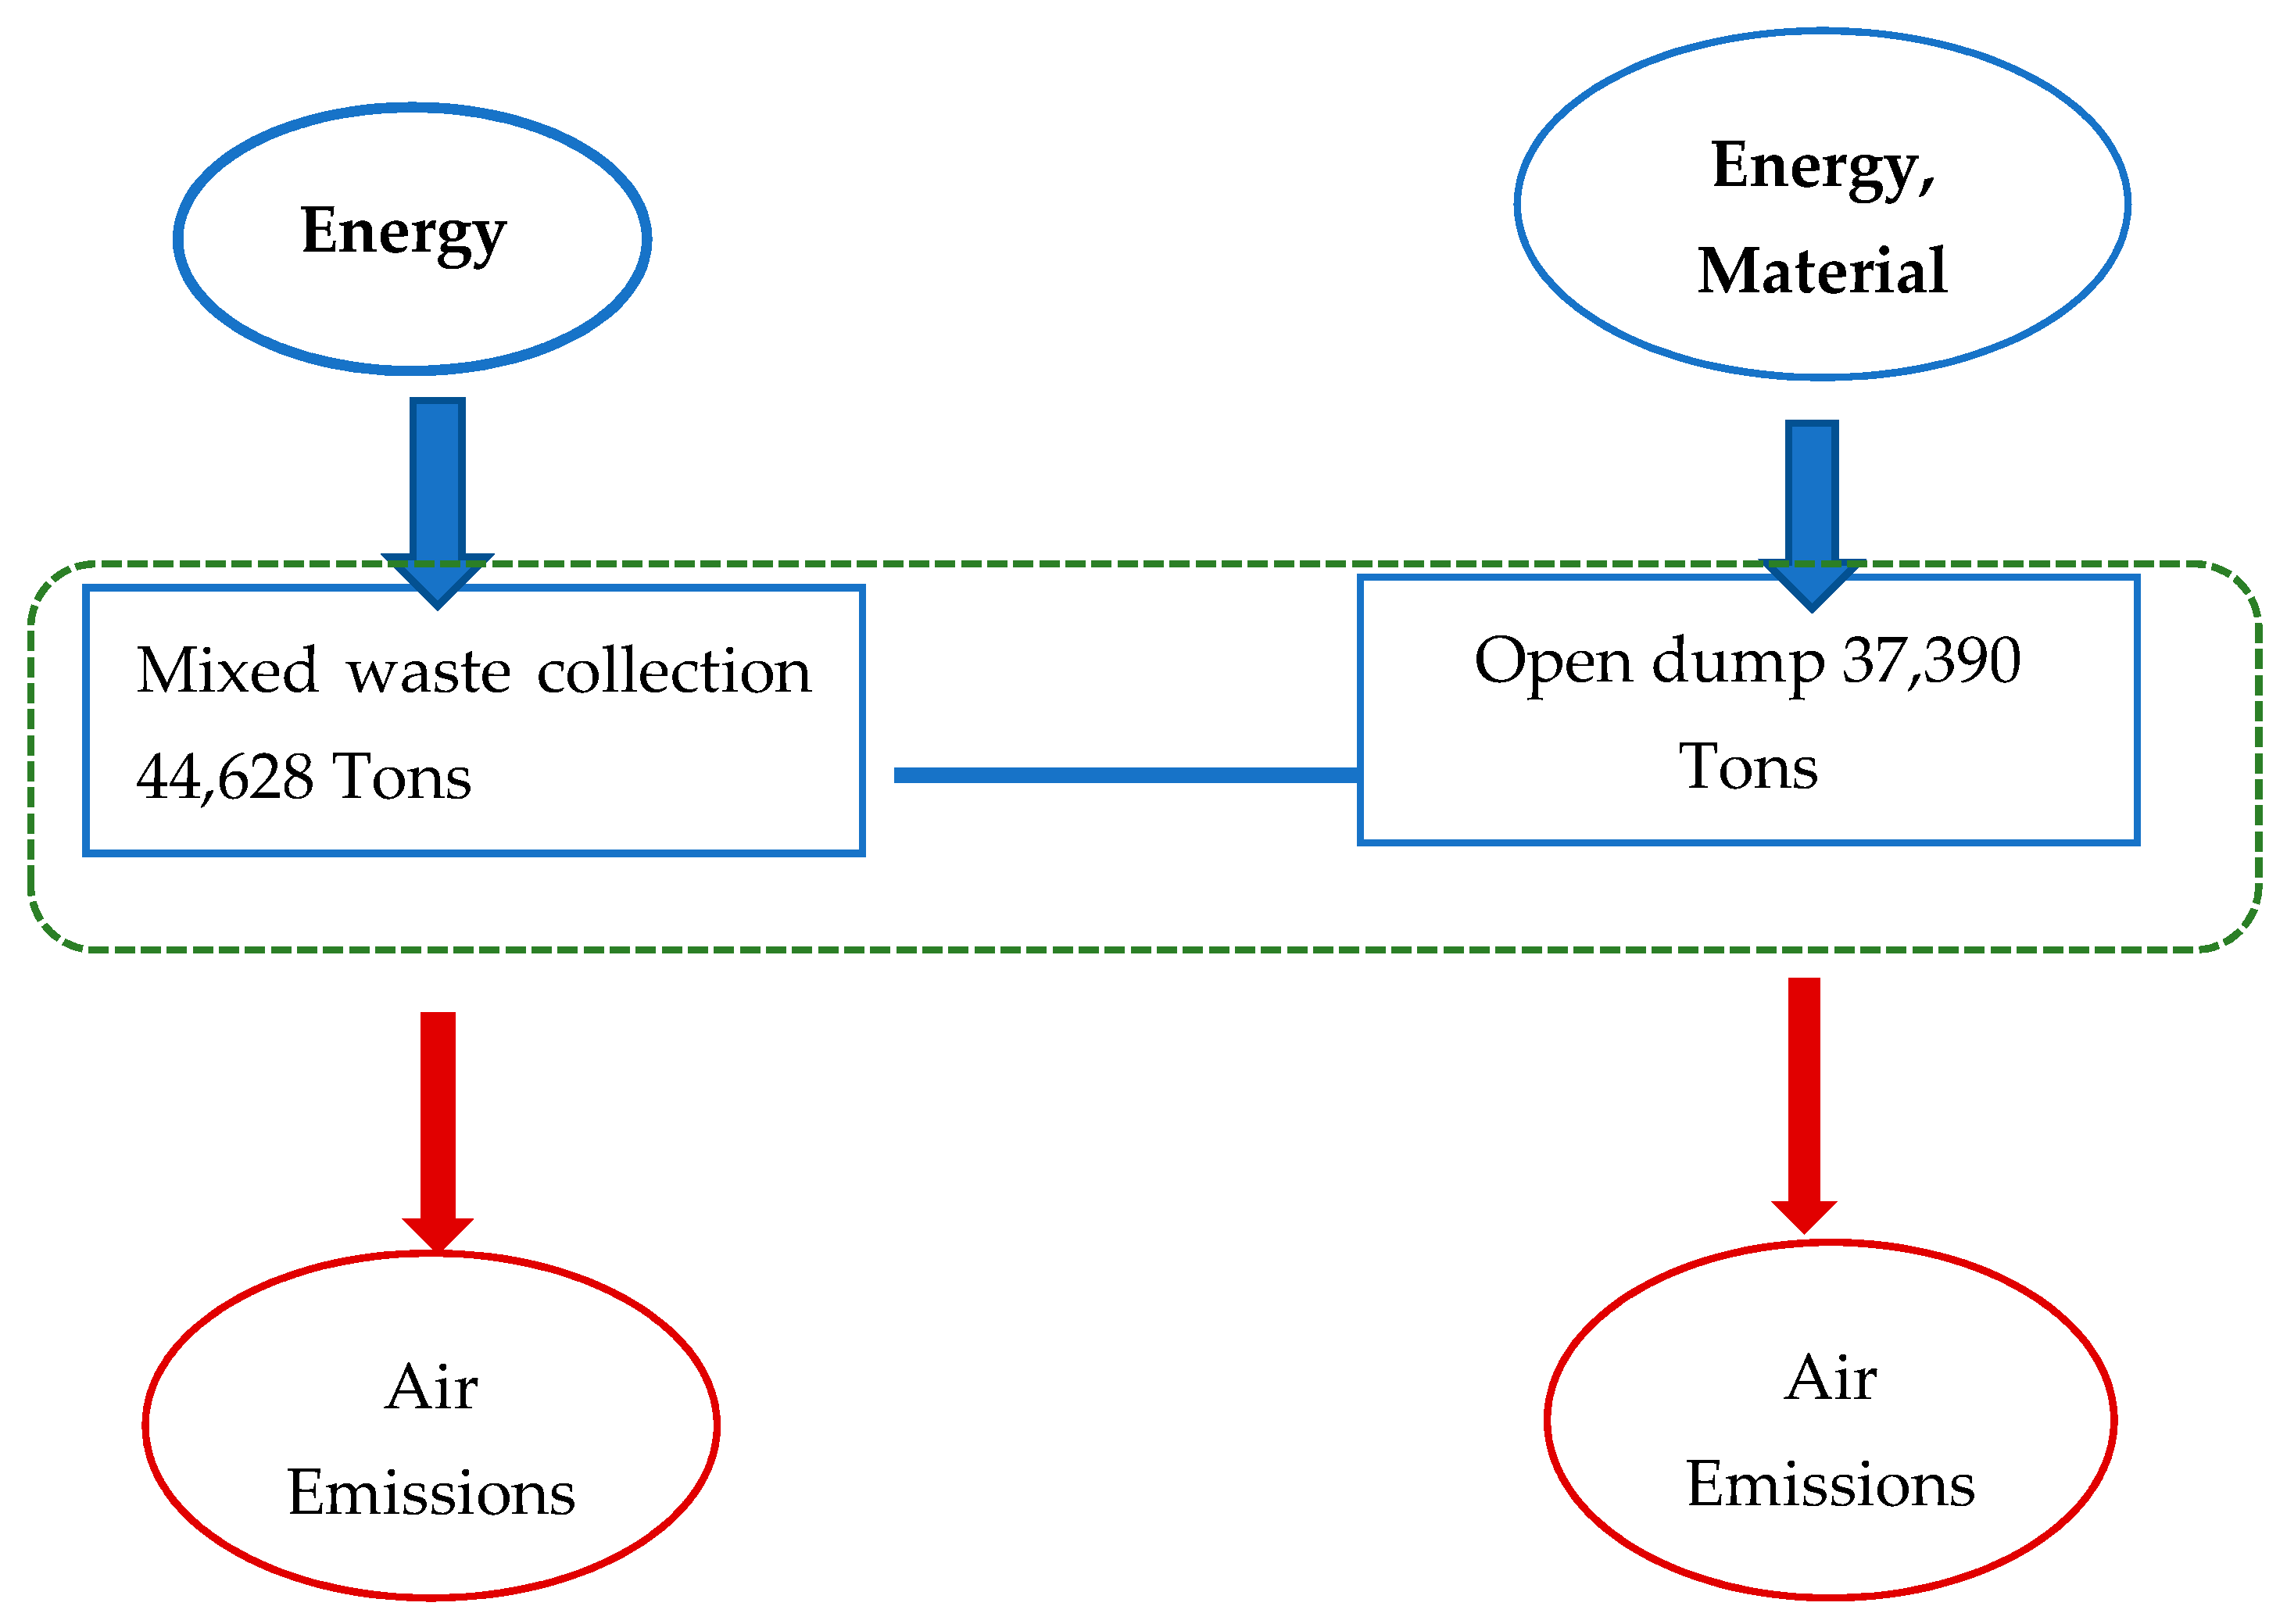
2.3.1. Scenario 1—Open Dump (Baseline)

Scenario 1 represented the existing collection system, which is characterized by a lack of adequate funding and facilities. This system is generally inefficient. It was assessed to deeply understand all the problems and propose an integrated policy as a replacement. All the waste collected were sent to the open dump site. In this scenario, there is no treatment of the waste and zero recoveries, as presented in Figure 3.

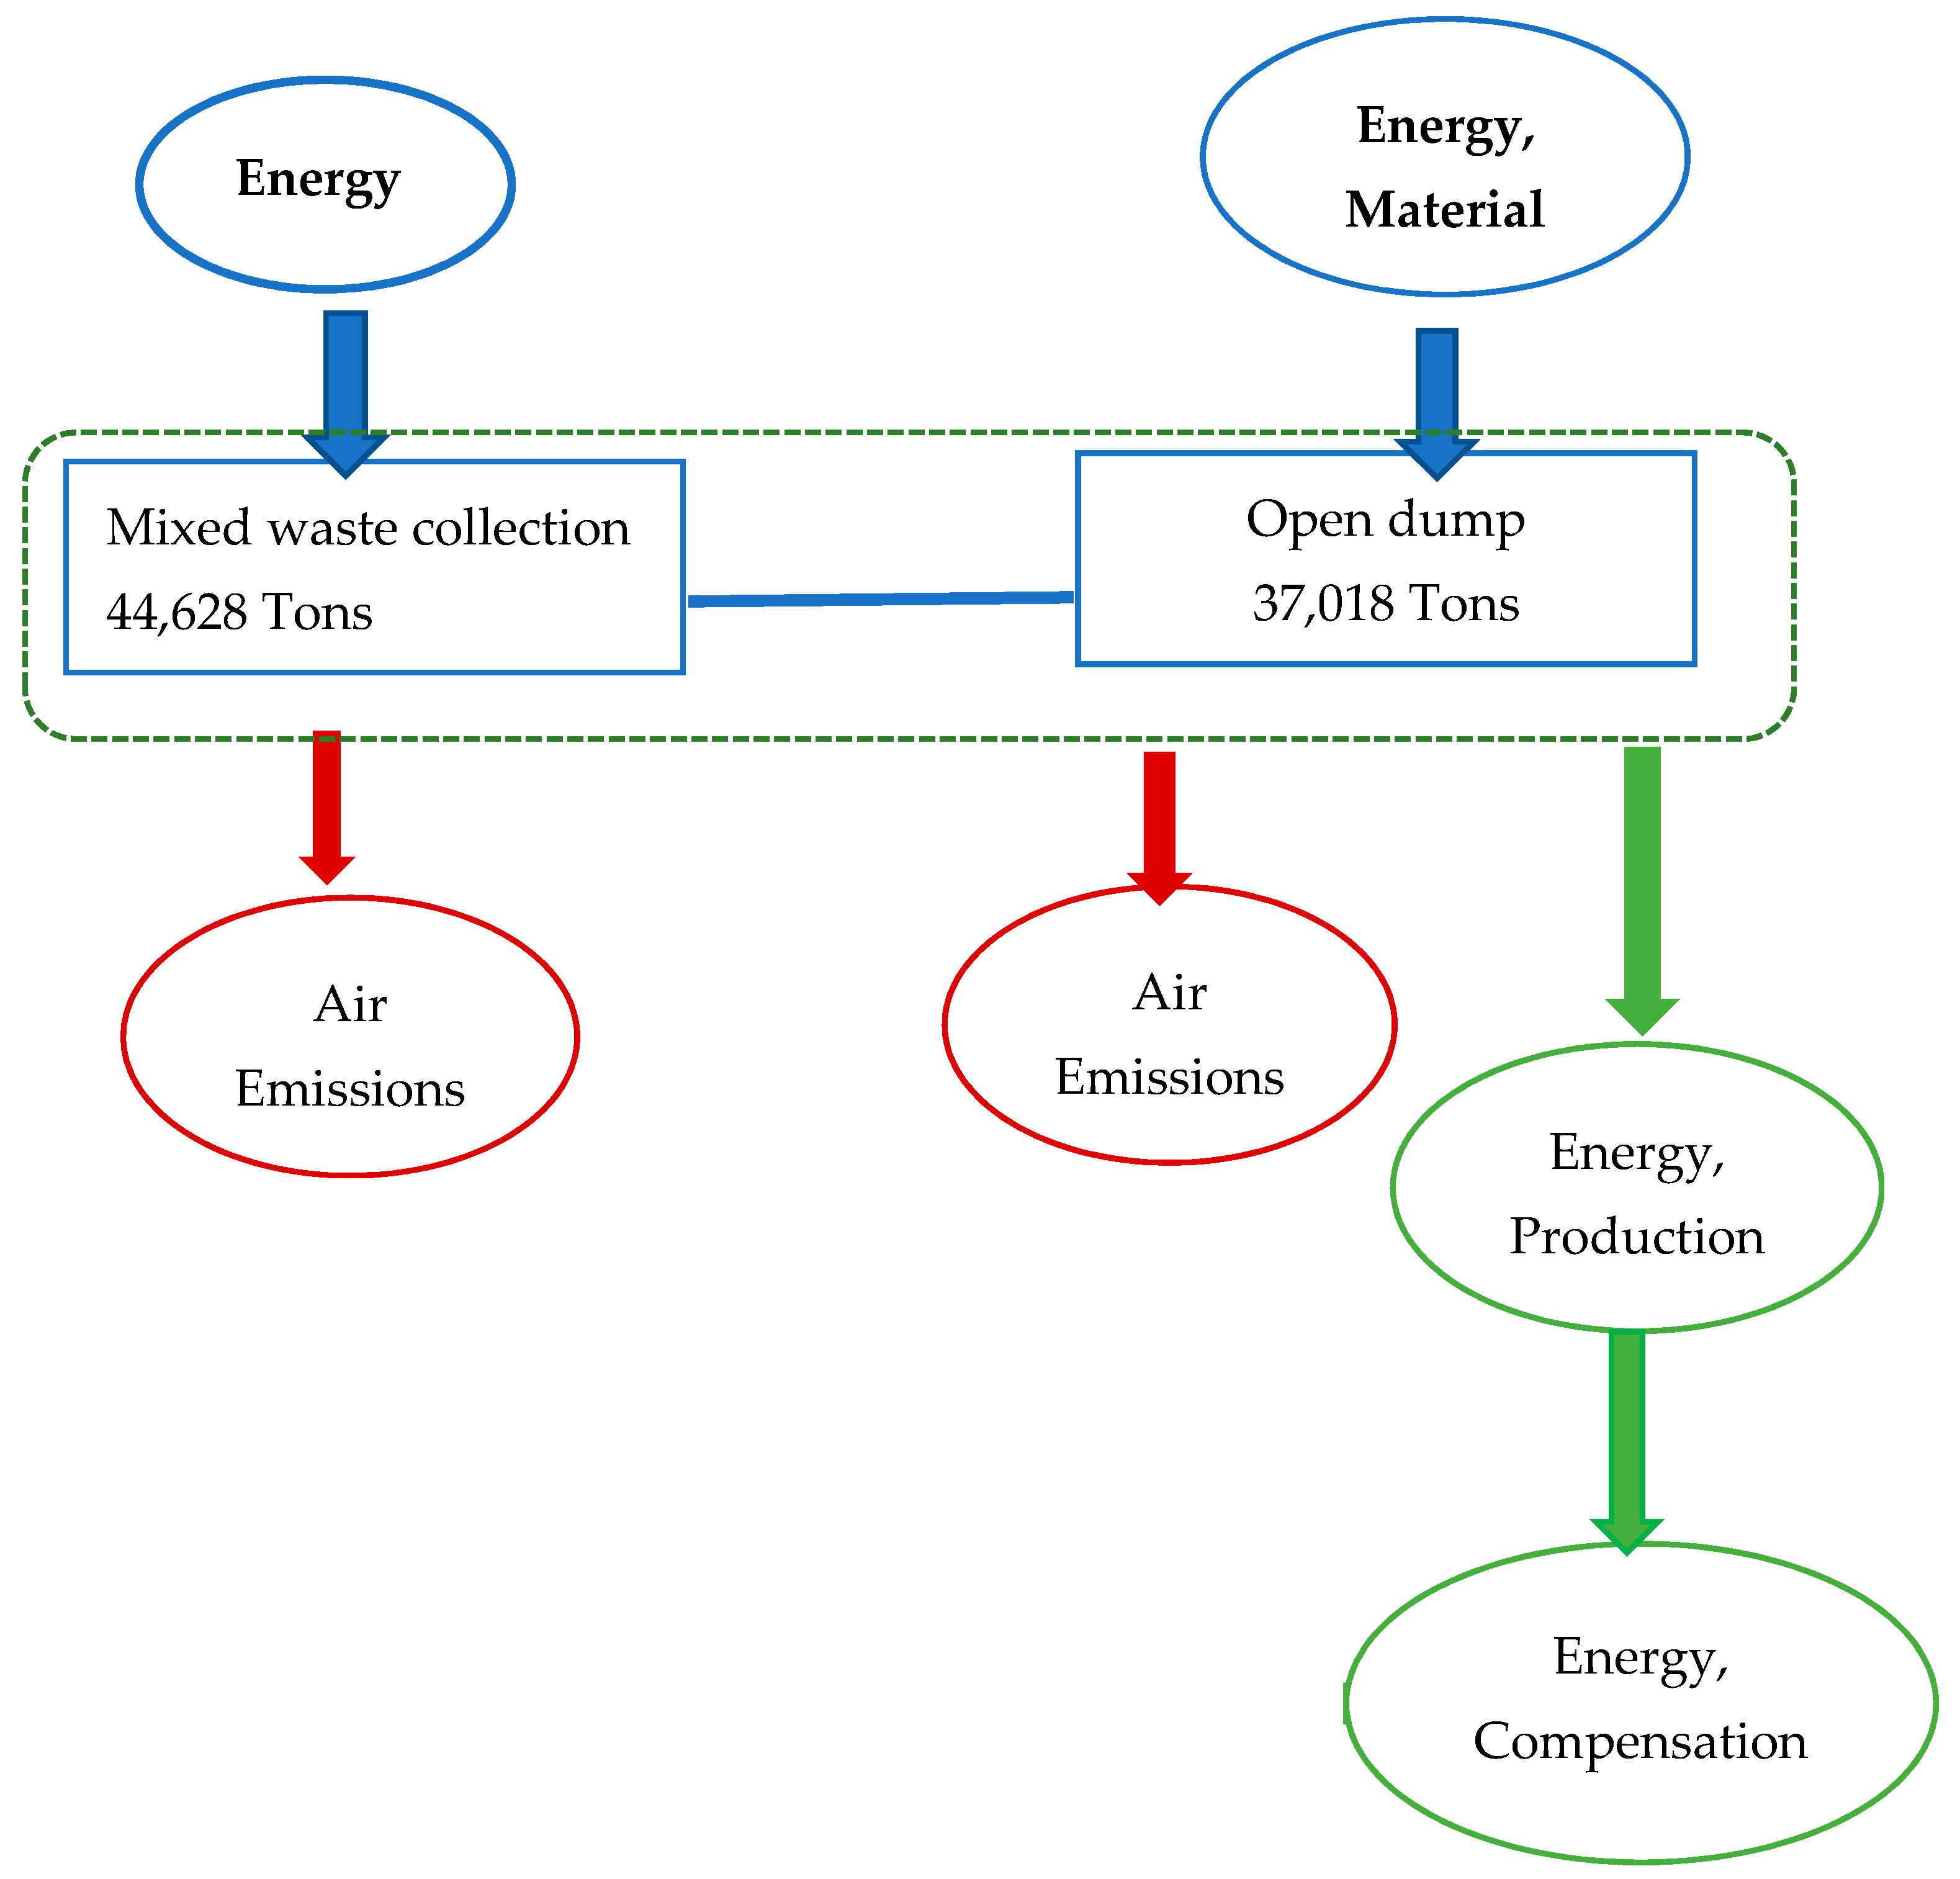
2.3.2. Scenario 2—Sanitary Landfill

Scenario 2 assumes that about 90% of the landfill gas could be collected, with 100% energy recovery at 30% efficiency. The Leachate recovery percentage was 95%, with a treatment efficiency of 95% using the default data of the Integrated Waste Management (IWM) software. The total amount of waste collected (44,628 Tons) sent to the sanitary landfill is almost the same (37,018 Tons) as appeared in Figure 4. However, a possibility for energy and available leachate recovery exists. However, the key problems, which are topography and access to roads, were not covered. Additionally, household distance and residents’ attitude were not covered effectively.

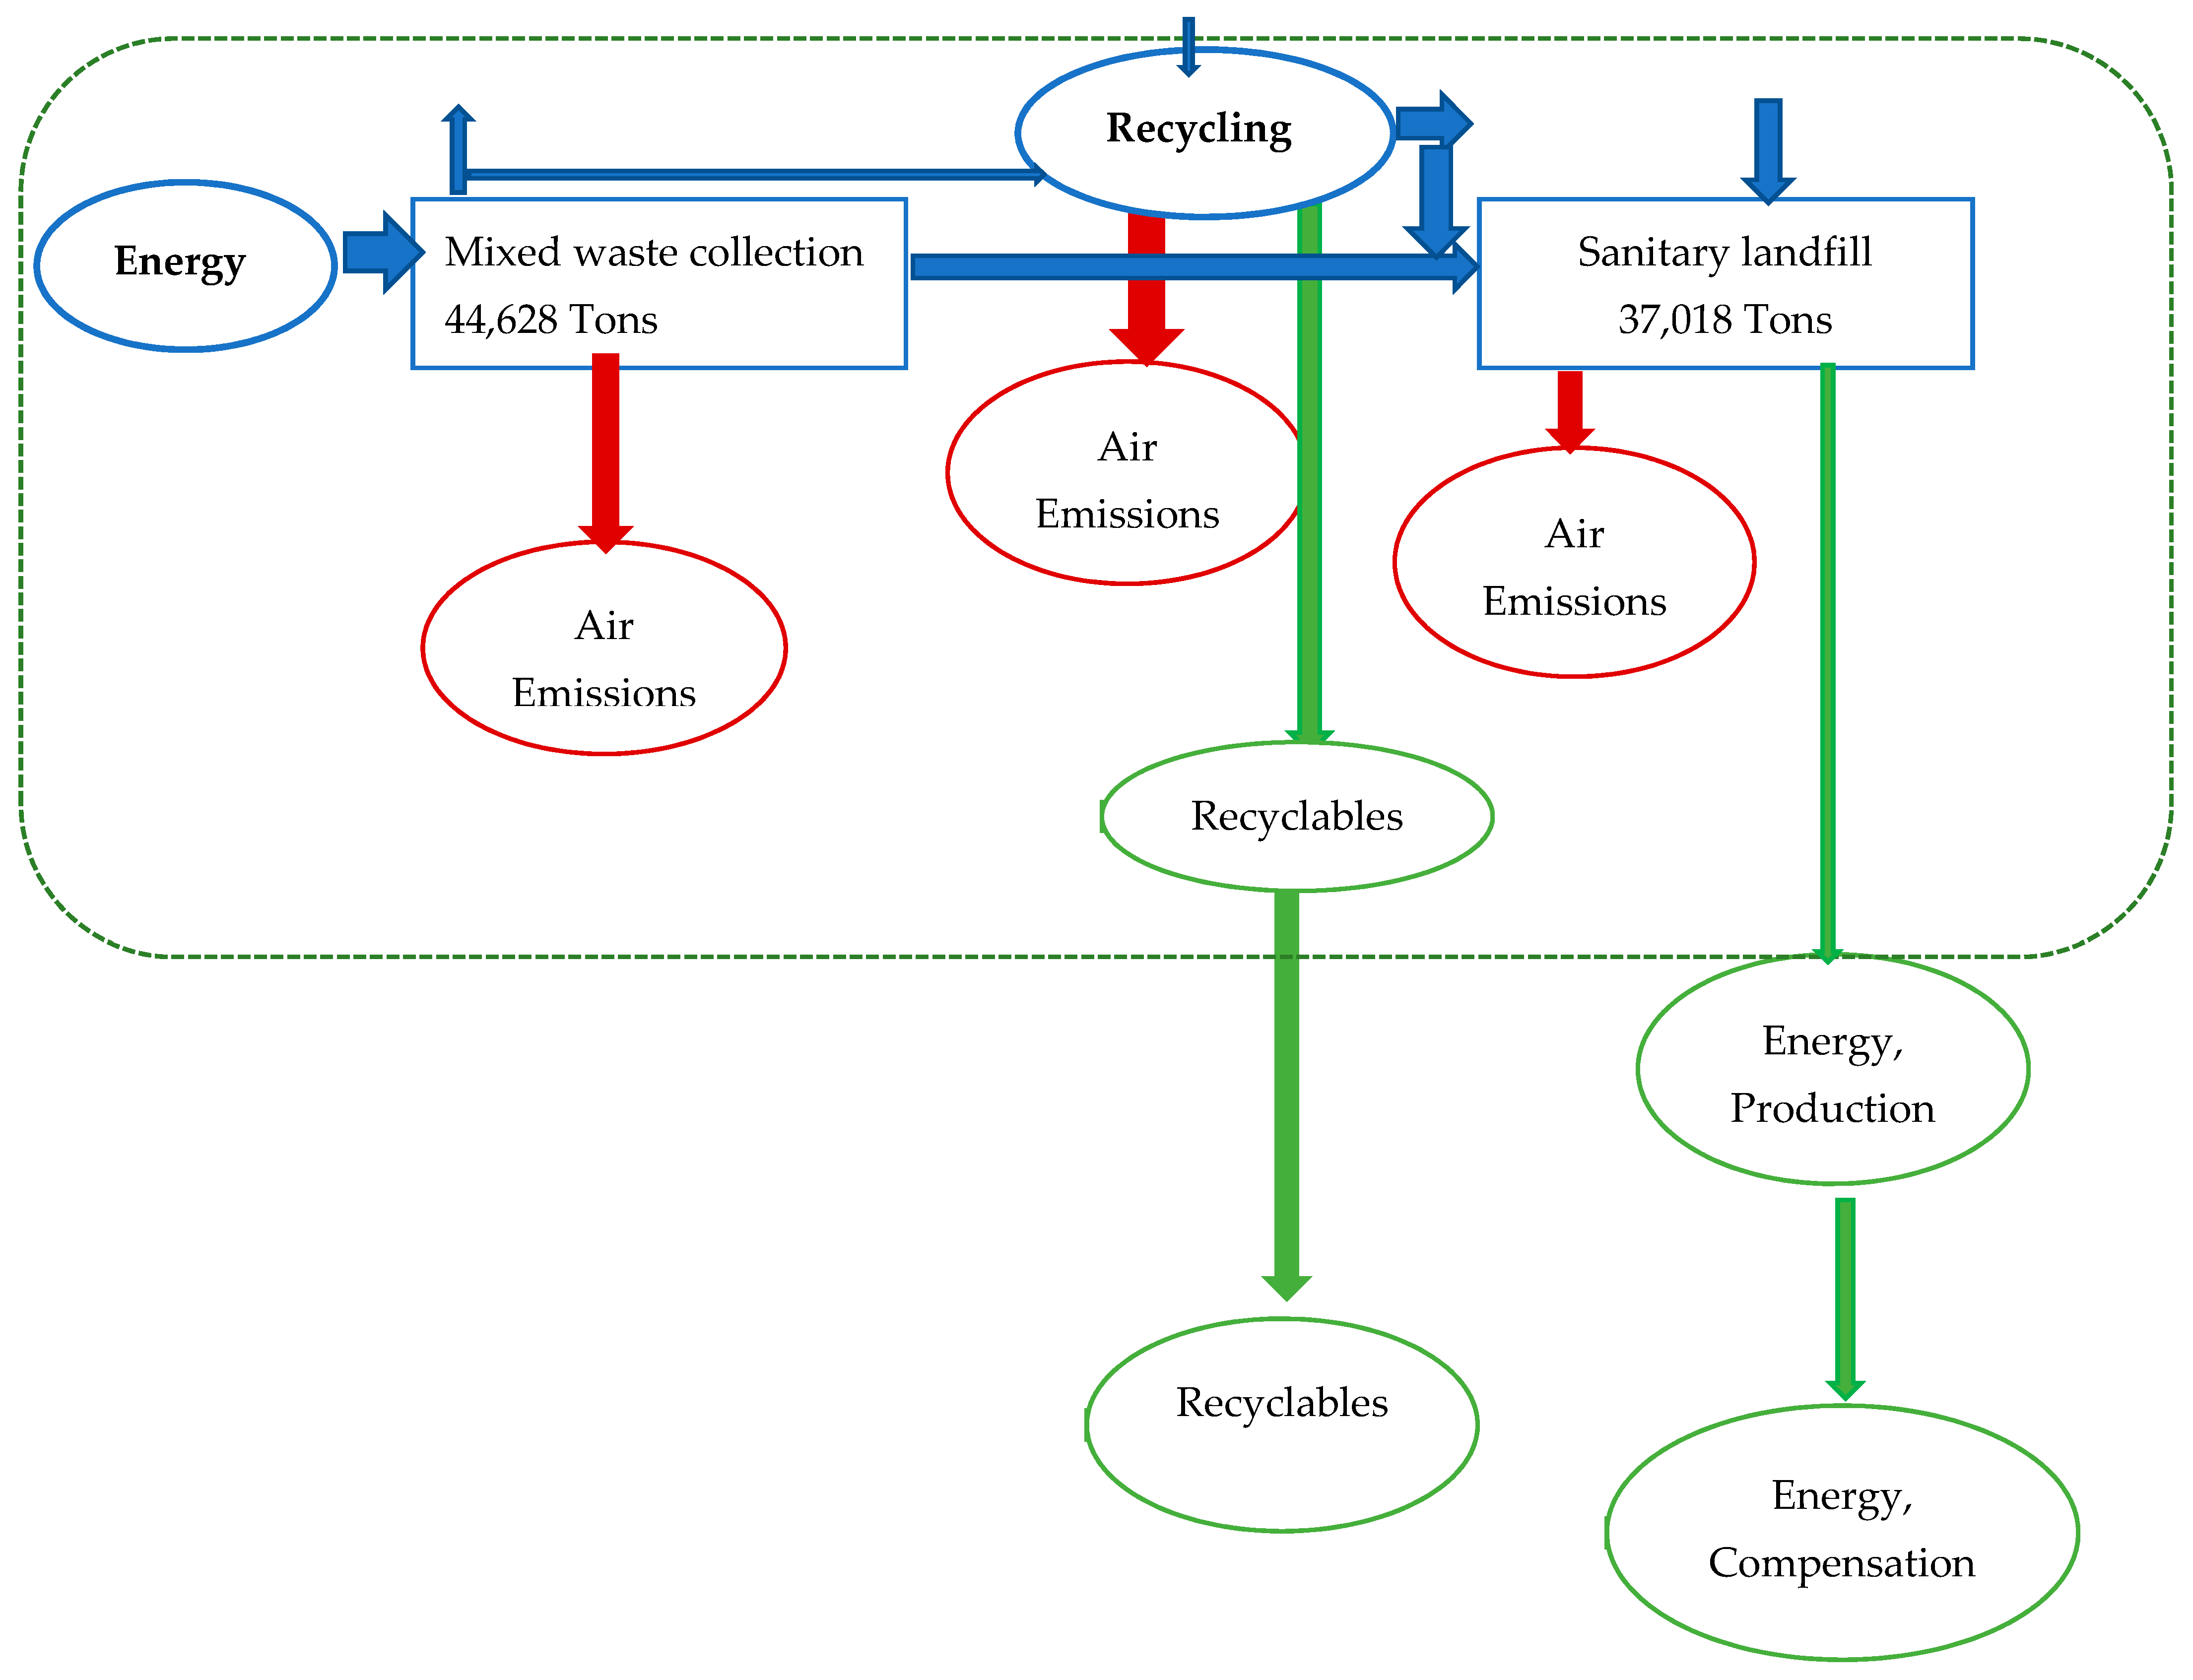
2.3.3. Scenario 3—The Material Bank Collection System Recycling (MBCS)

In this scenario, all the collection points in specific locations, such as supermarkets, offices, stores, and schools, were included in the scope. All the waste from different households were brought to a collection bank. The waste was brought unsorted with no sorting process carried out. Waste recycling is a part of this scenario; however, household are expected to bring their waste. Figure 5 represents the MBCS scenario with the integrated recycling component.

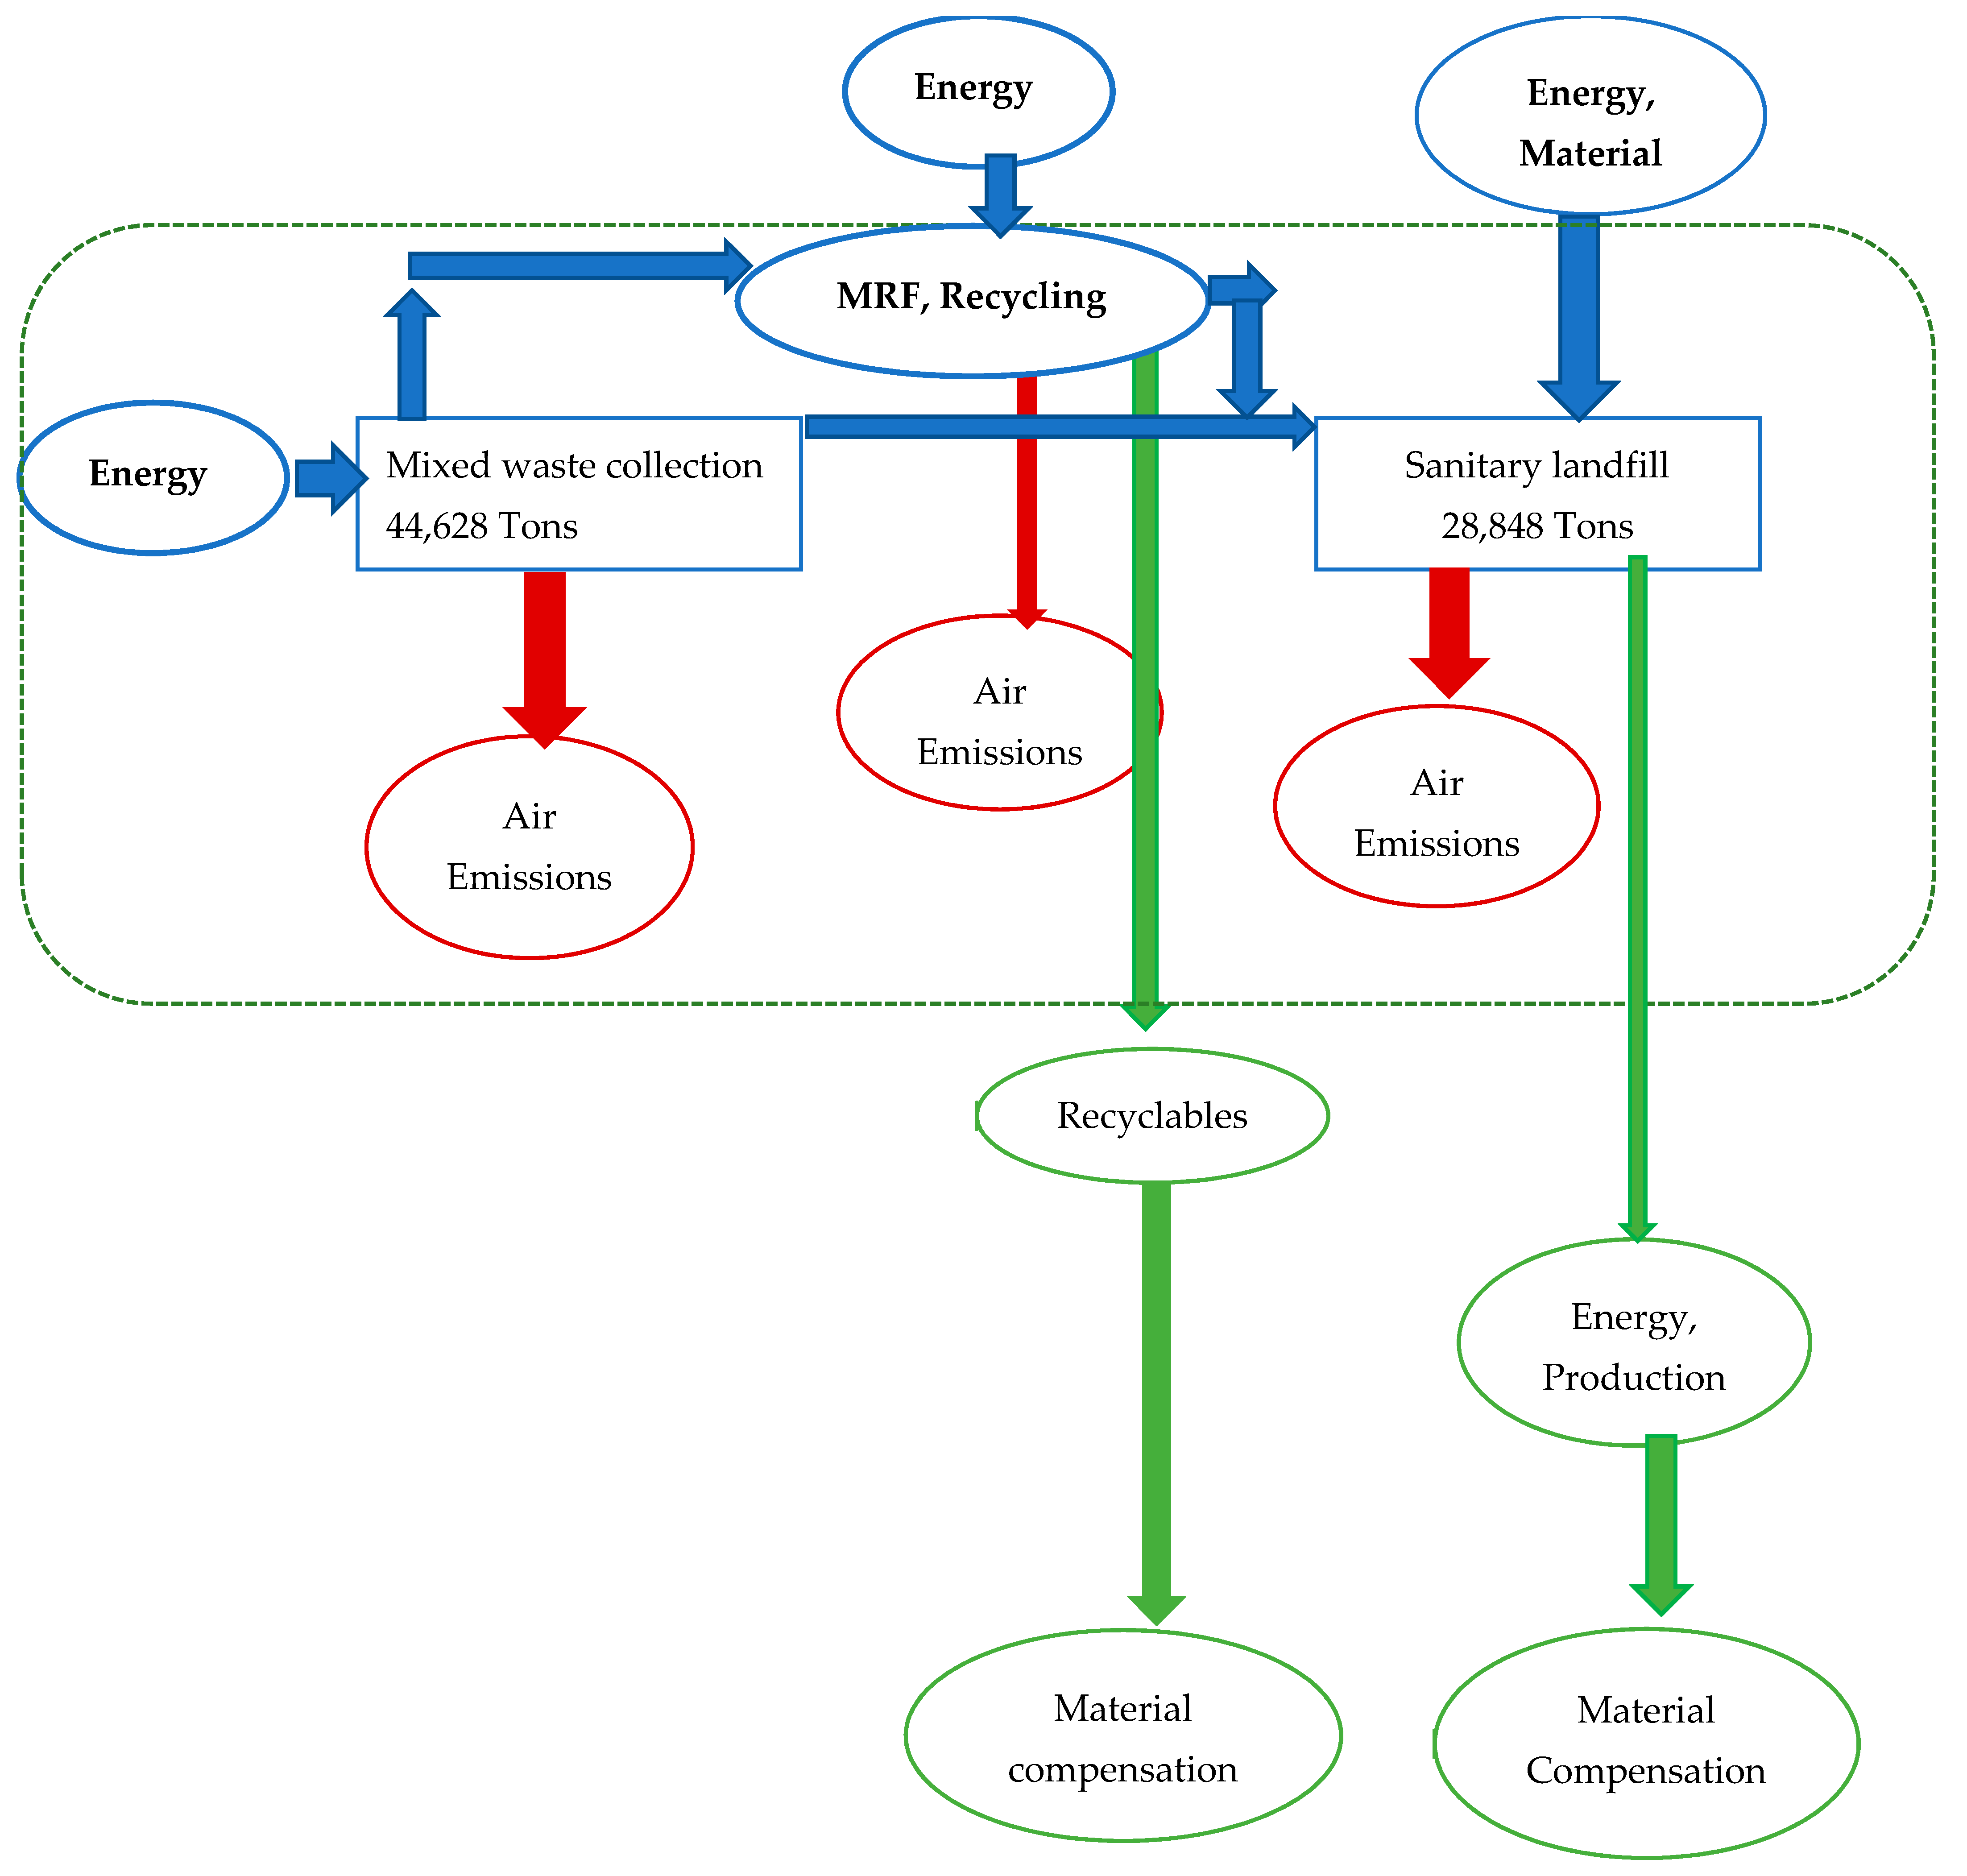
2.3.4. Scenario 4—The Kerbside Recycling System

In this scenario, sorting of recyclables is done at home. There is kerbside collection, and waste is transported to the material recovery facility (MRF, i.e., sorting center). The key factor in this scenario is that waste is sorted and picked up by the collector. Unlike scenario three, where the waste is not sorted, the households are responsible for bringing the waste to the collection bank. Figure 6 displays the kerbside recycling system scenario. One day is assigned for recyclables collection in the household.

2.4. Cost–Benefit Analysis

This analysis aims to analyze the environmental impact and cost–benefit ratios from Anyama city to the new landfill in Kossihouen, located approximately 45 km from Anyama city. The transfer of the waste collected to the Kossihouen center causes an increase in costs. Based on the data from the agency in charge of waste collection and management (ANAGED), some projections were made based on assumptions. Thus, we found out that the average waste generated in Anyama is 1.24 kg/day. Accordingly, 49% of waste generated is food waste, while 8% is plastic waste, an essential resource for waste recycling. About 80–90% of waste in Abidjan is collected by Eco Eburnie and Ecoti and transported to the modern Kossihouen landfill. Based on JICA’s waste management report, the total amount of waste generated in Anyama from the ANAGED source was estimated at an 80% rate [15]. The household waste characterization in Anyama is presented in the chart below (Figure 7).
Presently, the waste management method in Anyama does not follow any recycling method. Waste collected is mixed and directly sent to the current sanitary landfill. However, to optimize the waste collection service in Anyama, we proposed scenarios 3 and 4. The Kossihouen center in Abidjan is the current operational sanitary landfill receiving all the waste, including that from Anyama city. The Kossihouen center has an average capacity of 1,250,000 tons/year, covering an area of 100 hectares. Modern transfer centers are still under construction in Abidjan. The main objective of the new system is to optimize waste collection and to reach a rate of 95% with reduced transportation costs. The new system is based on infrastructure: transfer, waste recovery, and disposal centers. In this study, the collected and estimated inventory data results were categorized, and the emissions considered were CO2eq, CH4, and GWP. Avoided landfilling consisted of inorganic materials that were sold from the recycling scenarios. The calculation of these emissions adopted the LCA methodology through the Integrated Waste Management 2 software (IWM2). The emission factors used in this study for CO2eq, CH4, and GWP were obtained from the Intergovernmental Panel on Climate Change [33,34]. The environmental effects of collection and transportation were estimated based on fuel consumption, the number of vehicles, and the distance traveled.
The cost–benefit analysis evaluates the economic aspect of municipal waste management in Anyama. The results of the different scenarios were compared and critically assessed to decide which scenario was suitable for Anyama. The cost–benefit analysis in this study provides information to determine the value of the benefits activity from an overall perspective. According to Hylton, the total benefit and cost of projects represented by B total and C total , respectively, are defined in two components as follows [35]:
B total = B internal + B external
C total = C internal + C external
The total benefit consists of the internal and external benefits, which B internal and B external , respectively, denote in the equations. The internal benefit considered for this study was the “taxe d’enlevemenent des ordure menageres—TEOM”, a tax for household-refuse removal, and the annual budget allocated by the government to each municipality. The amount of the TEOM is 2.52 XOF per KW/h and is only applied to subscribers of low voltage electricity by the Ivorian Electricity Company (CIE). The amount collected totals XOF 1.2 billion (USD 2 million) for the whole capital city, Abidjan, including Anyama. The estimated amount collected for Anyama is about XOF 1,155,404.16 million (USD 1794.11). From the waste treatment process, waste collection and transportation produce emission, which indirectly affects the environment and could be considered external costs. Externality should be converted to a comparable value to understand the external cost and benefit resulting from those actions. This study employed the social cost of carbon (SCC) to convert those externalities to monetize CO2eq External cost and benefit in this study are estimated using an SCC value of 7.6 USD per ton of CO2eq or West African CFA franc 4,894.40 per ton at a 3% discount rate (1 USD = 644 XOF, 8/7/22) [32]. The functional unit used for environmental assessment is CO2eq equivalent (CO2eq) per ton of waste managed. It will be hypothetically monetized using Social Carbon Cost (SCC) conversion factor, and for cost analysis, is West African CFA franc per ton of waste [32]. The detailed cost–benefit component is shown in Table 1.
Cost component analysis is performed by adding the cost values of a scenario such that the total cost (net cost) of each planned scenario is obtained. Benefit component analysis is performed by adding the benefit values of each scenario to obtain the total benefit (net benefit) [32]. Based on Table 1, the net cost and net benefit equation are:
Net   cos t = C 1 + C 2 + C 3 + C 4 + C 5 + C 6 + C 7 + C 8 + C 9 + C 10
Net   benefit = B 1 + B 2 + B 3 + B 4 + B 5 + B 6

3. Results

3.1. Profile of Household Living in Anyama

The characteristics of the household in Anyama include gender (male and female), age (over 18 years of age), and level of education (primary, secondary, tertiary, never attended, and others). Respondents were selected to achieve the study’s objectives and research questions appropriately. The study was conducted in Anyama town, a sub-prefecture of Abidjan, where 378 structured questionnaires were administered to the respondents. Table 2 presents the profile and characteristics of the Anyama inhabitants.
From Table 2, most respondents were male, 341 (90.2%), and 37 (9.8%) were females. This result is because the survey targeted the head of each household. In Cote d’Ivoire, men are considered the heads of the household and are responsible for providing for all the family’s needs. Classifying the respondents into their genders is important since public services regarding adequacy, quality, and accessibility of waste collection services are viewed by both genders differently. From the survey result, the dominant age group is between 25–50 years and represents the city’s future. However, they are not well integrated into the development effort due to the lack of competency and the low level of education. This low level of education is a barrier to their full participation in their family’s well-being, given the household size and the increase in births.
Moreover, Table 2 indicates that 11% of respondents had never attended school. While 31.2% had completed secondary education, only 20.9% had tertiary education. With the introduction of free education in 2000 for children from 4 to 16 years old and subsequent subsidization of secondary education in the same year by the Government of Côte d’Ivoire, access to education has risen in the Abidjan district and all other areas of the country. An educated population is more likely to deal with waste issues more seriously since they are more enlightened and aware of their responsibility when compared to the uneducated population. About 56.3% of the household live with 3 to 4 members, followed by 25% of people living with 5 to 7 members. Most household heads migrate first and later bring their family members to improve their living conditions. This fact can also be explained by the polygamy factor, which is very high in traditional societies like Anyama. Consequently, many children are not well taken care of and do not have access to basic infrastructures such as education and health. The existing amenities are inadequate and cannot meet the population’s needs because the population is rapidly growing and has no corresponding infrastructural growth.

3.2. Comparative LCA Analysis of the Four Scenarios

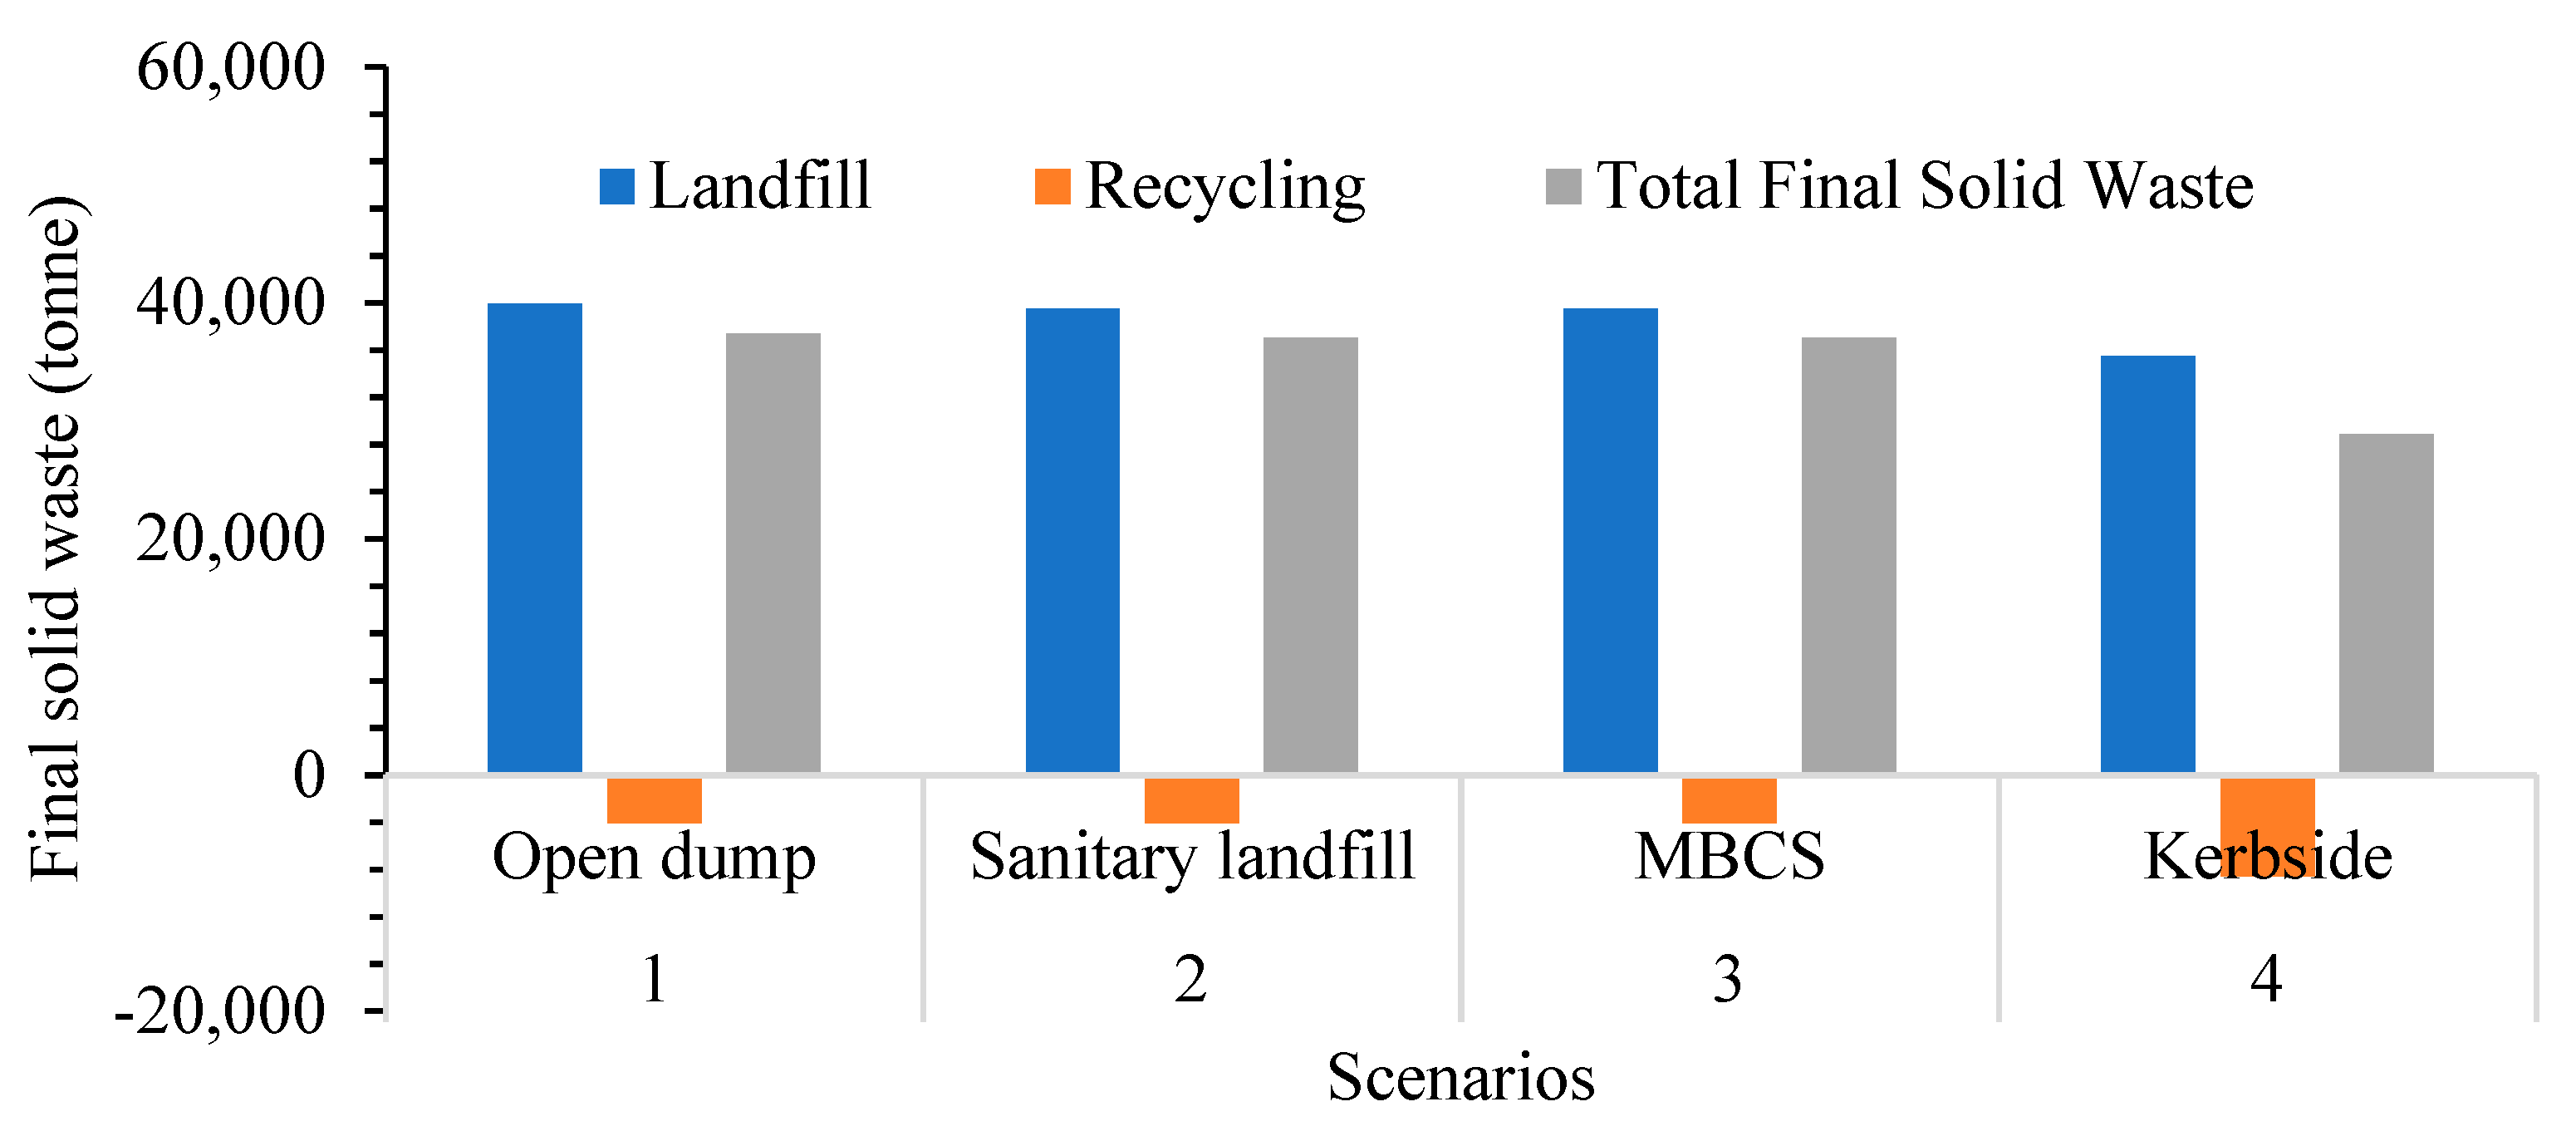
3.2.1. Final Solid Waste

The final solid waste from the four scenarios is presented in Figure 8. The final solid waste represents the amounts of waste being sent for final disposal to the landfill. This final waste is divided into non-hazardous and hazardous materials (fly ash from incineration). However, this study did not consider hazardous waste, as the municipality did not handle it.
As seen in Figure 8 above, the total amount of waste sent to the landfill was the highest for all four scenarios. Comparatively, the kerbside scenario (scenario 4) has the highest amount of waste sent for recycling (8589 tons), which increases the amount of retribution (benefits). This figure demonstrates that scenario 1 (Open dumping—37,390 tons), scenario 2 (Sanitary landfill—37,018 tons), and scenario 3 (Recycling_ Material Bank Collection System-MBCS—37,018 tons) have little effect on the landfill waste volume. However, scenario 4 (kerbside) shows the most significant reduction in landfill volume (28,848 tons).

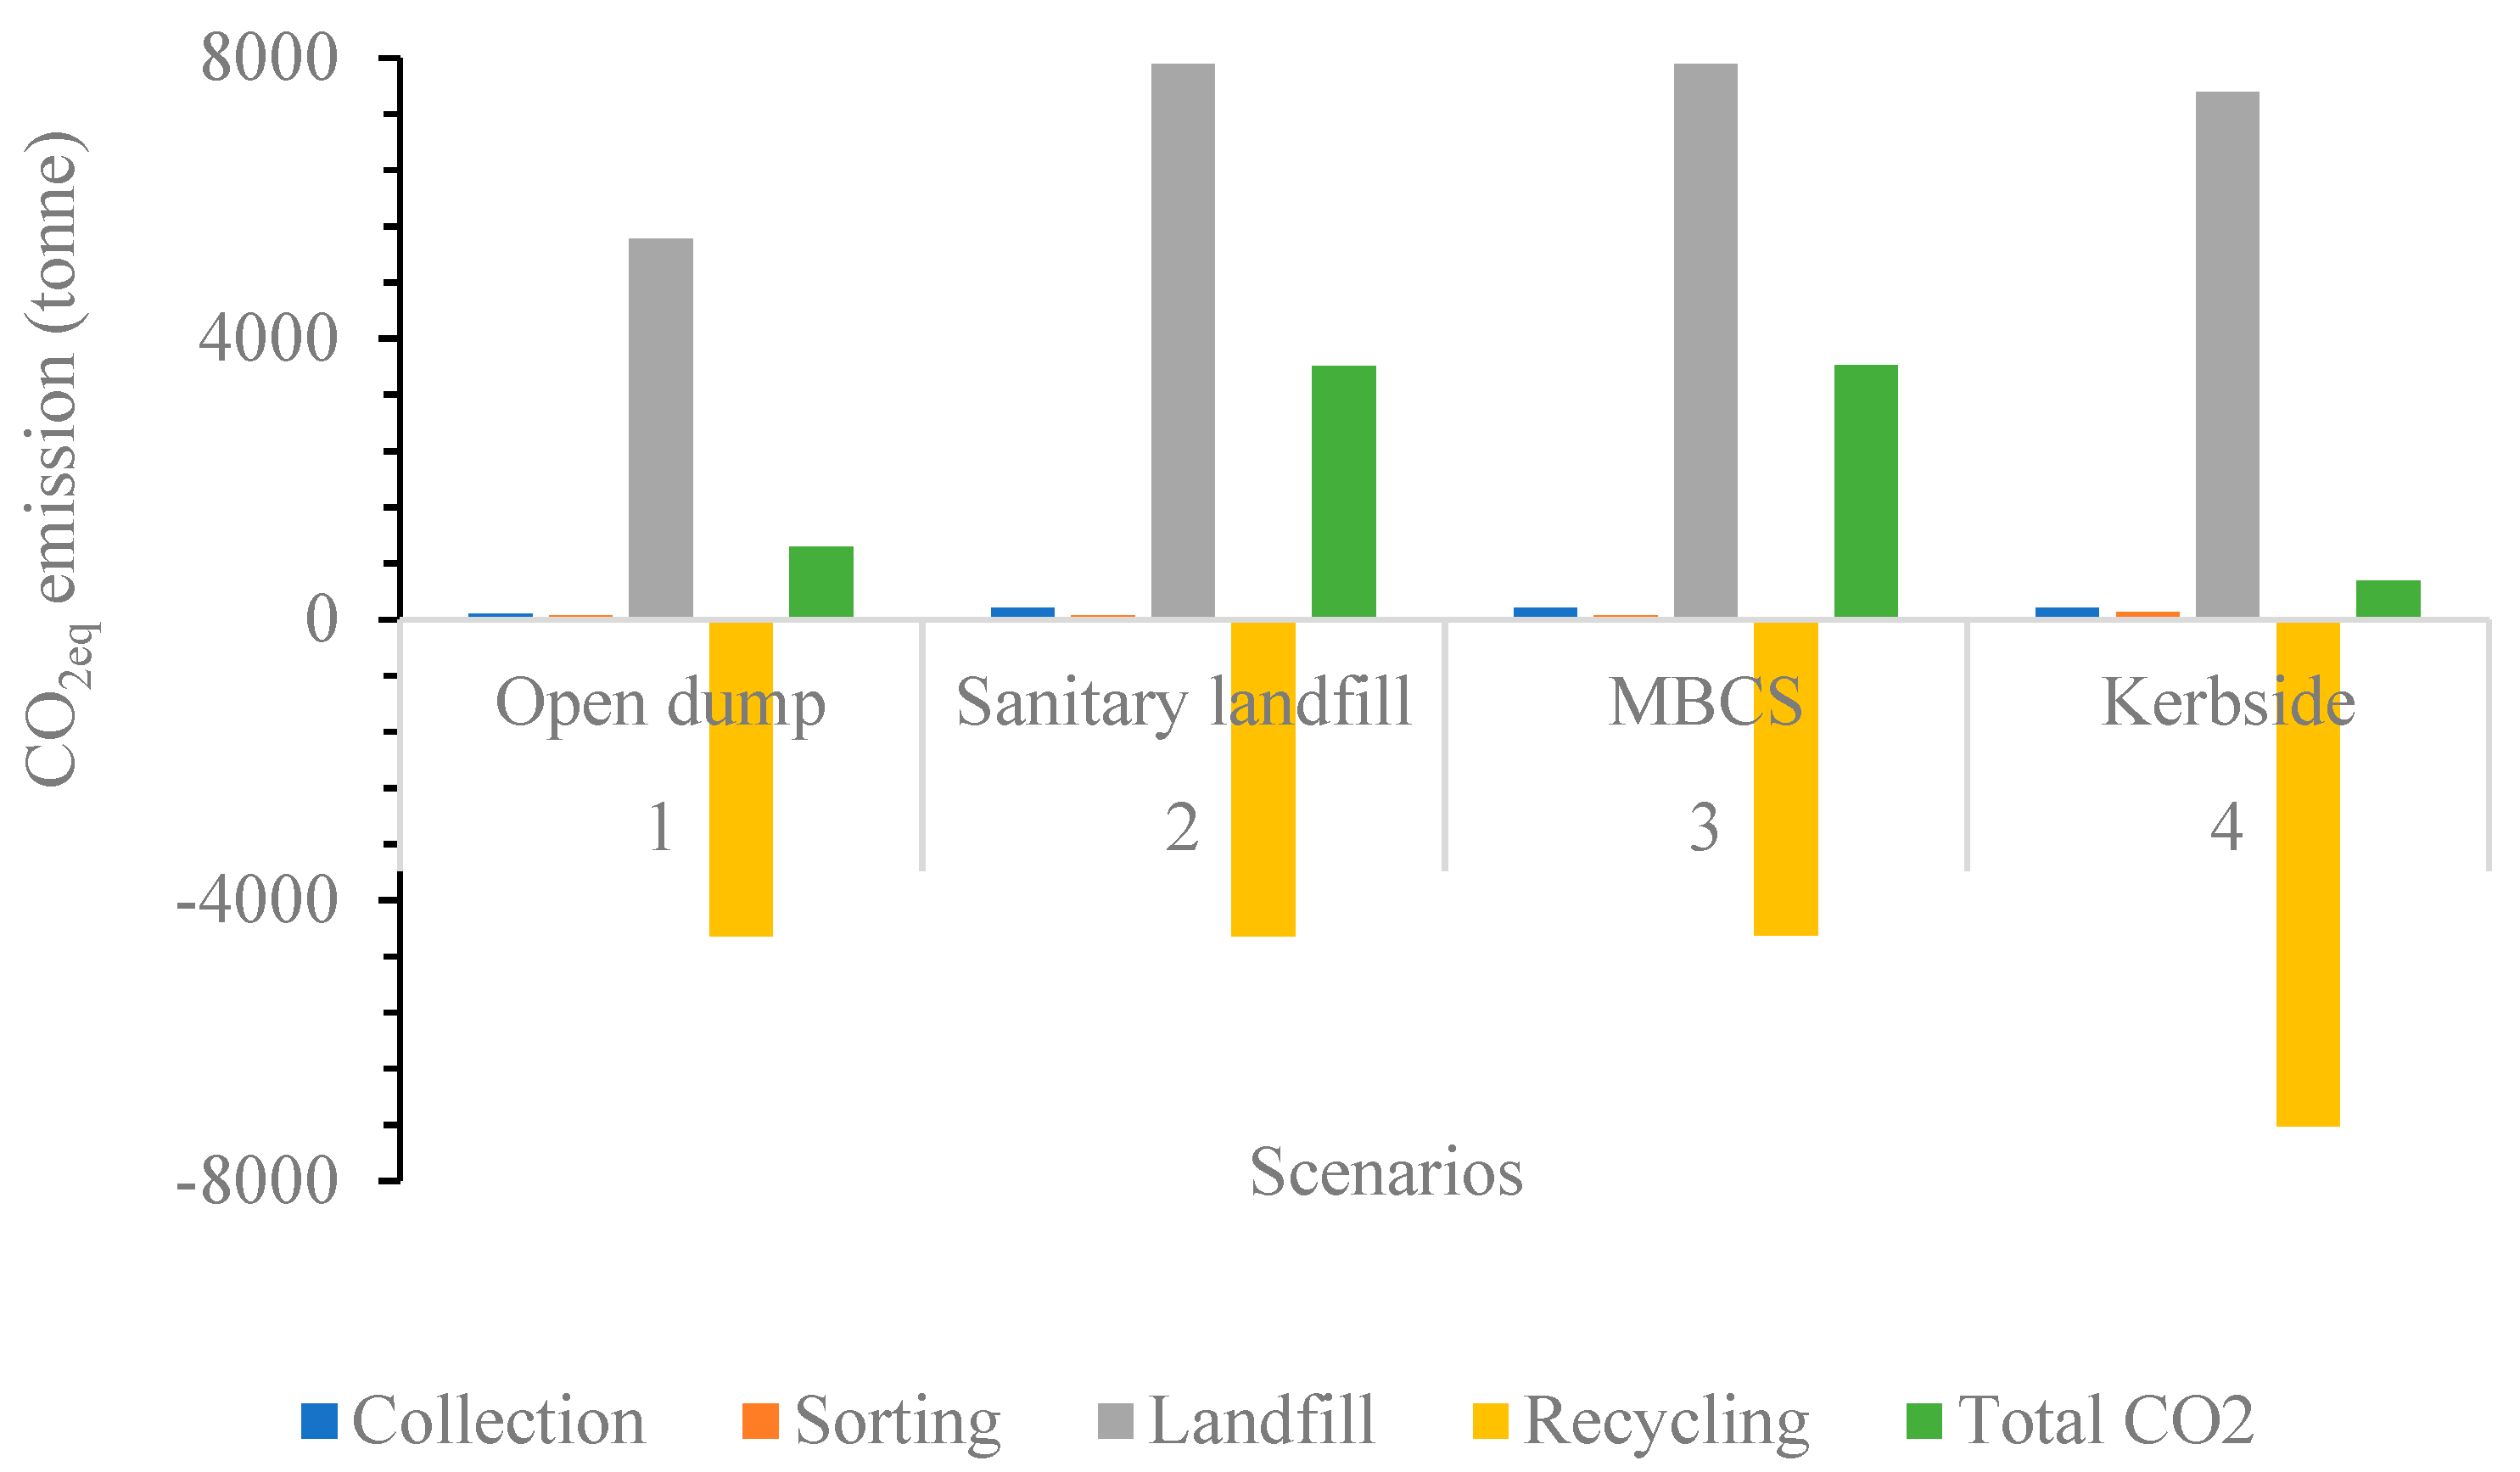
3.2.2. Carbon Dioxide (CO2) Emission

Carbon dioxide is one of the major air emissions, with significant global impacts such as global warming and climate change effects. Therefore, a CO2eq emission assessment was carried out on all four scenarios. Figure 9 presents the results of the comparative analysis of the four scenarios. Scenario 4 (kerbside system) had the lowest total CO2eq emission (550 tons) compared to the other scenarios. This lowest amount was principally due to having a more considerable amount of recycling.

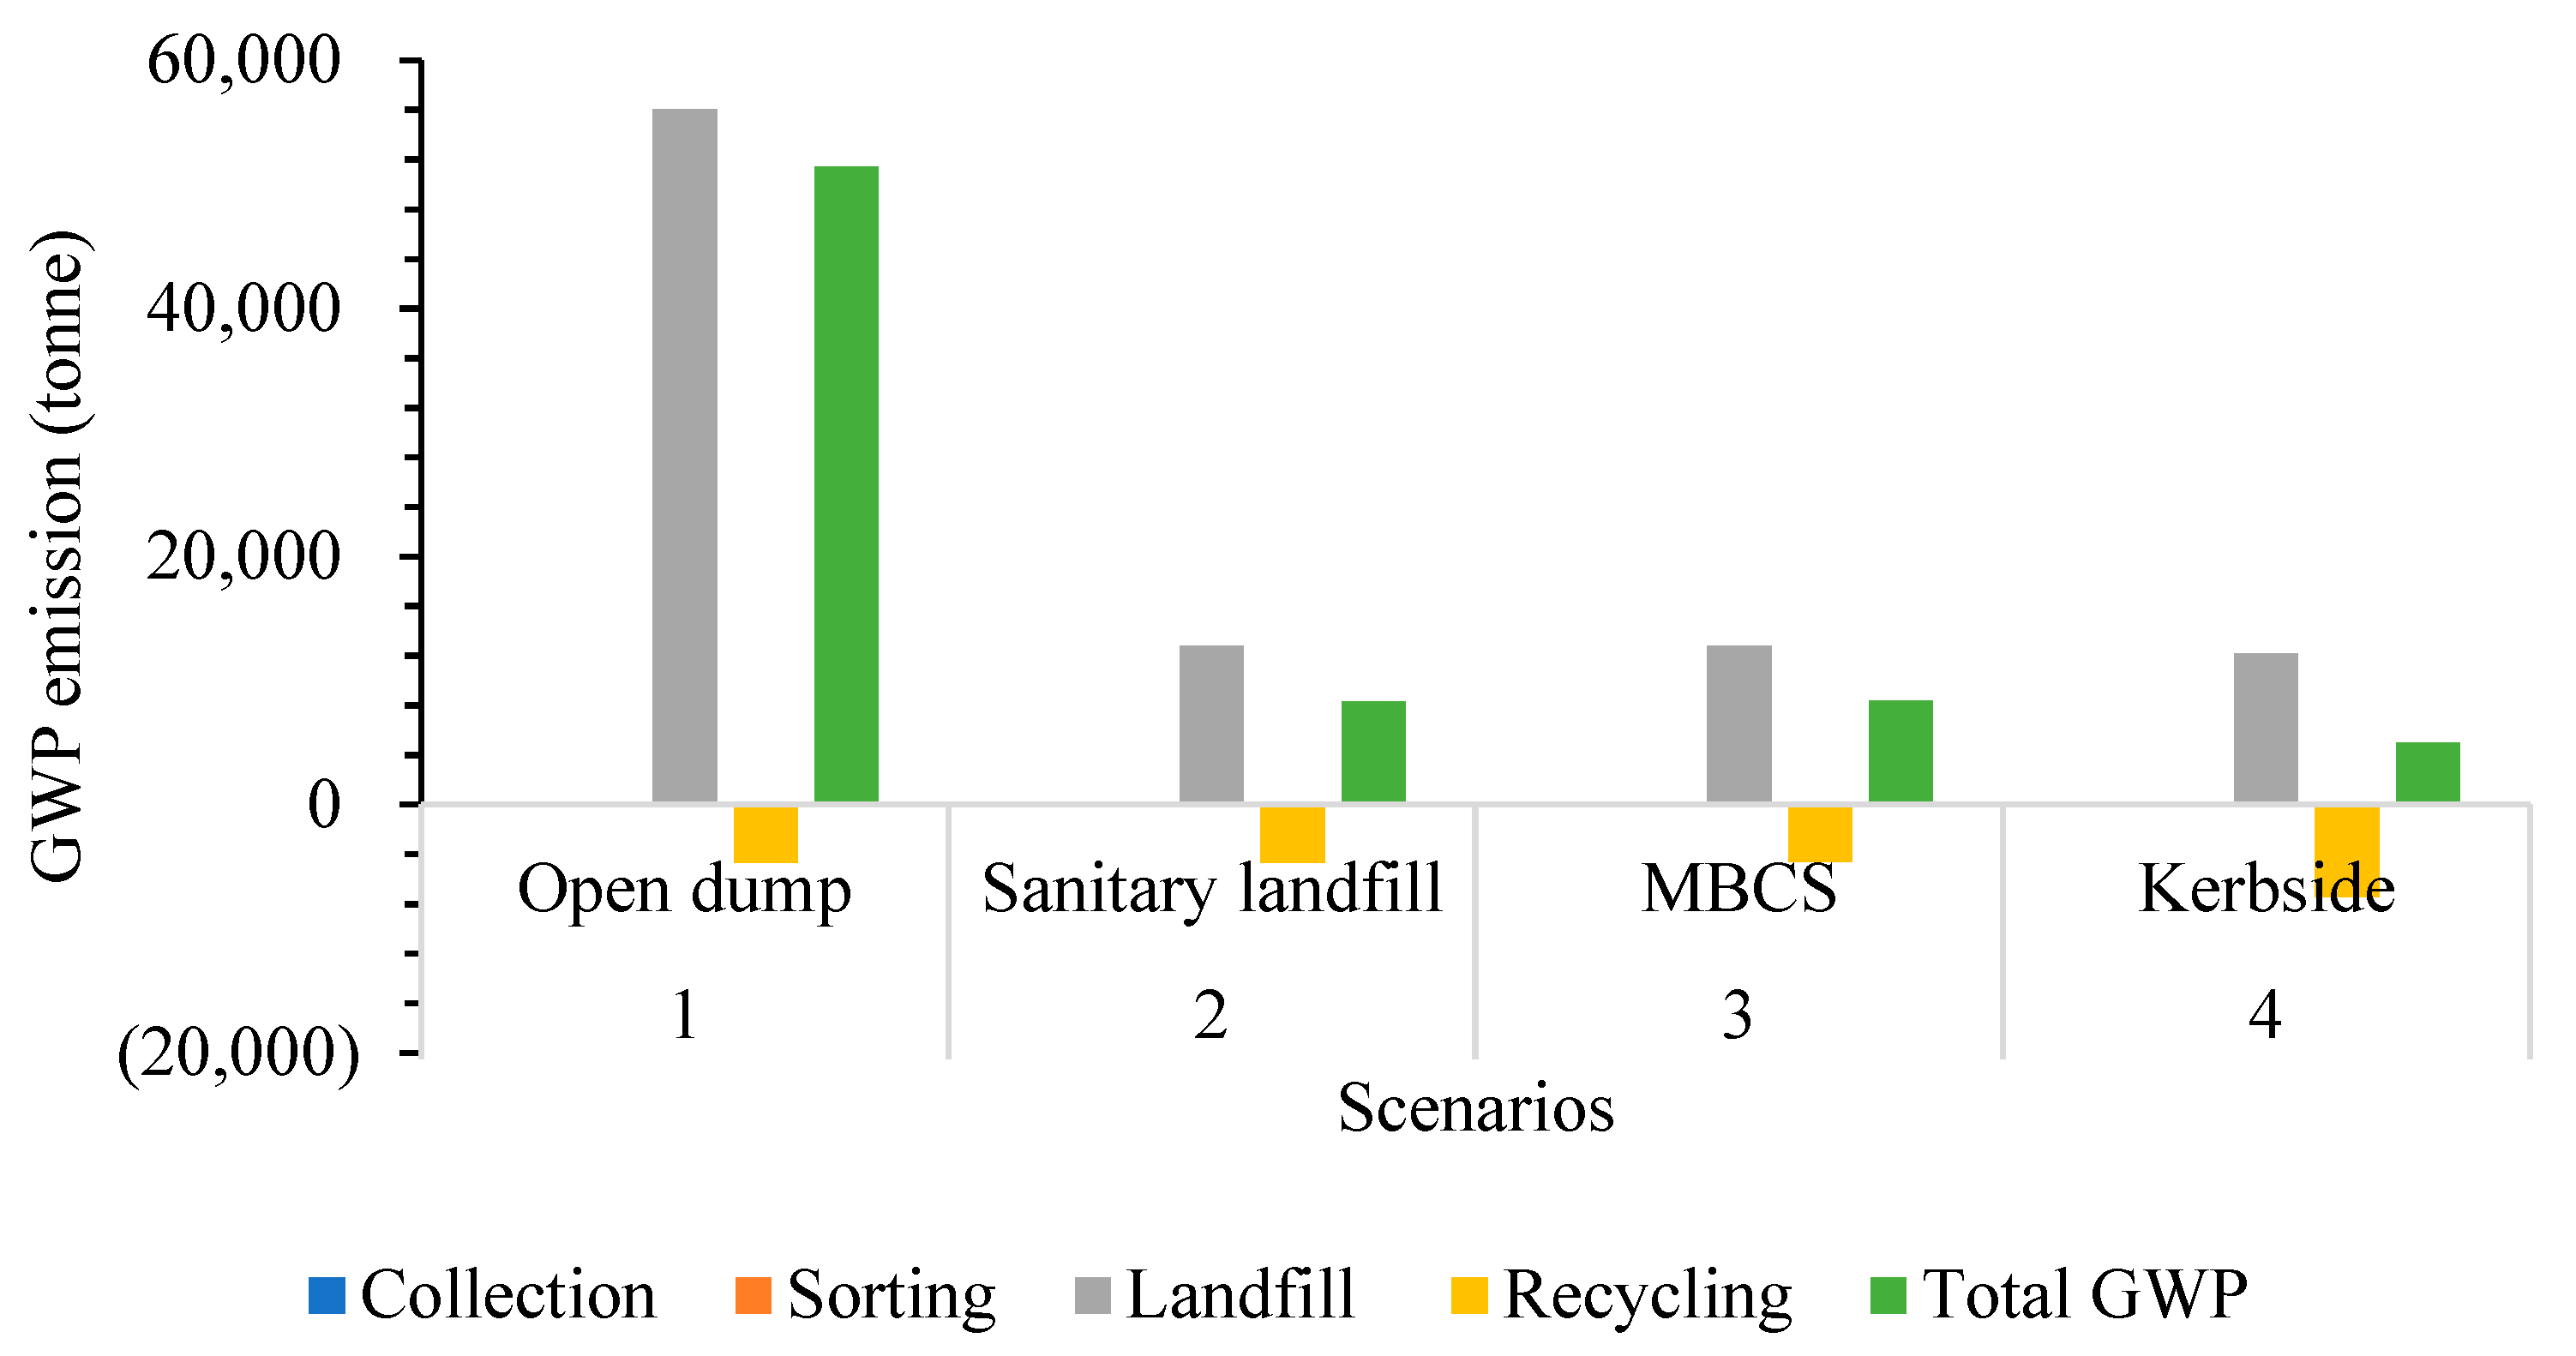
3.2.3. Comparative Assessment of the Global Warming Potential (GWP) of All Four Scenarios

The GWP values comprise carbon dioxide (CO2eq ), nitrous oxide (N2O), and methane (CH4), which are the most potent components. It is calculated from the carbon dioxide equivalents (over a 100-year time horizon) to evaluate air pollution. Figure 10 represents the result of the comparative analysis of GWP from all four scenarios. The result shows that scenario 4 (kerbside system) had the lowest GWP emissions (4967 tons). This result signifies that the kerbside system poses less danger to the environment when compared with the other scenarios.

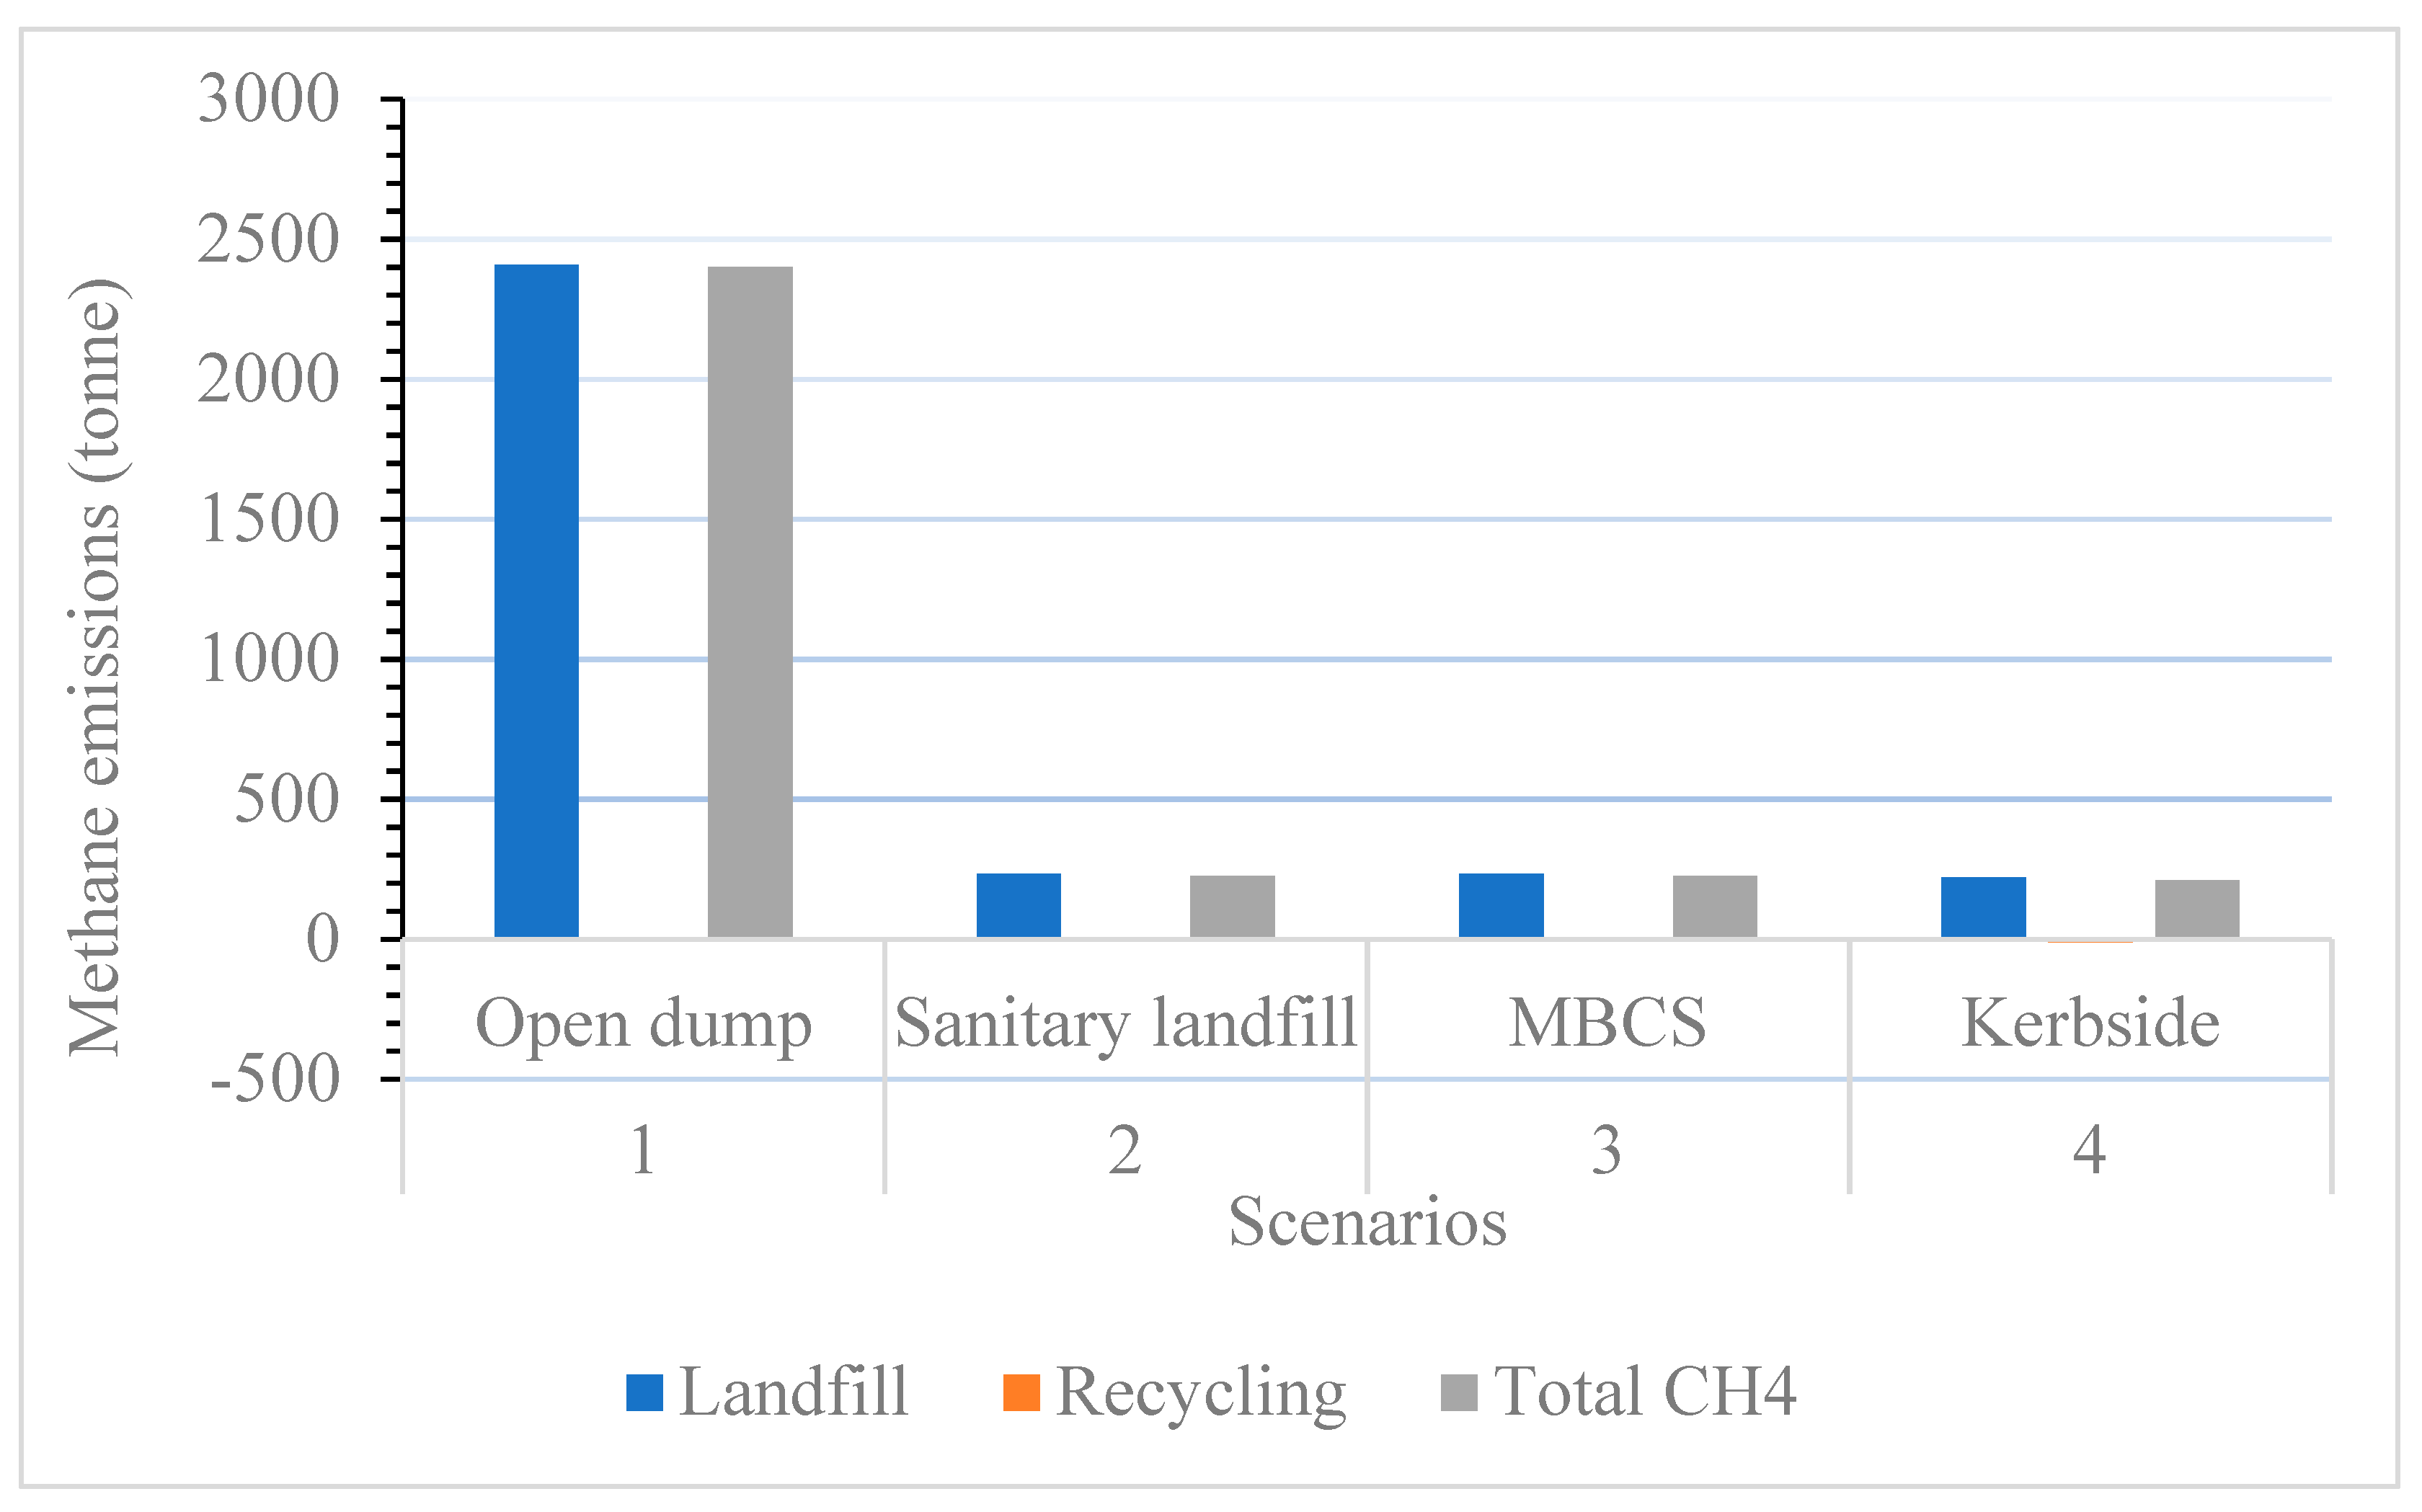
3.2.4. Methane (CH4) Emission Assessment from All Four Scenarios

Rising methane emissions are a key factor in the increasing global greenhouse gas levels. It is the major contributor to ozone formation at ground level, and is considered a hazardous air pollutant that causes several deaths annually. Figure 11 displays the result of the comparative assessment of methane emission from all four scenarios. From the graph, scenario 1 (open dump) has the highest methane emission (2401 tons) since all the generated waste was transported to the landfill. Therefore, this becomes the worst-case scenario.

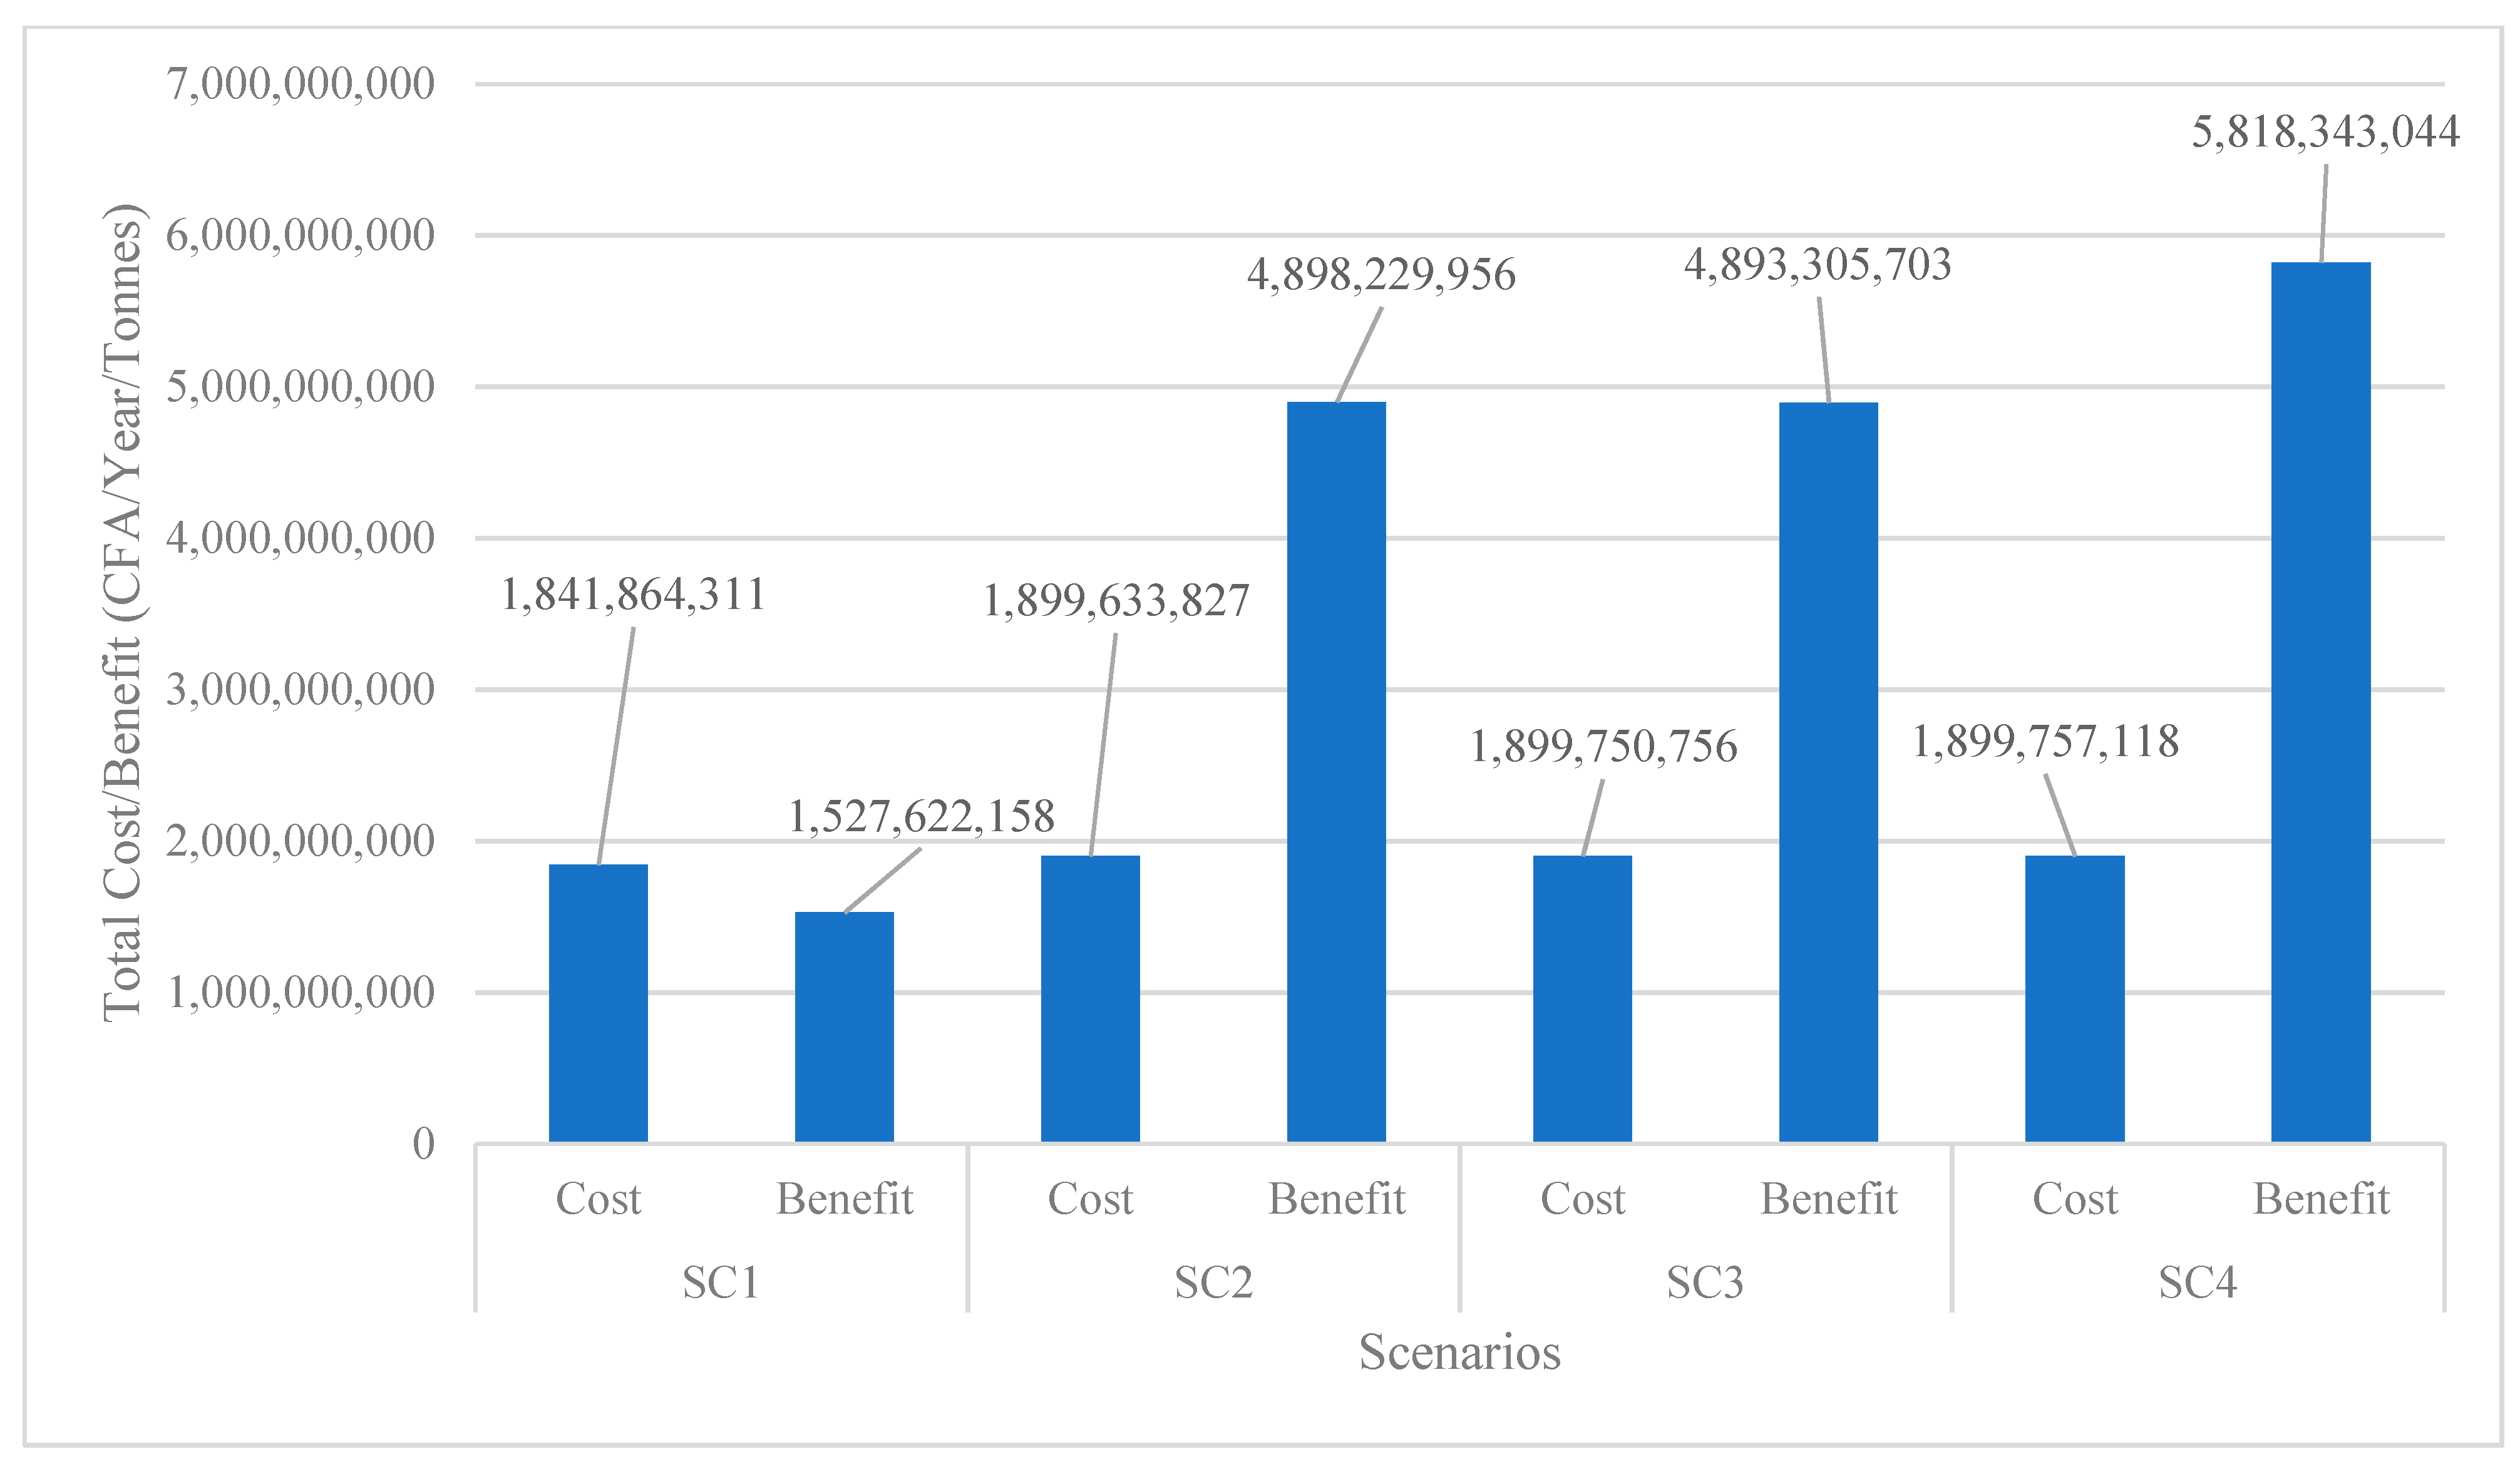
3.3. Cost–Benefit Analysis

Anyama is a small city in Abidjan, the economic capital of Cote d’Ivoire. The municipality’s tax for household waste is considered income because every household connected to the official electricity company must pay depending on their voltage. The average overall tax collected for household waste for Anyama is about 1,155,404.16 million West African CFA francs per year, using the 2019 household data for Anyama. Details of the cost–benefit scenario are presented in Table 3.
The selling of the recyclable items, the external cost, and the benefit operationally do not exist in this scenario 1. Therefore, considering them as assumptions contributes to evaluating the system and giving perspectives for further actions to be added and implemented for this waste treatment. Table 4 presents the cost–benefit analysis of scenario 2.
The selling of recyclable items, especially organic and plastic, was considered an external benefit due to their significant presence in the waste collected in Anyama. Food waste, which represents about 49% of the total waste collected in Anyama, can be used as raw material to produce biogas to support the country’s electricity production. Plastic waste presents potential opportunities for the country. In partnership with the Colombian social enterprise Conceptos Plasticos, UNICEF announced the establishment of a factory that will convert plastic waste collected in Côte d’Ivoire into modular plastic bricks [36]. The easy-to-assemble, durable, low-cost bricks will be used to build much-needed classrooms in the West African country. As the world is committed to promoting green cities by promoting a circular economy, waste recycling is necessary to boost municipalities’ benefits and reduce waste management costs. Therefore, we considered them as hypothetically contributing to evaluating the system and giving perspectives for further actions to be added and implemented for this waste treatment. Table 5 presents the cost–benefit analysis of scenario 3 (MBCS).
The MBCS is the system used in Anyama without any recycling option. Adding the waste bank to the collection system with the benefits of the selling item shows an increase in the municipality budget to cover the waste collection. However, the problem relating to the distance remains, as this scenario does not solve the distance problem raised as a concern by the households, having an average of 1 km before arriving at a collection point. Table 6 displays the result from the cost–benefit analysis of scenario 4 (kerbside).
The MBCS is the system used in Anyama without any recycling option. Adding the waste bank to the collection system with the benefits of the selling item shows an increase in the municipality budget to cover the waste collection. However, the problem relating to the distance remains as this scenario does not solve the distance problem raised as a concern by the households, having an average of 1 km before arriving at a collection point. Table 6 displays the result from the cost–benefit analysis of scenario 4 (kerbside).
Kerbside collection is done by the municipality’s collection trucks. This collection system and the proposed waste banks will increase the municipality’s benefit. This could contribute to solving the residents’ problems related to the distance in Anyama. The collectors will collect waste into the waste banks close to the different households. Kerbside collection is an excellent example of encouraging households to actively participate in the waste management and cleaning of the city. This collection system is used in most countries, such as Japan and European countries. Implementing this collection system in Anyama involves investing and constructing basic infrastructures such as road networks. Comparisons of cost and benefit for all scenarios are shown in Table 7 and Figure 12.

4. Discussion

The survey conducted in this paper reveals that households in Anyama have access to waste collection and disposal services. Overall, 97.6% of the respondents confirmed this assertion. Regarding service availability, about 70% of households dispose of their wastes using the current waste collection system. About 20% of the respondents dispose of their waste using illegal dumping, while about 10% paid some pre-collectors (private providers). However, regarding the quality of the waste collection service, 49.74% were satisfied with the waste removal service, while 50% remained unsatisfied with the system; they complained about waste collection frequency. Moreover, 31% complained about waste being collected weekly, while 28% complained about the removal system once every two days. In addition to the collection frequency, complaints relating to the household’s distance to the waste collection points were raised by most households. Most households must walk a distance of 0.5 km before finding a collection point, making them decide to dump their waste by the roadside in open dumps. A distance of 0.5–1.0 km requires about 12.9 minutes from the distance analysis. Therefore (i.e., walking to dispose of waste and walking back home), about 26 minutes is needed for a round trip walk from the collection point. This walking distance is a significant burden, influencing their attitude and unwillingness to spend much time on waste disposal alone.
Inefficient waste disposal control harms municipal well-being, causing air pollution and affecting all ecosystems. Thus, keeping solid waste is dangerous to the population and affects their health, especially children and the natural environment. It can pollute surface and groundwater with organics, nutrients, and sediments [8]. Several studies showed that most households dispose of garbage daily or twice weekly. The evacuation rate varies with the proximity of the disposal site, the food supply, means of transportation, and the garbage collector’s availability. It is clear that households that dispose of their waste daily are closer to the disposal sites, while those living far away dispose of it once, twice, or three times a week. However, according to the UNEP, few households in low-income districts are aware of the harmful effects of garbage on human health [1]. The principal diseases affecting human health are Anopheles mosquitoes causing malaria (one of Africa’s most important causes of death), typhoid fever, diarrhea, etc. This finding confirms that low-income household waste disposal could be linked to the population’s mentality for many urban planners [1].
Univariate analysis showed that malaria is the most common disease in Anyama, with a 73% prevalence rate among households with sick members during the study period. It is followed by ARI (Acute Respiratory Infection 43%) and diarrhea (13%). Malaria is the most common cause of medical consultation and hospitalization in Côte d’Ivoire. It is also responsible for 33% of hospital deaths [29]. It should be noted that this epidemiological profile of Anyama closely resembles that of risky regions in the West African subregion, especially those studied by Sy et al. in Mauritania [37]. They found that among the leading health problems perceived in Nouakchott, malaria came first, followed by respiratory diseases, and finally, diarrheal diseases in third place. Other works showed that the Burkinabe population contracted malaria due to waste [38]. These studies, like other studies, show that these waste-polluted neighborhoods are generally confronted with serious sanitation problems accentuated by poverty.
In Anyama, the level of education shows that one out of two household heads are illiterate (51%). They have a liberal profession (66%) with few possibilities for saving (37%) and integrating a business association (49%). With a poor level of education, it is difficult for a person to integrate socially and culturally into society. The 2015 Living Standards Survey in Côte d’Ivoire gives the prototype of the poor man at the national level: it is “… an uneducated man, exercising a liberal profession with at least four members composing the household…” [39]. The majority of the Anyama samples’ household heads match this profile. Solid waste not efficiently disposed of, collected, and treated, can be a breeding ground for the proliferation of insects and vermin. It can contaminate the air and cause waterborne diseases. A survey conducted by UN-Habitat shows that diarrhea is twice as high in areas where waste is not collected frequently, and acute respiratory infections are six times higher than in areas where the collection is frequent [40].
Providing appropriate skip bins, garbage collection trucks, and other logistics might help reduce environmental hazards by preventing indiscriminate waste dumping, burning, and other waste disposals. An effective solid waste disposal system must handle both the physical (technical) and the social (ethical) aspects (collection, disposal, recycling) and the ‘soft’ governance aspects. In the same line, raising awareness among residents and integrating informal workers are necessary elements for the success of waste management policies [18]. Integrating all stakeholders would allow all players and their interests to be considered in the waste sector. The waste sector benefits from a comprehensive legislative framework, various governmental incentives, and a high awareness from the population. In addition, the waste charge is essential to raise people’s consciousness of the environment and increase their awareness of its dangers. Furthermore, policy development and execution are critical components of solid waste governance and disposal.
The simulation evaluated household behavior is related to the spread of open dump sites in Anyama. With a buffer analysis of 100 m, we found a density of about 61.29 with 76 households in an area of 1.24 sq. km. With 150 m, we obtained a density of about 57.26 with 142 households in an area of 2.48 sq. km. A buffer analysis of 200 m showed a density of about 47.53 with 183 households in an area of 3.85 sq. km. The study discovered a density of 39.7 and 34.887 with 210 homes in a 5.28 sq. km area and 233 households in a 6.68 sq. km area with 250 and 300 m. Most open dumpsites are in high-elevated areas less than 200 m away from the household. Figure 13 confirms that households expect dumping sites around 200 m from their homes. It may not be practical to expect to deliver garbage more than 200 or 300 meters.
Therefore, this study recommends a 200 m radius as a mean value for any official waste collection site. We chose it as the best distance for households to dispose of their wastes based on other social factors such as walking distance and behavior. This result is one of the significant findings of this study. It could be used by urban planners and policymakers worldwide with similar issues to improve waste disposal, collection, and transport efficiency and optimization. Therefore, the study proposes modifying the existing waste collection system, as shown in Figure 14.
The assessment of the four scenarios through integrated waste management software could contribute to achieving this strategic goal. The scenarios were accessed under three criteria: Landfill total volume, Global Warming Potential, and Methane. According to the environmental assessment, comparing SC-1 to SC-4 revealed that scenario four did not contribute significantly to the total CO2eq emitted. There is a reduction equal to 8542 tons of CO2eq if we compare SC-1 with SC-2. This reduction happened due to the lower amount of waste disposal in landfill. This finding is in line with previous research: that the waste bank has the potential value to reduce CO2eq emissions from recyclable items [40]. In order to decrease more CO2eq emissions, the municipality has to implement a policy that supports composting or waste to energy recovery.
Having that policy will reduce the waste disposal to landfills and CO2 eq. In scenarios 2, 3, and 4, the total benefit per ton of waste managed weighs more than the total cost. Thus, it is suggested to establish more waste banks to prevent the increase in cost either by the government (the municipality) or private waste bank companies. Moreover, the municipality of Anyama needs to utilize more waste banks to spend less and gain both environmental and economic benefits. Anyama’s authorities should prioritize waste treatment (kerbside recycling) rather than the three proposed scenarios: Open dump, Sanitary landfill, and Bring Material scenarios, as this approach has a higher total benefit. This can also contribute to the financial issues faced by the municipality in terms of selling recyclable items such as organic waste for compost and plastic bottles for modular bricks. The focus on organic and plastic wastes should be prioritized as they are the most significant component of the study areas’ waste composition, implying that source separation that is not practiced in the study area must be introduced to the households. Thus, the Anyama municipality is advised to conduct awareness and carry out source-separation programs to make recycling facilities viable. Moreover, incentivizing source separation and awareness could lead to more support and progress in efficient waste collection in Anyama.
Furthermore, promoting household waste sorting is needed in Anyama, as most developed countries smoothly optimize the recycling process. This effort requires participation from residents, as recommended by the IMSW theoretical framework used for this study. Inclusive actions coordinated with full support from the municipality need to be undertaken to promote a sustainable waste management program in Anyama. According to studies on waste management, recycling through selling waste from waste banks can reduce waste disposal to landfills and extend the lifetime of landfills, which will affect the investment reduction cost for landfill.

5. Conclusions

This study hopes to bridge a gap by providing insight for further studies on LCA’s use by assessing the means to achieve an efficient and integrated waste management system in Anyama and Cote d’Ivoire. Moreover, LCA was crucial in selecting the best possible scenario to satisfy the objective of this research. The LCA software was used to assess the proposed scenarios and select the appropriate collection system. Scenario 2 (Sanitary landfill) was formulated using scenario 1 (Open dumping) as the baseline scenario. Scenarios 3 and 4 were formulated using scenario two as the baseline scenario. This research reveals that the two components need to be tested to propose the best scenario: the collection method and the type of waste. The use of LCA allows for a more informed decision, and the results can be reliable with the use of a waste characterization study.
Coupled with GIS analysis, a reasonable and feasible solution can be proposed. The study highlights the importance of LCA software as a critical tool to be adopted by technical experts and policymakers to analyze solid waste management infrastructure. Furthermore, LCA software is essential for designing an integrated solid waste management system for Anyama. Using waste banks reduces emissions from fuel consumed by the collection and transportation steps. Scenario 4 (kerbside collection) resulted in a similar CO2eq and GWP emissions reduction. Considering the environmental and economic aspects, the kerbside collection is preferable for implementation in Anyama. This waste management should be followed by educating the residents on the importance of sorting waste from home and putting together all recyclable waste.
In this study, we found that the current waste management system in Anyama contributes to an increase in total emissions and that the solid waste management systems in Cote d’Ivoire are not designed to achieve an integrated management system. Therefore, the system needs to be restructured to allow for the feasibility of a sustainable solid management system. Additionally, existing structures, such as traditional systems, should be utilized for awareness programs and drive support.

Policy Recommendation

Considering this study, Cote d’Ivoire is recommended to update the policies and legislation to reflect the current solid waste management situation. Additionally, due to the government’s dependence and the relatively low results observed during the study, more investment should be placed on organic and plastic waste treatment. The recommendations support the cost–benefit analysis studies on large-scale recycling suited for organic and plastic waste. Moreover, the municipality of Anyama is encouraged to carry out waste characterization surveys and establish and maintain databases. Furthermore, more solid waste studies with a GIS component are recommended.
Additionally, there is also a need to facilitate the solid waste management programs currently being conducted in an integrated manner being meticulous in the connectivity of stakeholders. Similarly, Anyama city is recommended to establish a robust financial system to recover debts while ensuring sustainable finance for solid waste projects. Additionally, an increase in collection rate to 3 to 4 days a week is recommended. Moreover, the study area is recommended to carry out a source-separation program to facilitate recycling and treatment facilities. More solid waste programs must be implemented to encourage the community to invest in separating waste. Existing community groups such as youth, religions, broadcasting channels, and schools allow for general information.
Furthermore, to aid source separation programs, a kerbside collections system built up by several waste banks is recommended for the study area to collect recyclable items. At the same time, organic and plastic wastes are recommended for collection through separate collections. Due to the high organic waste composition and its positive scenario results, composting and bio gasification are proposed as feasible alternatives for the municipality of Anyama. Policymakers should use Life Cycle Assessment to assess the feasibility of the projects, including achieving the goal of a sustainable integrated solid waste management system for the government. Thus, this study’s methodology and results aimed to accomplish a qualitative, quantitative, and practical analysis of the proposed scenarios suitable for Anyama. This paper demonstrated that integrated solid waste management is not being carried out in Anyama. However, it can be accomplished. The institutional, organizational, and appropriate technologies and related studies must be undertaken to design a sustainable and inclusive waste system.
This study did not consider the site suitability analysis. Thus, this study can be further improved by performing a site suitability analysis using Arc GIS techniques. This analysis would contribute identifying sensitives areas and selecting suitable areas for landfilling and optimizing the waste collection system in Anyama and in Cote d’Ivoire.

Author Contributions

Conceptualization, H.K.K.; methodology, H.K.K., T.M. and M.O.; software, H.K.K.; validation, H.K.K., T.M. and M.O.; formal analysis, H.K.K.; investigation, H.K.K.; resources, H.K.K.; data curation, M.O., T.M. and H.K.K.; writing original draft preparation, H.K.K.; writing review and editing, H.K.K. and M.O.; visualization, H.K.K.; supervision, M.O.; project administration, H.K.K.; funding acquisition, H.K.K. All authors have read and agreed to the published version of the manuscript.

Funding

The author received no funding for this work.

Institutional Review Board Statement

Not applicable.

Informed Consent Statement

Not applicable.

Data Availability Statement

Not applicable.

Acknowledgments

We are grateful to all contributors, especially Yabar Mostacero Helmut Friedrich, for assisting as academic supervisors and for Aba Emmanuel’s continual assistance and support.

Conflicts of Interest

The authors declare no conflict of interest.

References

  1. Bindra, S.; Scanlon, X.C.; United Nations Environment Programme. UNEP Annual Report 2009 Seizing the Green Opportunity; United Nations Environment Programme (UNEP): Nairobi, Kenya, 2010; ISBN 978-92-807-3071-5. [Google Scholar]
  2. Coffey, M.; Coad, A. Collection of Municipal Solid Waste in Developing Countries; UN-HABITAT: Nairobi, Kenya, 2010; ISBN 978-92-1-132254-5. [Google Scholar]
  3. Zhou, S.; Hursthouse, A. The Impact of Physical Properties on the Leaching of Potentially Toxic Elements from Antimony Ore Processing Wastes. Int. J. Environ. Res. Public Health 2019, 16, 2355. [Google Scholar] [CrossRef] [PubMed] [Green Version]
  4. Jalal, S.M.; Akhter, F.; Abdelhafez, A.I.; Alrajeh, A.M. Assessment of Knowledge, Practice and Attitude about Biomedical Waste Management among Healthcare Professionals during COVID-19 Crises in Al-Ahsa. Healthcare 2021, 9, 747. [Google Scholar] [CrossRef] [PubMed]
  5. Ghafourian, K.; Kabirifar, K.; Mahdiyar, A.; Yazdani, M.; Ismail, S.; Tam, V.W.Y. A Synthesis of Express Analytic Hierarchy Process (EAHP) and Partial Least Squares-Structural Equations Modeling (PLS-SEM) for Sustainable Construction and Demolition Waste Management Assessment: The Case of Malaysia. Recycling 2021, 6, 73. [Google Scholar] [CrossRef]
  6. Abalansa, S.; El Mahrad, B.; Icely, J.; Newton, A. Electronic Waste, an Environmental Problem Exported to Developing Countries: The GOOD, the BAD and the UGLY. Sustainability 2021, 13, 5302. [Google Scholar] [CrossRef]
  7. Gaillochet, C.; Chalmin, P.; Lacoste, E. From Waste to Resource: World Waste Survey 2009; Economica: Paris, France, 2009; ISBN 978-2-7178-5768-9. [Google Scholar]
  8. Hogrewe, W.; Steven, D.J.; Eduardo, A.P. The Unique Challenges of Improving Peri-Urban Sanitation; Prepared for the Office of Health, Bureau for Research and Development, U.S. Agency for International Development, under WASH Task No. 339; Water and Sanitation for Health Project (WASH): Arlington, VA, USA, 1993; p. 72. [Google Scholar]
  9. Hotchkiss, J.L.; Rupasingha, A.; Watson, T. In-Migration and Dilution of Community Social Capital. Int. Reg. Sci. Rev. 2022, 45, 36–57. [Google Scholar] [CrossRef]
  10. Moussa, C.; Tuo, P.; Ake-Awomon, D.F. Ordures ménagères, eaux usées et santé de la population dans la ville de Daloa (Centre-ouest de la Côte d’Ivoire). IGT 2018, 1, 46–65. [Google Scholar]
  11. Athanase, A.A. Crisis of Management of Household Waste in Abidjan, The Answer of the Informal Private Pre-collectors in the Municipality of Yopougon (Cote d’Ivoire). GEP 2016, 4, 58–71. [Google Scholar] [CrossRef] [Green Version]
  12. Godfrey, L.; Ahmed, M.T.; Gebremedhin, K.G.; Katima, J.H.; Oelofse, S.; Osibanjo, O.; Richter, U.H.; Yonli, A.H. Solid Waste Management in Africa: Governance Failure or Development Opportunity? In Regional Development in Africa; Edomah, N., Ed.; IntechOpen: London, UK, 2020; ISBN 978-1-78985-237-0. [Google Scholar]
  13. Debrah, J.K.; Teye, G.K.; Dinis, M.A.P. Barriers and Challenges to Waste Management Hindering the Circular Economy in Sub-Saharan Africa. Urban Sci. 2022, 6, 57. [Google Scholar] [CrossRef]
  14. Japan International Cooperation Agency. The Project for the Development of the Urban Master Plan in Greater Abidjan (SDUGA) Final Report 2015. Japan Development Institute; International Development Center of Japan Inc.; Asia Air Survey Co., Ltd. Available online: https://openjicareport.jica.go.jp/618/618/618_515_12230611.html (accessed on 31 August 2022).
  15. Japan International Cooperation Agency. Market Research of High Priority Investment Sectors in Côte d’Ivoire; JICA: Tokyo, Japan, 2021; p. 137. Available online: https://www.jica.go.jp/priv_partner/case/field/ku57pq00002azzsv-att/20210514_JICA_compendium_Final_Waste_management_vF.pdf (accessed on 31 August 2022).
  16. Fagariba, C.J.; Song, S. Assessment of Impediments and Factors Affecting Waste Management: A Case of Accra Metropolis. Acad. J. Environ. Sci. 2016, 4, 144–162. [Google Scholar] [CrossRef]
  17. Thomas, R. Gestion des Déchets: Réglementation, Organisation, Mise en Œuvre/Thomas Rogaume,…; Technosup les Filières Technologiques des Enseignements Supérieurs; Ellipses: Paris, France, 2006; ISBN 2-7298-2999-7. [Google Scholar]
  18. Lucie, B.; Pierre, E. Les Enjeux de la Gestion des Dechets a Abidjan. Rapport D’expertise, Master 2 Ingénierie des Services Urbains en Réseaux: Ville en Devenir; Sciences Po Rennes: Rennes, France, 2017. [Google Scholar]
  19. Tuo, P.; Coulibaly, M.; Aké, D.F.E.A.; Tamboura, A.T.; Anoh, K.P. Revue de Géographie, D’aménagement Régional et de Developpement des Suds. Avril 2018. De l’Institut de Géographie Tropicale, République de Côte d’Ivoire. Available online: https://www.retssa-ci.com/pages/Numero7/TOME1/RETSSA-Texte-Int%C3%A9gral-TOME-1-Juillet-2021.pdf (accessed on 31 August 2022).
  20. Yazdani, M.; Kabirifar, K.; Frimpong, B.E.; Shariati, M.; Mirmozaffari, M.; Boskabadi, A. Improving Construction and Demolition Waste Collection Service in an Urban Area Using a Simheuristic Approach: A Case Study in Sydney, Australia. J. Clean. Prod. 2021, 280, 124138. [Google Scholar] [CrossRef]
  21. Babaee Tirkolaee, E.; Goli, A.; Pahlevan, M.; Malekalipour Kordestanizadeh, R. A Robust Bi-Objective Multi-Trip Periodic Capacitated Arc Routing Problem for Urban Waste Collection Using a Multi-Objective Invasive Weed Optimization. Waste Manag. Res. 2019, 37, 1089–1101. [Google Scholar] [CrossRef]
  22. Shadkam, E. Cuckoo Optimization Algorithm in Reverse Logistics: A Network Design for COVID-19 Waste Management. Waste Manag. Res. 2022, 40, 458–469. [Google Scholar] [CrossRef] [PubMed]
  23. Wilson, D.C.; United Nations Environment Programme; International Solid Waste Association. Global Waste Management Outlook; United Nations Environment Programme: Vienna, Austria, 2015; ISBN 978-92-807-3479-9. [Google Scholar]
  24. Wilson, D.C.; Velis, C.A.; Rodic, L. Integrated Sustainable Waste Management in Developing Countries. Proc. Inst. Civ. Eng.—Waste Resour. Manag. 2013, 166, 52–68. [Google Scholar] [CrossRef]
  25. Christine, Y. Waste Management and Recycling in Japan Opportunities for European Companies (SMEs Focus); EU-Japan Centre for Industrial Cooperation: Tokyo, Japan, 2015; p. 142. Available online: https://www.eu-japan.eu/sites/default/files/publications/docs/waste_management_recycling_japan.pdf (accessed on 31 August 2022).
  26. Kojima, M.; Michida, E. (Eds.) International Trade in Recyclable and Hazardous Waste in Asia; Edward Elgar: Cheltenham, UK; Northampton, MA, USA, 2013; ISBN 978-1-78254-785-3. [Google Scholar]
  27. Yoshida, F. The Political Economy of Waste Management in Japan. Econ. J. Hokkaido Univ. 1999, 28, 1–27. [Google Scholar]
  28. Institut National de la Statistique. (INS-SODE) Resultat Definitif RGPH 2014; Institut National de la Statistique: Abidjan, Cote d’Ivoire, 2015. [Google Scholar]
  29. Kouassi, H.K.; Chamara, H.J.; N’DA, A.K.; Mitsuru, O. Implications of Urbanization and Impact of Population Growth on Abidjan City, Cote d’Ivoire. Afr. J. Land Policy Geospat. Sci. 2020, 3, 245–255. [Google Scholar]
  30. ONU-Habitat. Côte D’ivoire: Profil Urbain D’abidjan; HS/056/12E; Programme des Nations Unies pour les Établissement Humains; ISO 14001:2004-certified; UNON, Publishing Services Section: Nairobi, Kenya, 2012; p. 36. [Google Scholar]
  31. Coulibaly, K. Le Commerce de la Kola et le Developpement de la Ville D’anyama; Revue de Géographie Tropi-cale et d’Environnement: Abidjan, Côte D’ivoire, 2010; p. 47. [Google Scholar]
  32. Qiyam, M.B.S.; Laksamana, R.U.; Indriyani, R.; Toru, M. Life cycle assessment and cost benefit analysis of municipal waste management strategies. J. Environ. Sci. Sustainable Dev. 2021, 4. [Google Scholar] [CrossRef]
  33. Bartlett, N.; Coleman, T.; Stephan, S. Putting a Price on Carbon the State of Internal Carbon Pricing by Corporates Globally; CDP Worldwide: London, UK, 2021; p. 24. [Google Scholar]
  34. Piers, F.; Venkatachalam, R.; Paulo, A.; Terje, B.; Richard, B.; David, W.F.; James, H.; Judith, L.; David, C.L.; Gunnar, M.; et al. Changes in Atmospheric Constituents and in Radiative Forcing; Contribution of Working Group I to the Fourth Assessment Report of the Intergovernmental Panel on Climate Change; Solomon, S., Qin, D., Manning, M., Chen, Z., Marquis, M., Averyt, K.B., Tignor, M., Miller, H.L., Eds.; Cambridge University Press: Cambridge, UK; New York, NY, USA, 2007; p. 234. [Google Scholar]
  35. Hylton, K.N. Tort Law: A Modern Perspective; Cambridge University Press: New York, NY, USA, 2016; ISBN 978-1-107-12532-2. [Google Scholar]
  36. UNICEF Breaks Ground on Africa’s First-of-Its-Kind Recycled Plastic Brick Factory in Côte d’Ivoire; Innovative Partnership, Factory Will Produce Plastic Bricks to Build Classrooms for Children. Unicef: Côte d’Ivoire, 2019. Available online: https://www.unicef.org/press-releases/unicef-breaks-ground-africas-first-its-kind-recycled-plastic-brick-factory-Cote (accessed on 31 August 2022).
  37. Sy, I.; Piermay, J.-L.; Wyss, K.; Handschumacher, P.; Tanner, M.; Cissé, G. Gestion de l’espace urbain et morbidité des pathologies liées à l’assainissement à Rufisque (Sénégal). Espace Géographique 2011, 40, 47. [Google Scholar] [CrossRef]
  38. Somé, Y.S.C.; Kangambéga, E.; Béné, A.; Diendéré, I. Les Déterminants Du Choix Des Conteneurs Plastiques Dans La Production Des Plants à Ouagadougou (Burkina Faso): Une Contribution à La Gestion Des Déchets Plastiques. Int. J. Biol. Chem. Sci. 2017, 10, 2637. [Google Scholar] [CrossRef]
  39. Konan, K. Insalubrité, Gestion des Déchets Ménagers et Risque Sanitaire Infanto-Juvénile à Adjamé (Abidjan). Ph.D. Thesis, Université Félix Houphouët-Boigny, Abidjan, Côte d’Ivoire, 2012. [Google Scholar]
  40. WHO. Rapport sur la Salubrité de L’environnement (Carence en Matière D’assainissement: Ampleur du Problème au Niveau Mondiale); WHO: Geneva, Switzerland, 2018; p. 14. [Google Scholar]
Figure 1. Location map of the study area: Anyama.
Sustainability 14 13062 g001
Figure 2. Descriptive map of Anyama topography.
Sustainability 14 13062 g002
Figure 3. Baseline scenario model.
Sustainability 14 13062 g003
Figure 4. Sanitary landfill scenario.
Sustainability 14 13062 g004
Figure 5. The material bank collection systems (The Recycling and Bringing Material scenario).
Sustainability 14 13062 g005
Figure 6. The kerbside recycling system scenario.
Sustainability 14 13062 g006
Figure 7. Household waste characterization in Anyama.
Sustainability 14 13062 g007
Figure 8. The final solid waste of the four scenarios.
Sustainability 14 13062 g008
Figure 9. Comparative total CO2eq emission (in ton) from all four scenarios.
Sustainability 14 13062 g009
Figure 10. Global warming potential (GWP) of all four scenarios.
Sustainability 14 13062 g010
Figure 11. Methane emissions across all four scenarios.
Sustainability 14 13062 g011
Figure 12. Cost–benefit comparison for all scenarios.
Sustainability 14 13062 g012
Figure 13. Average waste distribution distance in Anyama with buffer analysis.
Sustainability 14 13062 g013
Figure 14. Modification of the existing waste collection system to eliminate open dumping.
Sustainability 14 13062 g014
Table 1. Cost–benefit component.
TypeComponentCode
Cost component
Direct cost (Internal)
Operational Cost
Salaries of waste personal
Transfer points
Transportation (fuel)
Landfilling
Operational Cost
Administrative Cost
Others (Additional Cost)
C1
C2
C3
C4
C5
C6
C7
Indirect cost (External)Collection and transport (CO2eq emission)
Collection and transport (CO2eq emission)
Pollution GWP
C8
C9
C10
Benefit component
Direct benefit (internal)Tax for household-refuse removal
Annual budget
Selling Recyclable Items
-Plastic
-Organic
B1
B2
B3
Indirect benefitRecycling (emission CO2eq)
Recycling (emission CH4)
Recycling (emission GWP)
B4
B5
B6
Table 2. Profile and characteristics of Anyama household.
VariableScaleFrequencyPercentage %
GenderMale34190.20
Female379.80
Age Group (Yrs.)≤2541.10
25–5030681.00
>50670.17
Not Answered10.30
Family Size1–2328.50
3–421356.30
5–79625.40
8–10215.60
11–1482.10
>1582.10
Income (CFA) (1 Euro = 653.98 CFA)<100,00022860.30
100,000–200,0007419.60
200,001–300,000307.90
300,001–400,00082.10
500,001–600,00010.30
Refuse to answer379.80
QualificationSecondary11831.20
Tertiary7920.90
Never attended4411.60
Other3910.40
Table 3. Scenario 1 (open dumping and baseline scenario model).
Aspect Cost CFA/Year/TonBenefit CFA/Year /TonTotal CostTotal Benefit
InternalTax for household-refuse removal 1,155,404.16 1,527,622,158
Operation and MaintenanceSalaries of waste personal12,000,000 1,841,864,311
MSWTransfer points112,170,000
Transportation (fuel)13,230,000
Landfilling 1,096,170,213.04
Operational Cost586,694,098.1
Administrative cost18,000,000
Others (Additional cost)3,600,000
Annual budget 1,526,466,753.56
Total 1,841,864,3111,527,622,158
Table 4. Cost–benefit of scenario 2 (Sanitary landfill and existing waste management).
Aspect Cost CFA/Year /TonBenefit CFA/Year /TonTotal CostTotal Benefit
InternalTax for household-refuse removal 1,155,404.16 2,965,522,131
Operation and MaintenanceSalaries of waste personal12,000,000 1,841,864,311
MSWTransfer points112,170,000
Transportation (fuel)13,230,000
Landfilling1,096,170,213.04
Operational Cost586,694,098.1
Administrative cost18,000,000
Others (Additional cost)3,600,000
Annual budget 1,526,466,753.56
Waste BankSelling Recyclable Items
-Plastic
-Organic
162,658,368
1,275,241,605.12
ExternalEnvironmentCollection and transport (CO2eq emission)691,125.76 57,769,516.16
Collection and transport (CH4 emission)24,591,423.36
Pollution GWP32,486,967.04
Recycling (emission CO2eq ) 22,115,892.33 1,932,707,825
Recycling (emission CH4) 1,010,817,673.04
Recycling (emission GWP) 899,774,260.00
Total 1,899,633,8274,898,229,956
Table 5. Cost–benefit scenario 3; Recycling: bringing material: proposed waste treatment.
Aspect Cost CFA/Year /TonBenefit CFA/Year /TonTotal CostTotal Benefit
InternalTax for household-refuse removal 1,155,404.16 2,965,522,131
Operation and MaintenanceSalaries of waste personal12,000,000 1,841,864,311
MSWTransfer points112,170,000
Transportation (fuel)13,230,000
Landfilling1,096,170,213.04
Operational Cost586,694,098.1
Administrative cost18,000,000
Others (Additional cost)3,600,000
Annual budget 1,526,466,753.56
Waste BankSelling Recyclable Items
-Plastic
-Organic
162,658,368
1,275,241,605.12
ExternalEnvironmentCollection and transport (CO2eq emission)808,085.51 57,886,445.43
Collection and transport (CH4 emission)24,591,423.36
Pollution GWP32,486,936.56
Recycling (emission CO2eq ) 22,047,143.44 1,927,783,572
Recycling (emission CH4) 1,008,725,561.76
Recycling (emission GWP) 897,010,866.30
Total 1,899,750,7564,893,305,703
Table 6. Cost–benefit scenario 4, Recycling: kerbside collection: proposed waste treatment.
Aspect Cost CFA/Year /TonBenefit CFA/Year /TonTotal CostTotal Benefit
InternalTax for household-refuse removal 1,155,404.16 2,965,522,131
Operation and MaintenanceSalaries of waste personal12,000,000 1,841,864,311
MSWTransfer points112,170,000
Transportation (fuel)13,230,000
Landfilling1,096,170,213.04
Operational Cost586,694,098.1
Administrative cost18,000,000
Others (Additional cost)3,600,000
Annual budget 1,526,466,753.56
Waste BankSelling Recyclable Items
-Plastic
-Organic
162,658,368
1,275,241,605.12
ExternalEnvironmentCollection and transport (CO2eq emission)808,085.51 57,892,807.16
Collection and transport (CH4 emission)24,591,423.36
Pollution GWP32,486,936.56
Recycling (emission CO2eq ) 35,355,474.16 2,852,820,913
Recycling (emission CH4) 1,388,848,770.68
Recycling (emission GWP) 1,428,616,667.77
Total 1,899,757,1185,818,343,044
Table 7. Comparison of cost and benefit for all scenarios.
CodeSC1SC2SC3SC4
CostBenefitCostBenefitCostBenefitCostBenefit
B1-1,155,404.16-1,155,404.16-1,155,404.16-1,155,404.16
C112,000,000-12,000,000-12,000,000-12,000,000-
C2112,170,000-112,170,000-112,170,000-112,170,000-
C313,230,000-13,230,000-13,230,000-13,230,000-
C41,096,170,213.04-1,096,170,213.04-1,096,170,213.04-1,096,170,213.04-
C5586,694,098.1-586,694,098.1-586,694,098.1-586,694,098.1-
C618,000,000-18,000,000-18,000,000-18,000,000-
C73,600,000-3,600,000-3,600,00-3,600,000-
B2---1,526,466,753.56-1,526,466,753.56-1,526,466,753.56
B3---1,437,899,973-1,437,899,973-1,437,899,973
C8--691,125.76-24,591,423.36-808,085.51-
C9--24,591,423.36-24,591,423.36-24,591,423.36-
C10--32,486,967.04-32,486,936.56-32,486,936.56-
B4---22,115,892.33-22,047,143.44-35,355,474.16
B5---1,010,817,673.04-1,008,725,561.76-1,388,848,770.68
B6---899,774,260.00-897,010,866.30-1,428,616,667.77
Total CFA/year/Ton1,841,864,3111,527,622,1581,899,633,8274,898,229,9561,899,750,7564,893,305,7031,899,757,1185,818,343,044
Publisher’s Note: MDPI stays neutral with regard to jurisdictional claims in published maps and institutional affiliations.

