
Practical Application of a New Cuffless Blood Pressure Measurement Method

 , , , , , , , ,
  and
and
Abstract
1. Introduction
2. Materials and Methods
2.1. Study Patients
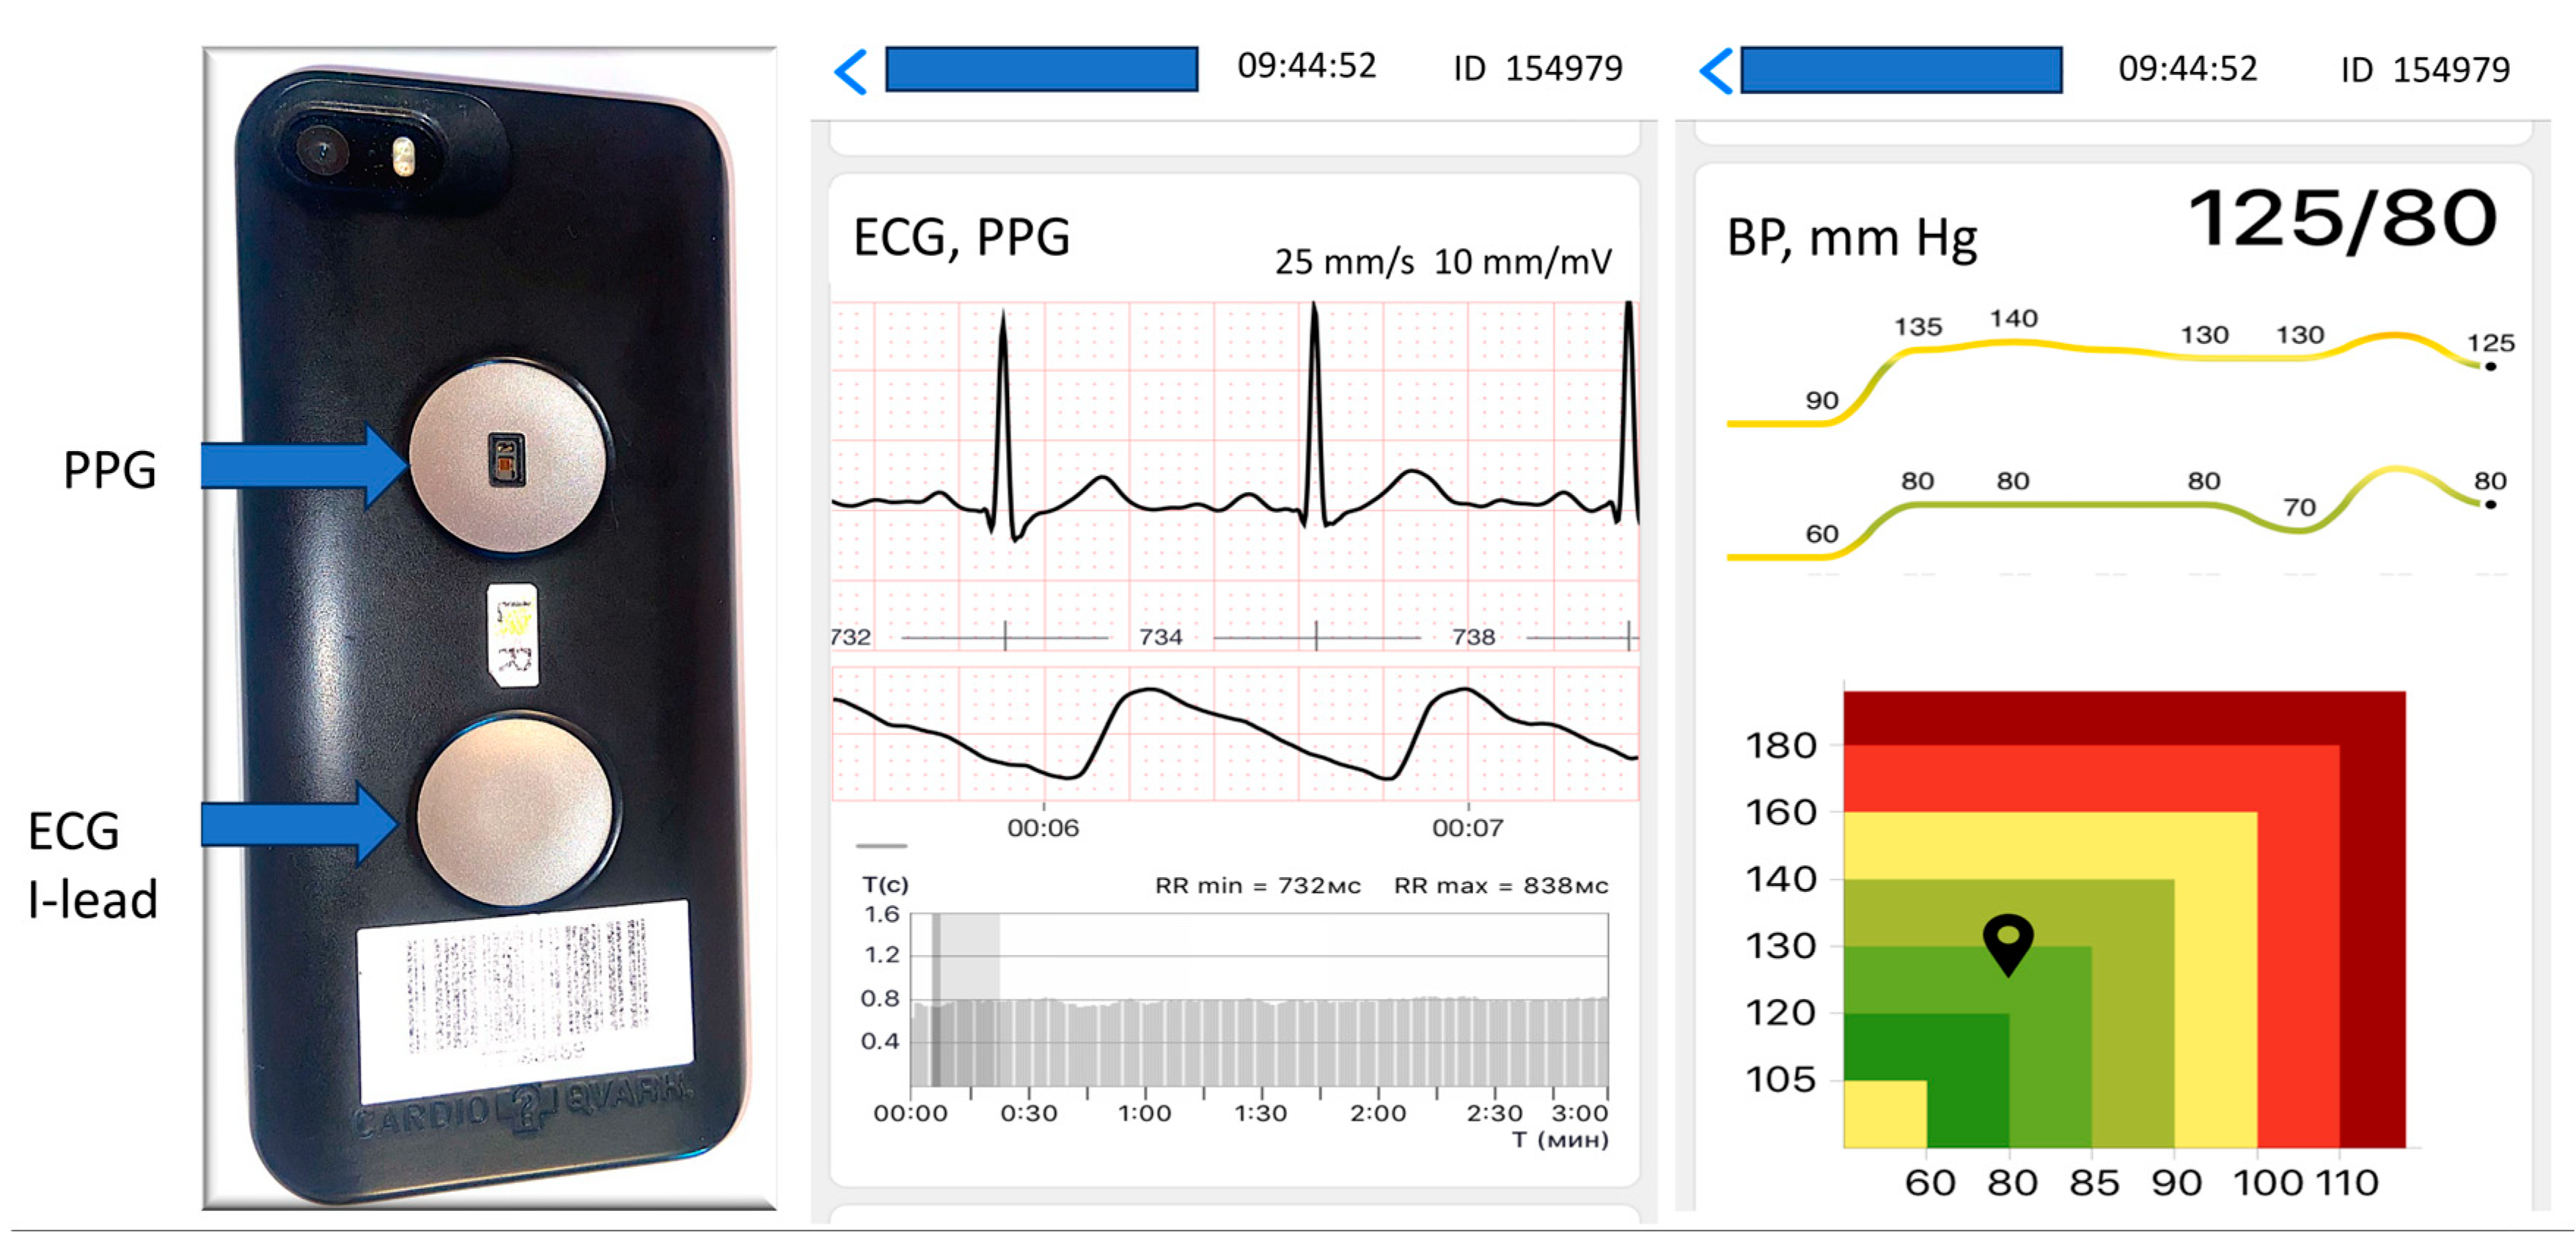
2.2. Blood Pressure Measurement and Data Acquisition
2.3. Statistical Analysis
3. Results
4. Discussion
Limitations
5. Conclusions
Author Contributions
Funding
Institutional Review Board Statement
Informed Consent Statement
Data Availability Statement
Conflicts of Interest
Appendix A

| Mark | Valid, n | Min | Mean ± Standard Deviation | 2.5% | Median and 25/75% | 97.5% | Max |
|---|---|---|---|---|---|---|---|
| SBP Korotkov | 167 | 88 | 130.5 ± 22.94 | 91.15 | 130.0 [114.0; 145.5] | 173.55 | 195 |
| DBP Korotkov | 167 | 55 | 81.51 ± 13.74 | 60 | 81.0 [72.0; 90.0] | 112 | 121 |
| SBP Quark | 167 | 90 | 130.45 ± 22.86 | 93.15 | 130.0 [114.5; 145.0] | 171.7 | 201 |
| DBP Quark | 167 | 56 | 80.5 ± 12.63 | 60 | 80.0 [72.0; 85.5] | 109.85 | 120 |
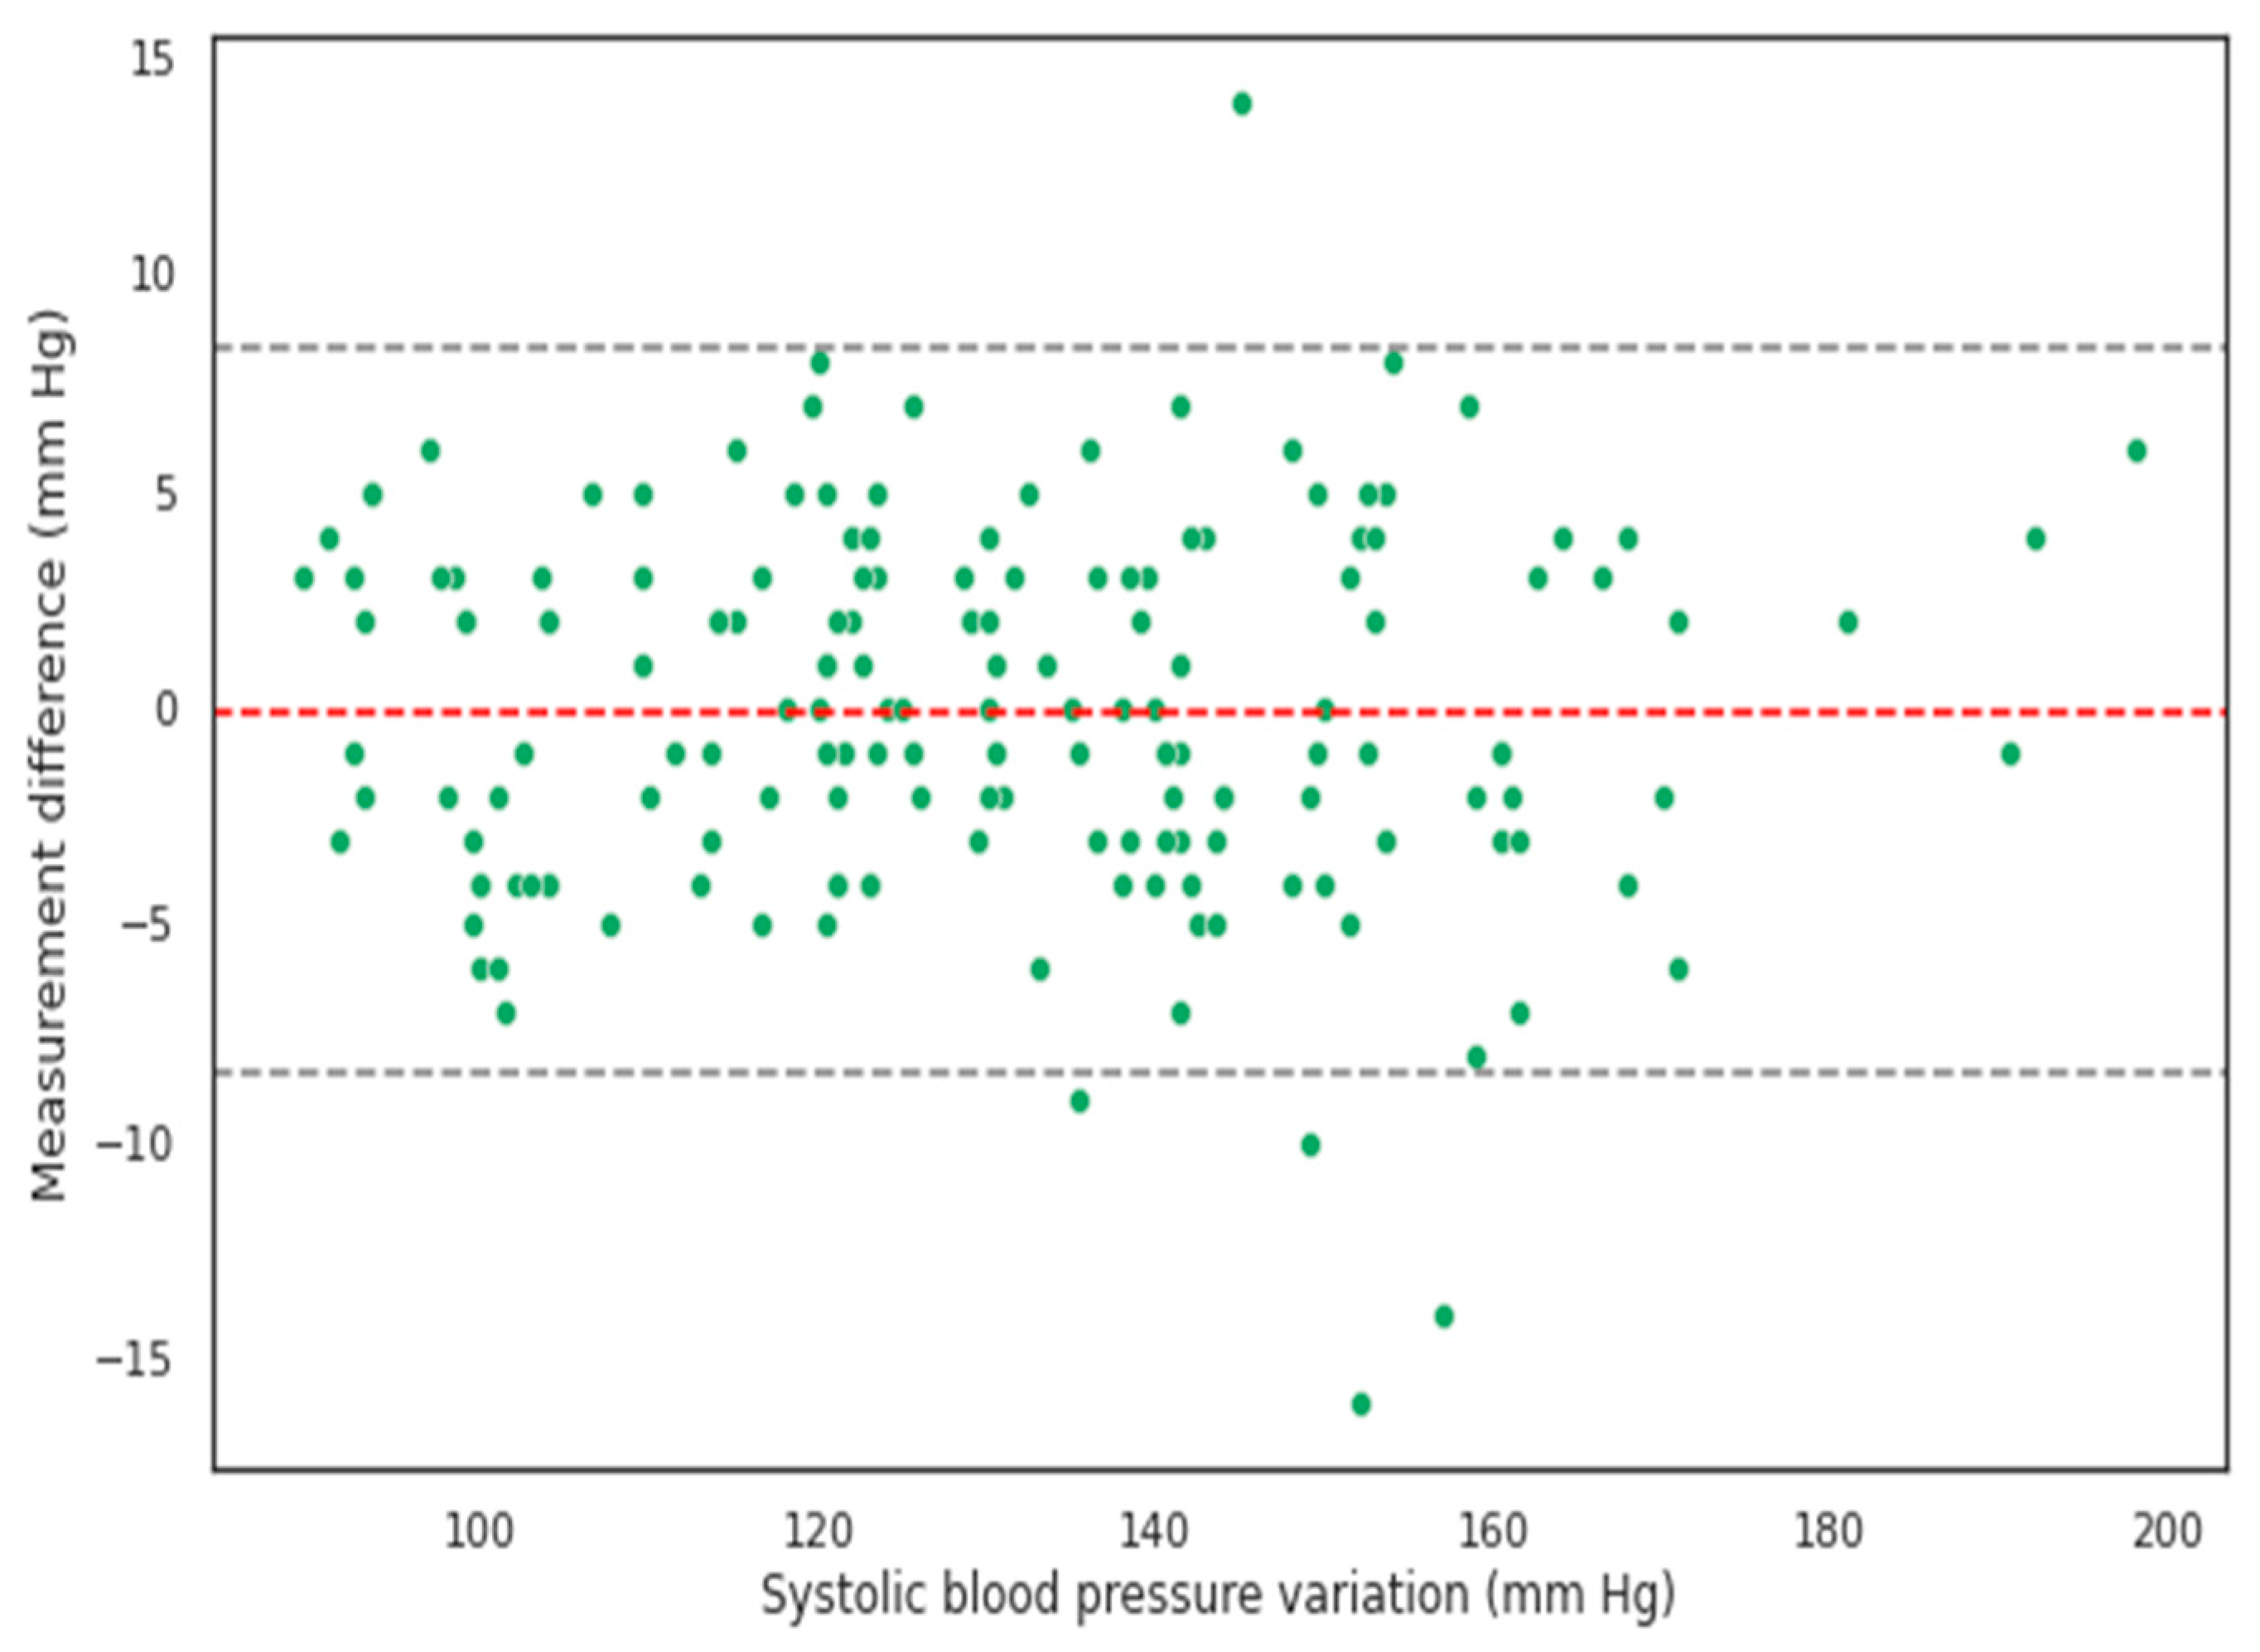
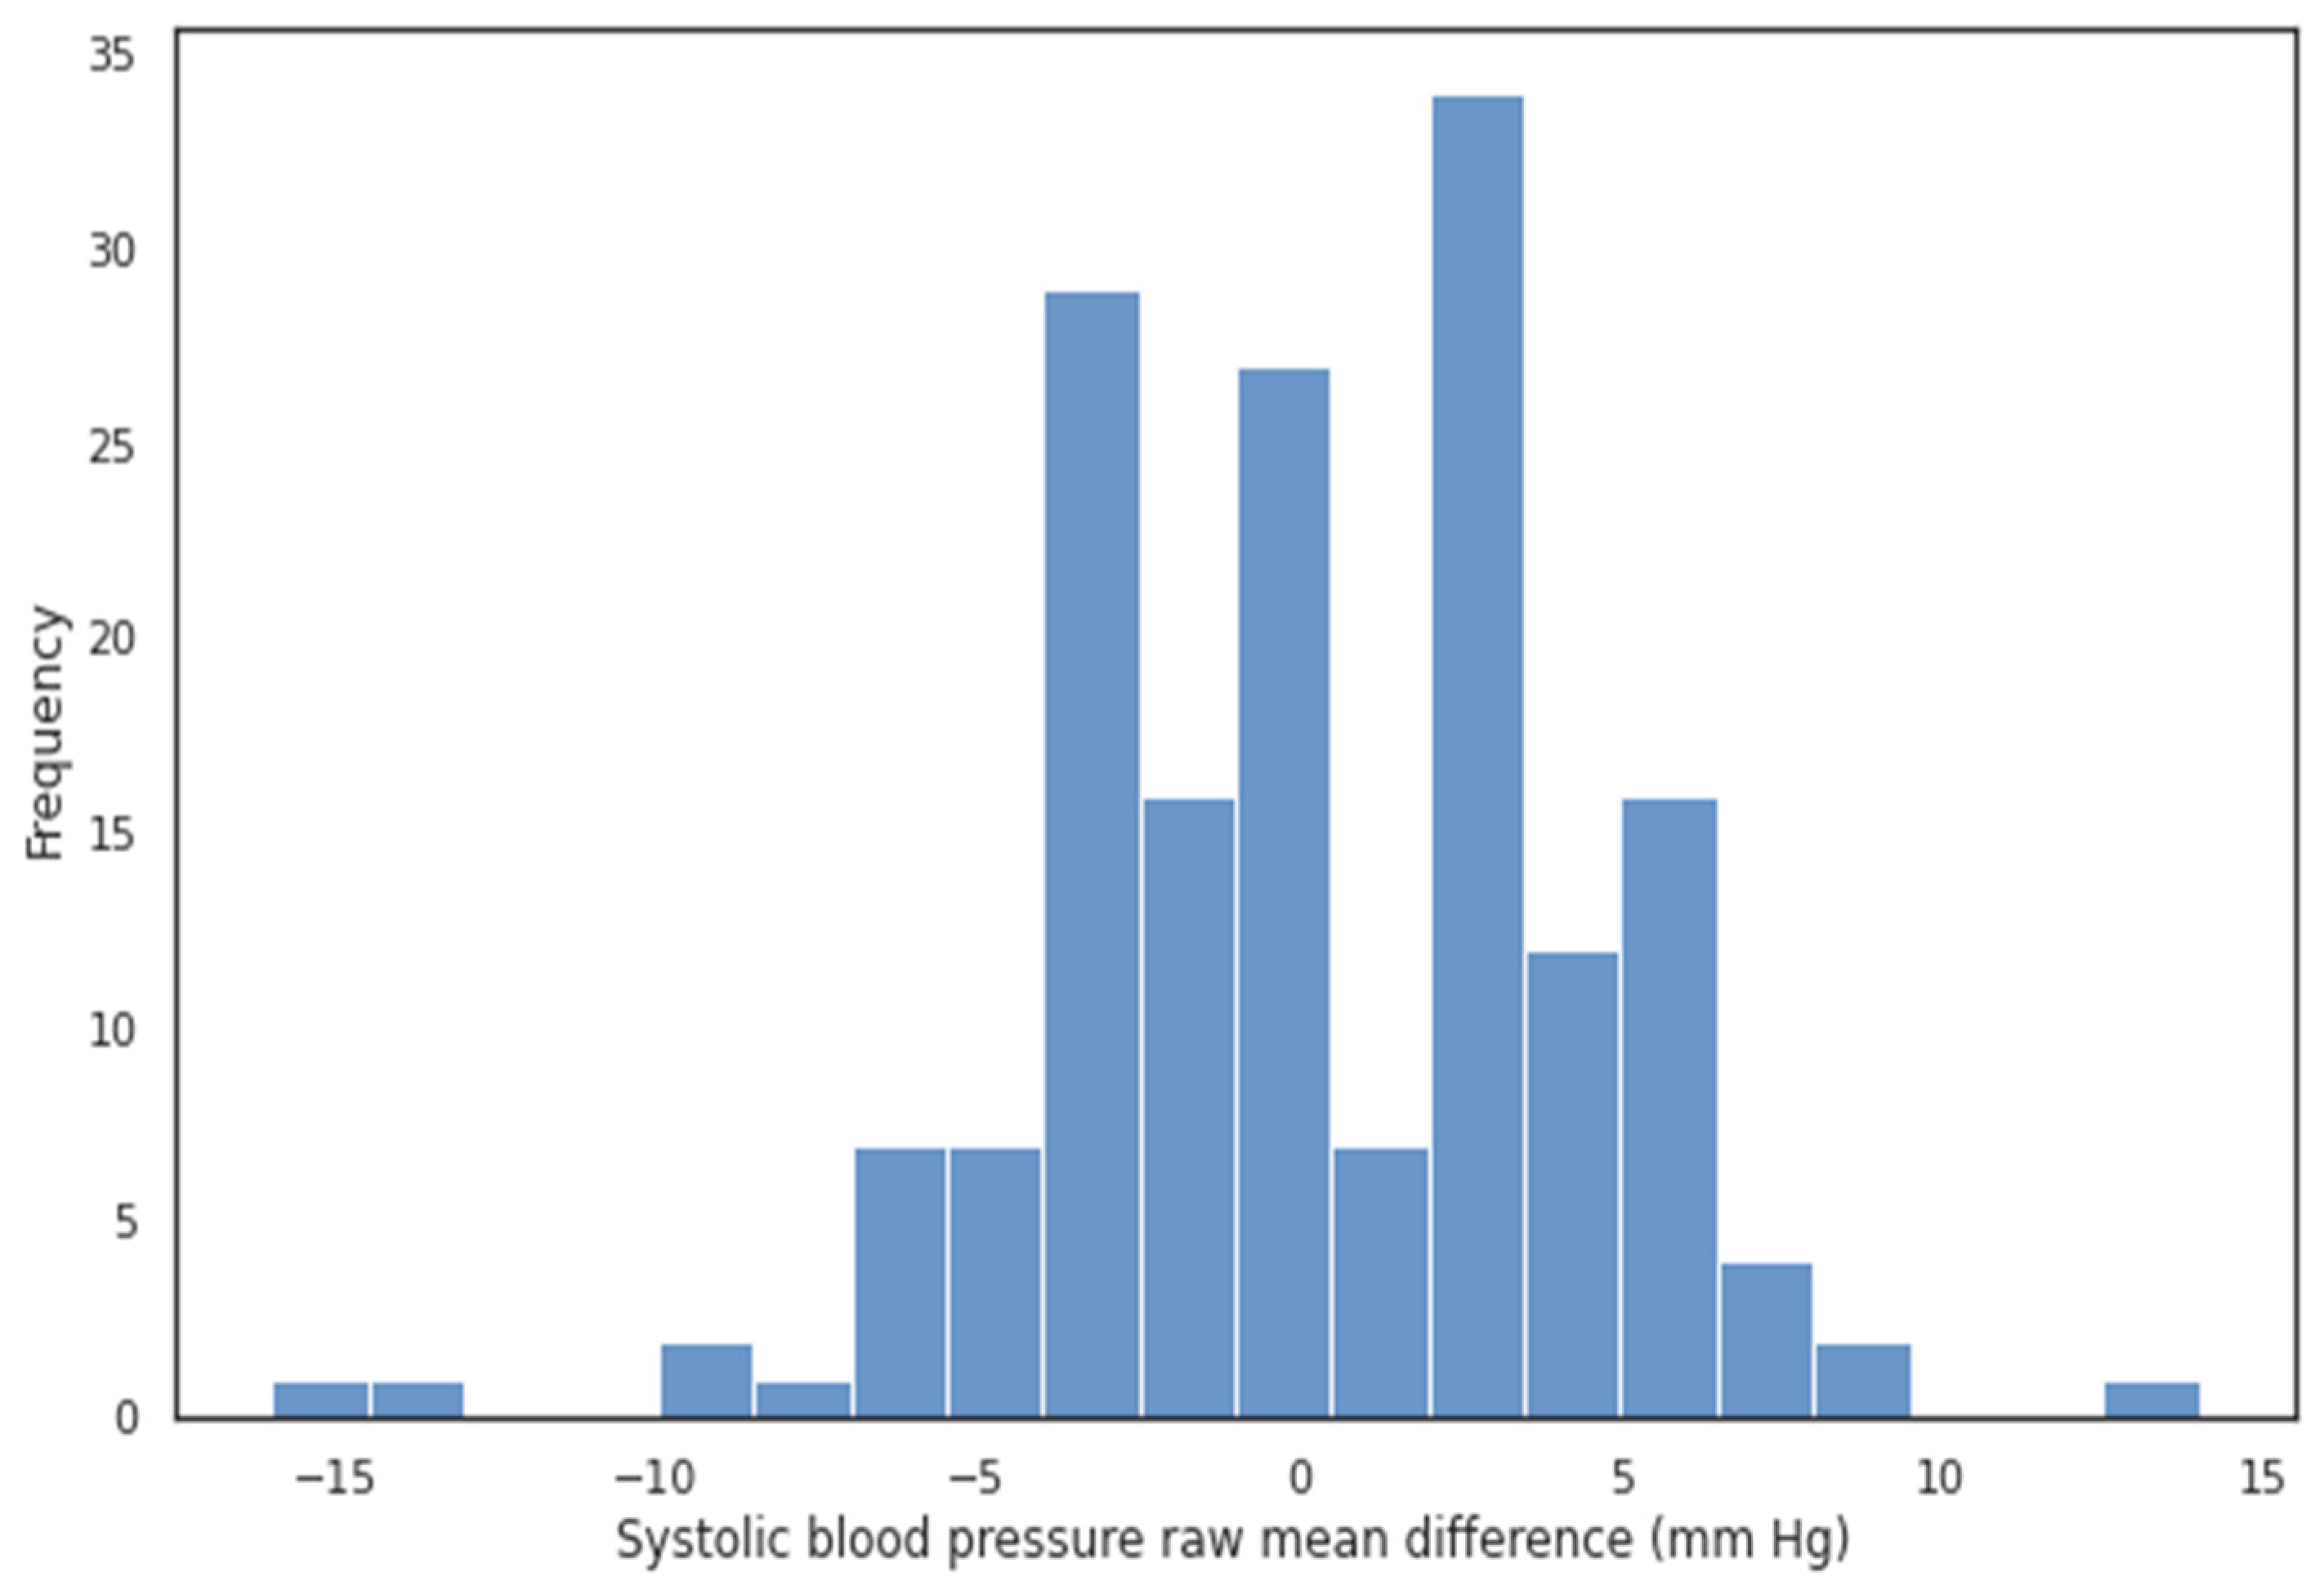
| MD SBP | 167 | −16 | −0.05 ± 4.25 | −7.85 | 0.0 [−3.0; 3.0] | 7 | 14 |
| MAD SBP | 167 | 0 | 3.44 ± 2.5 | 0 | 3.0 [2.0; 4.5] | 8.85 | 16 |
| MAPD SBP | 167 | 0 | 2.68 ± 1.85 | 0 | 2.31 [1.38; 3.46] | 6.64 | 10.14 |
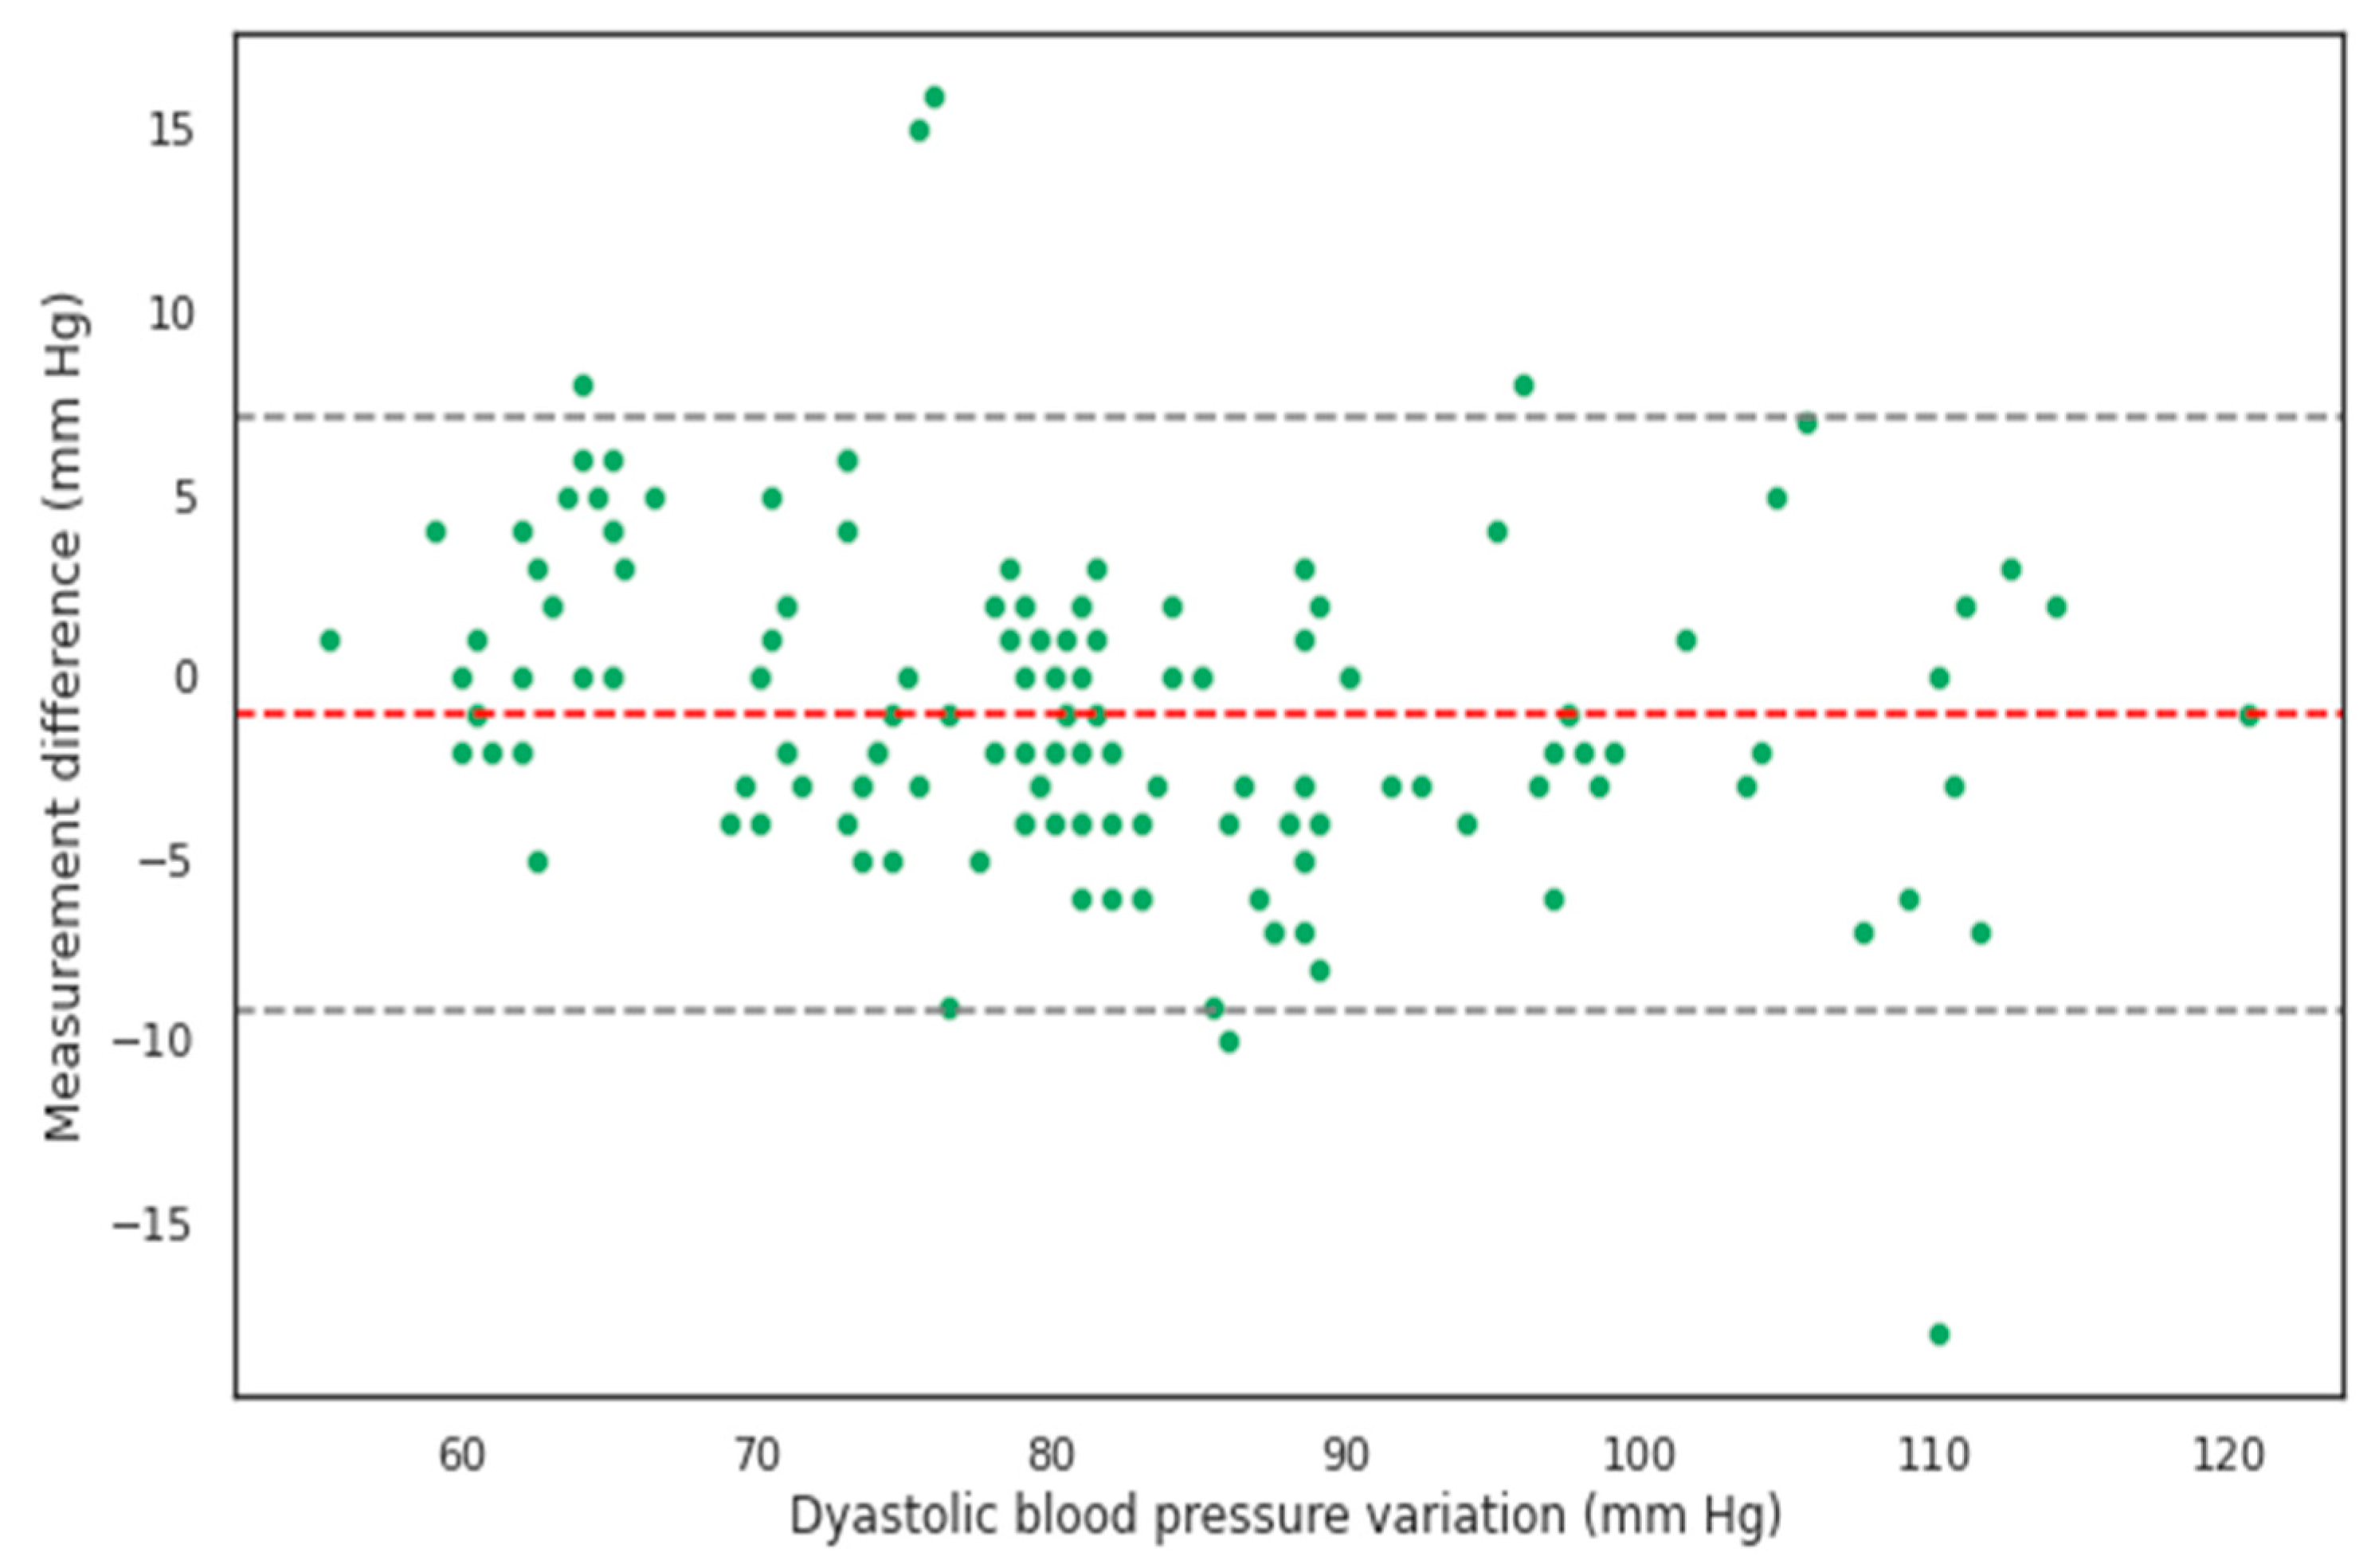
| MD DBP | 167 | −18 | −1.02 ± 4.15 | −7.85 | −1.0 [−3.5; 1.0] | 6.85 | 16 |
| MAD DBP | 167 | 0 | 3.21 ± 2.82 | 0 | 3.0 [1.0; 4.0] | 9 | 18 |
| MAPD DBP | 167 | 0 | 3.97 ± 3.53 | 0 | 3.23 [1.64; 5.49] | 11.09 | 23.53 |
| Mark | Valid, n | Min | Mean ± Standard Deviation | 2.5% | Median and 25/75% | 97.5% | Max |
|---|---|---|---|---|---|---|---|
| SBP Korotkov | 47 | 88 | 103.32 ± 8.24 | 89.3 | 103.0 [97.5; 109.5] | 117.7 | 119 |
| DBP Korotkov | 47 | 55 | 66.06 ± 5.76 | 57.45 | 64.0 [61.5; 70.5] | 76.7 | 77 |
| SBP Quark | 47 | 90 | 103.02 ± 7.91 | 91.15 | 100.0 [97.5; 110.5] | 117.7 | 121 |
| DBP Quark | 47 | 56 | 67.09 ± 5.67 | 59.15 | 67.0 [63.0; 70.5] | 79.4 | 83 |
| MD SBP | 47 | −7 | −0.3 ± 3.64 | −6 | −1.0 [−4.0; 3.0] | 5 | 6 |
| MAD SBP | 47 | 1 | 3.32 ± 1.53 | 1 | 3.0 [2.0; 4.5] | 6 | 7 |
| MAPD SBP | 47 | 0.88 | 3.24 ± 1.51 | 0.9 | 3.12 [1.99; 4.26] | 6.3 | 6.67 |
| MD DBP | 47 | −5 | 1.02 ± 3.92 | −4,85 | 0.0 [−2.0; 4.0] | 7.7 | 15 |
| MAD DBP | 47 | 0 | 3.06 ± 2.64 | 0 | 3.0 [1.0; 4.0] | 7.7 | 15 |
| MAPD DBP | 47 | 0 | 4.66 ± 4.03 | 0 | 3.9 [1.74; 6.58] | 12.81 | 22.06 |
| Mark | Valid, n | Min | Mean ± Standard Deviation | 2.5% | Median and 25/75% | 97.5% | Max |
|---|---|---|---|---|---|---|---|
| SBP Korotkov | 51 | 112 | 126.06 ± 6.68 | 114.5 | 125.0 [121.0; 131.0] | 138 | 138 |
| DBP Korotkov | 51 | 68 | 79.75 ± 4.52 | 68.5 | 80.0 [78.0; 82.0] | 87.5 | 88 |
| SBP Quark | 51 | 116 | 127.35 ± 7.1 | 118 | 125.0 [122.5; 131.0] | 140.75 | 152 |
| DBP Quark | 51 | 70 | 78.8 ± 3.97 | 71.25 | 79.0 [77.0; 81.0] | 85 | 90 |
| MD SBP | 51 | −6 | 1.29 ± 3.66 | −4 | 1.0 [−1.0; 3.0] | 7.75 | 14 |
| MAD SBP | 51 | 0 | 2.94 ± 2.54 | 0 | 2.0 [1.0; 4.0] | 7.75 | 14 |
| MAPD SBP | 51 | 0 | 2.34 ± 2.0 | 0 | 1.67 [0.82; 3.25] | 6.68 | 10.14 |
| MD DBP | 51 | −9 | −0.94 ± 3.78 | −6 | −1.0 [−3.0; 1.0] | 4.75 | 16 |
| MAD DBP | 51 | 0 | 2.78 ± 2.72 | 0 | 2.0 [1.0; 4.0] | 8.25 | 16 |
| MAPD DBP | 51 | 0 | 3.55 ± 3.73 | 0 | 2.6 [1.27; 4.82] | 10.17 | 23.53 |
| Mark | Valid, n | Min | Mean ± Standard Deviation | 2.5% | Median and 25/75% | 97.5% | Max |
|---|---|---|---|---|---|---|---|
| SBP Korotkov | 43 | 120 | 143.84 ± 7.46 | 123.2 | 145.0 [140.5; 150.0] | 154 | 155 |
| DBP Korotkov | 43 | 79 | 87.07 ± 5.6 | 79.05 | 88.0 [81.5; 91.0] | 98 | 99 |
| SBP Quark | 43 | 118 | 143.49 ± 8.89 | 121.45 | 142.0 [140.0; 150.0] | 157.9 | 162 |
| DBP Quark | 43 | 77 | 84.33 ± 5.35 | 78 | 84.0 [80.0; 87.0] | 97 | 97 |
| MD SBP | 43 | −10 | −0.35 ± 4.36 | −8.9 | −1.0 [−3.5; 3.5] | 7 | 8 |
| MAD SBP | 43 | 0 | 3.7 ± 2.33 | 0.05 | 4.0 [2.0; 5.0] | 8.95 | 10 |
| MAPD SBP | 43 | 0 | 2.56 ± 1.58 | 0.03 | 2.65 [1.36; 3.37] | 6.37 | 6.49 |
| MD DBP | 43 | −10 | −2.74 ± 3.12 | −8.95 | −3.0 [−4.0; 0.0] | 2.95 | 4 |
| MAD DBP | 43 | 0 | 3.3 ± 2.52 | 0 | 3.0 [1.5; 4.0] | 8.95 | 10 |
| MAPD DBP | 43 | 0 | 3.72 ± 2.75 | 0 | 3.45 [1.64; 4.82] | 9.93 | 10.99 |
| Mark | Valid, n | Min | Mean ± Standard Deviation | 2.5% | Median and 25/75% | 97.5% | Max |
|---|---|---|---|---|---|---|---|
| SBP Korotkov | 26 | 150 | 166.27 ± 11.44 | 150 | 163.0 [161.0; 170.0] | 192.5 | 195 |
| DBP Korotkov | 26 | 90 | 103.73 ± 8.86 | 90 | 102.0 [98.0; 111.0] | 119.75 | 121 |
| SBP Quark | 26 | 144 | 164.54 ± 13.81 | 146.5 | 160.0 [155.75; 168.75] | 196.62 | 201 |
| DBP Quark | 26 | 86 | 101.73 ± 9.05 | 86 | 102.0 [96.25; 108.75] | 116.88 | 120 |
| MD SBP | 26 | −16 | −1.73 ± 5.27 | −14.75 | −1.5 [−3.75; 2.75] | 4.75 | 6 |
| MAD SBP | 26 | 0 | 4.19 ± 3.64 | 0.62 | 3.0 [2.0; 4.0] | 14.75 | 16 |
| MAPD SBP | 26 | 0 | 2.53 ± 2.24 | 0.33 | 1.9 [1.19; 2.66] | 9.09 | 10 |
| MD DBP | 26 | −18 | −2.0 ± 5.05 | −11.12 | −2.5 [−4.0; 0.75] | 7.38 | 8 |
| MAD DBP | 26 | 0 | 4.15 ± 3.49 | 0.62 | 3.0 [2.0; 5.75] | 11.75 | 18 |
| MAPD DBP | 26 | 0 | 3.99 ± 3.07 | 0.52 | 3.11 [1.93; 5.46] | 11.11 | 15.13 |
References
- Olsen, M.H.; Angell, S.Y.; Asma, S.; Boutouyrie, P.; Burger, D.; A Chirinos, J.; Damasceno, A.; Delles, C.; Gimenez-Roqueplo, A.-P.; Hering, D.; et al. A call to action and a lifecourse strategy to address the global burden of raised blood pressure on current and future generations: The Lancet Commission on hypertension. Lancet 2016, 388, 2665–2712. [Google Scholar] [CrossRef] [PubMed]
- Bundy, J.D.; Li, C.; Stuchlik, P.; Bu, X.; Kelly, T.N.; Mills, K.T.; He, H.; Chen, J.; Whelton, P.K.; He, J. Systolic Blood Pressure Reduction and Risk of Cardiovascular Disease and Mortality: A systematic review and network meta-analysis. JAMA Cardiol. 2017, 2, 775–781. [Google Scholar] [CrossRef] [PubMed]
- Singh, G.M.; Danaei, G.; Farzadfar, F.; Stevens, G.A.; Woodward, M.; Wormser, D.; Kaptoge, S.; Whitlock, G.; Qiao, Q.; Lewington, S.; et al. The Age-Specific Quantitative Effects of Metabolic Risk Factors on Cardiovascular Diseases and Diabetes: A Pooled Analysis. PLoS ONE 2013, 8, e65174. [Google Scholar] [CrossRef] [PubMed]
- Kennelly, S.P.; Lawlor, B.A.; Kenny, R.A. Review: Blood pressure and dementia—A comprehensive review. Ther. Adv. Neurol. Disord. 2009, 2, 241–260. [Google Scholar] [CrossRef] [PubMed]
- Mills, K.T.; Bundy, J.D.; Kelly, T.N.; Reed, J.E.; Kearney, P.M.; Reynolds, K.; Chen, J.; He, J. Global Disparities of Hypertension Prevalence and Control: A Systematic Analysis of Population-Based Studies From 90 Countries. Circulation 2016, 134, 441–450. [Google Scholar] [CrossRef] [PubMed]
- Zhou, B.; Perel, P.; Mensah, G.A.; Ezzati, M. Global epidemiology, health burden and effective interventions for elevated blood pressure and hypertension. Nat. Rev. Cardiol. 2021, 18, 785–802. [Google Scholar] [CrossRef] [PubMed]
- Fuchs, F.D.; Whelton, P.K. High Blood Pressure and Cardiovascular Disease. Hypertension 2020, 75, 285–292. [Google Scholar] [CrossRef] [PubMed]
- McEniery, C.M.; Cockcroft, J.R.; Roman, M.J.; Franklin, S.S.; Wilkinson, I.B. Central blood pressure: Current evidence and clinical importance. Eur. Hear. J. 2014, 35, 1719–1725. [Google Scholar] [CrossRef]
- van Montfrans, G.A. Oscillometric blood pressure measurement: Progress and problems. Blood Press. Monit. 2001, 6, 287–290. [Google Scholar] [CrossRef]
- Beevers, D.G.; Beevers, M.; Zezulka, A.V.; Hornby, R.; Herod, J. Standards for blood pressure measuring devices. BMJ 1987, 294, 1614. [Google Scholar] [CrossRef][Green Version]
- Schoot, T.S.; Weenk, M.; van de Belt, T.H.; Engelen, L.J.; van Goor, H.; Bredie, S.J. A New Cuffless Device for Measuring Blood Pressure: A Real-Life Validation Study. J. Med. Internet Res. 2016, 18, e85. [Google Scholar] [CrossRef] [PubMed]
- Ruzicka, M.; Hiremath, S. Accuracy—Limiting Factor of Home Blood Pressure Monitors? Am. J. Hypertens. 2017, 30, 661–664. [Google Scholar] [CrossRef][Green Version]
- Koivistoinen, T.; Lyytikäinen, L.-P.; Aatola, H.; Luukkaala, T.; Juonala, M.; Viikari, J.; Lehtimäki, T.; Raitakari, O.T.; Kähönen, M.; Hutri-Kähönen, N. Pulse Wave Velocity Predicts the Progression of Blood Pressure and Development of Hypertension in Young Adults. Hypertension 2018, 71, 451–456. [Google Scholar] [CrossRef] [PubMed]
- Kronish, I.M.; Kent, S.; Moise, N.; Shimbo, D.; Safford, M.M.; Kynerd, R.E.; O’Beirne, R.; Sullivan, A.; Muntner, P. Barriers to conducting ambulatory and home blood pressure monitoring during hypertension screening in the United States. J. Am. Soc. Hypertens. 2017, 11, 573–580. [Google Scholar] [CrossRef] [PubMed]
- Xing, X.; Sun, M. Optical blood pressure estimation with photoplethysmography and FFT-based neural networks. Biomed. Opt. Express 2016, 7, 3007–3020. [Google Scholar] [CrossRef] [PubMed]
- Gesche, H.; Grosskurth, D.; Küchler, G.; Patzak, A. Continuous blood pressure measurement by using the pulse transit time: Comparison to a cuff-based method. Eur. J. Appl. Physiol. 2011, 112, 309–315. [Google Scholar] [CrossRef]
- Yoon, Y.; Cho, J.H.; Yoon, G. Non-constrained Blood Pressure Monitoring Using ECG and PPG for Personal Healthcare. J. Med. Syst. 2008, 33, 261–266. [Google Scholar] [CrossRef]
- Choi, J.; Kang, Y.; Park, J.; Joung, Y.; Koo, C. Development of Real-Time Cuffless Blood Pressure Measurement Systems with ECG Electrodes and a Microphone Using Pulse Transit Time (PTT). Sensors 2023, 23, 1684. [Google Scholar] [CrossRef]
- Lin, W.-H.; Wang, H.; Samuel, O.W.; Liu, G.; Huang, Z.; Li, G. New photoplethysmogram indicators for improving cuffless and continuous blood pressure estimation accuracy. Physiol. Meas. 2017, 39, 025005. [Google Scholar] [CrossRef]
- Ding, X.-R.; Zhang, Y.-T.; Liu, J.; Dai, W.-X.; Tsang, H.K. Continuous Cuffless Blood Pressure Estimation Using Pulse Transit Time and Photoplethysmogram Intensity Ratio. IEEE Trans. Biomed. Eng. 2015, 63, 964–972. [Google Scholar] [CrossRef] [PubMed]
- Naschitz, J.E.; Bezobchuk, S.; Mussafia-Priselac, R.; Sundick, S.; Dreyfuss, D.; Khorshidi, I.; Karidis, A.; Manor, H.; Nagar, M.; Peck, E.R.; et al. Pulse Transit Time by R-Wave-Gated Infrared Photoplethysmography: Review of the Literature and Personal Experience. J. Clin. Monit. Computing. 2004, 18, 333–342. [Google Scholar] [CrossRef]
- Gao, M.; Olivier, N.B.; Mukkamala, R. Comparison of noninvasive pulse transit time estimates as markers of blood pressure using invasive pulse transit time measurements as a reference. Physiol. Rep. 2016, 4, e12768. [Google Scholar] [CrossRef] [PubMed]
- Elgendi, M.; Fletcher, R.; Liang, Y.; Howard, N.; Lovell, N.H.; Abbott, D.; Lim, K.; Ward, R. The use of photoplethysmography for assessing hypertension. NPJ Digit. Med. 2019, 2, 60. [Google Scholar] [CrossRef] [PubMed]
- Sagirova, Z.; Kuznetsova, N.; Gogiberidze, N.; Gognieva, D.; Suvorov, A.; Chomakhidze, P.; Omboni, S.; Saner, H.; Kopylov, P. Cuffless Blood Pressure Measurement Using a Smartphone-case-based ECG Monitor with Photoplethysmography in Hypertensive Patients. Sensors 2021, 21, 3525. [Google Scholar] [CrossRef]
- O’brien, E.; Pickering, T.; Asmar, R.; Myers, M.; Parati, G.; Staessen, J.; Mengden, T.; Imai, Y.; Waeber, B.; Palatini, P.; et al. Working Group on Blood Pressure Monitoring of the European Society of Hypertension International Protocol for validation of blood pressure measuring devices in adults. Blood Press. Monit. 2002, 7, 3–17. [Google Scholar] [CrossRef]
- O’Brien, E.; Petrie, J.; Littler, W.A.; de Swiet, M.; Padfield, P.D.; Dillon, M.J.; Coats, A.; Mee, F. Blood Pressure Measurement: Recom-Mendations of the British Hypertension Society, 2nd ed.; BMJ Publishing Group: London, UK, 1997. [Google Scholar]
- O’Brien, E.; Petrie, J.; Littler, W.; de Swiet, M. The British Hypertension Society protocol for the evaluation of blood pressure measuring devices. J. Hypertens. 1993, 11 (Suppl. S2), S43–S62. [Google Scholar]
- IEEE 1708a-2019; IEEE Standard for Wearable, Cuffless Blood Pressure Measuring Devices. The Institute of Electrical and Electronics Engineers, Inc.; IEEE Standards Association; IEEE Engineering in Medicine and Biology Society; Standards Committee Institute of Electrical and Electronics Engineers, Incorporated; USE: New York, NY, USA, 2014; 24p, ISBN 978-0-7381-9213-0.
- ANSI/AAMI SP 10: 2002; Association for the Advancement Instrumentation, American National Standard for Electronic or Automated Sphygmomanometers. AAMI: Arlington, VA, USA, 2002.
- Sun, M.; Jones, R. Accuracy ratio of blood pressure de-vices between AAMI SP 10 standard and protocols of the British Society of Hypertension. Biomed. Instrum. Technol. 1999, 33, 62–70. [Google Scholar]
- Pereira, T.; Correia, C.; Cardoso, J. Novel Methods for Pulse Wave Velocity Measurement. J. Med. Biol. Eng. 2015, 35, 555–565. [Google Scholar] [CrossRef] [PubMed]
- Stergiou, G.S.; Avolio, A.P.; Palatini, P.; Kyriakoulis, K.G.; Schutte, A.E.; Mieke, S.; Kollias, A.; Parati, G.; Asmar, R.; Pantazis, N.; et al. European Society of Hypertension recommendations for the validation of cuffless blood pressure measuring devices: European Society of Hypertension Working Group on Blood Pressure Monitoring and Cardiovascular Variability. J. Hypertens. 2023, 41, 2074–2087. [Google Scholar] [CrossRef]
- Mukkamala, R.; Yavarimanesh, M.; Natarajan, K.; Hahn, J.-O.; Kyriakoulis, K.G.; Avolio, A.P.; Stergiou, G.S. Evaluation of the Accuracy of Cuffless Blood Pressure Measurement Devices: Challenges and Proposals. Hypertension 2021, 78, 1161–1167. [Google Scholar] [CrossRef]
- Bradley, C.K.; Shimbo, D.; Colburn, D.A.; Pugliese, D.N.; Padwal, R.; Sia, S.K.; Anstey, D.E. Cuffless Blood Pressure Devices. Am. J. Hypertens. 2022, 35, 380–387. [Google Scholar] [CrossRef] [PubMed]
- Avolio, A.; Cox, J.; Louka, K.; Shirbani, F.; Tan, I.; Qasem, A.; Butlin, M. Challenges Presented by Cuffless Measurement of Blood Pressure if Adopted for Diagnosis and Treatment of Hypertension. Pulse 2022, 10, 34–45. [Google Scholar] [CrossRef] [PubMed]


| Current SBP (mm Hg) | Mean SBP in Group (mm Hg) | Number of Patients | Age | Male (%) |
|---|---|---|---|---|
| All | 130.5 ± 23.0 | 167 | 65.3 ± 11.3 | 61.1 |
| ≥160 | 168.9 ± 10.7 | 22 | 67.0 ± 10.5 | 41.0 |
| 140–159 | 146.6 ± 4.9 | 41 | 63.3 ± 11.3 | 68.3 |
| 120–139 | 127.8 ± 6.2 | 51 | 66.4 ± 10.9 | 60.8 |
| <120 | 104.7 ± 8.8 | 53 | 65.2 ± 12.1 | 64.1 |
| Current DBP (mm Hg) | Mean DBP in group (mm Hg) | Number of Patients | Age | Male (%) |
| All | 81.5 ± 13.8 | 167 | 65.3 ± 11.3 | 61.1 |
| ≥100 | 108.3 ± 6.6 | 18 | 61.7 ± 12.2 | 55.5 |
| 90–100 | 92.3 ± 2.8 | 29 | 65.1 ± 10.4 | 58.6 |
| 80–89 | 82.5 ± 2.5 | 52 | 65.3 ± 10.4 | 63.5 |
| <80 | 69.0 ± 6.9 | 68 | 66.5 ± 12.2 | 61.9 |
| Characteristic | Number of Patients (N = 167) | % (From N) |
|---|---|---|
| Age: median 66 years [59.5; 73] | ||
| Ischemic heart disease | 75 | 44.9 |
| Arterial hypertension | 144 | 86.3 |
| Heart failure | 68 | 40.7 |
| LV EF < 55% | 36 | 21.6 |
| LV EF < 40% | 14 | 8.4 |
| LV DD in grades 2 and 3 | 31 | 18.6 |
| Diabetes | 72 | 43.1 |
| Smokers | 39 | 23.4 |
| Vessel wall stiffness | 35 | 21.0 |
| Using statins | 99 | 59.3 |
| Using antihypertension drugs | 139 | 83.2 |
| Using diuretics | 71 | 42.5 |
| Number of Subjects: 45 (20 Subjects for Phase 1; 25 Subjects for Phase 2) | |||||
|---|---|---|---|---|---|
| Blood Pressure Ranges: | |||||
| Blood Pressure Classification | Systolic Blood Pressure (mmHg) | Diastolic Blood Pressure (mmHg) | Subjects in Phase 1 | Subjects in Phase 2 | |
| Normal | <120 | and | <80 | 5 | ≥6 |
| Prehypertension | 120–139 | or | 80–89 | 5 | ≥6 |
| Stage 1 hypertension | 140–160 | or | 90–100 | 5 | ≥6 |
| Stage 2 hypertension | ≥160 | or | ≥100 | 5 | ≥6 |
| Gender: | |||||
| At least 22 males and 22 females | |||||
| Age: | |||||
| All subjects must be 18 to 65 years old. | |||||
| Group | Valid N | MAD (mmHg) | MAPD (%) | MD (mmHg) | CP MAD ≤ 5 mmHg (%) | CP MAD ≤ 10 mmHg (%) | CP MAD ≤ 15 mmHg (%) |
|---|---|---|---|---|---|---|---|
| Total group SBP | 167 | 3.44 [3.05, 3.82] | 2.68 [2.4, 2.96] | −0.05 [−0.7, 0.6] | 85.6% | 98.2% | 99.4% |
| Total group DBP | 167 | 3.21 [2.78; 3.64] | 3.97 [3.43; 4.51] | −1.02 [−1.65; −0.38] | 83.8% | 98.2% | 98.8% |
| Normal SBP | 47 | 3.32 [2.86; 3.77] | 3.24 [2.79; 3.69] | −0.3 [−1.38; 0.78] | 91.5% | - | - |
| Normal DBP | 47 | 3.06 [2.28; 3.85] | 4.66 [3.46; 5.85] | 1.02 [−0.14; 2.18] | 87.2% | 97.9% | 100% |
| Prehypertension SBP | 51 | 2.94 [2.22; 3.66] | 2.34 [1.78; 2.91] | 1.29 [0.25; 2.33] | 86.3% | 98.0% | 100% |
| Prehypertension DBP | 51 | 2.78 [2.01; 3.56] | 3.55 [2.49; 4.61] | −0.94 [−2.01; 0.13] | 88.2% | 98.0% | 98.0% |
| Stage 1 SAH | 43 | 3.7 [2.97; 4.42] | 2.56 [2.06; 3.05] | −0.35 [−1.71; 1.01] | 83.7% | 100% | - |
| Stage 1 DAH | 43 | 3.3 [2.52; 4.09] | 3.72 [2.86; 4.58] | −2.74 [−3.72; −1.77] | 81.4% | 100% | - |
| Stage 2 SAH | 26 | 4.19 [2.69; 5.69] | 2.53 [1.61; 3.46] | −1.73 [−3.9; 0.44] | 76.9% | 92.3% | 96.2% |
| Stage 2 DAH | 26 | 4.15 [2.71; 5.59] | 3.99 [2.72; 5.25] | −2.0 [−4.08; 0.08] | 73.1% | 96.2% | 96.2% |
Disclaimer/Publisher’s Note: The statements, opinions and data contained in all publications are solely those of the individual author(s) and contributor(s) and not of MDPI and/or the editor(s). MDPI and/or the editor(s) disclaim responsibility for any injury to people or property resulting from any ideas, methods, instructions or products referred to in the content. |
© 2023 by the authors. Licensee MDPI, Basel, Switzerland. This article is an open access article distributed under the terms and conditions of the Creative Commons Attribution (CC BY) license (https://creativecommons.org/licenses/by/4.0/).
Share and Cite
Gogiberidze, N.; Suvorov, A.; Sultygova, E.; Sagirova, Z.; Kuznetsova, N.; Gognieva, D.; Chomakhidze, P.; Frolov, V.; Bykova, A.; Mesitskaya, D.; et al. Practical Application of a New Cuffless Blood Pressure Measurement Method. Pathophysiology 2023, 30, 586-598. https://doi.org/10.3390/pathophysiology30040042
Gogiberidze N, Suvorov A, Sultygova E, Sagirova Z, Kuznetsova N, Gognieva D, Chomakhidze P, Frolov V, Bykova A, Mesitskaya D, et al. Practical Application of a New Cuffless Blood Pressure Measurement Method. Pathophysiology. 2023; 30(4):586-598. https://doi.org/10.3390/pathophysiology30040042
Chicago/Turabian StyleGogiberidze, Nana, Aleksandr Suvorov, Elizaveta Sultygova, Zhanna Sagirova, Natalia Kuznetsova, Daria Gognieva, Petr Chomakhidze, Victor Frolov, Aleksandra Bykova, Dinara Mesitskaya, and et al. 2023. "Practical Application of a New Cuffless Blood Pressure Measurement Method" Pathophysiology 30, no. 4: 586-598. https://doi.org/10.3390/pathophysiology30040042
APA StyleGogiberidze, N., Suvorov, A., Sultygova, E., Sagirova, Z., Kuznetsova, N., Gognieva, D., Chomakhidze, P., Frolov, V., Bykova, A., Mesitskaya, D., Novikova, A., Kondakov, D., Volovchenko, A., Omboni, S., & Kopylov, P. (2023). Practical Application of a New Cuffless Blood Pressure Measurement Method. Pathophysiology, 30(4), 586-598. https://doi.org/10.3390/pathophysiology30040042