
Evaluation of The Antioxidant Capacity of Food Products: Methods, Applications and Limitations

1
Laboratory of Analytical Biochemistry, Institute of Food Technology and Nutrition, College of Natural Sciences, Rzeszow University, 4 Zelwerowicza Street, 35-601 Rzeszow, Poland
2
Department of Bioenergetics, Food Analysis and Microbiology, Institute of Food Technology and Nutrition, College of Natural Sciences, Rzeszow University, 4 Zelwerowicza Street, 35-601 Rzeszow, Poland
*
Author to whom correspondence should be addressed.
Processes 2022, 10(10), 2031; https://doi.org/10.3390/pr10102031
Submission received: 11 September 2022
/
Revised: 2 October 2022
/
Accepted: 4 October 2022
/
Published: 8 October 2022
(This article belongs to the Special Issue Total Antioxidant Capacity: Idea, Methods and Limitations)
Abstract
:Assays of total antioxidant capacity (TAC) are popular in the analysis of food products. This review presents the most popular assays of TAC and their limitations, databases of TAC of food products, their application in clinical studies, and the effect of processing on the TAC of food. The importance of sample preparation for TAC assays and striking effects of digestion in the gastrointestinal tract on the TAC of food are discussed. Critical opinions on the validity of food TAC assays are considered. It is concluded that TAC methods can be useful as screening assays for food quality control and as low-cost, high-throughput tools used to discover potential antioxidant sources and follow changes in the content of antioxidants during food processing. However, effects revealed by TAC assays should be followed and explained using more specific methods.
1. Introduction
In recent decades, assays of the antioxidant activity/capacity have become one of the most popular subjects of publications concerning foods, beverages and their components. The idea of measuring the sum of antioxidant activities in a single simple assay is undoubtedly attractive and has been broadly applied. This approach can integrate the individual antioxidant actions of different compounds and their additive, synergistic, or antagonistic interactions. Let us recall, for the sake of clarity, the difference between the terms: “antioxidant activity” and “antioxidant capacity”. The term “antioxidant activity” should, in principle, be used to describe antioxidant properties of a single compound in a given assay, while the term “total antioxidant capacity” (TAC) refers to antioxidant properties of a complex material (such as a beverage, extract or biological fluid) composed of many compounds in this assay [1]. In addition, the term “antioxidant activity” used in a broader sense (a notion as opposed to a measurable parameter) encompasses diverse features of an antioxidant such as redox potential and rate constants of reactions with various oxidants. Therefore, the term “TAC” will be used throughout this paper for the parameter characterizing the antioxidant behavior of complex samples.
However, the notion of TAC became a subject of criticism. The term “total” has been criticized since the most common assays do not measure the activities of antioxidant enzymes, so important in the antioxidant defense. It has been argued that instead of “total” the term “partial” or “non-enzymatic” antioxidant capacity should be used [2,3,4,5]. Nevertheless, this distinction, important for characterization of the “antioxidant barrier” of human, animal or plant organisms, does not seem relevant with respect to food since food enzymes are anyhow digested and may act only to a limited extent in the gastrointestinal tract.
2. Methods of Estimation of Total Antioxidant Capacity
A bunch of methods has been proposed to estimate the total capacity of biological material to scavenge reactive oxygen species, to scavenge free radicals, or the content of reducing compounds. These terms are almost but not totally synonymous, which leads to some ambiguity. Reducing compounds donate electrons or hydrogen atoms to compounds which have higher reduction/oxidation (redox) potentials. The latter group of compounds includes free radicals and other oxidants occurring in living systems. Not all reactive oxygen species (ROS) are free radicals. Hydrogen peroxide, other peroxides, peroxynitrite, and singlet oxygen are not free radicals.
2.1. Most Popular Methods
Most TAC assays are based on reactions of antioxidants on stable free radicals or those generated in situ (Table 1).
Indicator substances used in these absorptiometic, fluorimetric, or luminometric assays of TAC are shown in Figure 1.
The antioxidant activity measured by ABTS● reduction is usually referred to that of Trolox (6-hydroxy-2,5,7,8-tetramethylchroman-2-carboxylic acid) as a standard antioxidant. It allows expression of results in Trolox equivalents (TE), which is a quite useful and comparable way comparing antioxidant activities. For this reason, the assay based on ABTS● reduction is often referred to as assessment of “Trolox Equivalent Antioxidant Capacity” (TEAC), although there are no real reasons for restricting this term to the ABTS● assays only and sometimes this term is also applied to the DPPH● reduction and ORAC assays (if expressed in TE).
In the original TAC assay employing ABTS●, the group of Arnao [18] employed peroxidase while and hydrogen peroxide while the group of Rice-Evans used metmyoglobin and hydrogen peroxide [19] to produce ABTS● in situ, and prevention of ABTS● formation was quantified. The latter assay became the basis of a commercial “ABTS Antioxidant Assay Kit”. Later on, the use of pre-formed ABTS● radical gave rise to the most commonly used “improved ABTS radical cation decolorization assay” [6]. Potassium persulphate is the oxidant used usually for ABTS● generation. The product is relatively stable at low temperature. The reaction product can also be lyophilized, and the stable powder may be dissolved to prepare a working ABTS● solution [20].
ABTS● is soluble in both aqueous and organic solvent media, enabling estimation of both hydrophilic and lipophilic antioxidants. The assay can be performed in a broad pH range [7]. ABTS● is an N-centered radical with sterically limited access, e.g., to polymeric phenols giving rise to slow reactions of some antioxidants [21,22]. The assay has been challenged for its lack of biological relevance due to use of the artificial ABTS● radical that is not present in food or biological systems (a “non-physiological radical”; this reservation concerns DPPH● as well) [22].
The DPPH● reduction method, though even simpler than the ABTS● reduction method (DPPH● is commercially available) has been reported to be much influenced by light, air oxygen, pH and the type of solvent. DPPH● is essentially soluble in organic solvent media but not in water. It is usually dissolved in methanol, ethanol, or their aqueous mixtures. In this final case, the water content should not exceed 60% to make the radical soluble [23]. The insolubility of DPPH● in water brings an important limitation to the determination of hydrophilic antioxidants. Flavonoids and other complex phenols generally exhibit moderate-to-slow reaction with DPPH● [21].
Antioxidant activity estimated by the DPPH● reduction method is often reported as efficient concentration EC50, which is defined as the concentration of the antioxidant necessary to reduce the initial DPPH● concentration (and absorbance) by 50%. In addition, tEC50 (the time necessary for EC50 to reach the equilibrium state) is used) [24]. Another approach is the “area under curve approach” i.e., measuring the sum of DPPH absorbances in the course of the reaction, as in the ORAC assay [25]. The reciprocal of the efficient concentration 1/EC50 termed “antiradical power” (ARP) is also employed [26]. Other authors proposed to use another parameter, reciprocal of the product of EC50 and tEC50, 1 / (EC50 × tEC50) termed “antiradical efficiency”, AE [27,28].
The ferric reducing antioxidant power assay (FRAP) assay is based on the reduction of the 2,4,6-tripyridyl- -triazine (TPTZ)–Fe3+ to the deep blue TPTZ-Fe2+ complex. The signal measured is the reduction-driven increase in absorbance at 593 nm. The assay is carried out at acidic pH conditions (pH = 3.6) to maintain iron solubility. In a modified version known as the FRASC assay, both the total antioxidant activity and the ascorbic acid (vitamin C) concentration of the test sample can be measured simultaneously by employing ascorbic oxidase to destroy ascorbic acid in one of a pair of samples run in parallel [29]. Oxidation of some hydroxycinnamic acids and flavonoids with the FRAP reagent is not complete within the protocol time period of the assay [30] so longer reaction times are used by some authors. High-spin Fe3+ bound to TPTZ has an inherently slow kinetics due to half-filled d-orbitals of ferric ion, and the trivalently-charged Fe3+-TPTZ complex has higher affinity toward the aqueous phase (due to ion-dipole interaction with solvent water molecules) than toward organic solvents [31], limiting the determination of lipophilic antioxidants. The original FRAP test uses TPTZ as the chelating ligand for the iron ions, while alternative ligands, such as ferrozine, were also used to bind the iron ions [32].
The cupric reducing antioxidant capacity (CUPRAC) method uses the copper2+-neocuproine (2,9-dimethyl-1,10-phenanthroline; Nc), which can be reduced by antioxidants. CUPRAC method measures the antioxidant capacity at nearly physiological pH (i.e., pH 7), so it better simulates the physiological action of antioxidants. The CUPRAC chromophore Cu(Nc)2+ is soluble in both aqueous and organic solvents, enabling the assay of hydrophilic and lipophilic antioxidants. The standard redox potential of the Cu2+/Cu+)-neocuproine complex is 0.6 V, which is much higher than that of the single Cu2+/Cu+ couple (0.17 V). Glutathione and other thiols, not reactive in the FRAP assay, react with the Cu2+-neocuproine complex [21]. The original CUPRAC test was modified to include various samples in diverse applications, e.g., the acetone/water environment, with the help of methyl-cyclodextrine, enables simultaneous determination of hydrophilic and lipophilic antioxidants [13,33].
The oxygen radical absorbance capacity (ORAC) assay is based on the inhibition of the oxidation of a fluorescent substrate (and fluorescence loss) by peroxyl radicals. Decomposition of an initiator compound produces alkyl radicals, which quickly react with oxygen, forming peroxyl radicals [34]. Commonly used peroxyl radical generators used in this assay are represented by azo-compounds decomposing at elevated temperatures. Usually, the hydrophilic 2,2′-azobis(2-amidinopropane) dihydrochloride (AAPH) is used as the initiator but lipophilic initiators such as 2,2’-azobis(isobutyronitrile) (AIBN) or 2,2′-azobis(2,4-dimethylvaleronytril) (AMVN) are also employed [35]. While the free radical initiators used in the assay are synthetic compounds not occurring in food, the peroxyl radicals are the main radicals involved in lipid peroxidation in foodstuffs, so it is argumented that the assay is fully relevant for food oxidation phenomena. In order to measure both hydrophilic and lipophilic antioxidants, the initial ORAC assay was modified using a solution of 50% acetone/50% water (v/v) and 7% randomly methylated β-cyclodextrin as a solubility enhancer for the antioxidants [36]. Initially β-phycoerythrin, a fluorescent protein isolated from the red algae Porphyridium cruentum, was used as a detector of oxidation caused by the peroxyl radicals but later on it was replaced by fluorescein (Figure 1) or, sometimes, by other fluorescent dyes, such as Nile blue [37] or p-aminobenzoic acid (PABA) [38]. The principle of the assay consists in estimation of the protection of the detector probe against the loss of fluorescence in a kinetic assay. Sum of fluorescence values (“area under curve” in a plot of fluorescence as a function of time) measured in the presence of a sample containing antioxidants is compared with that of a sample containing no antioxidant. The presence of metal ions in a sample may affect the assay. The inclusion of ethylenediaminetetraacetic acid (EDTA) was proposed to attenuate metal interferences [39].
Chemiluminescence assays of TAC are based on the reaction of reactive oxygen species or reactive nitrogen species (ROS/RNS) with detecting reagents to generate species in an excited state that emit light upon de-excitation to the ground state. Antioxidants that react with the initiating reactive species diminish the light generation as their reactions compete with reactions of ROS/RNS with detectors. By changing the oxidant initiator (e.g., superoxide or peroxyl radicals, peroxynitrite, hypochlorite, singlet oxygen), it is possible to measure the capacity of quenching of different ROS/RNS by antioxidants [17,40,41]. The main chemiluminescence reagents used are luminol [16,42] (Figure 1), lucigenin [43], peroxyoxalate [44], the NaHCO3-H2O2-Co2+ system [45], and a bioluminescent protein pholasin [46].
2.2. Less Popular Methods
Apart from these most popular methods, several other TAC assays are being in use. The hydroxyl radical antioxidant capacity (HORAC) assay is based on the oxidation of a fluorescent probe by hydroxyl radicals generated by a Fenton system, usually Co2+ + H2O2 [49]. In our opinion, the use of this assay for food analysis should be definitely discouraged. Hydroxyl radical is so reactive that it reacts with any molecule (although the reaction rate constants differ). Thus, any substance present in a sample will show antioxidant activity in this test and the assay is simply a measure of content of (mainly) organic substances in the material studied. Moreover, there is (less frequent) possibility that some components of a sample will strongly chelate the metal component of a Fenton system in a way preventing hydroxyl radical formation rather than react with the hydroxyl radical.
The potassium ferricyanide reducing power (PFRAP) assay is based on the reduction of ferricyanide to ferrocyanide by antioxidants [50,51,52]. The standard redox potential of the ferricyanide/ferrocyanide system is quite low (0.36 V), which should limit the range of antioxidants detected by this system but in fact the final product is not the ferrocyanide but the Prussian blue Fe[Fe(CN)6]- so the actual Eo of this system is much higher [51]. A disadvantage of this version of the FRAP test is the tendency of Prussian blue to precipitate and form a suspension. In order to keep Prussian blue in solution, inclusion of a detergent, sodium dodecyl sulphate, in the reaction medium and modification of pH was proposed [52].
The total reactive antioxidant potential (TRAP) test is based on the capacity of antioxidants to inhibit the reaction between peroxyl radicals and a target molecule, which initially represented the O2 consumption by a sample in the peroxidation process triggered by the thermal decomposition of AAPH. The retardation time of the O2 consumption, i.e., the induction period, may be quantitatively measured and used to express the total antioxidant capacity of the samples as the TRAP value. Then, the method was modified several times changing initiators and detectors [53,54].
The total radical-trapping antioxidant parameter assay also measures the capability of antioxidants to interfere with the reaction between peroxyl radical and a detector. Originally, AAPH was used as a peroxyl radical generator and R-phycoerythrin as a detector probe [55]. The quantification of antioxidants is based on the duration of the lag phase. Other sources of peroxyl radicals and other detectors (fluorescein, fluorescein diacetate and luminol) [42,56] were also used. An important limitation of the TRAP assay is the use of the lag phase for determination of antioxidant capacity because not all antioxidants produce a clear lag phase [57].
The total oxyradical scavenging capacity (TOSC) test is based on inhibition of the formation of ethylene from α-keto-gamma-methiolbutyric acid by antioxidant compounds [58].
The β-carotene bleaching assay [59] employs an aqueous emulsion of linoleic acid and β-carotene, which is discolored under the influence of the radicals generated through the spontaneous oxidation of the fatty acid, at elevated temperature. The measurements are done usually at 50°C. Quantification is based on the inhibition of the rate of decay of absorbance of β-carotene at of 470–490 nm in the presence of antioxidants. The β-carotene bleaching assay can screen both lipophilic and hydrophilic samples [60,61]. A similar assay is based on the attenuation of bleaching of crocin by antioxidants [62].
The assay of reduction of the galvinoxyl (2,6-di-tert-butyl-α-(3,5-di-tert-butyl-4-oxo-2,5-cyclohexadien-1-ylidene)-p-tolyloxy radical is also used. The radical is commercially available, is oxygen-centered and is more reactive towards polyphenols than DPPH● [63,64]. Spectrophotometric methods of TAC measurement based on the reduction of 2,6-dichlorophenolindophenol [65] and Ce4+ [66], and assays estimating the scavenging of such oxidants as peroxynitrite and hypochlorite based on protection of Pyrogallol Red or fluorescein against decolorization/loss of fluorescence were proposed [67,68].
The Folin-Ciocalteau assay is also listed in the context of TAC assays. It was originally developed for the assay of tyrosine and tryptophan [69] and later modified for analysis of total polyphenols [70]. These compounds constitute a considerable fraction of antioxidants in plant foods. However, the assay is not specific for antioxidants, because it responds also to simple phenols, citric acid, many amines, amino acids, and reducing sugars [40], due to the indefinitely high redox potential of the Folin reagent. Moreover, the molybdo-phosphotungstate heteropoly anion being the Folin chromophore is (4-) charged, exhibiting high ion-dipole interactions with water molecules, so this assay is unsuitable for lipophilic antioxidants [30].
There are also methods of TAC assay in use based not on optical measurements but on voltammetry, amperometry [71], chromatography [72], electrophoresis [73] or direct measurement of radical scavenging by electron paramagnetic spectroscopy [74,75] and employing nanoparticles [76,77]. To give two examples: a sample reacts with 2,6-dichlorophenolindophenol (DCIP), and the reduction product of DCIP is separated and quantified by capillary electrophoresis [73] or ABTS● remaining after reaction is quantified by HPLC [72]. In the exemplified assays, nanoliter volumes of samples can be used. A paper-based device, obviating the need for a spectrophotometer or plate reader, was proposed for TAC assays. which can be performed by dropping a sample solution onto the sample zone. The sample flows to the pretreatment and detection zones that are pre-deposited with the reagents corresponding to the assays evaluated. Color changes are analyzed using a scanner and imageJ software at the detection zone and are proportional to the concentration/activity of the antioxidants [78]. A simple minimized device based on moving drops as solution handling and a smartphone as a detector has been invented, basing on the reaction of DPPH● reduction [79].
Cellular-based antioxidant activity assays (CAA) seem to be more biologically relevant than purely chemical assays. These assays measures not only the chemical reactivity of antioxidants but also their ability to penetrate the plasma membrane and accumulate within cells. The principle of the test consists in a pre-incubation of cells with the antioxidant-containing sample and incubation with the cell-permeable fluorogenic probe 2′,7′-dichlorofluorescin diacetate (H2DCF-DA). Within the cells H2DCF-DA is deacetylated by cellular esterases generating 2′,7′-dichlorofluorescin (H2DCF) that is captured in the cells. Then AAPH is added, which crosses easily the plasma membrane. Peroxyl radicals formed upon decomposition of intracellular AAPH oxidize H2DCF to the fluorescent 2′,7′-dichlorofluorescein (DCF). Antioxidants reacting with peroxyl radicals decrease DCF formation and thus fluorescence intensity. Several cell lines have been employed for the CAA assay: HepG2, Caco-2, AGS and the yeast Saccharomyces cerevisiae. CAA is usually expressed in μmoles of quercetin equivalents per 100 g of a food product [80,81,82].
3. Limited Correlation between Results of Various Assays of Total Antioxidant Capacity
Not only are the values of TAC measured by various assays different, but correlations between results of various assays are also limited when comparing various food products or their treatments. Furthermore, the results of assay of the same material using the same assay often differ in various laboratories. There are several reasons for such a situation. Firstly, the reduction/oxidation (redox) potentials of various redox systems employed in the reduction assays are different. Standard redox potentials Eo’ values of the ABTS●/ABTS, Fe3+/Fe2+ (FRAP) and Cu2+Nc/Cu+Nc (CUPRAC) and DPPH●/DPPH-H are 0.68, 0.70, 0.60 and about 0.3 V, respectively [21,83,84]. Standard one-electron redox potentials of various antioxidants differ (e. g. ascorbate, 282 mV, α-tocopherol 500 mV, (-)-catechin 570 mV, generally polyphenols, 330–840 mV) [85,86,87]. An antioxidant cannot react in a particular assay if its redox potential is higher than the redox potential of the indicator system. Apart from this thermodynamic condition, some antioxidants may be not able to react with an indicator due to the steric hindrance or the kinetics of reaction may be slow. Thus, different assays can measure different pools of antioxidants. It is recommended by some authors that at least two different assays should be performed to characterize antioxidant capacity of a food sample [28].
A common disadvantage of the reduction-based assays are different reaction rates of various antioxidants; as a result, shorter assay times, recommended for the sake of convenience, may underestimate TAC. Other variables include temperature, pH, and changes in the composition of the medium. Ionic strength affects the reactivity of ABTS● [7]. DPPH reduction is affected by pH, solvent and presence of metal ions or inorganic salts [88]. If unbuffered water is applied, the use of freshly distilled/deionized water can make a difference with respect to water standing for several days containing dissolved CO2, which changes its pH. An increase in the initial DPPH● concentration increases its consumption, even when the ratio of antioxidant to DPPH● is maintained, thus affecting EC50 determination [9,89]. The background color of the food matrix may introduce artefacts if not taken into account and appropriate correction is not performed.
A crucial practical question contributing to the variance of results reported by various laboratories is the way of preparation of samples used for the determination of TAC. Details, often not reported in publications, may seriously affect the TAC values measured.
Liquid samples of beverages are usually assayed “as they are”, most frequently after preliminary centrifugation. Centrifugation removes particulate components, which may have important contribution to TAC after digestion in the gastrointestinal tract. Hydrophobic antioxidants can be extracted from beverages with a hydrophobic solvent non-miscible with water, e. g. ethyl acetate or chloroform.
TAC of oils is estimated by diluting with a hydrophobic solvent like ethyl acetate. For the assay of hydrophilic antioxidants that can be present in oils, they are extracted with methanol or ethanol.
Solid samples require homogenization; details of the homogenization procedure may affect the results of the assay. Yu et al. compared TAC of kale and broccoli samples ground in water with five different blenders finding significant differences [90]. Sometimes, foodstuffs are dried or freeze-dried and milled to a particle size of less than 0.5 mm, and then extracted.
The medium used for food homogenization and extraction of antioxidants may affect the efficiency of extraction of antioxidants. The one-step extraction procedure for sample preparation is used by many authors due to its simplicity. Usually, the material is homogenized with water, or neutral or alkaline buffers [91]. Our data point to higher TAC of carrot homogenates prepared in phosphate buffer than in water [92]. More hydrophobic antioxidants are poorly extracted by aqueous solution. To obviate this, extraction of food samples aqueous-organic solvents mixtures (methanol, ethanol, acetone, chloroform and other liquids is often performed. Acidification of the extracting medium usually enhances the efficiency of antioxidant extraction. The ratio of solvent volume to the material mass/volume and temperature of extraction may also affect the yield of antioxidant extraction [93].
It is recommended by many authors that the procedure for extraction of antioxidants from foods should combine at least two extraction cycles performed with aqueous-organic solvents with different polarities in order to extract antioxidant compounds with different chemical structures. A general procedure proposed by Pérez -Jimenez, Saura-Calixto et al. to extract antioxidants from different foodstuffs includes extraction with acidic methanol/water (50:50, v/v; pH 2) followed by acetone/water (70:30, v/v) [94,95]. However, there is no solvent that would be entirely satisfactory for extraction of all the antioxidants present in a food, especially those associated with complex carbohydrates and proteins [96]. Consequently, a considerable amount of antioxidants remains in the extraction residues, which is ignored in most chemical and biological studies. Extraction of dried or freeze-dried food samples warrants exact control of the extraction medium, which is not diluted by water present in the material tested. Sometimes antioxidants are released from the non-soluble residue by acidic hydrolysis [28]. A simple method of increasing the availability of antioxidants for TAC assays has been proposed. Its acronym is QUENCHER (a method, which is “quick, easy, new, cheap, and reproducible”, an example of extraordinary scientific marketing) [97] and consists in lyophilization of the sample and adding the lyophilizate to the reaction medium. TAC estimated using the QUENCHER method of sample preparation was higher than that obtained by sample extraction with methanol, ethanol and acetone [97,98]. E.g., TAC values obtained for lamb by the QUENCHER method were 24.5 and 45.8 TE/kg for the FRAP and ABTS● reduction assays, respectively, while values obtained by extraction were 6.8 and 18.7 TE/kg, respectively [98].
Results of TAC assays are expressed in different ways, which often complicates comparison of results reported by various authors. Results of some assays are expressed as TE, i.e., the amount the μmol or mmol of Trolox showing the same antioxidant capacity as a gram, kilogram or liter of the sample [6,15,99]. The higher the antioxidant content of the sample, the higher its TE value. Trolox, a vitamin E analogue devoid of the long hydrophobic chain of tocopherols does not have any physiological significance and its choice as the standard for antioxidant capacity is arbitrary; however, it is a useful compound, soluble both in aqueous solutions and in hydrophobic solvents (at concentrations sufficient for TAC assays). Some authors use other standards such as vitamin C; the results are roughly, but not exactly the same as expressed in TE. To make comparisons somewhat more troublesome, the results are sometimes reported in μg or mg instead of μmol or mmol. This is only a matter of calculation, but expressing using other standards, such as mg or mmol quercetin, can make comparisons impossible if the relative antioxidant activity of different standards are not given for the conditions of the assay. Some studies do not employ any standard but report only per cent inhibition of reaction or per cent reduction of an indicator. As this percentage of inhibition or reduction will depend on the reaction conditions, especially the concentration of the indicator of sample taken in each case, it is not possible to compare studies that use different initial conditions [28,100,101]. Therefore, the use of a generally acknowledge standard should be recommended in TAC assays.
4. Why to Assay the Total Antioxidant Capacity of Food Products?
4.1. Comparison of the Antioxidant Value of Food Components: Databases of Food Total Antioxidant Capacity
The popularization of the free radical theory of aging [102,103], postulating that free radicals and other reactive oxygen species are responsible for aging of organisms, and abundant evidence that oxidative stress (OS) accompanies numerous diseases, such as atherosclerosis, cardiovascular diseases, neurodegeneration, and cancer [5,104,105,106,107,108], leading to suggestions that these diseases are caused by OS, has raised great interest in antioxidants. Cells and tissues are equipped with numerous enzymatic antioxidant defense systems, which routinely keep under control the potentially deleterious oxidative reactions. Food products are a natural source of antioxidants, so consuming food rich in antioxidants has been advertised as a rational, natural way to enhance the antioxidant potential of the body, and thus prolong life and avoid diseases. This view has been partly supported by results of numerous studies and meta-analyses. For example, supplementation with selected antioxidants such as vitamin E reduced mortality caused by all pathophysiological causes (APC mortality) [109]. Higher dietary intake of vitamin C, carotenoids, and α-tocopherol (as markers of fruit and vegetable intake) were associated with reduced risk of cardiovascular disease, total cancer, and APC mortality [110].
However, such expectations were not fully confirmed. There are abundant data questioning beneficial health effects of excess of antioxidants [111,112] and it was concluded by many researchers that “the consumption of mega-doses of antioxidants (i.e., pills) has generally failed to prevent human disease, in part because they do not decrease oxidative damage in vivo” [113]. β-Carotene supplementation has not been shown to have any beneficial effect on cancer prevention. Conversely, it was associated with increased risk not only of lung cancer but also of gastric cancer in smokers and asbestos workers [114]. Generally, it was recommended to increase the consumption of natural antioxidants in food, especially the fruit and vegetable intake, but not antioxidant supplement use, for chronic disease prevention [110].
Along this way, databases of food TAC have been developed. Such databases, apart from providing information for consumers interested in high antioxidant uptake, are useful as tools for epidemiological investigations concerning the health benefits of dietary antioxidants. The first TAC database included data on 32 vegetables, 23 fruits, 19 berries, 11 tubers, 18 cereals, 10 pulses, six nuts, and four dried fruits measured by the FRAP assay. The results demonstrated that there was more than a 1000-fold difference of TAC values in various dietary plants, and that berries were the most antioxidant rich foods [115]. Later, using the same FRAP method, the database was extended up to 1113 food samples obtained from the US Department of Agriculture (USDA) National Food and Nutrient Analysis Program and included plant and animal products, beverages, cooked foods prepared using conventional and composite foods of several brands. Based on typical US serving sizes, blackberries, walnuts, strawberries, artichokes, cranberries, brewed coffee, raspberries, pecan nuts, blueberries, ground cloves, grape juice, red wine, and unsweetened baking chocolate were at the top of the ranked list [116]. The database was further enlarged to include over 3100 foods, beverages, spices, herbs and supplements purchased at local stores and markets in Scandinavia, USA and Europe, and from the African, Asian and South American continents. Interestingly, this study revealed that the antioxidant capacity of human breast milk is comparable to that in pomegranate juice, strawberries, and coffee [117] (data available at 12937_2009_259_MOESM1_ESM.PDF).
Another database was constructed on the basic of the ORAC test considering both lipophilic and hydrophilic antioxidant components in over 100 different foods from four different regions and during two different seasons in US markets. Lipophilic ORAC values were <10% of the hydrophilic ones, except for some nut samples [118]. USDA presented two successive ORAC of Selected Foods reports; the latter one included 326 items. The database was released on the USDA website; however, after two years the USDA Nutrient Data Laboratory removed it as a result of the lack of a direct correspondence of ORAC results with physiological effects. Moreover, it became obvious that ORAC values were misused by manufacturing companies when promoting their products, and by consumers when choosing food and dietary supplements [3,119].
Several smaller databases were developed. One of them covered fresh and dry fruits, commonly consumed in India using the ABTS●, DPPH● and FRAP methods [120], another covered roots, tubers and vegetables analyzed by DPPH● and FRAP methods [121]. The hydrophilic ORAC method was used for the TAC analysis of vegetables and fruit commonly consumed in Singapore [122,123] (databases in Supplementary data of [122,123]). The hydrophilic ORAC and DPPH● methods were employed to compare TAC of vegetables and fruits commonly consumed in Japan [124] (database in Supplementary data of [124]). The hydrophilic and lipophilic ORAC method was used to analyze basic food items commonly consumed in South Africa population [125]. A TAC database of foods and beverages commonly consumed in Italy has also been constructed using ABTS●, DPPH● and FRAP assays, various procedures for antioxidant extraction [119,126,127,128]. A database of TAC of dishes most widely consumed at university canteens based on the DPPH●, FRAP, and ORAC methods has been published in Spain [129].
One objection against food TAC databases was that most TAC databases only include information on the consumption of raw-state foodstuffs, whereas nutritional properties and biological activity are known to be significantly influenced by food processing [130]. Nevertheless, some databases contain data on processed foods. Moreover, this question seems even more complex (see (7)).
4.2. Total Antioxidant Capacity as a Measure of Food Origin and Quality
Total antioxidant capacity was found useful for evaluation of the botanical origin of honey as honey derived from various flowers differ in TAC vales [131].
Seemingly, TAC could serve as a measure of food quality and freshness. Indeed, frozen storage (−20°C) for up to 1 y decreased TAC of goose meat although was not the most sensitive parameter (malondialdehyde content showed more spectacular changes) [132]. Similarly, TAC may be an auxiliary parameter for estimation of milk quality during storage [133]. A 15-day storage of 19 fruits and vegetables at 4 °C led to decrease in TAC, correlating with the loss of principal antioxidant components [134]. TAC was essentially maintained during 8-week storage of kiwifruits at 1 °C, confirming the suitability of this method of storage [135].
However, in many cases, TAC increases during storage, especially in the case of fruits, perhaps due to their ripening during storage. TAC of blood oranges decreases during 180-d storage at 2 and 5 °C, increasing transiently in some cultivars, thus being a parameter allowing for the choice of best cultivars for storage, and optimal storage conditions [136]. A transient increase in TAC, conditioned by continuing synthesis of antioxidant compounds or transformation of existing compounds into derivatives of higher antioxidant activity, was also observed during storage of other fruits, e.g., strawberries [137].
Food irradiation could be expected to decrease TAC. If so, TAC could be a rough dose indicator. Contrary to these expectations, TAC of almond skins irradiated with doses of up to 16 kGy showed an increase [138]. TAC increase was also found for potato tubers irradiated with 200 kGy of electron radiation [139]. TAC of various tea species irradiated with 20 Gy generally decreased when estimated by DPPH● reduction but in most cases increased if estimated by ABTS● reduction [140]. No significant effect of irradiation (1–10 kGy) on the TAC of spices was found [141]. Apparently, various processes take place during irradiation and the decay of some antioxidants is accompanied by the decomposition of others to fragments of higher antioxidant activity, so the net result depends on the composition of a sample.
5. Total Antioxidant Capacity of Diet and Diseases
The TAC databases have been used in epidemiological studies examining the effect of total TAC of the diet on the risk of diseases. Total TAC of the diet was estimated on the basis of dietary questionnaires and TAC databases. One study showed a statistically significant association between TAC and total mortality in elderly subjects at high cardiovascular risk [142]. An inverse relationship between dietary TAC and APC mortality was confirmed for adult population [143]. Other studies also showed a significant inverse association between dietary TAC and APC mortality and cancer [144] and an inverse association between dietary TAC intake and APC mortality as well as mortality due to cancer and cardiovascular diseases, the correlations being the strongest among current smokers [145]. In the Singapore-Chinese Health Study, higher dietary TAC in midlife was associated with a lower risk of APC, cardiovascular and respiratory disease mortality [146]. Other authors found that dietary TAC was inversely associated with risk of colorectal, gastric and endometrial cancer [147].
An inverse association between the dietary TAC and the risk of gastrointestinal cancers [148], in particular gastric cancer [149], was found. Dietary TAC (excluding supplements) was found to be inversely associated with rectal cancer risk [150]. Increased dietary TAC was associated with a decreasing risk of colon cancer but an increased risk of rectal cancer [151]. Other studies found inverse relations between dietary TAC and colorectal cancer risk [152,153]. A smaller case-control study suggested an inverse association between the dietary TAC and the risk of colorectal cancer and colorectal adenomatous polyps [154]. An inverse relation between the dietary TAC from diet and supplements combined was associated with a reduced odds of high aggressive prostate cancer [155]. No association was found between the dietary TAC and risk of endometrial cancer though total phenolic consumption may decrease endometrial cancer risk [156]. Little association was found between dietary TAC and the risk of epithelial ovarian cancer [157] while other studies found an inverse relation between TAC of the diet and the risk of endometrial cancer [158] and breast cancer [159]. A case-control study indicated an inverse association of dietary TAC with the risk of breast cancer, in particular among postmenopausal women [160]. Another case-control study showed no association between dietary TAC and odds of breast cancer [161]. Inverse relationship was found between the dietary TAC and the risk of hepatocellular carcinoma [162] and pancreatic cancer [163]. Other authors found an inverse relationship of the dietary TAC with odds of glioma in adults [164]. Disease-free survival in patients who underwent breast cancer surgery was positively correlated with total dietary TAC [165].
Divergent results were reported in studies of the effect of the dietary TAC on cardiovascular and neurodegenerative diseases. In postmenopausal women, dietary TAC was inversely related to depression and anxiety scores but there was no significant association between dietary TAC and stress score [166]. Some studies found no association between the TAC od the diet and the risk of dementia and of ischemic and hemorrhagic stroke [167], and with cognitive decline in the elderly [168]. Others found an inverse relationship between the TAC of diet and myocardial infarction incidence [169], and the risk of heart failure [170] as well as total stroke and hemorrhagic stroke [171]. Other studies confirmed that higher TAC of the diet decreases the probability of ischemic stroke [172,173].
An inverse association between dietary TAC and the risk of chronic diseases was found [174]. An inverse association TAC of the diet and risk of type 2 diabetes was observed up to values of 15 mmol/day, after which the effect reached a plateau [175] although another study found no appreciable association between dietary TAC and the risk of type 2 diabetes in adults [176]. An inverse relation was also found between dietary TAC and occurrence of metabolic syndrome [177,178], abdominal obesity and hypertension as well as body mass and abdominal fat gain [179]. Dietary TAC was found to be inversely associated with the risk of osteoporosis in postmenopausal women and positively associated with bone mass in both pre- and postmenopausal women [179]. High dietary TAC was associated to a decreased odd of hypertension in women [180] and a reduced risk of H. pylori infection in adults [181].
No association was revealed between dietary TAC and LDL-cholesterol or triglyceride levels [182]. Another study found a positive association of TAC assayed by ABTS● reduction and obesity, no association between TAC assayed by FRAP and obesity, and no association between TAC values and waist circumference [183]. In all dietary patterns except for the “Grain, bean, nuts, vegetables & fruits”, dietary TAC was inversely associated with hypertriglyceridemia [184]. Another study found that dietary TAC values were inversely associated with glycemia, total cholesterol: HDL-cholesterol ratio, triglycerides and oxidized-LDL concentrations, waist circumference values and central obesity occurrence while positively associated with HDL-cholesterol concentrations [185].
A large summary of results of studies on the relationships between TAC of food and diseases was provided by Pellegrini et al. [119].
6. Effect of Processing on the Food Total Antioxidant Capacity
It could be expected that TAC will be the highest in minimally processed foods (foods that have been slightly altered for the main purpose of preservation without substantially changing its nutritional content of the food, e.g., by cleaning and removing inedible or unwanted parts, grinding or refrigeration), lower in processed foods (foods supplemented with ingredients such as oil and packaged, such as are simple bread, cheese, tofu, and canned tuna or beans), and the lowest in ultra-processed foods (foods which underwent multiple processes, contain many added ingredients, and are highly manipulated, e.g., soft drinks, chips, chocolate, candy, ice-cream, sweetened breakfast cereals, packaged soups, chicken nuggets, hotdogs or fries). However, the expectation is not always fulfilled since processing may also enhance TAC [186]. Moreover, various food processing techniques often include fortification and the use of antioxidant additives [187].
Processing involving heat treatment not always decreases TAC of food. Many studies have demonstrated that compounds of antioxidant properties may occur in increased quantities and with enhanced bioavailability following food processing protocols, which involve, for example, moderate heating or enzymatic disruption of cell walls [188].
In most cases, heat treatment positively affects the measured antioxidant capacity of food although this effect depends on the type of food and method of assay. Deep-frying, sautéing and boiling of potato, tomato, eggplant and pumpkin conserved or increased their TAC [189]. Stir-frying, steaming, microwaving, and boiling increased the TAC of water spinach; stir-frying, steaming and microwaving increased the TAC of cabbage [190]. Boiling, steaming, and frying of carrots, courgettes, and broccoli augmented their TAC [191]. Boiling and steaming had different effects on TAC of various frozen vegetables, depending on the method of assay. Boiling decreased TAC of all vegetables in the ABTS● reduction and FRAP assays while steaming decreased the TAC of carrot and cauliflower but increased the TAC of spinach in the FRAP assay. Steaming decreased the TAC of cauliflower but increased the TAC of carrot and spinach [192]. We found an increase in TAC of carrots estimated by ABTS● and DPPH● reduction and FRAP after boiling [91]. TAC decreased after cooking of whole grains of sorghum, fonio, and millet [193]. Two cooking methods (i.e., “risotto” and boiling) decreased TAC of rice, the decrease being smaller for the “risotto” [194]. Boiling, steaming and microwaving increased TAC of pepper, broccoli, spinach and green beans. Boiling and steaming increased the TAC of squash; boiling decreased the TAC of peas and leek [195]. The total antioxidant capacity of potato and Swiss chard was not significantly affected by cooking procedures (cooking, pressure cooking and microwaving), whereas it decreased for spinach and peas, and increased for tomato and carrots [196]. Cooking of mushrooms decreased TAC of some species while increasing the TAC of other species [197]. TAC of orange sweet potato and red rice decreased upon cooking [198] but microwave cooking increased the TAC of flakes and bran due to increased release of solids [199]. Cooking duration increased or decreased TAC of pasta, depending on the flour, but the changes were limited [200].
TAC of meat was found to decrease generally upon cooking [98] although another study pointed to an initial increase of TAC of meat heated at 180 °C, to an apparent maximum at 5 min followed by sudden decreases until 15 min and a slight increase in the final stage of heating when estimated by ABTS● and DPPH● scavenging, and to a continuous increase of TAC estimated by FRAP starting from 5 min, even up to five-fold after 20 min in the case of beef [201]. The changes of TAC during cooking can be explained considering factors such as degradation of endogenous antioxidants on one hand, and, on the other hand, increased extractability of antioxidant components due to matrix softening, denaturation and exposure of reactive protein sites as well as conversion of some food components into more antioxidant chemical species (as the formation of Maillard reaction products having antioxidant properties).
High-pressure processing (HPP) is an emerging non-thermal technology of minimal processing of i.a. fruits and fruit products, having the potential to inactivate the microbial load while exerting minimal effects on the nutritional and organoleptic properties of food products [202]. HPP (400–550 Mpa) induced a transient increase in TAC of mango pulp [203]. TAC decreased during storage (45 days, 5 or 25 °C) of HPP-cupped strawberry but increased during storage of HPP-strawberry syrup [204]. Strawberry jam stabilized by HPP retained higher TAC than jam stabilized thermally [205]. TAC of HPP-stabilized fruit and vegetable smoothie decreased during 26-day storage at 25°C [206]. A review on the effect of HPP on TAC of food products was recently published [202].
7. Is the Measured Total Antioxidant Capacity Only a Top of an Iceberg?
It was shown that “global antioxidant response” [207,208], i.e., TAC measured after simulated gastric digestion (digestion with pepsin at low pH followed by simulated intestinal digestion (digestion with pancreatin, usually in the presence of bile salts) was higher than TAC measured in pooled methanol-water and acetone-water extracts. E.g., for lamb extraction-based TAC and “global antioxidant response” values were 6.8 and 10.6 mmol (TE/kg), respectively, when estimated by FRAP, and 18.7 and 248.1 mmol TE/kg, respectively, when estimated by ABTS● reduction [203]. In vitro digestion increased TAC of edible mushrooms by up to 1400% [197].
It is generally believed that plant-derived food is the main contributor to the TAC of food. However, it was found that digestion and subsequent fermentation by gut microbiota considerably increases TAC of non-plant products, especially meat. E. g., TAC of digested meat was 15.2 µmol TE/kg while TAC digested by gut fermentation was 278 µmol TE /kg and total TAC of food (to be consumed + liberated by digestion + liberated by gut fermentation) was 294 µmol TE/kg (TAC was estimated by DPPH reduction). Thus, the real TAC of meat liberated by digestion in the intestinal tract is two orders of magnitude higher than that estimated for food to be consumed. Similar results were obtained for dairy products. Therefore, foods of animal origin contribute to around 50% of the daily TAC intake if digestion in the gastrointestinal tract is considered [209]. Interestingly, fermentation by fecal bacteria from lean children released more TAC than by fecal bacteria from obese children [210]. If the TAC of food measured is only a fraction of that released in the gastrointestinal tract, what is their real physiological meaning?
8. How Does the Total Antioxidant Capacity of Food Affect the Antioxidant Status of the Consumers?
The question of the effect of the TAC of food on the antioxidant status of the organism raised many controversies. Many studies demonstrated that consumption of high-TAC food, especially fruits, leads to a postprandial transient increase of the TAC of blood plasma [211,212]. An increase in the blood plasma TAC was observed also after the consumption of tea and red wine [213,214].
However, studies on the effects of antioxidant-rich foods on the TAC of blood plasma usually do not quantify the antioxidants contributing to the plasma TAC; the latter may be not the same compounds as those ingested in food. For example, the increase of plasma TAC after consumption of apples is due to the effect of fructose present in the fruits (stimulation of AMP degradation to urate by releasing the inhibitory effect of ATP and phosphate on 5′-nucleotidase and AMP deaminase, which augments the level of uric acid). The effect can be mimicked by the ingestion of an equivalent amount of fructose [215,216]. This argument was questioned, however, in the case of consumption of strawberries where changes in the ascorbic acid but not urea concentrations were responsible for the postprandial increase in TAC [217].
Although polyphenols contribute significantly to TAC of plant-derived food, their bioavailability is low and their maximal plasma concentration rarely exceeds 1 μM after consumption of polyphenol-rich foods and beverages, and 3 μM after intake of pure compounds [218]. A comprehensive analysis of literature data identified 301 polyphenol metabolites without prior enzymatic hydrolysis of biofluids. They included glucuronide and sulfate esters, glycosides, aglycones, and O-methyl ethers. Median maximum plasma concentrations of all human metabolites were 0.09 and 0.32 μM when consumed from foods or dietary supplements, respectively. Median time to reach maximum plasma concentration in humans as 2.18 h. Polyphenols absorbed without further metabolism accounted for about one third of these values [219]. The contribution of such concentration of polyphenols to the TAC of blood plasma (hundreds μM > 1 mM, depending on the assay) is negligible. No correlation was found between the dietary intake of polyphenols and serum TAC in European adolescents in the HELENA study [220].
How this information can be reconciled with the reported beneficial health effects of high dietary TAC presented above? Firstly, these beneficial effects may be critically dependent on some critical contributors to TAC, such as antioxidant vitamins; their intake can be expected to correlate with total dietary TAC. Secondly, the positive health effects of diet components may depend not on their antioxidant effects, but on interactions with specific receptors and effects on signaling pathways. For these effects, much lower doses of these compounds are needed. For example, isoflavones are phytoestrogens and their pseudo-hormonal effect may be more important than their antioxidant action [221,222].
9. What Is the Importance of Measurements of Total Antioxidant Capacity of Food Products?
Measurements of TAC, especially of body fluids, but also of food products, have been seriously criticized. It has been argued that TAC is only a surrogate marker of food quality [3].
As discussed by Forman et al. [223] food antioxidants, with the exception of antioxidant vitamins, cannot contribute significantly to free radical scavenging in the human body. Their concentrations are negligible due to low bioavailability and they cannot compete for reactive free radicals with the endogenous antioxidants which are much more abundant; moreover, most of antioxidant reactions in vivo are two-electron reactions, making one-electron radical scavenging properties of food components irrelevant to antioxidant defense in the human body.
Some antioxidants in foods contribute to food quality by functioning as preservatives preventing oxidative decay (e.g., of food lipids during shelf-life). Subsequent to ingestion, antioxidants, such as ascorbic acid and a-tocopherol, may be taken up and may exert similar antioxidant function in the systemic circulation and in tissues. However, other food antioxidants, including flavonoids, phenolic acids, and other phytochemicals, may not act as efficient antioxidants within the organism. As discussed above, they are generally poorly absorbed and undergo extensive first-pass metabolism in the intestine and liver during which redox-active hydroxyl groups are conjugated with functional groups (e.g., glucuronic acids, sulfate, methyl substituents), which compromises or abolishes their antioxidant function. As concluded by Pompella et al. [3], the significance and applicability of information obtained with TAC assays “is limited and should be used, with due caution, for the evaluation of food quality only, but not food biofunctionality”. According to Fraga et al. [224] “the assessment of TAC in foods can be useful for selected purposes and upon validation with other methods, including an initial characterization of the individual components with antioxidant capacity. In the case of using food TAC values to assess biological effects, its validity would be restricted to the oral cavity and the gastrointestinal tract”.
Undoubtedly, TAC methods can be useful as screening assays for food quality control and as low-cost, high-throughput tools used to discover potential antioxidant sources [225] and follow changes in the content of antioxidants during food processing. As with every research tool, it should be rationally used and its effects should be cautiously interpreted. Effects revealed by TAC assays should be followed and explained using more specific methods.
Author Contributions
G.B. was responsible for the concept of the review and had a leading role in the preparation of the manuscript. I.S.-B. participated in the preparation as well as revision of the manuscript. Both authors read and approved the final manuscript. All authors have read and agreed to the published version of the manuscript.
Funding
This research was funded by financial resources of the Ministry of Science and Higher Education for the maintenance of the research potential of the Institute of Food Technology and Nutrition, University of Rzeszow, Project PB/PB/2022.
Institutional Review Board Statement
Not applicable.
Informed Consent Statement
Not applicable.
Data Availability Statement
Not applicable.
Conflicts of Interest
The authors declare no conflict of interest.
References
- Bartosz, G. Total antioxidant capacity. Adv. Clin. Chem. 2003, 37, 219–292. [Google Scholar] [PubMed]
- Sies, H. Total antioxidant capacity: Appraisal of a concept. J. Nutr. 2007, 137, 1493–1495. [Google Scholar] [CrossRef] [Green Version]
- Pompella, A.; Sies, H.; Wacker, R.; Brouns, F.; Grune, T.; Biesalski, H.K.; Frank, J. The use of total antioxidant capacity as surrogate marker for food quality and its effect on health is to be discouraged. Nutrition 2014, 30, 791–793. [Google Scholar] [CrossRef] [PubMed]
- Bartosz, G. Non-enzymatic antioxidant capacity assays: Limitations of use in biomedicine. Free Radic. Res. 2010, 44, 711–720. [Google Scholar] [CrossRef]
- Sies, H. Oxidative stress: A concept in redox biology and medicine. Redox Biol. 2015, 4, 180–183. [Google Scholar] [CrossRef] [Green Version]
- Re, R.; Pellegrini, N.; Proteggente, A.; Pannala, A.; Yang, M.; Rice-Evans, C. Antioxidant activity applying an improved ABTS radical cation decolorization assay. Free Radic. Biol. Med. 1999, 26, 1231–1237. [Google Scholar] [CrossRef]
- Kut, K.; Cieniek, B.; Stefaniuk, I.; Bartosz, G.; Sadowska-Bartosz, I. A Modification of the ABTS• Decolorization Method and an Insight into Its Mechanism. Processes 2022, 10, 1288. [Google Scholar] [CrossRef]
- Blois, M.S. Antioxidant determinations by the use of a stable free radical. Nature 1958, 181, 1199–1200. [Google Scholar] [CrossRef]
- de Menezes, B.B.; Frescura, L.M.; Duarte, R.; Villetti, M.A.; da Rosa, M.B. A critical examination of the DPPH method: Mistakes and inconsistencies in stoichiometry and IC50 determination by UV-Vis spectroscopy. Anal. Chim. Acta 2021, 1157, 338398. [Google Scholar] [CrossRef] [PubMed]
- Benzie, I.F.; Strain, J.J. The ferric reducing ability of plasma (FRAP) as a measure of “antioxidant power”: The FRAP assay. Anal. Biochem. 1996, 239, 70–76. [Google Scholar] [CrossRef]
- Benzie, I.F.; Choi, S.W. Antioxidants in food: Content, measurement, significance, action, cautions, caveats, and research needs. Adv. Food Nutr. Res. 2014, 71, 1–53. [Google Scholar]
- Apak, R.; Güçlü, K.; Ozyürek, M.; Karademir, S.E. Novel total antioxidant capacity index for dietary polyphenols and vitamins C and E, using their cupric ion reducing capability in the presence of neocuproine: CUPRAC method. J. Agric. Food Chem. 2004, 52, 7970–7981. [Google Scholar] [CrossRef] [PubMed]
- Özyürek, M.; Güçlü, K.; Tütem, E.; Başkan, K.S.; Erçağ, E.; Çelik, S.E.; Baki, S.; Yıldız, L.; Karaman, S.; Apak, R. A comprehensive review of CUPRAC methodology. Anal. Meth. 2011, 3, 2439–2453. [Google Scholar] [CrossRef]
- Cao, G.; Alessio, H.M.; Cutler, R.G. Oxygen-radical absorbance capacity assay for antioxidants. Free Radic. Biol. Med. 1993, 14, 303–311. [Google Scholar] [CrossRef] [Green Version]
- Ou, B.; Hampsch-Woodill, M.; Prior, R.L. Development and validation of an improved oxygen radical absorbance capacity assay using fluorescein as the fluorescent probe. J. Agric. Food Chem. 2001, 49, 4619–4626. [Google Scholar] [CrossRef]
- Whitehead, T.P.; Thorpe, G.H.G.; Maxwell, S.R.J. Enhanced chemiluminescent assay for antioxidant capacity in biological fluids. Anal. Chim. Acta 1992, 266, 265–277. [Google Scholar] [CrossRef]
- Fedorova, G.F.; Menshov, V.A.; Trofimov, A.V.; Vasilev, R.F. Facile chemiluminescence assay for antioxidative properties of vegetable lipids: Fundamentals and illustrative examples. Analyst 2009, 134, 2128–2134. [Google Scholar] [CrossRef]
- Arnao, M.B.; Cano, A.; Hernández-Ruiz, J.; García-Cánovas, F.; Acosta, M. Inhibition by L-ascorbic acid and other antioxidants of the 2.2'-azino-bis(3-ethylbenzthiazoline-6-sulfonic acid) oxidation catalyzed by peroxidase: a new approach for determining total antioxidant status of foods. Anal. Biochem. 1996, 236, 255–261. [Google Scholar]
- Miller, N.J.; Rice-Evans, C.; Davies, M.J.; Gopinathan, V.; Milner, A. A novel method for measuring antioxidant capacity and its application to monitoring the antioxidant status in premature neonates. Clin. Sci. 1993, 84, 407–412. [Google Scholar] [CrossRef] [Green Version]
- Durmaz, G. Freeze-dried ABTS+ method: A ready-to-use radical powder to assess antioxidant capacity of vegetable oils. Food Chem. 2012, 133, 1658–1663. [Google Scholar] [CrossRef]
- Özyürek, M.; Güçlü, K.; Apak, R. The main and modified CUPRAC methods of antioxidant measurement. Trends Anal. Chem. 2011, 30, 652–664. [Google Scholar] [CrossRef]
- Schaich, K.M.; Tian, X.; Xie, J. Hurdles and pitfalls in measuring antioxidant efficacy: A critical evaluation of ABTS, DPPH, and ORAC assays. J. Funct. Foods 2015, 14, 111–125. [Google Scholar] [CrossRef]
- Staško, A.; Brezová, V.; Biskupič, S.; Mišík, V. The potential pitfalls of using 1,1-diphenyl-2-picrylhydrazyl to characterize antioxidants in mixed water solvents. Free Radic. Res. 2007, 41, 379–390. [Google Scholar] [CrossRef] [PubMed]
- Foti, M.C. Use and Abuse of the DPPH• Radical. J. Agric. Food Chem. 2015, 63, 8765–8776. [Google Scholar] [CrossRef] [PubMed]
- Cheng, Z.; Moore, J.; Yu, L. High-throughput relative DPPH radical scavenging capacity assay. J. Agric. Food Chem. 2006, 54, 7429–7436. [Google Scholar] [CrossRef] [PubMed]
- Femenía-Ríos, M.; García-Pajón, C.M.; Hernández-Galán, R.; Macías-Sánchez, A.J.; Collado, I.G. Synthesis and free radical scavenging activity of a novel metabolite from the fungus Colletotrichum gloeosporioides. Bioorg. Med. Chem. Lett. 2006, 16, 5836–5839. [Google Scholar] [CrossRef]
- Sánchez-Moreno, C.; Larrauri, J.A.; Saura-Calixto, F. A procedure to measure the antiradical efficiency of polyphenols. J. Sci. Food Agric. 1998, 76, 270–276. [Google Scholar] [CrossRef]
- Pérez-Jiménez, J.; Arranz, S.; Tabernero, M.; Díaz-Rubio, M.E.; Serrano, J.; Goñi, I.; Saura-Calixto, F. Updated methodology to determine antioxidant capacity in plant foods, oils and beverages: Extraction, measurement and expression of results. Food Res. Int. 2008, 41, 274–285. [Google Scholar] [CrossRef]
- Benzie, I.F.; Strain, J.J. Simultaneous automated measurement of total ‘antioxidant’ (reducing) capacity and ascorbic acid concentration. Redox Rep. 1997, 3, 233–238. [Google Scholar] [CrossRef]
- Apak, R.; Güçlü, K.; Demirata, B.; Ozyürek, M.; Celik, S.E.; Bektaşoğlu, B.; Berker, K.I.; Ozyurt, D. Comparative evaluation of various total antioxidant capacity assays applied to phenolic compounds with the CUPRAC assay. Molecules 2007, 12, 1496–1547. [Google Scholar] [CrossRef] [Green Version]
- Apak, R.; Güçlü, K.; Ozyürek, M.; Karademir, S.E.; Altun, M. Total antioxidant capacity assay of human serum using copper(II)-neocuproine as chromogenic oxidant: The CUPRAC method. Free Radic Res. 2005, 39, 949–961. [Google Scholar] [CrossRef] [PubMed]
- Berker, K.I.; Güçlü, K.; Demirata, B.; Apak, R. A novel antioxidant assay of ferric reducing capacity measurement using ferrozine as the colour forming complexation reagent. Anal. Meth. 2010, 2, 1770–1778. [Google Scholar] [CrossRef]
- Ozyürek, M.; Bektaşoğlu, B.; Güçlü, K.; Güngör, N.; Apak, R. Simultaneous total antioxidant capacity assay of lipophilic and hydrophilic antioxidants in the same acetone-water solution containing 2% methyl-beta-cyclodextrin using the cupric reducing antioxidant capacity (CUPRAC) method. Anal. Chim. Acta 2008, 630, 28–39. [Google Scholar] [CrossRef] [PubMed]
- Werber, J.; Wang, Y.J.; Milligan, M.; Li, X.; Ji, J.A. Analysis of 2, 2′-azobis(2-amidinopropane) dihydrochloride degradation and hydrolysis in aqueous solutions. J. Pharm. Sci. 2011, 100, 3307–3315. [Google Scholar] [CrossRef]
- Becker, E.M.; Nissen, L.R.; Skibsted, L.H. Antioxidant evaluation protocols: Food quality or health effects. Eur. Food Res. Technol. 2004, 219, 561–571. [Google Scholar] [CrossRef]
- Huang, D.; Ou, B.; Hampsch-Woodill, M.; Flanagan, J.A.; Deemer, E.K. Development and validation of oxygen radical absorbance capacity assay for lipophilic antioxidants using randomly methylated β-cyclodextrin as the solubility enhancer. J. Agric. Food Chem. 2002, 50, 1815–1821. [Google Scholar] [CrossRef]
- Godoy-Navajas, J.; Aguilar Caballos, M.P.; Gomez-Hens, A. Long-wavelength fluorimetric determination of food antioxidant capacity using Nile blue as reagent. J. Agric. Food Chem. 2011, 59, 2235–2240. [Google Scholar] [CrossRef]
- Guclu, K.; Kıbrıslıoğlu, G.; Ozyurek, M.; Apak, R. Development of a fluorescent probe for measurement of peroxyl radical scavenging activity in biological samples. J. Agric. Food Chem. 2014, 62, 1839–1845. [Google Scholar] [CrossRef]
- Nkhili, E.; Brat, P. Reexamination of the ORAC assay: Effect of metal ions. Anal. Bioanal. Chem. 2011, 400, 1451–1458. [Google Scholar] [CrossRef]
- Prior, R.L.; Wu, X.; Schaich, K. Standardized methods for the determination of antioxidant capacity and phenolics in foods and dietary supplements. J. Agric. Food Chem. 2005, 53, 4290–4302. [Google Scholar] [CrossRef]
- Kancheva, V.D.; Dettori, M.A.; Fabbri, D.; Alov, P.; Angelova, S.E.; Slavova-Kazakova, A.K.; Carta, P.; Menshov, V.A.; Yablonskaya, O.I.; Trofimov, A.V.; et al. Natural Chain-Breaking Antioxidants and Their Synthetic Analogs as Modulators of Oxidative Stress. Antioxidants 2021, 10, 624. [Google Scholar] [CrossRef] [PubMed]
- Popa, C.V.; Lungu, L.; Savoiu, M.; Bradu, C.; Dinoiu, V.; Danet, A.F. Total antioxidant activity and phenols and flavonoids content of several plant extracts. Int. J. Food Prop. 2012, 15, 691–701. [Google Scholar] [CrossRef]
- Christodouleas, D.; Papadopoulos, K.; Calokerinos, A.C. Determination of total antioxidant activity of edible oils as well as their aqueous and organic extracts by chemiluminescence. Food Anal. Meth. 2011, 4, 475–484. [Google Scholar] [CrossRef]
- Zargoosh, K.; Ghayeb, Y.; Aeineh, N.; Qandalee, M. Evaluation of antioxidant capacity of hydrophilic and hydrophobic antioxidants using peroxyoxalate chemiluminescence reaction of the novel furandicarboxylate derivative. Food Anal. Meth. 2014, 7, 283–290. [Google Scholar] [CrossRef]
- Iranifam, M.; Al Lawati, H.A. Monitoring the antioxidant capacity in honey and fruit juices using a microfluidic device with a NaHCO3-H2O2-Co2+ chemiluminescence reaction. Food Chem. 2019, 297, 124930. [Google Scholar] [CrossRef]
- Weingerl, V.; Strlič, M.; Kočar, D. Evaluation of the chemiluminometric method for determination of polyphenols in wine. Anal. Lett. 2011, 44, 1310–1322. [Google Scholar] [CrossRef]
- Pegg, R.B.; Amarowicz, R.; Naczk, M.; Shahidi, F. PHOTOCHEM® for determination of antioxidant capacity of plant extracts. In ACS Symposium Series; Shahidi, F., Ho, C.-T., Eds.; Antioxidant Measurement and Applications; American Chemical Society: Washington, DC, USA, 2007; Volume 956, pp. 140–158. [Google Scholar]
- Wesołowska, M.; Dżugan, M. The use of the Photochem device in evaluation of antioxidant activity of Polish honey. Food Anal. Meth. 2017, 10, 1568–1574. [Google Scholar] [CrossRef]
- Ou, B.; Hampsch-Woodill, M.; Flanagan, J.; Deemer, E.K.; Prior, R.L.; Huang, D. Novel fluorometric assay for hydroxyl radical prevention capacity using fluorescein as the probe. J. Agric. Food Chem. 2002, 50, 2772–2777. [Google Scholar] [CrossRef]
- Oyaizu, M. Studies on product of browning reaction prepared from glucose amine. Jpn. J. Nutr. 1986, 44, 307–315. [Google Scholar] [CrossRef] [Green Version]
- Berker, K.I.; Güçlü, K.; Tor, I.; Apak, R. Comparative evaluation of Fe (III) reducing power-based antioxidant capacity assays in the presence of phenanthroline, batho-phenanthroline, tripyridyltriazine (FRAP), and ferricyanide reagents. Talanta 2007, 72, 1157–1165. [Google Scholar] [CrossRef]
- Berker, K.I.; Güçlü, K.; Tor, İ.; Demirata, B.; Apak, R. Total antioxidant capacity assay using optimized ferricyanide/prussian blue method. Food Anal. Meth. 2010, 3, 154–168. [Google Scholar] [CrossRef]
- Lissi, E.; Salim-Hanna, M.; Pascual, C.; del Castillo, M.D. Evaluation of total antioxidant potential (TRAP) and total antioxidant reactivity from luminol-enhanced chemiluminescence measurements. Free Radic. Biol. Med. 1995, 18, 153–158. [Google Scholar] [CrossRef]
- Munteanu, I.G.; Apetrei, C. Analytical Methods Used in Determining Antioxidant Activity: A Review. Int. J. Mol. Sci. 2021, 22, 3380. [Google Scholar] [CrossRef] [PubMed]
- Ghiselli, A.; Serafini, M.; Maiani, G.; Azzini, E.; Ferro-Luzzi, A. A fluorescence-based method for measuring total plasma antioxidant capability. Free Radic. Biol. Med. 1995, 18, 29–36. [Google Scholar] [CrossRef]
- Valkonen, M.; Kuusi, T. Spectrophotometric assay for total peroxyl radical-trapping antioxidant potential in human serum. J. Lipid Res. 1997, 38, 823–833. [Google Scholar] [CrossRef]
- Somogyi, A.; Rosta, K.; Pusztai, P.; Tulassay, Z.; Nagy, G. Antioxidant measurements. Physiol. Meas. 2007, 28, R41. [Google Scholar] [CrossRef]
- Winston, G.W.; Regoli, F.; Dugas, A.J., Jr.; Fong, J.H.; Blanchard, K.A. A rapid gas chromatographic assay for determining oxyradical scavenging capacity of antioxidants and biological fluids. Free Radic. Biol. Med. 1998, 24, 480–493. [Google Scholar] [CrossRef]
- Marco, G.J. A rapid method for evaluation of antioxidants. J. Am. Oil Chem. Soc. 1968, 45, 594–598. [Google Scholar] [CrossRef]
- Prieto, M.A.; Rodríguez-Amado, I.; Vázquez, J.A.; Murado, M.A. β-Carotene assay revisited. application to characterize and quantify antioxidant and prooxidant activities in a microplate. J. Agric. Food Chem. 2012, 60, 8983–8993. [Google Scholar] [CrossRef] [Green Version]
- Lage, M.Á.P.; García, M.A.M.; Álvarez, J.A.V.; Anders, Y.; Curran, T.P. A new microplate procedure for simultaneous assessment of lipophilic and hydrophilic antioxidants and pro-oxidants, using crocin and β-carotene bleaching methods in a single combined assay: Tea extracts as a case study. Food Res. Int. 2013, 53, 836–846. [Google Scholar] [CrossRef] [Green Version]
- Bors, W.; Michel, C.; Saran, M. Inhibition of the bleaching of the carotenoid crocin a rapid test for quantifying antioxidant activity. Biochim. Biophys. Acta 1984, 796, 312–319. [Google Scholar] [CrossRef]
- Tirzitis, G.; Bartosz, G. Determination of antiradical and antioxidant activity: Basic principles and new insights. Acta Biochim. Pol. 2010, 57, 139–142. [Google Scholar] [CrossRef]
- Kotora, P.; Šeršeň, F.; Filo, J.; Loos, D.; Gregáň, J.; Gregáň, F. The scavenging of DPPH, galvinoxyl and ABTS radicals by imine analogs of resveratrol. Molecules 2016, 21, 127. [Google Scholar] [CrossRef] [PubMed] [Green Version]
- Ciuti, R.; Liguri, G. A novel assay for measuring total antioxidant capacity in whole blood and other biological samples. J. Biomed. Sci. Eng. 2017, 10, 60. [Google Scholar] [CrossRef] [Green Version]
- Ozyurt, D.; Demirata, B.; Apak, R. Determination of total antioxidant capacity by a new spectrophotometric method based on Ce (IV) reducing capacity measurement. Talanta 2007, 71, 1155–1165. [Google Scholar] [CrossRef]
- Robaszkiewicz, A.; Bartosz, G. Estimation of antioxidant capacity against pathophysiologically relevant oxidants using Pyrogallol Red. Biochem. Biophys. Res. Commun. 2009, 390, 659–661. [Google Scholar] [CrossRef]
- Robaszkiewicz, A.; Bartosz, G. Estimation of antioxidant capacity against peroxynitrite and hypochlorite with fluorescein. Talanta 2010, 80, 2196–2198. [Google Scholar] [CrossRef] [PubMed]
- Folin, O.; Ciocalteu, V. On tyrosine and tryptophane determinations in proteins. J. Biol. Chem. 1927, 73, 627–650. [Google Scholar] [CrossRef]
- Singleton, V.L.; Rossi, J.A. Colorimetry of total phenolics with phosphomolybdic-phosphotungstic acid reagents. Am. J. Enol. Viticult. 1965, 16, 144–158. [Google Scholar]
- Haque, M.A.; Morozova, K.; Ferrentino, G.; Scampicchio, M. Electrochemical methods to evaluate the antioxidant activity and capacity of foods: A review. Electroanalysis 2021, 33, 1419–1435. [Google Scholar] [CrossRef]
- Cano, A.; Alcaraz, O.; Acosta, M.; Arnao, M.B. On-line antioxidant activity determination: Comparison of hydrophilic and lipophilic antioxidant activity using the ABTS•+ assay. Redox Rep. 2002, 7, 103–109. [Google Scholar] [CrossRef]
- Merola, E.T.; Catherman, A.D.; Yehl, J.B.; Strein, T.G. Determination of total antioxidant capacity of commercial beverage samples by capillary electrophoresis via inline reaction with 2,6-dichlorophenolindophenol. J. Agric. Food Chem. 2009, 57, 6518–6523. [Google Scholar] [CrossRef] [Green Version]
- Kozik, V.; Jarzembek, K.; Jędrzejowska, A.; Bąk, A.; Polak, J.; Bartoszek, M.; Pytlakowska, K. Investigation of Antioxidant Activity of Pomegranate Juices by Means of Electron Paramagnetic Resonance and UV-Vis Spectroscopy. J. AOAC Int. 2015, 98, 866–870. [Google Scholar] [CrossRef]
- Polak, J.; Bartoszek, M.; Lowe, A.R.; Postnikov, E.B.; Chorążewski, M. Antioxidant Properties of Various Alcoholic Beverages: Application of a Semiempirical Equation. Anal. Chem. 2020, 92, 2145–2150. [Google Scholar] [CrossRef] [PubMed]
- Sharpe, E.; Frasco, T.; Andreescu, D.; Andreescu, S. Portable ceria nanoparticle-based assay for rapid detection of food antioxidants (NanoCerac). Analyst 2013, 138, 249–262. [Google Scholar] [CrossRef] [Green Version]
- Teerasong, S.; Jinnarak, A.; Chaneam, S.; Wilairat, P.; Nacapricha, D. Poly (vinyl alcohol) capped silver nanoparticles for antioxidant assay based on seed-mediated nanoparticle growth. Talanta 2017, 170, 193–198. [Google Scholar] [CrossRef] [PubMed]
- Puangbanlang, C.; Sirivibulkovit, K.; Nacapricha, D.; Sameenoi, Y. A paper-based device for simultaneous determination of antioxidant activity and total phenolic content in food samples. Talanta 2019, 198, 542–549. [Google Scholar] [CrossRef] [PubMed]
- Apichai, S.; Thajee, K.; Pattananandecha, T.; Saenjum, C.; Grudpan, K. A Simple Minimized System Based on Moving Drops for Antioxidant Analysis Using a Smartphone. Molecules 2021, 26, 5744. [Google Scholar] [CrossRef]
- López-Alarcón, C.; Denicola, A. Evaluating the antioxidant capacity of natural products: A review on chemical and cellular-based assays. Anal. Chim. Acta 2013, 763, 1–10. [Google Scholar] [CrossRef]
- Meng, D.; Zhang, P.; Zhang, L.; Wang, H.; Ho, C.-T.; Li, S.; Shahidi, F.; Zhao, H. Detection of cellular redox reactions and antioxidant activity assays. J. Funct. Foods 2017, 37, 467–479. [Google Scholar] [CrossRef]
- Meng, D.; Zhang, P.; Li, S.; Ho, C.-T.; Zhao, H. Antioxidant activity evaluation of dietary phytochemicals using Saccharomyces cerevisiae as a model. J. Funct. Foods 2017, 38, 36–44. [Google Scholar] [CrossRef]
- Müller, L.; Fröhlich, K.; Böhm, V. Comparative antioxidant activities of carotenoids measured by ferric reducing antioxidant power (FRAP), ABTS bleaching assay (TEAC). Food Chem. 2011, 129, 139–148. [Google Scholar] [CrossRef]
- Milardović, S.; Iveković, D.; Grabarić, B.S. A novel amperometric method for antioxidant activity determination using DPPH free radical. Bioelectrochemistry 2006, 68, 175–180. [Google Scholar] [CrossRef]
- Buettner, G.R. The pecking order of free radicals and antioxidants: Lipid peroxidation, α-tocopherol, and ascorbate. Arch. Biochem. Biophys. 1993, 300, 535–543. [Google Scholar] [CrossRef] [PubMed]
- Fraga, C.G.; Galleano, M.; Verstraeten, S.V.; Oteiza, P.I. Basic biochemical mechanisms behind the health benefits of polyphenols. Mol. Aspects Med. 2010, 31, 435–445. [Google Scholar] [CrossRef]
- Fraga, C.G.; Sadgdicoglu Celep, G.; Galleano, M. Biochemical actions of plant phenolics compounds: Thermodynamic and kinetic aspects. In Plant Phenolics and Human Health: Biochemistry, Nutrition, and Pharmacology; Fraga, C.G., Ed.; John Wiley & Sons Inc.: Hoboken, NJ, USA, 2010; pp. 91–106. [Google Scholar]
- Pyrzynska, K.; Pękal, A. Application of free radical diphenylpicrylhydrazyl (DPPH) to estimate the antioxidant capacity of food samples. Anal. Meth. 2013, 5, 4288–4295. [Google Scholar] [CrossRef]
- Fadda, A.; Serra, M.; Molinu, M.G.; Azara, E.; Barberis, A.; Sanna, D. Reaction time and DPPH concentration influence antioxidant activity and kinetic parameters of bioactive molecules and plant extracts in the reaction with the DPPH radical. J. Food Compos. Anal. 2014, 35, 112–119. [Google Scholar] [CrossRef]
- Yu, L.; Gao, B.; Li, Y.; Wang, T.T.; Luo, Y.; Wang, J.; Yu, L.L. Home food preparation techniques impacted the availability of natural antioxidants and bioactivities in kale and broccoli. Food Funct. 2018, 9, 585–593. [Google Scholar] [CrossRef] [PubMed]
- Kerchev, P.; Ivanov, S. Influence of extraction techniques and solvents on the antioxidant capacity of plant material. Biotechnol. Biotechnol. Equip. 2008, 22, 556–559. [Google Scholar] [CrossRef] [Green Version]
- Bartosz, G.; Baran, S.; Grzesik-Pietrasiewicz, M.; Sadowska-Bartosz, I. The Antioxidant capacity and hydrogen peroxide formation by black and orange carrots: Black and orange carrots. Agric. Food Sci. 2022, 31, 71–77. [Google Scholar] [CrossRef]
- Michiels, J.A.; Kevers, C.; Pincemail, J.; Defraigne, J.O.; Dommes, J. Extraction conditions can greatly influence antioxidant capacity assays in plant food matrices. Food Chem. 2012, 130, 986–993. [Google Scholar] [CrossRef]
- Pérez-Jiménez, J.; Saura-Calixto, F. Effect of solvent and certain food constituents on different antioxidant capacity assays. Food Res. Int. 2006, 39, 791–800. [Google Scholar] [CrossRef]
- Saura-Calixto, F.; Goñi, I. Antioxidant capacity of the Spanish Mediterranean diet. Food Chem. 2006, 94, 442–447. [Google Scholar] [CrossRef]
- Bravo, L.; Abia, R.; Saura-Calixto, F. Polyphenols as dietary fiber associated compounds. Comparative study on in vivo and in vitro properties. J. Agric. Food Chem. 1994, 42, 1481–1487. [Google Scholar] [CrossRef]
- Gökmen, V.; Serpen, A.; Fogliano, V. Direct measurement of the total antioxidant capacity of foods: The ‘QUENCHER’ approach. Trends Food Sci. Technol. 2009, 20, 278–288. [Google Scholar] [CrossRef]
- Carrillo, C.; Barrio, Á.; Del Mar Cavia, M.; Alonso-Torre, S. Global antioxidant response of meat. J. Sci. Food Agric. 2017, 97, 2358–2365. [Google Scholar] [CrossRef]
- Cao, G.; Russell, M.; Lischner, N.; Prior, R.L. Serum antioxidant capacity is increased by consumption of strawberries, spinach, red wine or vitamin C in elderly women. J. Nutr. 1998, 128, 2383–2390. [Google Scholar] [CrossRef] [Green Version]
- Yu, L.; Perret, J.; Davy, B.; Wilson, J.; Melby, C.L. Antioxidant properties of cereal products. J. Food Sci. 2002, 67, 2600–2603. [Google Scholar] [CrossRef]
- Xu, J.; Yang, F.; Chen, L.; Hu, Y.; Hu, Q. Effect of selenium on increasing the antioxidant activity of tea leaves harvested during the early spring tea producing season. J. Agric. Food Chem. 2003, 51, 1081–1084. [Google Scholar] [CrossRef]
- Harman, D. Aging: A theory based on free radical and radiation chemistry. J. Gerontol. 1956, 11, 298–300. [Google Scholar] [CrossRef] [Green Version]
- Harman, D. Free radical theory of aging: An update: Increasing the functional life span. Ann. N. Y. Acad. Sci. 2006, 1067, 10–21. [Google Scholar] [CrossRef]
- Chen, Z.; Zhong, C. Oxidative stress in Alzheimer’s disease. Neurosci. Bull. 2014, 30, 271–281. [Google Scholar] [CrossRef] [Green Version]
- Bisht, S.; Faiq, M.; Tolahunase, M.; Dada, R. Oxidative stress and male infertility. Nat. Rev. Urol. 2017, 14, 470–485. [Google Scholar] [CrossRef]
- Cabello-Verrugio, C.; Simon, F.; Trollet, C.; Santibañez, J.F. Oxidative Stress in Disease and Aging: Mechanisms and Therapies 2016. Oxid. Med. Cell. Longev. 2017, 2017, 4310469. [Google Scholar] [CrossRef]
- Senoner, T.; Dichtl, W. Oxidative Stress in Cardiovascular Diseases: Still a Therapeutic Target? Nutrients 2019, 11, 2090. [Google Scholar] [CrossRef] [Green Version]
- Luo, J.; Mills, K.; le Cessie, S.; Noordam, R.; van Heemst, D. Ageing, age-related diseases and oxidative stress: What to do next? Age. Res. Rev. 2020, 57, 100982. [Google Scholar] [CrossRef]
- Abner, E.L.; Schmitt, F.A.; Mendiondo, M.S.; Marcum, J.L.; Kryscio, R.J. Vitamin E and all-cause mortality: A meta-analysis. Curr. Aging Sci. 2011, 4, 158–170. [Google Scholar] [CrossRef]
- Aune, D.; Keum, N.; Giovannucci, E.; Fadnes, L.T.; Boffetta, P.; Greenwood, D.C.; Tonstad, S.; Vatten, L.J.; Riboli, E.; Norat, T. Dietary intake and blood concentrations of antioxidants and the risk of cardiovascular disease, total cancer, and all-cause mortality: A systematic review and dose-response meta-analysis of prospective studies. Am. J. Clin. Nutr. 2018, 108, 1069–1091. [Google Scholar] [CrossRef] [Green Version]
- Bouayed, J.; Bohn, T. Exogenous antioxidants—Double-edged swords in cellular redox state: Health beneficial effects at physiologic doses versus deleterious effects at high doses. Oxid. Med. Cell. Longev. 2010, 3, 228–237. [Google Scholar] [CrossRef] [Green Version]
- Berger, R.G.; Lunkenbein, S.; Ströhle, A.; Hahn, A. Antioxidants in food: Mere myth or magic medicine? Crit. Rev. Food Sci. Nutr. 2012, 52, 162–171. [Google Scholar] [CrossRef]
- Halliwell, B. Free radicals and antioxidants: Updating a personal view. Nutr. Rev. 2012, 70, 257–265. [Google Scholar] [CrossRef]
- Druesne-Pecollo, N.; Latino-Martel, P.; Norat, T.; Barrandon, E.; Bertrais, S.; Galan, P.; Hercberg, S. Beta-carotene supplementation and cancer risk: A systematic review and metaanalysis of randomized controlled trials. Int. J. Cancer 2010, 127, 172–184. [Google Scholar] [CrossRef]
- Halvorsen, B.L.; Holte, K.; Myhrstad, M.C.; Barikmo, I.; Hvattum, E.; Remberg, S.F.; Wold, A.B.; Haffner, K.; Baugerød, H.; Andersen, L.F.; et al. A systematic screening of total antioxidants in dietary plants. J. Nutr. 2002, 132, 461–471. [Google Scholar] [CrossRef]
- Halvorsen, B.L.; Carlsen, M.H.; Phillips, K.M.; Bøhn, S.K.; Holte, K.; Jacobs, D.R., Jr.; Blomhoff, R. Content of redox-active compounds (ie, antioxidants) in foods consumed in the United States. Am. J. Clin. Nutr. 2006, 84, 95–135. [Google Scholar] [CrossRef] [Green Version]
- Carlsen, M.H.; Halvorsen, B.L.; Holte, K.; Bøhn, S.K.; Dragland, S.; Sampson, L.; Willey, C.; Senoo, H.; Umezono, Y.; Sanada, C.; et al. The total antioxidant content of more than 3100 foods, beverages, spices, herbs and supplements used worldwide. Nutr. J. 2010, 9, 3. [Google Scholar] [CrossRef]
- Wu, X.; Beecher, G.R.; Holden, J.M.; Haytowitz, D.B.; Gebhardt, S.E.; Prior, R.L. Lipophilic and hydrophilic antioxidant capacities of common foods in the United States. J. Agric. Food Chem. 2004, 52, 4026–4037. [Google Scholar] [CrossRef]
- Pellegrini, N.; Vitaglione, P.; Granato, D.; Fogliano, V. Twenty-five years of total antioxidant capacity measurement of foods and biological fluids: Merits and limitations. J. Sci. Food Agric. 2020, 100, 5064–5078. [Google Scholar] [CrossRef]
- Reddy, C.V.K.; Sreeramulu, D.; Raghunath, M. Antioxidant activity of fresh and dry fruits commonly consumed in India. Food Res. Int. 2010, 43, 285–288. [Google Scholar] [CrossRef]
- Sreeramulu, D.; Raghunath, M. Antioxidant activity and phenolic content of roots, tubers and vegetables commonly consumed in India. Food Res. Int. 2010, 43, 1017–1020. [Google Scholar] [CrossRef]
- Isabelle, M.; Lee, B.L.; Lim, M.T.; Koh, W.P.; Huang, D.; Ong, C.N. Antioxidant activity and profiles of common vegetables in Singapore. Food Chem. 2010, 120, 993–1003. [Google Scholar] [CrossRef]
- Isabelle, M.; Lee, B.L.; Lim, M.T.; Koh, W.P.; Huang, D.; Ong, C.N. Antioxidant activity and profiles of common fruits in Singapore. Food Chem. 2010, 123, 77–84. [Google Scholar] [CrossRef]
- Takebayashi, J.; Oki, T.; Watanabe, J.; Yamasaki, K.; Chen, J.; Sato-Furukawa, M.; Tsubota-Utsugi, M.; Taku, K.; Goto, K.; Matsumoto, T.; et al. Hydrophilic antioxidant capacities of vegetables and fruits commonly consumed in Japan and estimated average daily intake of hydrophilic antioxidants from these foods. J. Food Comp. Anal. 2013, 29, 25–31. [Google Scholar] [CrossRef]
- Rautenbach, F.; Venter, I. Hydrophilic and lipophilic antioxidant capacity of commonly consumed South African fruits, vegetables, grains, legumes, fats/oils and beverages. J. Food Comp. Anal. 2010, 23, 753–761. [Google Scholar] [CrossRef]
- Pellegrini, N.; Serafini, M.; Colombi, B.; Del Rio, D.; Salvatore, S.; Bianchi, M.; Brighenti, F. Total antioxidant capacity of plant foods, beverages and oils consumed in Italy assessed by three different in vitro assays. J. Nutr. 2003, 133, 2812–2819. [Google Scholar] [CrossRef] [Green Version]
- Pellegrini, N.; Serafini, M.; Salvatore, S.; Del Rio, D.; Bianchi, M.; Brighenti, F. Total antioxidant capacity of spices, dried fruits, nuts, pulses, cereals and sweets consumed in Italy assessed by three different in vitro assays. Mol. Nutr. Food Res. 2006, 50, 1030–1038. [Google Scholar] [CrossRef]
- Pellegrini, N.; Miglio, C.; Del Rio, D.; Salvatore, S.; Serafini, M.; Brighenti, F. Effect of domestic cooking methods on the total antioxidant capacity of vegetables. Int. J. Food Sci. Nutr. 2009, 60 (Suppl. 2), 2–22. [Google Scholar] [CrossRef]
- Martínez-Zamora, L.; Peñalver, R.; Ros, G.; Nieto, G. Antioxidant capacity and diet pattern evaluation in a university community in south eastern Spain. Nutr. Hosp. 2021, 38, 1200–1208. [Google Scholar]
- Tanemura, N.; Machii, Y.; Urushihara, H. The first survey of gap between the actual labelling and efficacy information of functional substances in food under the regulatory processes in Japan. J. Funct. Foods 2020, 72, 104047. [Google Scholar] [CrossRef]
- Dżugan, M.; Tomczyk, M.; Sowa, P.; Grabek-Lejko, D. Antioxidant activity as biomarker of honey variety. Molecules 2018, 23, 2069. [Google Scholar] [CrossRef] [Green Version]
- Wereńska, M.; Okruszek, A.; Haraf, G.; Wołoszyn, J.; Goluch, Z. Impact of frozen storage on oxidation changes of some components in goose meat. Poult. Sci. 2022, 101, 101517. [Google Scholar] [CrossRef]
- Gutierrez, A.M.; Boylston, T.D.; Clark, S. Effects of Pro-Oxidants and Antioxidants on the Total Antioxidant Capacity and Lipid Oxidation Products of Milk During Refrigerated Storage. J. Food Sci. 2018, 83, 275–283. [Google Scholar] [CrossRef]
- Galani, J.H.Y.; Patel, J.S.; Patel, N.J.; Talati, J.G. Storage of Fruits and Vegetables in Refrigerator Increases their Phenolic Acids but Decreases the Total Phenolics, Anthocyanins and Vitamin C with Subsequent Loss of their Antioxidant Capacity. Antioxidants 2017, 6, 59. [Google Scholar] [CrossRef] [Green Version]
- Jeong, H.R.; Cho, H.S.; Cho, Y.S.; Kim, D.O. Changes in phenolics, soluble solids, vitamin C, and antioxidant capacity of various cultivars of hardy kiwifruits during cold storage. Food Sci. Biotechnol. 2020, 29, 1763–1770. [Google Scholar] [CrossRef]
- Habibi, F.; Ramezanian, A.; Guillén, F.; Castillo, S.; Serrano, M.; Valero, D. Changes in Bioactive Compounds, Antioxidant Activity, and Nutritional Quality of Blood Orange Cultivars at Different Storage Temperatures. Antioxidants 2020, 9, 1016. [Google Scholar] [CrossRef]
- Dragišić Maksimović, J.; Poledica, M.; Mutavdžić, D.; Mojović, M.; Radivojević, D.; Milivojević, J. Variation in nutritional quality and chemical composition of fresh strawberry fruit: Combined effect of cultivar and storage. Plant Foods Hum. Nutr. 2015, 70, 77–84. [Google Scholar] [CrossRef]
- Harrison, K.; Were, L.M. Effect of gamma irradiation on total phenolic content yield and antioxidant capacity of almond skin extracts. Food Chem. 2007, 102, 932–937. [Google Scholar] [CrossRef]
- Blessington, T.; Scheuring, D.C.; Nzaramba, M.N.; Hale, A.L.; Reddivari, L.; Vestal, T.A.; Maxim, J.E.; Miller, J.C., Jr. The use of low-dose electron-beam irradiation and storage conditions for sprout control and their effects on Xanthophylls, antioxidant capacity, and phenolics in the potato cultivar Atlantic. Am. J. Potato Res. 2015, 92, 609–618. [Google Scholar] [CrossRef]
- Gerolis, L.G.L.; Lameiras, F.S.; Krambrock, K.; Neves, M.J. Effect of gamma radiation on antioxidant capacity of green tea, yerba mate, and chamomile tea as evaluated by different methods. Radiat. Phys. Chem. 2017, 130, 177–185. [Google Scholar] [CrossRef]
- Murcia, M.A.; Egea, I.; Romojaro, F.; Parras, P.; Jiménez, A.M.; Martínez-Tomé, M. Antioxidant evaluation in dessert spices compared with common food additives. Influence of irradiation procedure. J. Agric. Food Chem. 2004, 52, 1872–1881. [Google Scholar] [CrossRef]
- Henríquez-Sánchez, P.; Sánchez-Villegas, A.; Ruano-Rodríguez, C.; Gea, A.; Lamuela-Raventós, R.M.; Estruch, R.; Salas-Salvadó, J.; Covas, M.I.; Corella, D.; Schröder, H.; et al. Dietary total antioxidant capacity and mortality in the PREDIMED study. Eur. J. Nutr. 2016, 55, 227–236. [Google Scholar] [CrossRef]
- Ha, K.; Kim, K.; Sakaki, J.R.; Chun, O.K. Relative Validity of Dietary Total Antioxidant Capacity for Predicting All-Cause Mortality in Comparison to Diet Quality Indexes in US Adults. Nutrients 2020, 12, 1210. [Google Scholar] [CrossRef]
- Parohan, M.; Anjom-Shoae, J.; Nasiri, M.; Khodadost, M.; Khatibi, S.R.; Sadeghi, O. Dietary total antioxidant capacity and mortality from all causes, cardiovascular disease and cancer: A systematic review and dose–response meta-analysis of prospective cohort studies. Eur. J. Nutr. 2019, 58, 2175–2189. [Google Scholar] [CrossRef]
- Bastide, N.; Dartois, L.; Dyevre, V.; Dossus, L.; Fagherazzi, G.; Serafini, M.; Boutron-Ruault, M.C. Dietary antioxidant capacity and all-cause and cause-specific mortality in the E3N/EPIC cohort study. Eur. J. Nutr. 2017, 56, 1233–1243. [Google Scholar] [CrossRef]
- Sheng, L.T.; Jiang, Y.W.; Pan, A.; Koh, W.P. Dietary total antioxidant capacity and mortality outcomes: The Singapore Chinese Health Study. Eur. J. Nutr. 2022, 61, 2375–2382. [Google Scholar] [CrossRef]
- Parohan, M.; Sadeghi, A.; Khatibi, S.R.; Nasiri, M.; Milajerdi, A.; Khodadost, M.; Sadeghi, O. Dietary total antioxidant capacity and risk of cancer: A systematic review and meta-analysis on observational studies. Crit. Rev. Oncol. Hematol. 2019, 138, 70–86. [Google Scholar] [CrossRef]
- Zamani, B.; Daneshzad, E.; Azadbakht, L. Dietary Total Antioxidant Capacity and Risk of Gastrointestinal Cancers: A Systematic Review and Meta-analysis of Observational Studies. Arch. Iran. Med. 2019, 22, 328–335. [Google Scholar]
- Vahid, F.; Rahmani, D.; Davoodi, S.H. Validation of Dietary Antioxidant Index (DAI) and investigating the relationship between DAI and the odds of gastric cancer. Nutr. Metab. 2020, 17, 102. [Google Scholar] [CrossRef]
- Mekary, R.A.; Wu, K.; Giovannucci, E.; Sampson, L.; Fuchs, C.; Spiegelman, D.; Willett, W.C.; Smith-Warner, S.A. Total antioxidant capacity intake and colorectal cancer risk in the Health Professionals Follow-up Study. Cancer Causes Control 2010, 21, 1315–1321. [Google Scholar] [CrossRef] [Green Version]
- Vece, M.M.; Agnoli, C.; Grioni, S.; Sieri, S.; Pala, V.; Pellegrini, N.; Frasca, G.; Tumino, R.; Mattiello, A.; Panico, S.; et al. Dietary Total Antioxidant Capacity and Colorectal Cancer in the Italian EPIC Cohort. PLoS ONE 2015, 10, e0142995. [Google Scholar] [CrossRef] [PubMed] [Green Version]
- La Vecchia, C.; Decarli, A.; Serafini, M.; Parpinel, M.; Bellocco, R.; Galeone, C.; Bosetti, C.; Zucchetto, A.; Polesel, J.; Lagiou, P.; et al. Dietary total antioxidant capacity and colorectal cancer: A large case-control study in Italy. Int. J. Cancer 2013, 133, 1447–1451. [Google Scholar] [CrossRef]
- Amiano, P.; Molina-Montes, E.; Molinuevo, A.; Huerta, J.M.; Romaguera, D.; Gracia, E.; Martín, V.; Castaño-Vinyals, G.; Pérez-Gómez, B.; Moreno, V.; et al. Association study of dietary non-enzymatic antioxidant capacity (NEAC) and colorectal cancer risk in the Spanish Multicase-Control Cancer (MCC-Spain) study. Eur. J. Nutr. 2019, 58, 2229–2242. [Google Scholar] [CrossRef]
- Rafiee, P.; Jafari Nasab, S.; Bahrami, A.; Rezaeimanesh, N.; Jalali, S.; Hekmatdoost, A.; Sadeghi, A.; Naja, F.; Houshyari, M.; Hejazi, E. Dietary total antioxidant capacity and colorectal cancer and colorectal adenomatous polyps: A case-control study. Eur. J. Cancer Prev. 2021, 30, 40–45. [Google Scholar] [CrossRef]
- Vance, T.M.; Wang, Y.; Su, L.J.; Fontham, E.T.; Steck, S.E.; Arab, L.; Bensen, J.T.; Mohler, J.L.; Chen, M.H.; Chun, O.K. Dietary Total Antioxidant Capacity is Inversely Associated with Prostate Cancer Aggressiveness in a Population-Based Study. Nutr. Cancer 2016, 68, 214–224. [Google Scholar] [CrossRef] [Green Version]
- Gifkins, D.; Olson, S.H.; Demissie, K.; Lu, S.E.; Kong, A.N.; Bandera, E.V. Total and individual antioxidant intake and endometrial cancer risk: Results from a population-based case-control study in New Jersey. Cancer Causes Control 2012, 23, 887–895. [Google Scholar] [CrossRef] [Green Version]
- Gifkins, D.; Olson, S.H.; Paddock, L.; King, M.; Demissie, K.; Lu, S.E.; Kong, A.N.; Rodriguez-Rodriguez, L.; Bandera, E.V. Total and individual antioxidant intake and risk of epithelial ovarian cancer. BMC Cancer 2012, 12, 211. [Google Scholar] [CrossRef]
- Rossi, M.; Tavani, A.; Ciociola, V.; Ferraroni, M.; Parpinel, M.; Serafini, M.; Bellocco, R.; Zucchetto, A.; Montella, M.; Serraino, D.; et al. Dietary total antioxidant capacity in relation to endometrial cancer risk: A case-control study in Italy. Cancer Causes Control 2016, 27, 425–431. [Google Scholar] [CrossRef]
- Pantavos, A.; Ruiter, R.; Feskens, E.F.; de Keyser, C.E.; Hofman, A.; Stricker, B.H.; Franco, O.H.; Kiefte-de Jong, J.C. Total dietary antioxidant capacity, individual antioxidant intake and breast cancer risk: The Rotterdam Study. Int. J. Cancer 2015, 136, 2178–2186. [Google Scholar] [CrossRef]
- Sasanfar, B.; Toorang, F.; Maleki, F.; Esmaillzadeh, A.; Zendehdel, K. Association between dietary total antioxidant capacity and breast cancer: A case-control study in a Middle Eastern country. Public Health Nutr. 2021, 24, 965–972. [Google Scholar] [CrossRef]
- Jalali, S.; Heidari, Z.; de Courten, B.; Rashidkhani, B. Dietary Total Antioxidant Capacity and Odds of Breast Cancer: A Case-Control Study. Nutr. Cancer 2022, Aug 16, 1–8. [Google Scholar] [CrossRef]
- Zamora-Ros, R.; Fedirko, V.; Trichopoulou, A.; González, C.A.; Bamia, C.; Trepo, E.; Nöthlings, U.; Duarte-Salles, T.; Serafini, M.; Bredsdorff, L.; et al. Dietary flavonoid, lignan and antioxidant capacity and risk of hepatocellular carcinoma in the European prospective investigation into cancer and nutrition study. Int. J. Cancer 2013, 133, 2429–2443. [Google Scholar] [CrossRef] [PubMed] [Green Version]
- Lucas, A.L.; Bosetti, C.; Boffetta, P.; Negri, E.; Tavani, A.; Serafini, M.; Polesel, J.; Serraino, D.; La Vecchia, C.; Rossi, M. Dietary total antioxidant capacity and pancreatic cancer risk: An Italian case-control study. Br. J. Cancer 2016, 115, 102–107. [Google Scholar] [CrossRef] [Green Version]
- Heydari, M.; Shayanfar, M.; Sharifi, G.; Saneei, P.; Sadeghi, O.; Esmaillzadeh, A. The Association between Dietary Total Antioxidant Capacity and Glioma in Adults. Nutr. Cancer 2021, 73, 1947–1956. [Google Scholar]
- Han, D.; Chung, M.; Park, Y. Association of Dietary Total Antioxidant Capacity with Cancer Recurrence and Mortality among Breast Cancer Survivors: A Prospective Cohort Study. Nutr. Cancer 2022, 74, 3253–3262. [Google Scholar] [CrossRef]
- Abshirini, M.; Siassi, F.; Koohdani, F.; Qorbani, M.; Mozaffari, H.; Aslani, Z.; Soleymani, M.; Entezarian, M.; Sotoudeh, G. Dietary total antioxidant capacity is inversely associated with depression, anxiety and some oxidative stress biomarkers in postmenopausal women: A cross-sectional study. Ann. Gen. Psychiatry 2019, 18, 3. [Google Scholar] [CrossRef]
- Devore, E.E.; Feskens, E.; Ikram, M.A.; den Heijer, T.; Vernooij, M.; van der Lijn, F.; Hofman, A.; Niessen, W.J.; Breteler, M.M. Total antioxidant capacity of the diet and major neurologic outcomes in older adults. Neurology 2013, 80, 904–910. [Google Scholar] [CrossRef] [Green Version]
- Devore, E.E.; Kang, J.H.; Stampfer, M.J.; Grodstein, F. Total antioxidant capacity of diet in relation to cognitive function and decline. Am. J. Clin. Nutr. 2010, 92, 1157–1164. [Google Scholar] [CrossRef] [Green Version]
- Rautiainen, S.; Levitan, E.B.; Orsini, N.; Åkesson, A.; Morgenstern, R.; Mittleman, M.A.; Wolk, A. Total antioxidant capacity from diet and risk of myocardial infarction: A prospective cohort of women. Am. J. Med. 2012, 125, 974–980. [Google Scholar] [CrossRef]
- Rautiainen, S.; Levitan, E.B.; Mittleman, M.A.; Wolk, A. Total antioxidant capacity of diet and risk of heart failure: A population-based prospective cohort of women. Am. J. Med. 2013, 126, 494–500. [Google Scholar] [CrossRef]
- Rautiainen, S.; Larsson, S.; Virtamo, J.; Wolk, A. Total antioxidant capacity of diet and risk of stroke: A population-based prospective cohort of women. Stroke 2012, 43, 335–340. [Google Scholar] [CrossRef] [Green Version]
- Del Rio, D.; Agnoli, C.; Pellegrini, N.; Krogh, V.; Brighenti, F.; Mazzeo, T.; Masala, G.; Bendinelli, B.; Berrino, F.; Sieri, S.; et al. Total antioxidant capacity of the diet is associated with lower risk of ischemic stroke in a large Italian cohort. J. Nutr. 2011, 141, 118–123. [Google Scholar] [PubMed] [Green Version]
- Colarusso, L.; Serafini, M.; Lagerros, Y.T.; Nyren, O.; La Vecchia, C.; Rossi, M.; Ye, W.; Tavani, A.; Adami, H.O.; Grotta, A.; et al. Dietary antioxidant capacity and risk for stroke in a prospective cohort study of Swedish men and women. Nutrition 2017, 33, 234–239. [Google Scholar] [CrossRef] [PubMed]
- Nascimento-Souza, M.A.; Paiva, P.G.; Martino, H.S.D.; Ribeiro, A.Q. Dietary total antioxidant capacity as a tool in health outcomes in middle-aged and older adults: A systematic review. Crit. Rev. Food Sci. Nutr. 2018, 58, 905–912. [Google Scholar] [CrossRef] [PubMed]
- Mancini, F.R.; Affret, A.; Dow, C.; Balkau, B.; Bonnet, F.; Boutron-Ruault, M.C.; Fagherazzi, G. Dietary antioxidant capacity and risk of type 2 diabetes in the large prospective E3N-EPIC cohort. Diabetologia 2018, 61, 308–316. [Google Scholar] [CrossRef] [PubMed] [Green Version]
- Kashino, I.; Serafini, M.; Kurotani, K.; Akter, S.; Mizoue, T.; Ishihara, J.; Kotemori, A.; Sawada, N.; Inoue, M.; Iwasaki, M.; et al. Japan Public Health Center-based Prospective Study Group. Relationship between dietary non-enzymatic antioxidant capacity and type 2 diabetes risk in the Japan Public Health Center-based Prospective Study. Nutrition 2019, 66, 62–69. [Google Scholar] [CrossRef]
- Puchau, B.; Zulet, M.A.; de Echávarri, A.G.; Hermsdorff, H.H.; Martínez, J.A. Dietary total antioxidant capacity is negatively associated with some metabolic syndrome features in healthy young adults. Nutrition 2010, 26, 534–541. [Google Scholar] [CrossRef]
- Bahadoran, Z.; Golzarand, M.; Mirmiran, P.; Shiva, N.; Azizi, F. Dietary total antioxidant capacity and the occurrence of metabolic syndrome and its components after a 3-year follow-up in adults: Tehran Lipid and Glucose Study. Nutr. Metab. (Lond). 2012, 9, 70. [Google Scholar] [CrossRef]
- Kim, D.; Han, A.; Park, Y. Association of Dietary Total Antioxidant Capacity with Bone Mass and Osteoporosis Risk in Korean Women: Analysis of the Korea National Health and Nutrition Examination Survey 2008–2011. Nutrients 2021, 13, 1149. [Google Scholar] [CrossRef]
- Fateh, H.L.; Mirzaei, N.; Gubari, M.I.M.; Darbandi, M.; Najafi, F.; Pasdar, Y. Association between dietary total antioxidant capacity and hypertension in Iranian Kurdish women. BMC Womens Health 2022, 22, 255. [Google Scholar] [CrossRef]
- Nabavizadeh, R.; Sohouli, M.H.; Santos, H.O.; Roustaei, M.; Fatahi, S.; Ghodoosi, N.; Saeidi, R. Higher dietary total antioxidant capacity is inversely associated with Helicobacter pylori infection among adults: A case-control study. Indian J. Gastroenterol. 2022, 41, 258–265. [Google Scholar] [CrossRef]
- Mozaffari, H.; Daneshzad, E.; Surkan, P.J.; Azadbakht, L. Dietary total antioxidant capacity and cardiovascular disease risk factors: A systematic review of observational studies. J. Am. Coll. Nutr. 2018, 37, 533–545. [Google Scholar] [CrossRef]
- Mozaffari, H.; Daneshzad, E.; Larijani, B.; Surkan, P.J.; Azadbakht, L. Association of dietary total antioxidant capacity to anthropometry in healthy women: A cross-sectional study. Nutrition 2020, 69, 110577. [Google Scholar] [CrossRef] [PubMed]
- Kim, S.A.; Joung, H.; Shin, S. Dietary pattern, dietary total antioxidant capacity, and dyslipidemia in Korean adults. Nutr. J. 2019, 18, 37. [Google Scholar] [CrossRef] [PubMed] [Green Version]
- Hermsdorff, H.H.; Puchau, B.; Volp, A.C.; Barbosa, K.B.; Bressan, J.; Zulet, M.Á.; Martínez, J.A. Dietary total antioxidant capacity is inversely related to central adiposity as well as to metabolic and oxidative stress markers in healthy young adults. Nutr. Metab. 2011, 8, 59. [Google Scholar] [CrossRef] [PubMed] [Green Version]
- Lindsay, D.G.; Astley, S.B. European research on the functional effects of dietary antioxidants—EUROFEDA. Mol. Aspects Med. 2002, 23, 1–38. [Google Scholar] [CrossRef]
- Stanley, S.; Basile, A.; Ruiz Tejada, A.; Hjelm, E.; Sweazea, K. Effect of Food Processing on Total Antioxidant Capacity. Curr. Dev. Nutr. 2021, 5 (Suppl. 2), 370. [Google Scholar] [CrossRef]
- Castro, D.R.G.; Mar, J.M.; da Silva, L.S.; da Silva, K.A.; Sanches, E.A.; de Araújo Bezerra, J.; Rodrigues, S.; Fernandes, F.A.N.; Campelo, P.H. Improvement of the Bioavailability of Amazonian Juices Rich in Bioactive Compounds Using Glow Plasma Technique. Food Bioproc. Technol. 2020, 13, 670–679. [Google Scholar] [CrossRef]
- Ramírez-Anaya Jdel, P.; Samaniego-Sánchez, C.; Castañeda-Saucedo, M.C.; Villalón-Mir, M.; de la Serrana, H.L. Phenols and the antioxidant capacity of Mediterranean vegetables prepared with extra virgin olive oil using different domestic cooking techniques. Food Chem. 2015, 188, 430–438. [Google Scholar] [CrossRef]
- Wu, S.; Liu, Y.; Cui, X.; Zhang, Q.; Wang, Y.; Cao, L.; Luo, X.; Xiong, J.; Ruan, R. Assessment of Potential Nitrite Safety Risk of Leafy Vegetables after Domestic Cooking. Foods 2021, 10, 2953. [Google Scholar] [CrossRef]
- Miglio, C.; Chiavaro, E.; Visconti, A.; Fogliano, V.; Pellegrini, N. Effects of different cooking methods on nutritional and physicochemical characteristics of selected vegetables. J. Agric. Food Chem. 2008, 56, 139–147. [Google Scholar] [CrossRef]
- Mazzeo, T.; N’Dri, D.; Chiavaro, E.; Visconti, A.; Fogliano, V.; Pellegrini, N. Effect of two cooking procedures on phytochemical compounds, total antioxidant capacity and colour of selected frozen vegetables. Food Chem. 2011, 128, 627–633. [Google Scholar] [CrossRef]
- N’Dri, D.; Mazzeo, T.; Zaupa, M.; Ferracane, R.; Fogliano, V.; Pellegrini, N. Effect of cooking on the total antioxidant capacity and phenolic profile of some whole-meal African cereals. J. Sci. Food Agric. 2013, 93, 29–36. [Google Scholar] [CrossRef] [PubMed]
- Zaupa, M.; Calani, L.; Del Rio, D.; Brighenti, F.; Pellegrini, N. Characterization of total antioxidant capacity and (poly) phenolic compounds of differently pigmented rice varieties and their changes during domestic cooking. Food Chem. 2015, 187, 338–347. [Google Scholar] [CrossRef] [PubMed]
- Turkmen, N.; Sari, F.; Velioglu, Y.S. (2005). The effect of cooking methods on total phenolics and antioxidant activity of selected green vegetables. Food Chem. 2005, 93, 713–718. [Google Scholar] [CrossRef]
- Natella, F.; Belelli, F.; Ramberti, A.; Scaccini, C. Microwave and traditional cooking methods: Effect of cooking on antioxidant capacity and phenolic compounds content of seven vegetables. J. Food Biochem. 2010, 34, 796–810. [Google Scholar] [CrossRef]
- Ng, Z.X.; Rosman, N.F. In vitro digestion and domestic cooking improved the total antioxidant activity and carbohydrate-digestive enzymes inhibitory potential of selected edible mushrooms. J. Food Sci. Technol. 2019, 56, 865–877. [Google Scholar] [CrossRef]
- Jati, I.R.A.; Darmoatmodjo, L.M.; Suseno, T.I.; Ristiarini, S.; Wibowo, C. Effect of Processing on Bioactive Compounds, Antioxidant Activity, Physicochemical, and Sensory Properties of Orange Sweet Potato, Red Rice, and Their Application for Flake Products. Plants 2022, 11, 440. [Google Scholar] [CrossRef]
- Harasym, J.; Olędzki, R. Comparison of Conventional and Microwave Assisted Heating on Carbohydrate Content, Antioxidant Capacity and Postprandial Glycemic Response in Oat Meals. Nutrients 2018, 10, 207. [Google Scholar] [CrossRef] [Green Version]
- Oduro-Obeng, H.; Fu, B.X.; Beta, T. Influence of cooking duration on carotenoids, physical properties and in vitro antioxidant capacity of pasta prepared from three Canadian durum wheat cultivars. Food Chem. 2021, 363, 130016. [Google Scholar] [CrossRef]
- Serpen, A.; Gökmen, V.; Fogliano, V. Total antioxidant capacities of raw and cooked meats. Meat Sci. 2012, 90, 60–65. [Google Scholar] [CrossRef]
- Pérez-Lamela, C.; Franco, I.; Falqué, E. Impact of High-Pressure Processing on Antioxidant Activity during Storage of Fruits and Fruit Products: A Review. Molecules 2021, 26, 5265. [Google Scholar] [CrossRef]
- Camiro-Cabrera, M.; Escobedo-Avellaneda, Z.; Salinas-Roca, B.; Martín-Belloso, O.; Welti-Chanes, J. High hydrostatic pressure and temperature applied to preserve the antioxidant compounds of mango pulp (Mangifera indica L.). Food Bioproc. Technol. 2017, 10, 639–649. [Google Scholar] [CrossRef]
- Gao, G.; Ren, P.; Cao, X.; Yan, B.; Liao, X.; Sun, Z.; Wang, Y. Comparing quality changes of cupped strawberry treated by high hydrostatic pressure and thermal processing during storage. Food Bioprod. Process. 2016, 100, 221–229. [Google Scholar] [CrossRef]
- Sravani, V.J.; Ravi, N.; Roopa, N.; Kumar, S.; Pandey, A.K.; Chauhan, O.P. Use of high pressure technology for the development of novel jam and its quality evaluation during storage. J. Food Sci. Technol. 2017, 54, 3562–3568. [Google Scholar] [CrossRef] [PubMed]
- Fernandez, M.V.; Denoya, G.I.; Jagus, R.J.; Vaudagna, S.R.; Agüero, M.V. Microbiological, antioxidant and physicochemical stability of a fruit and vegetable smoothie treated by high pressure processing and stored at room temperature. LWT 2019, 105, 206–210. [Google Scholar] [CrossRef]
- Miller, D.D.; Schricker, B.R.; Rasmussen, R.R.; Van Campen, D. An in vitro method for estimation of iron availability from meals. Am. J. Clin. Nutr. 1981, 34, 2248–2256. [Google Scholar] [CrossRef] [PubMed] [Green Version]
- Rufián-Henares, J.A.; Delgado-Andrade, C. Effect of digestive process on Maillard reaction indexes and antioxidant properties of breakfast cereals. Food Res. Int. 2009, 42, 394–400. [Google Scholar] [CrossRef]
- Navajas-Porras, B.; Pérez-Burillo, S.; Valverde-Moya, Á.; Hinojosa-Nogueira, D.; Pastoriza, S.; Rufián-Henares, J.Á. Effect of Cooking Methods on the Antioxidant Capacity of Foods of Animal Origin Submitted to In Vitro Digestion-Fermentation. Antioxidants 2021, 10, 445. [Google Scholar] [CrossRef]
- Navajas-Porras, B.; Pérez-Burillo, S.; Hinojosa-Nogueira, D.; Douros, K.; Pastoriza, S.; Rufián-Henares, J.Á. The Gut Microbiota of Obese Children Releases Lower Antioxidant Capacity from Food than That of Lean Children. Nutrients 2022, 14, 2829. [Google Scholar] [CrossRef]
- Serafini, M.; Del Rio, D. Understanding the association between dietary antioxidants, redox status and disease: Is the total antioxidant capacity the right tool? Redox Rep. 2004, 9, 145–152. [Google Scholar] [CrossRef]
- Harasym, J.; Olędzki, R. Effect of fruit and vegetable antioxidants on total antioxidant capacity of blood plasma. Nutrition 2014, 30, 511–517. [Google Scholar] [CrossRef]
- Melville, C.A. Red wine, tea, and antioxidants. Lancet 1994, 344, 626. [Google Scholar] [PubMed]
- Serafini, M.; Ghiselli, A.; Ferro-Luzzi, A. Red wine, tea, and antioxidants. Lancet 1994, 344, 626. [Google Scholar] [CrossRef]
- Lotito, S.B.; Frei, B. The increase in human plasma antioxidant capacity after apple consumption is due to the metabolic effect of fructose on urate, not apple-derived antioxidant flavonoids. Free Radic. Biol. Med. 2004, 37, 251–258. [Google Scholar] [CrossRef] [PubMed]
- Lotito, S.B.; Frei, B. Consumption of flavonoid-rich foods and increased plasma antioxidant capacity in humans: Cause, consequence, or epiphenomenon? Free Radic. Biol. Med. 2006, 41, 1727–1746. [Google Scholar] [CrossRef]
- Tulipani, S.; Romandini, S.; Busco, F.; Bompadre, S.; Mezzetti, B.; Battino, M. Ascorbate, not urate, modulates the plasma antioxidant capacity after strawberry intake. Food Chem. 2009, 117, 181–188. [Google Scholar] [CrossRef]
- Scalbert, A.; Williamson, G. Dietary intake and bioavailability of polyphenols. J. Nutr. 2000, 130, 2073S–2085S. [Google Scholar] [CrossRef]
- Rothwell, J.A.; Urpi-Sarda, M.; Boto-Ordoñez, M.; Llorach, R.; Farran-Codina, A.; Barupal, D.K.; Neveu, V.; Manach, C.; Andres-Lacueva, C.; Scalbert, A. Systematic analysis of the polyphenol metabolome using the Phenol-Explorer database. Mol. Nutr. Food Res. 2016, 60, 203–211. [Google Scholar] [CrossRef] [Green Version]
- Wisnuwardani, R.W.; De Henauw, S.; Forsner, M.; Gottrand, F.; Huybrechts, I.; Kafatos, A.G.; Kersting, M.; Knaze, V.; Manios, Y.; Nova, E.; et al. Adolescents’ dietary polyphenol intake in relation to serum total antioxidant capacity: The HELENA study. Int. J. Food Sci. Nutr. 2022, 73, 71–81. [Google Scholar] [CrossRef]
- Sirotkin, A.V.; Harrath, A.H. Phytoestrogens and their effects. Eur. J. Pharmacol. 2014, 741, 230–236. [Google Scholar]
- Křížová, L.; Dadáková, K.; Kašparovská, J.; Kašparovský, T. Isoflavones. Molecules, Křížová, L., Dadáková, K., Kašparovská, J., & Kašparovský, T. Isoflavones. Molecules 2019, 24, 1076. [Google Scholar]
- Forman, H.J.; Davies, K.J.; Ursini, F. How do nutritional antioxidants really work: Nucleophilic tone and para-hormesis versus free radical scavenging in vivo. Free Radic. Biol. Med. 2014, 66, 24–35. [Google Scholar] [CrossRef] [Green Version]
- Fraga, C.G.; Oteiza, P.I.; Galleano, M. In vitro measurements and interpretation of total antioxidant capacity. Biochim. Biophys. Acta 2014, 1840, 931–934. [Google Scholar] [CrossRef]
- Alves, A.M.; Dias, T.; Hassimotto, N.M.A.; Naves, M.M.V. Ascorbic acid and phenolic contents, antioxidant capacity and flavonoids composition of Brazilian Savannah native fruits. Food Sci. Technol. 2017, 37, 564–569. [Google Scholar] [CrossRef]
Figure 1.
Structure of substrates used in the most popular assays of TAC: (A) ABTS●, (B) DPPH●, (C) bis(TPTZ)Fe3+, (D) bis(neocuproine)Cu2+, (E) fluorescein, (F) luminol.
Figure 1.
Structure of substrates used in the most popular assays of TAC: (A) ABTS●, (B) DPPH●, (C) bis(TPTZ)Fe3+, (D) bis(neocuproine)Cu2+, (E) fluorescein, (F) luminol.
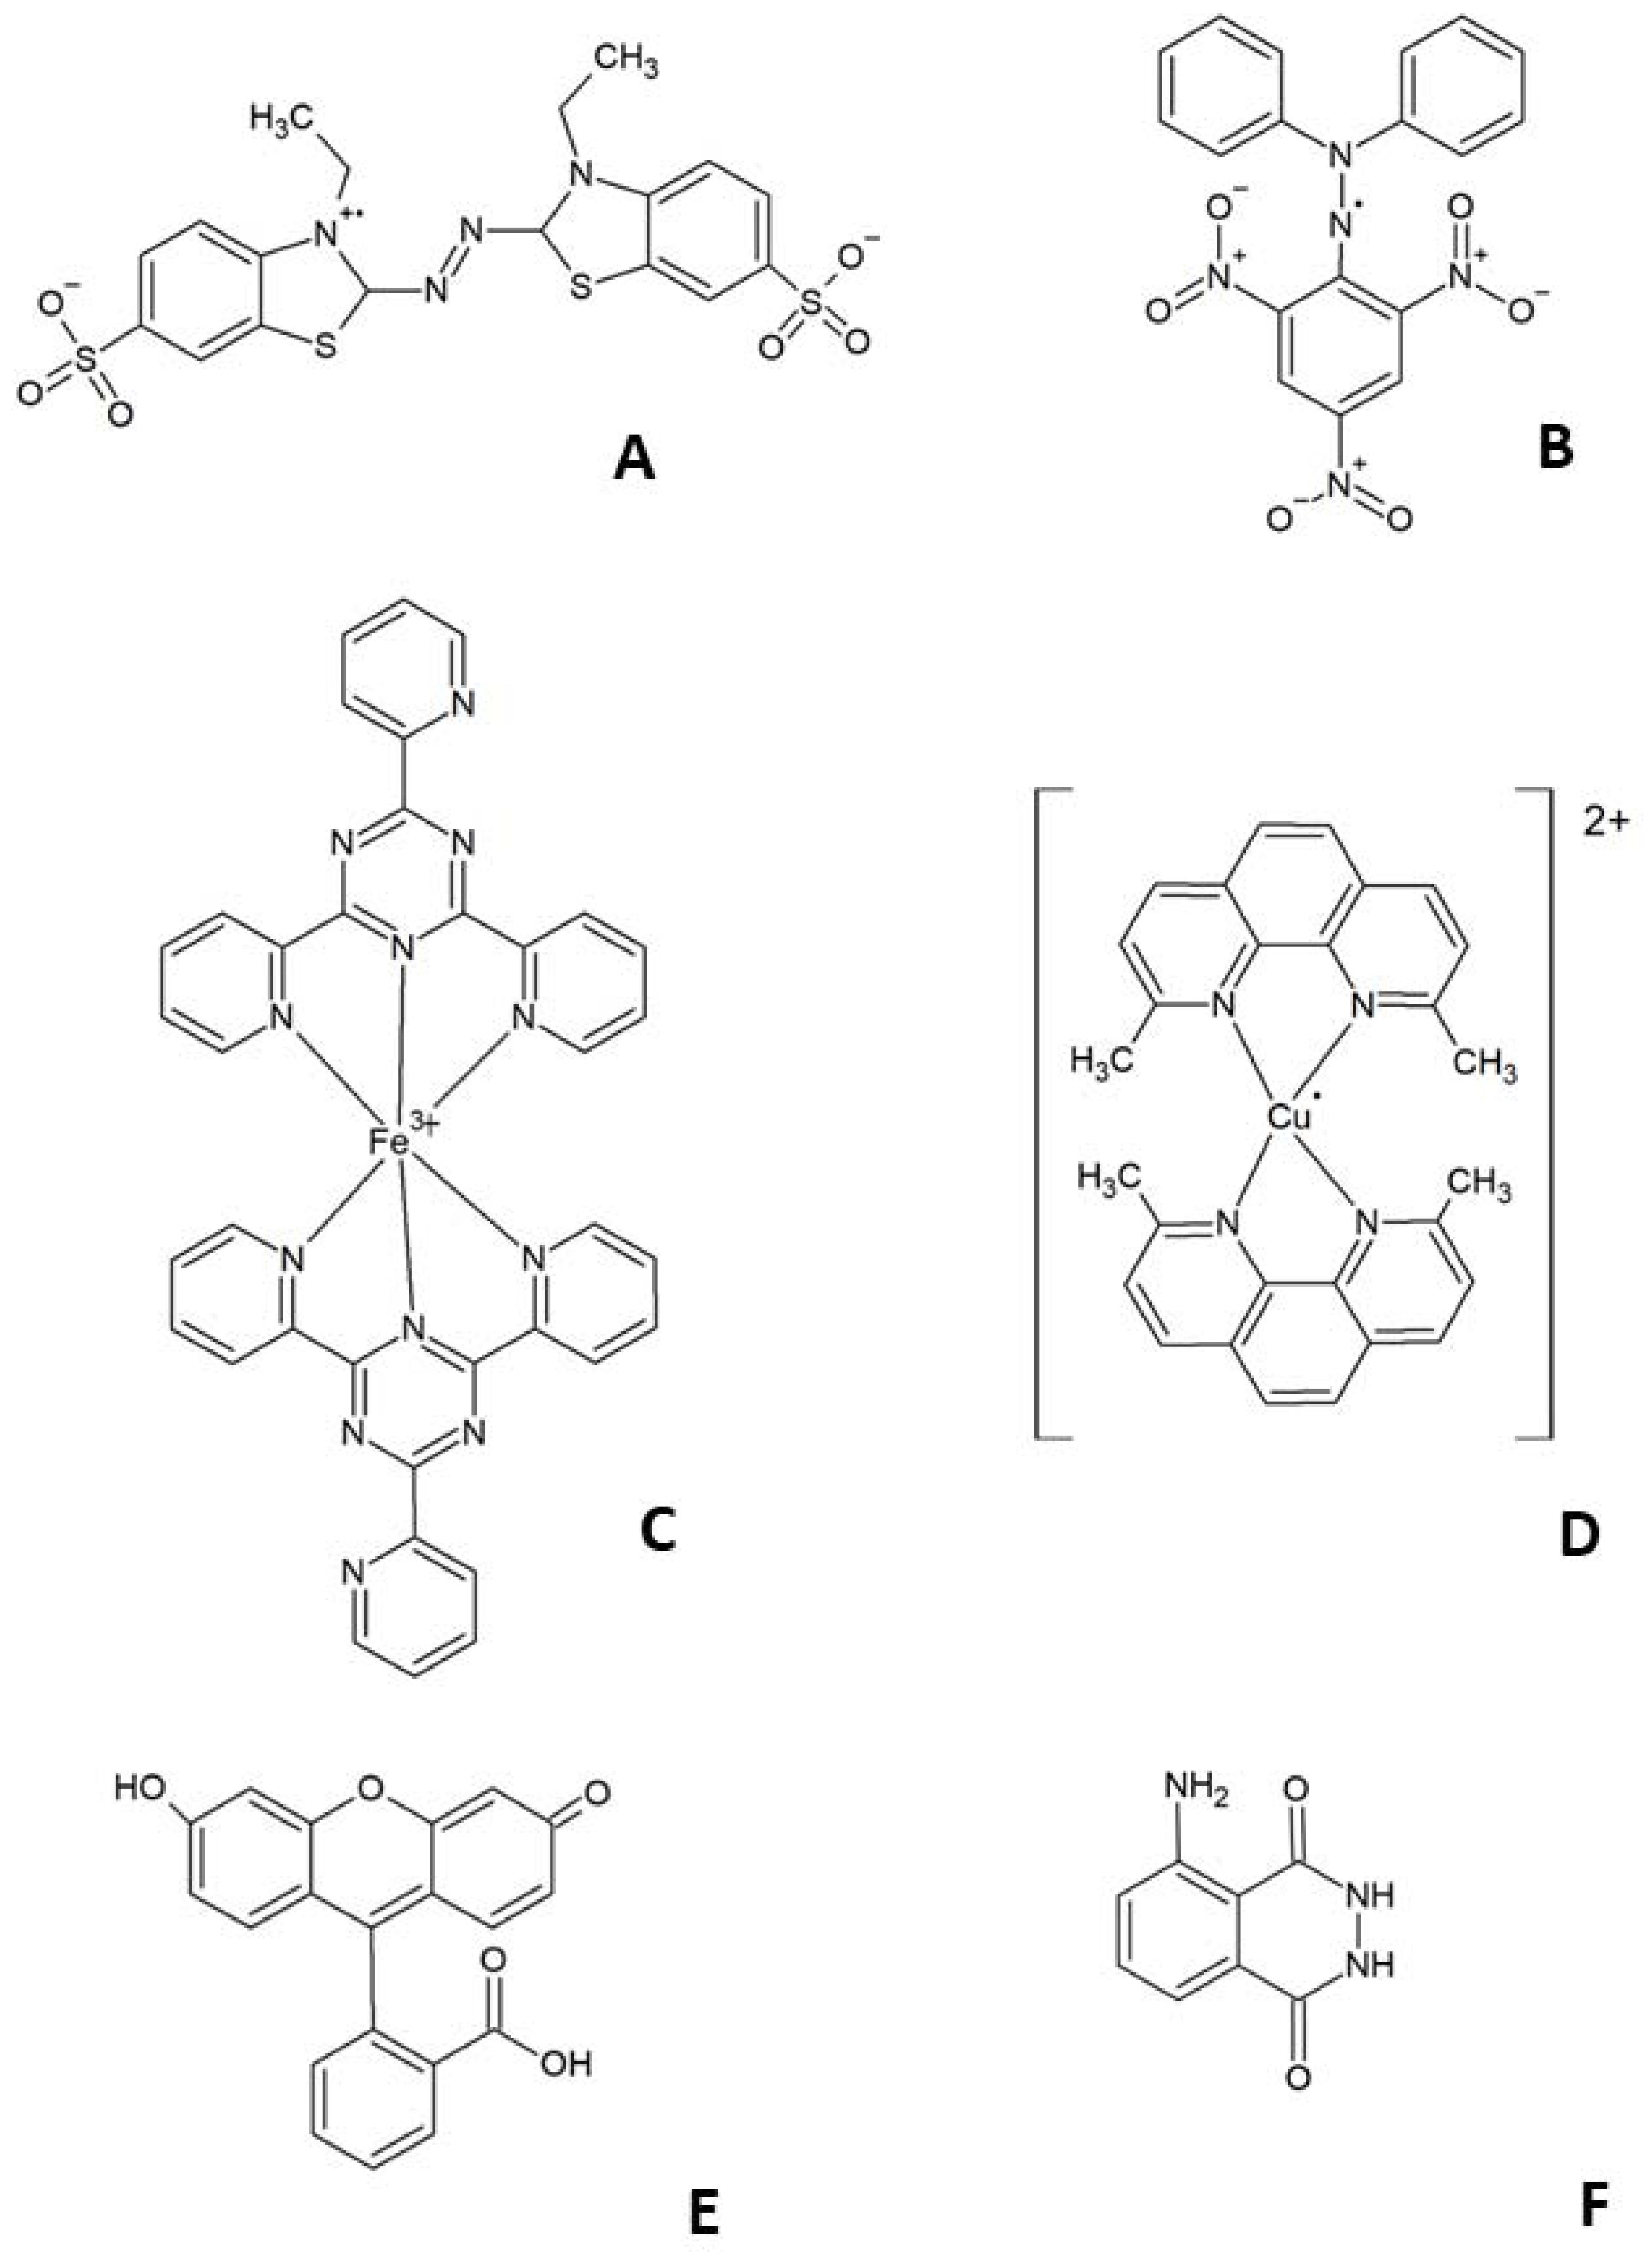

Table 1.
Most popular assays of total antioxidant capacity.
| Method | Principle of Measurement | References |
|---|---|---|
| ABTS● reduction | Decrease in absorbance of solution of pre-formed ABTS● radical (usually at 734 or 414 nm) | [6,7] |
| DPPH● reduction | Decrease in absorbance of solution of the stable DPPH● radical (around 517 nm) | [8,9] |
| FRAP | Increase in absorbance of Fe2+-TPTZ complex upon reduction of Fe3+ to Fe2+ (at 593 nm) | [10,11] |
| CUPRAC | Increase in absorbance of bis(neocuproine)copper(+) upon reduction of Cu2+ to Cu+ (at 540 nm) | [12,13] |
| ORAC CL assay | Inhibition of fluorescence decrease of R-phycoerythrin or fluorescein induced by a source of peroxyl radicals Inhibition of chemiluminescence of a detector induced by an oxidant | [14,15] [16,17] |
Publisher’s Note: MDPI stays neutral with regard to jurisdictional claims in published maps and institutional affiliations. |
© 2022 by the authors. Licensee MDPI, Basel, Switzerland. This article is an open access article distributed under the terms and conditions of the Creative Commons Attribution (CC BY) license (https://creativecommons.org/licenses/by/4.0/).
Share and Cite
MDPI and ACS Style
Sadowska-Bartosz, I.; Bartosz, G. Evaluation of The Antioxidant Capacity of Food Products: Methods, Applications and Limitations. Processes 2022, 10, 2031. https://doi.org/10.3390/pr10102031
AMA Style
Sadowska-Bartosz I, Bartosz G. Evaluation of The Antioxidant Capacity of Food Products: Methods, Applications and Limitations. Processes. 2022; 10(10):2031. https://doi.org/10.3390/pr10102031
Chicago/Turabian StyleSadowska-Bartosz, Izabela, and Grzegorz Bartosz. 2022. "Evaluation of The Antioxidant Capacity of Food Products: Methods, Applications and Limitations" Processes 10, no. 10: 2031. https://doi.org/10.3390/pr10102031
Note that from the first issue of 2016, this journal uses article numbers instead of page numbers. See further details here.