
Machine Learning-Based Forest Burned Area Detection with Various Input Variables: A Case Study of South Korea

 , ,
, ,  , , and
Abstract
:1. Introduction
2. Study Area and Data
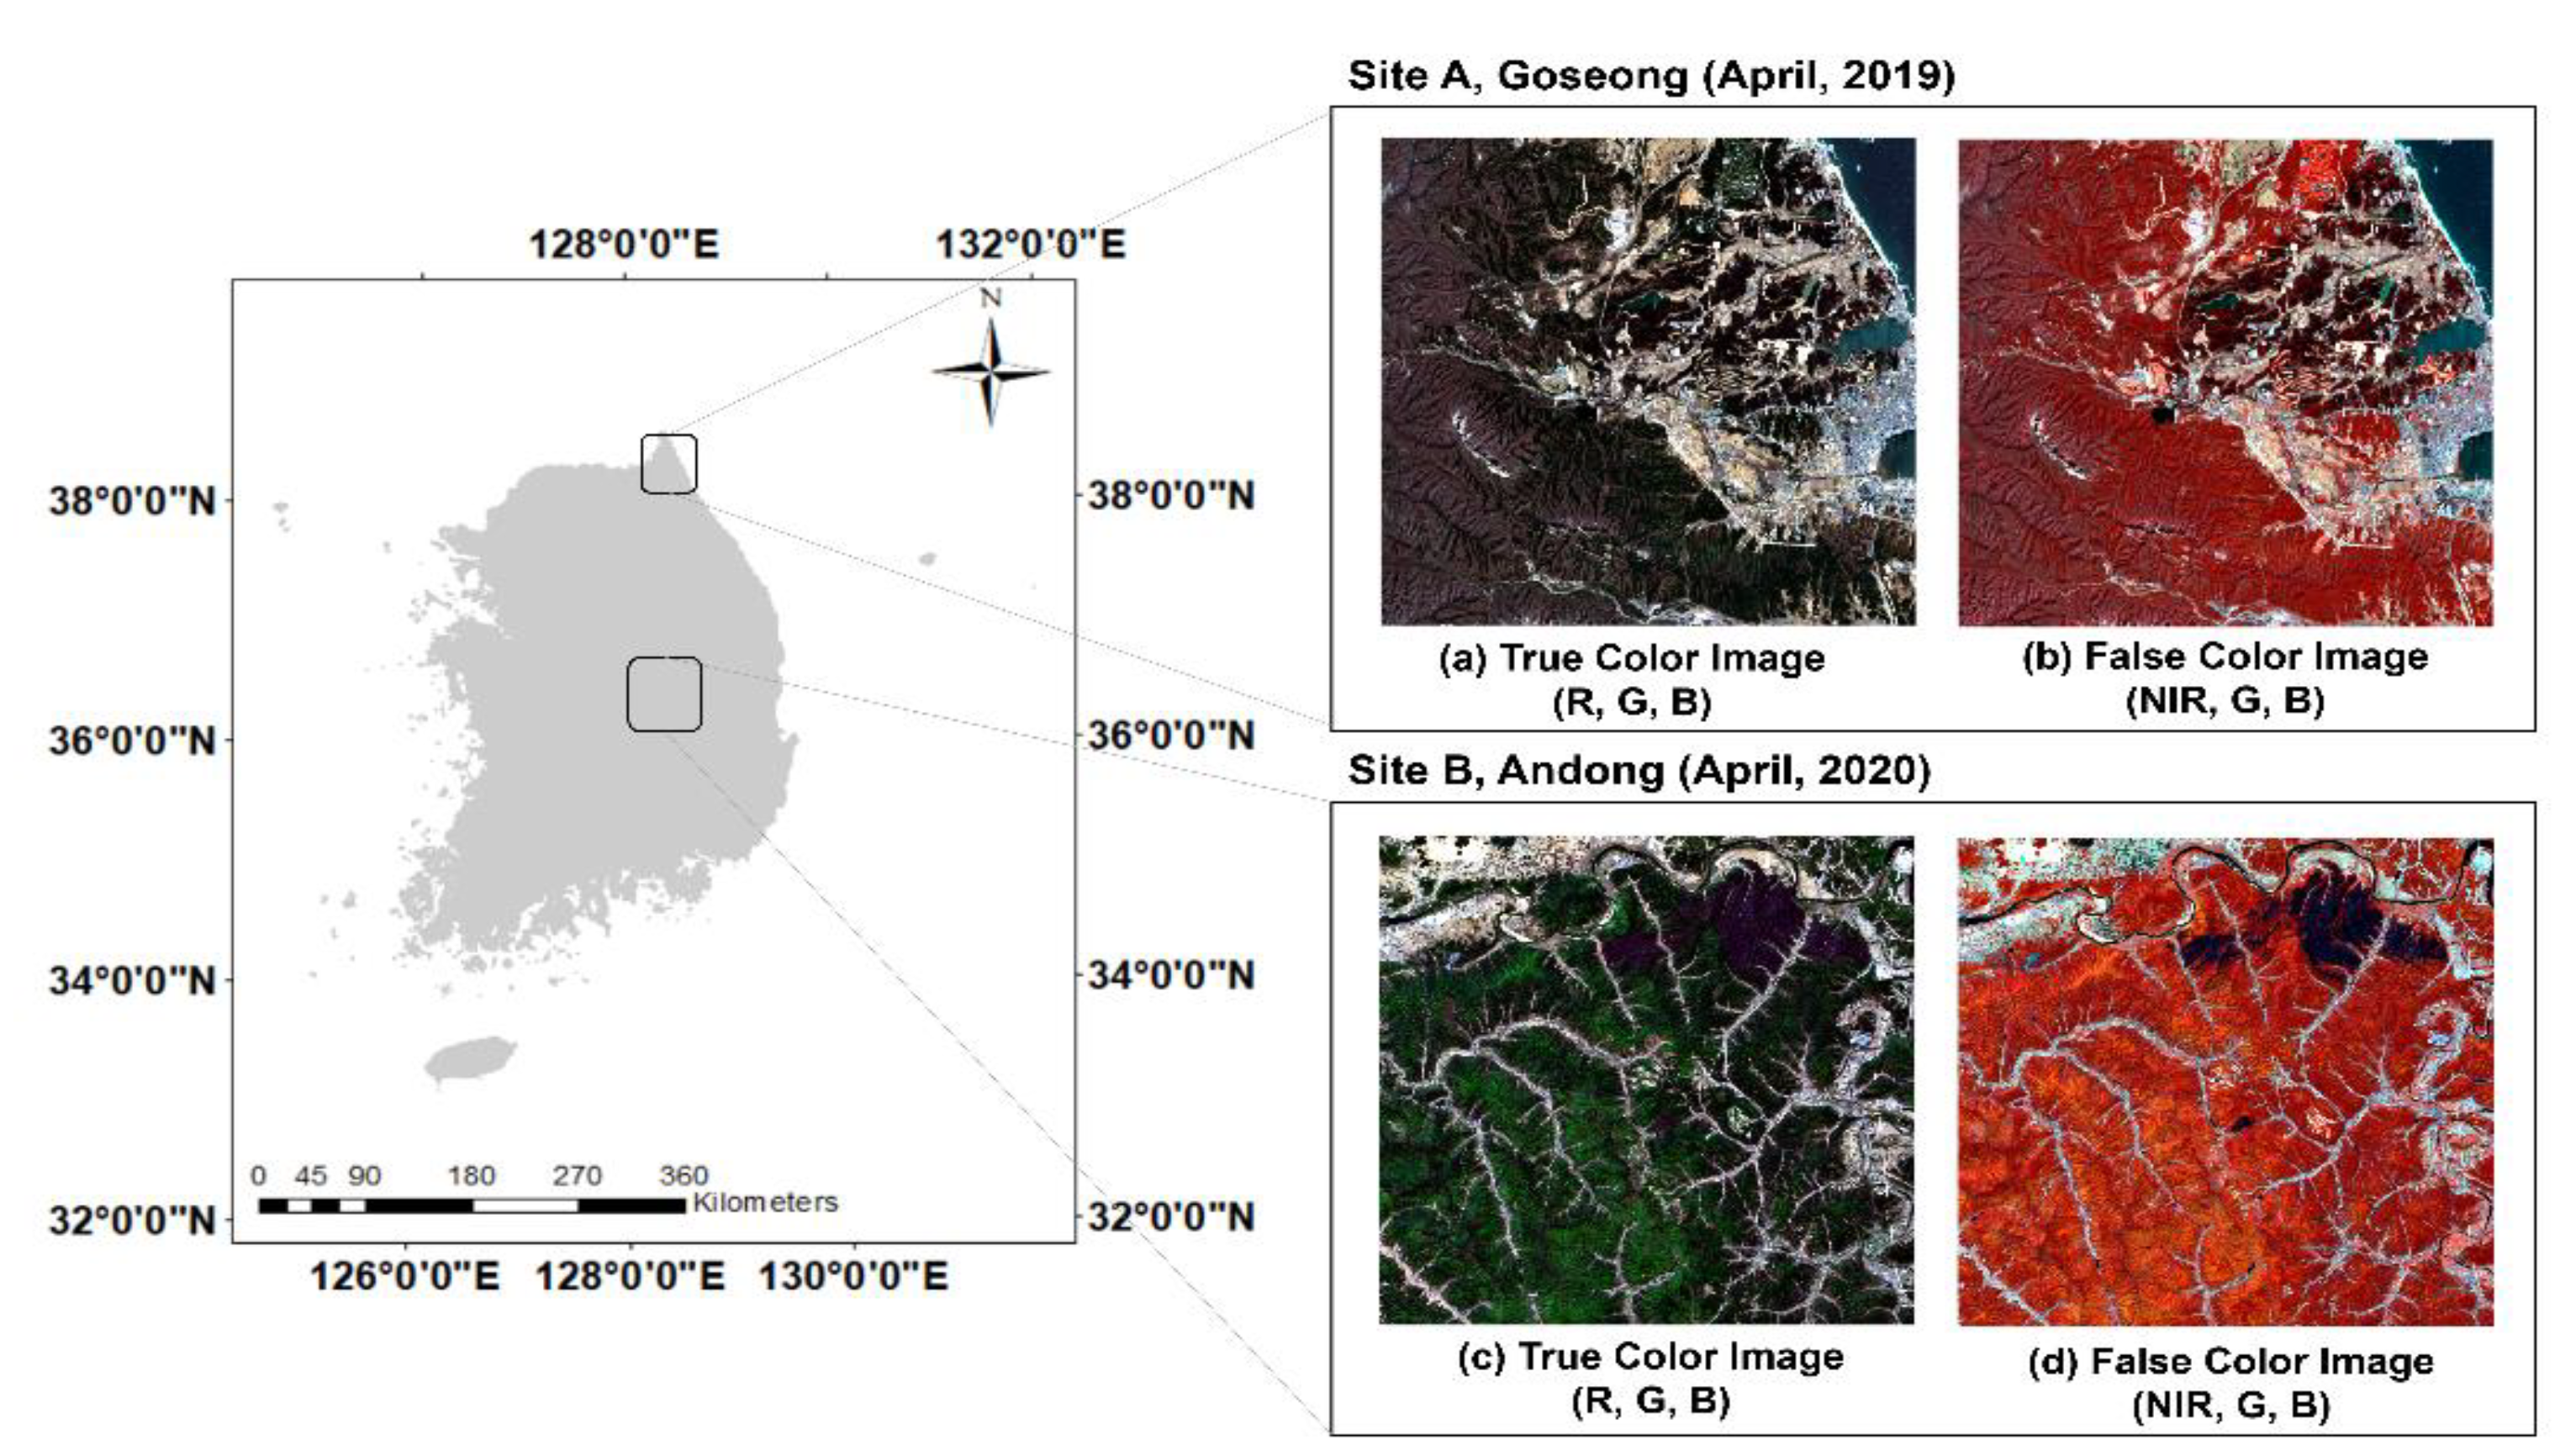
2.1. Study Area
2.2. Data Preparation
3. Methodology
3.1. Machine Learning Approches
3.1.1. LightGBM
3.1.2. RF
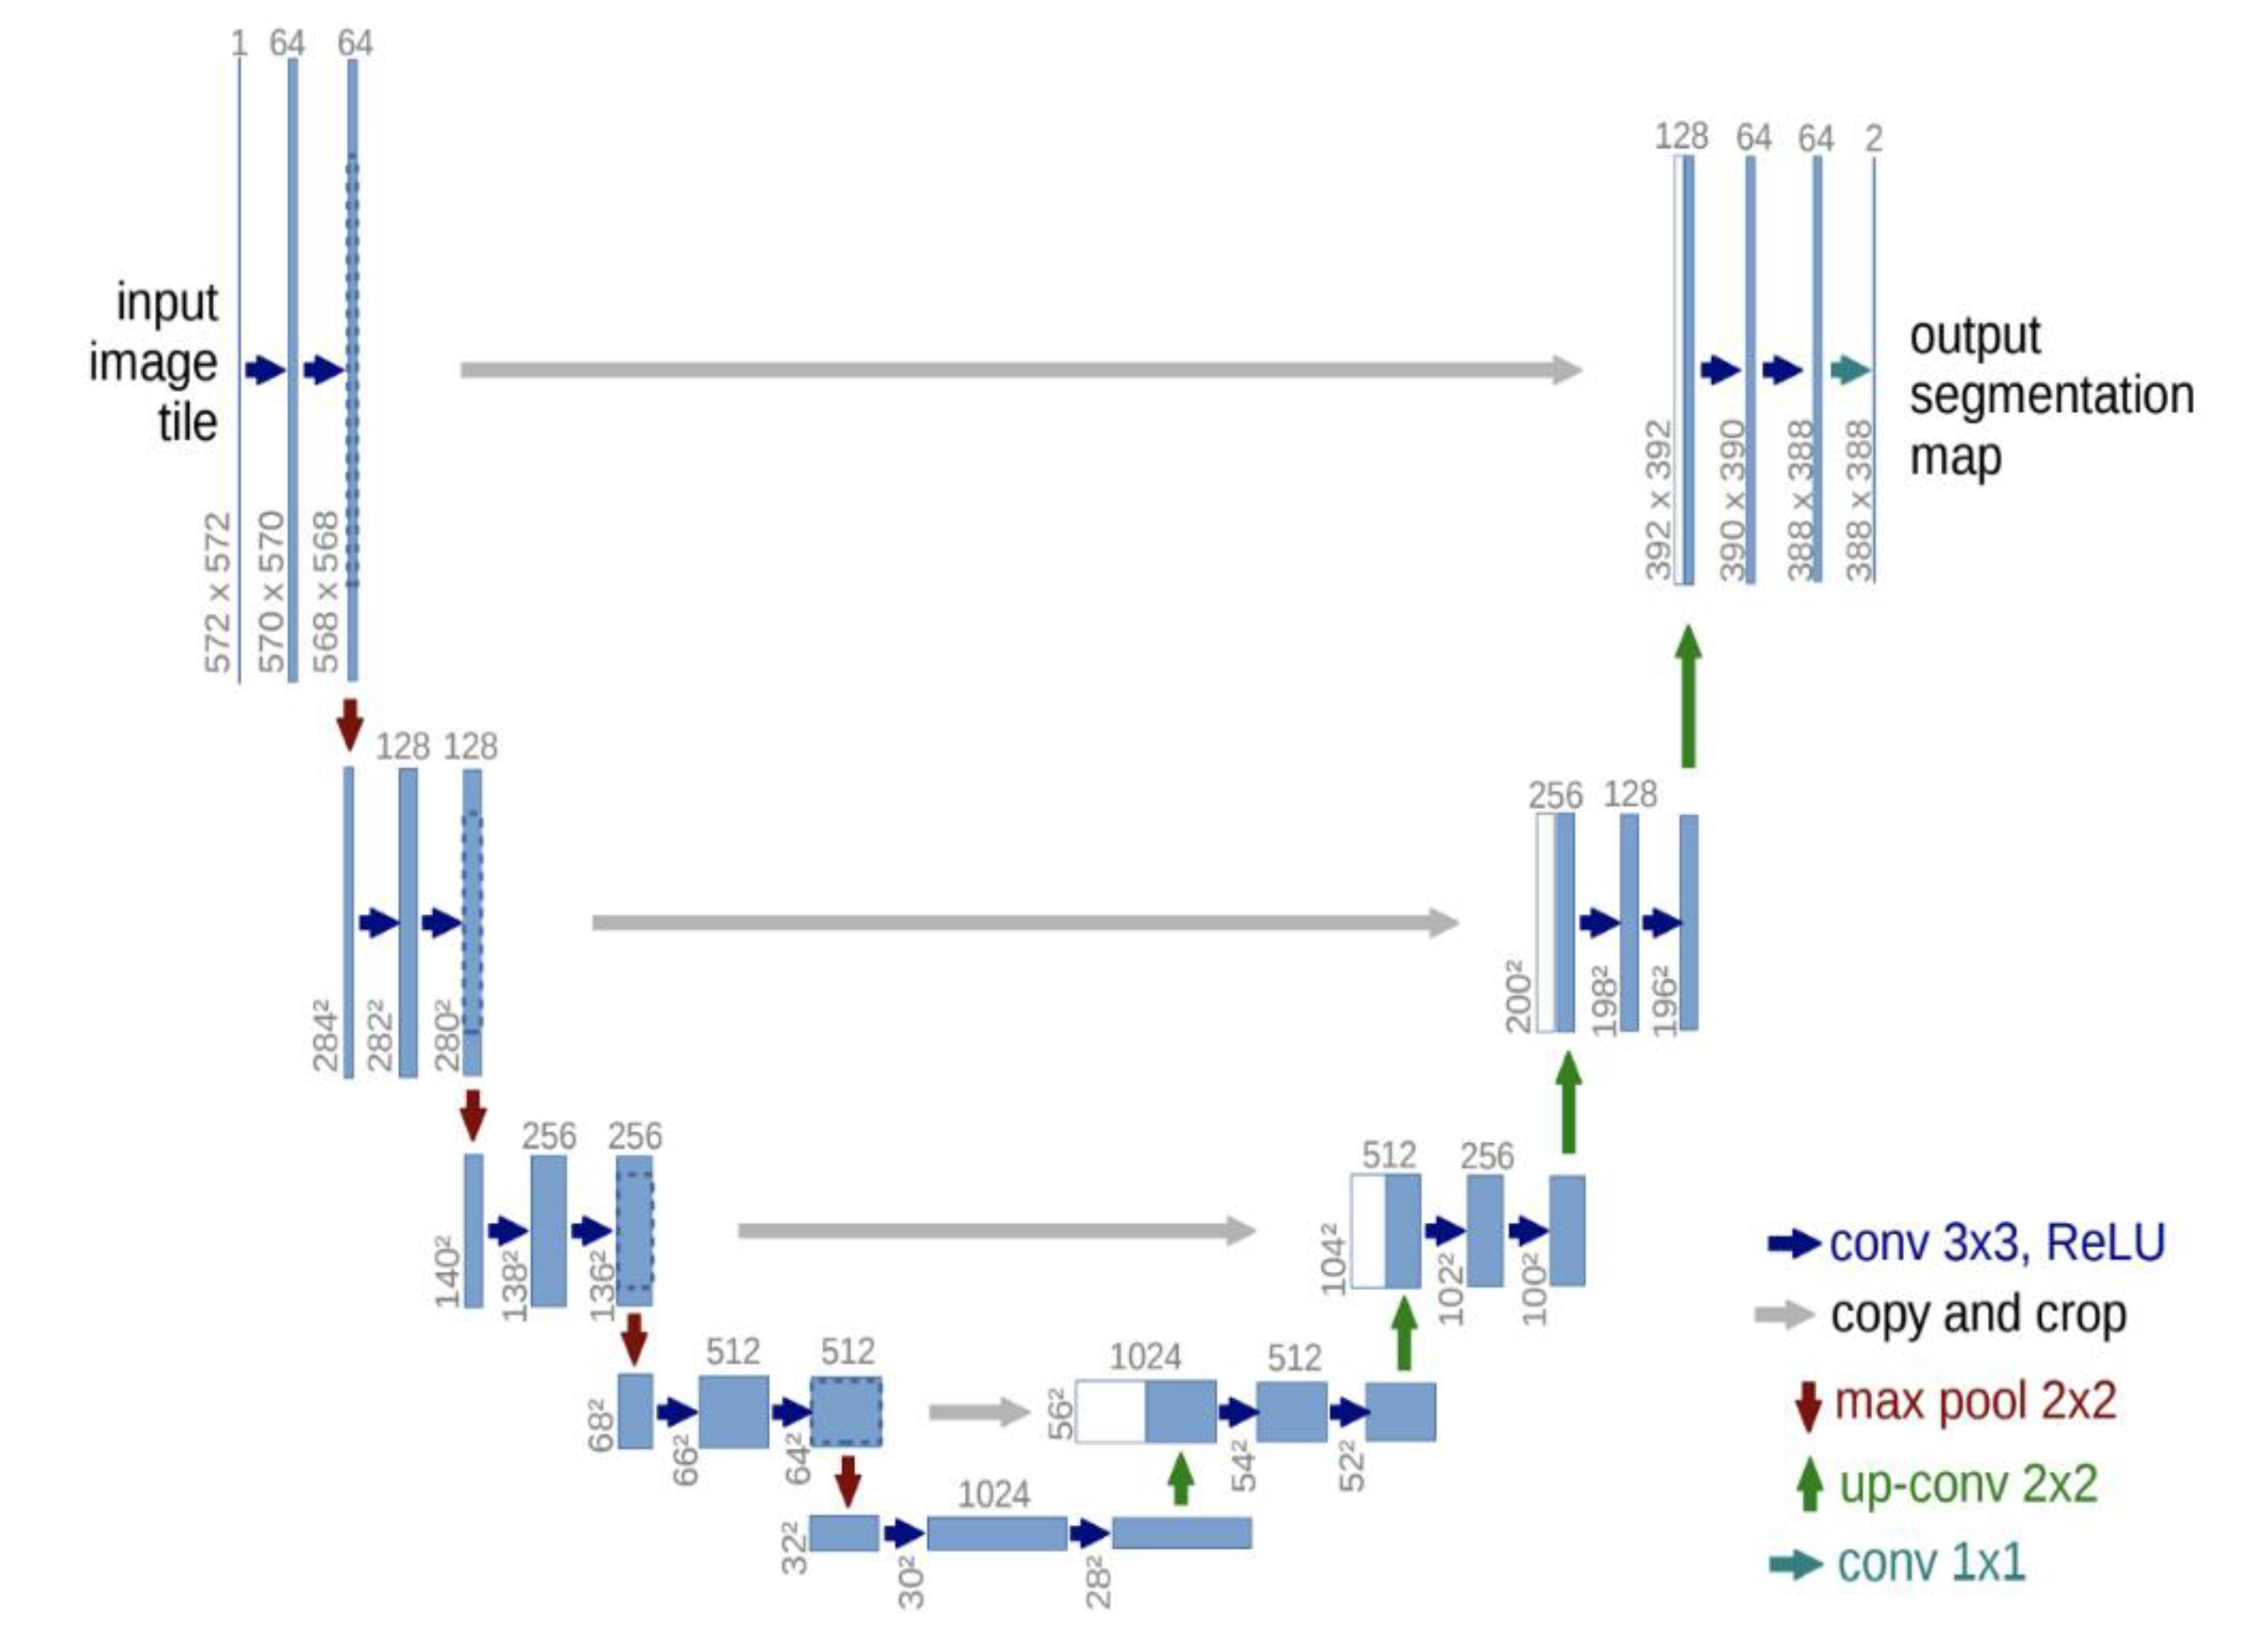
3.1.3. U-Net
3.2. Classification Scheme Design
3.3. Accuracy Assessment
4. Result
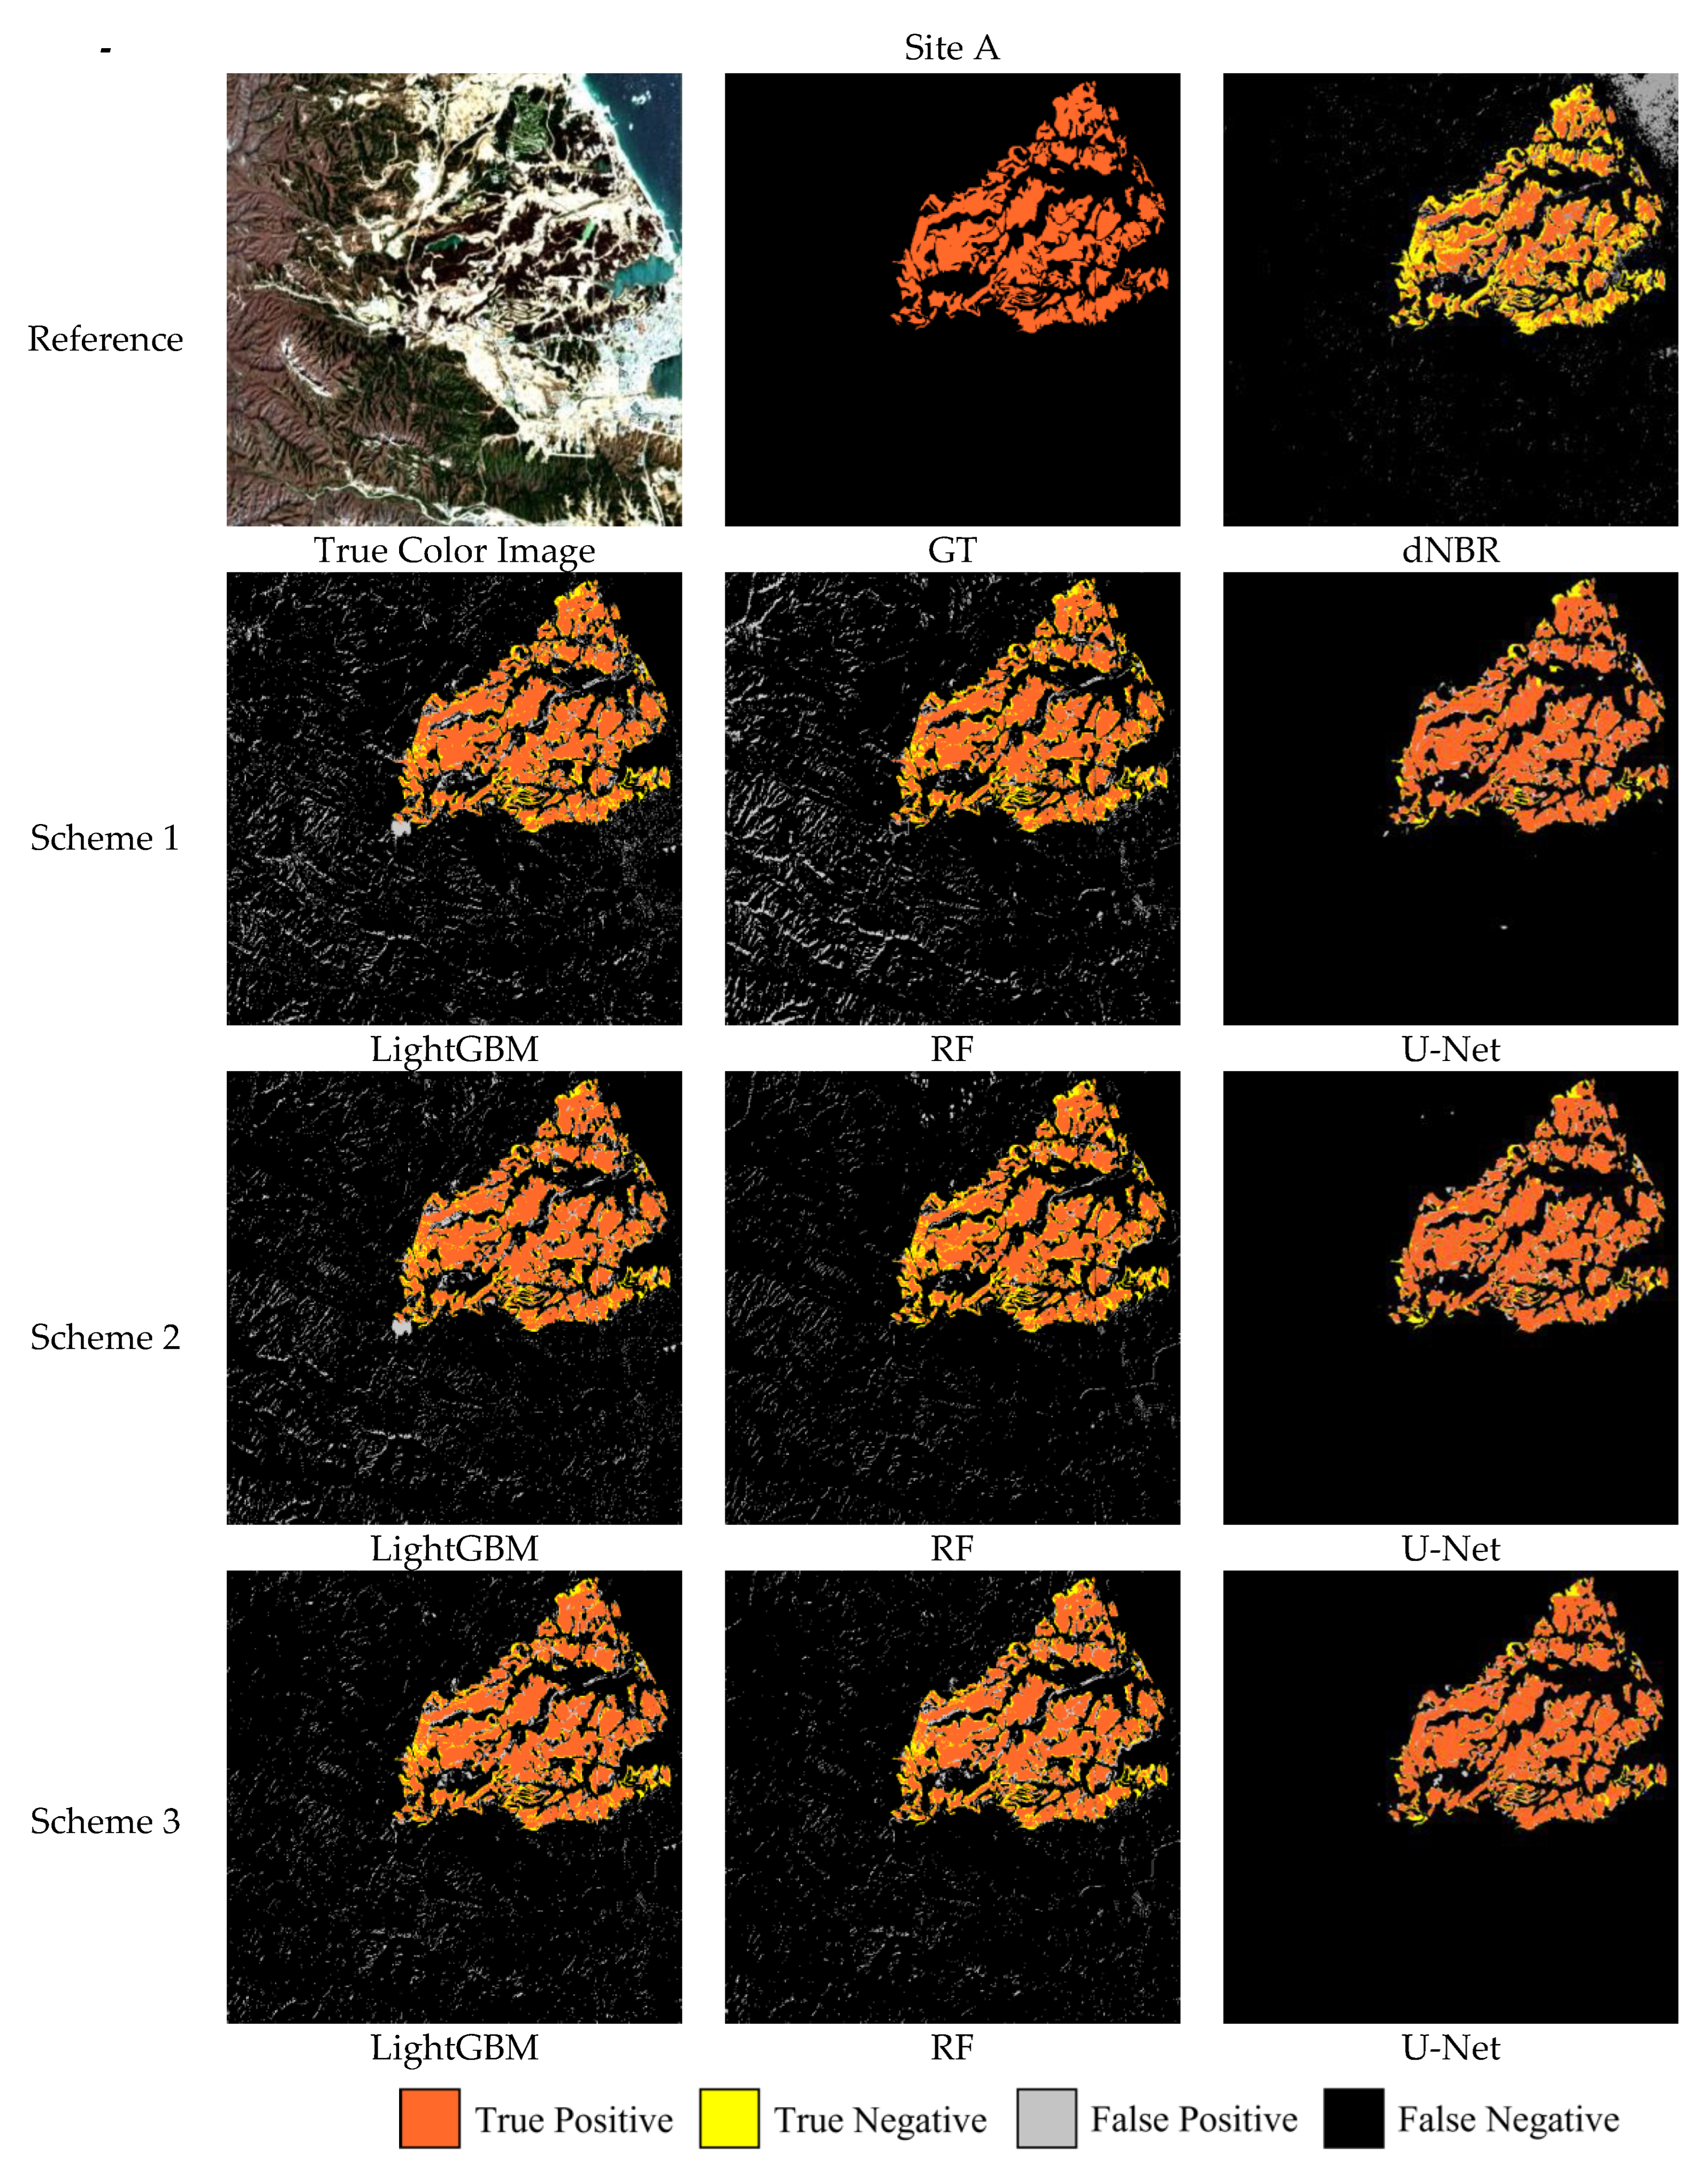
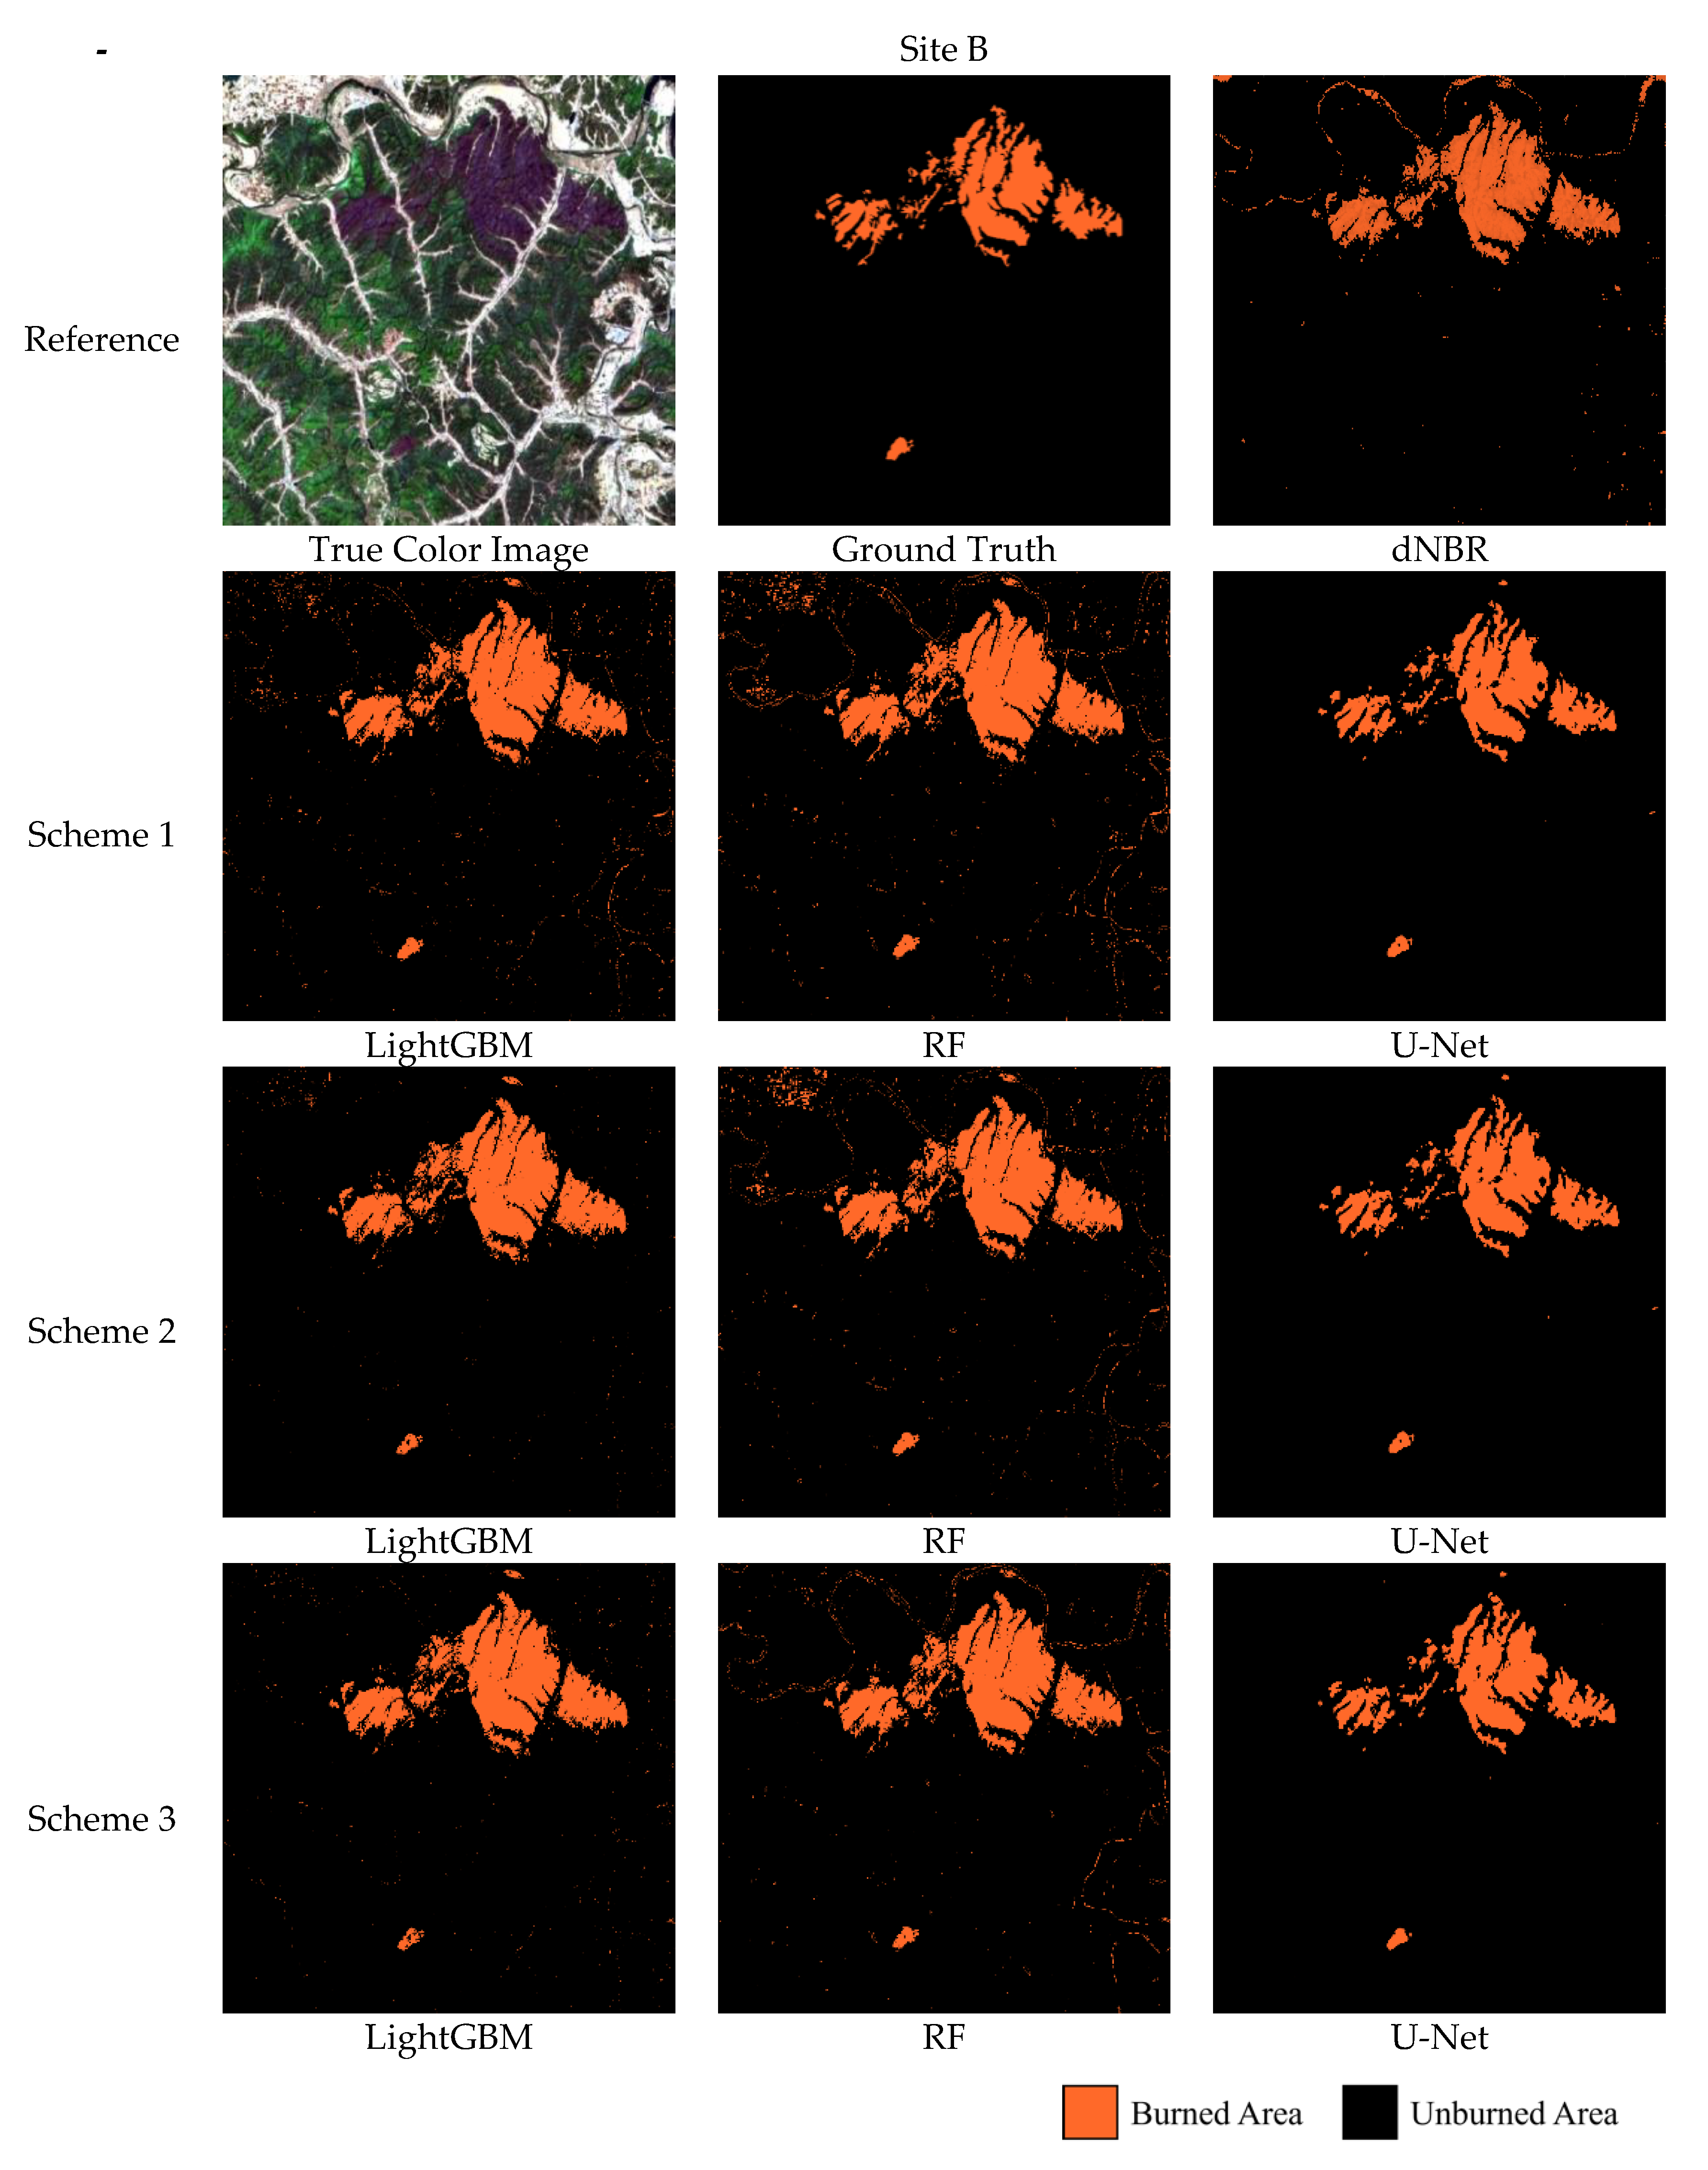
4.1. Comparison of Forest Burned Area Detection Performance
4.2. Comparison of Spatial Distributions of Forest Burned Area Detection Results
5. Discussion
5.1. Analysis of Forest Fire Burned Area Detection Errors
5.2. Assessment of Training Efficiency According to the Models
6. Conclusions
Author Contributions
Funding
Institutional Review Board Statement
Informed Consent Statement
Data Availability Statement
Conflicts of Interest
Appendix A. Structure of U-Net

References
- Farasin, A.; Colomba, L.; Garza, P. Double-step u-net: A deep learning-based approach for the estimation of wildfire damage severity through sentinel-2 satellite data. Appl. Sci. 2020, 10, 4332. [Google Scholar] [CrossRef]
- Rashkovetsky, D.; Mauracher, F.; Langer, M.; Schmitt, M. Wildfire Detection From Multisensor Satellite Imagery Using Deep Semantic Segmentation. IEEE J. Sel. Top. Appl. Earth Obs. Remote Sens. 2021, 14, 7001–7016. [Google Scholar] [CrossRef]
- Coogan, S.C.; Robinne, F.N.; Jain, P.; Flannigan, M.D. Scientists’ warning on wildfire—A Canadian perspective. Can. J. Forest Res. 2019, 49, 1015–1023. [Google Scholar] [CrossRef] [Green Version]
- Zhang, P.; Ban, Y.; Nascetti, A. Learning U-Net without forgetting for near real-time wildfire monitoring by the fusion of SAR and optical time series. Remote Sens. Environ. 2021, 261, 112467. [Google Scholar] [CrossRef]
- Lozano, O.M.; Salis, M.; Ager, A.A.; Arca, B.; Alcasena, F.J.; Monteiro, A.T.; Finney, M.A.; Del Giudice, L.; Scoccimarro, E.; Spano, D. Assessing climate change impacts on wildfire exposure in Mediterranean areas. Risk Anal. 2017, 37, 1898–1916. [Google Scholar] [CrossRef]
- Littell, J.S.; McKenzie, D.; Wan, H.Y.; Cushman, S.A. Climate change and future wildfire in the western United States: An ecological approach to nonstationarity. Earth’s Future 2018, 6, 1097–1111. [Google Scholar] [CrossRef] [Green Version]
- Vil’a-Vilardell, L.; Keeton, W.S.; Thom, D.; Gyeltshen, C.; Tshering, K.; Gratzer, G. Climate change effects on wildfire hazards in the wildland-urban-interface–blue pine forests of Bhutan. For. Ecol. Manag. 2020, 461, 117927. [Google Scholar] [CrossRef]
- Liu, C.C.; Chen, Y.H.; Wu, M.H.M.; Wei, C.; Ko, M.H. Assessment of forest restoration with multitemporal remote sensing imagery. Sci. Rep. 2019, 9, 7219. [Google Scholar] [CrossRef] [Green Version]
- Chuvieco, E.; Mouillot, F.; van der Werf, G.R.; San Miguel, J.; Tanase, M.; Koutsias, N.; García, M.; Yebra, M.; Padilla, M.; Gitas, I.; et al. Historical background and current developments for mapping burned area from satellite Earth observation. Remote Sens. Environ. 2019, 225, 45–64. [Google Scholar] [CrossRef]
- Fornacca, D.; Ren, G.; Xiao, W. Performance of three MODIS fire products (MCD45A1, MCD64A1, MCD14ML), and ESA Fire_CCI in a mountainous area of Northwest Yunnan, China, characterized by frequent small fires. Remote Sens. 2017, 9, 1131. [Google Scholar] [CrossRef]
- Wang, J.; Sammis, T.W.; Gutschick, V.P.; Gebremichael, M.; Dennis, S.O.; Harrison, R.E. Review of satellite remote sensing use in forest health studies. Open Geogr. J. 2010, 3, 28–42. [Google Scholar] [CrossRef]
- Hu, X.; Ban, Y.; Nascetti, A. Uni-Temporal Multispectral Imagery for Burned Area Mapping with Deep Learning. Remote Sens. 2021, 13, 1509. [Google Scholar] [CrossRef]
- Kontoes, C.C.; Poilvé, H.; Florsch, G.; Keramitsoglou, I.; Paralikidis, S. A comparative analysis of a fixed thresholding vs. a classification tree approach for operational burn scar detection and mapping. Int. J. Appl. Earth Obs. Geoinf. 2009, 11, 299–316. [Google Scholar] [CrossRef]
- Quintano, C.; Fernández-Manso, A.; Stein, A.; Bijker, W. Estimation of area burned by forest fires in Mediterranean countries: A remote sensing data mining perspective. For. Ecol. Manag. 2011, 262, 1597–1607. [Google Scholar] [CrossRef]
- Roteta, E.; Bastarrika, A.; Padilla, M.; Storm, T.; Chuvieco, E. Development of a Sentinel-2 burned area algorithm: Generation of a small fire database for sub-Saharan Africa. Remote Sens. Environ. 2019, 222, 1–17. [Google Scholar] [CrossRef]
- Trigg, S.; Flasse, S. An evaluation of different bi-spectral spaces for discriminating burned shrub-savannah. Int. J. Remote Sens. 2001, 22, 2641–2647. [Google Scholar] [CrossRef]
- Chu, T.; Guo, X. Remote sensing techniques in monitoring post-fire effects and patterns of forest recovery in boreal forest regions: A review. Remote Sens. 2013, 6, 470–520. [Google Scholar] [CrossRef] [Green Version]
- Huang, H.; Roy, D.P.; Boschetti, L.; Zhang, H.K.; Yan, L.; Kumar, S.S.; Gomez-Dans, J.; Li, J.; Huang, H.; Roy, D.P.; et al. Separability analysis of Sentinel-2A Multi-Spectral Instrument (MSI) data for burned area discrimination. Remote Sens. 2016, 8, 873. [Google Scholar] [CrossRef] [Green Version]
- Navarro, G.; Caballero, I.; Silva, G.; Parra, P.C.; Vázquez, Á.; Caldeira, R. Evaluation of forest fire on Madeira Island using Sentinel-2A MSI imagery. Int. J. Appl. Earth Obs. Geoinf. 2017, 58, 97–106. [Google Scholar] [CrossRef] [Green Version]
- Quintano, C.; Fernández-Manso, A.; Fernández-Manso, O. Combination of Landsat and Sentinel-2 MSI data for initial assessing of burn severity. Int. J. Appl. Earth Obs. Geoinf. 2018, 64, 221–225. [Google Scholar] [CrossRef]
- Liu, S.; Zheng, Y.; Dalponte, M.; Tong, X. A novel fire index based burned area change detection approach using Landsat-8 OLI data. Eur. J. Remote Sens. 2020, 53, 104–112. [Google Scholar] [CrossRef] [Green Version]
- Escuin, S.; Navarro, R.; Fernandez, P. Fire severity assessment by using NBR (Normalized Burn Ratio) and NDVI (Normalized Difference Vegetation Index) derived from LANDSAT TM/ETM images. Int. J. Remote Sens. 2008, 29, 1053–1073. [Google Scholar] [CrossRef]
- Cardil, A.; Mola-Yudego, B.; Blázquez-Casado, Á.; González-Olabarria, J.R. Fire and burn severity assessment: Calibration of Relative Differenced Normalized Burn Ratio (RdNBR) with field data. J. Environ. Manag. 2019, 235, 342–349. [Google Scholar] [CrossRef] [PubMed]
- Miller, J.D.; Thode, A.E. Quantifying burn severity in a heterogeneous landscape with a relative version of the delta Normalized Burn Ratio (dNBR). Remote Sens. Environ. 2007, 109, 66–80. [Google Scholar] [CrossRef]
- Pulvirenti, L.; Squicciarino, G.; Fiori, E.; Fiorucci, P.; Ferraris, L.; Negro, D.; Gollini, A.; Severino, M.; Puca, S. An automatic processing chain for near real-time mapping of burned forest areas using sentinel-2 data. Remote Sens. 2020, 12, 674. [Google Scholar] [CrossRef] [Green Version]
- Smith, A.M.; Drake, N.A.; Wooster, M.J.; Hudak, A.T.; Holden, Z.A.; Gibbons, C.J. Production of Landsat ETM+ reference imagery of burned areas within Southern African savannahs: Comparison of methods and application to MODIS. Int. J. Remote Sens. 2007, 28, 2753–2775. [Google Scholar] [CrossRef]
- Jain, P.; Coogan, S.C.; Subramanian, S.G.; Crowley, M.; Taylor, S.; Flannigan, M.D. A review of machine learning applications in wildfire science and management. Environ. Rev. 2020, 28, 478–505. [Google Scholar] [CrossRef]
- Reichstein, M.; Camps-Valls, G.; Stevens, B.; Jung, M.; Denzler, J.; Carvalhais, N. Deep learning and process understanding for data-driven Earth system science. Nature 2019, 566, 195–204. [Google Scholar] [CrossRef]
- Stavrakoudis, D.; Katagis, T.; Minakou, C.; Gitas, I.Z.; Stavrakoudis, D.; Katagis, T.; Minakou, C.; Gitas, I.Z. Automated Burned Scar Mapping Using Sentinel-2 Imagery. J. Geogr. Inf. Syst. 2020, 12, 221–240. [Google Scholar] [CrossRef]
- Long, T.; Zhang, Z.; He, G.; Jiao, W.; Tang, C.; Wu, B.; Zhang, X.; Wang, G.; Yin, R. 30 m resolution global annual burned area mapping based on landsat images and Google Earth Engine. Remote Sens. 2019, 11, 489. [Google Scholar] [CrossRef]
- Gibson, R.; Danaher, T.; Hehir, W.; Collins, L. A remote sensing approach to mapping fire severity in south-eastern Australia using sentinel 2 and random forest. Remote Sens. Environ. 2020, 240, 111702. [Google Scholar] [CrossRef]
- Pinto, M.M.; Libonati, R.; Trigo, R.M.; Trigo, I.F.; DaCamara, C.C. A deep learning approach for mapping and dating burned areas using temporal sequences of satellite images. ISPRS J. Photogramm. Remote Sens. 2020, 160, 260–274. [Google Scholar] [CrossRef]
- Arruda, V.L.; Piontekowski, V.J.; Alencar, A.; Pereira, R.S.; Matricardi, E.A. An alternative approach for mapping burn scars using Landsat imagery, Google Earth Engine, and Deep Learning in the Brazilian Savanna. Remote Sens. Appl. Soc. Environ. 2021, 22, 100472. [Google Scholar] [CrossRef]
- De Bem, P.P.; de Carvalho Júnior, O.A.; de Carvalho, O.L.F.; Gomes, R.A.T.; Fontes Guimarães, R. Performance analysis of deep convolutional autoencoders with different patch sizes for change detection from burnt areas. Remote Sens. 2020, 12, 2576. [Google Scholar] [CrossRef]
- Knopp, L.; Wieland, M.; Rättich, M.; Martinis, S. A deep learning approach for burned area segmentation with Sentinel-2 data. Remote Sens. 2020, 12, 2422. [Google Scholar] [CrossRef]
- Key, C.H.; Benson, N.C. Measuring and remote sensing of burn severity. In Proceedings of the Joint Fire Science Conference and Workshop, Boise, ID, USA, 15–17 June 1999; Neuenschwander, L.F., Ryan, K.C., Eds.; Univeristy of Idaho: Moscow, ID, USA, 1999; Volume II, p. 284. [Google Scholar]
- United Nations. Office for Outer Space Affairs UN-SPIDER Knowledge Portal. Normalized Burn Ratio (NBR). Available online: https://www.un-spider.org/advisory-support/recommended-practices/recommended-practice-burn-severity/in-detail/normalized-burn-ratio (accessed on 19 September 2022).
- Ke, G.; Meng, Q.; Finley, T.; Wang, T.; Chen, W.; Ma, W.; Ye, Q.; Liu, T.Y. Lightgbm: A highly efficient gradient boosting decision tree. In Proceedings of the Advances in Neural Information Processing Systems, Long Beach, CA, USA, 4–9 December 2017; Volume 30. [Google Scholar]
- Park, J.; Chung, Y.R.; Nose, A. Comparative analysis of high-and low-level deep learning approaches in microsatellite instability prediction. Sci. Rep. 2022, 12, 12218. [Google Scholar] [CrossRef]
- Breiman, L. Random forests. Mach. Learn. 2001, 45, 5–32. [Google Scholar] [CrossRef] [Green Version]
- Shadman Roodposhti, M.; Aryal, J.; Lucieer, A.; Bryan, B.A. Uncertainty assessment of hyperspectral image classification: Deep learning vs. random forest. Entropy 2019, 21, 78. [Google Scholar] [CrossRef] [Green Version]
- Mahapatra, D. Analyzing training information from random forests for improved image segmentation. IEEE Trans. Image Process. 2014, 23, 1504–1512. [Google Scholar] [CrossRef]
- Ronneberger, O.; Fischer, P.; Brox, T. U-net: Convolutional networks for biomedical image segmentation. In Proceedings of the International Conference on Medical Image Computing and Computer-Assisted Intervention, Munich, Germany, 5–9 October 1999; Springer: Cham, Switzerland, 2015; pp. 234–241. [Google Scholar]
- Solórzano, J.V.; Mas, J.F.; Gao, Y.; Gallardo-Cruz, J.A. Land use land cover classification with U-net: Advantages of combining sentinel-1 and sentinel-2 imagery. Remote Sens. 2021, 13, 3600. [Google Scholar] [CrossRef]
- Zhang, J.; Du, J.; Liu, H.; Hou, X.; Zhao, Y.; Ding, M. LU-NET: An improved U-Net for ventricular segmentation. IEEE Access 2019, 7, 92539–92546. [Google Scholar] [CrossRef]
- Wonho, J.; Park, K.H. Deep Learning Based Land Cover Change Detection Using U-Net. J. Korean Geogr. Soc. 2022, 57, 297–306. [Google Scholar]
- Karpatne, A.; Jiang, Z.; Vatsavai, R.R.; Shekhar, S.; Kumar, V. Monitoring land-cover changes: A machine-learning perspective. IEEE Geosci. Remote Sens. Mag. 2016, 4, 8–21. [Google Scholar] [CrossRef]
- FuenTes-sAnTos, I.; Marey-Pérez, M.F.; González-Manteiga, W. Forest fire spatial pattern analysis in Galicia (NW Spain). J. Environ. Manag. 2013, 128, 30–42. [Google Scholar] [CrossRef] [PubMed]
- Duan, S.; Huang, S.; Bu, W.; Ge, X.; Chen, H.; Liu, J.; Luo, J. LightGBM low-temperature prediction model based on LassoCV feature selection. Math. Probl. Eng. 2021, 2021, 1776805. [Google Scholar] [CrossRef]
- Oreski, S.; Oreski, D.; Oreski, G. Hybrid system with genetic algorithm and artificial neural networks and its application to retail credit risk assessment. Expert Syst. Appl. 2012, 39, 12605–12617. [Google Scholar] [CrossRef]
- Yeh, I.C.; Lien, C.H. The comparisons of data mining techniques for the predictive accuracy of probability of default of credit card clients. Expert Syst. Appl. 2009, 36, 2473–2480. [Google Scholar] [CrossRef]
- Bui, D.T.; Tsangaratos, P.; Nguyen, V.T.; Van Liem, N.; Trinh, P.T. Comparing the prediction performance of a Deep Learning Neural Network model with conventional machine learning models in landslide susceptibility assessment. Catena 2020, 188, 104426. [Google Scholar] [CrossRef]
- Park, S.; Im, J.; Park, S.; Yoo, C.; Han, H.; Rhee, J. Classification and mapping of paddy rice by combining Landsat and SAR time series data. Remote Sens. 2018, 10, 447. [Google Scholar] [CrossRef] [Green Version]
- Yang, X.; Sun, H.; Fu, K.; Yang, J.; Sun, X.; Yan, M.; Guo, Z. Automatic ship detection in remote sensing images from google earth of complex scenes based on multiscale rotation dense feature pyramid networks. Remote Sens. 2018, 10, 132. [Google Scholar] [CrossRef] [Green Version]
- Minastireanu, E.A.; Mesnita, G. Light gbm machine learning algorithm to online click fraud detection. J. Inform. Assur. Cybersecur. 2019, 2019, 263928. [Google Scholar] [CrossRef]
- LightGBM, Parameters Tuning. Available online: https://lightgbm.readthedocs.io/en/latest/Parameters-Tuning.html (accessed on 19 September 2022).


| Sites | Event Date | Acquisition Date | Size | Resolution & Product Level | |
|---|---|---|---|---|---|
| Site A | 4 April 2019 | Pre-event | 26 March 2019 | 494 × 655 pixels | Spatial Resolution: 20 m Product Level: Level-2A |
| Post-event | 8 April 2019 | ||||
| Site B | 24 April 2020 | Pre-event | 14 April 2020 | 886 × 976 pixels | |
| Post-event | 29 April 2020 | ||||
| Model | Parameters | ||
|---|---|---|---|
| Scheme 1 | Scheme 2 | Scheme 3 | |
| Boosting type | GBDT (traditional Gradient Boosting Decision Tree) | ||
| Colsample bytree | 0.6 | 0.8 | 0.8 |
| Maxdepth | 7 | 1 | 4 |
| Min. child weight | 10 | 20 | 10 |
| Num. of estimators | 900 | 300 | 900 |
| Num. leaves | 15 | 15 | 15 |
| Subsample | 0.6 | 0.6 | 0.6 |
| Learning rate | 0.005 | 0.005 | 0.005 |
| Scheme | Num. Spectral Bands | Num. Indices | Total |
|---|---|---|---|
| Scheme 1 | 9 images (post fire image, 9 bands) | 2 images (PostNDVI, PostNBR) | 11 variables |
| Scheme 2 | 18 images (pre and post fire images, 9 bands each) | - | 18 variables |
| Scheme 3 | 18 images (pre and post fire images, 9 bands each) | 6 images (PreNDVI, PreNBR, PostNDVI, PostNBR, dNDVI, dNBR) | 24 variables |
| Multiclass Classification | ||||||
| - | OA | Recall | Precision | F1-Score | Kappa | |
| Scheme 1 | LightGBM | 0.85 | 0.78 | 0.60 | 0.68 | 0.73 |
| RF | 0.85 | 0.74 | 0.62 | 0.67 | 0.74 | |
| U-Net | 0.93 | 0.87 | 0.89 | 0.88 | 0.88 | |
| Scheme 2 | LightGBM | 0.86 | 0.80 | 0.68 | 0.73 | 0.76 |
| RF | 0.86 | 0.78 | 0.67 | 0.72 | 0.75 | |
| U-Net | 0.93 | 0.88 | 0.89 | 0.89 | 0.88 | |
| Scheme 3 | LightGBM | 0.88 | 0.81 | 0.71 | 0.76 | 0.78 |
| RF | 0.87 | 0.81 | 0.70 | 0.75 | 0.77 | |
| U-Net | 0.93 | 0.89 | 0.88 | 0.89 | 0.88 | |
| Binary Classification | ||||||
| - | OA | Recall | Precision | F1-Score | Kappa | |
| Scheme 1 | LightGBM | 0.92 | 0.78 | 0.60 | 0.68 | 0.63 |
| RF | 0.92 | 0.74 | 0.62 | 0.67 | 0.62 | |
| U-Net | 0.97 | 0.87 | 0.89 | 0.88 | 0.86 | |
| Scheme 2 | LightGBM | 0.94 | 0.80 | 0.68 | 0.73 | 0.69 |
| RF | 0.93 | 0.78 | 0.67 | 0.72 | 0.68 | |
| U-Net | 0.98 | 0.88 | 0.89 | 0.89 | 0.87 | |
| Scheme 3 | LightGBM | 0.94 | 0.81 | 0.71 | 0.76 | 0.73 |
| RF | 0.94 | 0.81 | 0.70 | 0.75 | 0.71 | |
| dNBR | 0.92 | 0.56 | 0.63 | 0.59 | 0.55 | |
| U-Net | 0.98 | 0.89 | 0.88 | 0.89 | 0.88 | |
| Multiclass Classification | ||||||
| - | OA | Recall | Precision | F1-Score | Kappa | |
| Scheme 1 | LightGBM | 0.90 | 0.96 | 0.61 | 0.74 | 0.79 |
| RF | 0.91 | 0.97 | 0.60 | 0.74 | 0.80 | |
| U-Net | 0.94 | 0.90 | 0.91 | 0.90 | 0.87 | |
| Scheme 2 | LightGBM | 0.91 | 0.97 | 0.67 | 0.79 | 0.81 |
| RF | 0.92 | 0.97 | 0.63 | 0.76 | 0.81 | |
| U-Net | 0.94 | 0.91 | 0.92 | 0.92 | 0.87 | |
| Scheme 3 | LightGBM | 0.91 | 0.96 | 0.67 | 0.79 | 0.80 |
| RF | 0.91 | 0.96 | 0.68 | 0.79 | 0.81 | |
| U-Net | 0.94 | 0.92 | 0.91 | 0.92 | 0.88 | |
| Binary Classification | ||||||
| - | OA | Recall | Precision | F1-Score | Kappa | |
| Scheme 1 | LightGBM | 0.98 | 0.96 | 0.61 | 0.74 | 0.74 |
| RF | 0.98 | 0.97 | 0.60 | 0.74 | 0.73 | |
| U-Net | 0.99 | 0.90 | 0.91 | 0.90 | 0.90 | |
| Scheme 2 | LightGBM | 0.98 | 0.97 | 0.67 | 0.79 | 0.78 |
| RF | 0.98 | 0.97 | 0.63 | 0.76 | 0.75 | |
| U-Net | 0.99 | 0.91 | 0.92 | 0.92 | 0.91 | |
| Scheme 3 | LightGBM | 0.98 | 0.96 | 0.67 | 0.79 | 0.78 |
| RF | 0.98 | 0.96 | 0.68 | 0.79 | 0.79 | |
| dNBR | 0.98 | 0.93 | 0.67 | 0.78 | 0.77 | |
| U-Net | 0.99 | 0.92 | 0.91 | 0.92 | 0.92 | |
| - | Site A | Site B | |||
|---|---|---|---|---|---|
| - | Accuracy | Training Time | Accuracy | Training Time | |
| Scheme 1 | LightGBM | 0.88 | 175.5 s | 0.92 | 143.8 s |
| RF | 0.78 | 17.5 s | 0.95 | 17.6 s | |
| U-Net | 0.91 | 173.2 s | 0.94 | 175.4 s | |
| Scheme 2 | LightGBM | 0.89 | 190.4 s | 0.93 | 163.9 s |
| RF | 0.84 | 18.2 s | 0.94 | 17.3 s | |
| U-Net | 0.90 | 177.2 s | 0.97 | 176.8 s | |
| Scheme 3 | LightGBM | 0.90 | 196.2 s | 0.94 | 175.6 s |
| RF | 0.88 | 18.5 s | 0.90 | 17.3 s | |
| U-Net | 0.91 | 174.1 s | 0.97 | 179.2 s | |
Publisher’s Note: MDPI stays neutral with regard to jurisdictional claims in published maps and institutional affiliations. |
© 2022 by the authors. Licensee MDPI, Basel, Switzerland. This article is an open access article distributed under the terms and conditions of the Creative Commons Attribution (CC BY) license (https://creativecommons.org/licenses/by/4.0/).
Share and Cite
Lee, C.; Park, S.; Kim, T.; Liu, S.; Md Reba, M.N.; Oh, J.; Han, Y. Machine Learning-Based Forest Burned Area Detection with Various Input Variables: A Case Study of South Korea. Appl. Sci. 2022, 12, 10077. https://doi.org/10.3390/app121910077
Lee C, Park S, Kim T, Liu S, Md Reba MN, Oh J, Han Y. Machine Learning-Based Forest Burned Area Detection with Various Input Variables: A Case Study of South Korea. Applied Sciences. 2022; 12(19):10077. https://doi.org/10.3390/app121910077
Chicago/Turabian StyleLee, Changhui, Seonyoung Park, Taeheon Kim, Sicong Liu, Mohd Nadzri Md Reba, Jaehong Oh, and Youkyung Han. 2022. "Machine Learning-Based Forest Burned Area Detection with Various Input Variables: A Case Study of South Korea" Applied Sciences 12, no. 19: 10077. https://doi.org/10.3390/app121910077