Abstract
Concrete cover has an important role in reinforced concrete (RC) structures because it protects reinforcement bars from the bad effects of weather, fire, and bad environmental conditions that cause the corrosion of the reinforcements. Although it is an essential parameter to be considered for structural health monitoring (SHM), its detection by infrared thermography, especially in the heating phase, has not been accessed yet. The detailed analysis and discussions of physical phenomena, known as diffraction and interference, affecting the thermograms during the detection of the steel bars by microwave thermography have given an essential key for resolving this issue. The present paper proposes an innovative methodology with microwave thermography for determining the concrete cover thickness of one-layer reinforcements (12 mm in diameter and regularly placed at 10 cm) in an RC wall (1 m × 1 m × 6.5 cm). By using the transmission approach with five angles of microwave antenna direction (0°, 15°, 30°, 45°, and 60°) and the Snell–Descartes law and linear law, the proposed methodology leads us to deduce the approximate value of the concrete cover thickness (37.74 mm), which is close to the real value (38 mm), as well as the spacing of the steel bars and dielectric constant of the concrete. The detection of the concrete cover thickness is another new remarkable achievement of infrared thermography methods.
1. Introduction
Concrete cover has an important role in reinforced concrete (RC) structures. It protects reinforcement bars from the bad effects of weather, fire, and bad environmental conditions that cause the corrosion of the reinforcements and reduce the service life of the RC structures. Thus, it is an important durability indicator for RC structures, and an essential parameter to be considered for the structural health monitoring (SHM) of RC structures [1]. For this reason, the study on the concrete cover, as well as the development of different non-destructive evaluation (NDE) methods for detecting this parameter, have become crucial. The radar method is one of the NDE methods commonly used for the detection of the concrete cover [2,3]. This electromagnetic method has also been used for determining the location of reinforcements and assessing moisture in RC structures [4,5,6,7,8]. However, this method is a contact method (contact between the wave transmitter and the detected element) while the infrared thermography method is a non-contact one with a simple and rapid implementation.
The infrared thermography method is a temperature measurement technique based on heat transfer by thermal radiation. It is an NDE technique, that is based on measuring the temperature difference at the surface of materials or structures to detect the presence of problems, defects, or variations of thermal conduction properties beneath the surface [9]. The detection by infrared thermography is classified into two approaches: active thermography and passive thermography. The development of active infrared thermography methods has been accompanied by the development of interpretation methods and adopted stimulation techniques (heating source or excitation) [9,10,11,12,13,14,15,16,17]. Active infrared thermography methods have been developed with different types of excitation (halogen lamps, CO2 lasers, microwaves, etc.) for various applications, such as spot weld inspection [18] and the detection of a metal element behind a wooden plate [19]. Other applications for defect detection include defects of roll-to-roll printed conductors [20], defects in reinforcement with a carbon fiber-reinforced polymer (CFRP) [21,22,23,24], as well as defects in biomedical materials [25]. The latest development with a new microwave excitation system has enabled the detection of reinforcement in a reinforced concrete wall, which has highlighted the contributions of microwave excitation [26,27,28,29,30]. The microwave excitation is of great interest because of its volumetric heating, with a penetration depth of waves (which depends, in particular, on the dielectric constant of the detected material [31,32,33,34]), allowing the visualization of steel bars in the RC structure during the heating phase.
However, the detection of the concrete cover thickness (quantitative) by infrared thermography, especially in the heating phase, has not been accessed yet. The detailed analysis and discussions of the physical phenomena known as diffraction and interference affecting the thermograms during the detection of the steel bars by microwave thermography have given an essential key, leading to the resolution of this issue. As a result of the study, the effects of incident waves on the thermograms in both detection approaches (reflection and transmission) have also been clarified. On the thermograms in the reflection approach, concrete parts in the reflected areas are hotter than other areas, whereas the fractions in the areas of wave superposition (interference) are hotter than other areas in the transmission approach [35].
The present study shows an innovative methodology for determining the concrete cover thickness of one-layer reinforcements in a concrete wall with microwave thermography. In the methodology, the transmission approach (the infrared camera and the microwave antenna are situated on the same side) is used. It is a physical and mathematical methodology because it depends on a physical law called Snell–Descartes and the linear function of a non-linear relation between incident waves and shifts deduced from temperature profiles. The temperature profiles are obtained from the thermograms of the transmission approach with different incident waves. The details of the methodology are explained in the next part of the paper. At the end of the methodology, the values of the dielectric constant and the concrete cover thickness are deducted. This is a remarkable outcome of the application of physical law and mathematical analysis for detection by the microwave thermography method.
2. Methodology
The principle of the proposed methodology is illustrated by a flowchart, as shown in Figure 1. The methodology is divided into seven steps. From the first step to the fourth step, expertise in infrared thermography methods is applied. In the first step, five experimental campaigns with the microwave thermography method are carried out with five angles of the incident wave (θi): 0° (normal direction of the microwave antenna), 15°, 30°, 45°, and 60°. It is worth reminding that, in the transmission approach, the infrared camera and the heating source (and the antenna) are not situated on the same side. Details of the experimental set-up are shown in the next part of the present paper. In the second step, the thermograms are obtained from all the tests with the RC wall. Then, one thermogram at an instant is to be selected for each angle of the incident wave. The criteria for selecting the thermogram are based on the thermal contrast being optimal so that the corresponding temperature profile, to be drawn in the third step, gives clear peaks. Multiple choices are possible, but the selected thermogram must be in the heating phase to avoid thermal contrast decrease on the thermogram due to thermal conduction in the detected materials. All the temperature profiles for all θi are drawn on the same axes to facilitate deducing the values of the shifts of the peaks on the temperature profiles (compared to the case of normal direction) in the fourth step. The shift value for the case of 15° of the incident wave angle is measured from the peaks of its temperature profile to the peaks of the temperature profile for the case of the normal incident waves. The same way of measurement is used to obtain the shift values for the other cases of incident wave angles. It is worth noticing that the shifts (Δi) are generated by the effect of the refraction of the waves after reaching the steel bars inside the detected RC wall, which was interpreted in the previous study [35]. From step five to step seven, which is the last step, a combination of a physical law and a mathematical analysis method is needed. In step five, a non-linear relation between θi and Δi is created by using the Snell–Descartes law (as presented in Figure 2) and a geometrical relation between the Δi, the transmitted waves in the concrete (θt), and the concrete cover thickness (e).
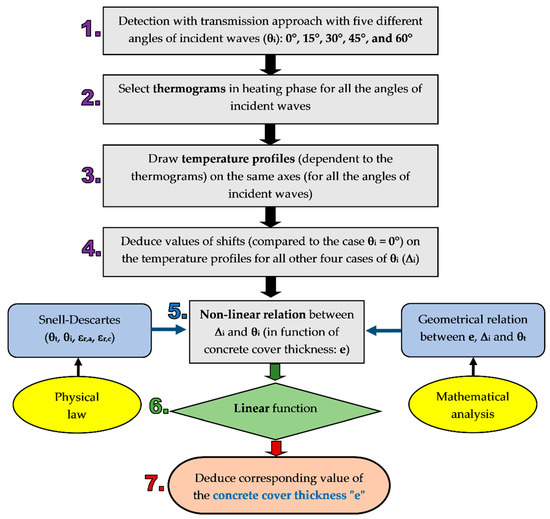
Figure 1.
Methodology for detecting the concrete cover thickness of one-layer reinforcements in RC wall by microwave thermography method with transmission approach.
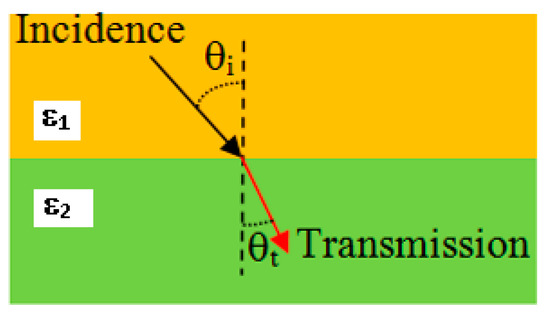
Figure 2.
Refraction of wave by Snell—Descartes’s law.
The theory gives the relation between the incident waves and refracted waves as the following equation:
where is the dielectric constant of medium 1, is the dielectric constant of medium 2, is the angle of the incident waves in medium 1, and is the angle of the transmitted waves in medium 2. In our study, medium 1 is the air, and medium 2 is the concrete. The dielectric constant of the air is equal to 1 () [31].
The geometrical relation between Δi, θt, and the concrete cover (e) can be illustrated in Figure 3. As shown in Figure 3a, which was discussed in the previous study [35], the concrete in the areas of inference (superposition of the waves) of the refracted waves is hotter than in the other areas. The same study also showed that the steel bars in the detected wall play a role as an obstacle to the transmitted waves, which makes some fractions of the waves totally reflected to the concrete surface. The fractions of the refracted waves(with the transmitted angle θt) around a steel bar can be simplified, as shown in Figure 3b.
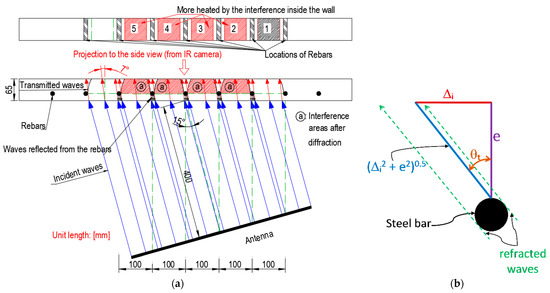
Figure 3.
Schemas for geometrical relation between e, Δi, and θt: (a) Effect of the interference on the thermogram in transmission approach (α = 15°) [35]; (b) Simplified schema of refracted waves around a steel bar.
By applying the Pythagorean theorem and trigonometric formula to the simplified schema of the refracted waves in Figure 3b, the following equation is obtained:
By combining Equations (1) and (2), we get the equation:
Supposing that and , Equation (3) becomes:
Equation (4) is a non-linear relation in which the concrete cover (e) as a constant parameter is to be found. By dividing this non-linear equation by X, another form of the equation is obtained:
In the proposed methodology, the non-linear equation (of the X and Y variables) is to be converted to a linear equation (in step 6). For this purpose, we suppose that , and y = Y. Then, Equation (5) becomes:
which is a linear function with ε2 as the gradient constant, and a squared value of the concrete cover (e2) is to be found.
Thus, the concrete cover thickness (e) can be deduced (at the final step of the methodology) from the line represented by linear Equation (6). It is worth noticing that two essential elements allowing us to detect the concrete cover (e) with the proposed methodology are: the angles of incident waves (θi) and the shift values (Δi).
3. Experimental Campaigns
The sample used for the tests was an RC wall of 1 m × 1 m dimensions and a 6.5 cm thickness, cast with a water/cement/sand/coarse aggregate mixing ratio of 1:1.6:4.45:4.7 (by weight). The reinforcements inside the RC wall were steel bars of 12 mm in diameter, regularly placed at 10 cm. As the reinforcements had one layer, there were two values of concrete cover thickness: 3.8 cm and 1.5 cm. The sample was subjected to testing at the age of 3 months. The experimental setup of the tests is shown in Figure 4.
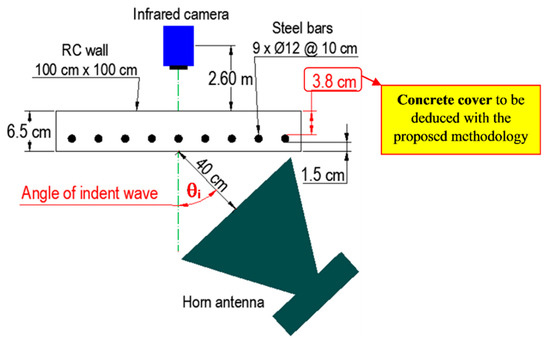
Figure 4.
Experimental setup of the detection of RC wall by microwave thermography with transmission approach.
A mid-wavelength infrared camera of FLIR, sensitive to medium waves in the range of 3–5 μm, with a 320 × 256 matrix detector in InSb (indium antimonite), was placed at 2.6 m from the wall in the normal direction so as to detect the whole area of the wall to be heated by the microwaves. The microwaves used for the tests had a frequency of 2.45 GHz, and were guided onto the tested sample by a horn antenna with an opening of 40°, a gain of 21.67 dB in its main direction, and aperture dimensions of 59 cm × 56 cm. The sample was placed at 40 cm from the antenna’s aperture.
Five tests were carried out for five different antennas’ directions corresponding to the angles of the incident waves (θi): 0° (the normal direction of the microwave antenna), 15°, 30°, 45°, and 60°. The thermograms were recorded at regular intervals (one image per second). The sample was heated with an average power of 600 W for 5 min.
It is essential to note that the concrete cover deduced from the methodology (with the transmission approach) was behind the reinforcement layer, not exposed to the microwave antenna. The use of the normal direction of the infrared camera is an advantage for the transmission approach, compared to the reflection approach, which can give real dimensions to the thermograms.
4. Result Analysis and Discussion
4.1. Angles of Transmitted Waves
It is important to observe how the angle of the transmitted waves changed when the angle of the incident waves varied because it allows us to understand what happened inside the detected RC wall. Based on the Snell–Descartes law, the evolution of the angles of the refracted waves (θt) in the function of the direction of the microwave antenna used in the experimental campaigns for the proposed methodology is shown in Figure 5.
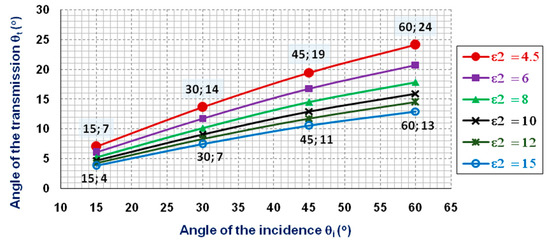
Figure 5.
Angles of refracted waves (θt) in the function of the incident waves (θi) and the dielectric constant of the concrete (ε2).
The evolution of the transmitted waves depends also on the dielectric constant of the concrete. As the real value of the dielectric constant of the tested concrete is unknown, the graphs for six different values of the dielectric constant of concrete (ε2) are proposed. The proposed values of ε2 are for common concrete, which vary from about 4.5 to 15 [31]. According to the graphs in Figure 5, we see that when the angle of the incident waves increases from 15° to 60°, the angle of the refracted waves also increases. However, the angles of the refracted waves are always smaller than the angles of the incident waves: they increase from 4° to 13° (the minimum angles) when ε2 = 15, and from 7° to 24° (the maximum angles) when ε2 = 4.5. The small values of the angles of the refracted waves also allow us to know that the shifts’ values (Δi) to be determined for the proposed methodology are very small.
4.2. Determination of the Shifts’ Values (Δi) from the Thermograms
As mentioned in the methodology section of this paper, the selection of the thermograms is very important in the procedure for determining the Δi. Five thermograms, selected from the detection of the RC wall, with five different angles of the incident waves (or the direction of the microwave antenna), are shown in Figure 6. All the selected thermograms were not obtained at the same instant of heating, although the same heating duration was used for the tests: 172 s when θi = 0°, 243 s when θi = 15°, 288 s when θi = 30°, 290 s when θi = 45°, and 281 s when θi = 60°.
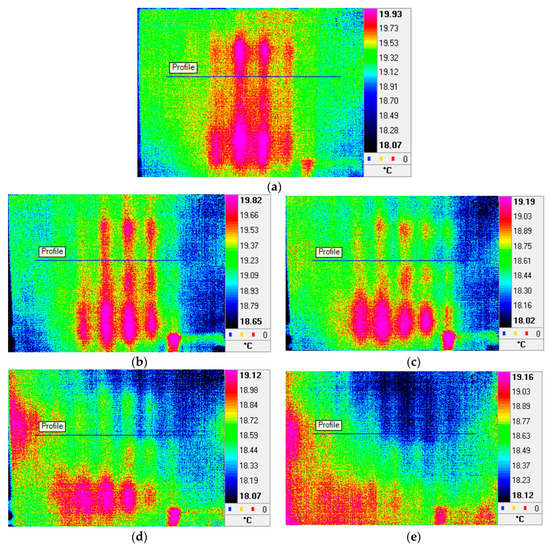
Figure 6.
Thermograms from the detection of RC wall by transmission approach at different instants for different angles of incident waves (θi): (a) Thermogram at 172 s when θi = 0°; (b) Thermogram at 243 s when θi = 15°; (c) Thermogram at 288 s when θi = 30°; (d) Thermogram at 290 s when θi = 45°; (e) Thermogram at 281 s when θi = 60°.
On all the thermograms, we can see the heated areas due to the inference of the refracted waves between the steel bars inside the detected concrete wall. In order to obtain the temperature profiles for determining the shifts’ values, a horizontal segment (the same length on all the thermograms) is placed at the same position (in the vertical and horizontal direction) on all the thermograms. The obtained temperature profiles for all the angles of the incident waves (θ = θi) are presented in Figure 7. The horizontal axis corresponds to the dimension (the length) of the detected RC wall.
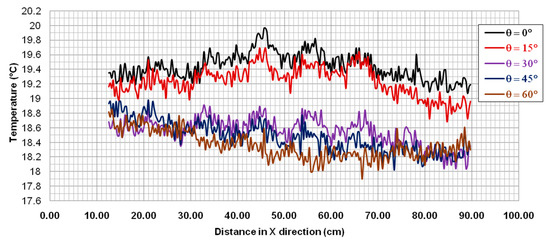
Figure 7.
Temperature profiles for different angles of incident waves (θ = θi).
In order to deduce the shifts’ values, the bottom peaks (which correspond to the real positions of the steel bars in case the normal direction of the microwave antenna is used) of the temperature profiles have to be defined. However, the forms of the temperature profiles do not facilitate the determination of the peaks’ positions. For this reason, convenient fitting curves were needed for all the temperature profiles. In our study, moving the average with a period of 5 was used. Other fit functions (such as linear, exponential, logarithmic, polynomial, and power) have also been tried, but the moving average gives the best-fit curves. Other periods (3, 4, and 6) have also been tried, but period 5 gives the best-fit curves. It is necessary to note that the main objective of using the moving average fit curves is to facilitate the determination of the peaks on the temperature profile curves (after eliminating the multiple pulses) but to avoid a shift between the obtained fit curves and the original temperature profile curves. The peaks were hard to determine with period 3, while period 4 gave a better appearance of some peaks. Period 6 gave good peaks too (compared to period 5), but small shifts (compared to the initial temperature curves) started to appear, and the higher the period was used, the bigger shifts appeared. The fitted curves of the temperature profiles, after the application of the moving average, for all the angles of the incident waves are shown in Figure 8.
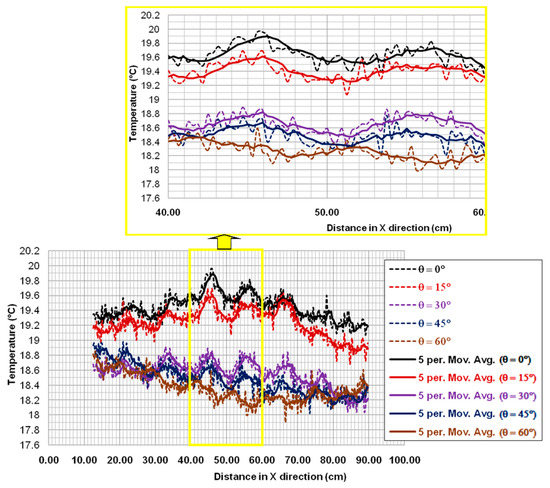
Figure 8.
Temperature profiles with fitting curves by using the moving average for different angles of incident waves (θ = θi).
It is worth noting that 100 cm in the horizontal axis corresponds well to the 1 m width of the detected wall. The minor gridlines of 1 cm lead to a good observation of the shifts (from the peaks for different angles of the incident waves compared to those of the normal incident wave). On the new graphs of the temperature profiles, the peaks clearly appear. We can also observe the zoomed area (from 40 cm to 60 cm) to see the difference between both states of the temperature profiles: before and after the application of the moving average.
As there is no effect on the direction of the infrared camera, the temperature profile for the case of the normal direction of the antenna (the angle of the incident waves is equal to zero) can be used to deduce the position and spacing of the steel bars inside the RC wall. According to the graph, we can see that the spacing of the steel bars is approximately 10 cm (the distance between two peaks). As described in the methodology part (step 4), the shift value for the case of an incident wave is deduced by measuring the distance from the peaks of its temperature profile to the peaks of the temperature profile for the case of the normal incident waves. The temperature profiles used for determining the values of Δi are their fitted curves obtained after using the moving average with a period of 5. Finally, the values of the shifts (Δi) obtained from the fitted temperature curves are shown in Table 1.

Table 1.
Deduced values of the shifts (Δi) from the fitted temperature profiles.
In the 2nd column of the table, the values of sin(θi) are also given, as it is a parameter needed in the next step of the methodology.
4.3. Deduction of Concrete Cover Thickness
The last step, and also the essential one in the proposed methodology, is the use of linear law. In our case, the application of the linear law to the non-linear function (X, Y) in order to obtain the linear function (x, y) is illustrated in Figure 9.
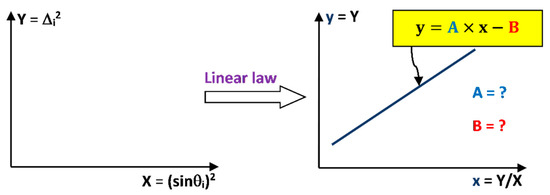
Figure 9.
Application of linear law (x, y) for non-linear relation (X, Y).
Thus, the remaining problem to resolve is to find the equation representing the linear relation (x, y) in order to deduce the value of A and B (Figure 9). For this purpose, the graph (x, y) needs to be drawn by using the values in Table 2.
Table 2.
Values for drawing the linear function (x, y).
Note that the value of x when θi = 60° is too large compared to the average value. For this reason, this point is not taken for determining the equation of the linear function. It can also allow us to see that this angle may be too large for detection with our microwave antenna due to the constraint related to its dimensions.
By using the values in Table 2, the graph of the linear function (x, y) is obtained (an approximation with R2 = 0.965), as shown in Figure 10.
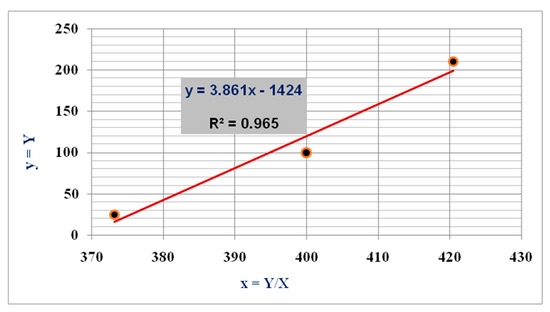
Figure 10.
Graph of the linear function (x, y) for deducing the value of concrete cover thickness.
According to the equation of the fitting line: , and the Equation (6), the values of “ε2” and “e” can be deduced as follows:
Therefore, the deduced value of the concrete cover thickness by the proposed methodology (37.74 mm) is acceptable compared to the real value (38 mm).
5. Conclusions
In this study, an innovative methodology with microwave thermography for determining the concrete cover thickness of one-layer reinforcements in an RC wall was presented By using the transmission approach with five angles of microwave antenna direction and the Snell–Descartes law (physical) and linear law (mathematical), the methodology led us to deduce the approximate value of the concrete cover thickness. The concrete cover detected by the proposed method was behind the reinforcement layer. This methodology expands the frontier of the infrared thermography method, which is a non-contact and simple method but capable of detecting the concrete cover thickness.
Perspectives of the present work can be the application of the reflection approach by taking into account the direction of the infrared camera, which would be more complicated for detecting the concrete cover facing the microwave antenna.
Author Contributions
Conceptualization, F.B. (Florin Breaban), D.D. and S.A.K.; methodology, S.A.K. and D.D.; formal analysis, S.A.K.; investigation, S.A.K., D.D. and F.B. (Franck Brachelet); data curation, S.A.K. and F.B. (Franck Brachelet); writing—original draft preparation, S.A.K.; writing—review and editing, S.A.K. and D.D.; visualization, S.A.K.; supervision, D.D. and F.B. (Florin Breaban); funding acquisition, D.D. All authors have read and agreed to the published version of the manuscript.
Funding
The authors would like to acknowledge the Nord-Pas-Calais Regional Council and the Laboratory of Civil and geo-Environmental (LGCgE) of Artois University for their financial support.
Institutional Review Board Statement
Not applicable.
Informed Consent Statement
Not applicable.
Data Availability Statement
Not applicable.
Acknowledgments
The authors express their gratitude to the Mechanical and Productive Department of the Institut Universitaire de Technologie de Béthune (IUT Béthune) for providing space to carry out the tests. The methodology presented in the manuscript is the outcome of the collaboration between LGCgE and the ENDSUM’s (Evaluation Non Destructive des Structures et des Matériaux) research team of the Cerema Angers.
Conflicts of Interest
The authors declare no conflict of interest.
References
- Civil Engineering Association of France (AFGC). Conception des bétons pour une durée de vie donnée des ouvrages—Indicateurs de durabilité: Conception des bétons pour une durée de vie donnée des ouvrages—Indicateurs de durabilité; Research Report in French; Civil Engineering Association of France (AFGC): Paris, France, 2004; p. 252. [Google Scholar]
- Klysz, G.; Balayssac, J.-P.; Laurens, S. Spectral Analysis of Radar Surface Waves for Non-Destructive Evaluation of Cover Concrete. NDT E Int. 2004, 37, 221–227. [Google Scholar] [CrossRef]
- Dérobert, X.; Iaquinta, J.; Klysz, G.; Balayssac, J.-P. Use of Capacitive and GPR Techniques for the Non-Destructive Evaluation of Cover Concrete. NDT E Int. 2008, 41, 44–52. [Google Scholar] [CrossRef]
- Agred, K. Localisation automatique des aciers et caractérisation de la teneur en eau du béton armé par radar double-offset à grand rendement. Ph.D. Thesis, Université Toulouse 3 Paul Sabatier, Toulouse, France, 2017. (In French). [Google Scholar]
- Agred, K.; Klysz, G.; Balayssac, J.-P. Location of Reinforcement and Moisture Assessment in Reinforced Concrete with a Double Receiver GPR Antenna. Constr. Build. Mater. 2018, 188, 1119–1127. [Google Scholar] [CrossRef]
- Sbartaï, Z.M.; Laurens, S.; Viriyametanont, K.; Balayssac, J.P.; Arliguie, G. Non-Destructive Evaluation of Concrete Physical Condition Using Radar and Artificial Neural Networks. Constr. Build. Mater. 2009, 23, 837–845. [Google Scholar] [CrossRef]
- Du Plooy, R.; Villain, G.; Palma Lopes, S.; Ihamouten, A.; Dérobert, X.; Thauvin, B. Electromagnetic Non-Destructive Evaluation Techniques for the Monitoring of Water and Chloride Ingress into Concrete: A Comparative Study. Mater. Struct. 2015, 48, 369–386. [Google Scholar] [CrossRef]
- Sbartaï, Z.-M.; Laurens, S.; Breysse, D. Concrete Moisture Assessment Using Radar NDT Technique—Comparison between Time and Frequency Domain Analysis. In Proceedings of the Non-Destructive Testing in Civil Engineering (NDTCE’09), Nantes, France, 30 June–3 July 2009; p. 9. [Google Scholar]
- Maldague, X.P.V. Theory and Practice of Infrared Technology for Nondestructive Testing. In Wiley Series in Microwave and Optical Engineering; Wiley: New York, NY, USA, 2001. [Google Scholar]
- Deane, S.; Avdelidis, N.P.; Ibarra-Castanedo, C.; Williamson, A.A.; Withers, S.; Zolotas, A.; Maldague, X.P.V.; Ahmadi, M.; Pant, S.; Genest, M.; et al. Development of a Thermal Excitation Source Used in an Active Thermographic UAV Platform. Quant. InfraRed Thermogr. J. 2022, 1–32. [Google Scholar] [CrossRef]
- Dahlberg, P.; Ziegeler, N.J.; Nolte, P.W.; Schweizer, S. Design and Construction of an LED-Based Excitation Source for Lock-In Thermography. Appl. Sci. 2022, 12, 2940. [Google Scholar] [CrossRef]
- Geng, C.; Shi, W.; Liu, Z.; Xie, H.; He, W. Nondestructive Surface Crack Detection of Laser-Repaired Components by Laser Scanning Thermography. Appl. Sci. 2022, 12, 5665. [Google Scholar] [CrossRef]
- Lee, S.; Chung, Y.; Kim, W. Defect Recognition and Morphology Operation in Binary Images Using Line-Scanning-Based Induction Thermography. Appl. Sci. 2022, 12, 6006. [Google Scholar] [CrossRef]
- Lubkowska, A.; Pluta, W. Infrared Thermography as a Non-Invasive Tool in Musculoskeletal Disease Rehabilitation—The Control Variables in Applicability—A Systematic Review. Appl. Sci. 2022, 12, 4302. [Google Scholar] [CrossRef]
- Sultan, A.A.; Washer, G. A Pixel-by-Pixel Reliability Analysis of Infrared Thermography (IRT) for the Detection of Subsurface Delamination. NDT E Int. 2017, 92, 177–186. [Google Scholar] [CrossRef]
- Bagavac, P.; Krstulović-Opara, L.; Domazet, Ž. Infrared Thermography of Steel Structure by FFT. Mater. Today Proc. 2019, 12, 298–303. [Google Scholar] [CrossRef]
- Bu, C.; Liu, G.; Zhang, X.; Tang, Q. Debonding Defects Detection of FMLs Based on Long Pulsed Infrared Thermography Technique. Infrared Phys. Technol. 2020, 104, 103074. [Google Scholar] [CrossRef]
- Verspeek, S.; Ribbens, B.; Maldague, X.; Steenackers, G. Spot Weld Inspections Using Active Thermography. Appl. Sci. 2022, 12, 5668. [Google Scholar] [CrossRef]
- Keo, S.A.; Brachelet, F.; Defer, D.; Breaban, F. Defects Detection by Infrared Thermography with a New Microwave Excitation System. Mech. Ind. 2014, 15, 509–516. [Google Scholar] [CrossRef]
- Zheng, H.; Zhou, L.; Marks, R.; Happonen, T.; Kraft, T.M. Defect Recognition of Roll-to-Roll Printed Conductors Using Dark Lock-in Thermography and Localized Segmentation. Appl. Sci. 2022, 12, 2005. [Google Scholar] [CrossRef]
- Keo, S.-A.; Defer, D.; Breaban, F.; Brachelet, F. Comparison between Microwave Infrared Thermography and CO2 Laser Infrared Thermography in Defect Detection in Applications with CFRP. Mater. Sci. Appl. 2013, 4, 600–605. [Google Scholar] [CrossRef][Green Version]
- Keo, S.A.; Brachelet, F.; Breaban, F.; Defer, D. Defect Detection in CFRP by Infrared Thermography with CO2 Laser Excitation Compared to Conventional Lock-in Infrared Thermography. Compos. Part B Eng. 2015, 69, 1–5. [Google Scholar] [CrossRef]
- Keo, S.-A.; Brachelet, F.; Breaban, F.; Defer, D. Development of an Infrared Thermography Method with CO2 Laser Excitation, Applied to Defect Detection in CFRP. Int. J. Civ. Environ. Eng. 2013, 7, 5. [Google Scholar]
- Yumnam, M.; Gupta, H.; Ghosh, D.; Jaganathan, J. Inspection of Concrete Structures Externally Reinforced with FRP Composites Using Active Infrared Thermography: A Review. Constr. Build. Mater. 2021, 310, 125265. [Google Scholar] [CrossRef]
- Dragan, R.G.; Rosca, I.-C.; Keo, S.-A.; Breaban, F. Active Thermography Method Using an CO2 Laser for Thermal Excitation, Applied to Defect Detection in Bioceramic Materials. In Proceedings of the 2013 E-Health and Bioengineering Conference (EHB), Iasi, Romania, 21–23 November 2013; IEEE: Iasi, Romania, 2013; pp. 1–4. [Google Scholar] [CrossRef]
- Keo, S.A. Développement d’une méthode de thermographie infrarouge active par excitation micro-ondes appliquée au contrôle non destructif. Ph.D. Thesis, Université d’Artois, Béthune, France, 2013. (In French). [Google Scholar]
- Keo, S.A. Nouvelles Méthodes de Contrôle Non Destructif (CND) en Génie Civil Développement de la Méthode de Thermographie Infrarouge par Excitation Micro-onde et Laser CO2; Presses Académiques Francophones: Sarrebruck, Germany, 2014. [Google Scholar]
- Keo, S.A.; Brachelet, F.; Breaban, F.; Defer, D. Steel Detection in Reinforced Concrete Wall by Microwave Infrared Thermography. NDT E Int. 2014, 62, 172–177. [Google Scholar] [CrossRef]
- Szymanik, B.; Frankowski, P.; Chady, T.; John Chelliah, C. Detection and Inspection of Steel Bars in Reinforced Concrete Structures Using Active Infrared Thermography with Microwave Excitation and Eddy Current Sensors. Sensors 2016, 16, 234. [Google Scholar] [CrossRef] [PubMed]
- Szymanik, B.; Chady, T.; Frankowski, P. Inspection of Reinforcement Concrete Structures with Active Infrared Thermography. AIP Conf. Proc. 2017, 1806, 100013. [Google Scholar] [CrossRef]
- Hong, C.R.; Buyukozturk, O. Electromagnetic Properties of Concrete at Microwave Frequency Range. ACI Mater. J. 1998, 95, 262–271. [Google Scholar]
- Jamil, M.; Hassan, M.K.; Al-Mattarneh, H.M.A.; Zain, M.F.M. Concrete Dielectric Properties Investigation Using Microwave Nondestructive Techniques. Mater. Struct. 2013, 46, 77–87. [Google Scholar] [CrossRef]
- Makul, N.; Rattanadecho, P.; Agrawal, D.K. Applications of Microwave Energy in Cement and Concrete—A Review. Renew. Sustain. Energy Rev. 2014, 37, 715–733. [Google Scholar] [CrossRef]
- Mai, T.C. Evaluation non destructive des matériaux de construction par technique électromagnétique aux fréquences radar—Modélisation et Expérimentation en laboratoire. Ph.D. Thesis, Université de Bordeaux, Bordeaux, French, 2015. (In French). [Google Scholar]
- Keo, S.-A.; Yune, C.-Y.; Dragan, R.G.; Defer, D.; Breaban, F. Analysis of Effects of Diffraction and Interference on Detection by Microwave Thermography. J. Civ. Struct. Health Monit. 2019, 9, 153–167. [Google Scholar] [CrossRef]


Publisher’s Note: MDPI stays neutral with regard to jurisdictional claims in published maps and institutional affiliations. |
© 2022 by the authors. Licensee MDPI, Basel, Switzerland. This article is an open access article distributed under the terms and conditions of the Creative Commons Attribution (CC BY) license (https://creativecommons.org/licenses/by/4.0/).