

Water Purification Effect of Ecological Floating Bed Combination Based on the Numerical Simulation
1
School of College of Water Conservancy Engineering, Tianjin Agricultural University, No. 22, Jinjing Road, Xiqing District, Tianjin 300392, China
2
State Key Laboratory of Hydraulic Engineering Simulation and Safety, Tianjin University, Tianjin 300072, China
*
Author to whom correspondence should be addressed.
Sustainability 2022, 14(19), 12276; https://doi.org/10.3390/su141912276
Submission received: 25 August 2022
/
Revised: 22 September 2022
/
Accepted: 24 September 2022
/
Published: 27 September 2022
(This article belongs to the Special Issue Urban Management Based on the Concept of Sustainable Development)
Abstract
:The Wuqing urban section of the North Canal Basin, Tianjin, is a significant gathering place for multisource pollution, showing the characteristics of a stagnant water body supplied by unconventional water sources. With the development of the economy and society, the water quality of the Wuqing urban section of the North Canal Basin, Tianjin, has been seriously polluted due to the discharge of sewage outlets and the influx of nonpoint source pollution from farmland. In this study, based on the results of special water experiments, a two-dimensional hydrodynamic water quality model was constructed. The concentrations of ammonia nitrogen (NH3-N), total phosphorus (TP), and chemical oxygen demand (COD) in the study area were simulated, and the model parameters were calibrated and verified with the measured values. Based on the model verification, the water quality improvement scheme of the ecological floating bed with different plant ratios was set up to simulate the water quality. The research results showed that the average concentrations of NH3-N, TP, and COD decreased by 10.4%, 15.7%, and of d 26.3%, respectively, after the ecological floating bed was arranged. During model parameter calibration and validation, the RMSE ranges of NH3-N, TP, and COD were 0.09~0.22 mg/L, 0.00~0.02 mg/L, and 0.37~2.42 mg/L, respectively. Other statistical indicators are also within a reasonable range, and the model accuracy and reliability are high. The simulation results of different scenarios showed that the optimal ratio of ecological floating bed plants was 700 m2 of Scirpus validus Vahl and 700 m2 of Canna in zone 1 of the floating bed combination, 430 m2 of Scirpus validus Vahl, and 170 m2 of Iris in zone 2 of the floating bed combination, and 200 m2 of Iris and 200 m2 of Lythrum salicaria in zone 3 of the floating bed combination. This study can provide a theoretical basis for the sustainable development of water purification in the North Canal. It can also provide a model approach for the implementation of river water purification schemes, exemplified by the North Canal.
1. Introduction
In ecological purification projects, the ecological floating bed based on the internal interaction of the plant community plays an important role in sewage purification and water quality restoration. This project obtained plant units with better purification effects on different water quality indicators through the screening of different aquatic plants [1,2]. The configuration of different types of aquatic plants after manual screening has different effects on water purification [3,4], and the rational configuration of ecological floating bed aquatic plants can improve the purification effect [5,6,7,8,9]. The purification of polluted water by ecological floating beds mainly relies on the physiological and biochemical effects of floating bed plants and the physical sedimentation of plant roots on water bodies. Floating bed plants are also the most critical part of the entire artificial ecological floating bed. The ecological floating bed purifies the polluted water body by configuring different plants, using the direct absorption of plants to various pollutants in the water, the promoting effect of plants, and the combined action of plants and root microorganisms [10,11,12,13]. The configuration types of different plants in the ecological floating bed have differences in the purification capacity of each water quality index. The plant type configuration of Phragmites communis, Typha orientalis Presl, Nelumbo SP, Charophyceae, and Potamogeton pectinatus had a better effect on the removal of TN and TP from water. The plant type configuration of Phragmites communis, Typha orientalis Presl, Nelumbo SP, Charophyceae, and Ceratophyllum demersum had the best removal effect of NH3-N in water. The plant type configuration of Phragmites communis, Typha orientalis Presl, Nelumbo SP, and Potamogeton pectinatus has a better removal effect of TP in water bodies [14,15,16,17,18,19,20,21]. Jing Yanwen et al. [22] used the commonly used extruded polystyrene as the ecological floating bed template and chose Cyperus alternifolius and Canna as the ecological floating bed selection plants. The results show that the ratio of ecological floating bed plants has a strong absorption effect on nitrogen and phosphorus in the water body. Lu Jindeng et al. [23] cultivated seven kinds of plants in an artificial ecological floating bed in eutrophic water, and the research results showed that the Phragmites communis artificial floating bed had the best purification effect. Lythrum salicaria and Iris are resistant to severe colds and can be naturally overwintered in the open air in northern China. Canna is generally cold-resistant and needs to take thermal insulation measures to survive winter in northern China. Scirpus validus Vahl has strong environmental adaptability and strong stress resistance and can be better used in ecological floating beds in northern water bodies [24,25,26,27,28]. The water purification function of ecological floating beds has always been a research hotspot and has played a good role in engineering. However, from individual aquatic plants to complex ecological floating beds, field experiments are becoming increasingly complicated. Additionally, time-consuming and labor-intensive field experiments are affected by many uncertain factors, which further exacerbates the difficulty of research.
The numerical model has the advantages of time savings, labor savings, and strong flexibility [29]. It can establish suitable river terrain conditions and make reasonable plans for the configuration of plant types, the distribution of planting areas, and the size of the area. Numerical simulation has become an effective means to study water purification. However, research on ecological floating bed combinations based on numerical simulations in China is relatively late compared with that in foreign countries. In recent years, with the rapid development of scientific and technological levels and computer levels, some researchers have performed research on hydrodynamic-water quality simulation. The authors in [30,31,32] constructed a two-dimensional hydrodynamic-water quality model based on MIKE21 software. Parameter calibration and model verification were carried out for the Xi’an Moat, Shahe Reservoir, and an inland river in northwest China, and corresponding water quality improvement simulation research was carried out. However, the water quality has not been improved by arranging plant ecological floating beds in the corresponding river channel, and the sustainable development of the river water environment remains to be studied [33,34].
The North Canal is a key river for improving the water environment of the Haihe River Basin. The subject has carried out water purification treatment for the Wuqing Demonstration Section of the North Canal Basin, Tianjin. The water quality has been improved to a certain extent, and the water quality has reached the surface water class V standard. The preliminary work of China’s National Water Pollution Control and Treatment Science and Technology Major Project (Water Special) verified the water purification effect of the ecological floating bed combination of different plants through experiments. The research process consumes many financial and human resources, and the understanding of the overall water quality and spatial distribution of the river is not comprehensive enough. In order to achieve the sustainable development of the ecological environment, it is necessary to more comprehensively explore the changes in the water quality of the North Canal [35,36,37]. Based on special water research results, this study established a numerical model to simulate hydrodynamic water quality, further screened the optimal ecological floating bed combination, and discussed the effect of water purification. Additionally, it provides a theoretical basis for the implementation of the northern river water purification scheme, taking the North Canal as an example.
2. Materials and Methods
2.1. Overview of the Study Area
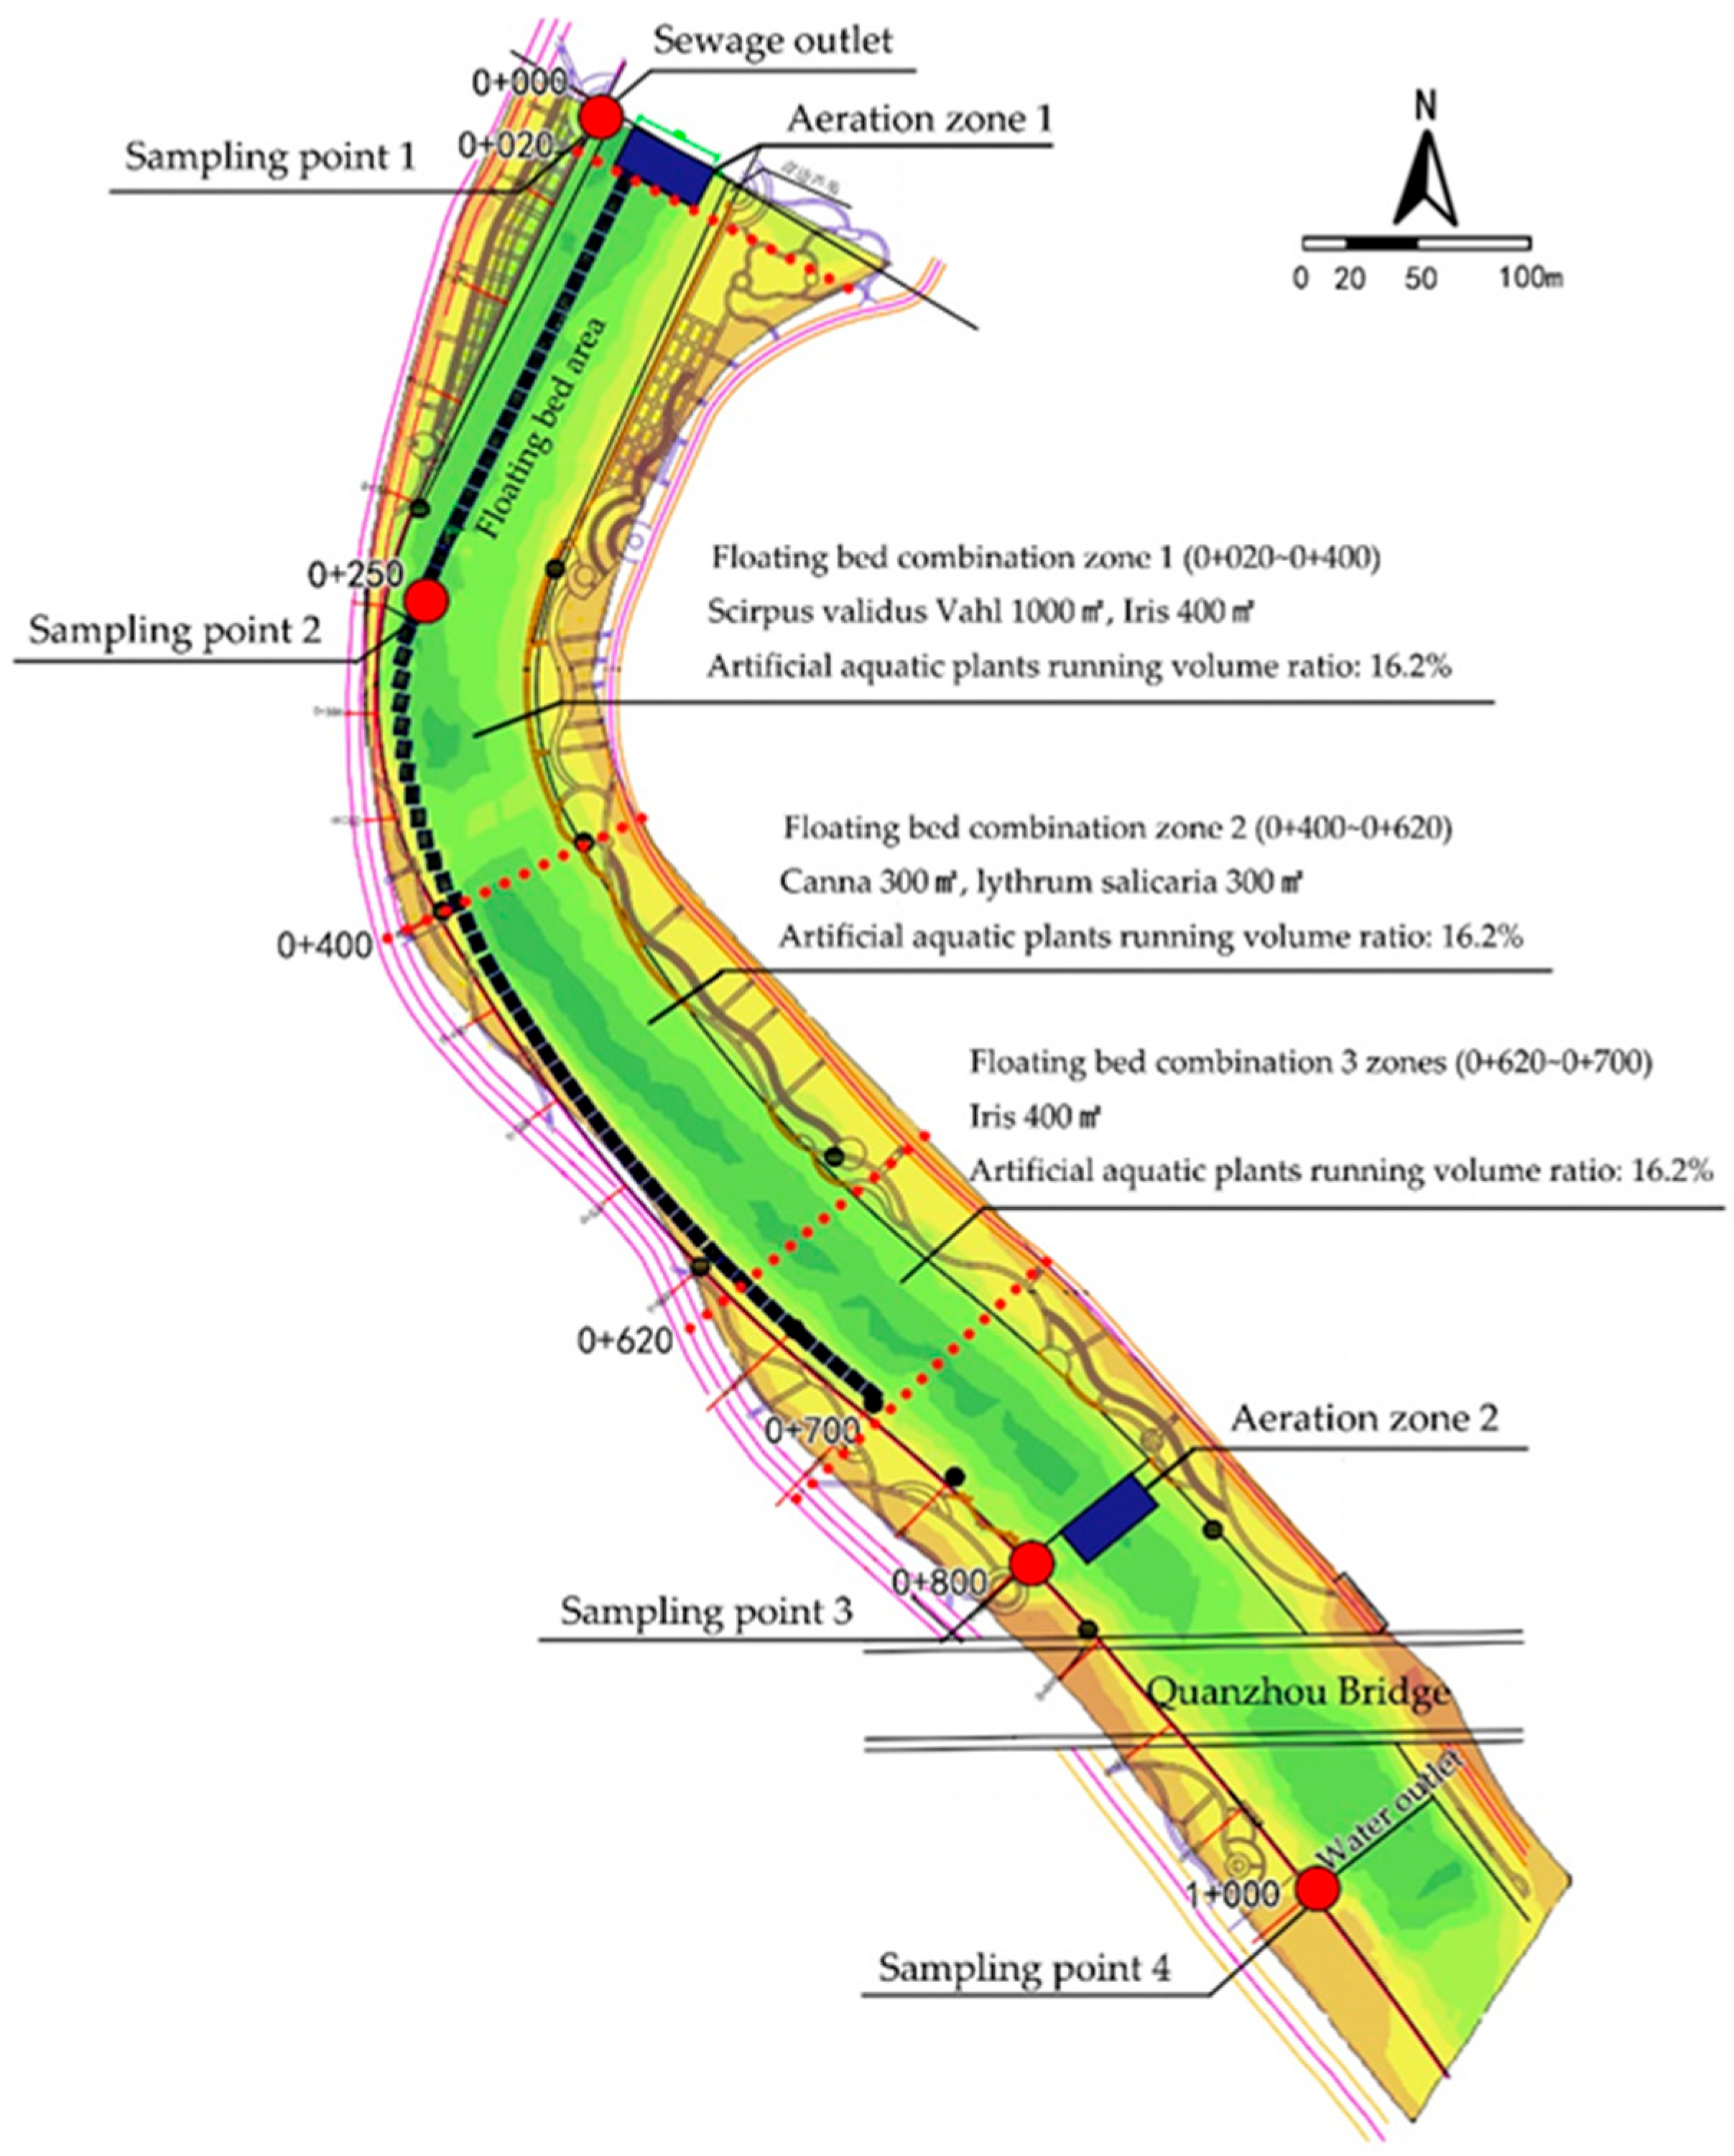
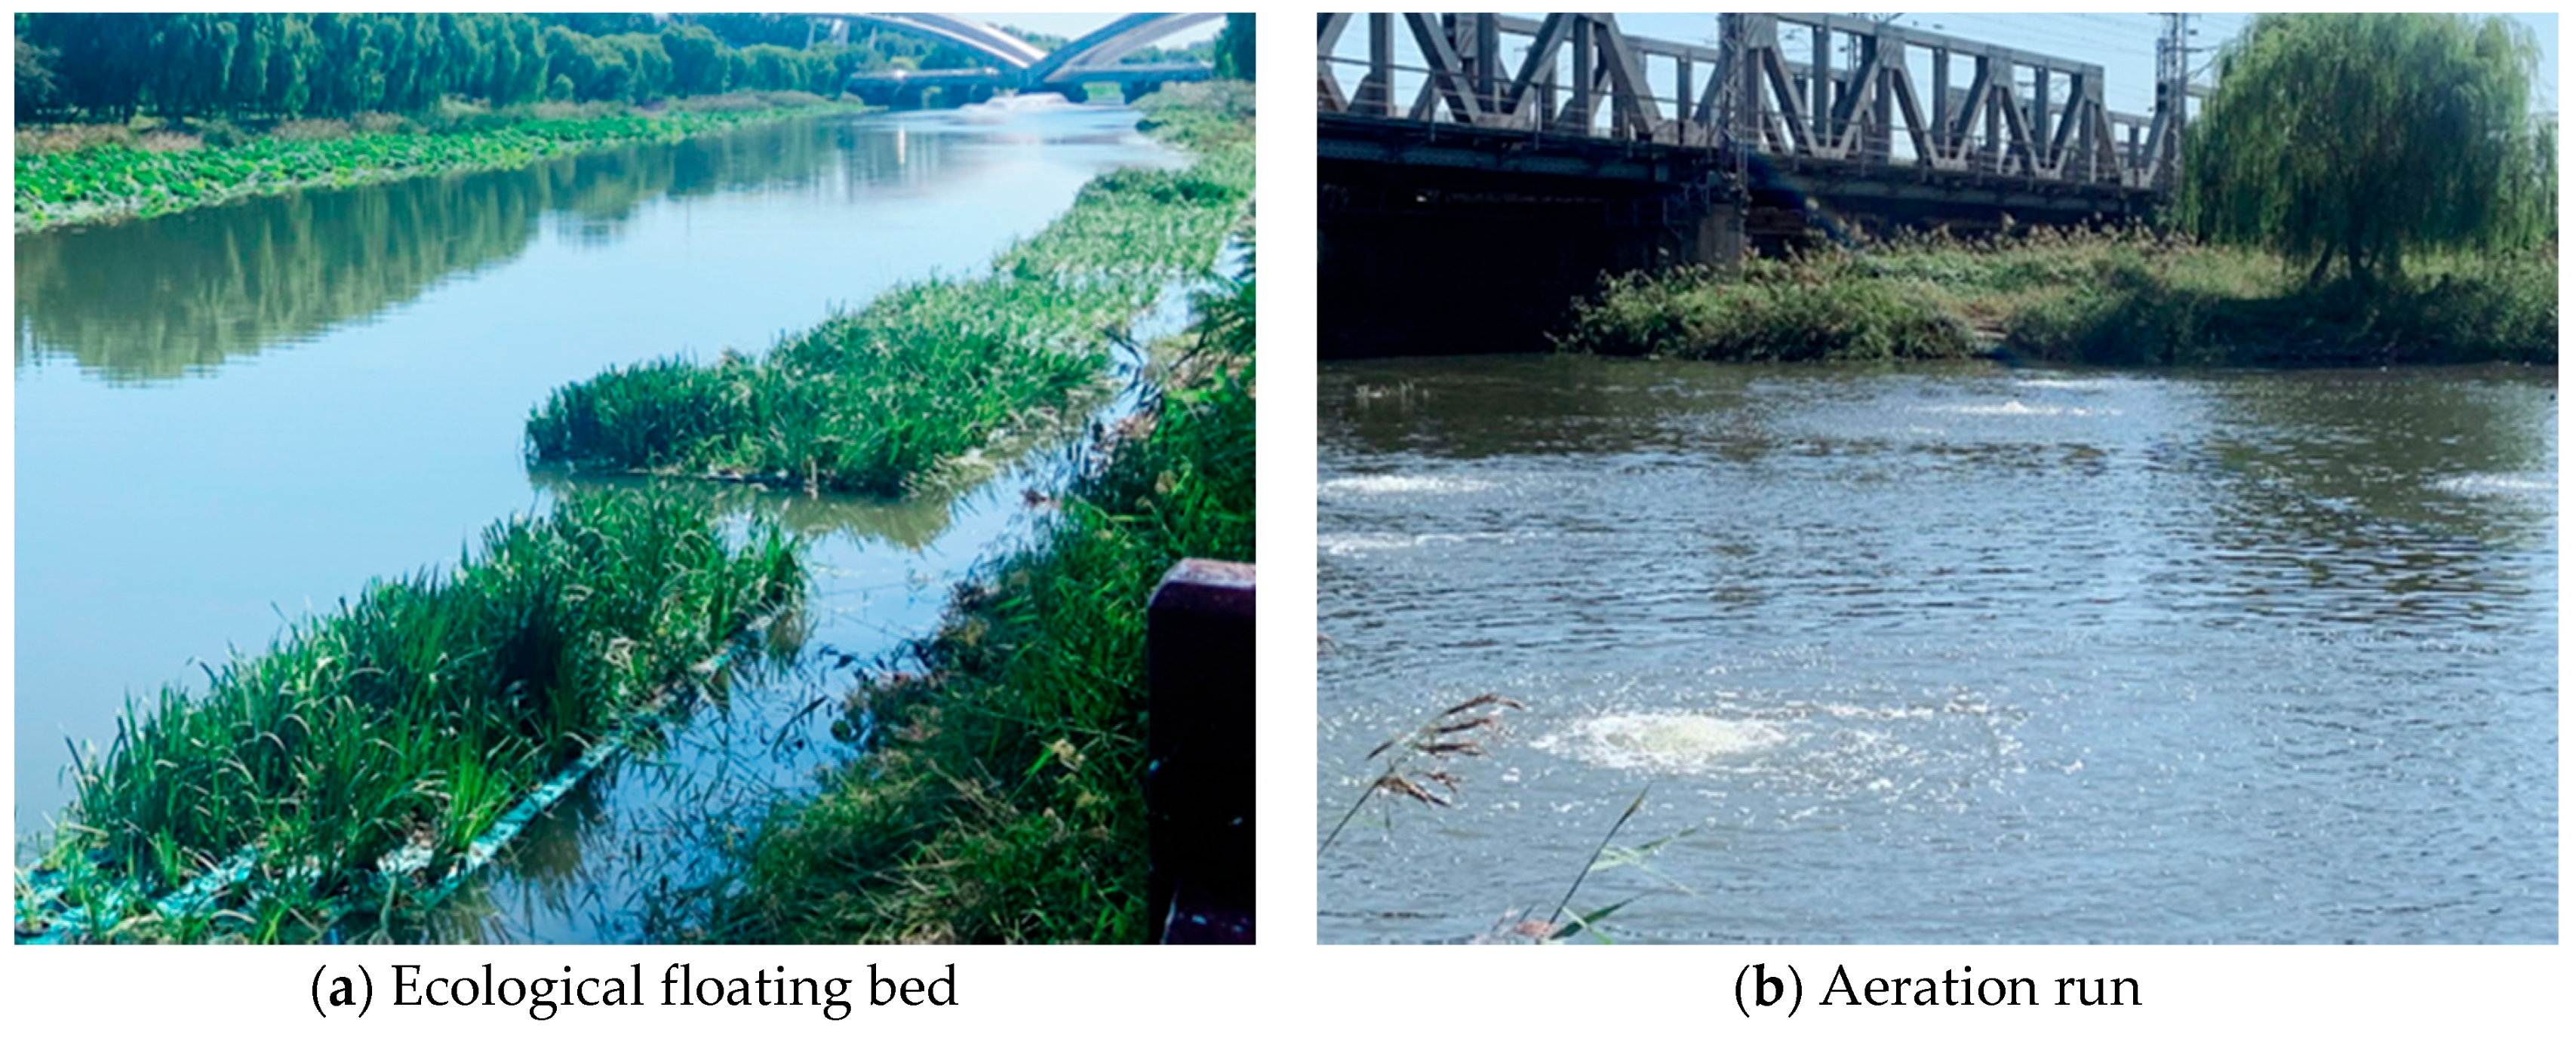
The study area was within 1.1 km of the sewage outlet of the Wuqing No. 7 Sewage Treatment Plant in the North Canal Basin, Tianjin. The average bottom width of the main channel of the river was 57 m, and the average water depth was 1.75 m. It was a stagnant channel. There was no water purification treatment site on either side of the research river. Affected by the discharge of sewage outlets and the inflow of nonpoint source pollution from farmland, the pollutants exceed the standard after rain in the rainy season, and the water quality is often unstable in the dry season. The water special project screened 4 kinds of aquatic plants suitable for the study of the river section through preliminary experiments and plant characteristics and was equipped with ecological floating bed for demonstration project. The main water quality indicators of the demonstration river reach should reach the surface water category V (NH3-N ≤ 2 mg/L, TP ≤ 0.4 mg/L, COD ≤ 40 mg/L). In the preliminary pilot test, Scirpus validus Vahl, Iris, Lythrum salicaria, and Canna effectively reduced the concentrations of NH3-N, TP, and COD water quality indicators. In 2020, the artificial aquatic plants Scirpus validus Vahl, Iris, Lythrum salicaria, and Canna were arranged in the study area to form an ecological floating bed, and the purification effect of the ecological floating bed on water quality indicators under different vegetation ratios was determined. Combined with the actual situation of the river channel and the characteristics of water flow, four sampling points at 0+000 stake, 0+250 stake, 0+800 stake, and 1+000 stake were selected to monitor NH3-N, TP, and COD indicators. The plant distribution in each ecological floating bed combination area is shown in Figure 1. In the upstream Section 0+000 to 0+020 and the downstream Section 0+800 to 0+820, a 20 m-long distributed microaeration was installed. For the research situation, see Figure 2.
2.2. Model Governing Equations
2.2.1. Hydrodynamic Model
The hydrodynamic model was based on the Navier-Stokes equation of the three-way incompressible Reynolds average obeys the Boussinesq assumption and the assumption of hydrostatic pressure, and obtains a two-dimensional shallow water equation system based on the average integral of the water depth. This system of equations is a continuity equation based on still water depth, and the specific equations are as follows:
The momentum equation in the x direction is as follows:
The momentum equation in the y direction is as follows:
where t represents time; x and y are Cartesian coordinates; η is the water level; d is the still water depth; u and v are velocity components in the x and y directions, respectively; ƒ is the Coriolis force coefficient, ƒ = 2ωsinφ, ω is the angular velocity of the Earth’s rotation, φ is the local latitude; g is the acceleration of gravity; ρ is the density of water; S is the source-sink term; us and vs. are the water flow velocity of the source-sink term; τsx, τbx, τsv, and τbv are the components of the surface wind stress and the frictional stress at the bottom of the riverbed along the x and y directions, respectively.
2.2.2. Water Quality Model
The state variable process differential equations of COD, NH3-N, and TP involved in the water quality model in this study are as follows [38]:
where C is the COD value (g·m−3), Cd is the COD degradation amount (g·m−3·d−1), CS is the COD sedimentation amount (g·m−3·d−1), CR is the amount of COD resuspension (g·m−3·d−1), K3 is the first-order degradation rate of COD at 20 °C (d−1), θ3 is the coefficient of the Arrhenius temperature limiting function (dimensionless, value 1.0~1.2), T is water temperature (°C), D is DO concentration (g·m−3), S is HS concentration (g·m−3); KS is COD sedimentation rate (d−1), KR is COD regeneration suspension rate (d−1), H is water depth (m), AS is sedimentation COD (g·m−2), and AR is suspended COD (g·m−2).
where is the NH3-N content (g·m−3), YC is the proportion of NH3-N released from COD degradation, UN is the consumption of nitrification reaction (g·m−3·d−1), UP is the amount of NH3-N absorbed by plants (g·m−3·d−1), UB is the amount of NH3-N absorbed by bacteria (g·m−3·d−1), Y1 is the amount of NH3-N involved in nitrification (dimensionless), and K4 is First-order nitrification reaction rate of NH3-N at 20 °C (d−1), θ4 is the coefficient of Arrhenius temperature limit function of nitrification process (dimensionless, value 1.0–1.2), NP is the total amount of NH3-N absorbed by plants (g·m−3), P is the maximum oxygen production rate of plant photosynthesis (d−1), R1 is the plant respiration rate (d−1), θ1 is the coefficient of the Arrhenius temperature limit function in the nitrification process (dimensionless, value 1.0~1.2), F(N,P) is the MICHAELIS_MENTEN NH3-N/phosphorus concentration limiting function (dimensionless) of the plant respiration process; UNb is the rate coefficient of NH3-N absorption by bacteria, refers to the half-saturated oxygen concentration of NH3-N absorbed by bacteria (g·m−3).
The uptake of phosphorus by plants is UP_P, and the calculation formula is as follows:
where UPP is the phosphorus absorption coefficient of plants, mgP/mgO2, and F(N,P) is the nutrient limit function of plant photosynthesis.
2.3. 2D Model Construction of the Study Area
2.3.1. Study Area Generalization
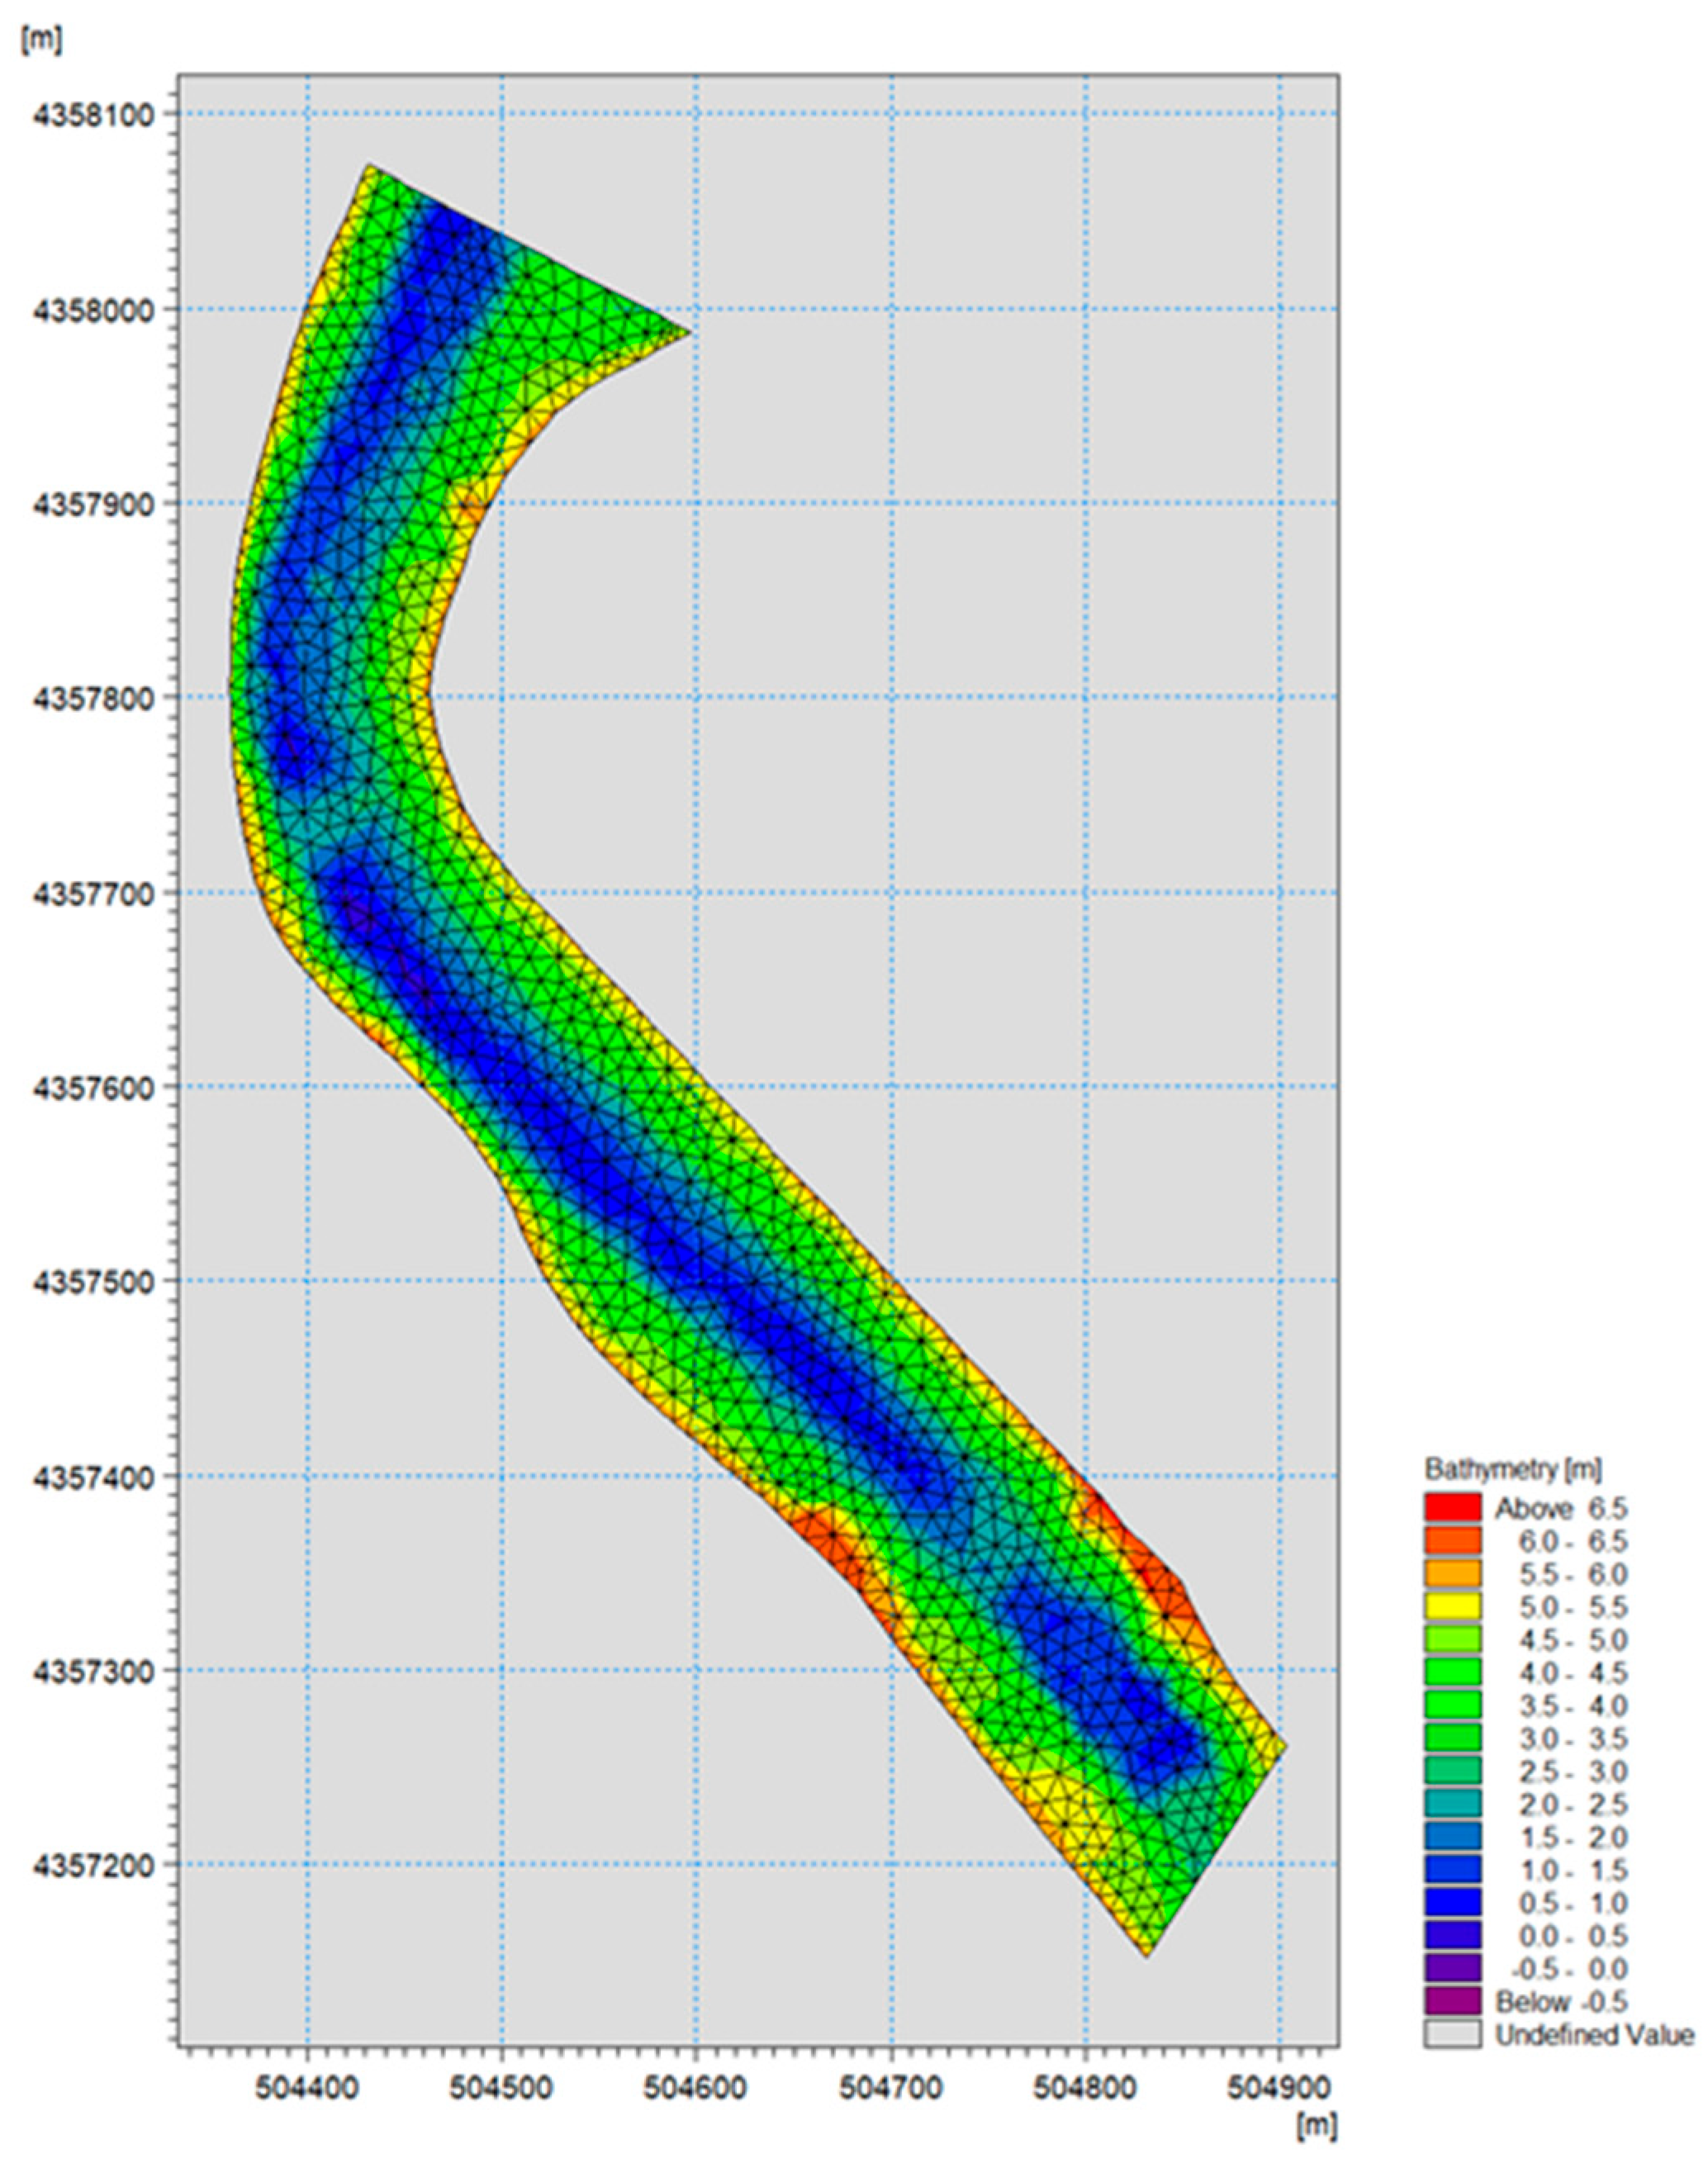
According to the horizontal and vertical section data of the research river section measured by the intelligent measurement and control unmanned ship and the actual river bottom elevation data of the field survey, the CAD topographic map of the research river section is drawn and generalized. Through cross-section simplification, river terrain data correction, and other related operations, the generalized topographic file of the research river reach is obtained, and the calculation grid is shown in Figure 3.
2.3.2. Simulation Condition Settings
The simulation period of this model was set from 8:00 a.m. on 3 July 2020, to 8:00 a.m. on 3 August 2020. On the basis of fully balancing the stability and efficiency of the model calculation, the time step of the model calculations is 30 s.
Set the iterative solution parameters of the hydrodynamic module equation, among which the CFL parameter has a greater influence. After model calibration and parameter correction, the CFL number was determined to be 0.8. Set the open boundary as the north-south boundary condition and set data such as flow velocity at the north-south boundary. According to the selection formula, the recommended value of 0.28 is the eddy viscosity coefficient, and the Manny coefficient was used as the input item to describe the bottom friction force. After calibration, the Manny coefficient value was 0.03125. The dry and wet boundary adopts the recommended value of the program, in which the dry water depth was 0.005 m, and the wet water depth was 0.05 m. To improve the calculation efficiency of the model, the simulation time was calculated in months to ensure the accuracy of the model, and the time step was 30 s. Since the river reaches do not freeze in winter and the water surface was less affected by wind, the influence of wind field and ice cover was not considered in the model calculation.
The average value of the actual monitoring data on site on 3 July 2020, was selected as the initial conditions (Table 1) and boundary conditions of the model simulation. High-pressure fans (power 5 kW) were used for aeration in both the north and south borders. The aeration pipe network was arranged at the bottom of the main channel (40 m wide) of the river. The aeration volume reached 260 m3/h at a water depth of 1.5 m, and the dissolved oxygen increment reached 2 mg/L. There were sewage outlets and aeration at the northern boundary, and the average concentration of each state variable at the sewage outlet is consistent with that of sampling point 1.
The water quality model parameter rate is timed, the measured value and the reference experience value are integrated, and the parameters are repeatedly adjusted by the trial-and-error method to obtain a relatively stable water quality model. Table 2 is the simulated water quality parameter table, in which the parameters of NH3-N, TP, and COD are drawn and inputted by the surface file according to the attenuation coefficients in Table 3. Table 3 shows the attenuation coefficient of each water quality indicator under different ecological floating bed combinations according to the degradation coefficient, plant ratio, and percentage of water quality indicators of different aquatic plants. The actual attenuation coefficient of aquatic plants in the mathematical model of the studied river reaches is obtained through model parameter calibration.
2.4. Model Parameter Calibration and Validation
Based on the existing water level data and river section water quality monitoring data, this study calibrates the model hydrodynamics and analyses and evaluates the simulation results in the study area after the calibration is completed. The root mean square error (RMSE), mean error (ME), consistency index (d), and Nash–Sutcliffe efficiency (NSE) were used to evaluate the performance of the hydrodynamic water quality model to simulate the water purification effect. The mathematical equations of the statistical data are as follows:
where Oi and Pi are the measured and simulated values, respectively, n is the number of observations, and is the average of the measured values. RMSE reflects the degree of deviation between the predicted value and the actual value, and MAE represents the average value of the absolute error, reflecting the actual situation of the predicted value error. The closer RMSE and MAE are to zero, the better the performance of the model [39]. The range of NSE was from −∞ to 1. When NSE was close to 1, it means that the model has high reliability; if NSE was close to 0, it means that the simulation results were close to the average level of the observed values, i.e., the overall results are credible, but the process simulation error is large [40]. The range of d was 0~1, and the closer the value was to 1, the higher the degree of agreement between the model prediction results and the actual monitoring values [41].
3. Results and Analysis
3.1. River Water Quality Monitoring
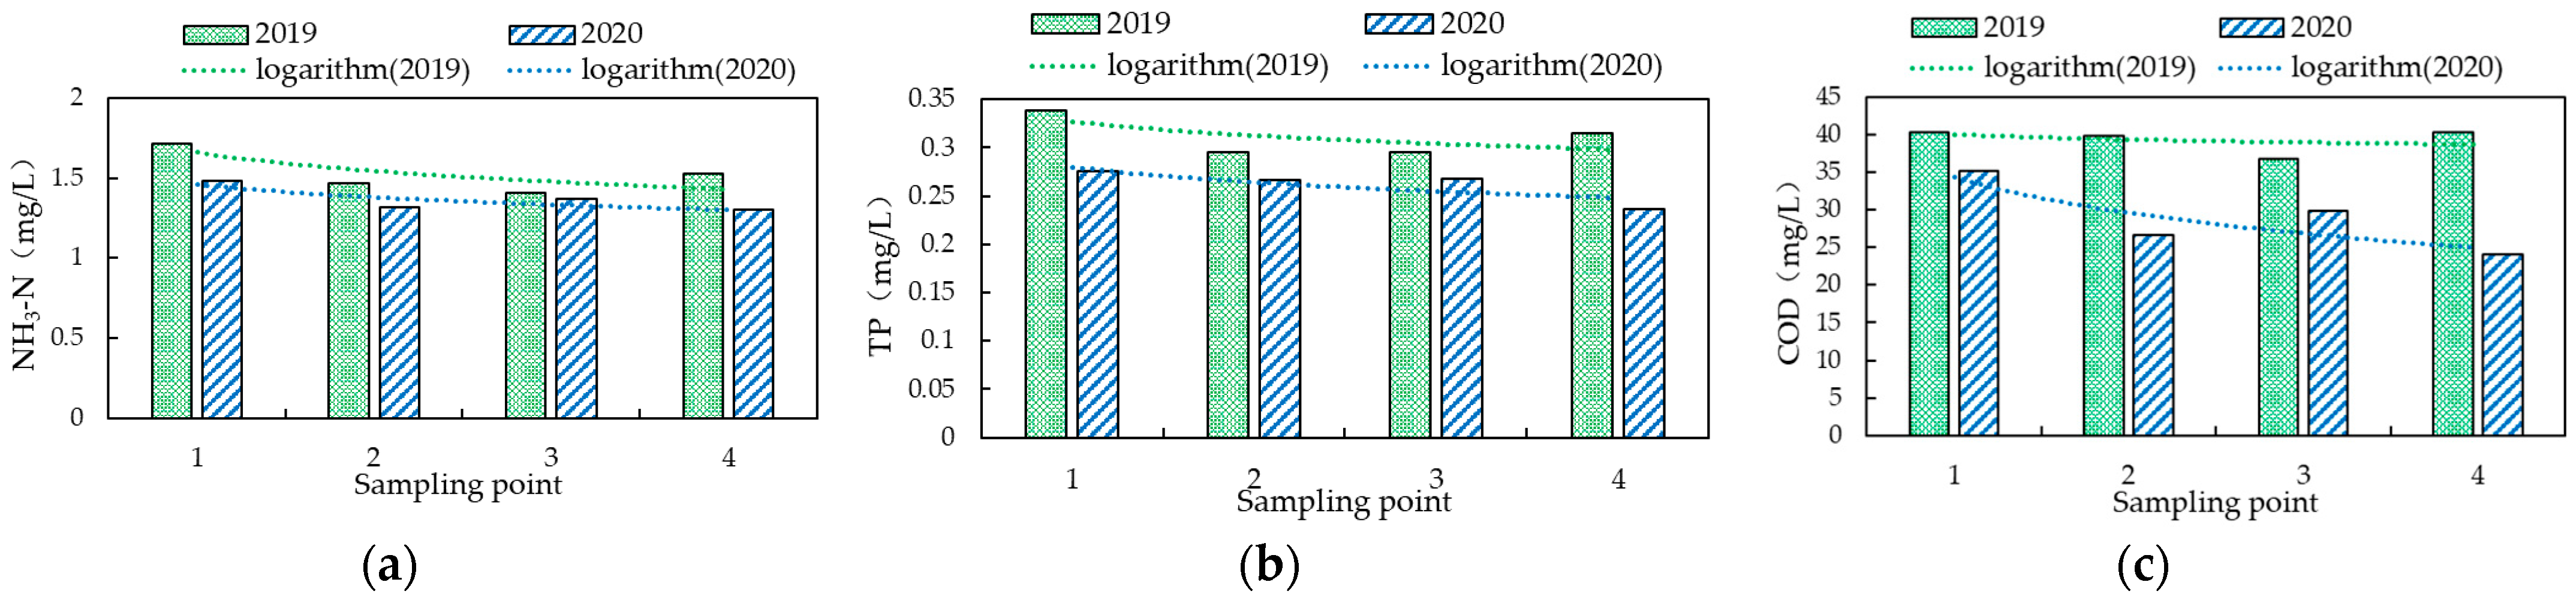
According to the water quality monitoring of the four sampling points in the 2019–2020 water special river channel water quality demonstration project and based on the analysis of water quality data, the changes in the water quality indicators of the research river section before and after the ecological floating bed arrangement were compared as shown in Figure 4. The average water quality test results of each sampling point in 2019 and 2020 showed that the concentrations of NH3-N, TP, and COD at each sampling point from inflow to outflow showed an overall decreasing trend, which was in line with the logarithmic decay model. In 2019, the NH3-N concentration range of each sampling point was 1.40–1.71 mg/L, and the average concentration was 1.53 mg/L; in 2020, the NH3-N concentration range of each sampling point was 1.30–1.48 mg/L, and the average concentration was 1.37 mg/L. In 2019, the TP concentration range of each sampling point was 0.29–0.34 mg/L, and the average concentration was 0.31 mg/L; in 2020, the TP concentration range of each sampling point was 0.24–0.28 mg/L, and the average concentration was 0.26 mg/L. In 2019, the COD concentration range of each sampling point was 36.71–40.25 mg/L, and the average concentration was 39.24 mg/L; in 2020, the COD concentration range of each sampling point was 24.08–35.17 mg/L, and the average concentration was 28.92 mg/L. The water quality concentration in 2020 was generally lower than that in 2019. In 2020, each indicator had the largest decline at the four sampling points, and the average concentrations of NH3-N, TP, and COD at the 1–4 sampling points in 2020 decreased to 10.4%, 15.7%, and 26.3%. Plant planting and artificial aquatic plants in ecological floating beds can improve water quality to some extent Numerical simulation based on the measured water quality data in the study area can further improve the water environment of this section.
3.2. Analysis of Water Quality Calibration Results
Table 4 shows the statistical analysis between the measured and simulated sampling points of NH3-N, TP, and COD in the parameter calibration and model validation stages. The variation range of RMSE was 0.12~0.22 mg/L, 0.00~0.02 mg/L, and 0.37~1.24 mg/L, the variation range of MAE was −0.12~0.14 mg/L, −0.01~0.00 mg/L, and −0.29~1.02 mg/L, the variation range of d was 0.97~0.99, 0.93~0.99, and 0.94~0.99, the variation range of NSE was 0.89~0.97, 0.63~0.99, and 0.60~0.98, and the model parameter calibration accuracy was high.
Table 4 shows that during the model validation process, the RMSE changes in NH3-N, TP, and COD at each sampling point ranged from 0.09 to 0.17 mg/L, 0.01 to 0.02 mg/L, and 1.24 to 2.42 mg/L, respectively. The ranges were −0.14~−0.07 mg/L, −0.01~0.00 mg/L, and −2.16~−0.66 mg/L, the d changes are 0.90~0.99, 0.82~0.99, and 0.94~0.99, respectively, and the NSE changes are 0.35~0.96, 0.39~0.98, and 0.79~0.98. The model verification results of NH3-N, TP, and COD at each sampling point showed superior agreement between the measured and simulated values.
Figure 5 shows the simulated and measured values of NH3-N, TP, and COD at sampling point 4 (the outlet of the research river reach) in the model parameter calibration stage ((a)–(c)) and verification stage ((d)–(f)). comparison of values. Figure 5 shows that the simulated trends of the three water quality indicators were consistent with the measured values, and the change trends of the water quality indicators at the outlet are consistent with the change trends of the discharge concentration of the upstream Wuqing No. 7 Sewage Treatment Plant. The fitting effect of the model validation stage in September was better than that in July. The reason was that the rainfall in autumn was low, and the study river section was less affected by other pollution sources. In summer, the rainfall was greater, and the nitrogen loss from fertilization in farmland was large. Flushing into the river, some of the measured values will be slightly higher than the simulated values, but the overall trend remains unchanged, and the simulation effect is superior.
3.3. Scenario
3.3.1. Research on the Formulation of an Ecological Floating Bed Combination Scheme in the River Reach
Due to factors such as large sewage discharges and high water temperatures in July, the water quality of the river is more serious. To explore a better water purification effect in this season, a validated model was used to simulate the purification of river water by the ecological floating bed under different plant ratios in July 2020. According to the purification effect of different aquatic plants on various water quality indicators, the percentage of the original ecological floating bed in the river was not changed. Three scenarios were set up to simulate the purification effects of different ecological floating bed combinations on water quality indicators. The percentage of each plant in the river channel under different plant proportions and the attenuation coefficient of the ecological floating bed for each water quality index (Table 5) were obtained to evaluate the effect of different aquatic plant proportions on the water purification effect of the river channel.
3.3.2. Analysis of the Water Quality Improvement Effect under Different Ecological Floating Bed Combinations
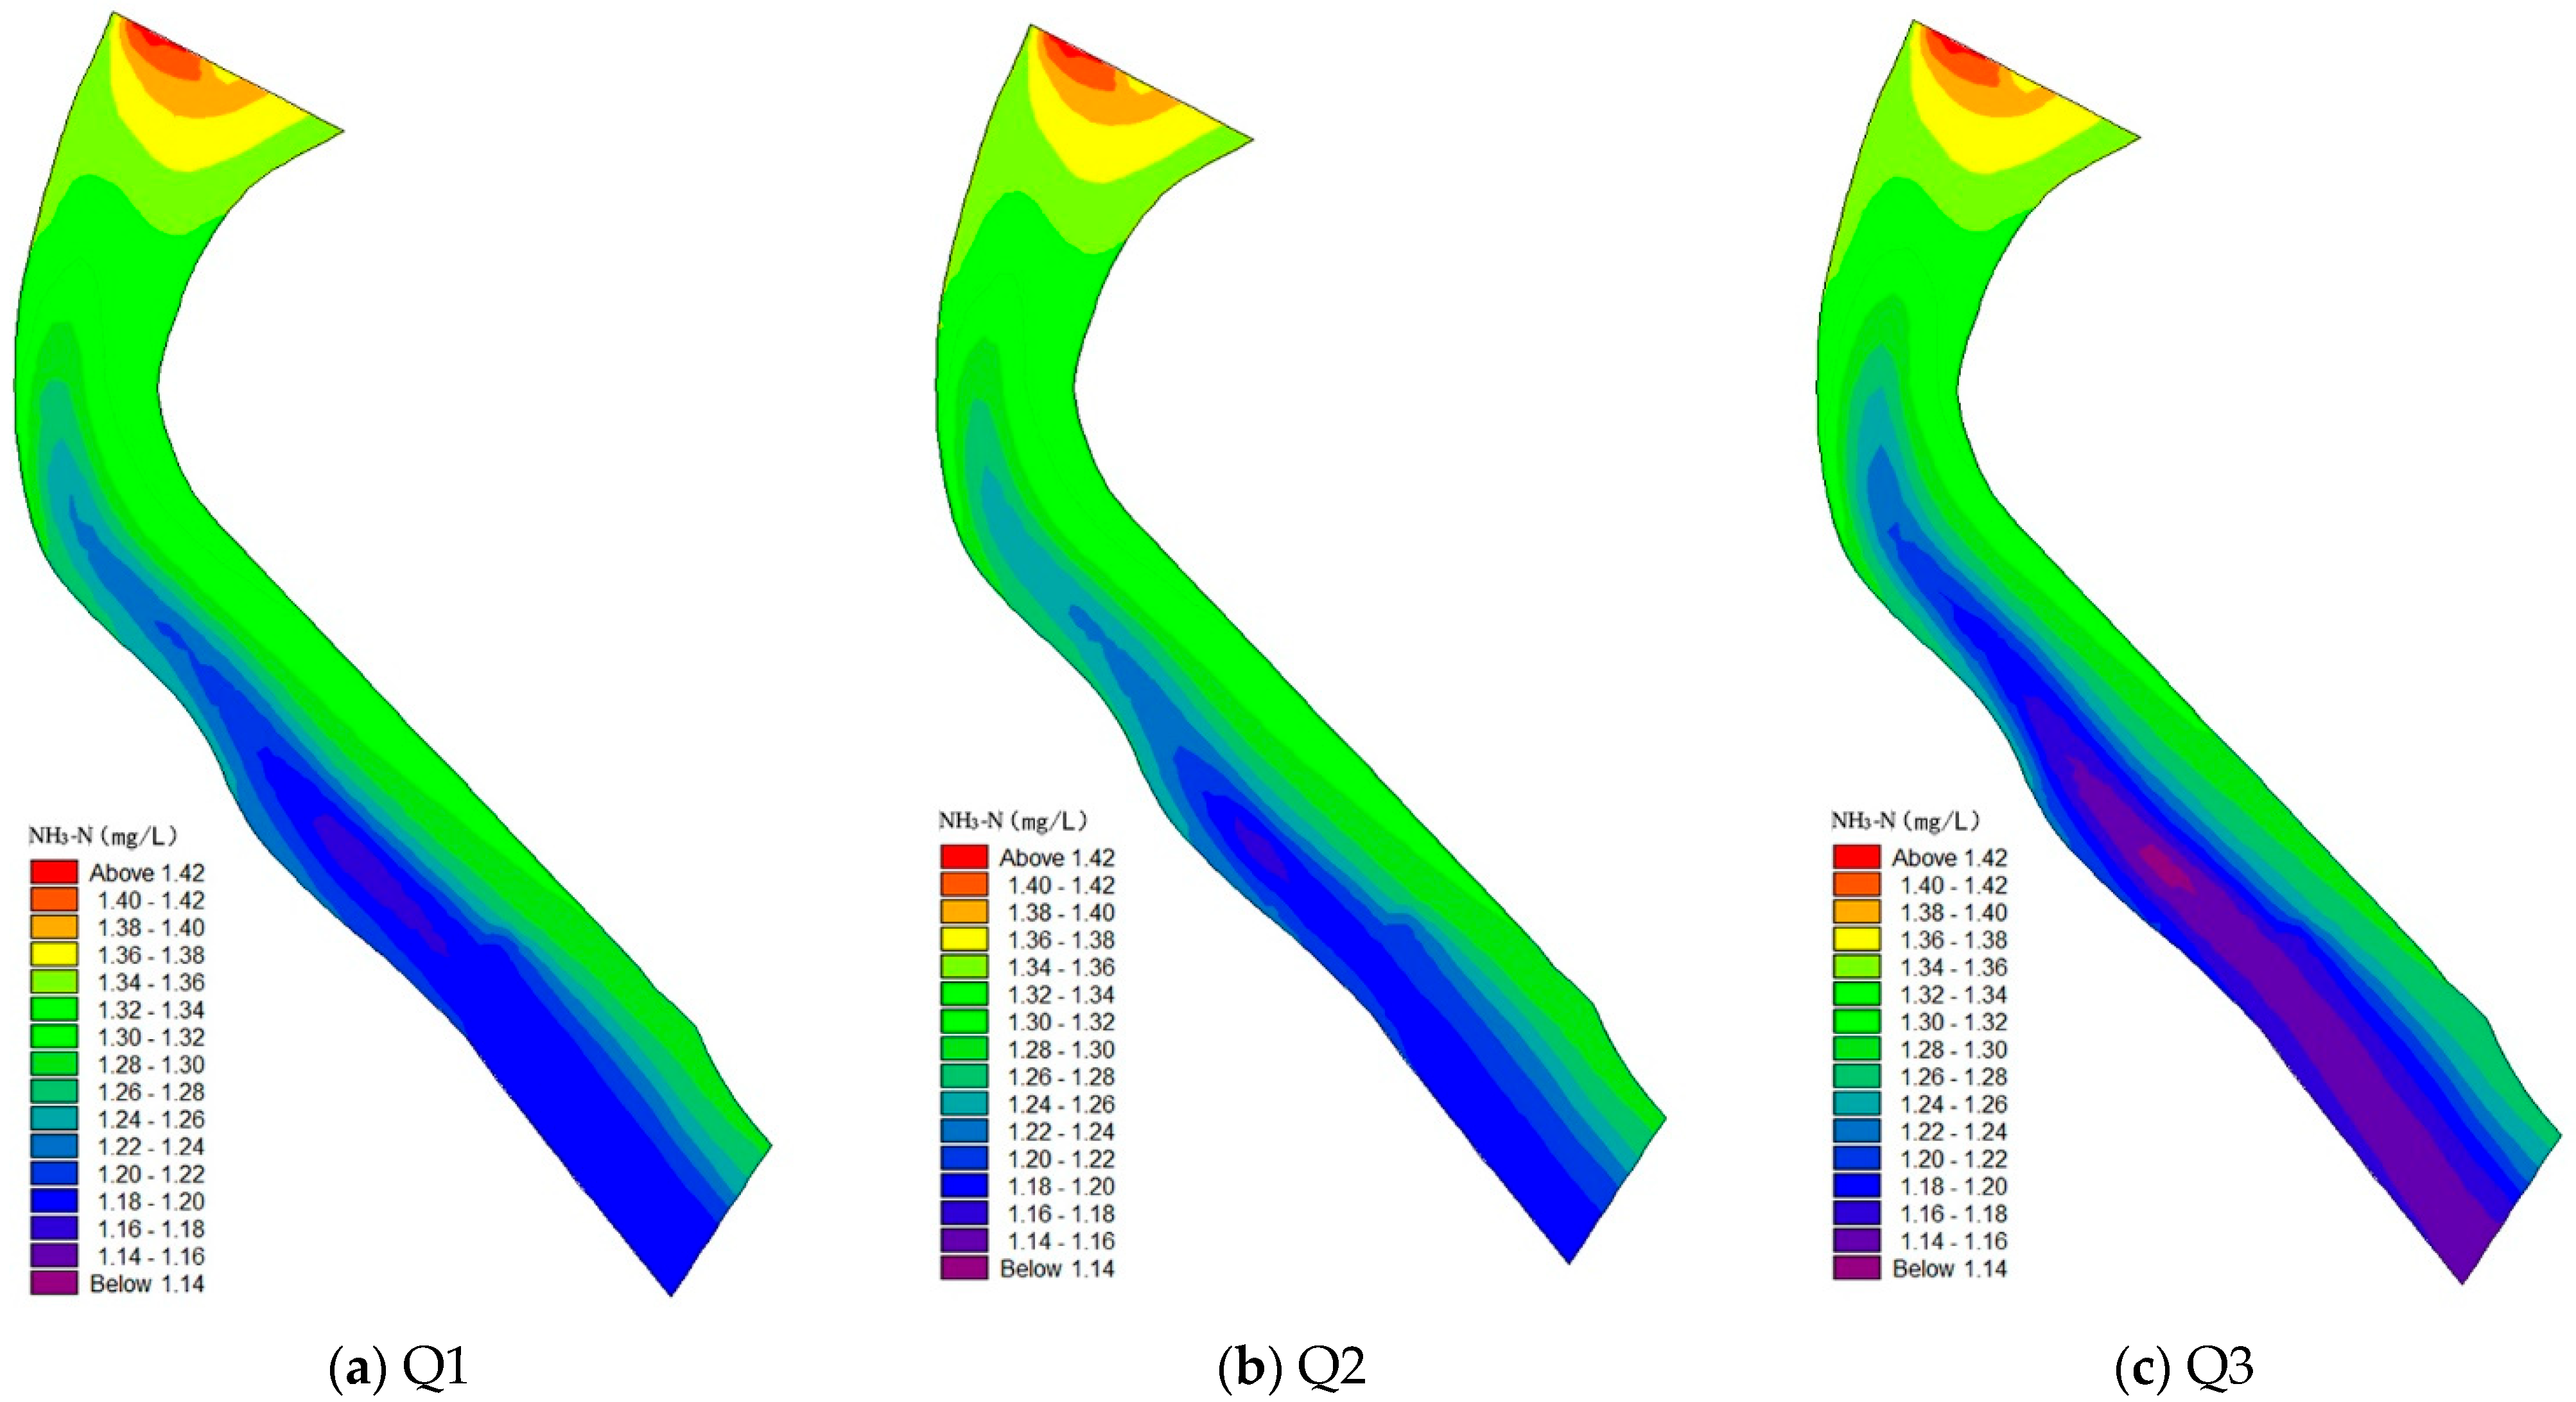
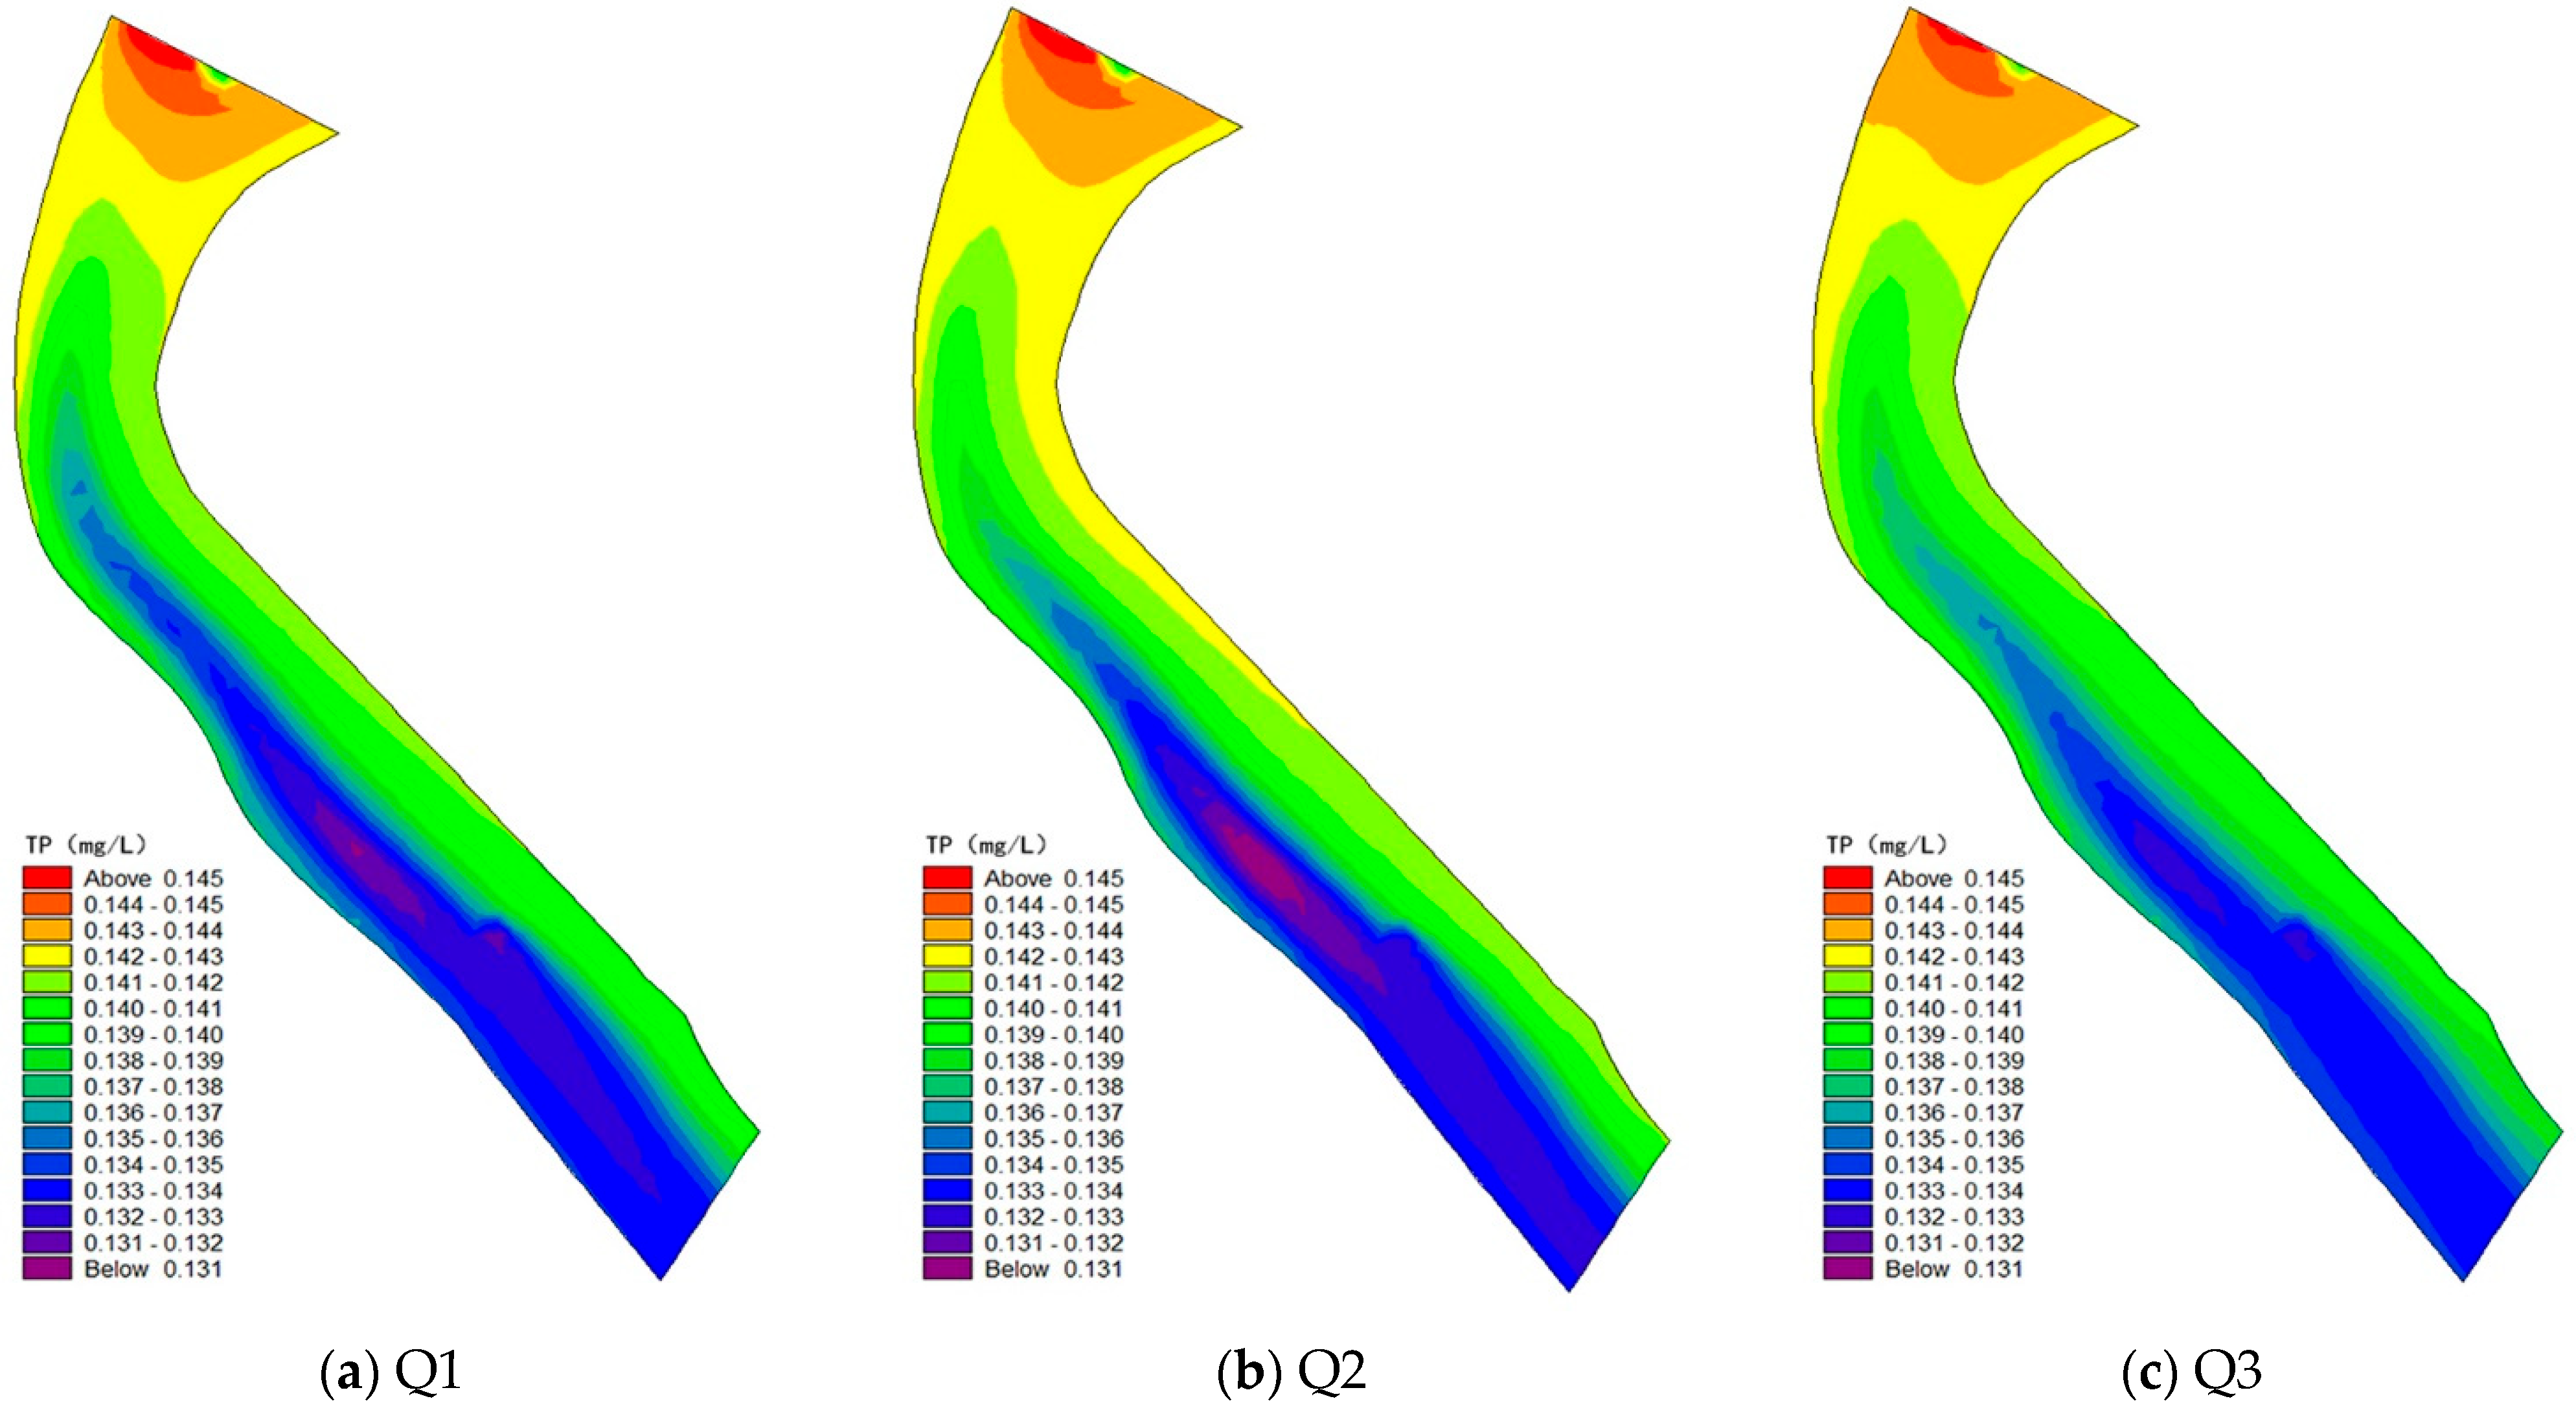
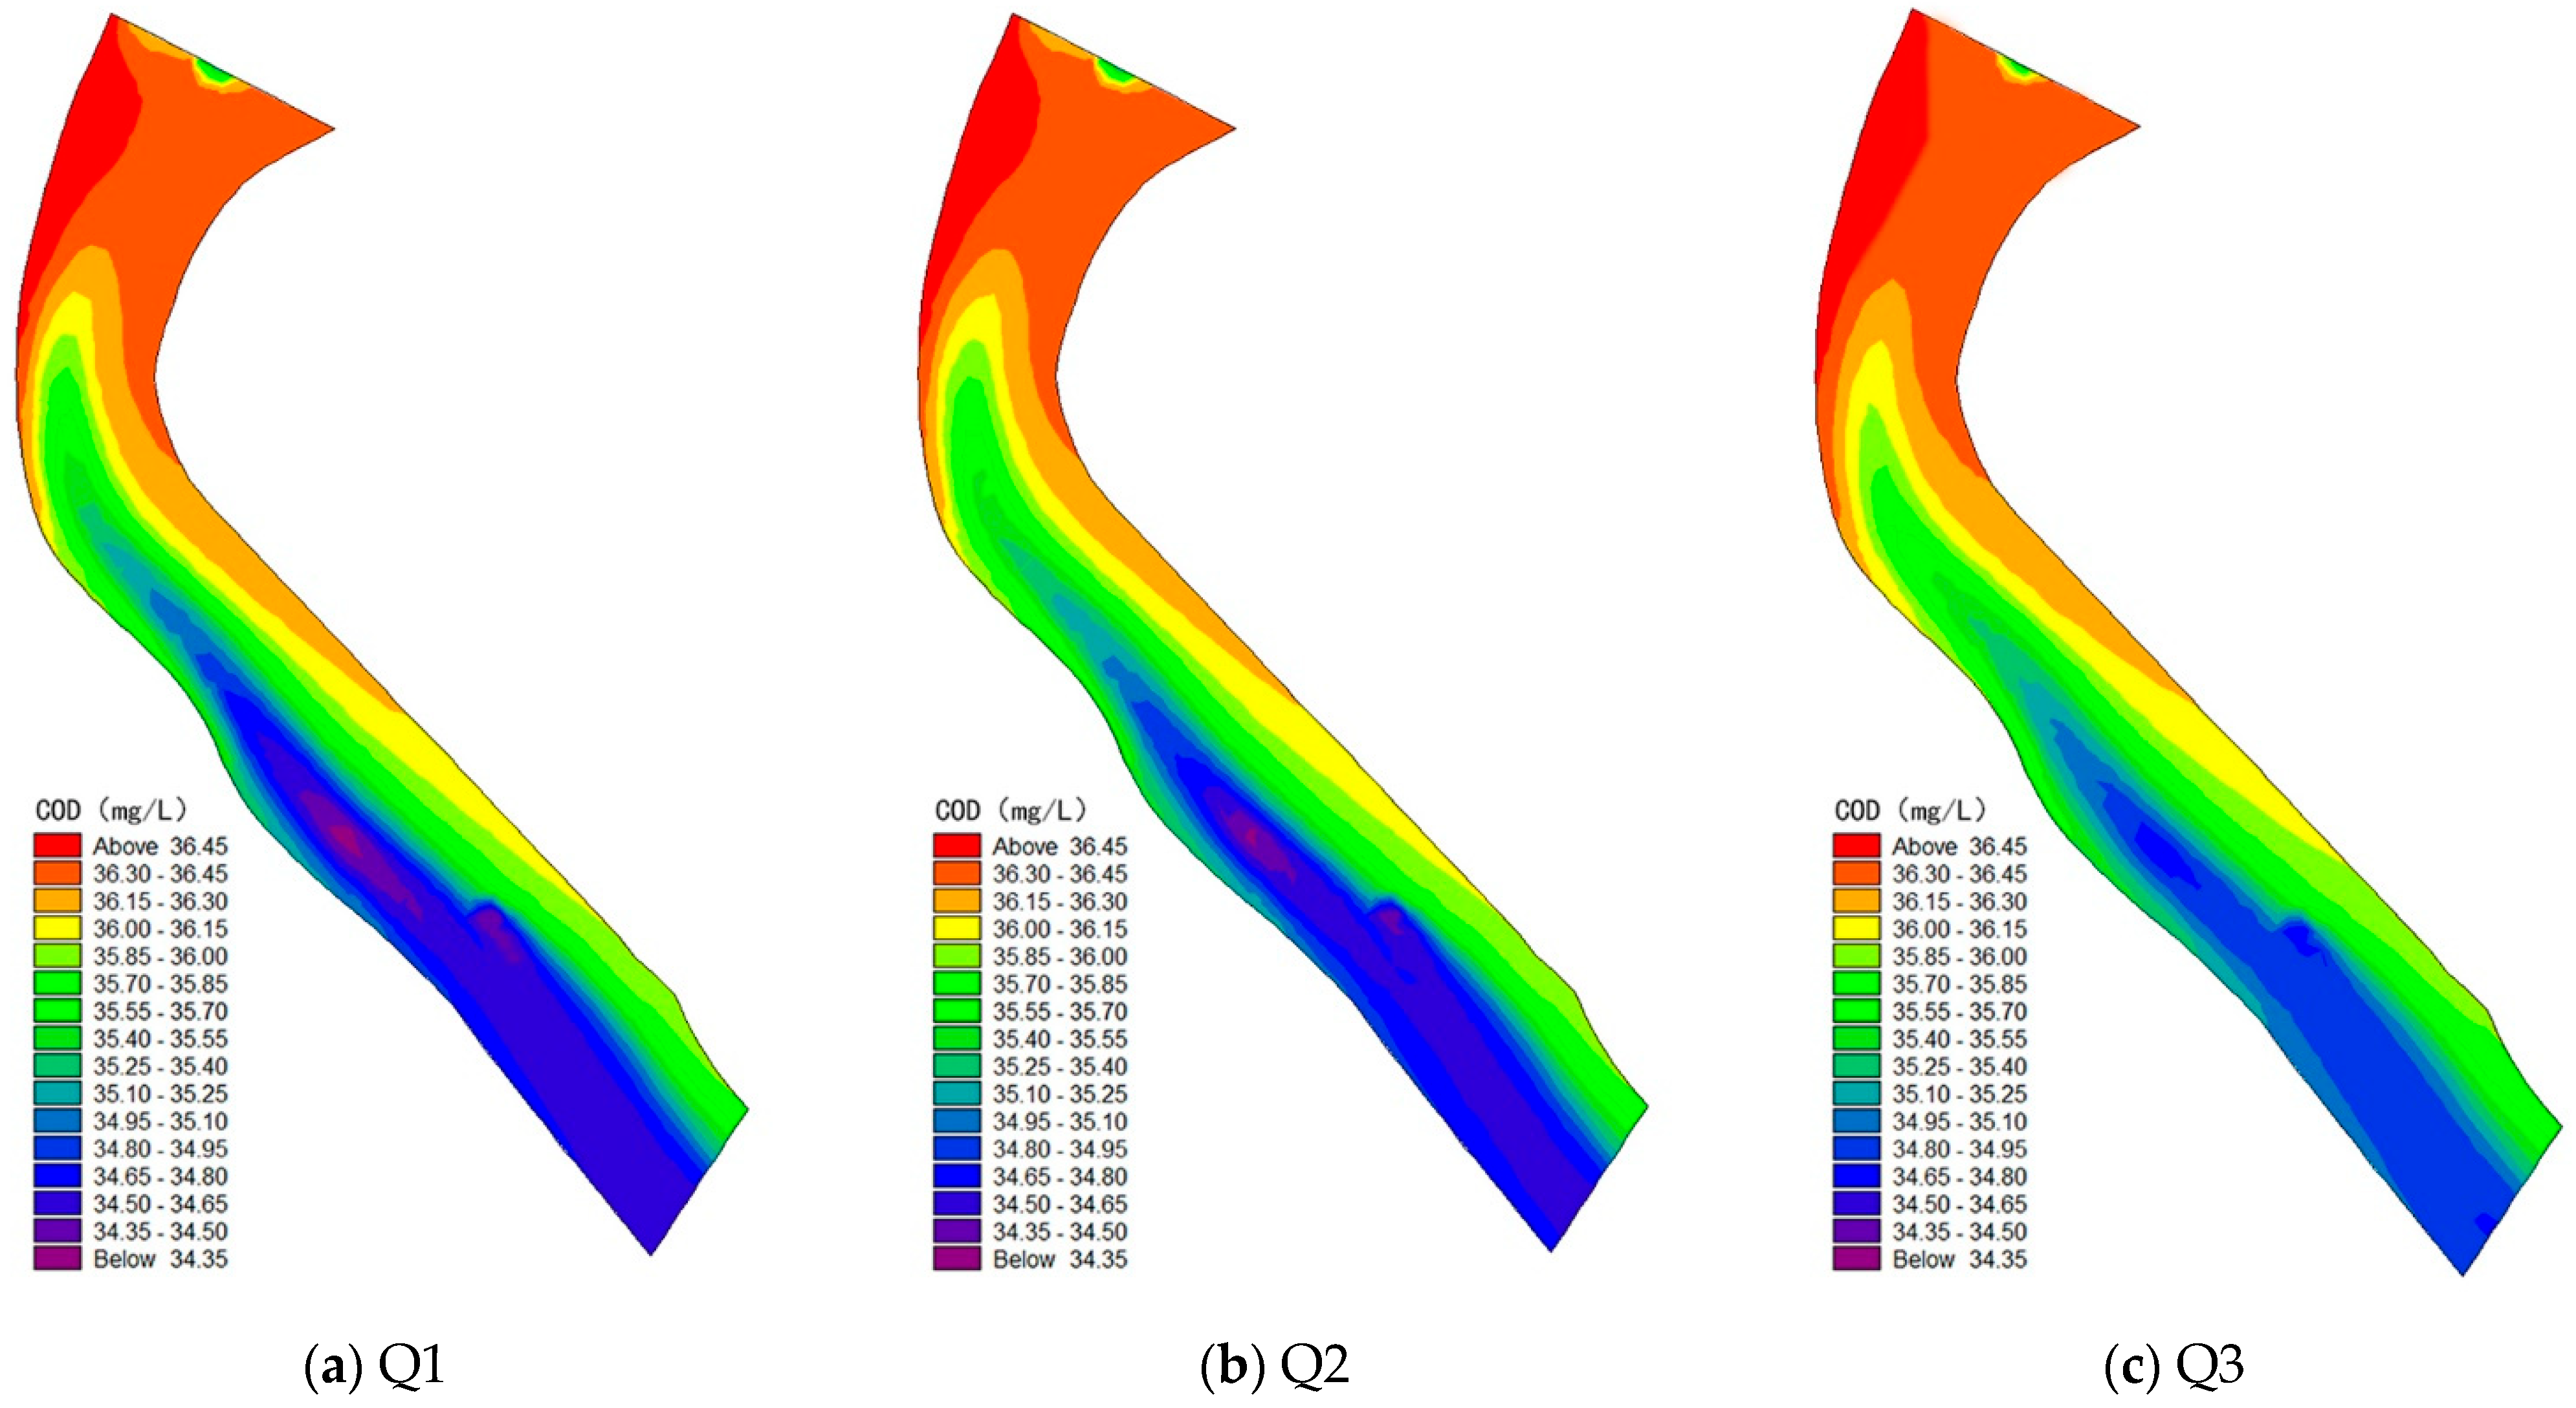
Figure 6, Figure 7 and Figure 8 show the spatial distribution changes in NH3-N, TP, and COD under different ecological floating bed aquatic plant ratios. From Figure 6a–c, it can be seen from the overall distribution of the river channel that the NH3-N concentration of Q3 in the floating bed combination area and the middle and lower reaches of the river channel is lower than that of Q1 and Q2, and the NH3-N concentration of the left bank was also higher than that of Q2. It was obviously lower. From the effect of the NH3-N concentration distribution, the size was Q3 < Q1 < Q2. Figure 7a–c shows that the TP concentration at the outlet simulated by the three scenarios is approximately 0.135 mg/L, but it can be seen from the three areas of the ecological floating bed combination that Q2 will be lower than that of Q1 and Q3. The simulated TP concentrations did not differ much. Figure 8a–c shows that Q1 has a better COD removal effect than Q2 and Q3, but the overall difference is not as obvious as that of NH3-N.
Considering that the concentrations of TP and COD in the sewage discharge in this season did not exceed the standard of Class V water, the concentration of NH3-N partially exceeded 2 mg/L in early July. Therefore, when choosing the optimal plan, the removal effect of the plant floating bed on NH3-N was mainly considered, and the optimal scenario simulation plan is Q3. Therefore, without changing the coverage of the original ecological floating bed and the running volume ratio of artificial aquatic plants, the optimal plant ratio of the ecological floating bed in this area was 700 m2 of Scirpus validus Vahl and 700 m2 of Canna in zone 1 of the floating bed combination, 430 m2 of Scirpus validus Vahl and 170 m2 of Iris in zone 2 of the floating bed combination, 200 m2 of Iris and 200 m2 of Lythrum salicaria in zone 3 of floating bed combination.
4. Discussion
In this study, the hydrodynamic water quality model was used to construct the water quality model of the demonstration section of the North Canal. The model was based on the action mechanism of the ecological floating bed combination on water quality and considered the removal effects of different plants on NH3-N, TP, and COD. According to the spatial distribution of the actual river ecological floating bed, the water ecological floating bed combination area was set. The biochemical reactions of different floating bed combinations in the water were simulated, and the changes in the water quality of the river were calculated. The urban section of the river is easily affected by the discharge of industrial, agricultural, and domestic sewage and is often overwhelmed by taking into account the role of the landscape and maintaining ecological self-purification. Deploying ecological floating beds in polluted rivers has become an important means to maintain the ecological environment of rivers. The model simulated the changes in water quality of the river under different artificial ecological floating beds and accurately simulates the purification effects of the ecological floating beds under different plant ratios. It can reflect the dynamic changes in river water quality under the change in river plant configuration. The model results can be used to comprehensively evaluate the ecological restoration scheme and water purification under the combination of individual aquatic plants and an ecological floating bed. The model method has been applied in the model construction and simulation of the demonstration section of the North Canal. The model simulated the water quality changes after the ecological floating bed layout of urban rivers and can improve the ecological floating bed layout plan under different plant ratios.
The study showed that the average concentrations of NH3-N, TP, and COD decreased by 10.4%, 15.7%, and 26.3%, respectively, after the ecological floating bed was arranged. The simulation results of the model scenario can quantify the purification effect of the river from the layout of the ecological floating bed, which provides a strong basis for the study of ecological floating beds with different plant configuration types in different regions of the river. The model results showed that, without changing the status quo of the river, the water quality of the river has been effectively improved under different scenarios. By considering the removal effect of water quality indicators with more serious river pollution, the selection of the scheme was comprehensively considered, and the model results can provide a scheme for water purification of river courses with different pollutant characteristics. Through the example of hydrodynamic water quality simulation calculations in the urban section of the North Canal, the model method in this study was reasonably designed, and the calculation results were credible. It is a tool to study the purification function of river ecological floating beds on water quality and, at the same time, provide scientific support for the optimal design of complex river ecological restoration programs. This study provides model parameters and a theoretical basis for the water purification of northern rivers by taking the North Canal as an example. The optimal scheme was selected through model calculation, which saves the manpower, material, and financial resources of the preliminary test for other similar projects. Additionally, in the formulation stage of the ecological floating bed combination, in the future, it can be considered by changing the area of the ecological floating bed layout, comprehensively considering the engineering quantity, project cost, and other factors, and formulating the ecological floating bed combination plan based on the principles of economy, safety, and efficiency.
5. Conclusions
(1) Before and after the construction of the ecological floating bed in the demonstration section of the Wuqing urban area of the North Canal, the concentrations of NH3-N, TP, and COD at each sampling point from the inflow to the outflow showed a logarithmic decay mode. After the ecological floating bed was arranged, the concentrations of ammonia nitrogen, total phosphorus, and COD decreased by 10.4%, 15.7%, and 26.3%, respectively. The special water results provide a strong basis for numerical simulation research.
(2) Based on the degradation effects of different aquatic plants on various water quality indicators, a hydrodynamic-water quality model was constructed to simulate the water quality evolution of the Wuqing urban section of the North Canal Basin, Tianjin, after the construction of the ecological floating bed. The relevant parameters were calibrated and verified in the water quality calculation. The RMSE ranges of NH3-N, TP and COD were 0.09~0.22 mg/L, 0.00~0.02 mg/L, and 0.37~2.42 mg/L, respectively. Other statistical indicators are also within a reasonable range, and the model accuracy and reliability are high.
(3) On the premise that the percentage of the river channel in each floating bed combination area remains unchanged, three different ecological floating bed combination schemes are set up. The simulation results showed that the optimal plant ratio of the ecological floating bed in the study area was 700 m2 of Scirpus validus Vahl and 700 m2 of Canna in zone 1 of the floating bed combination, 430 m2 of Scirpus validus Vahl and 170 m2 of Iris in zone 2 of the floating bed combination, and 200 m2 of Iris and 200 m2 of Lythrum salicaria in zone 3 of the floating bed combination. This best solution can be applied to the construction of the North Canal in the future to realize the sustainable development of the ecological environment of the North Canal.
Author Contributions
Conceptualization, P.Y. and L.Q.; methodology, S.L.; software, P.Y. and L.Q.; validation, L.Q. and S.L.; formal analysis, L.Q. and D.L.; investigation, H.M. and L.Q.; resources, P.Y. and L.Q.; data curation, S.L.; writing—original draft preparation, L.Q.; writing—review and editing, L.Q. and P.Y.; visualization, L.Q. and H.M.; supervision, P.Y. and J.L.; project administration, P.Y., J.L. and S.L.; funding acquisition, P.Y. and S.L. All authors have read and agreed to the published version of the manuscript.
Funding
This research was funded by Scientific Research Program of Tianjin Education Commission, grant number 2019KJ038.
Institutional Review Board Statement
Not applicable.
Informed Consent Statement
Informed consent was obtained from all subjects involved in the study.
Data Availability Statement
Not applicable.
Conflicts of Interest
The authors declare that there is no conflict of interests regarding the publication of this paper. Data availability statement All data included in this study are available upon request by contact with the corresponding author.
References
- Cao, Y.; Sun, J.K.; Li, T. The Water Recycling Mode Based on Urban Tail Water Deep Purification and Ecological Restoration of Wetlands. J. Water Conserv. 2015, 29, 307–310. [Google Scholar] [CrossRef]
- Md Anawar, H.; Chowdhury, R. Remediation of Polluted River Water by Biological, Chemical, Ecological and Engineering Processes. Sustainability 2020, 12, 7017. [Google Scholar] [CrossRef]
- Yan, Z.; Song, B.; Li, Z. Effects of Submerged Plants on the Growth of Eutrophic Algae and Nutrient Removal in Constructed Wetlands. Open Access Libr. J. 2016, 3, 1–11. [Google Scholar] [CrossRef]
- Wei, X.D.; Yang, J.; Luo, P.P. Assessment of the variation and influencing factors of vegetation NPP and carbon sink capacity under different natural conditions. Ecol. Indic. 2022, 138, 108834. [Google Scholar] [CrossRef]
- Li, S.S.; Tian, K.; Liu, Y.G.; Zhou, Y.H.; Yang, H.M. Compare the purification effects of sewage by the wetland plant community composition and spatial patterns. J. Ecol. Environ. 2010, 19, 1951–1955. [Google Scholar] [CrossRef]
- Xia, Y.; Dou, P.; Lou, C.H.; Wang, C.; Li, Q.J. Simulation study on the effect of water quality improvement of landscape water body under different vegetation coverage scenarios. J. Environ. Sci. 2022, 42, 248–258. [Google Scholar] [CrossRef]
- Rao, L.; Wang, P.F.; Lei, Y. Coupling of the flow field and the purification efficiency in root system region of ecological floating bed under different hydrodynamic conditions. Res. Prog. Hydrodyn. Engl. Ed. 2016, 28, 1049–1057. [Google Scholar] [CrossRef]
- Zheng, L.; Wang, H. The Effect of Combined Ecological Floating Bed for Eutrophic Lake Remediation. In American Institute of Physics Conference Series; AIP Publishing LLC: Melville, NY, USA, 2017; p. 020058. [Google Scholar]
- Zhang, Q.; Achal, V.; Xu, Y. Aquaculture wastewater quality improvement by water spinach (Ipomoea aquatica Forsskal) floating bed and ecological benefit assessment in ecological agriculture district. Aquac. Eng. 2014, 60, 48–55. [Google Scholar] [CrossRef]
- Zhang, Y.H.; Gao, X.H. The Purification Mechanism and Application of Aquatic Plants in Water Pollution Control. China Compr. Util. Resour. 2020, 38, 199–201. [Google Scholar]
- Li, P.W.; Yang, G.M.; Chen, Z.; Sun, R.G. Effect Analysis of Plants in Water Purification in Stereo-ecological Floating Bed. Guangzhou Chem. Ind. 2016, 44, 129–130. [Google Scholar]
- Shen, W.; Huang, X.Q.; Luo, X.; Zhou, K.X.; Ling, H.; Xie, B.W. Comparative Study of Purification Capacity in Aquaculture Water between Lythrum salicaria and Eichhornia crassipes. J. Neijiang Norm. Univ. 2017, 32, 77–81. [Google Scholar] [CrossRef]
- Ji, F.; Zhang, Y.J.; Wang, F.; Peng, Q.Z.; Hua, W.F.; Chen, X.J. Research on the annual changes of nitrogen removal efficiency in a combined ecological floating bed system. J. Shanghai Ocean. Univ. 2017, 26, 235–242. [Google Scholar]
- Bai, X.M.; He, L.S.; Li, B.C.; Meng, R.; Meng, F.L.; Huang, C.H.; Dong, J.; Li, G. Application of Combined Aquatic Plants to Control Eutrophic Water in Baiyangdian Lake. Wetl. Sci. 2013, 11, 495–498. [Google Scholar] [CrossRef]
- Du, Y.L.; Zhang, S.H.; Wang, L.J.; Mao, Z.P.; Ma, X.Y. Numerical simulation of water purification effects of aquatic plant in artificial surface flow wetland. J. Hydraul. Eng. 2020, 51, 675–684. [Google Scholar] [CrossRef]
- Luo, P.; Liu, L.; Wang, S.; Ren, B.; He, B.; Nover, D. Influence assessment of new Inner Tube Porous Brick with absorbent concrete on urban floods control. Case Stud. Constr. Mater. 2022, 17, e01236. [Google Scholar] [CrossRef]
- Wang, S.; Cao, Z.; Luo, P.; Zhu, W. Spatiotemporal Variations and Climatological Trends in Precipitation Indices in Shaanxi Province, China. Atmosphere 2022, 13, 744. [Google Scholar] [CrossRef]
- Zhu, W.; Zha, X.; Luo, P.; Wang, S.; Cao, Z.; Lyu, J.; Zhou, M.; He, B.; Nover, D. A quantitative analysis of research trends in flood hazard assessment. Stoch. Environ. Res. Risk Assess. 2022, in press. [Google Scholar] [CrossRef]
- Rotiroti, M.; Bonomi, T.; Fumagalli, L.; Azzoni, A.; Pisaroni, B.; Demicheli, G. Methodological approach in the analysis of Arsenic, Iron and Manganese contamination phenomena in shallow aquifer, the case of the Cremona area. Eng. Hydro Environ. Geol. 2012, 15, 117–128. [Google Scholar]
- Cuiuli, E. Remarks on the hydrogeological setting of S. Eufemia Lamezia Plain through the developement of the top surface of the intermediate confined aquifer. Acq. Sotter.-Ital. J. Groundwat. 2015, 4, 45–52. [Google Scholar]
- Maringo, R.; Torretta, M. Stochastic modeling of radon gas distribution in the unsaturated as a function of groudwater depth. In Proceedings of the XXXVI Convegno Nazionale di Radioprotezione (AIRP), Palermo, Italy, 18–20 September 2013; ISBN 978-88-88648-38-5. [Google Scholar]
- Jing, Y.W.; Hu, X.L.; Xu, Z.L.; Liu, H.C. Research and Demonstration of Water Remediation Using Biological Floating Bed Technology. Beijing Water 2003, 6, 20–22. [Google Scholar] [CrossRef]
- Lu, J.D.; Chen, H.B.; Zhao, L.Y.; Li, Z.H. Study on the growth characteristics of seven plants cultivated on artificial floating rafts in eutrophic water. Environ. Pollut. Control. Technol. Equip. 2006, 7, 58–61. [Google Scholar]
- Xiao, C.T.; Xiao, K.Y. Plants Purification & Ecological Restoration; Jiangsu Phoenix Science and Technology Press: Nanjing, China, 2017. [Google Scholar]
- Li, Y.J.; Du, Y.L.; Bi, E.P.; Wang, L. Chen, C.B. Simulation of Water Quality Response of Guishui River Wetland Plants and Water Diversion. Environ. Sci. 2020, 41, 4095–4104. [Google Scholar] [CrossRef]
- ISO Standard n. 13164-3; Water Quality—Radon-222—Part 3: Test Method Using Emanometry. ISO—International Organization for Standardization: Geneva, Switzerland, 2013.
- Mook, W.G.; Gat, J.R.; Meijer, H.A.; Różański, K.; Froehlich, K.J. Environmental Isotopes in the Hydrological Cycle, Principles and Applications, Volumes I, IV and V; Technical Documents in Hydrology No. 39; IAEA-UNESCO: Paris, France, 2001. [Google Scholar]
- Samal, K.; Kar, S.; Trivedi, S. Ecological floating bed (EFB) for decontamination of polluted water bodies: Design, mechanism and performance. J. Environ. Manag. 2019, 251, 109550. [Google Scholar] [CrossRef] [PubMed]
- Luo, P.; Luo, M.; Li, F.; Qi, X.; Huo, A.; Wang, Z.; He, B.; Takara, K.; Nover, D. Urban flood numerical simulation: Research, methods and future perspectives. Environ. Model. Softw. 2022, 156, 105478. [Google Scholar] [CrossRef]
- Chen, C.C. Simulation and Study on Hydrodynamic and Water Quality of Urban Rivers Based on MIKE21—Taking the Xi’an Moat as an Example; Xi’an University of Technology: Xi’an, China, 2020. [Google Scholar] [CrossRef]
- Li, T.Y.; Li, Z.H.; Huang, B.B. Simulation on water quantity and quality of Shahe Reservoir by MIKE21 model. J. Environ. Sci. 2021, 41, 293–300. [Google Scholar] [CrossRef]
- Rehanguli, Y.M.T. Simulation analysis of river water quality in river basin based on ECOLab. Groundwater 2020, 42, 64–66+95. [Google Scholar] [CrossRef]
- Luo, P.P.; Mu, Y.; Wang, S.T.; Zhu, W.; Mishra, B.K.; Huo, A.D.; Zhou, M.M. Exploring sustainable solutions for the water environment in Chinese and Southeast Asian cities. Ambio 2021, 51, 1199–1218. [Google Scholar] [CrossRef]
- Munazzam, J.S.; Razia, T.; Muhammad, S.; Shafaqat, A.; Samina, I.; Muhammad, A. Remediation of polluted river water by floating treatment wetlands. Water Supply 2019, 19, 967–977. [Google Scholar] [CrossRef]
- Swastik, G.; Nishan, P.; Susmita, P.; Tunisha, G.; Apekshya, K.; Bandita, M.; Michael, J.A.; Shukra, R.P. Assessment of technologies for water quality control of the Bagmati River in Kath-mandu valley, Nepal. Groundw. Sustain. Dev. 2022, 18, 100770. [Google Scholar] [CrossRef]
- Luo, P.; Xu, C.; Kang, S.; Huo, A.; Lyu, J.; Zhou, M.; Nover, D. Heavy metals in water and surface sediments of the Fenghe River Basin, China: Assessment and source analysis. Water Sci. Technol. 2021, 84, 3072–3090. [Google Scholar] [CrossRef]
- Luo, P.; Zheng, Y.; Wang, Y.; Zhang, S.; Yu, W.; Zhu, X.; Huo, A.; Wang, Z.; He, B.; Nover, D. Comparative Assessment of Sponge City Constructing in Public Awareness, Xi’an, China. Sustainability 2022, 14, 11653. [Google Scholar] [CrossRef]
- Zhou, H.Y.; Liu, C. Two-dimensional water quality model based on MIKE 21 for Miyun reservoir. Beijing Water. 2017, 5, 15–18. [Google Scholar] [CrossRef]
- McCuen, R.H.; Knight, Z.; Cutter, A.G. Evaluation of the Nash–Sutcliffe efficiency index. J. Hydrol. Eng. 2006, 11, 597–602. [Google Scholar] [CrossRef]
- Nash, J.E.; Sutcliffe, J.V. River flow forecasting through conceptual models.Part 1:a discussion of principles. J. Hydrol. 1970, 10, 282–290. [Google Scholar] [CrossRef]
- Khodaverdiloo, H.; Homaee, M.; van Genuchten, M.T.; Dashtaki, S.G. Deriving and validating pedotransfer functions for some calcareous soils. J. Hydrol. 2011, 399, 93–99. [Google Scholar] [CrossRef]
Figure 1.
Study on the distribution and monitoring points of ecological floating beds in the river reach.
Figure 1.
Study on the distribution and monitoring points of ecological floating beds in the river reach.

Figure 2.
Onsite situation of the research.

Figure 3.
Topographic map of the channel grid.

Figure 4.
(a) NH3-N, (b) TP, (c) COD before and after the addition of ecological floating beds in 2019 and 2020 indicator changes.
Figure 4.
(a) NH3-N, (b) TP, (c) COD before and after the addition of ecological floating beds in 2019 and 2020 indicator changes.

Figure 5.
Parameter calibration (a–c) and model verification stage (d–f). Comparison of measured and simulated values of water quality indicators at the outlet.
Figure 5.
Parameter calibration (a–c) and model verification stage (d–f). Comparison of measured and simulated values of water quality indicators at the outlet.
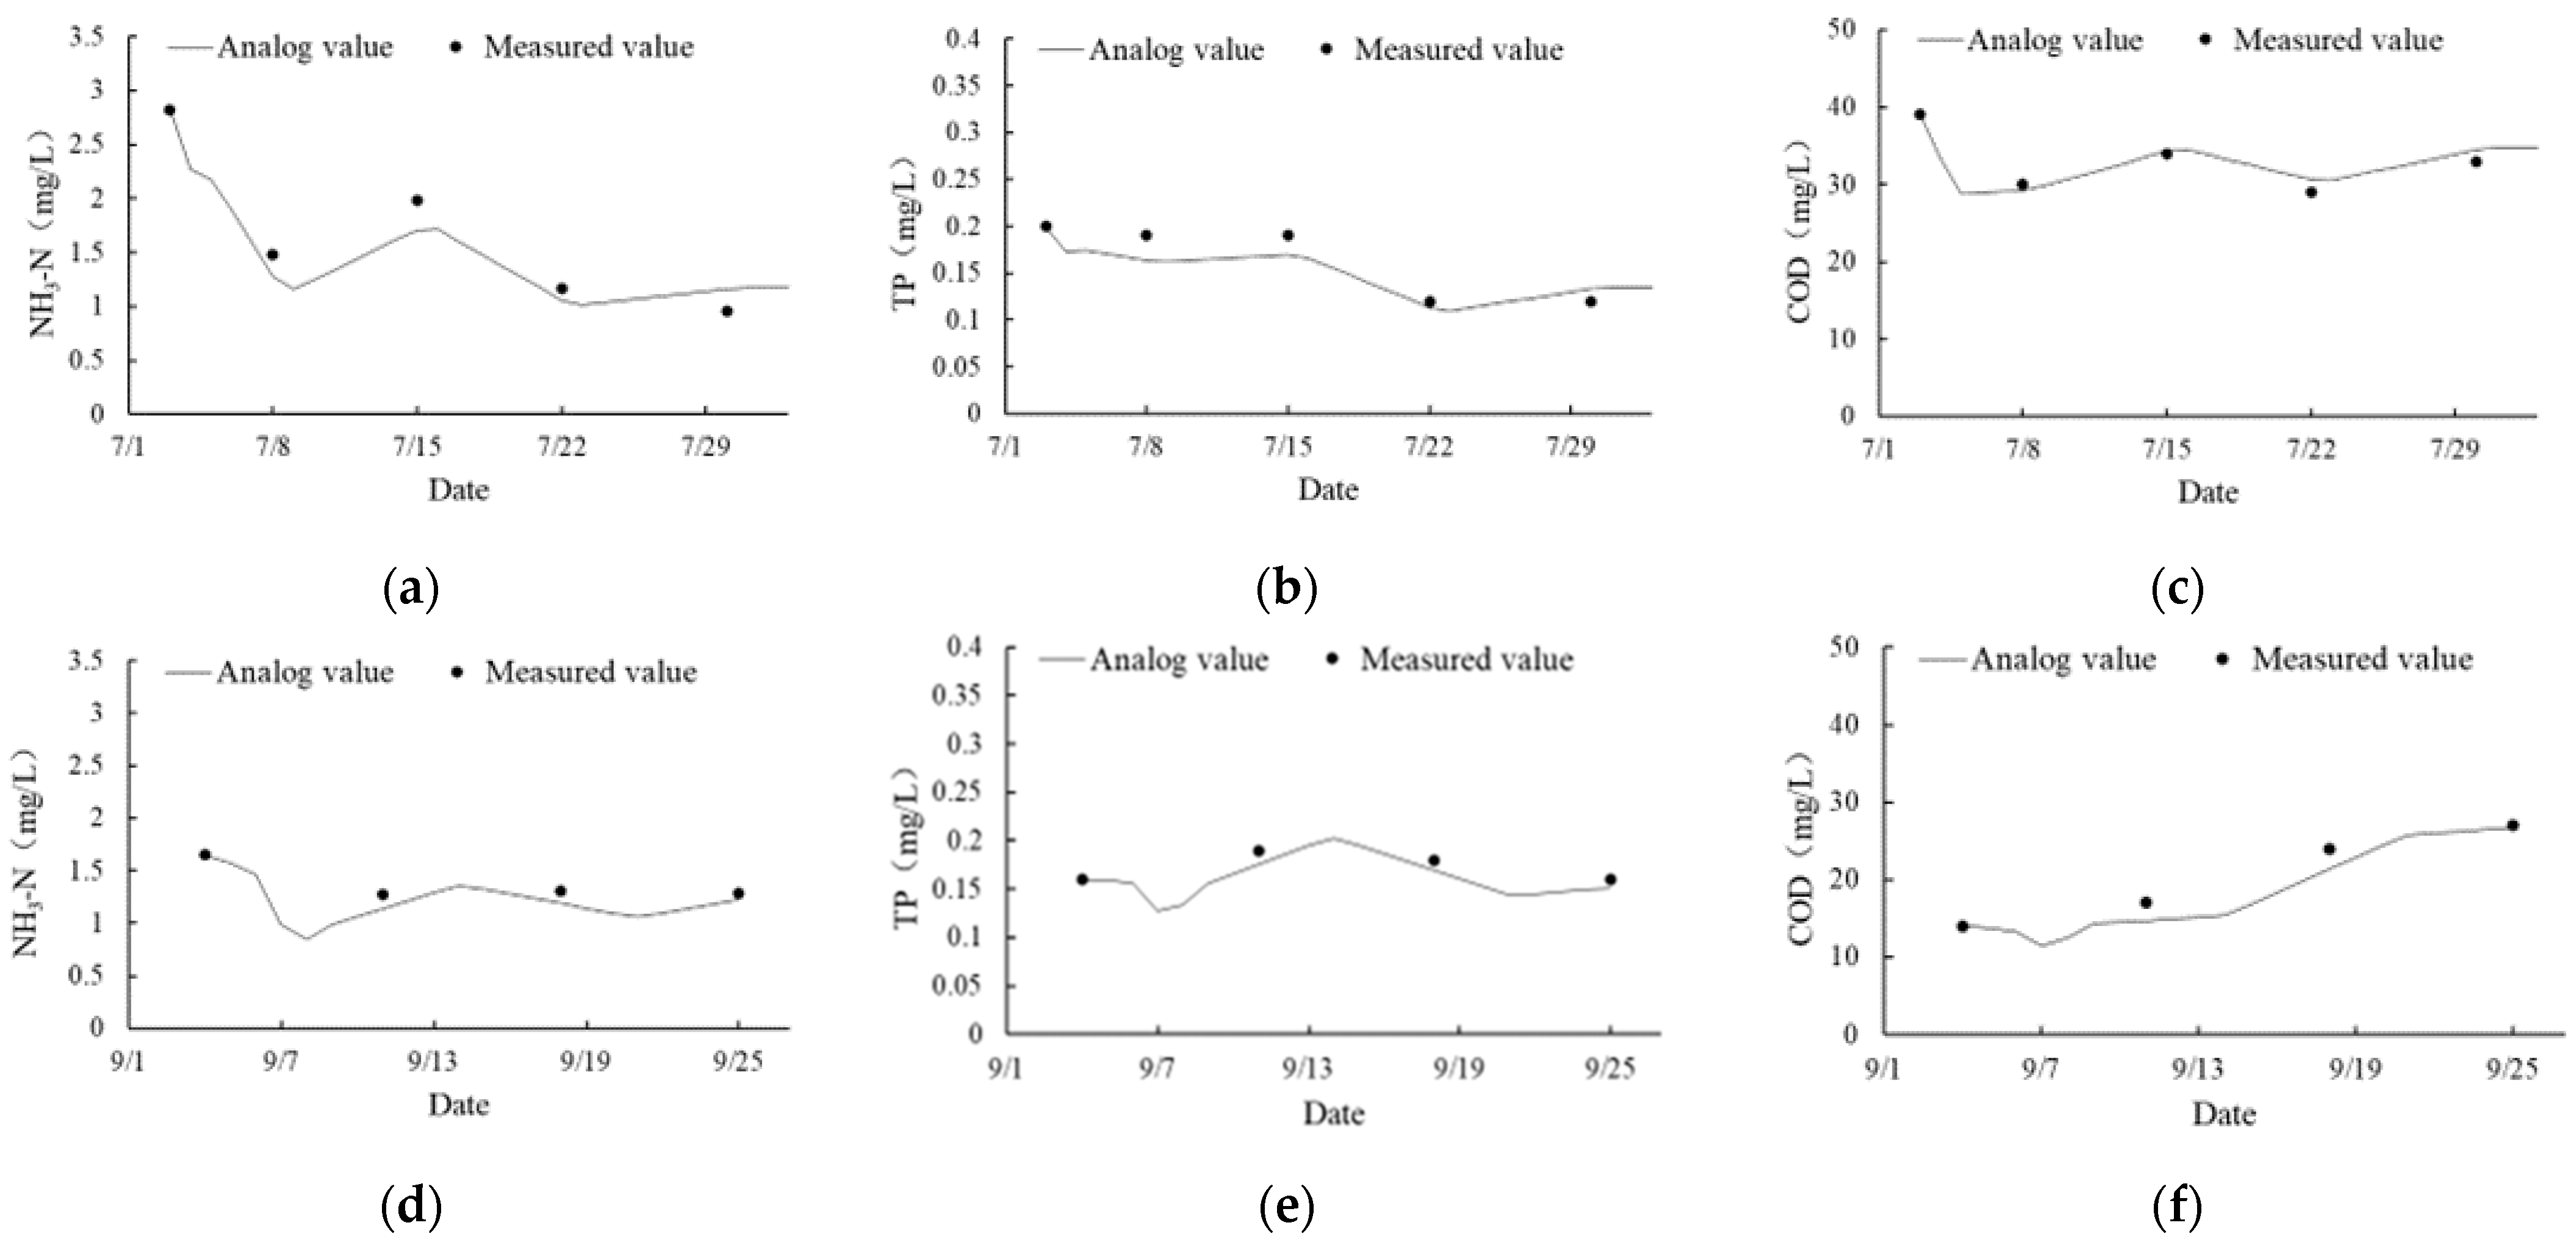
Figure 6.
Variation in NH3-N content under different scenarios.

Figure 7.
Variation in TP content under different scenarios.

Figure 8.
Variation in COD content under different scenarios.


Table 1.
Initial conditions of state variables of the water quality model.
| Sampling Point | Station | NH3-N (mg/L) | TP (mg/L) | COD (mg/L) |
|---|---|---|---|---|
| 1 | 0+000 | 3.01 | 0.19 | 30.0 |
| 2 | 0+250 | 2.60 | 0.18 | 31.0 |
| 3 | 0+800 | 2.84 | 0.18 | 32.0 |
| 4 | 1+000 | 2.82 | 0.20 | 39.0 |
Table 2.
Water quality parameters.
| Parameter Description | Value | Unit |
|---|---|---|
| Temperature coefficient | 1.07177 | — |
| Decay rate BOD | 0.03 | /d |
| Nitrification rate | NH3-N.dfsu | /d |
| Denitrification rate | 0.2 | /d |
| Decay rate P_tot | TP.dfsu | /d |
| N/BOD ratio | 0.02 | Fraction |
| Nitrification yield factor | 2.57 | gO2/gNH3-N |
| Used for P sedimentation | 0 | — |
| Weir aeration coefficient in Holler equation | 0.21 | /m |
| ECOLab time step | 30 | Seconds |
| COD decay rate at 20 deg.C | COD.dfsu | /d |
| Temperature coefficient for COD decay rate | 1.02 | Dimensionless |
Table 3.
Attenuation coefficient of the ecological floating beds in the study area in the mathematical model.
Table 3.
Attenuation coefficient of the ecological floating beds in the study area in the mathematical model.
| Floating Bed Combination Area | Station Number Range | Plant Ratio/m2 | Plants as a Per-Centage of the River/% | Artificial Aquatic Plants Running Volume Ratio/% | NH3-N (/d) | TP (/d) | COD (/d) |
|---|---|---|---|---|---|---|---|
| Zone 1 | 0+020 to 0+400 | Scirpus validus Vahl 1000 + Iris 400 | Scirpus validus Vah 17.86 + Iris 7.14 | 16.2 | 1.50 | 0.60 | 0.30 |
| Zone 2 | 0+400 to 0+620 | Canna 300 + Lythrum salicaria 300 | Canna 12.5 + Lythrum salicaria 12.5 | 16.2 | 2.20 | 1.00 | 0.40 |
| Zone 3 | 0+620 to 0+700 | Iris 400 | Iris 25 | 16.2 | 1.60 | 0.60 | 0.30 |
| Plant-free area | — | — | — | — | 0.10 | 0.005 | 0.02 |
Table 4.
Statistical analysis of measured and simulated values at each sampling point in the parameter calibration and model validation stages.
Table 4.
Statistical analysis of measured and simulated values at each sampling point in the parameter calibration and model validation stages.
| Different Stage | Sampling Point | NH3-N | TP | COD | |||||||||
|---|---|---|---|---|---|---|---|---|---|---|---|---|---|
| RMSE (mg/L) | MAE (mg/L) | d | NSE | RMSE (mg/L) | MAE (mg/L) | d | NSE | RMSE (mg/L) | MAE | d | NSE | ||
| Parameter calibration | 1 | 0.12 | 0.09 | 0.99 | 0.97 | 0.00 | 0.00 | 0.99 | 0.99 | 0.37 | −0.22 | 0.99 | 0.98 |
| 2 | 0.22 | 0.14 | 0.97 | 0.89 | 0.01 | 0.00 | 0.93 | 0.63 | 1.24 | 1.02 | 0.94 | 0.76 | |
| 3 | 0.17 | −0.12 | 0.98 | 0.94 | 0.01 | −0.01 | 0.95 | 0.79 | 0.86 | −0.29 | 0.94 | 0.60 | |
| 4 | 0.18 | −0.08 | 0.98 | 0.92 | 0.02 | −0.01 | 0.94 | 0.80 | 1.03 | 0.54 | 0.98 | 0.91 | |
| Model validation | 1 | 0.09 | −0.08 | 0.99 | 0.96 | 0.01 | 0.00 | 0.99 | 0.98 | 1.41 | −1.05 | 0.99 | 0.97 |
| 2 | 0.11 | −0.07 | 0.98 | 0.91 | 0.01 | 0.00 | 0.99 | 0.94 | 1.24 | −0.66 | 0.99 | 0.98 | |
| 3 | 0.17 | −0.14 | 0.90 | 0.35 | 0.01 | −0.01 | 0.87 | 0.55 | 2.42 | −2.16 | 0.94 | 0.79 | |
| 4 | 0.10 | −0.08 | 0.93 | 0.61 | 0.02 | −0.01 | 0.82 | 0.39 | 1.75 | −1.31 | 0.97 | 0.89 | |
Table 5.
Scenario simulation of different plant ratios.
| Scenario | Floating Bed Combination Area | Plant Ratio/m2 | Plants as a Percentage of the River/% | Artificial Aquatic Plants Running Volume Ratio% | Water Quality Index Attenuation Coefficient/d | ||
|---|---|---|---|---|---|---|---|
| NH3-N | TP | COD | |||||
| Q1 | 1 | Canna 600 + Scirpus validus Vahl 400 + Lythrum salicaria 400 | Canna 10.72 + Scirpus validus Vahl 7.14 + Lythrum salicaria 7.14 | 16.2 | 1.58 | 0.89 | 0.37 |
| 2 | Scirpus validus Vahl 430 + Lythrum salicaria 170 | Scirpus validus Vahl 17.91 + Lythrum salicaria 7.09 | 16.2 | 1.22 | 0.70 | 0.34 | |
| 3 | Iris 400 | Iris 25 | 16.2 | 1.52 | 0.62 | 0.30 | |
| Q2 | 1 | Scirpus validus Vahl 1000 + Iris 400 | Scirpus validus Vahl 17.86 + Iris 7.14 | 16.2 | 1.50 | 0.60 | 0.30 |
| 2 | Lythrum salicaria 400 + Iris 200 | Lythrum salicaria 16.67 + Iris 8.33 | 16.2 | 0.86 | 0.85 | 0.35 | |
| 3 | Scirpus validus Vahl 200 + Canna 200 | Scirpus validus Vahl 12.5 + Canna 12.5 | 16.2 | 1.92 | 0.81 | 0.33 | |
| Q3 | 1 | Scirpus validus Vahl 700 + Canna 700 | Scirpus validus Vahl 12.5 + Canna 12.5 | 16.2 | 1.92 | 0.81 | 0.33 |
| 2 | Scirpus validus Vahl 430 + Iris 170 | Scirpus validus Vahl 17.91 + Iris 7.09 | 16.2 | 1.50 | 0.60 | 0.30 | |
| 3 | Iris 200 + Lythrum salicaria 200 | Iris 12.5 + Lythrum salicaria 12.5 | 16.2 | 1.02 | 0.80 | 0.37 | |
Publisher’s Note: MDPI stays neutral with regard to jurisdictional claims in published maps and institutional affiliations. |
© 2022 by the authors. Licensee MDPI, Basel, Switzerland. This article is an open access article distributed under the terms and conditions of the Creative Commons Attribution (CC BY) license (https://creativecommons.org/licenses/by/4.0/).
Share and Cite
MDPI and ACS Style
Qiu, L.; Yu, P.; Li, S.; Ma, H.; Li, D.; Li, J. Water Purification Effect of Ecological Floating Bed Combination Based on the Numerical Simulation. Sustainability 2022, 14, 12276. https://doi.org/10.3390/su141912276
AMA Style
Qiu L, Yu P, Li S, Ma H, Li D, Li J. Water Purification Effect of Ecological Floating Bed Combination Based on the Numerical Simulation. Sustainability. 2022; 14(19):12276. https://doi.org/10.3390/su141912276
Chicago/Turabian StyleQiu, Lanqing, Ping Yu, Shaofei Li, Huixin Ma, Danying Li, and Jianzhu Li. 2022. "Water Purification Effect of Ecological Floating Bed Combination Based on the Numerical Simulation" Sustainability 14, no. 19: 12276. https://doi.org/10.3390/su141912276
Note that from the first issue of 2016, this journal uses article numbers instead of page numbers. See further details here.