Article

Numerical Investigation on Mechanisms of MHD Heat Flux Mitigation in Hypersonic Flows

1
School of Aeronautic Science and Engineering, Beihang University, Beijing 100191, China
2
Beijing System Design Institute of Electro-mechanic Engineering, Beijing 100039, China
*
Author to whom correspondence should be addressed.
Aerospace 2022, 9(10), 548; https://doi.org/10.3390/aerospace9100548
Submission received: 25 August 2022 / Revised: 17 September 2022 / Accepted: 19 September 2022 / Published: 25 September 2022

Abstract

:
Numerical simulations of hypersonic magnetohydrodynamics (MHD) flow over a typical sphere–cone blunt body are carried out based on the assumption of a low magnetic Reynolds number. The effects of an external dipole magnetic field on the surface heat flux are analyzed in detail, and multiple mechanisms of the MHD heat flux mitigation are revealed systematically for the first time. The following is found: (1) The external magnetic field can effectively reduce the stagnation point heat flux, and the increase in the boundary layer thickness due to the effect of counter-flow Lorentz force, which is equivalent to adding an adverse pressure gradient, is the main reason. (2) In the head region of the blunt body, the relative surface heat flux shows a complex trend of rising and falling because there are two mechanisms which could produce the opposite effects on the surface heat flux. One is that the counter-flow Lorentz force results in an increase in the boundary layer thickness, and the other is that the Joule heating increases the static temperature behind the shock wave. (3) In the shoulder region of the blunt body, the Lorentz force component, normal to streamline, could change the flow direction of the fluid elements, causing the streamline to deviate from the wall or even separate, thus affecting the surface heat flux. (4) In the large area downstream of the blunt body, the surface heat flux could still be reduced by more than 30% due to the “upstream historical effect”.

1. Introduction

Hypersonic flight technology is attracting increasing attention from major countries worldwide due to its vast potential value for military and civil applications. However, the enormous aerodynamic heating severely restricts the further development of hypersonic vehicles [1]. During the hypersonic flight, the weakly ionized plasma with certain electrical conductivity formed behind the detached bow shock provides the possibility for flow control by applying an external magnetic field. In the 1950s, Resler and Sears pointed out the potential of magnetohydrodynamics (MHD) flow control technology in aerospace applications for the first time [2]. The diagram view of MHD flow control around a blunt body is shown in Figure 1. Under the effect of the eternal magnetic field, there is the electric current in the weakly ionized plasma flow behind the detached shock. The interaction between the induced electric current and external magnetic field generates the Lorentz force, which decelerates the flow behind the shock and pushes the bow shock away from the blunt body, leading to a significant influence on the aerodynamic heat load on the surface of the vehicle. In the 1990s, with the development of hypersonic vehicles and the advancement of superconducting material technology, MHD heat flux mitigation drew extensive attention as a potential thermal protection technology to reduce hypersonic aerodynamic heating.
In the early days when computational fluid dynamics (CFD) theory was not yet established, Meyer [3] and Bush [4,5] conducted theoretical studies on hypersonic MHD flow control by establishing simplified mathematical models, which theoretically confirmed the reduction effect on the aerodynamic heating by the external magnetic field and gave the primary physical picture of MHD flow control. In recent years, tremendous progress has been made in the capability of CFD and wind tunnel experimental technologies. A large number of numerical and experimental studies have been carried out for MHD flow control, and all of these studies proved that the external magnetic field could significantly increase the shock stand-off distance and reduce the stagnation point heat flux of the blunt body. Gülhan et al. [6] investigated the effect of an external magnetic field on the surface heat flux in the L2K arc-heated wind tunnel in Cologne using a high enthalpy ionized argon gas stream. The experimental results showed that the surface temperature of the blunt-end model and the flat-end model decreased by 16% and 44%, respectively, and the stagnation point heat flux decreased by 46% and 85%, respectively. Fujino et al. [7,8] developed a numerical simulation program for hypersonic MHD flows considering thermo-chemical nonequilibrium effects based on the assumption of low magnetic Reynolds number, and the numerical simulation results showed that the stagnation point heat flux could be decreased by 13% at the typical re-entry condition ( H = 59.6 km, M a = 17.6) under the effect of an external magnetic field.
The opening literature extensively investigated the effects of low magnetic Reynolds number assumption [9], gas chemical kinetic model [10], electrical conductivity model [7], wall conductive boundary conditions [8], Hall effect [11,12], and other factors on the MHD flow control, as well as the MHD thermal protection performances for typical configurations [13,14,15]. However, there is little attention paid to the flow mechanism about how the external magnetic field changes the surface heat flux in hypersonic flows. Among the few studies about the MHD flow control mechanism, the stagnation point region of the vehicle is the focus, where the aerodynamic heating is most severe, and the prevailing viewpoint is generally that the decrease in the stagnation point heat flux is due to the significant increase in the shock stand-off distance [16,17]. However, in recent years, researchers also put forward different explanations, arguing that the change of the shock stand-off distance is not directly related to the change of the surface heat flux. Li et al. [18] pointed out that the influence of external magnetic field on the surface heat flux mainly depends on the effect of Lorentz force in the boundary layer, and the dominant Lorentz force components in different regions are different; Bityurin held the view that the change of flow characteristics at the outer edge of boundary layer is the main reason for the change of surface heat flux, and the decrease in velocity at the outer edge of boundary layer reduces the heat transfer coefficient, which leads to the decrease in the surface heat flux [11]. All of the above studies only investigated the stagnation point region, lacking a complete description and mechanism study of the heat flux on the overall wall of the vehicle. Additionally, the existing mechanism explanations are not systematic. For example, Hoffmann et al. [19,20] found that Joule heating has a significant impact on temperature distribution in the flow field, which would lead to an increase in the surface temperature, while there is currently a lack of analysis of the effect of Joule heating on the surface heat flux. From the above discussions, it can be seen that the current understanding of the flow mechanisms of MHD heat flux mitigation is not complete, and there are still inconsistencies in the existing explanations, so further research work is needed.
The purpose of this paper is to carry out numerical studies on the flow mechanisms of MHD heat flux mitigation in hypersonic flows for a typical blunt body. The content is organized in the following manner: the governing equations of compressible MHD flow based on the assumption of low magnetic Reynolds number are given, and the adopted numerical methods are verified by comparing the numerical results with experimental or theoretical studies. Next, numerical experiments are designed for a typical sphere–cone blunt body to analyze the influence of the external magnetic field on the surface heat flux, revealing the flow mechanisms of aerodynamic heating changes and proposing the more reasonable and systematic explanations of MHD heat flux mitigation in hypersonic flows.

2. Numerical Methods and Verification

2.1. Governing Equations and Numerical Methods

The governing equations of compressible MHD flows are the Navier–Stokes (N-S) equations, including the component transport equations and the electromagnetic source terms, which are expressed in vector form as follows:
ρ t + · ρ u = 0
t ( ρ Y s ) + · ( ρ Y s u ) = · ( ρ D s Y s ) + ω ˙ s , ( s = 1 , 2 , , n s )
ρ u t + · ρ uu + p I ¯ ¯ = · τ ¯ ¯ + F e m
ρ e t + · ρ H u = · τ ¯ ¯ · u + · k T + · s = 1 n s ρ h s D s Y s + W e m
The ρ , p , T and u refer to density, pressure, temperature and velocity vector of the gas mixture, respectively. Y s , D s , h S are the mass fraction, mass diffusion coefficients, and static enthalpy (the sum of the sensible and formation enthalpy) of the species s, respectively. ω ˙ s is the mass production per unit volume per unit time of species s. e and H are the total energy and total enthalpy per unit mass of the gas mixture, and e is given as Equation (5), where u , v , w are the velocity components in the three directions of x , y , and z. τ ¯ ¯ = τ i j represents the molecular stress tensor, which can be calculated by Equation (6):
e = s = 1 n s Y s h s + 1 2 u 2 + v 2 + w 2 p ρ
τ i j = μ ( u i x j + u j x i ) 2 3 μ u i x j δ i j
The molecular viscosity μ , thermal conductivity k and the mass diffusion coefficients D s for each species are obtained by the theory of molecular kinetics [21], whereas the transport coefficients for the gas mixture are calculated through Wilke’s mixing law [22]. The specific heat at constant pressure C p s and static enthalpy h s of all the species are fitted by temperature polynomials, whose coefficients can be accessed from [23], while the corresponding parameters of the gas mixture are obtained by weighting the mass fraction of components. The equation of state for the gas mixture must be supplemented to make the governing equations closed, which is given as Equation (7):
p = ρ R * M T
where R * is the universal gas constant, and M is the average molar mass of the gas mixture.
F e m and W e m in Equations (3) and (4) are the electromagnetic force source term and energy source term introduced by the external electromagnetic field, which are given as Equations (8) and (9), where J is the electric current density, B is the magnetic field vector, and E is the electric field vector. The electromagnetic source terms introduce new unknowns J , B , and E into the governing equations, which need to be obtained by solving the electromagnetic module.
F e m = J × B
W e m = E · J
Because the magnetic Reynolds number is small ( R e m = μ 0 σ r e f U L 1 ) during hypersonic flight, the induced magnetic field could be neglected [24], which means that the magnetic field in the flow field is equal to the external magnetic field, and the curl of electric field is equal to zero. Therefore, the electric potential ϕ can be introduced to reduce the electromagnetic module from Maxwell equations to Poisson’s equation of ϕ in scalar form, as seen in Equations (10) and (11), where the σ is the electrical conductivity. Then, J can be calculated from the generalized Ohm’s law given by Equation (12). The Hall effect and ion slip effect are both neglected in this paper, and the electrical conductivity can be expressed in scalar form.
E = ϕ
· σ ϕ + u × B = 0
J = σ ( E + u × B )
The governing Equations (1)–(4) are solved using an in-house code ACANS, a finite difference CFD code developed by Gao et al. [25]. The reliability of ACANS was verified by a variety of simulations, and the details of the code can be found in [26,27,28]. In the present numerical simulations, the inviscid flux vectors are discretized using the Roe scheme [29], and the monotone upstream-centered scheme for conservation laws method [30] is adopted to achieve second-order precision. The viscous flux vectors are discretized by the second-order central-difference scheme. The implicit lower–upper symmetric Gauss–Seidel method [31] is employed for the time marching. For the chemical kinetic model of high-temperature air, a single-temperature chemical non-equilibrium kinetic model of 7 species (N 2 , O 2 , NO, N, O, NO + , e ) and 11 elementary reactions is used in this paper. The thermodynamic parameters of each component and the rate constants of elementary reactions are detailed in the literature [32]. In addition, the equation of ϕ is discretized by the second-order central-difference scheme and solved by the successive over relaxation method.

2.2. Electrical Conductivity Model

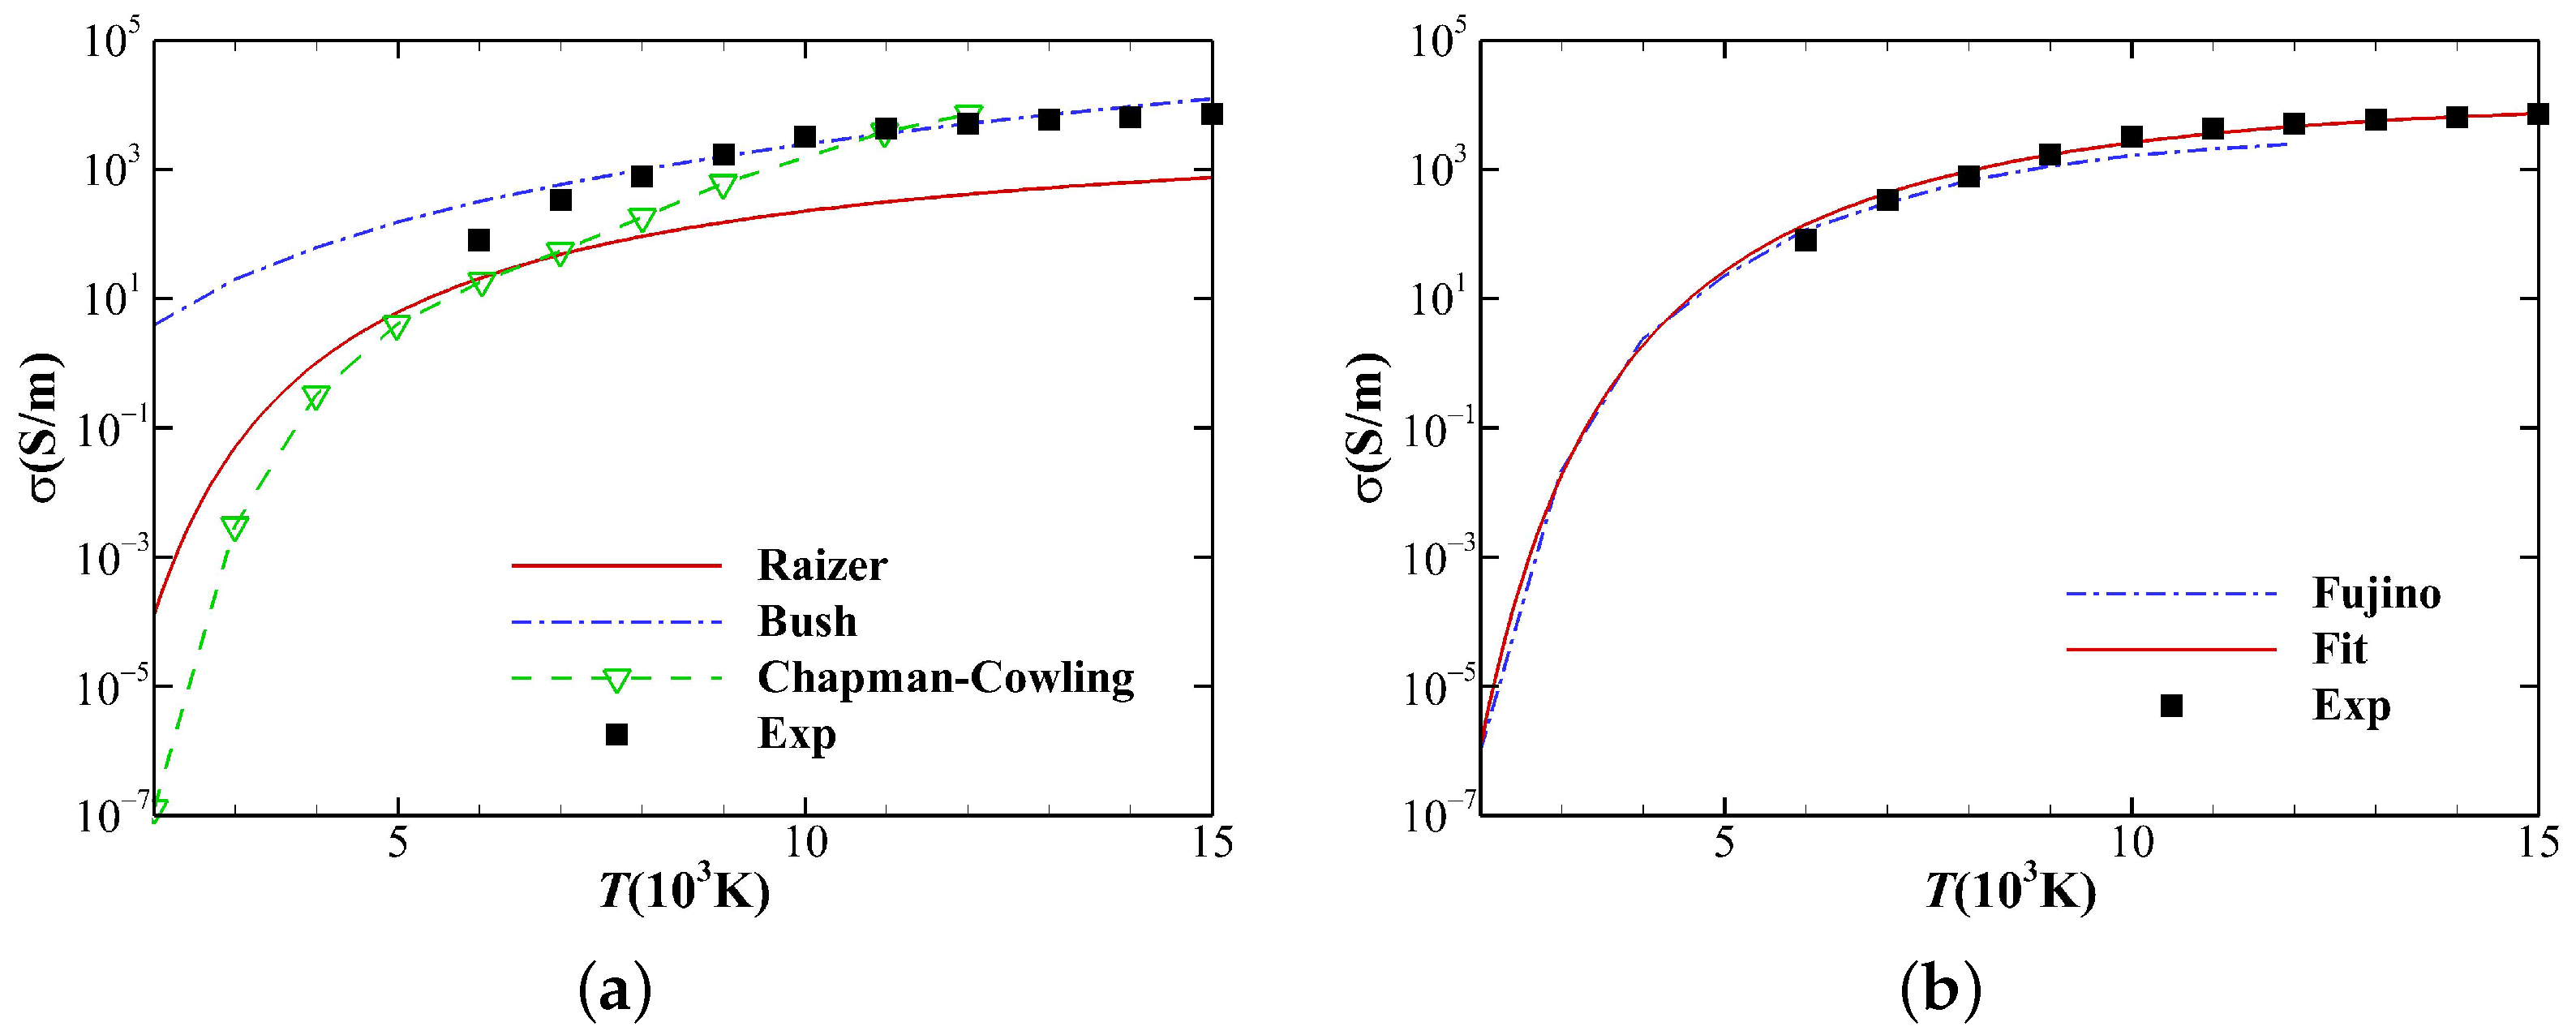
Electrical conductivity, as a transport property of plasma, quantitatively describes the ease of directional conduction of charges in plasma. The accurate calculation of the electrical conductivity is critical for MHD flow simulations. Temperature-dependent semi-analytic models are generally employed, and the representative models are the Chapman–Cowling model, Bush model, Raizer model, etc. [33]. These semi-analytic models are computationally efficient, but as shown in Figure 2a, all these models deviate to some extent from the experimental data and have poor generality and limited applicability.
Fujino et al. employed the electrical conductivity model based on the molecular collision theory when thermochemical nonequilibrium effects are considered [35], which is closer to the electrical conduction mechanism of plasma [36] and could be regarded as an accurate calculation method of electrical conductivity. However, this model involves data of the exact composition of the gas mixture, the electron temperature, the electron–neutral particle and the electron–ion interaction potential, which is extremely complex. For simplicity and reliability, curve fitting for the experimental or accurately calculated data is commonly used in numerical simulations to calculate the electrical conductivity of high temperature air [37]. The data given in [38] are employed in this paper to fit a new electrical conductivity model using the least squares method, which is denoted as the Fit model given by Equation (13), where a = e 40.0523 , b = 2.78871 , c = 65 , 066.9 . The comparison of the Fit model with the experimental data and the calculation results by Fujino is shown in Figure 2b. It can be seen that the Fit model is in good agreement with the experimental data and even achieves better agreement than the results given by Fujino, especially in the high-temperature region. Therefore, the Fit model is used to calculate the electrical conductivity in this paper.
σ ( T ) = a T b e c / T

2.3. Code Verification

In this section, the experiment performed by Klaus et al. [39] and a theoretical solution developed by Bush for the stagnation point flow over an axisymmetric blunt body with an external dipole magnetic field [4,5], are employed to verify the adopted numerical code.

2.3.1. Hypersonic Flow over a Cylinder

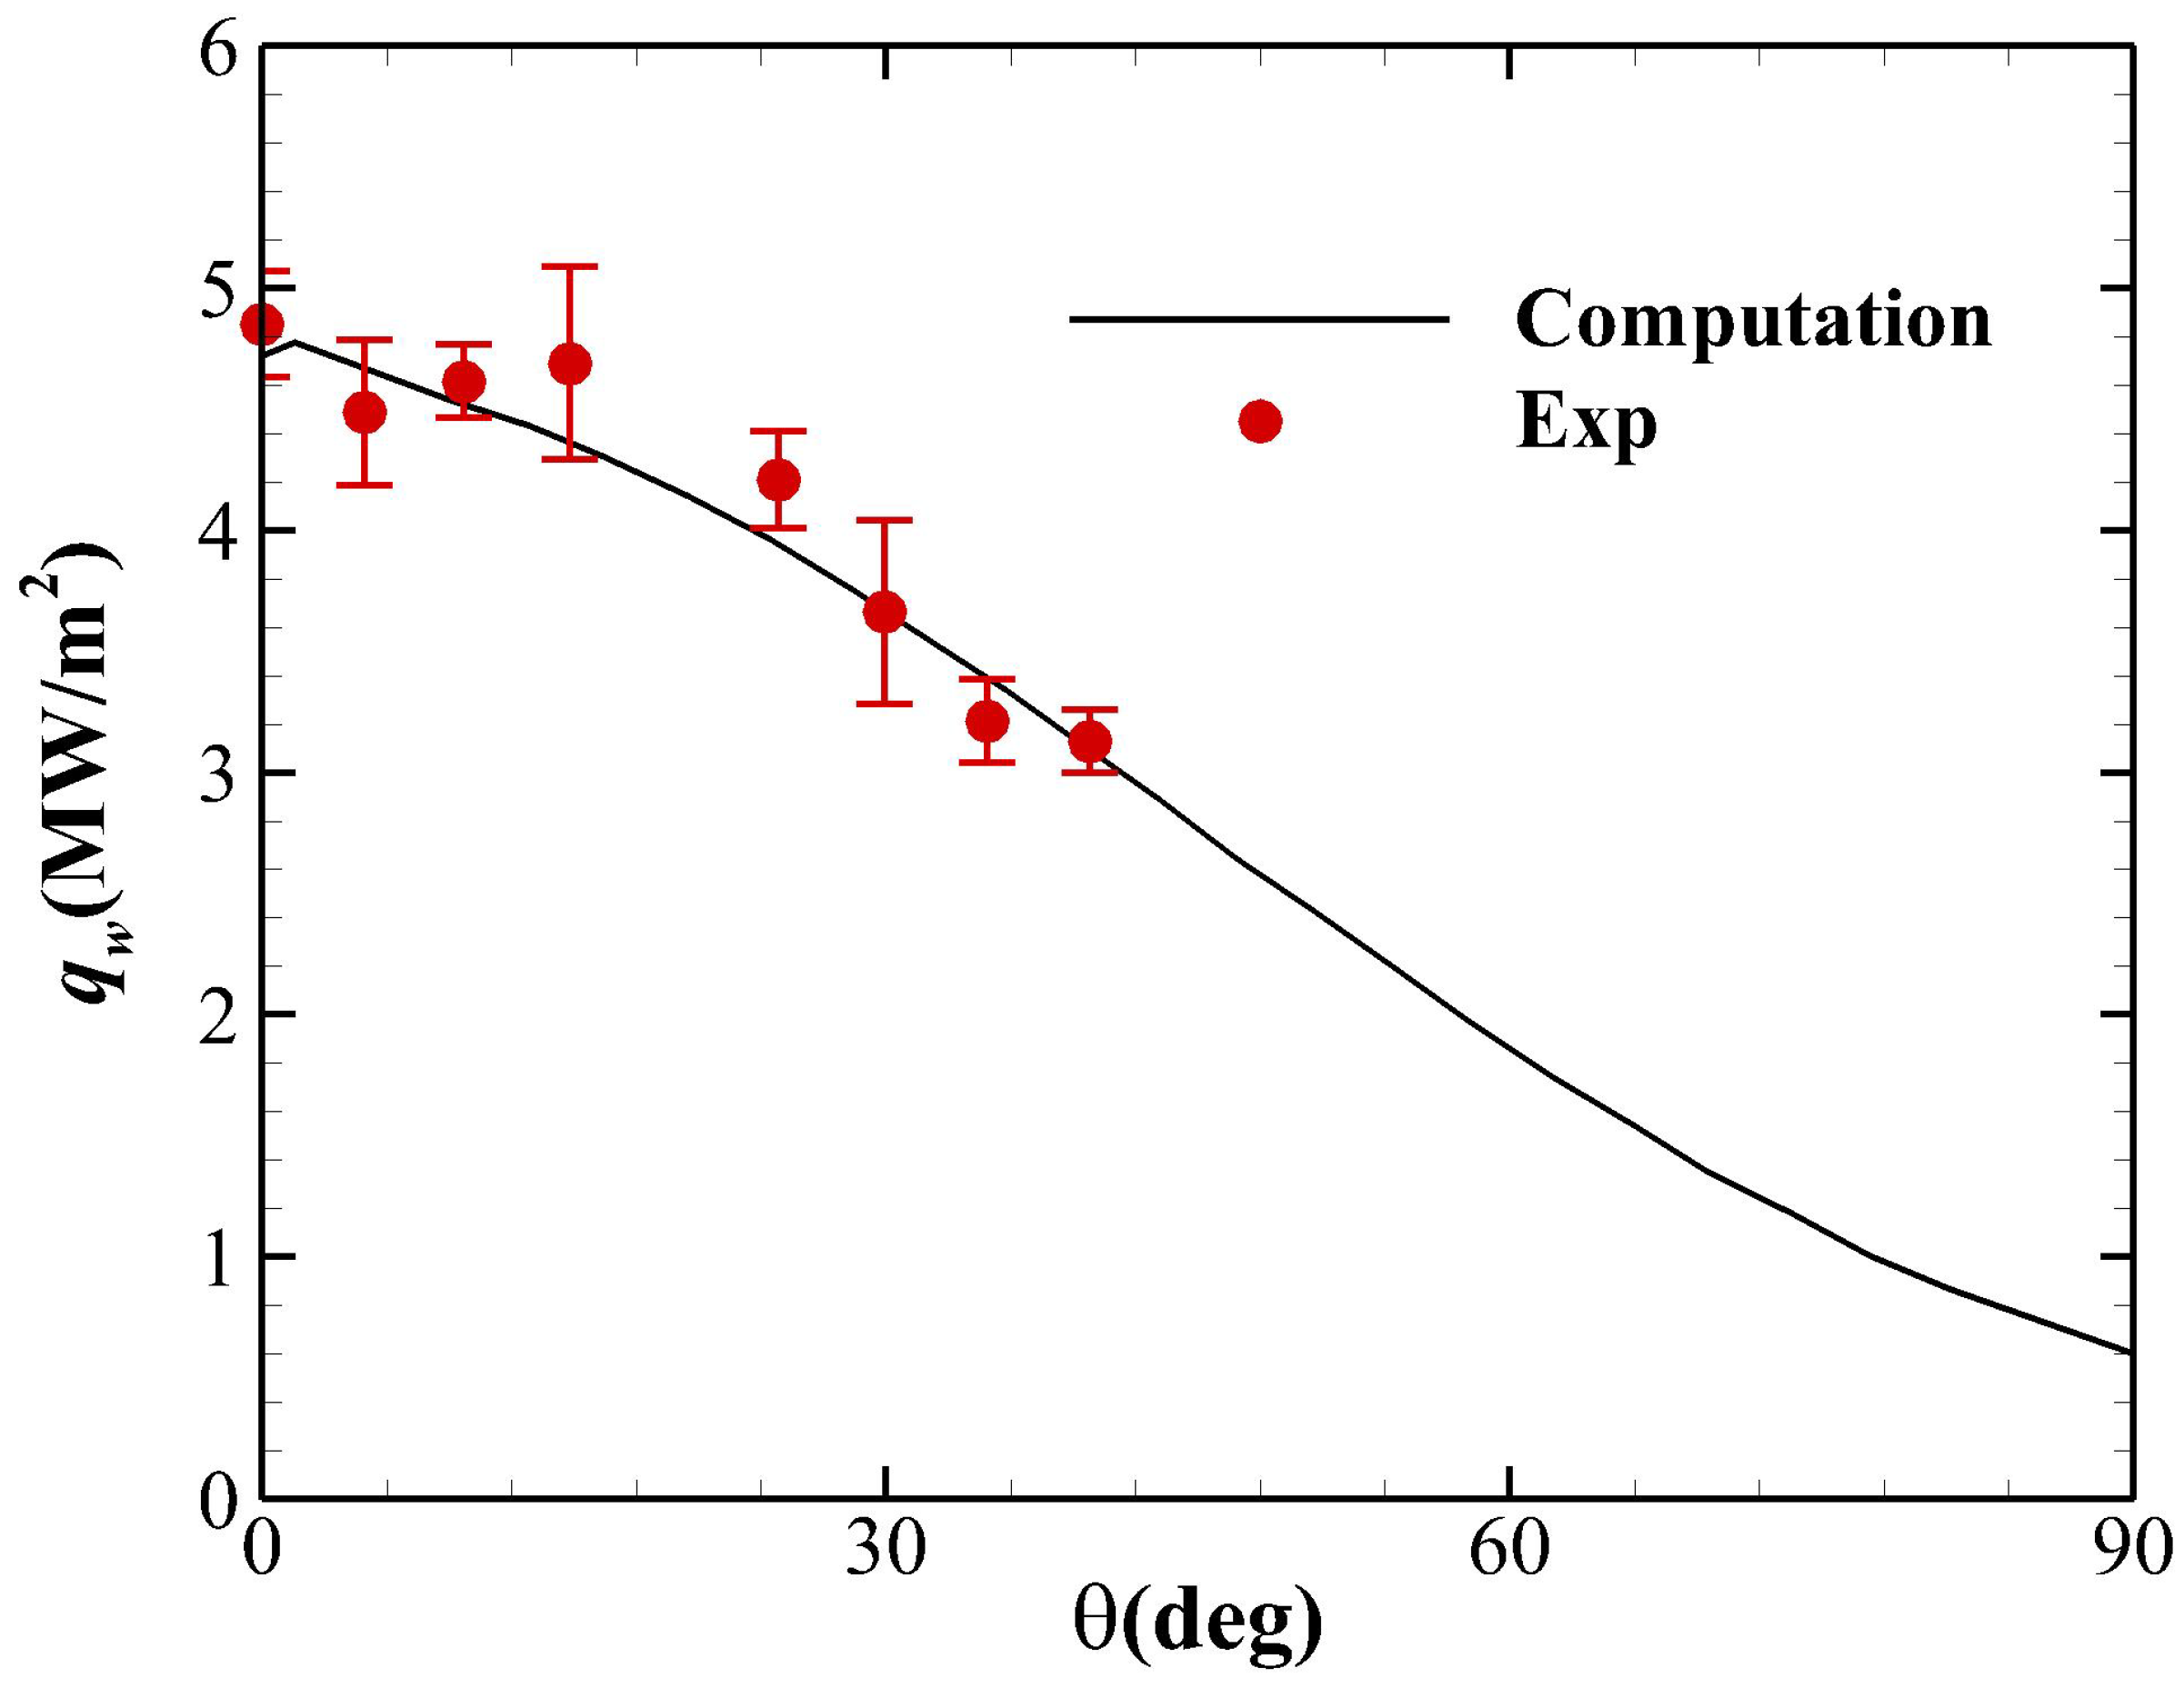
The hypersonic aeroheating experiment for a cylinder performed by Klaus et al. is simulated first, and the diameter of the cylinder is 90 mm and the length is 380 mm. The flow conditions are given as M a = 8.78 , T = 694 K, and P = 687 Pa, respectively. The total temperature of the incoming flow exceeds 10,000 K, so the chemical non-equilibrium effect must be considered in this case. The mass fractions of each species in the freestream are Y N 2 = 0.7355 , Y O 2 = 0.134 , Y N O = 0.0509 , Y N = 1.0 × 10 9 , Y O = 0.07955 . The isothermal wall boundary condition is adopted for the cylinder surface with T w = 300 K. Figure 3, with the comparison of measured and numerical result of surface heat flux, shows that the numerical code used in this paper can accurately predict the surface heat flux considering the chemical nonequilibrium effects.

2.3.2. Theoretical Solution of Stagnation Point MHD Flow

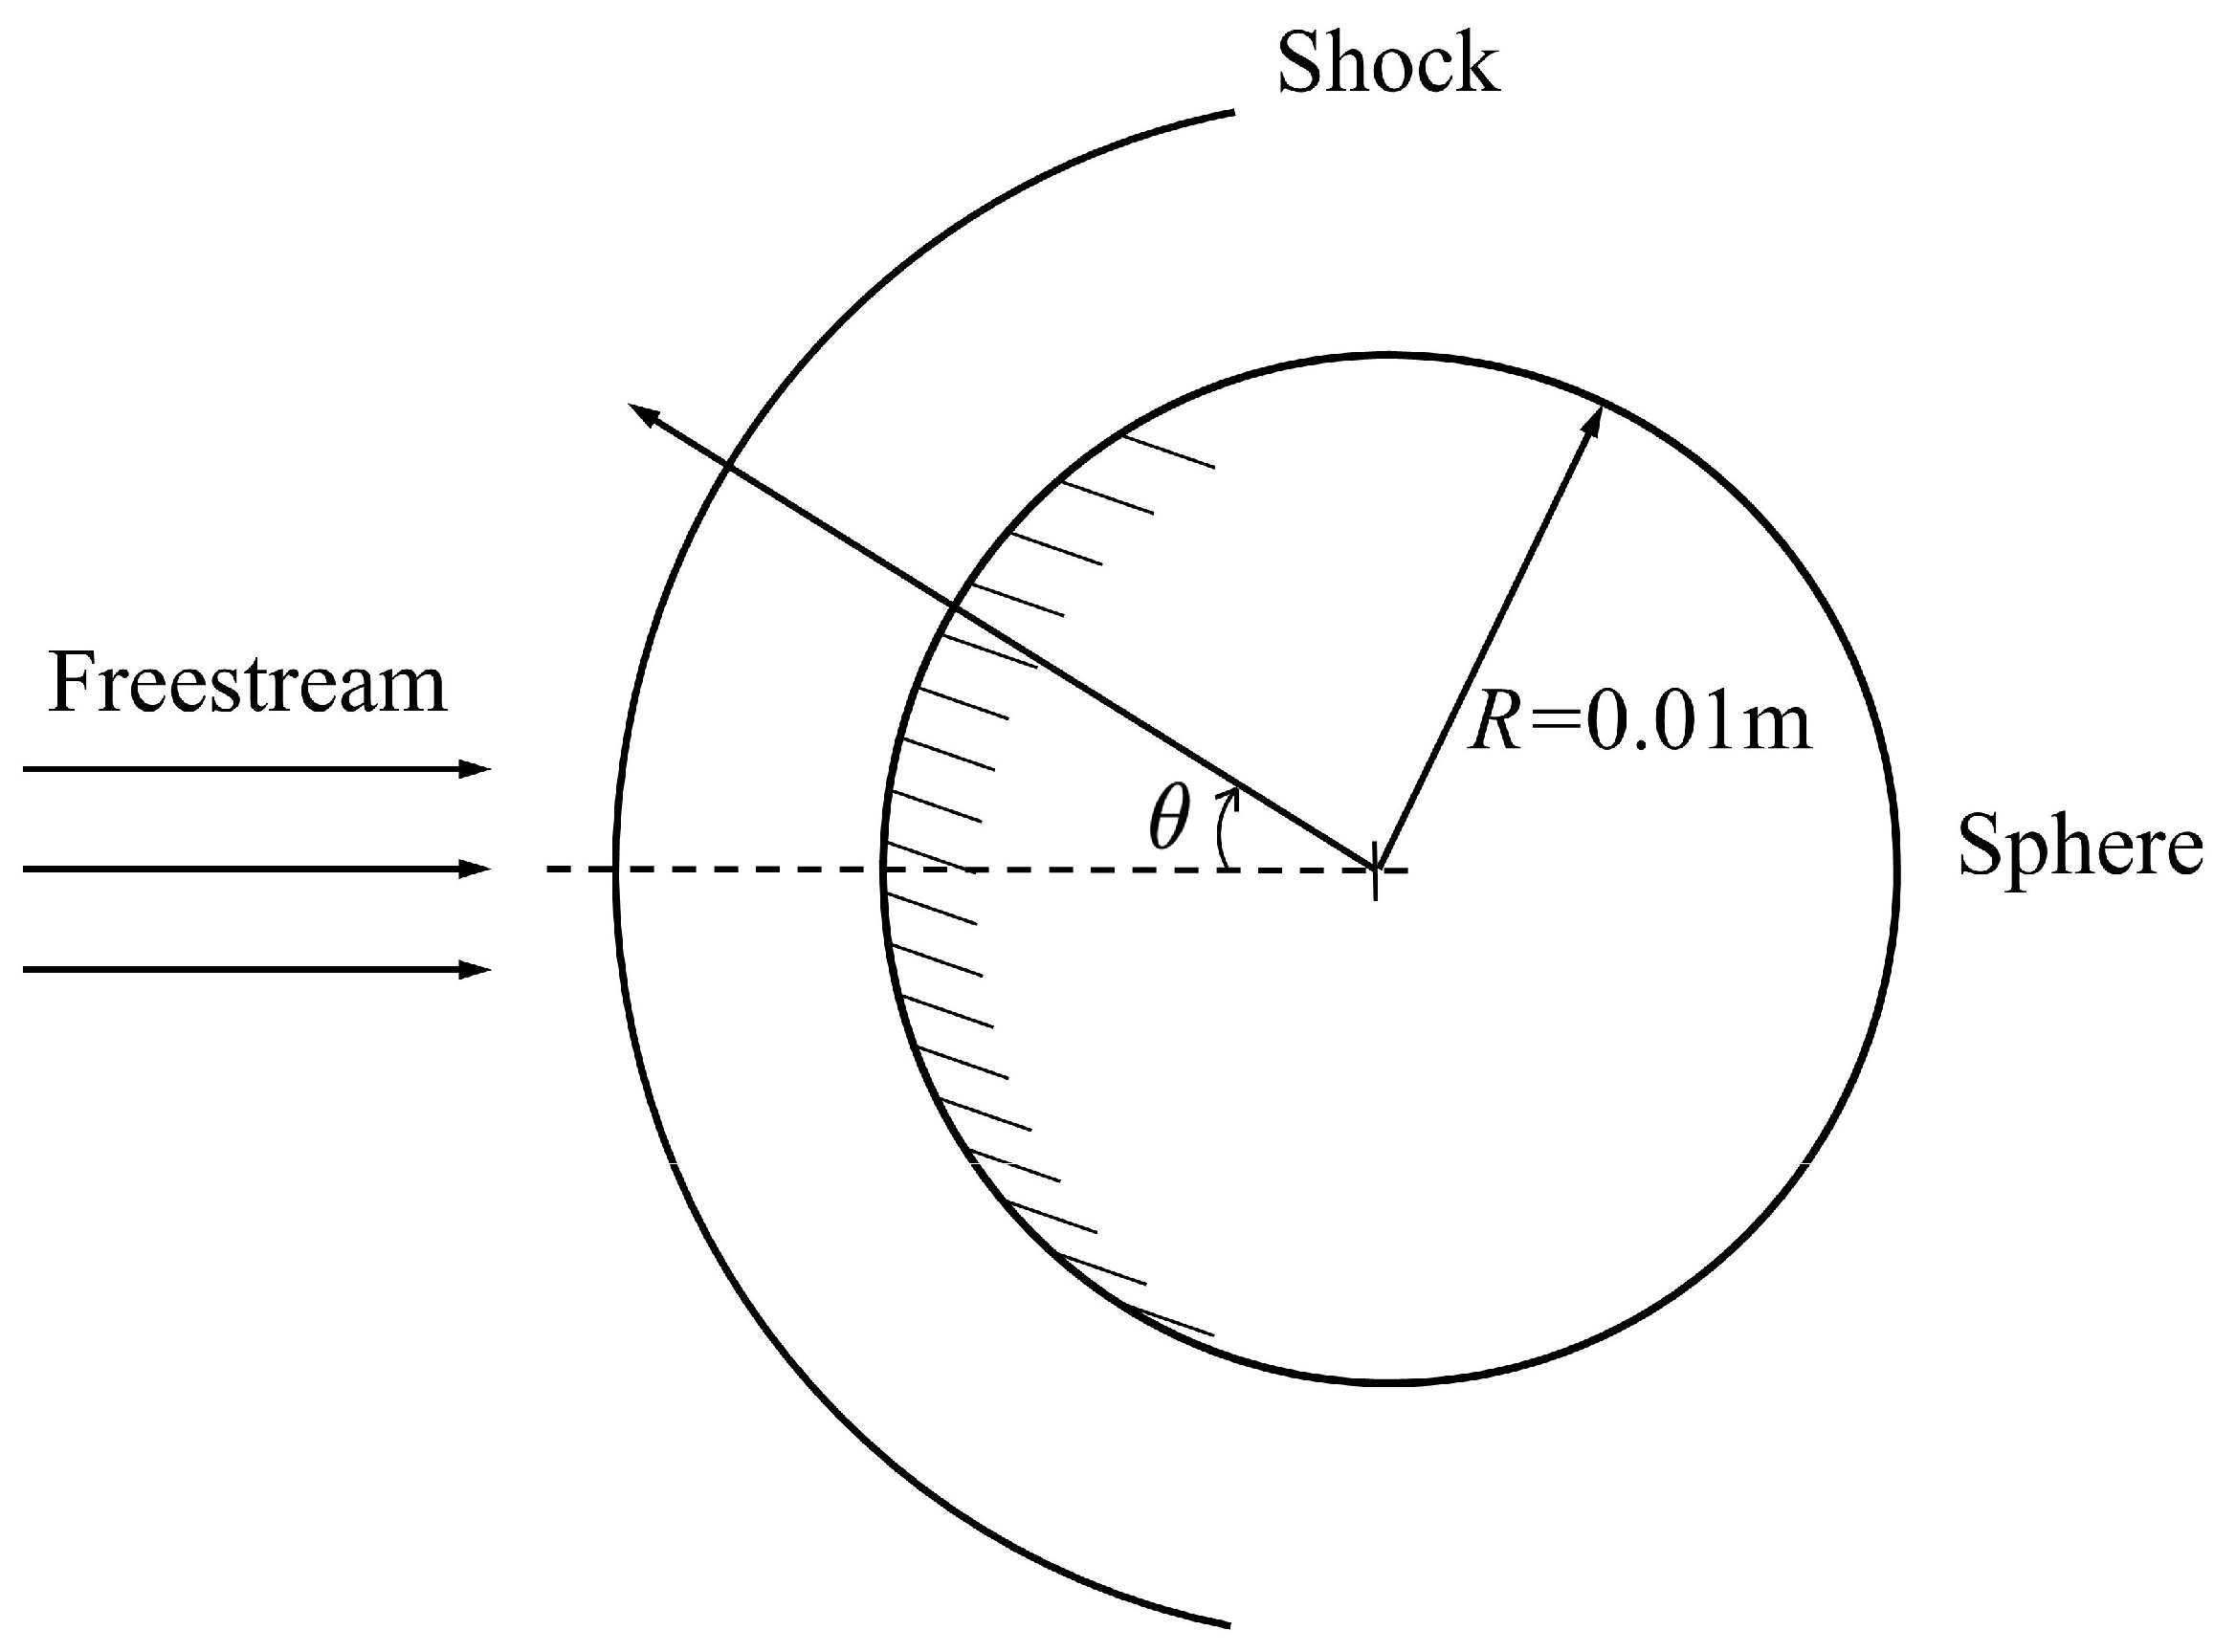
To further verify that the electromagnetic-flow coupling can be simulated precisely by the numerical code in this paper, the theoretical solution given by Bush [4,5] is employed here. The schematic of this case is illustrated in Figure 4, and the radius of the sphere is R = 0.01 m. The freestream conditions are given as ρ = 5.531 × 10 2 kg/m 3 , M a = 5, T = 100 K, R e = 80,000. The isothermal wall boundary condition is adopted with T w = 300 K, and the wall is assumed to be electrically insulated. The dipole magnet placed at the sphere center pointing against the direction of incoming flow is adopted. The Hall effect and ion slip effect are ignored, and the electrical conductivity is set to zero at the far field and constant behind the shock with σ = 500 S/m.
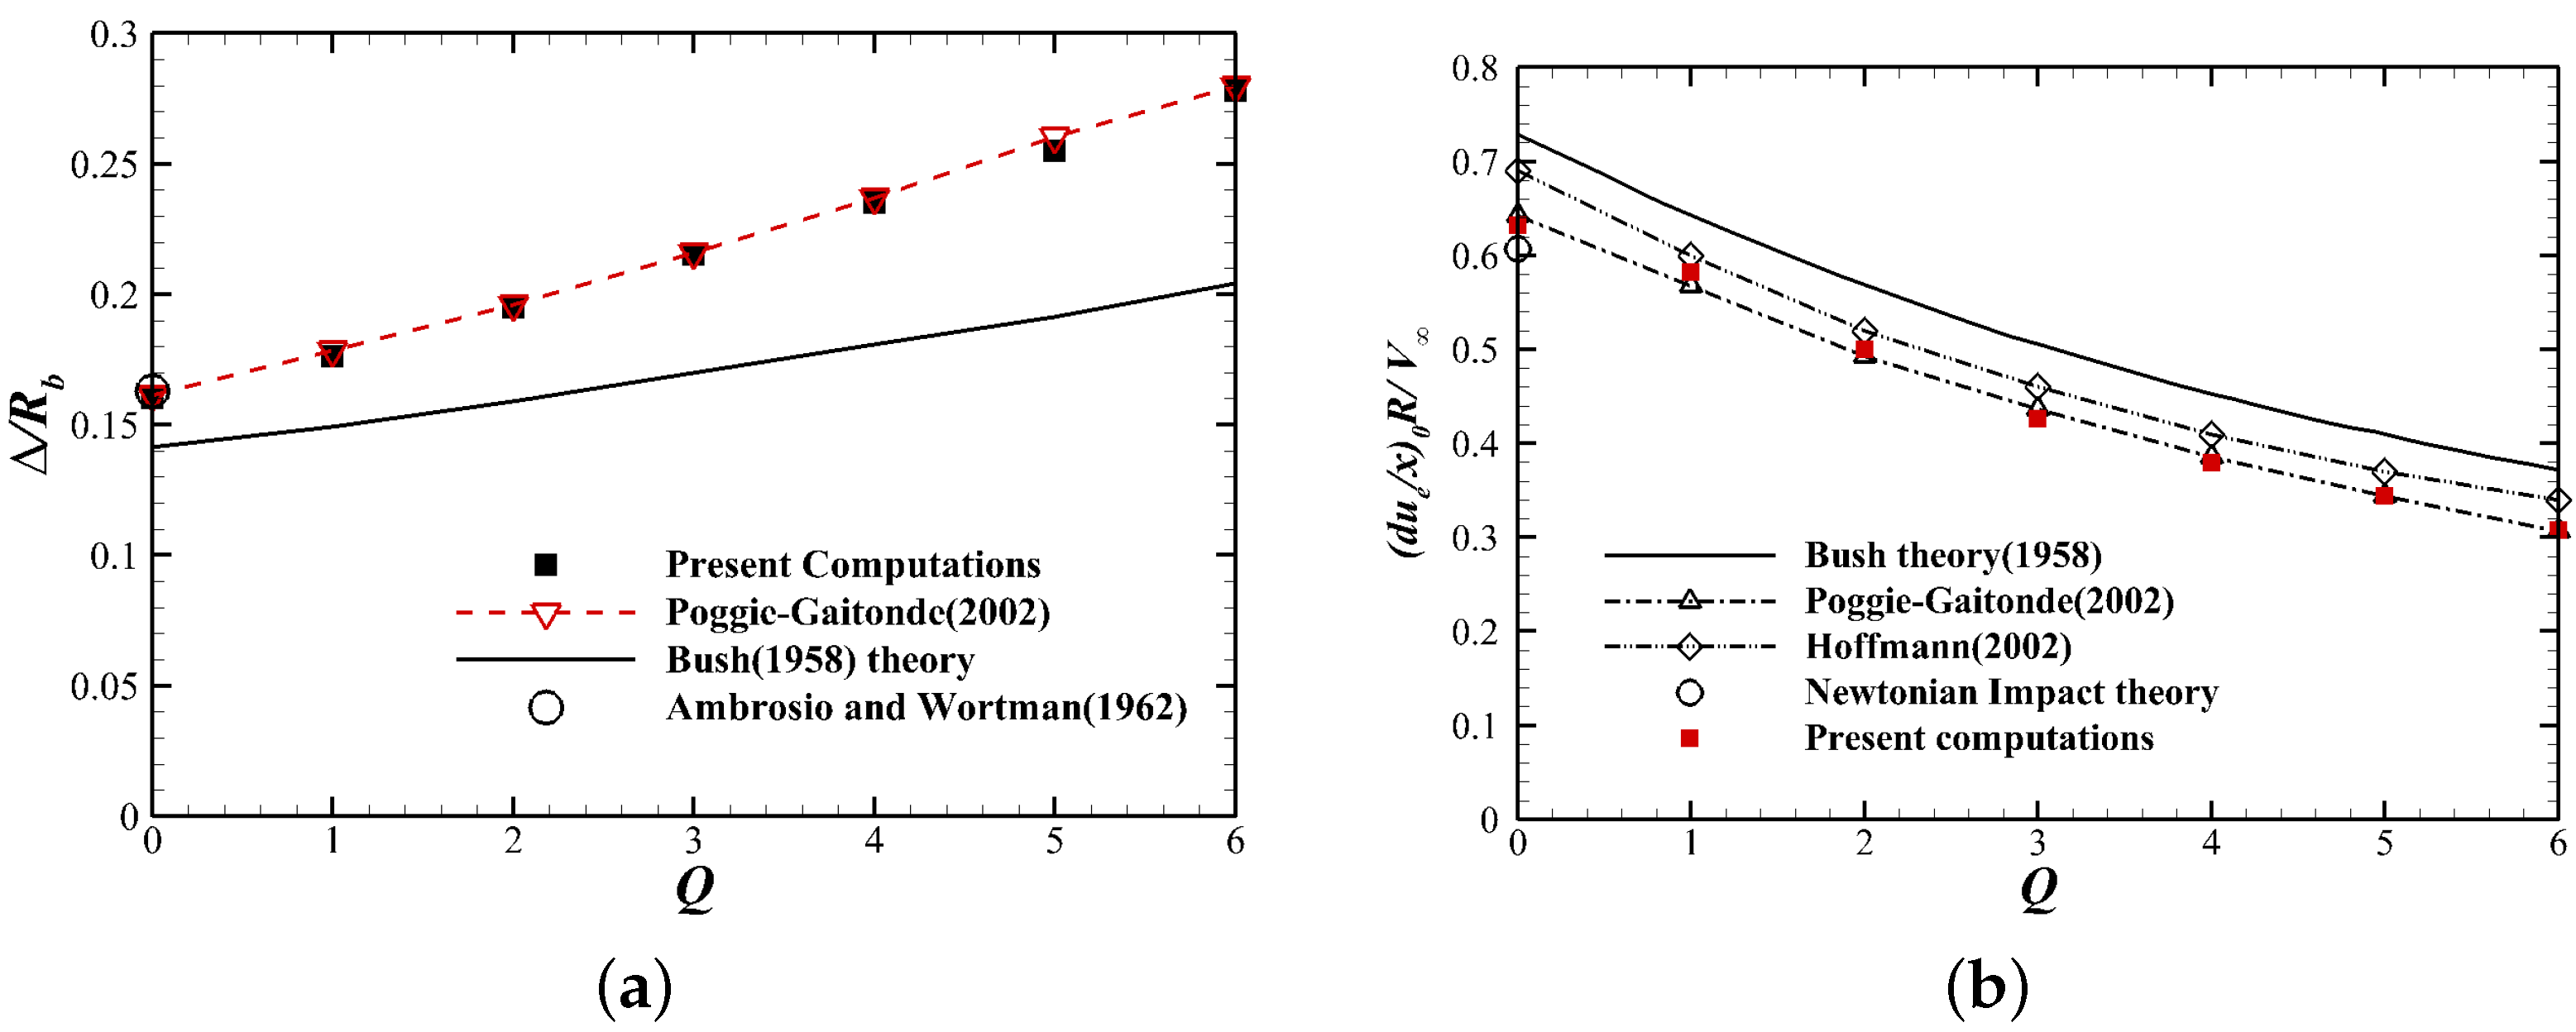
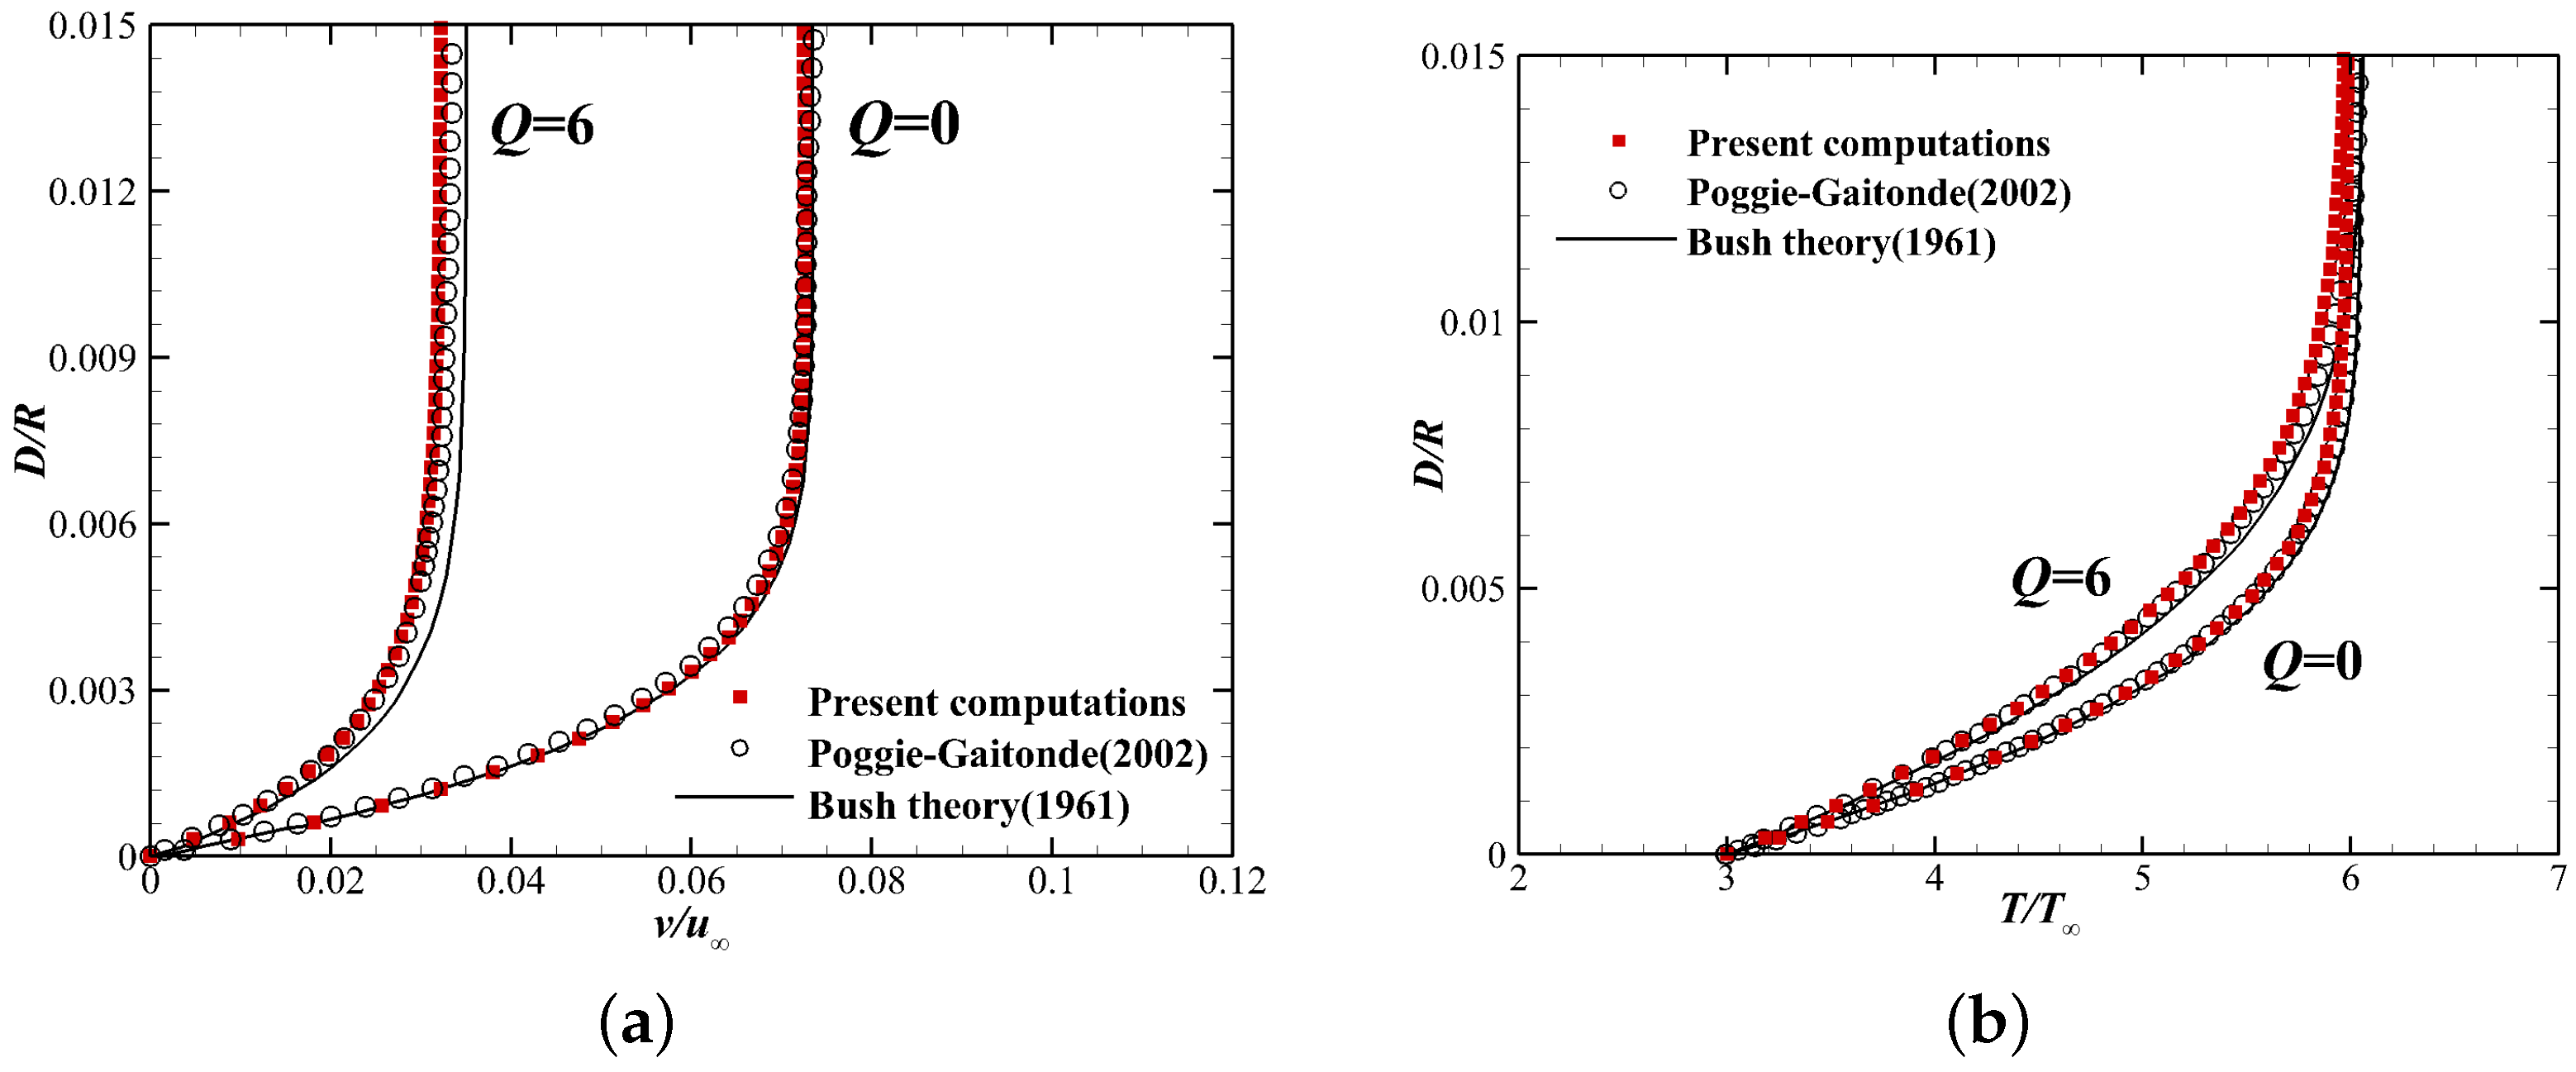
For the inviscid situation, the variation of the shock stand-off distance with Q is shown in Figure 5a, where Q is the magnetic interaction parameter given by Equation (14) and is a measurement of the ratio of Lorentz force to inertia force in the flow. It can be seen that good agreement is achieved between the present computational results and the ones obtained by Poggie and Gaitonde. Meanwhile, it is seen that all of the numerical results are higher than those predicted by Bush’s theory, and Poggie and Gaitonde attributed these deviations to the assumption of constant density in the shock layer in Bush’s theory. Furthermore, Figure 5b shows the tangential velocity gradient distribution at the stagnation point, which shows good agreement with the Bush theoretical results qualitatively and also with other numerical simulation results.
Q = σ r e f B r e f 2 L ρ U
For the viscid situation, the boundary layer profiles of velocity and temperature for a station close to the center line ( θ = 6 . 6 ) are shown in Figure 6, and fairly good agreement is also achieved between the present computations and Bush’s theory.

3. Results and Discussion

3.1. Problem Set-Up

A typical sphere–cone blunt body, with a nose radius of 50 mm and a half cone angle of 12 is employed for numerical simulations, and the total length of the blunt body is 1.5 m. The dipole magnet is adopted, pointing against the direction of incoming flow, and the distribution of magnetic field follows the expression given as Equation (15), where B 0 is the magnetic field intensity at a distance r 0 from the center of magnetic dipole on the polar axis. The dipole magnet is located at ( 0.07 , 0 ) , setting ( B 0 , r 0 ) to ( 1.5 , 0.07 ) . The spatial distribution of magnetic field intensity is shown in Figure 7, where the magnetic field line is represented by the solid black line. The freestream conditions are given in Table 1. The wall is set to be electrically insulated, non-catalytic, and isothermal with T W = 800 K. Since the model, the freestream conditions, and the magnetic field distribution are axisymmetric, the governing equations in axisymmetric form are employed to solve these hypersonic MHD flows.
B = B 0 [ cos θ ( r / r 0 ) 3 r + sin θ 2 ( r / r 0 ) 3 θ ]
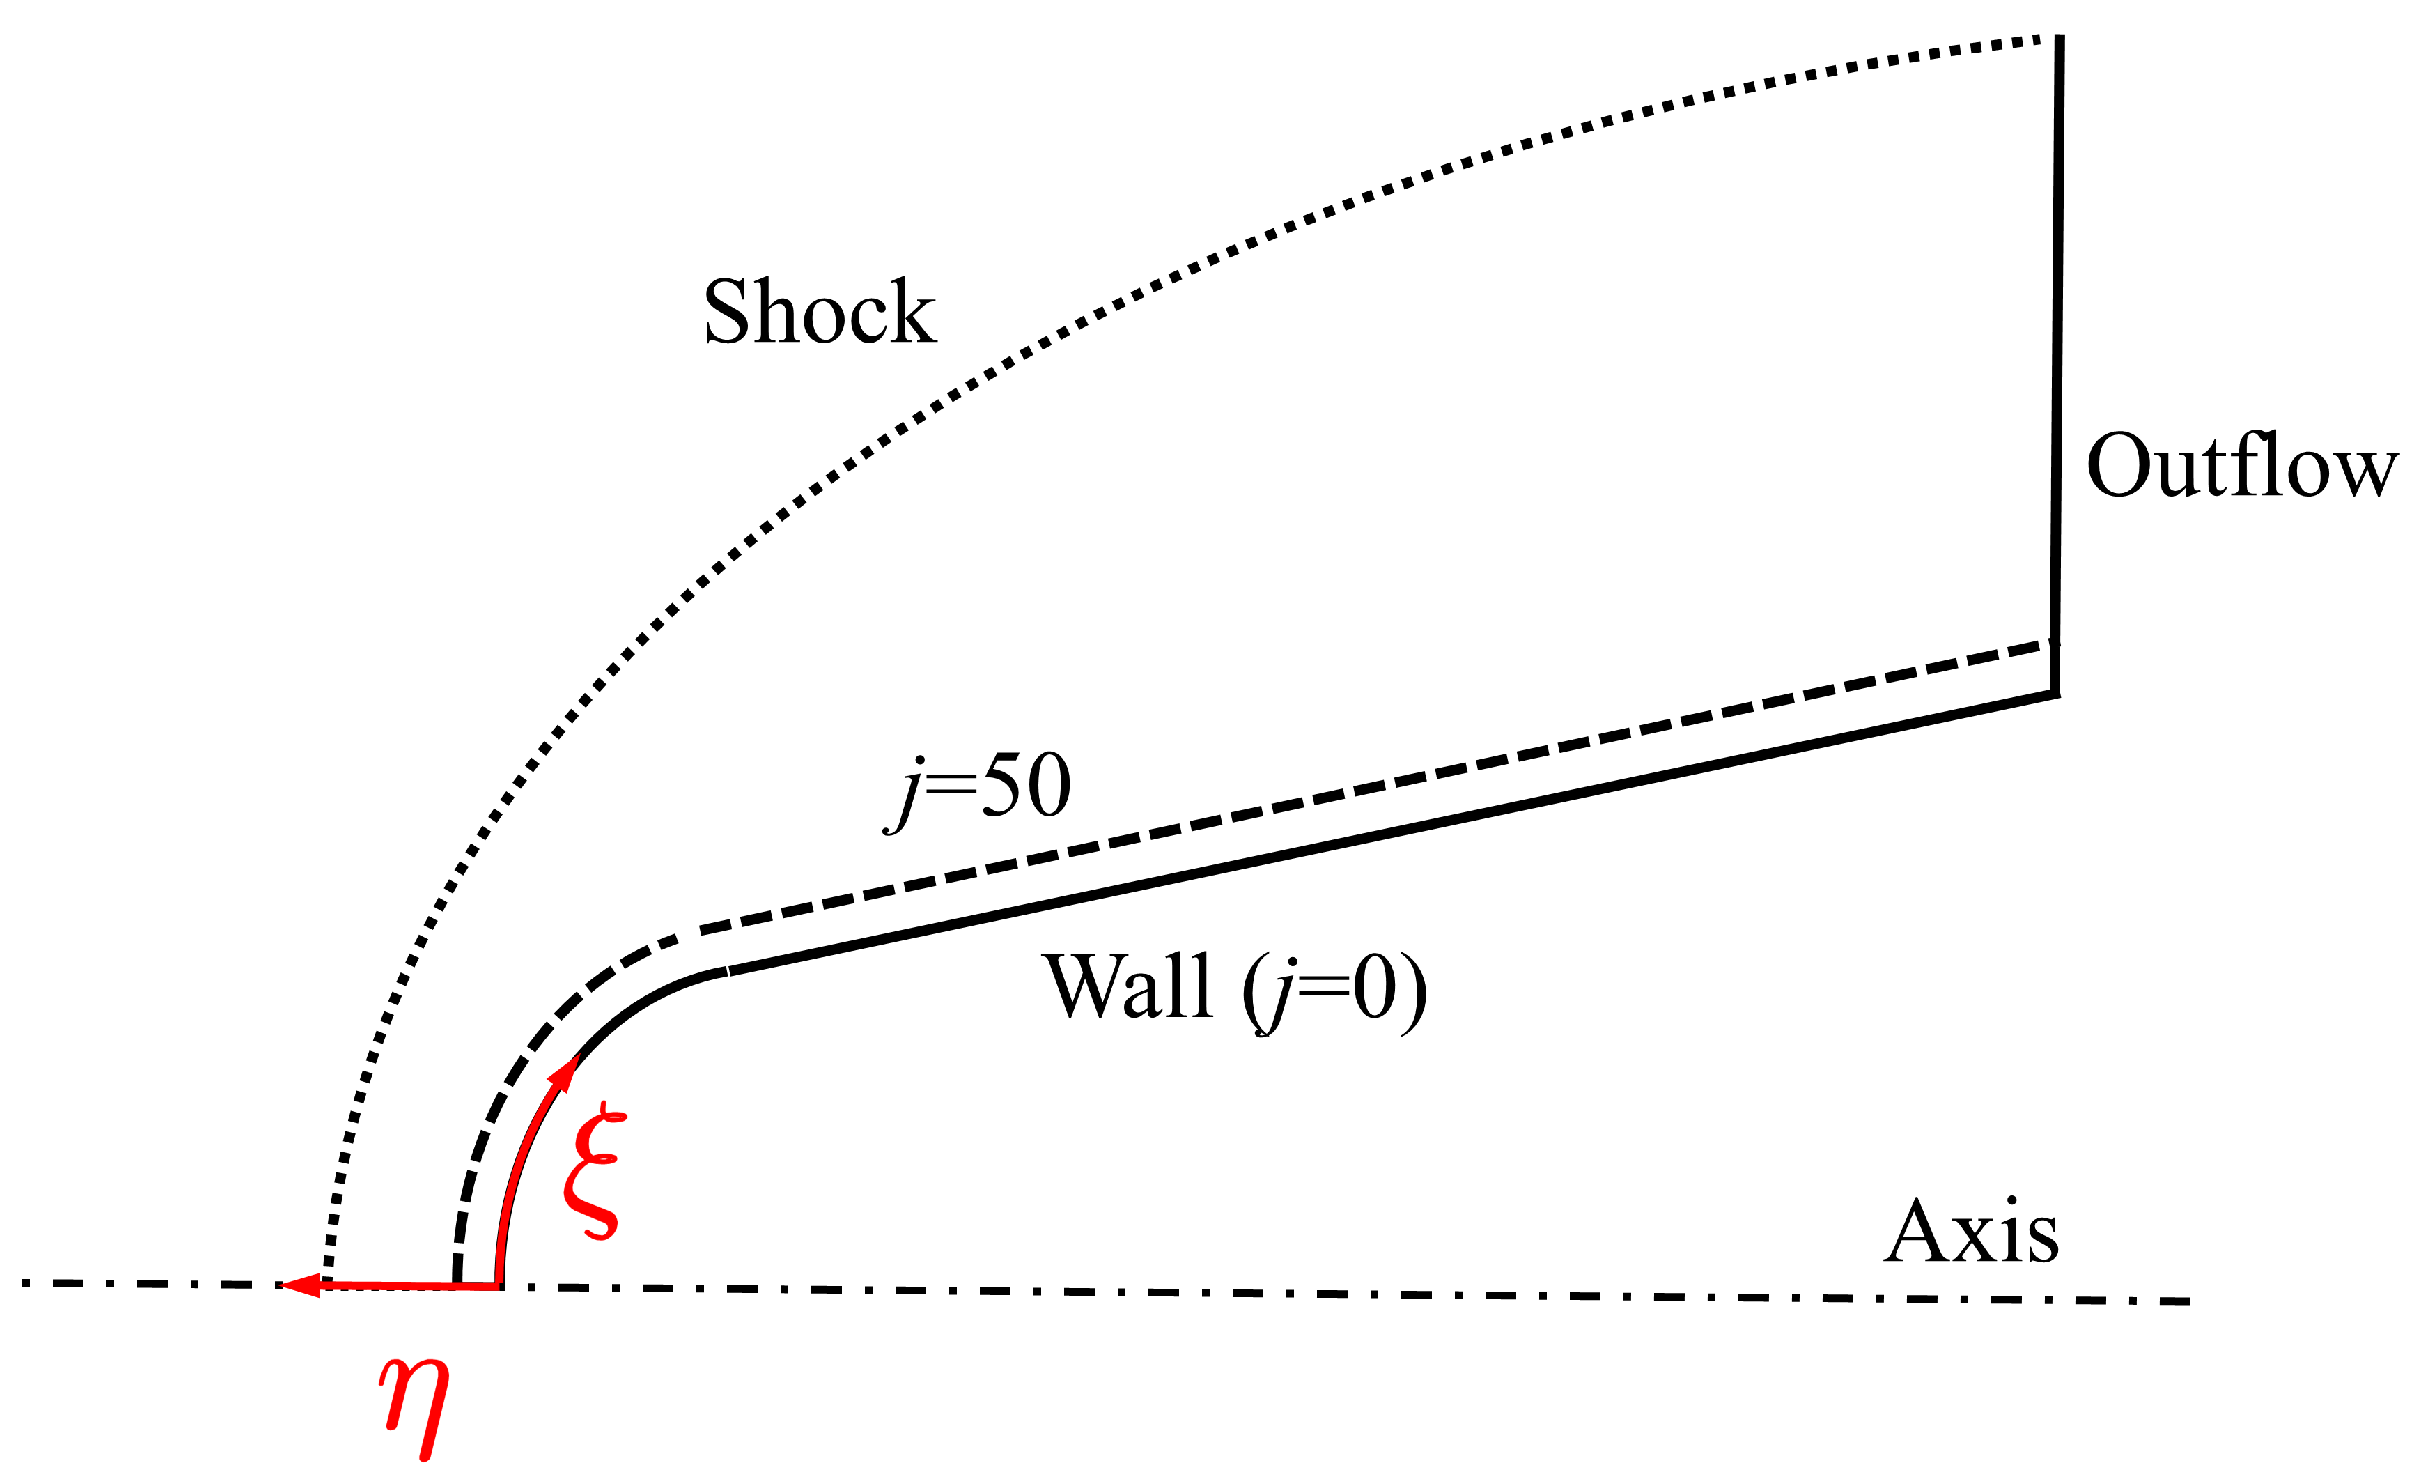
Two groups of numerical simulations are carried out, and the detailed set-ups of each case are shown in Table 2. The first group of cases A which consider the chemical nonequilibrium effect are the focus of this paper; the distribution of their surface heat flux will be analyzed in detail, and the corresponding flow mechanisms will be given later. The group of cases B are mainly designed to perform numerical experiments for analyzing the existing mechanism explanation which attributes the decrease in stagnation point heat flux to the increase in shock stand-off distance. These cases are based on the assumption of perfect gas, and the constant electrical conductivity model is employed with σ = 200 S/m. The difference between Case B1∼Case B3 is the distribution of electrical conductivity. Case B1 only sets the electrical conductivity in the near-wall region, Case B2 sets the electrical conductivity outside the near-wall region to the bow shock, and Case B3 sets the electrical conductivity in the entire region behind the shock. The diagram of each region is shown in Figure 8, where the j represents the grid line in the direction of η . The position of j = 50 is enlarged for the convenience of illustration; in fact, it is very close to the wall surface, which is in the same order as the thickness of boundary layer. Obviously, the group of cases B based on the perfect gas and constant electrical conductivity model are not consistent with the real physical scene, but they can still qualitatively reveal the interaction mechanisms between electromagnetic field and hypersonic flows.
Due to the different chemical kinetic models used, the flow fields of the cases of Group A and Group B are also different, especially the position of the detached bow shock. For accurate simulation of each case, mesh A and mesh B are used for the simulation of Group A and Group B, respectively; the meshes of their head regions are shown in Figure 9. In order to accurately calculate the surface heat flux, the grid height in the direction of η near the wall is set to 1 × 10 6 m for both meshes. Mesh A densifies the mesh at the two positions where the bow shock wave appears, the grid height in the direction of η near the shock wave is set to 1 × 10 4 m, and it has 300 points in the direction of ξ and 150 points in the direction of η ; mesh B densifies the mesh within the range ( 0.02 ∼0 m) where the bow shock wave may appear, the grid height in the direction of η in this area is set to 2 × 10 4 m, and it has 200 points in the direction of ξ and 145 points in the direction of η .

3.2. Surface Heat Flux Distribution Considering Chemical Nonequilibrium Effect

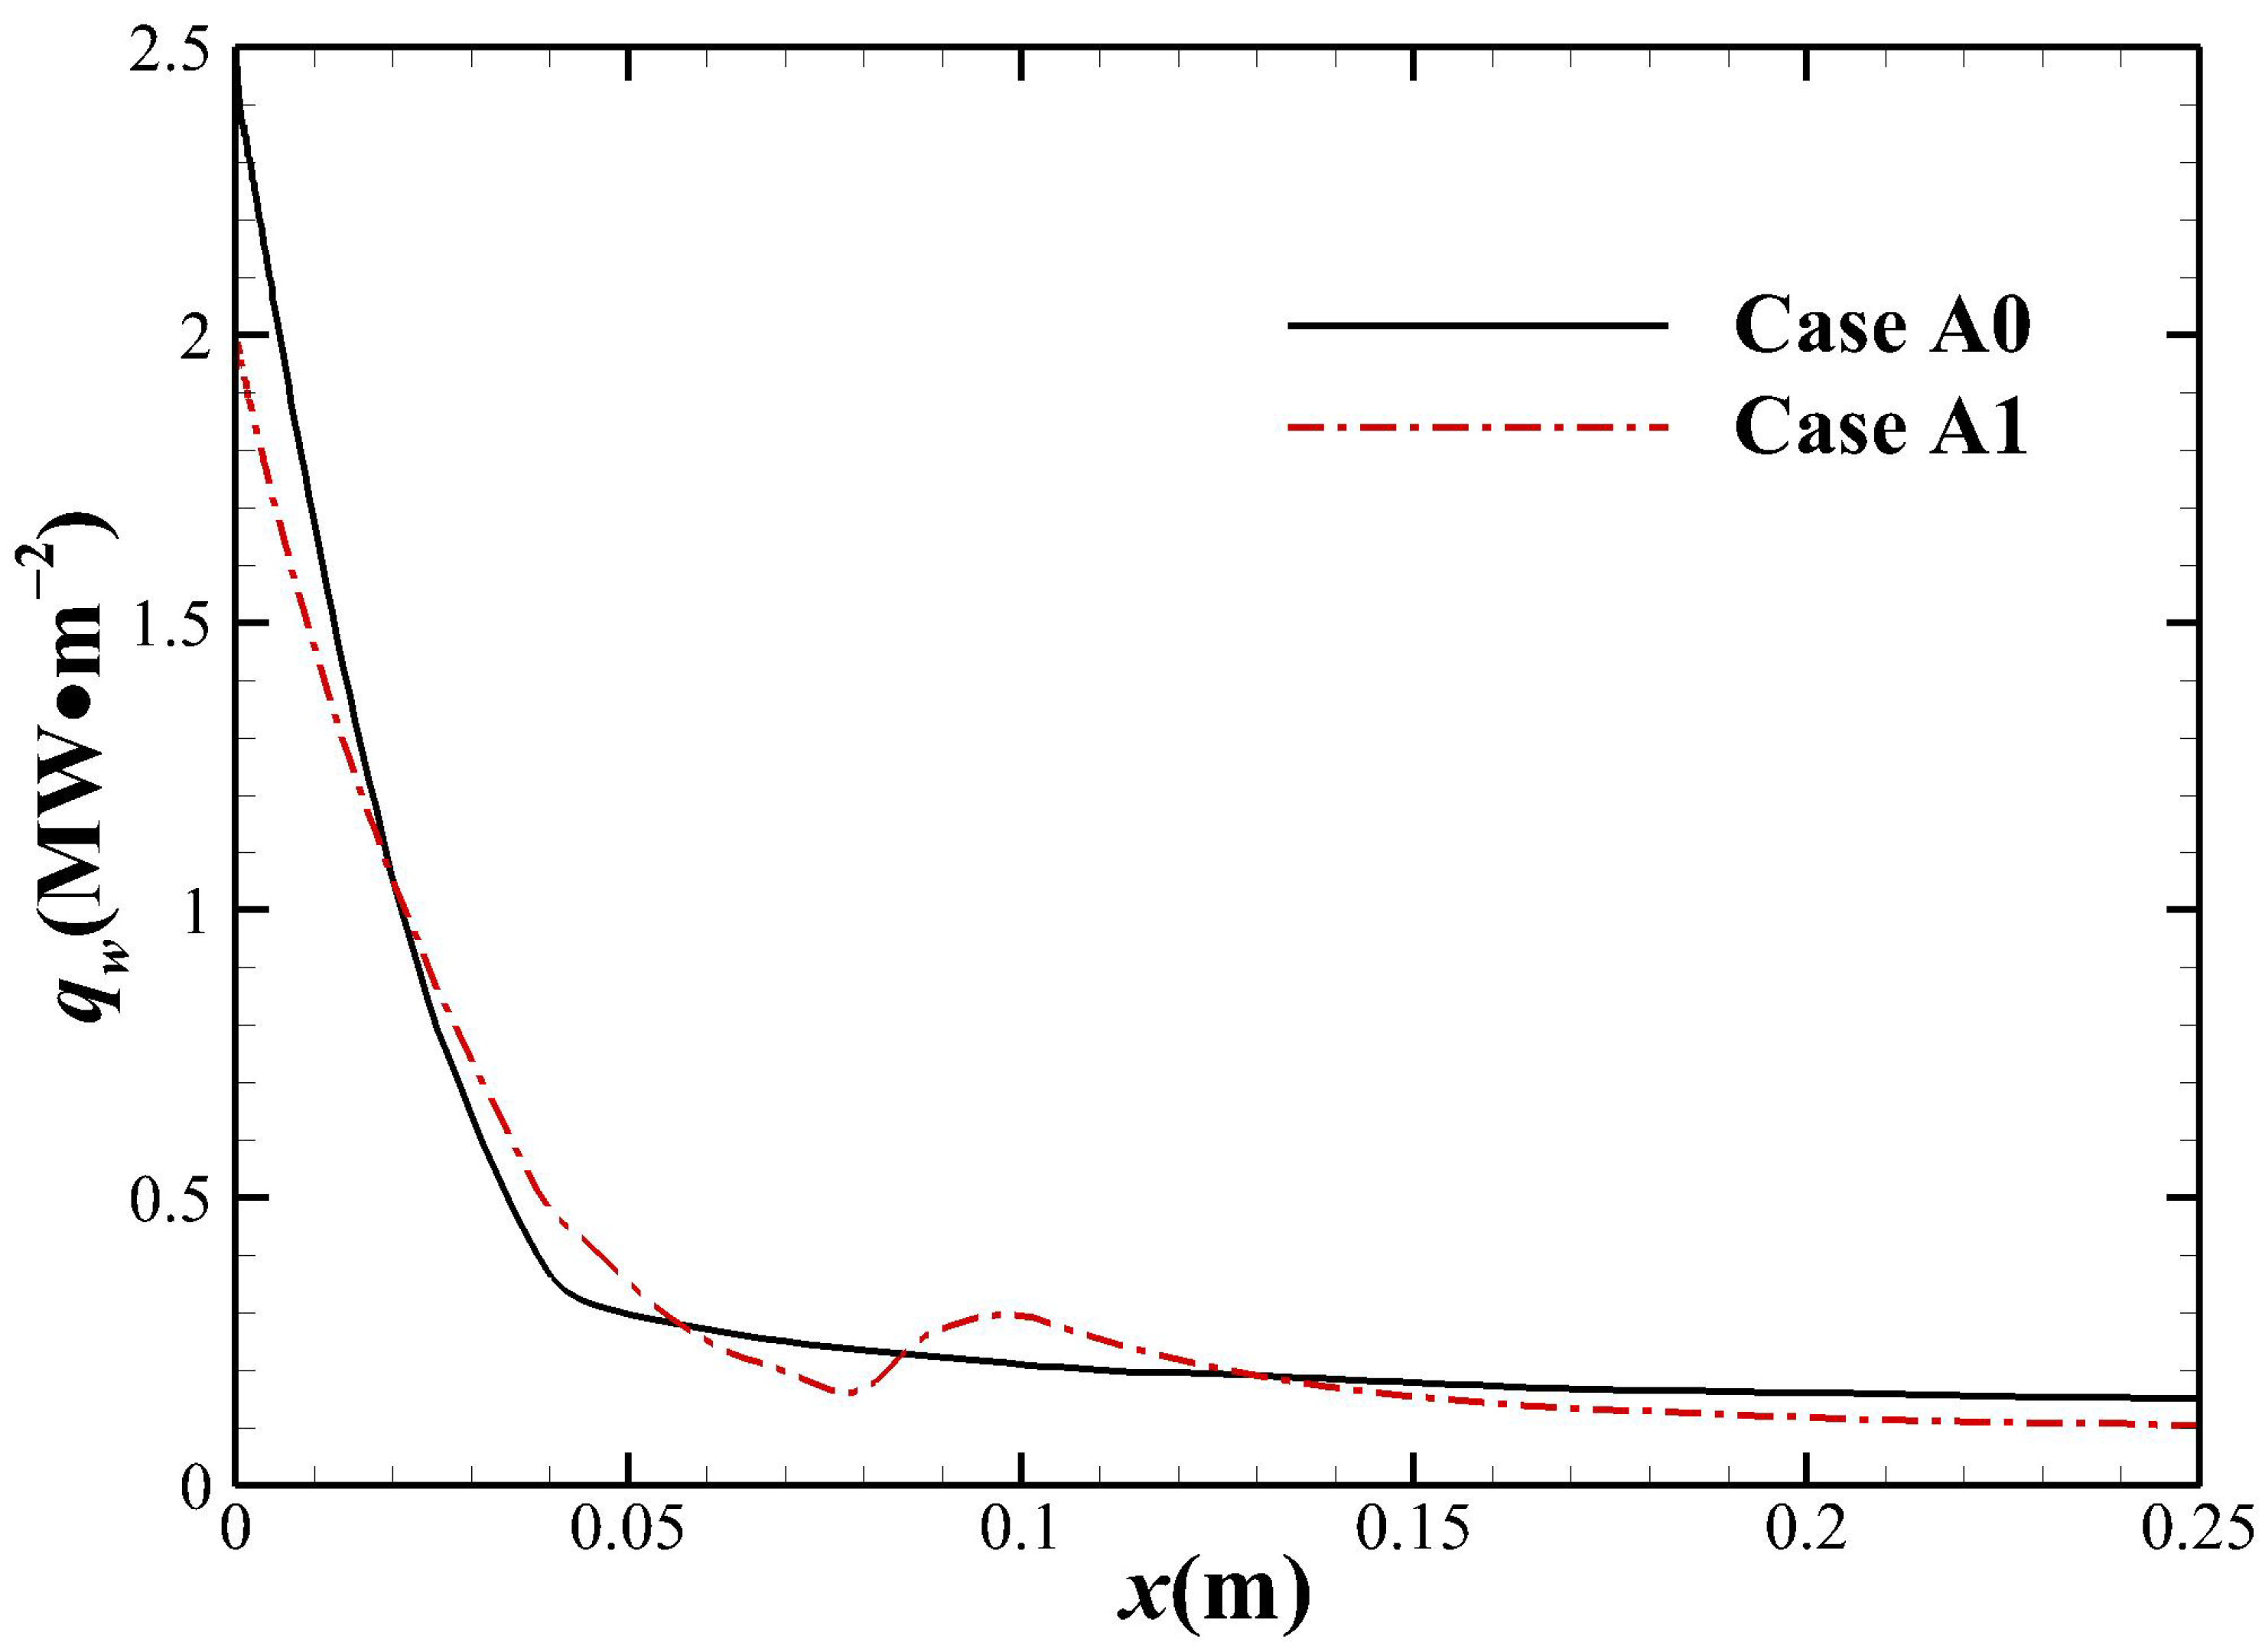
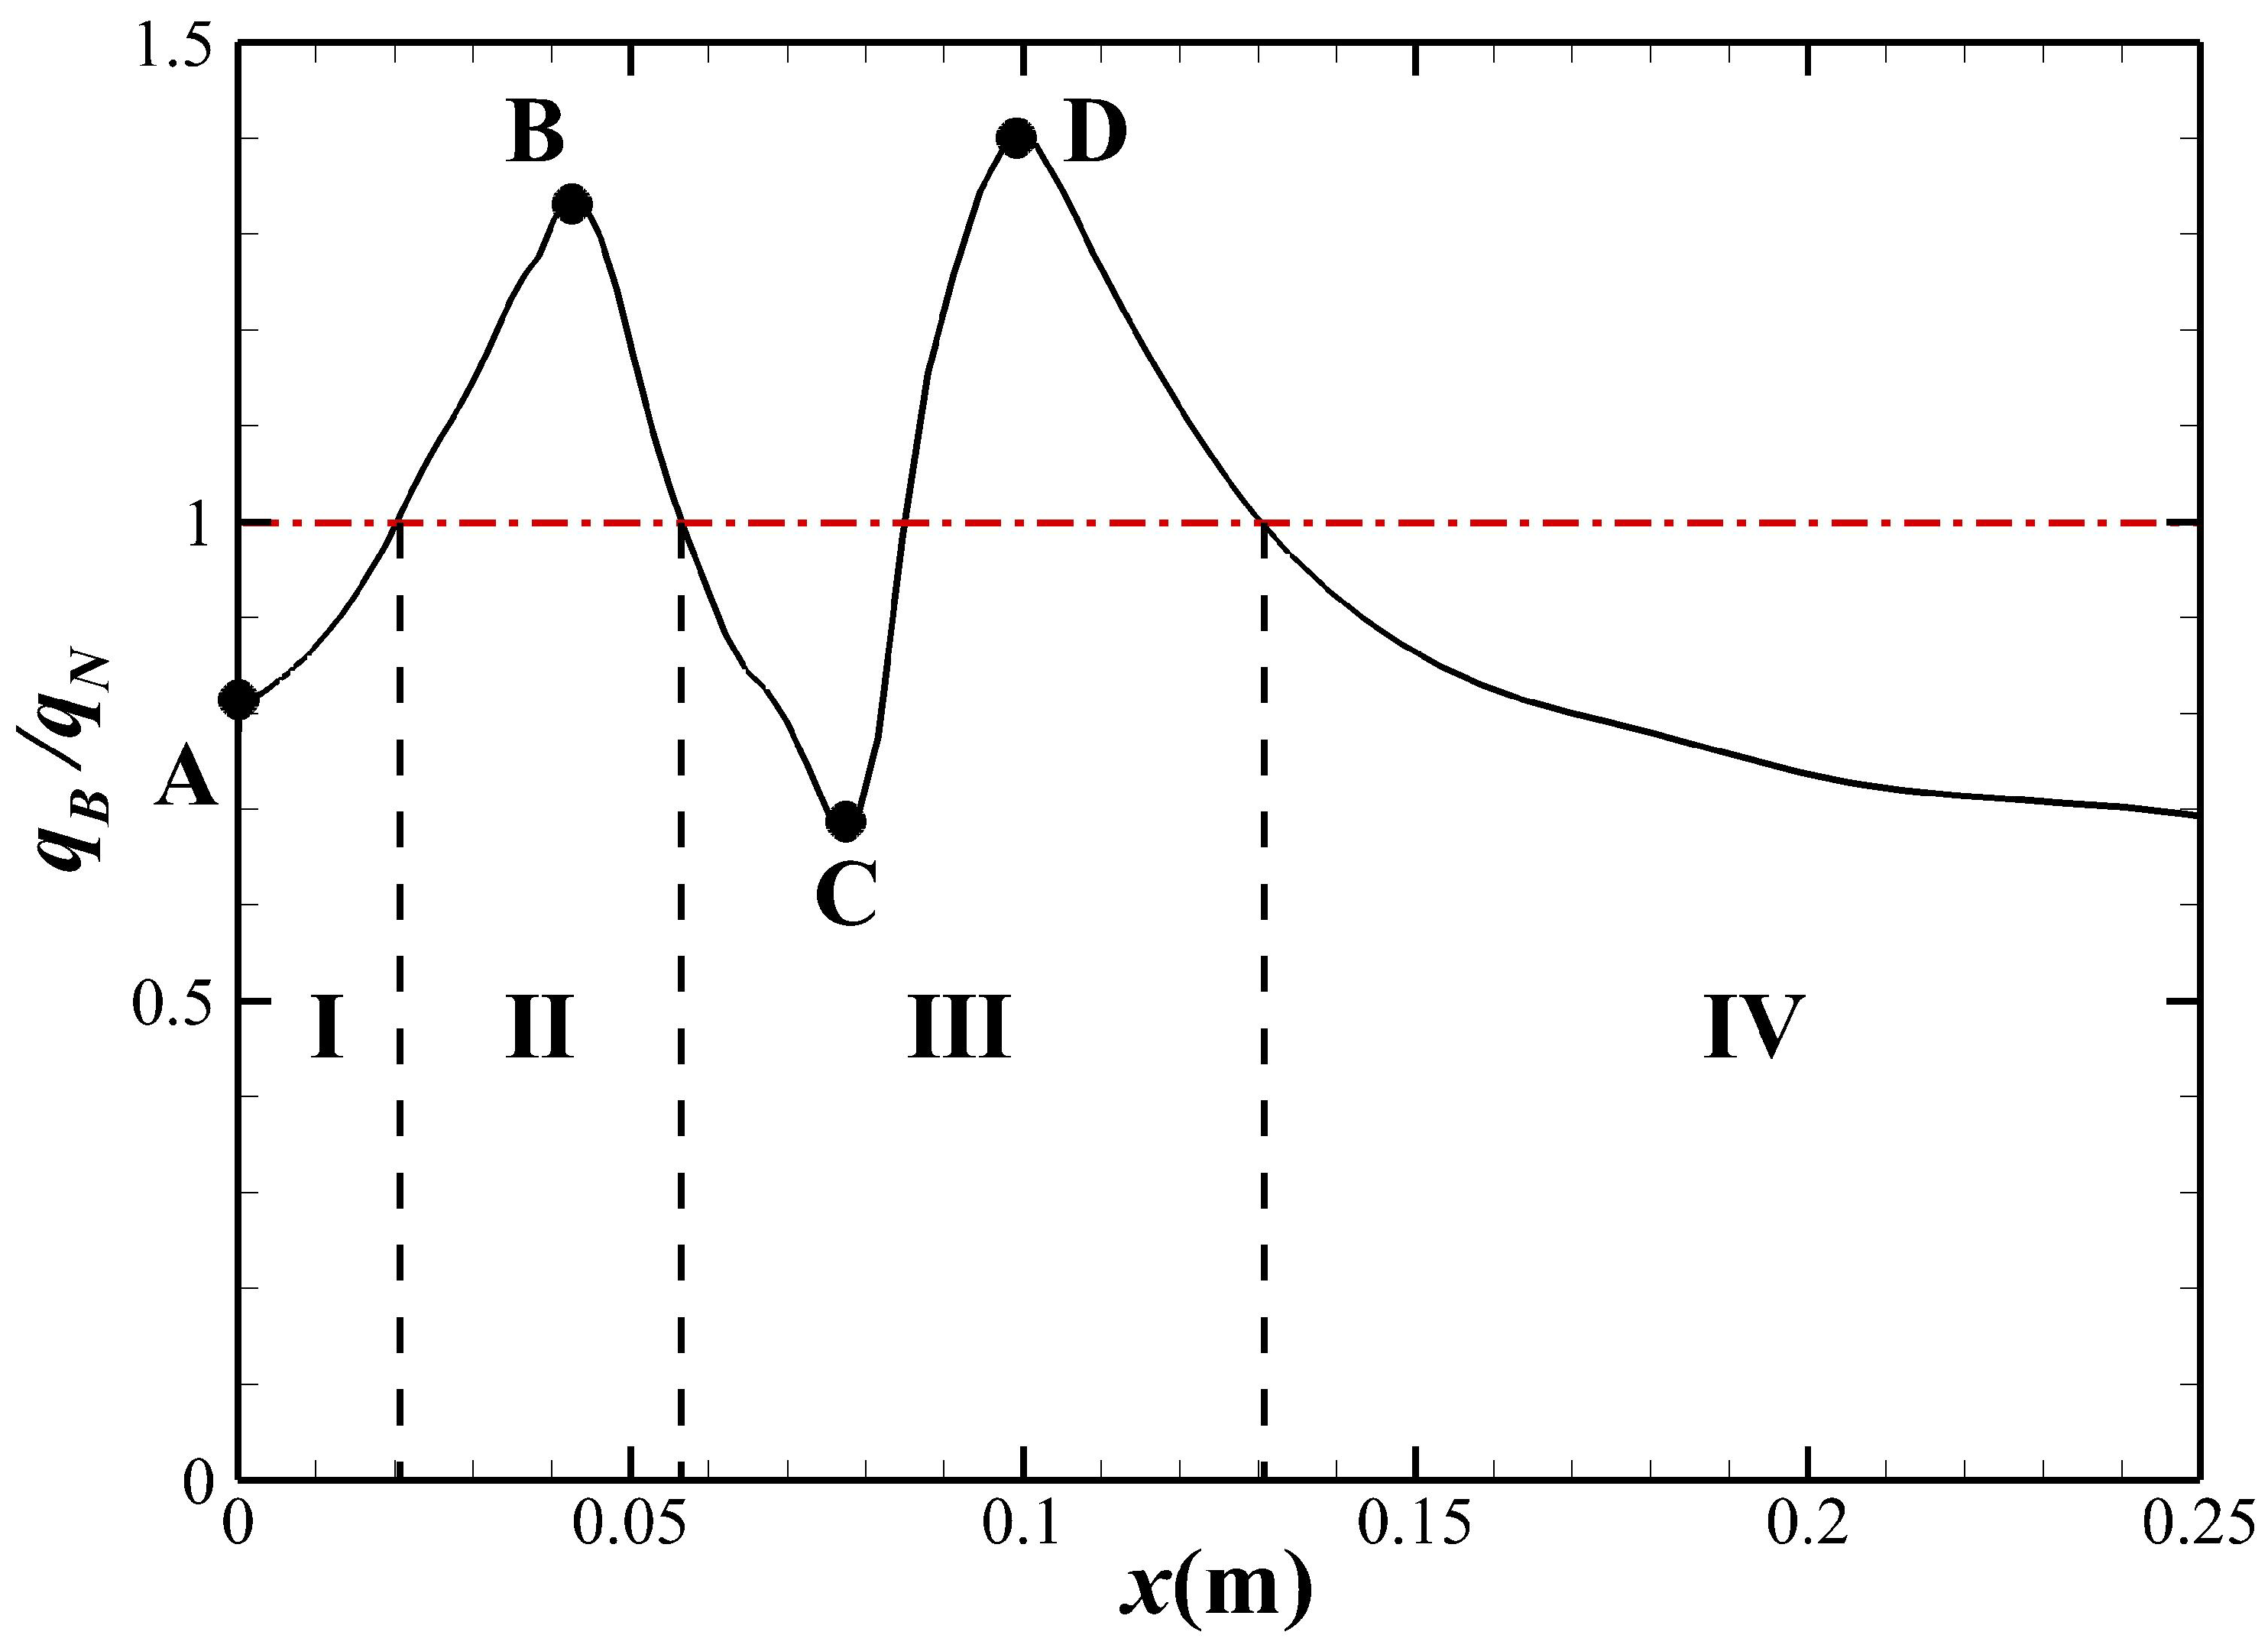
The flow field comparison with and without an external magnetic field (Case A0 and Case A1) is shown in Figure 10. It can be seen that the temperature in the shock layer increases slightly, while the shock stand-off distance is significantly increased under the effect of an external magnetic field. As shown in Figure 11, the surface heat flux distribution is changed significantly due to the external magnetic field. Further, the distribution of relative heat flux q B / q N is shown in Figure 12, where q B and q N are the surface heat flux with and without an external magnetic field, respectively. The red dotted line represents q B / q N = 1 , which can divide the wall into four zones shown in the figure. In Zone I , the surface heat flux is significantly reduced, and the drop at stagnation point reaches 18.7%. However, in Zone II , the shoulder region, the surface heat flux increases instead, and the rise at point B reaches 33.7%. After that, the new trough C and peak D of q B / q N appear in Zone III . In Zone IV , q B / q N is always less than 1, which indicates that the external magnetic field can still effectively reduce heat flux in this region. From the above results of relative heat flux distribution, it can be concluded that the external magnetic field can indeed effectively reduce the heat flux at stagnation point, but it may increase heat flux in the downstream area of stagnation point. The above phenomena suggest that the influencing mechanism of external magnetic field on the surface heat flux may differ in different zones of the blunt body.

3.3. Flow Mechanisms Analysis in Different Regions

3.3.1. Stagnation Point Region

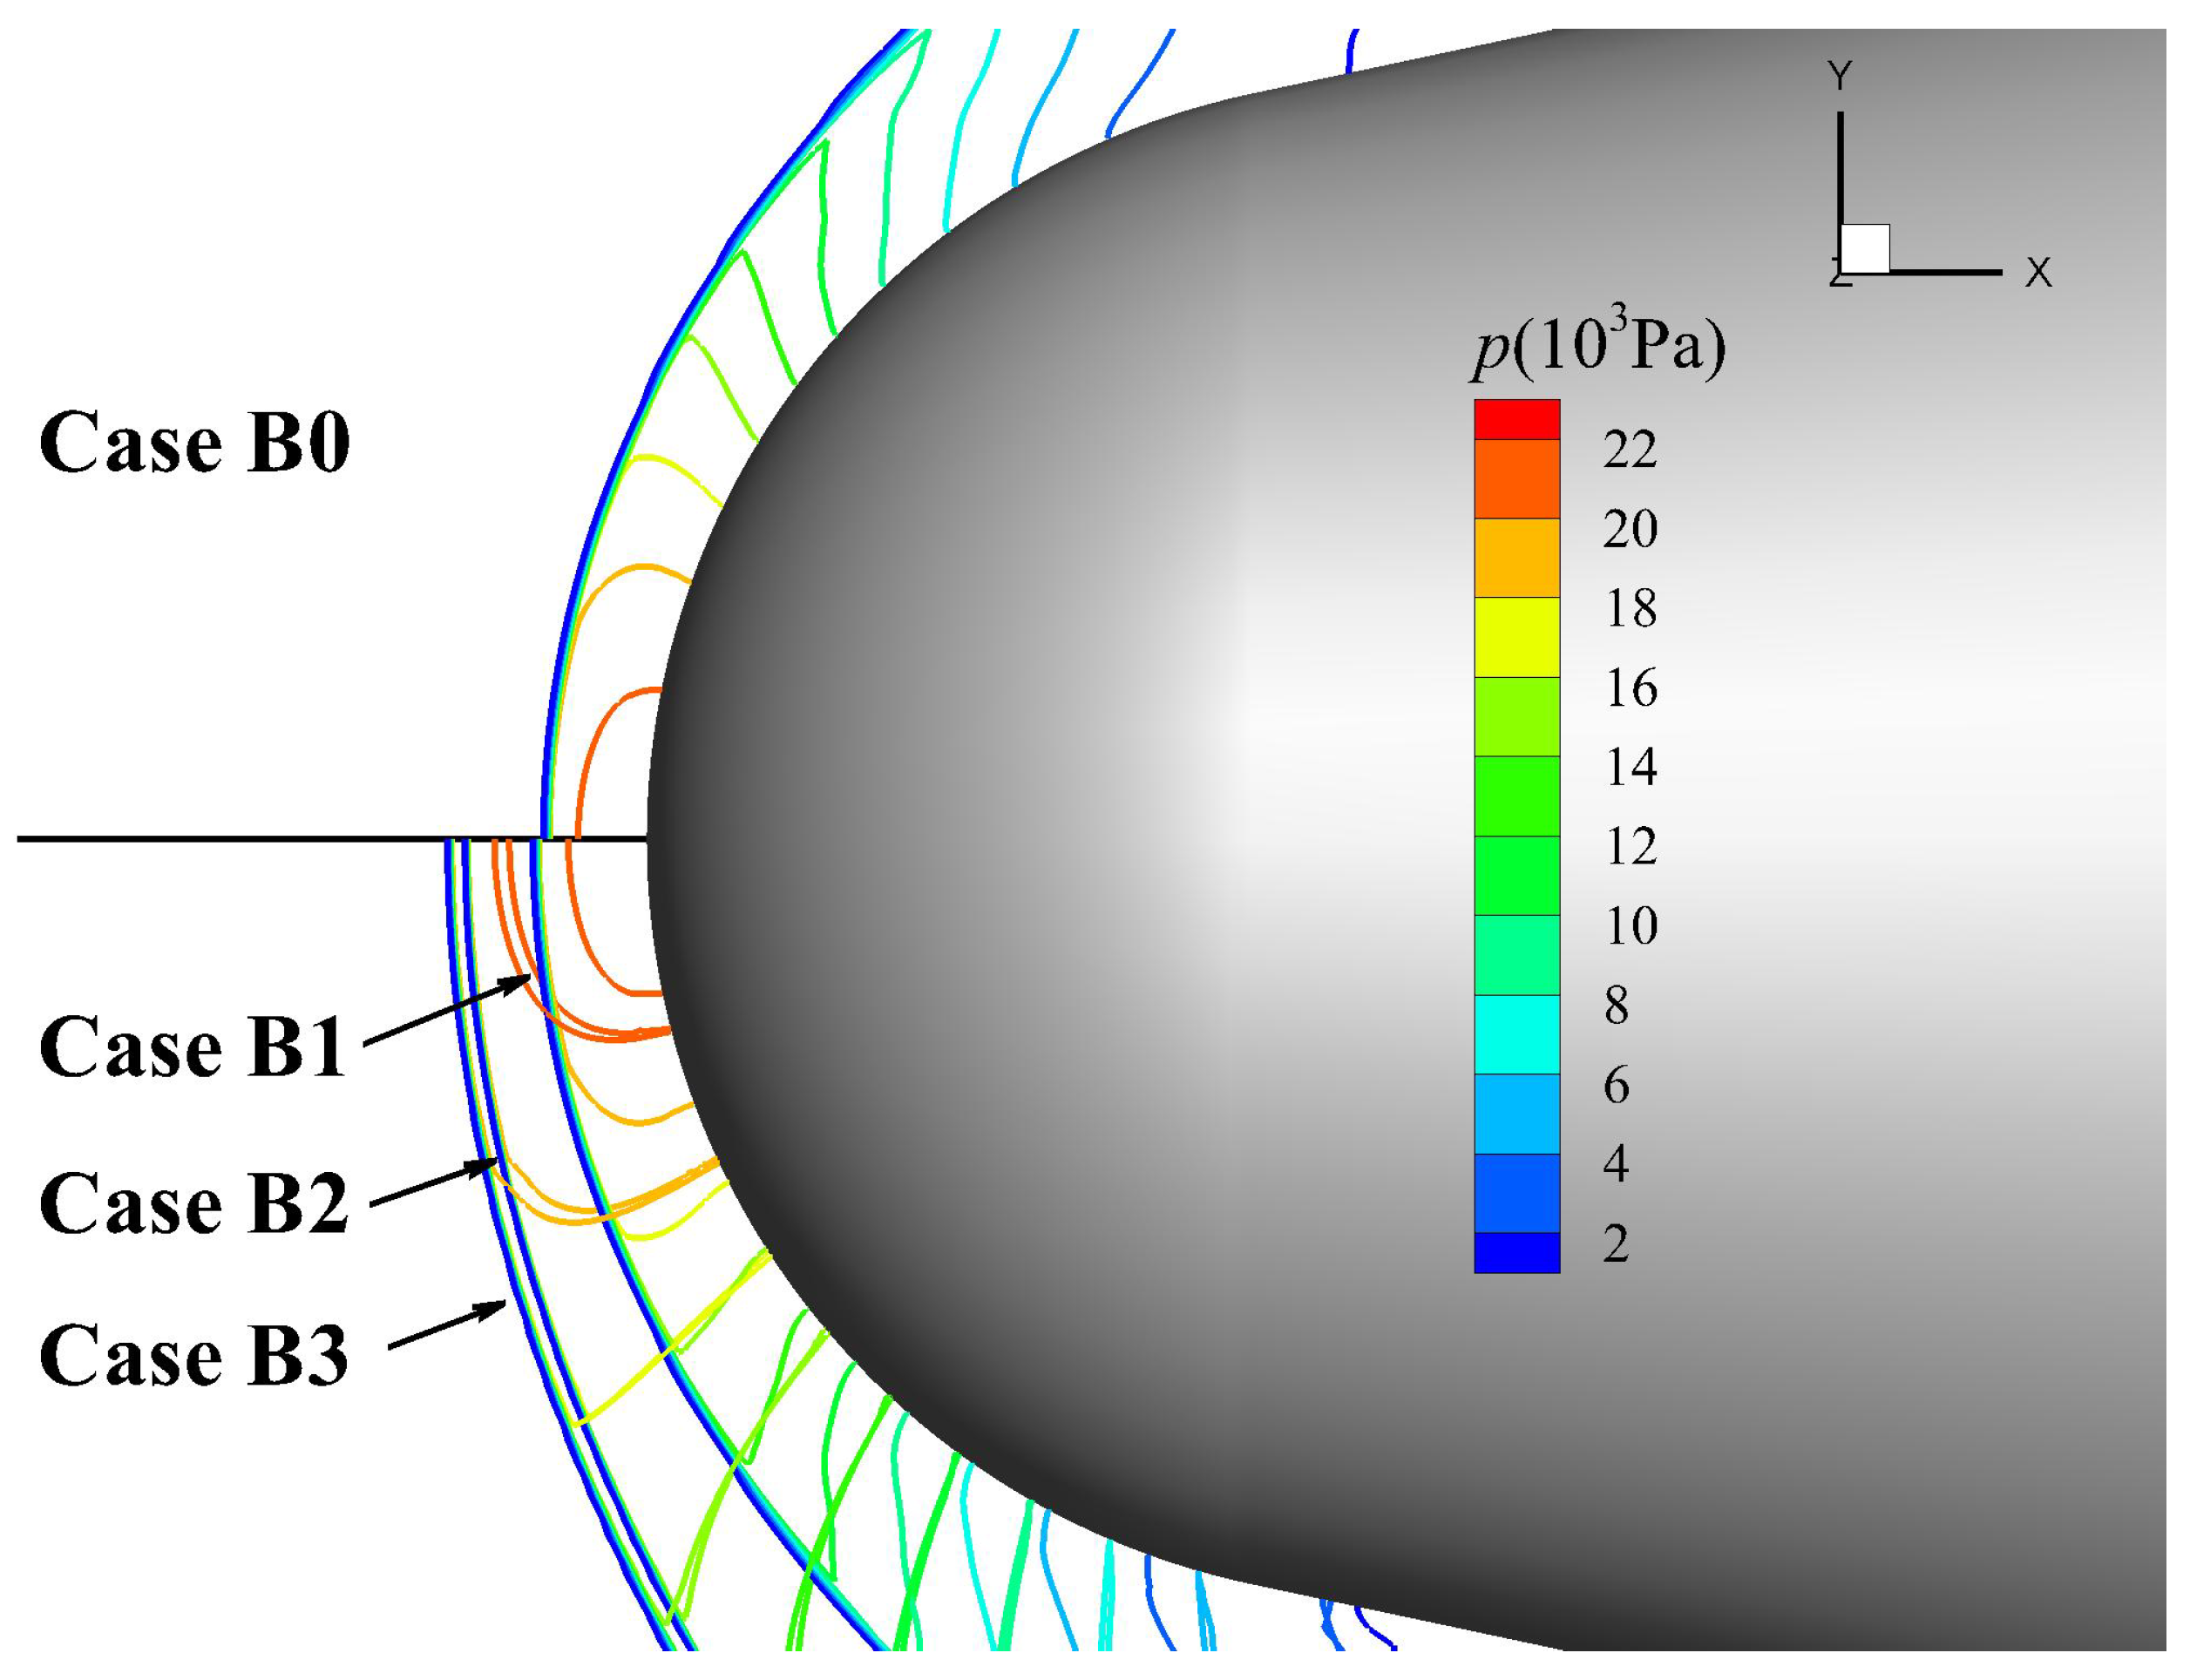
As mentioned in the Introduction, the current mainstream view generally attributes the reduction of stagnation point heat flux to increase of shock stand-off distance due to the external magnetic field. This section will discuss whether this explanation is correct by the result of numerical experiments corresponding to the cases of Group B, the set-ups of which are shown in Table 2. These cases investigate the effect of magnetic interaction when it acts in different regions. Figure 13 is the pressure contours of Group B cases. It can be seen that there are significant differences in the shock stand-off distance when constant electrical conductivity is added in different regions. The shock stand-off distance increase rate (SDIR ) and heat flux decrease rate (HFDR) of each case are shown in Table 3. The SDIR and HFDR are defined by Equations (16) and (17), where Δ B and Δ N o M H D are the shock stand-off distance with and without the external magnetic field, respectively, while q B 0 and q N 0 are the stagnation point heat flux with and without the external magnetic field, respectively.
S D I R = Δ B Δ N o M H D Δ N o M H D × 100 %
H F D R = q N 0 q B 0 q N 0 × 100 %
It can be seen from Table 3 that SDIR and HFDR have a lack of sufficient correlation under the external magnetic field. SDIR of Case B2 is significantly larger than that of Case B1, but both HFDRs are similar. SDIRs of Cases B2 and B3 are similar, but the HFDR of Case B3 is about twice that of Case B2. Therefore, from the results, there is no direct relationship between the increase in shock stand-off distance and the decrease in stagnation point heat flux. It can also be seen from the table that the shock stand-off distance of Cases B2 and B3 are relatively close, which indicates that the magnetic interaction in the inviscid flow outside the near-wall region is the main reason for the increase in shock stand-off distance. The physical reason is as follows: the temperature behind the shock will increase under the effect of external magnetic field as shown in Figure 13, which then leads to an increase in the speed of sound behind the shock and thus to an increase in the shock stand-off distance.
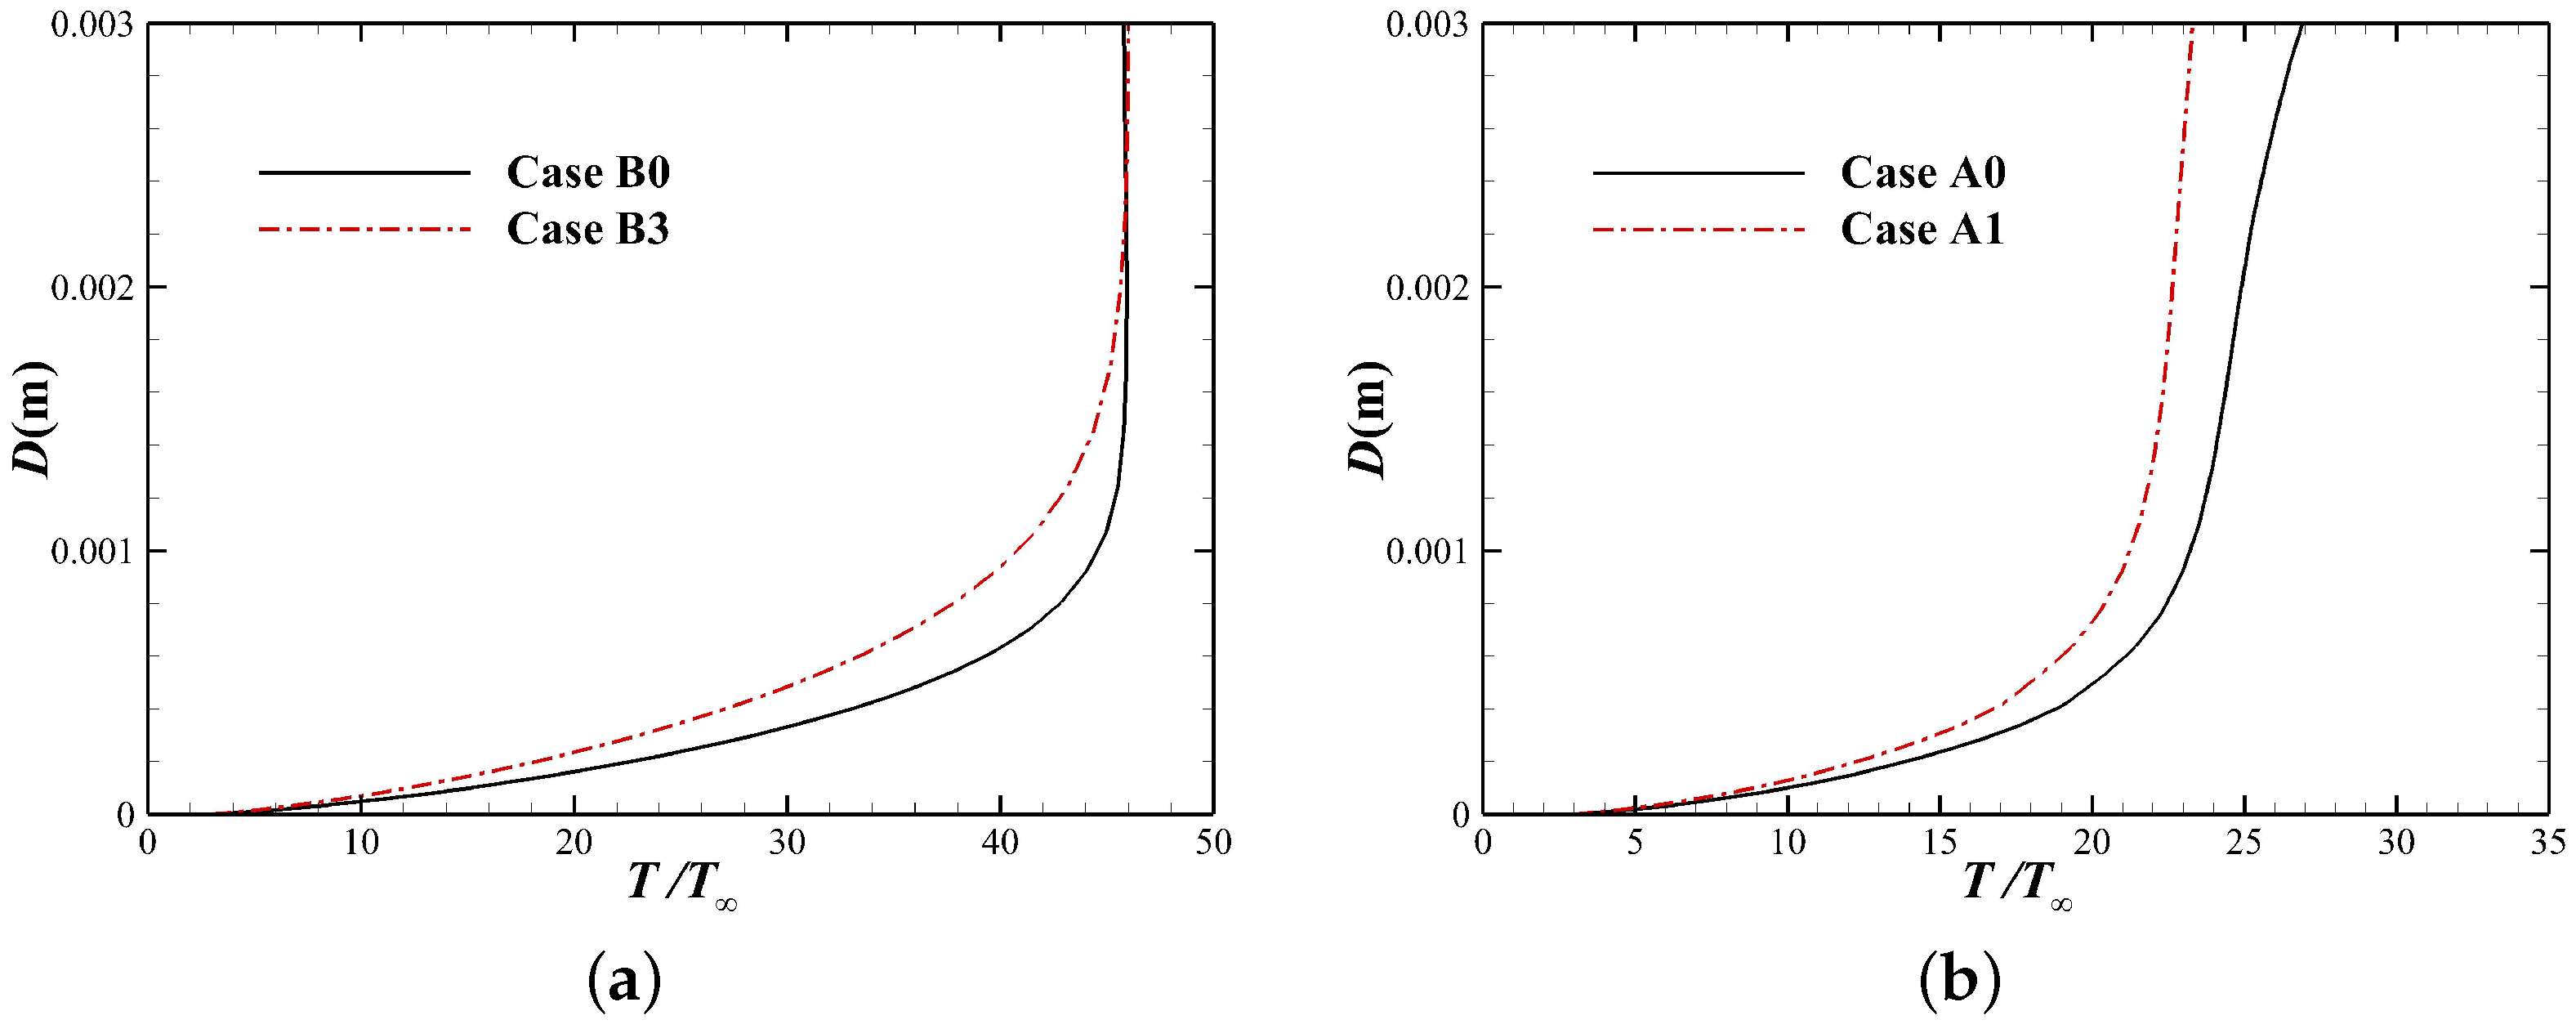
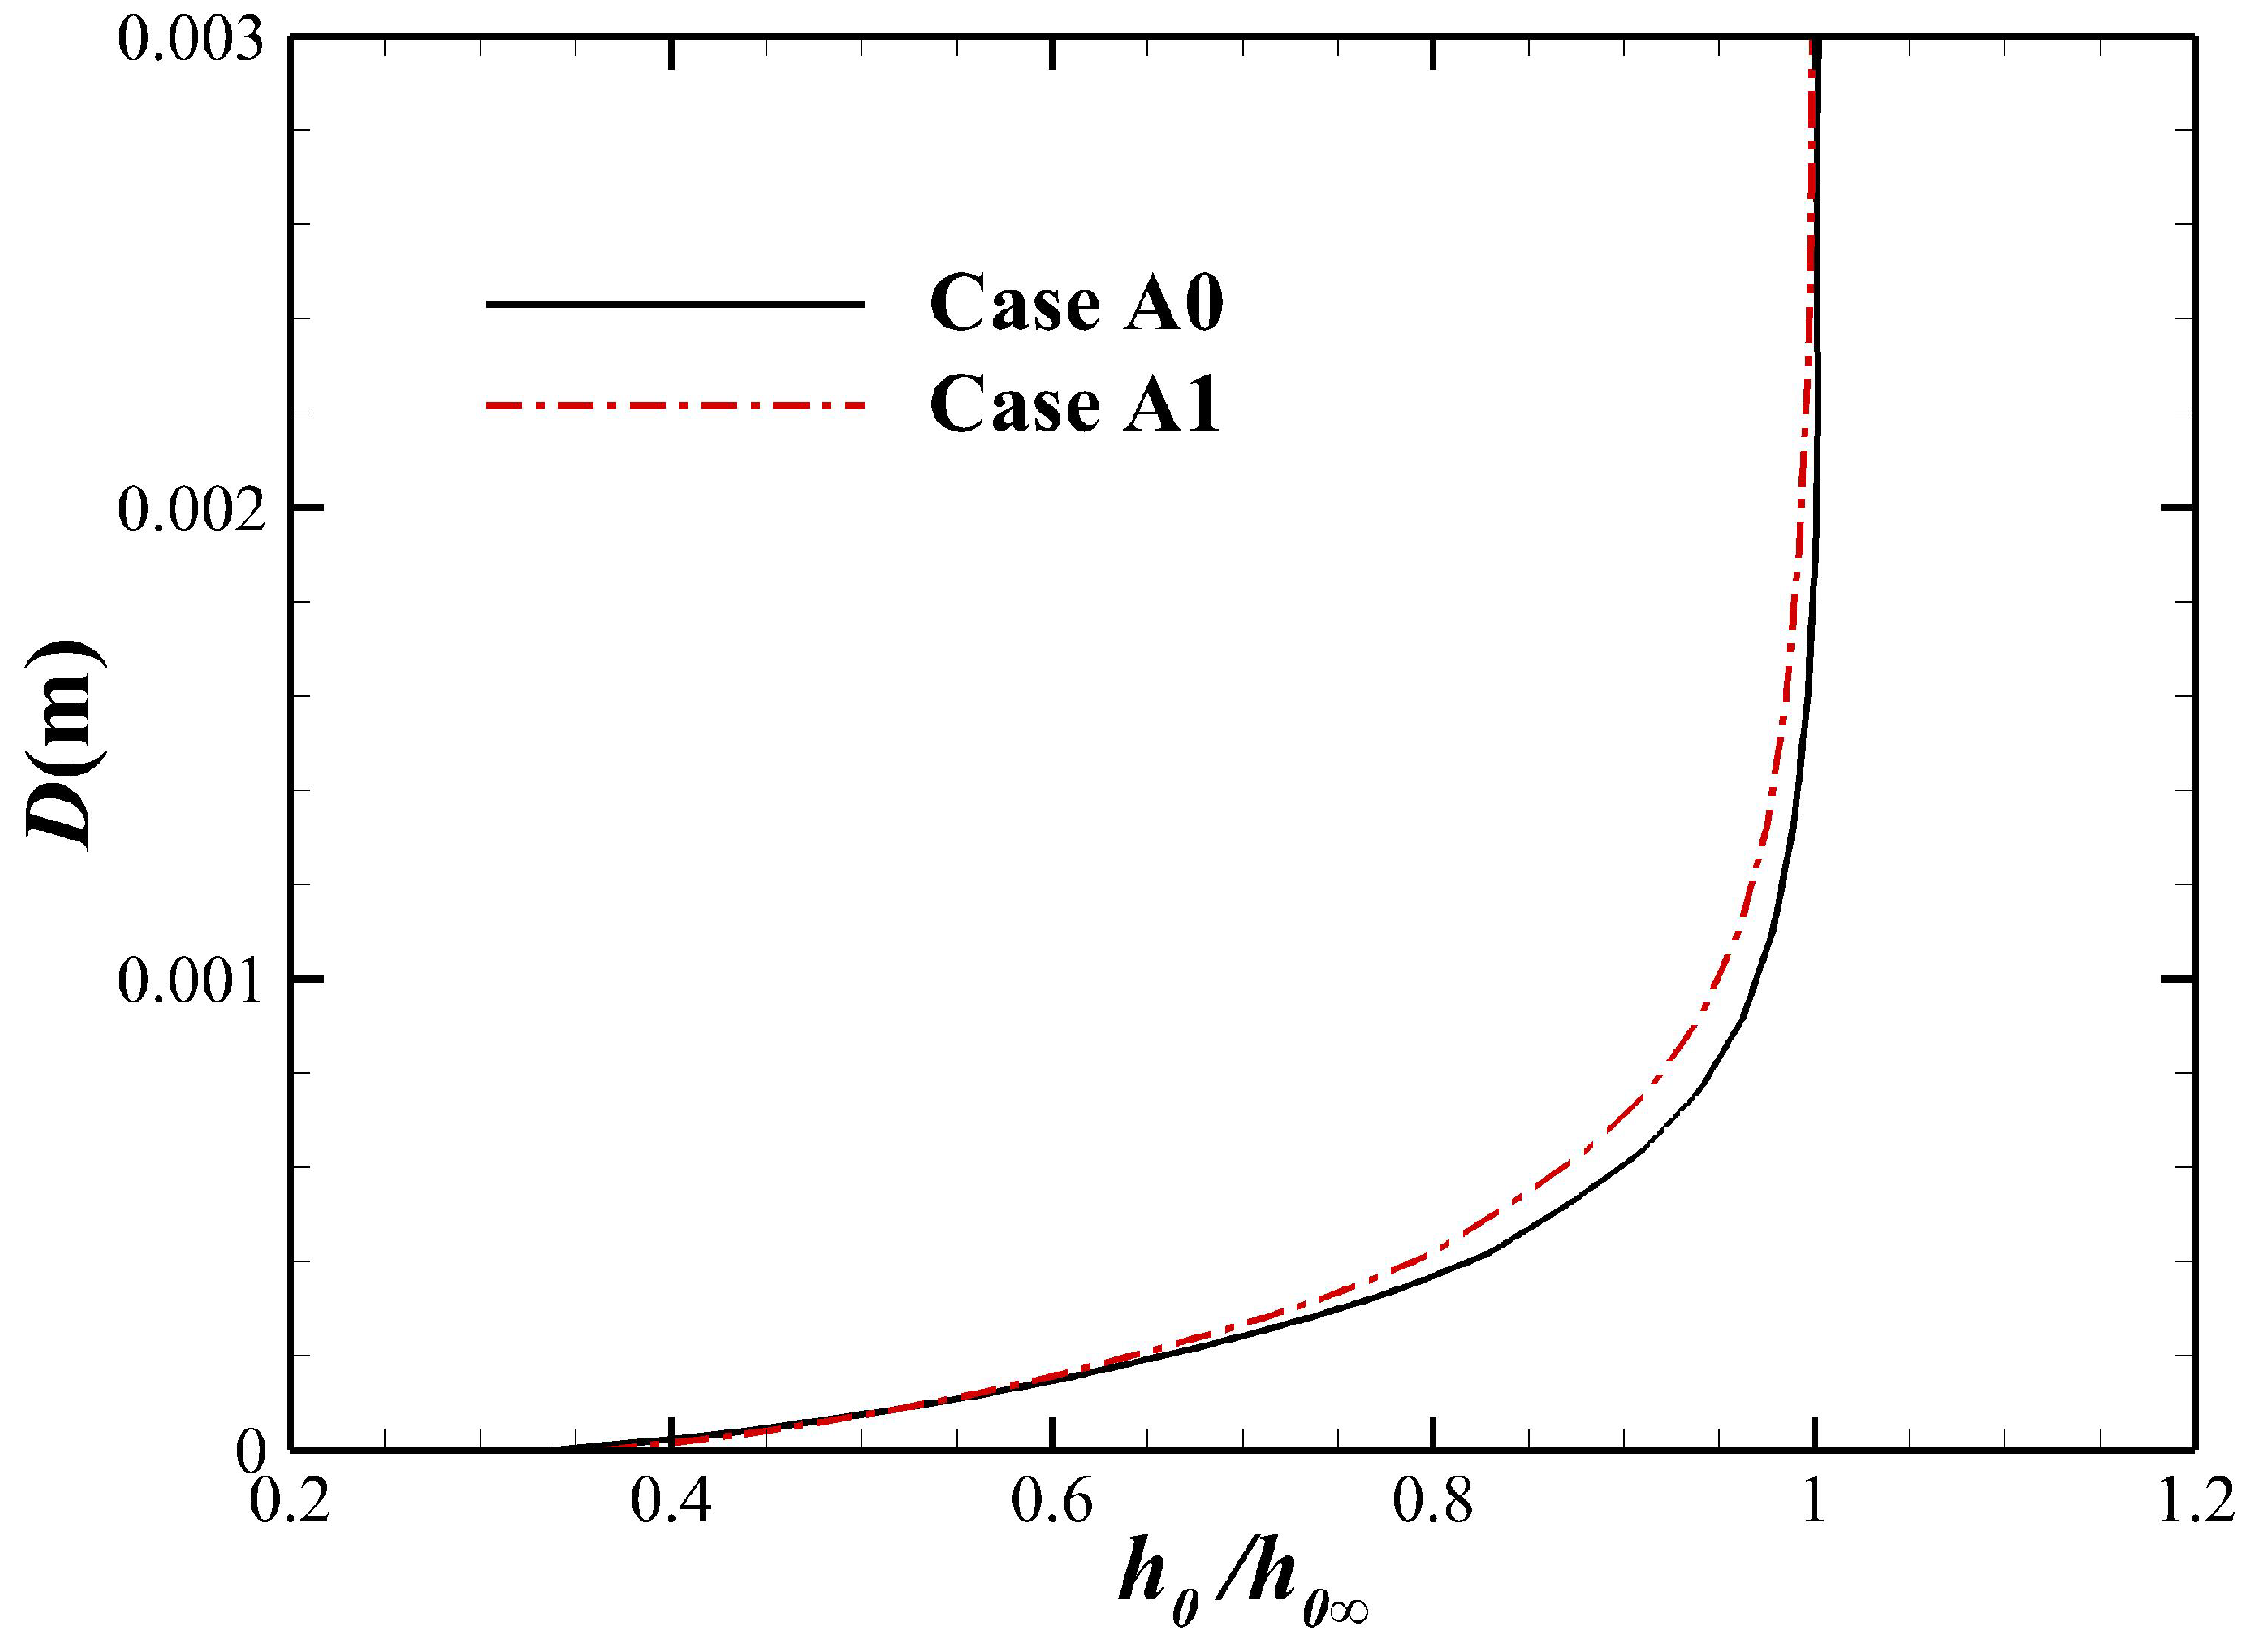
In fact, the Lorentz force can be decomposed into two components: the counter-flow Lorentz force along the streamline and the normal one perpendicular to the streamline, where the counter-flow component will decelerate the flow within the entire shock layer, which is equivalent to an additional inverse pressure gradient in the boundary layer downstream near the stagnation point, and this inverse pressure gradient will lead to an increase in the boundary layer thickness. Figure 14 shows the temperature boundary layer profiles at stagnation point under the perfect gas and chemical nonequilibrium model, respectively. It can be seen that the increase of boundary layer thickness significantly reduces the surface temperature gradient. Moreover, Figure 15 shows the total enthalpy boundary layer profile at stagnation point when the chemical nonequilibrium effect is considered, and the increase in boundary layer thickness can be seen more clearly.
In summary, the decrease in stagnation point heat flux by the external magnetic field is not directly related to the increase in the shock stand-off distance. The increase in boundary layer thickness due to the effect of the counter-flow Lorentz force is the main reason.

3.3.2. Zone I and Zone II

As shown in Figure 12, the HFDR caused by external magnetic field in Zone I gradually decreases as it progresses downstream from the stagnation point, and there is even an increase in the surface heat flux in Zone II , which indicates that there may also be a negative effect mechanism of external magnetic field on the reduction of aerodynamic heating. Now two stations are selected along the surface, as shown in Figure 9. Station 1 is located in Zone I , corresponding to x = 0.0116 m on the sphere, and Station 2 coincides with point B, located at x = 0.0420 m on the cone. By analyzing the flow state at the two stations, further influencing mechanisms of the external magnetic field on the surface heat flux are investigated.
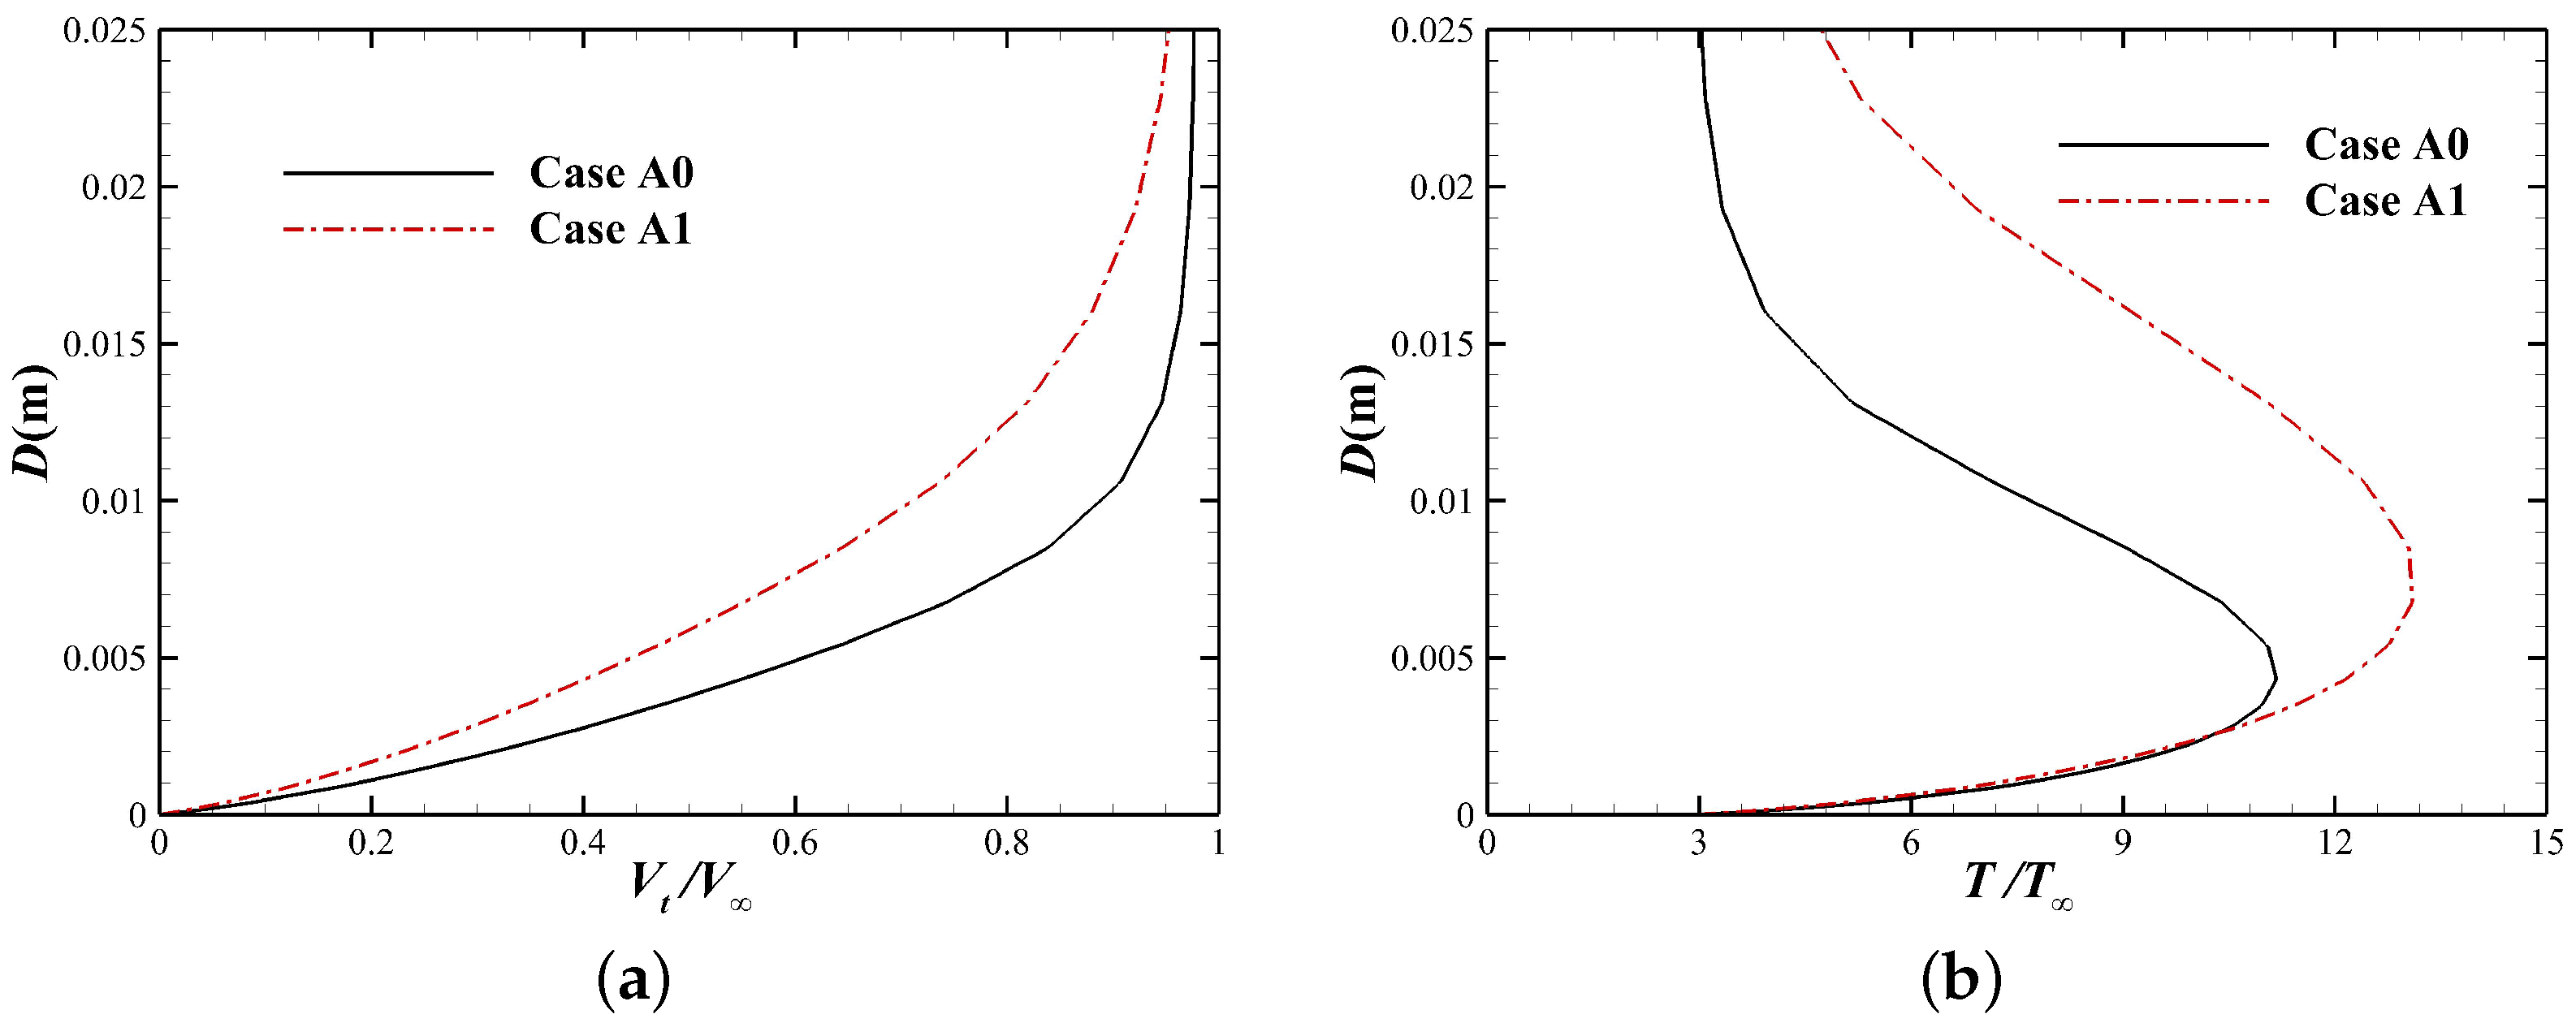
The electromagnetic source terms in Equation (4) can be written in the form as Equation (18), which indicates that the energy introduced by external electromagnetic field is divided into two parts, which are the work done by Lorentz force on fluid elements and the Joule heating generated from electrical current. The Lorentz force is equivalent to adding a new dissipation mechanism in the flow: that is, the counter-flow Lorentz force decelerates the fluid elements behind the shock, and the reduced kinetic energy will be totally converted to internal energy through Joule heating at the condition of E = 0 , leading to an increase in the static temperature of the fluid elements. This physical process is referred to as ‘electromagnetic dissipation’ in this paper, which will have a significant effect on both the velocity and temperature distribution within the boundary layer.
E · J = J × B · u + J · J σ
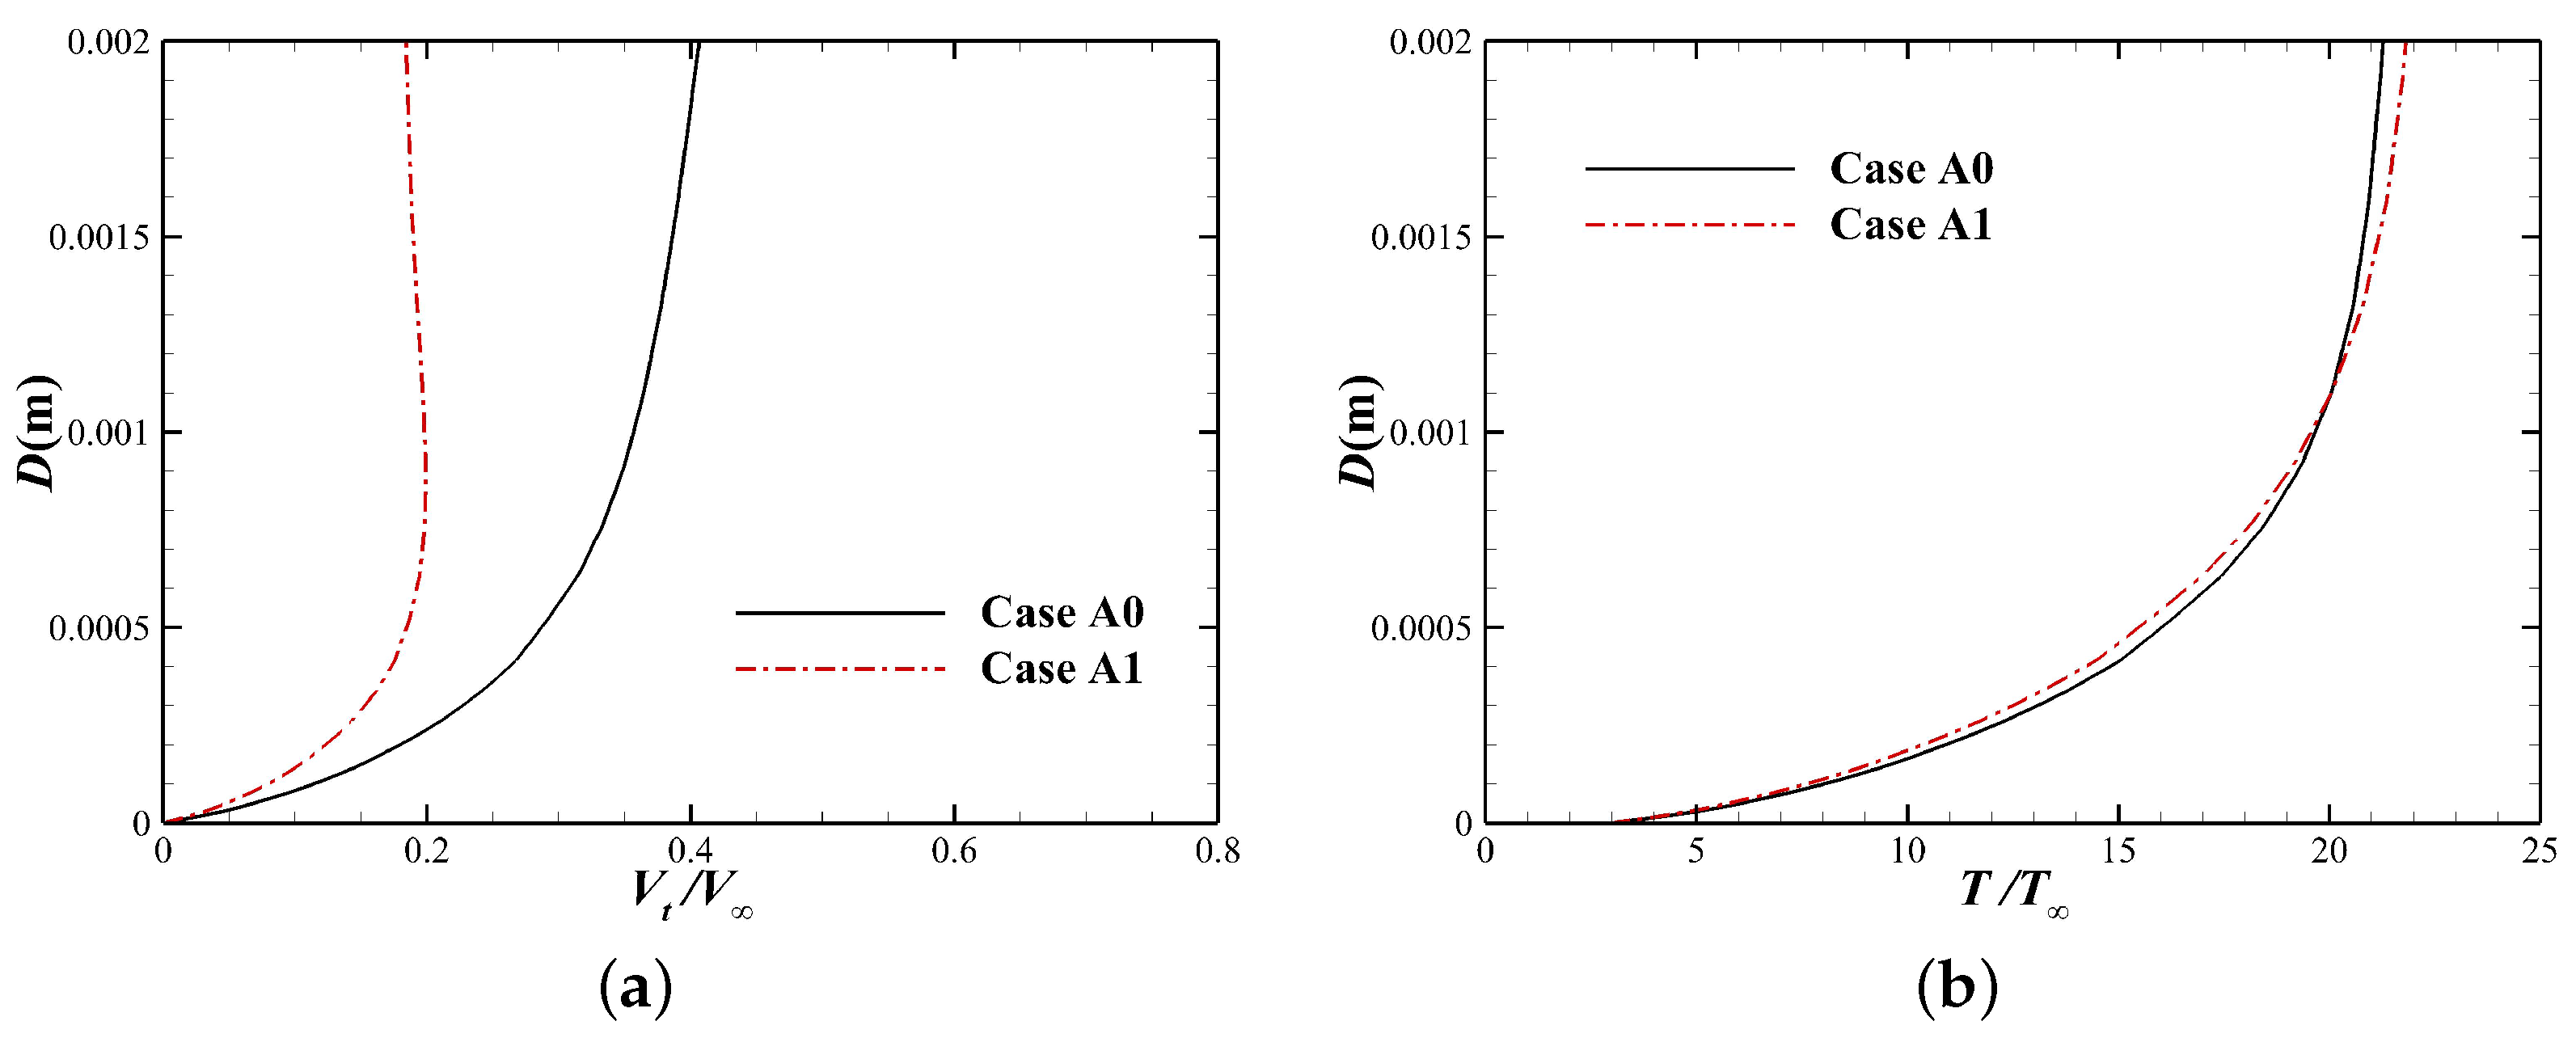
The velocity and temperature profiles in the boundary layer at Station 1 are shown in Figure 16, where the tangential velocity is given as Equation (19). It can be seen that, under the effect of electromagnetic dissipation, the velocity at the outer edge of boundary layer decreases significantly, and the static temperature of inviscid flow increases slightly. Although the static temperature at the outer edge of boundary layer has increased for this station, the surface heat flux still decreases by 11.28%. Figure 17 shows further downstream boundary layer profiles at Station 2, which can be found that the electromagnetic dissipation effect becomes stronger at this station, with a greater decrease in tangential velocity and a more significant increase in static temperature for the inviscid flow. Obviously, the increase in boundary layer thickness caused by the external magnetic field is no longer the dominant factor affecting the surface heat flux. In contrast, the increase in static temperature of the inviscid flow caused by Joule heating becomes the dominant factor, which increases the temperature gradient in the boundary layer significantly, resulting in an increase in surface heat flux. It can also be seen that due to the substantial increase in the temperature of the inviscid flow, the electrical conductivity and the Lorentz force outside the boundary layer will also increase, making the inviscid flow velocity smaller than the velocity in boundary layer, that is, the so-called “Speed Overshoot” phenomenon [40].
V t = u · sin θ + v · cos θ , i f t h e S t a t i o n i s o n t h e b a l l u · sin 78 + v · cos 78 , i f t h e S t a t i o n i s o n t h e c o n e
From the above discussion, it can be concluded that there are two opposing mechanisms to influence the surface heat flux by external magnetic field in Zone I and II , and the final result depends on the competition between two mechanisms. Evidently, in the region of stagnation point and Zone I , the dominant mechanism is the increase of boundary layer thickness, which leads to a decrease in surface heat flux, while in Zone II region, the Joule heating caused by the electromagnetic dissipation is the dominant factor, thus causing the surface heat flux increase instead.

3.3.3. Zone III

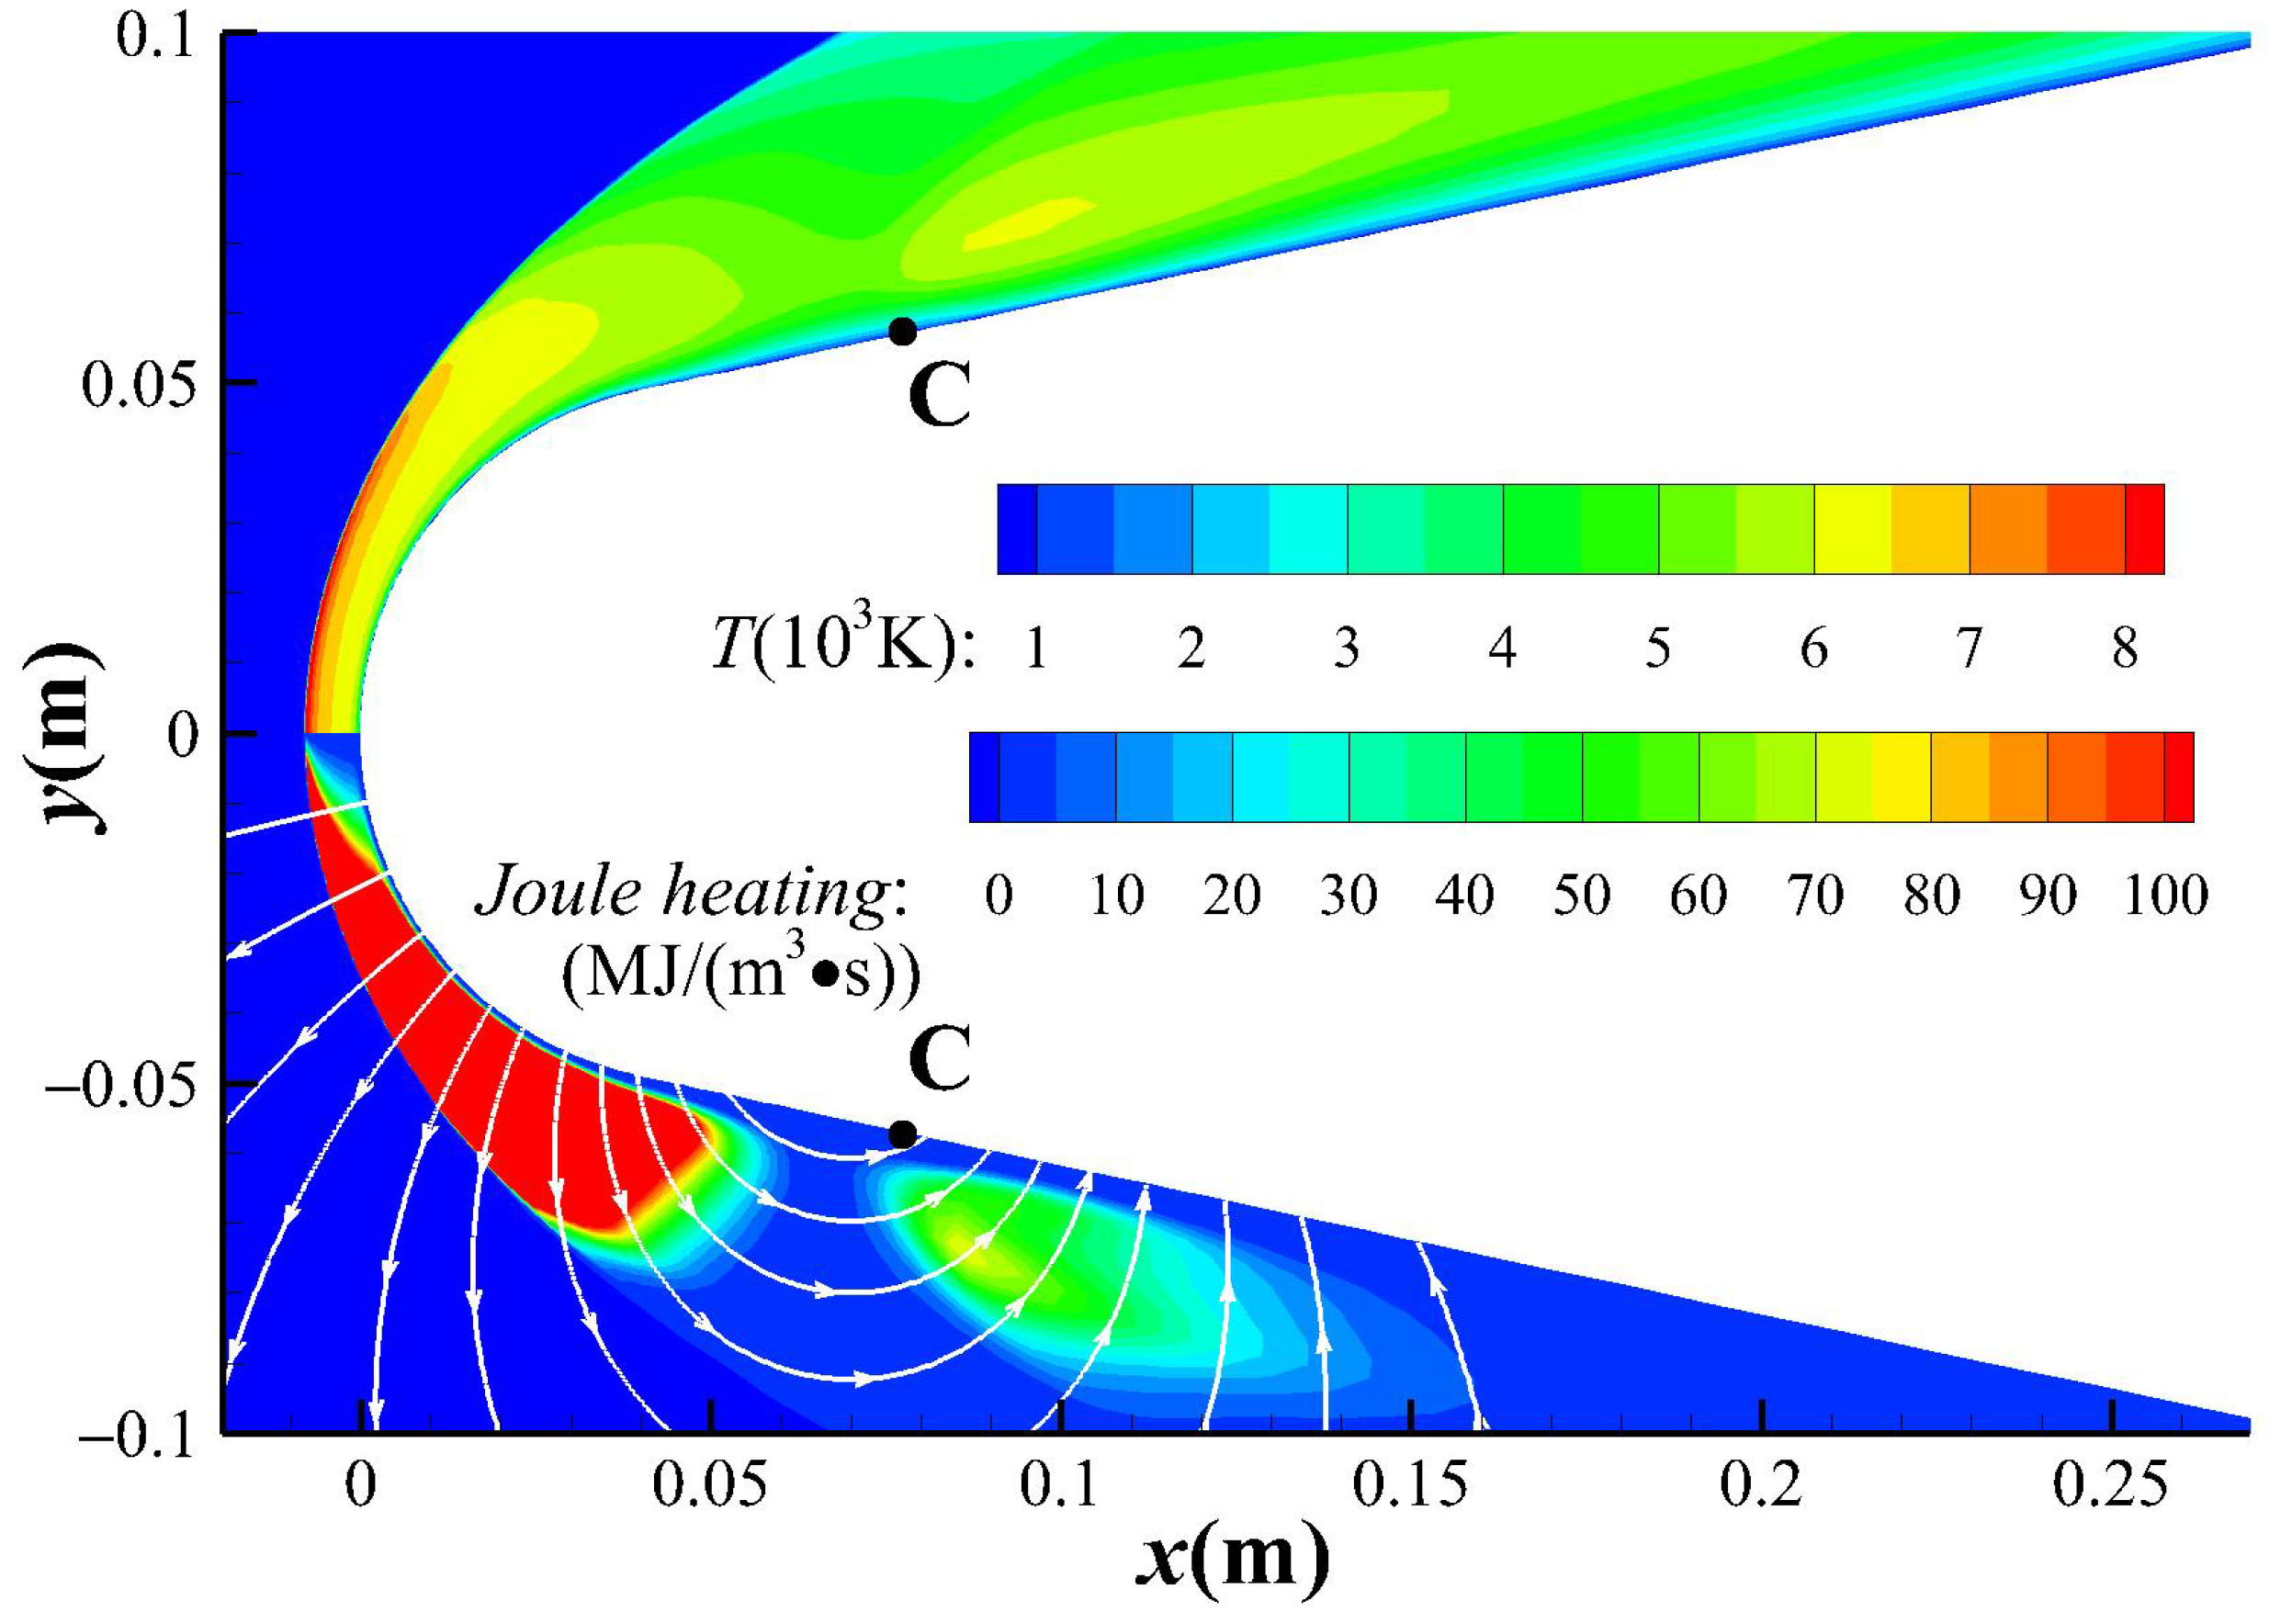
As mentioned above, Joule heating plays an important role in the distribution of energy in the flow field. The magnitude of Joule heating depends on the electrical conductivity, velocity, magnetic field intensity, and the angle between magnetic field line and streamline as given in Equation (20). Figure 18 shows that the magnetic field line, represented by solid white line, is roughly parallel to the direction of streamline near point C, resulting in weak Joule heating in this region. Hence, the temperature in the area near point C is relatively lower. At this time, the effect of Joule heating on the heat flux is no longer dominant, so the relative heat flux at point C drops to less than 1 again.
J o u l e h e a t i n g = J · J σ = σ u × B 2 = σ u B sin u B 2
In addition, for the cases that the magnetic interaction above the shoulder region is still strong, such as the B3 case, the Lorentz force component normal to the streamline would likely change the flow state and thus affect the surface heat flux. As shown in Figure 19, the streamlines of case B3 obviously separate from the surface near shoulder region, causing the high-temperature gas to move away from the wall surface, where the heat flux decreases significantly.
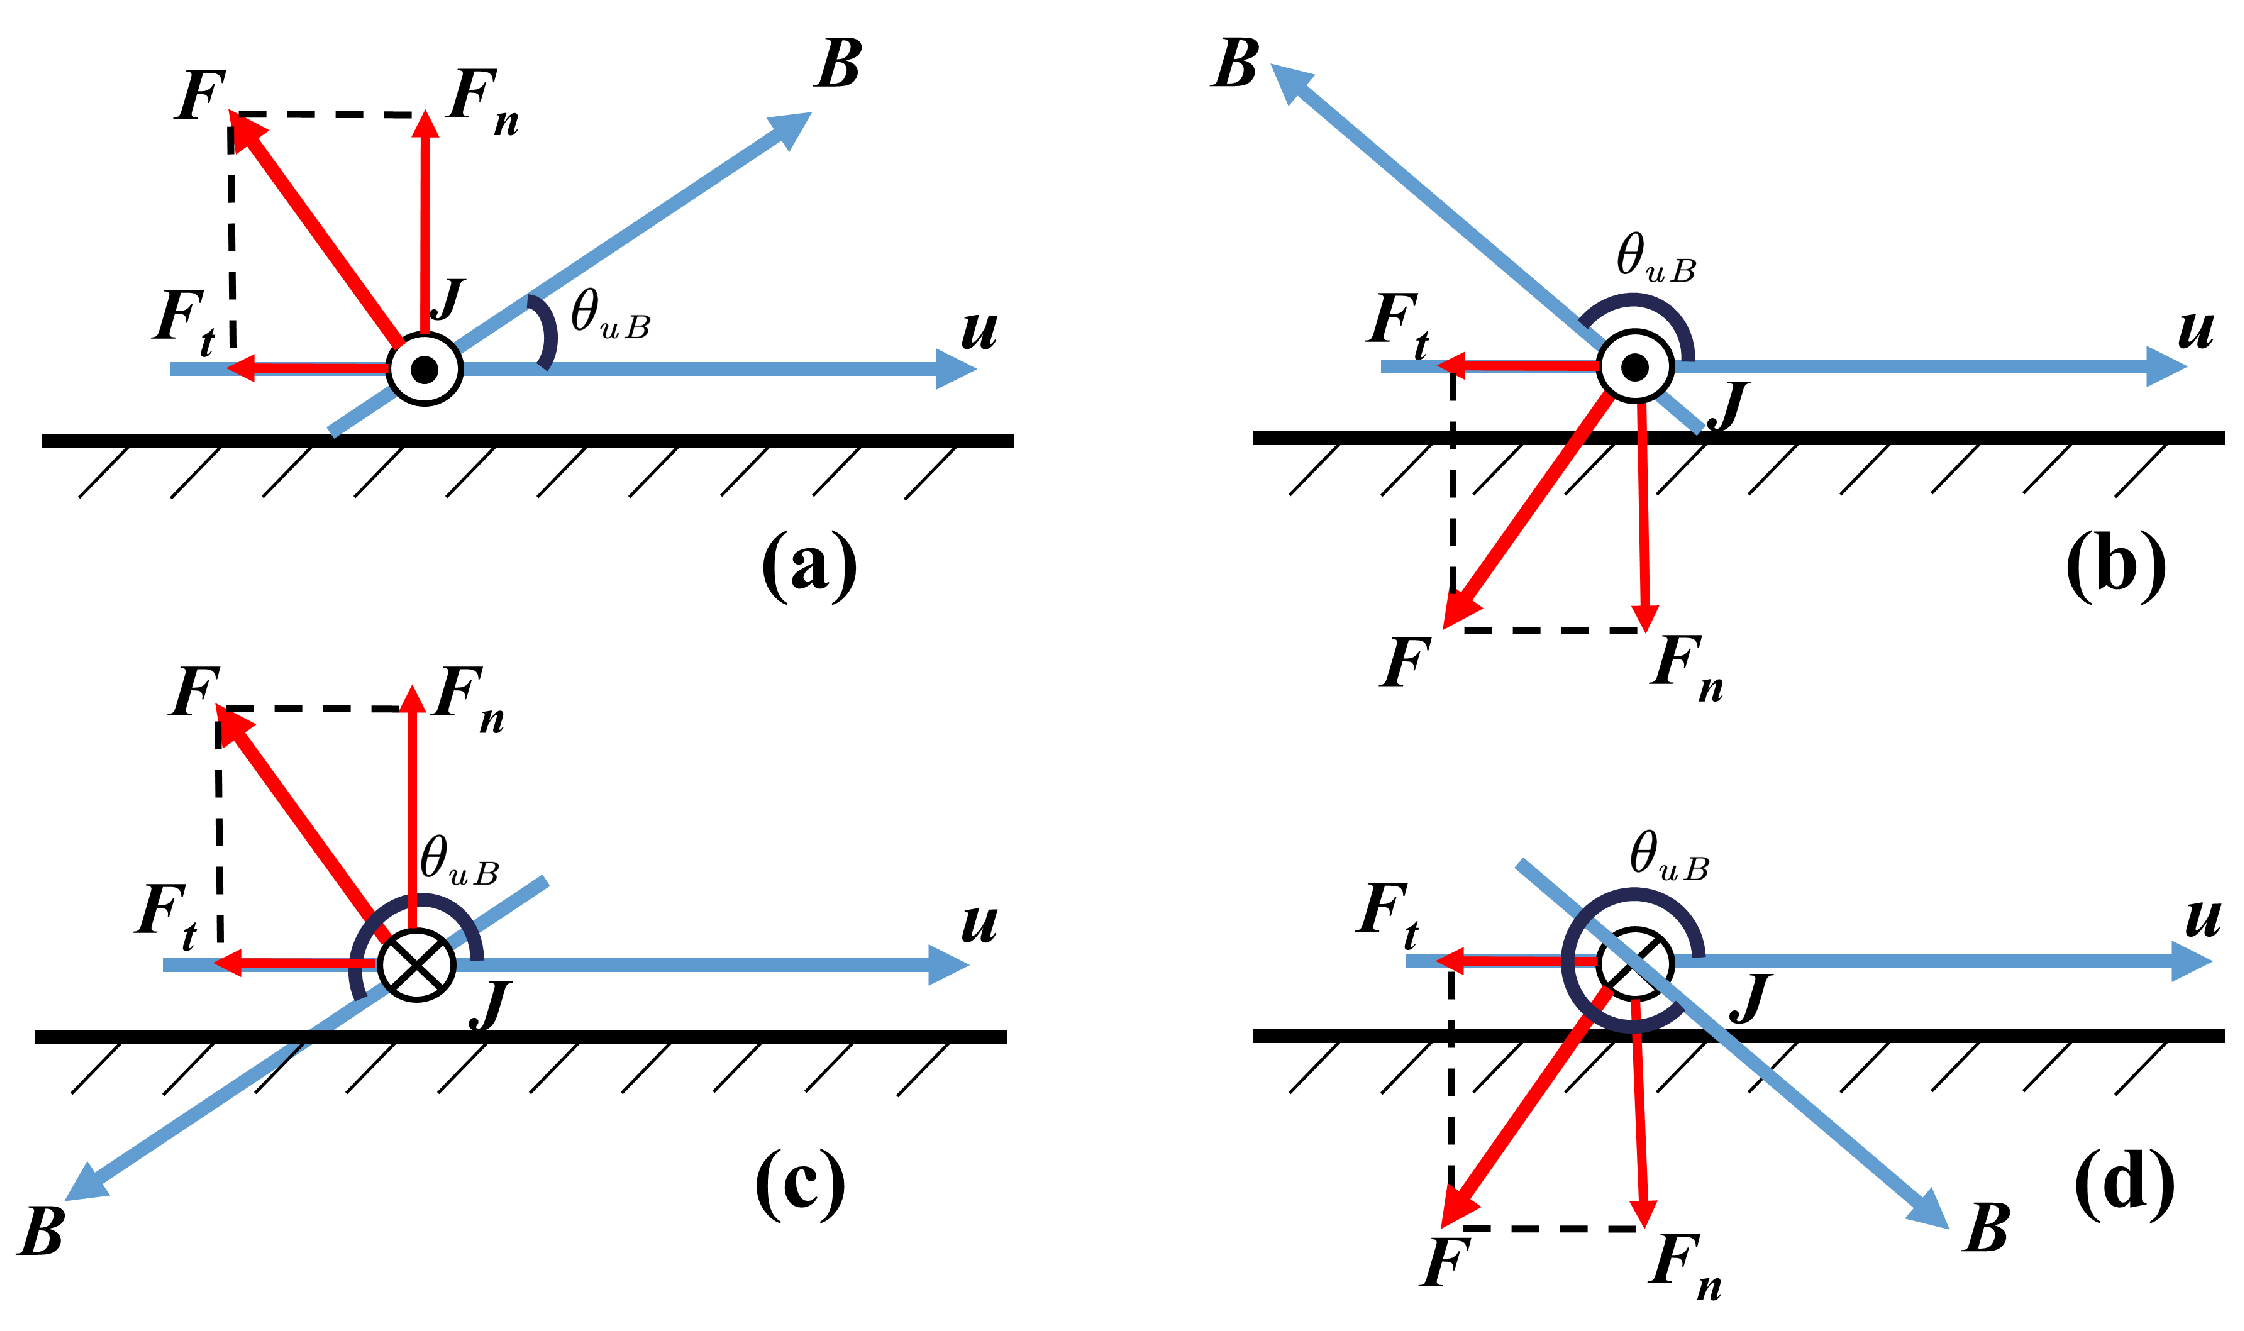
The effect of normal Lorentz force on the flow is shown in Figure 20, where F t is the counter-flow Lorentz force, F n is the normal Lorentz force, and the positive direction of θ u B is set to rotate counterclockwise from the streamline. According to the relative positional relationship between the streamlines and magnetic field lines, there are four possible situations. When 0 < θ u B < 90 or 180 < θ u B < 270 , the normal Lorentz force will move the flow away from the wall, while 90 < θ u B < 180 or 270 < θ u B < 360 , the normal Lorentz force will push the flow closer to the wall. For Case B3, as shown in Figure 19, the black and white solid lines represent the streamlines and magnetic field lines, respectively. Point E corresponds to situation (a), point F corresponds to situation (d), and a separation zone is formed between them. However, in the head region of the blunt body, because the θ u B is close to 90 , resulting in a small F n , the streamline does not deviate from the wall surface.

3.3.4. Zone IV

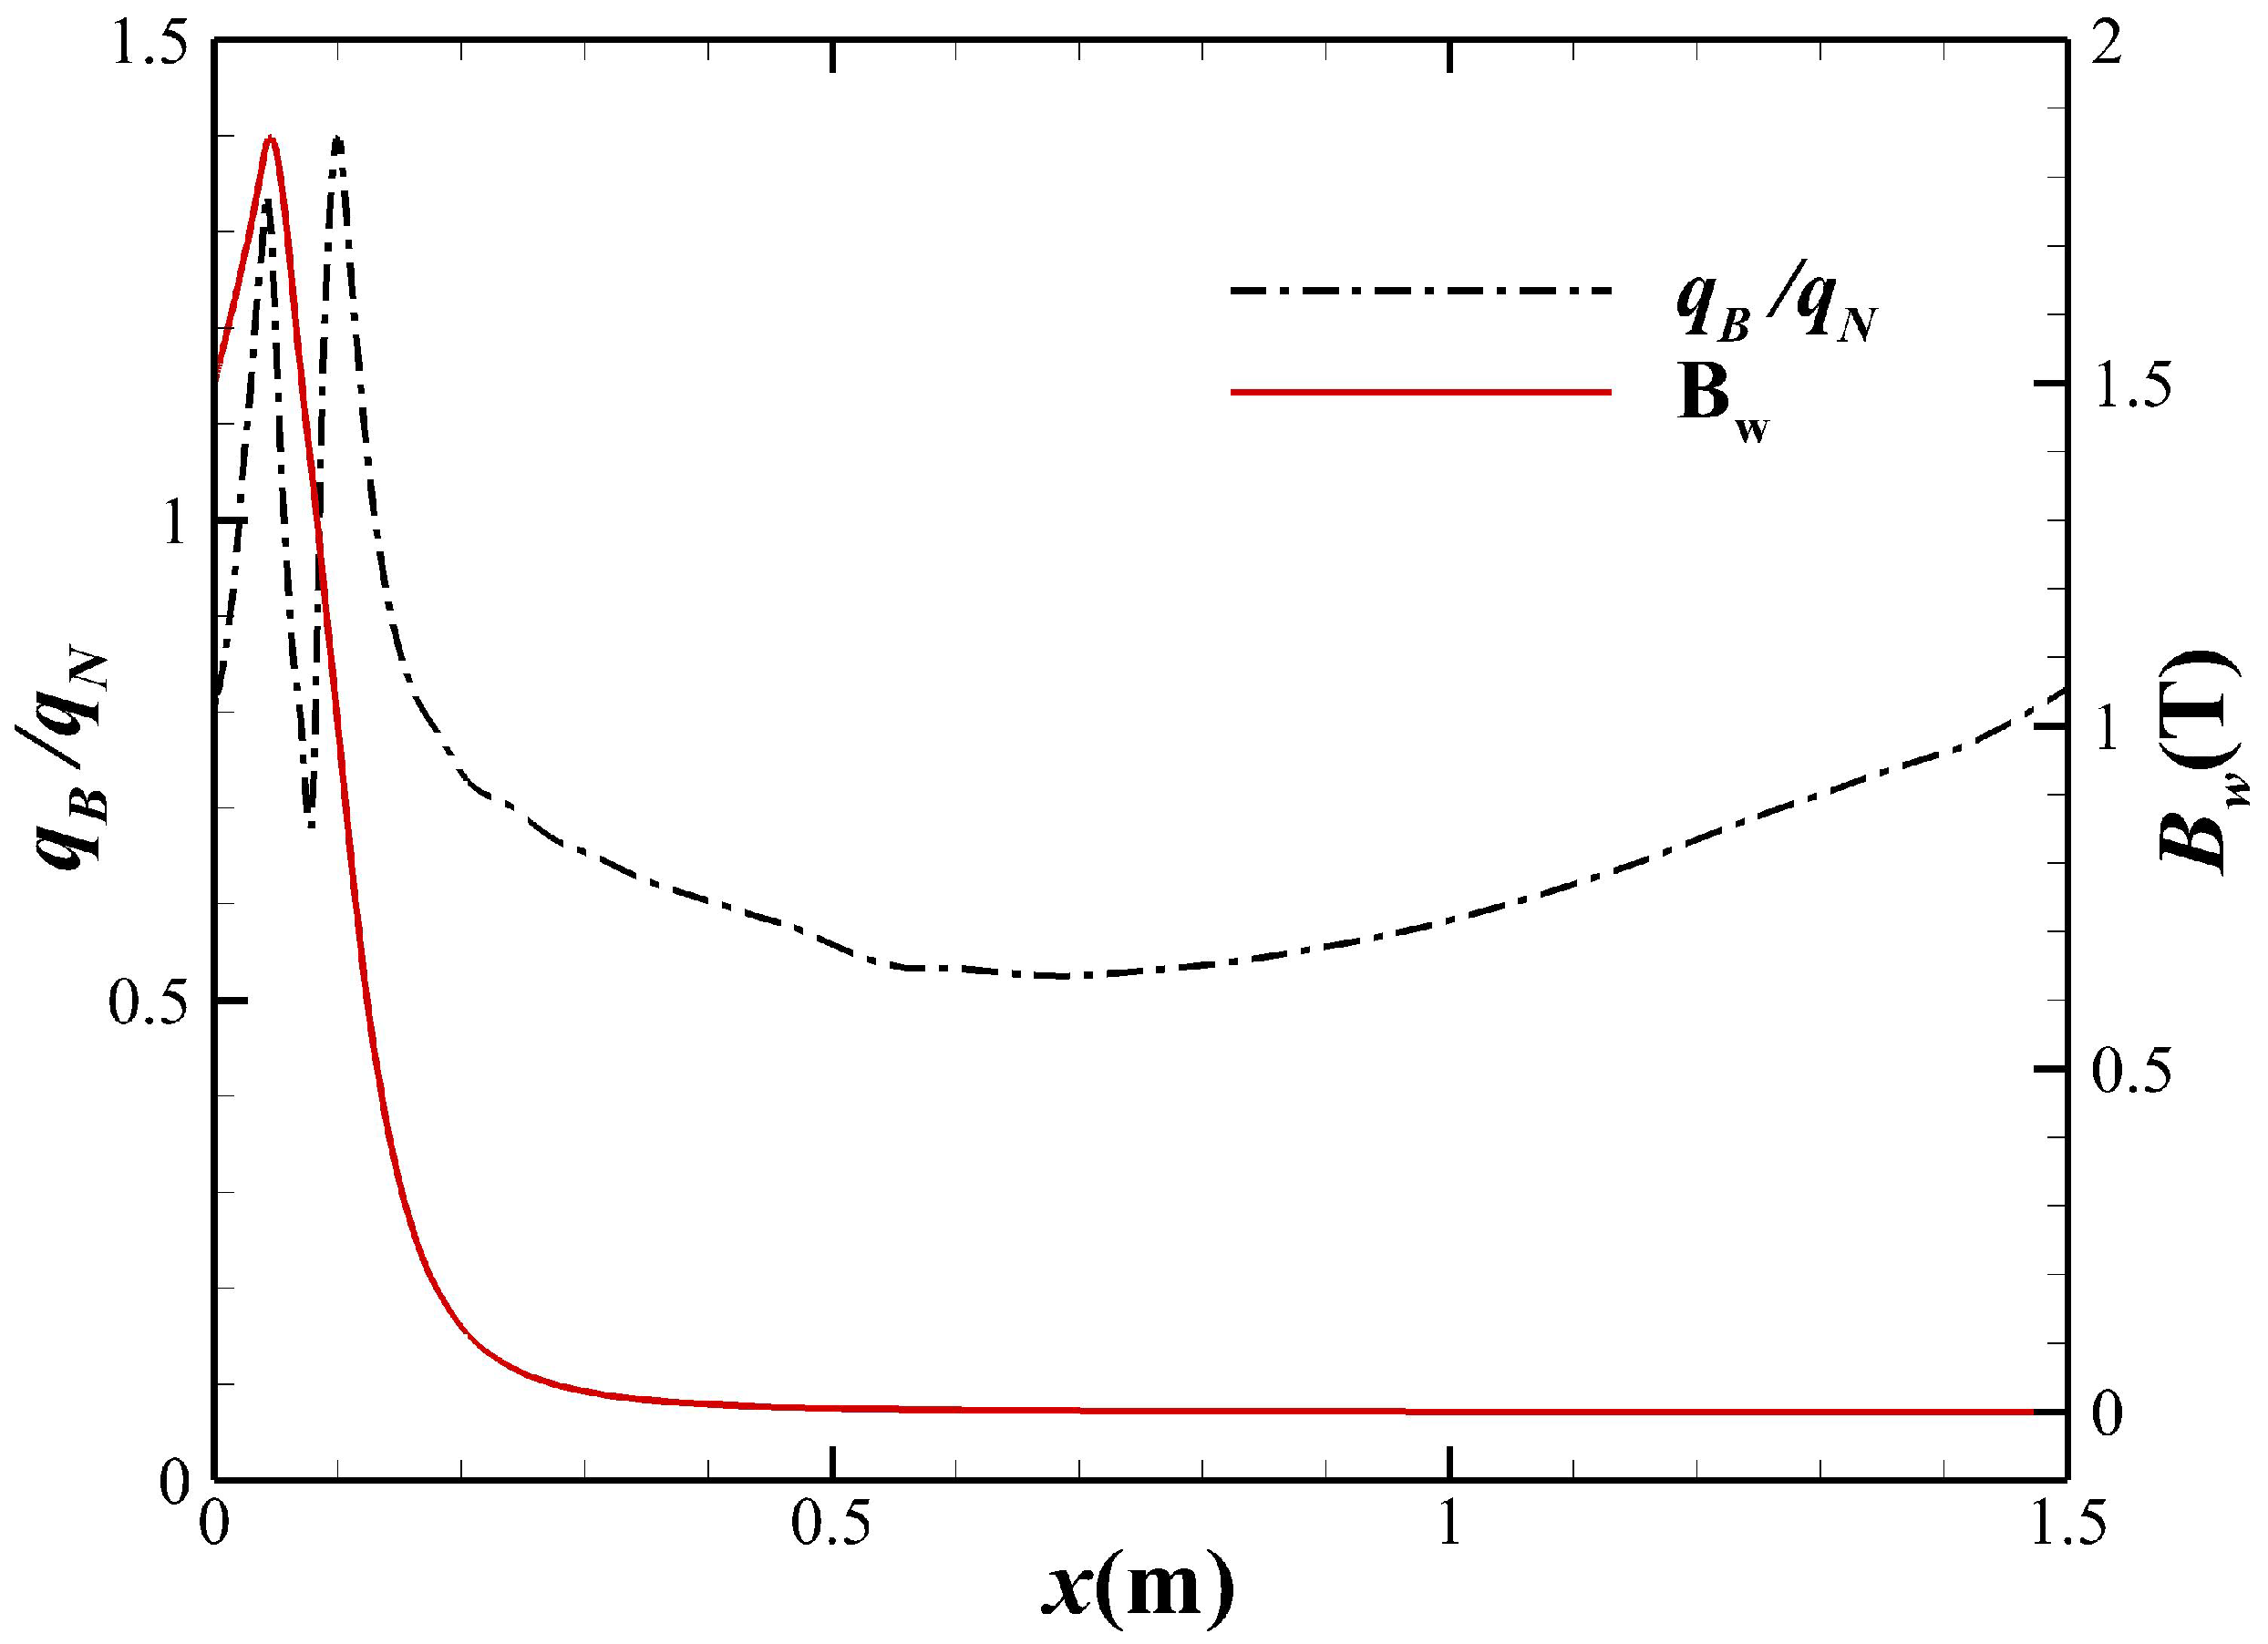
It can be seen from Figure 12 that the external magnetic field can still reduce the surface heat flux in Zone IV , which shows that the magnetic field applied to the sphere head does not only change the surface heat flux near the head region, but the effect of the magnetic field on the heat flux could continue for a long distance downstream. Now extending our focus to the entire 1.5 m long blunt body surface, Figure 21 shows that in the large area downstream of the cone surface far away from the center of dipole magnet, the surface heat flux is still reduced, the reduction rate can reach more than 30%, and a stable heat flux reduction maintains a long distance, until approaching the tail of blunt body. However, it can be seen from Figure 21 that the magnetic field intensity is significantly reduced in the large area of the cone surface, which indicates that the reduction of heat flux in this area is not caused by the local magnetic interaction.
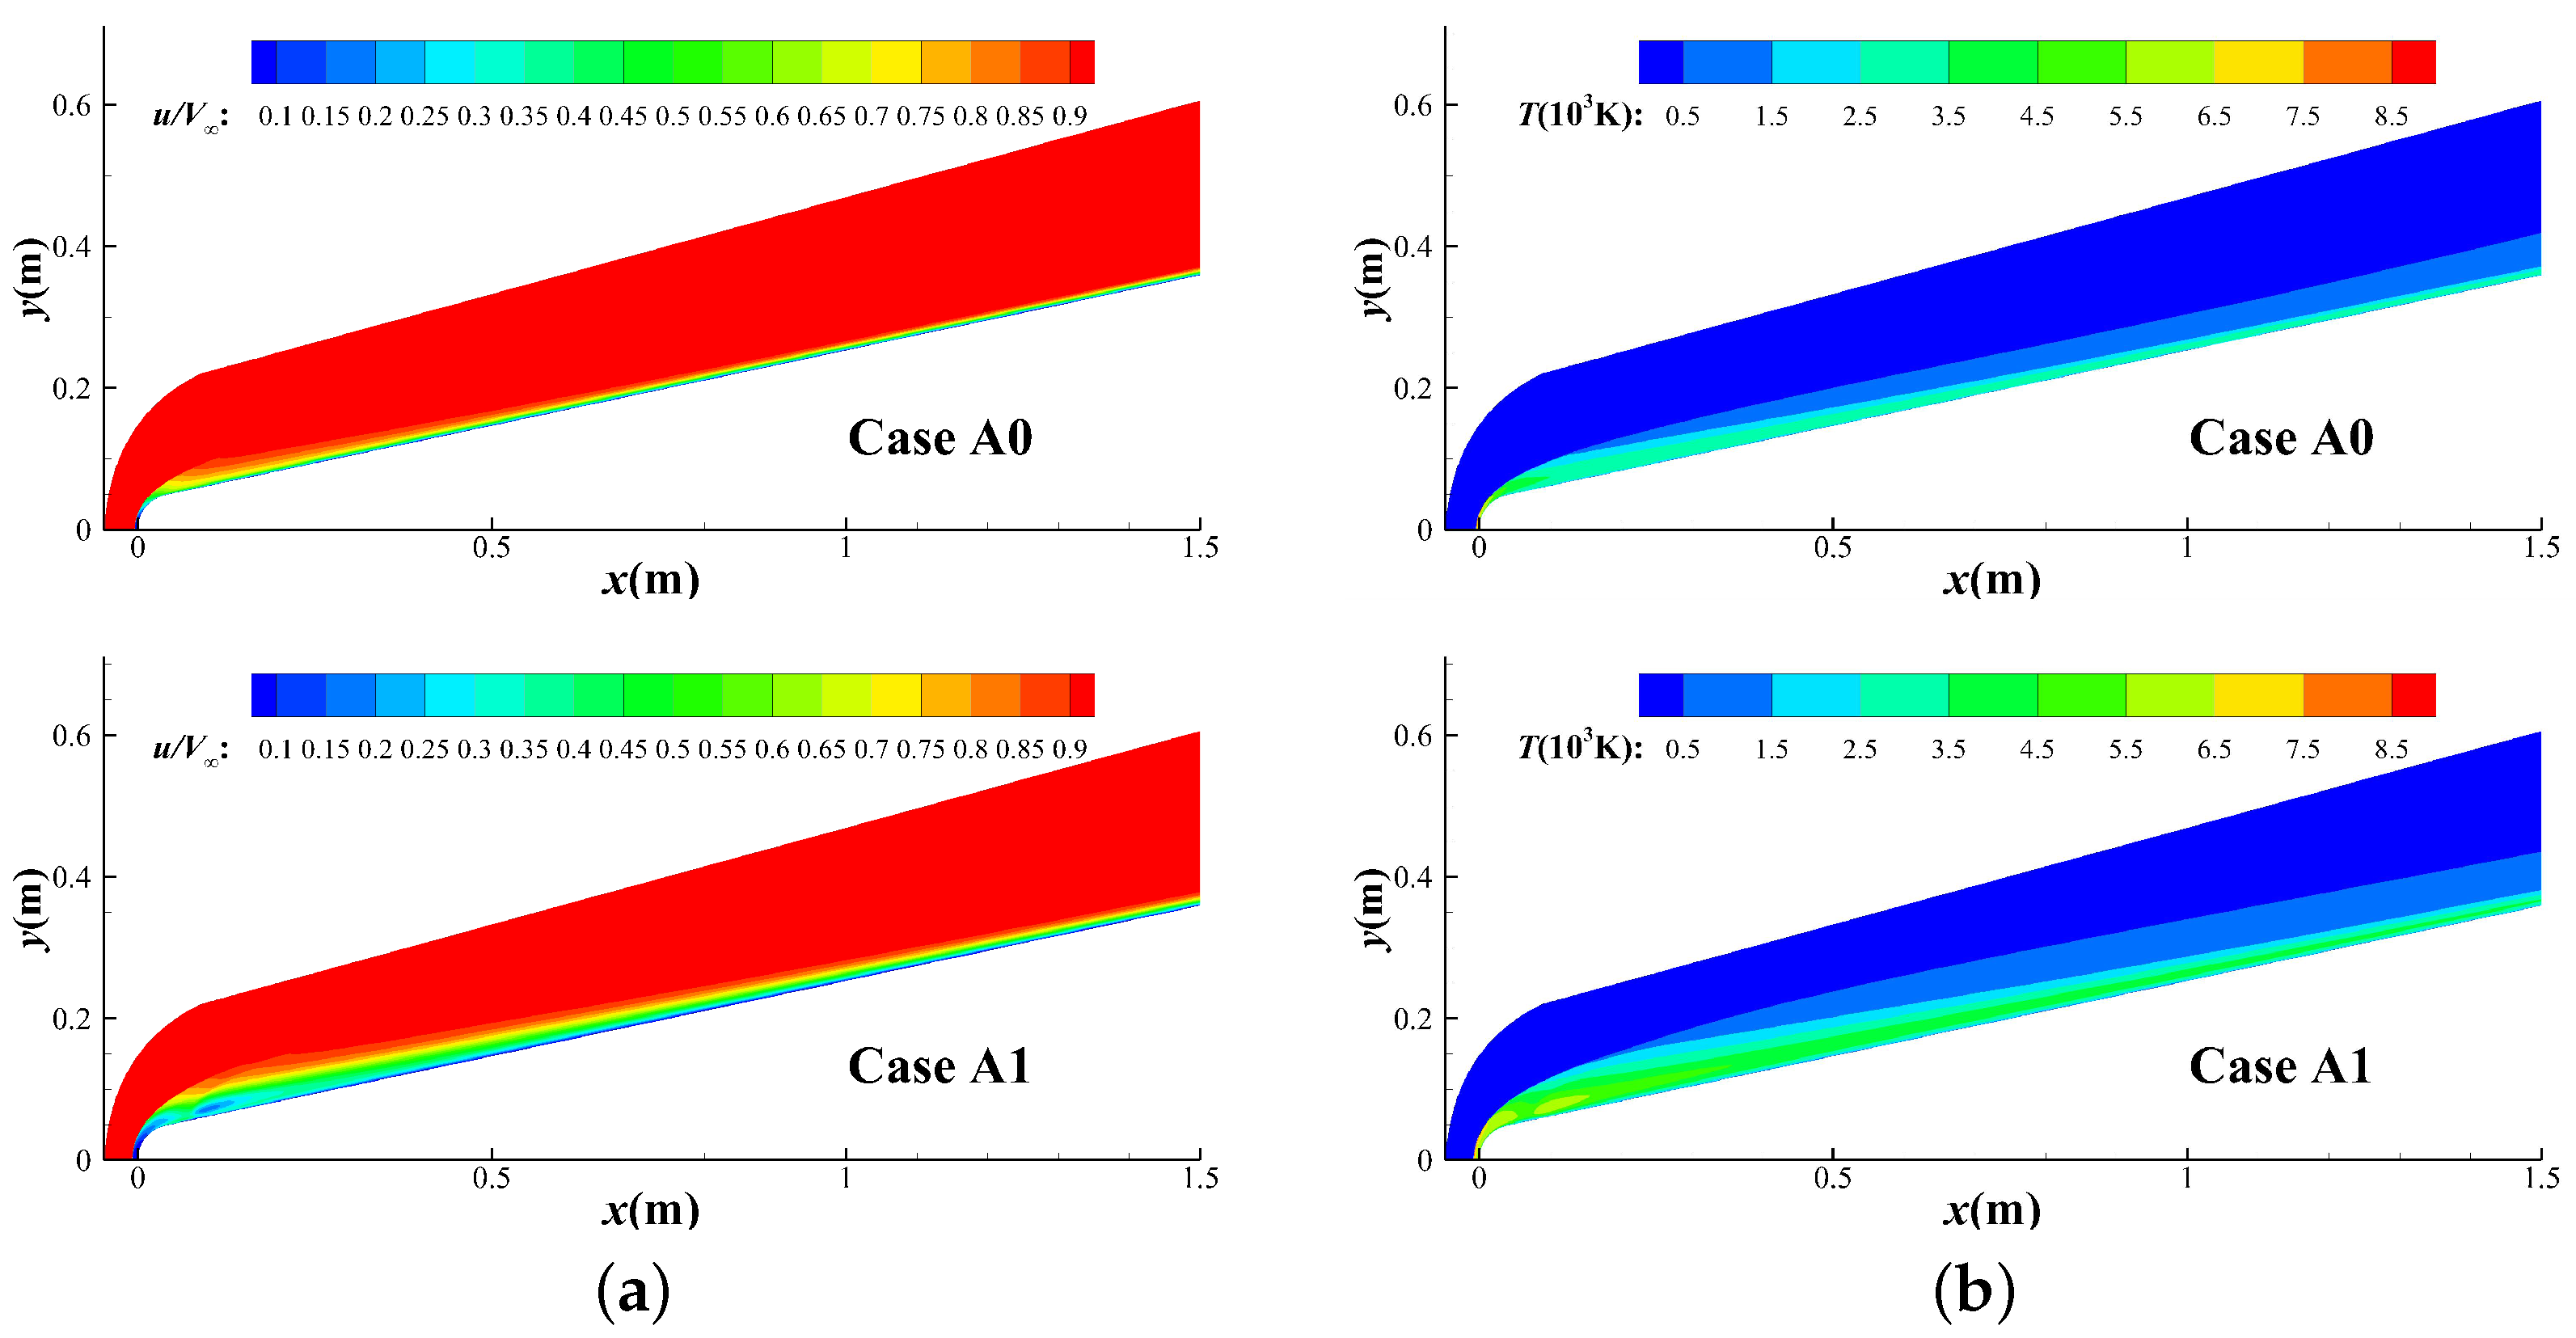
The comparison of the flow fields with and without external magnetic field is shown in Figure 22. It can be seen that the velocity deceleration and temperature enhancement effects induced by Lorentz force in the upstream sphere region need time to recover with downstream development, that is, there is an “upstream historical effect”. Figure 23 shows the velocity and temperature profiles inside the boundary layer at x = 1.5 m; it is seen that even at a distance of 1.5 m downstream, the boundary layer profiles have not recovered to the situation without the external magnetic field, and meanwhile, the thickness of boundary layer still increases significantly. Although the temperature at the outer edge of boundary layer is larger than that without external magnetic field due to the upstream influence, the surface heat flux still decreases because the thickening effect of boundary layer is dominant. As the flow continues to develop downstream, the influence of upstream historical effect will gradually weaken, and the relative heat flux will rebound and slowly tend to 1.

4. Conclusions

Numerical simulations of hypersonic MHD flows are carried out based on the assumption of a low magnetic Reynolds number, and the influencing mechanisms of external magnetic field on the heat flux of typical sphere–cone blunt body are analyzed in detail. Multiple mechanisms of the MHD heat flux mitigation are revealed systematically in this paper for the first time. The main conclusions of this study are as follows:
(1)
The external magnetic field can effectively reduce the heat flux at the stagnation point. Under the freestream conditions and the effect of magnetic field in this paper, the stagnation point heat flux decreases by 18.7%. Numerical experiments reveal that the current viewpoint that the increase of shock stand-off distance leads to the decrease in stagnation point heat flux is not reasonable. In fact, the increase in boundary layer thickness due to the effect of counter-flow Lorentz force, which is equivalent to adding an adverse pressure gradient, is the main reason.
(2)
In the head region of the blunt body, the relative surface heat flux shows a complex trend of rising and falling under the effect of external magnetic field. There are two basic mechanisms. On the one hand, the counter-flow Lorentz force results in the increase in boundary layer thickness, which helps to reduce the surface heat flux. On the other hand, the Joule heating directly increases the static temperature behind bow shock, which enhances the surface heat flux. Since the above two mechanisms are dominant alternately in different regions, the surface heat flux exhibits rise and fall under the effect of external magnetic field.
(3)
In the shoulder region of blunt body, there is another mechanism. When the local magnetic interaction is large enough, the Lorentz force component, normal to streamline, may change the flow direction of the fluid elements, causing the streamline to deviate from the wall or even separate. The flow separation and reattachment would significantly affect the surface heat flux.
(4)
In the large area downstream of the blunt body, it is found that the surface heat flux could still be significantly reduced by more than 30%. This is because of the “upstream historical effect”, which is that the velocity deceleration and temperature enhancement effects induced by the external magnetic field in the upstream sphere region need time to recover with downstream development. The heat flux reduction effect of magnetic field can be extended downstream to about 1.5 m in this paper.

Author Contributions

Conceptualization, Z.Z. (Zhifeng Zhou) and C.-H.L.; methodology, Z.Z. (Zhichao Zhang); software, Z.Z. (Zhifeng Zhou) and Z.Z. (Zhichao Zhang); validation, Z.Z. (Zhifeng Zhou) and K.X.; formal analysis, Z.Z. (Zhifeng Zhou); investigation, Z.Z. (Zhifeng Zhou) and Z.Z. (Zhichao Zhang); resources, K.X.; data curation, Z.Z. (Zhifeng Zhou); writing—original draft preparation, Z.Z. (Zhifeng Zhou); writing—review and editing, Z.Z. (Zhifeng Zhou) and Z.G.; visualization, Z.Z. (Zhifeng Zhou); supervision, Z.G.; project administration, Z.G.; funding acquisition, Z.Z. (Zhichao Zhang). All authors have read and agreed to the published version of the manuscript.

Funding

This research is supported by the National Natural Science Foundation of China through Grant 11872094.

Institutional Review Board Statement

Not applicable.

Informed Consent Statement

Not applicable.

Data Availability Statement

Not applicable.

Acknowledgments

The authors would like to thank the support by academician workstation of AVIC Aerodynamics Research Institute on this work.

Conflicts of Interest

The authors declare no conflict of interest.

References

  1. Anderson, J.D. Hypersonic and High Temperature Gas Dynamics; AIAA: Reston, WV, USA, 2000. [Google Scholar]
  2. Resler, E., Jr.; Sears, W. The prospects for magneto-aerodynamics. J. Aerosp. Sci. 1958, 25, 235–245. [Google Scholar] [CrossRef]
  3. Meyer, R.C. On reducing aerodynamic heat-transfer rates by magnetohydrodynamic techniques. J. Aerosp. Sci. 1958, 25, 561–566. [Google Scholar] [CrossRef]
  4. Bush, W.B. Magnetohydrodynamic-hypersonic flow past a blunt body. J. Aerosp. Sci. 1958, 25, 685–690. [Google Scholar] [CrossRef]
  5. Bush, W.B. The stagnation-point boundary layer in the presence of an applied magnetic field. J. Aerosp. Sci. 1961, 28, 610–611. [Google Scholar] [CrossRef]
  6. Gülhan, A.; Esser, B.; Koch, U.; Siebe, F.; Riehmer, J.; Giordano, D.; Konigorski, D. Experimental verification of heat-flux mitigation by electromagnetic fields in partially-ionized-argon flows. J. Spacecr. Rocket. 2009, 46, 274–283. [Google Scholar] [CrossRef]
  7. Fujino, T.; Funaki, I.; Sugita, H.; Mizuno, M.; Ishikawa, M. Numerical Analyses on Flow Control Around Blunt Body “OREX” by Magnetic Field. In Proceedings of the 34th AIAA Plasmadynamics and Lasers Conference, Orlando, FL, USA, 23–26 June 2003; p. 3760. [Google Scholar]
  8. Yoshino, T.; Fujino, T.; Ishikawa, M. Numerical study of thermal protection utilizing magnetohydrodynamic technology in super-orbital reentry flight. In Proceedings of the 41st Plasmadynamics and Lasers Conference, Chicago, FL, USA, 28 June–1 July 2010; p. 4486. [Google Scholar]
  9. Khan, O.; Hoffmann, K.; Dietiker, J.F. Validity of low magnetic Reynolds number formulation of magnetofluiddynamics. In Proceedings of the 38th AIAA Plasmadynamics and Lasers Conference in Conjunction with the 16th International Conference on MHD Energy Conversion, Miami, FL, USA, 2–28 June 2007; p. 4374. [Google Scholar]
  10. Damevin, H.M.; Hoffmann, K.A. Numerical simulations of magnetic flow control in hypersonic chemically reacting flows. J. Thermophys. Heat Transf. 2002, 16, 498–507. [Google Scholar] [CrossRef]
  11. Bityurin, V.; Bocharov, A. MHD heat flux mitigation in hypersonic flow around a blunt body with ablating surface. J. Phys. Appl. Phys. 2018, 51, 264001. [Google Scholar] [CrossRef]
  12. Nagata, Y.; Otsu, H.; Yamada, K.; Abe, T. Influence of hall effect on electrodynamic flow control for weakly ionized flow. In Proceedings of the 43rd AIAA Plasmadynamics and Lasers Conference, New Orleans, LA, USA, 25–28 June 2012; p. 2734. [Google Scholar]
  13. Fujino, T.; Takahashi, T. Numerical simulation of mars entry flight using magnetohydrodynamic parachute effect. In Proceedings of the 47th AIAA Plasmadynamics and Lasers Conference, Washington, DC, USA, 13–17 June 2016; p. 3227. [Google Scholar]
  14. Bityurin, V.; Bocharov, A. On efficiency of heat flux mitigation by the magnetic field in MHD re-entry flow. In Proceedings of the 42nd AIAA Plasmadynamics and Lasers Conference in Conjunction with the 18th International Conference on MHD Energy Conversion (ICMHD), Honolulu, HI, USA, 27–30 June 2011; p. 3463. [Google Scholar]
  15. Bisek, N.; Boyd, I.; Poggie, J. Three dimensional simulations of hypersonic MHD flow control. In Proceedings of the 40th AIAA Plasmadynamics and Lasers Conference, San Antonio, TX, USA, 22–25 June 2009; p. 3731. [Google Scholar]
  16. Bisek, N.J.; Boyd, I.D.; Poggie, J. Numerical study of magnetoaerodynamic flow around a hemisphere. J. Spacecr. Rocket. 2010, 47, 816–827. [Google Scholar] [CrossRef]
  17. Fujino, T.; Yoshino, T.; Ishikawa, M. Numerical analysis of reentry trajectory coupled with magnetohydrodynamics flow control. J. Spacecr. Rocket. 2008, 45, 911–920. [Google Scholar] [CrossRef]
  18. Li, K.; Liu, J.; Liu, W. Mechanism analysis of magnetohydrodynamic heat shield system and optimization of externally applied magnetic field. Acta Astronaut. 2017, 133, 14–23. [Google Scholar] [CrossRef]
  19. Khan, O.U.; Hoffmann, K.A.; Dietiker, J.F. Computational aspects of high-speed flows with applied magnetic field. IEEE Trans. Magn. 2006, 42, 389–397. [Google Scholar] [CrossRef]
  20. Khan, O.; Hoffmann, K. Temperature and Stress Distributions within a Body in High Speed Flow with and without Applied Magnetic Field. In Proceedings of the 38th AIAA Plasmadynamics and Lasers Conference In conjunction with the 16th International Conference on MHD Energy Conversion, Miami, FL, USA, 25–28 June 2007; p. 4368. [Google Scholar]
  21. Bird, R.B. Transport phenomena. Appl. Mech. Rev. 2002, 55, R1–R4. [Google Scholar] [CrossRef]
  22. Wilke, C. A viscosity equation for gas mixtures. J. Chem. Phys. 1950, 18, 517–519. [Google Scholar] [CrossRef]
  23. Kee, R.J.; Rupley, F.M.; Miller, J.A. The Chemkin Thermodynamic Data Base; Technical Report; Sandia National Lab.: Livermore, CA, USA, 1990. [Google Scholar]
  24. Shercliff, J.A. Textbook of Magnetohydrodynamics; Pergamon Press: Oxford, UK, 1965. [Google Scholar]
  25. Gao, Z.; Jiang, C.; Lee, C. Improvement and application of wall function boundary condition for high-speed compressible flows. Sci. China Technol. Sci. 2013, 56, 2501–2515. [Google Scholar] [CrossRef]
  26. Gao, Z.; Jiang, C.; Pan, S.; Lee, C.H. Combustion heat-release effects on supersonic compressible turbulent boundary layers. AIAA J. 2015, 53, 1949–1968. [Google Scholar] [CrossRef]
  27. Gao, Z.X.; Jiang, C.W.; Lee, C.H. A new wall function boundary condition including heat release effect for supersonic combustion flows. Appl. Therm. Eng. 2016, 92, 62–70. [Google Scholar] [CrossRef]
  28. Gao, Z.X.; Xue, H.C.; Zhang, Z.C.; Liu, H.P.; Lee, C.H. A hybrid numerical scheme for aeroheating computation of hypersonic reentry vehicles. Int. J. Heat Mass Transf. 2018, 116, 432–444. [Google Scholar] [CrossRef]
  29. Roe, P.L. Approximate Riemann solvers, parameter vectors, and difference schemes. J. Comput. Phys. 1981, 43, 357–372. [Google Scholar] [CrossRef]
  30. Van Leer, B. Towards the ultimate conservative difference scheme. V. A second-order sequel to Godunov’s method. J. Comput. Phys. 1979, 32, 101–136. [Google Scholar] [CrossRef]
  31. Yoon, S.; Jameson, A. Lower-upper symmetric-Gauss-Seidel method for the Euler and Navier-Stokes equations. AIAA J. 1988, 26, 1025–1026. [Google Scholar] [CrossRef] [Green Version]
  32. Gupta, R.N.; Yos, J.M.; Thompson, R.A.; Lee, K.P. A Review of Reaction Rates and Thermodynamic and Transport Properties for an 11-Species Air Model for Chemical and Thermal Nonequilibrium Calculations to 30,000 K; NASA RP-1232; 1990. Available online: https://ntrs.nasa.gov/citations/19900017748 (accessed on 23 August 2022).
  33. Bisek, N.J.; Boyd, I.D.; Poggie, J. Numerical study of plasma-assisted aerodynamic control for hypersonic vehicles. J. Spacecr. Rocket. 2009, 46, 568–576. [Google Scholar] [CrossRef]
  34. Asinovsky, E.; Kirillin, A.; Pakhomov, E.; Shabashov, V. Experimental investigation of transport properties of low-temperature plasma by means of electric arc. Proc. IEEE 1971, 59, 592–601. [Google Scholar] [CrossRef]
  35. Fujino, T.; Ishikawa, M. Numerical simulation of control of plasma flow with magnetic field for thermal protection in earth reentry flight. IEEE Trans. Plasma Sci. 2006, 34, 409–420. [Google Scholar] [CrossRef]
  36. Raizer, Y.P.; Allen, J.E. Gas Discharge Physics; Springer: Berlin, Germany, 1991; Volume 1. [Google Scholar]
  37. MacCormack, R. Evaluation of the low magnetic Reynolds number approximation for aerodynamic flow calculations. In Proceedings of the 36th AIAA Plasmadynamics and Lasers Conference, Toronto, ON, Canada, 6–9 June 2005; p. 4780. [Google Scholar]
  38. Yos, J.M. Transport Properties of Nitrogen, Hydrogen, Oxygen, and Air to 30,000 K; Technical Report; Avco Corp.: Wilmington, MA, USA, 1963. [Google Scholar]
  39. Martinez Schramm, J.; Hannemann, K.; Beck, W.; Karl, S. Cylinder shock layer density profiles measured in high enthalpy flows in HEG. In Proceedings of the 22nd AIAA Aerodynamic Measurement Technology and Ground Testing Conference, St. Louis, MI, USA, 24–26 June 2002; p. 2913. [Google Scholar]
  40. Poggie, J.; Gaitonde, D.V. Magnetic control of flow past a blunt body: Numerical validation and exploration. Phys. Fluids 2002, 14, 1720–1731. [Google Scholar] [CrossRef]
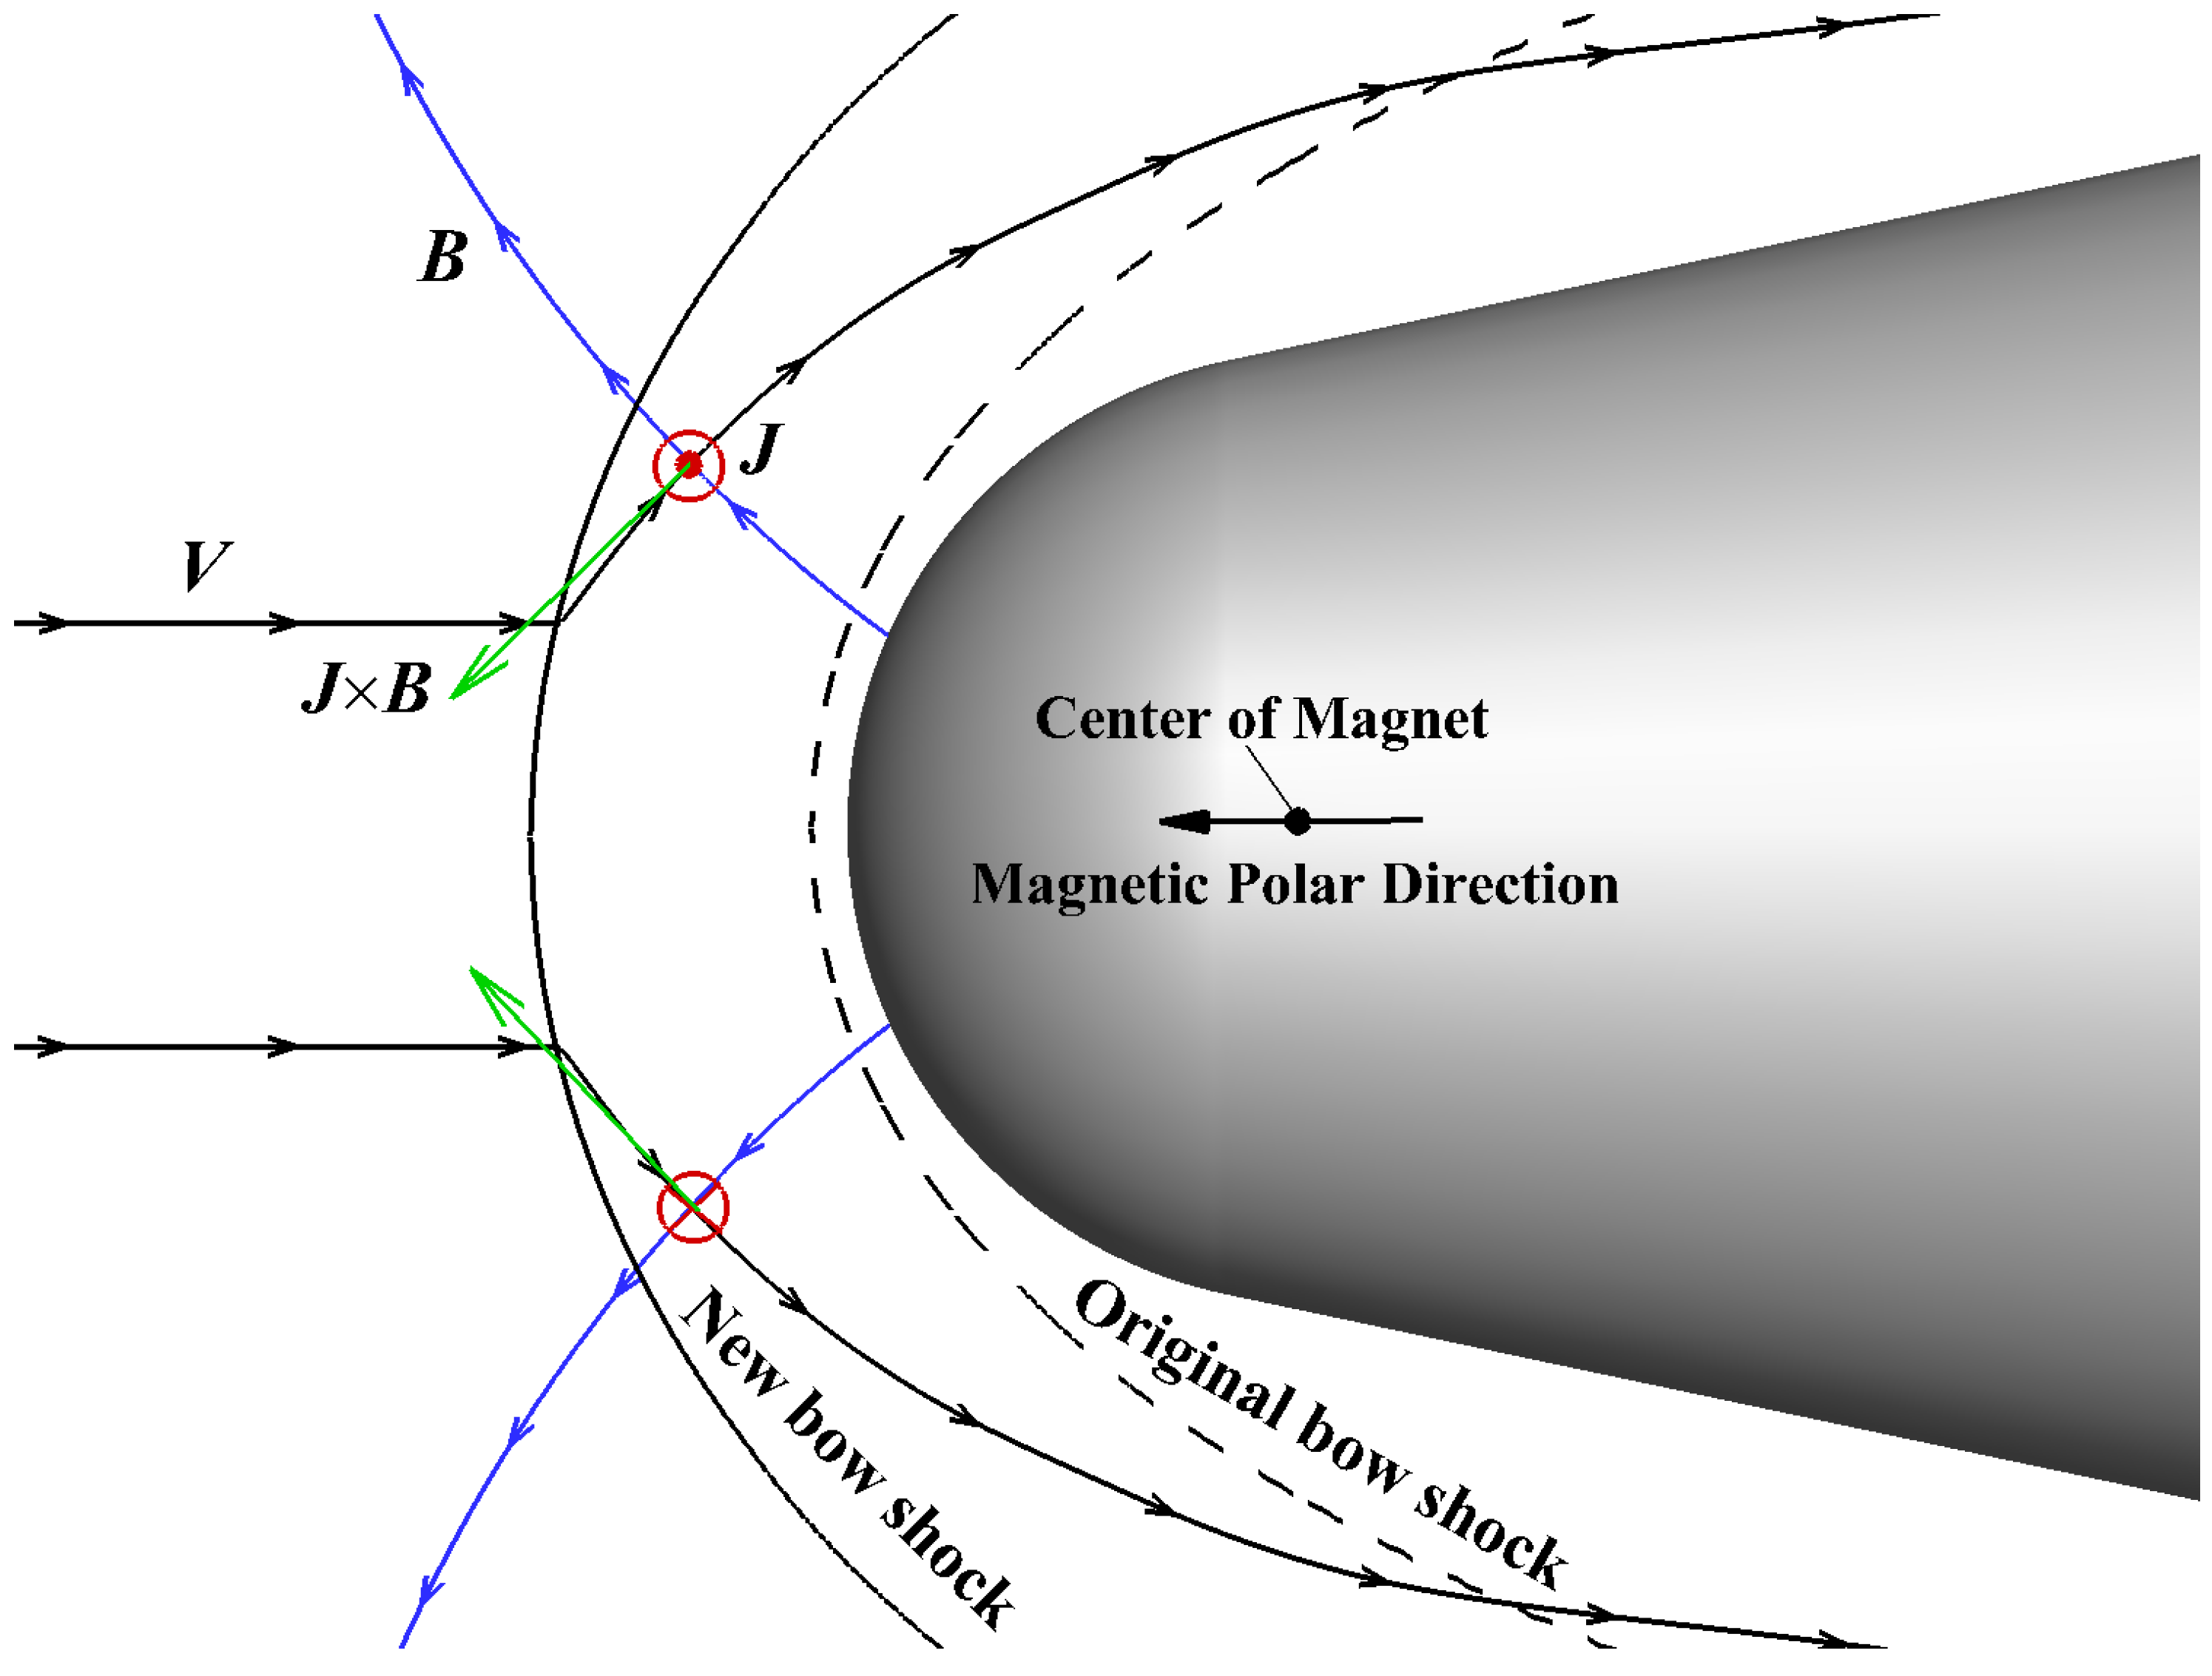
Figure 1. Diagram view of magnetohydrodynamics (MHD) flow control.
Aerospace 09 00548 g001
Figure 2. (a) Comparison between semi-analytic models and experimental data [34]. (b) Comparison between Fujino’s result, Fit model and experimental data.
Aerospace 09 00548 g002
Figure 3. Comparison of measured and numerical result of surface heat flux.
Aerospace 09 00548 g003
Figure 4. Schematic diagram of Bush’s model.
Aerospace 09 00548 g004
Figure 5. Effect of external magnetic field: (a) Shock stand-off distance, γ = 1.4 . (b) Velocity gradient at stagnation point.
Aerospace 09 00548 g005
Figure 6. Boundary layer profiles at θ = 6.6 : (a) Streamwise velocity. (b) Temperature.
Aerospace 09 00548 g006
Figure 7. Diagram of sphere–cone blunt body with external magnetic field.
Aerospace 09 00548 g007
Figure 8. Schematic diagram of different regions.
Aerospace 09 00548 g008
Figure 9. Computational meshes: (a) Mesh A. (b) Mesh B.
Aerospace 09 00548 g009
Figure 10. Comparison of flow field with and without external magnetic field.
Aerospace 09 00548 g010
Figure 11. Comparison of surface heat flux distribution.
Aerospace 09 00548 g011
Figure 12. The distribution of relative surface heat flux.
Aerospace 09 00548 g012
Figure 13. Comparison of shock stand-off distance.
Aerospace 09 00548 g013
Figure 14. Temperature boundary layer profiles at stagnation point: (a) Perfect gas. (b) Chemical nonequilibrium.
Aerospace 09 00548 g014
Figure 15. Total enthalpy boundary layer profile at stagnation point.
Aerospace 09 00548 g015
Figure 16. Boundary layer profiles at Station 1: (a) Tangential velocity. (b) Temperature.
Aerospace 09 00548 g016
Figure 17. Boundary layer profiles at Station 2: (a) Tangential velocity. (b) Temperature.
Aerospace 09 00548 g017
Figure 18. Distribution of temperature and Joule heating of case A1.
Aerospace 09 00548 g018
Figure 19. Temperature distribution of Case B3.
Aerospace 09 00548 g019
Figure 20. Schematic diagram of the Lorentz force: (a) 0 < θ u B < 90 . (b) 90 < θ u B < 180 . (c) 180 < θ u B < 270 . (d) 270 < θ u B < 360 .
Aerospace 09 00548 g020
Figure 21. The total magnetic field intensity and relative heat flux distribution along the wall.
Aerospace 09 00548 g021
Figure 22. Comparison of flow fields with and without external magnetic field: (a) Streamwise velocity. (b) Temperature.
Aerospace 09 00548 g022
Figure 23. Boundary layer profiles at x = 1.5 m: (a) Streamwise velocity. (b) Temperature.
Aerospace 09 00548 g023
Table 1. Freestream conditions.
Mach NumberPressureTemperatureAngle of Attack
1579.78 Pa270.65 K0
Table 2. Cases set-up.
CaseChemical Kinetic ModelElectrical Conductivity
Case A0Chemical nonequilibriumNoMHD
Case A1Chemical nonequilibriumFit model
Case B0Perfect gasNoMHD
Case B1Perfect gas σ = 200  S/m from wall to j = 50
Case B2Perfect gas σ = 200  S/m from j = 50 to shock
Case B3Perfect gas σ = 200  S/m in the entire shock layer
Table 3. Comparison of SDIR and HFDR.
CaseCase B1Case B2Case B3
SDIR10.22%80.26%92.10%
HFDR16.35%15.75%30.56%
Publisher’s Note: MDPI stays neutral with regard to jurisdictional claims in published maps and institutional affiliations.