
Effect of Aluminum Flakes on Corrosion Protection Behavior of Water-Based Hybrid Zinc-Rich Coatings for Carbon Steel Substrate in NaCl Environment
 , ,
, ,  and
and
Abstract
:1. Introduction
2. Materials and Methods
2.1. Materials
2.1.1. Substrate
2.1.2. Coatings
2.2. Dissolution Measurement
2.3. Electrochemical Tests
2.3.1. Open Circuit Potential
2.3.2. Electrochemical Impedance Spectroscopy
2.4. Normalized Tests
2.4.1. Salt Spray Test
2.4.2. Cross-Cut Test
2.5. Microstructural Characterization
2.5.1. X-ray Diffraction
2.5.2. Infrared Spectroscopy
2.5.3. Scanning Electron Microscopy
3. Results and Discussion
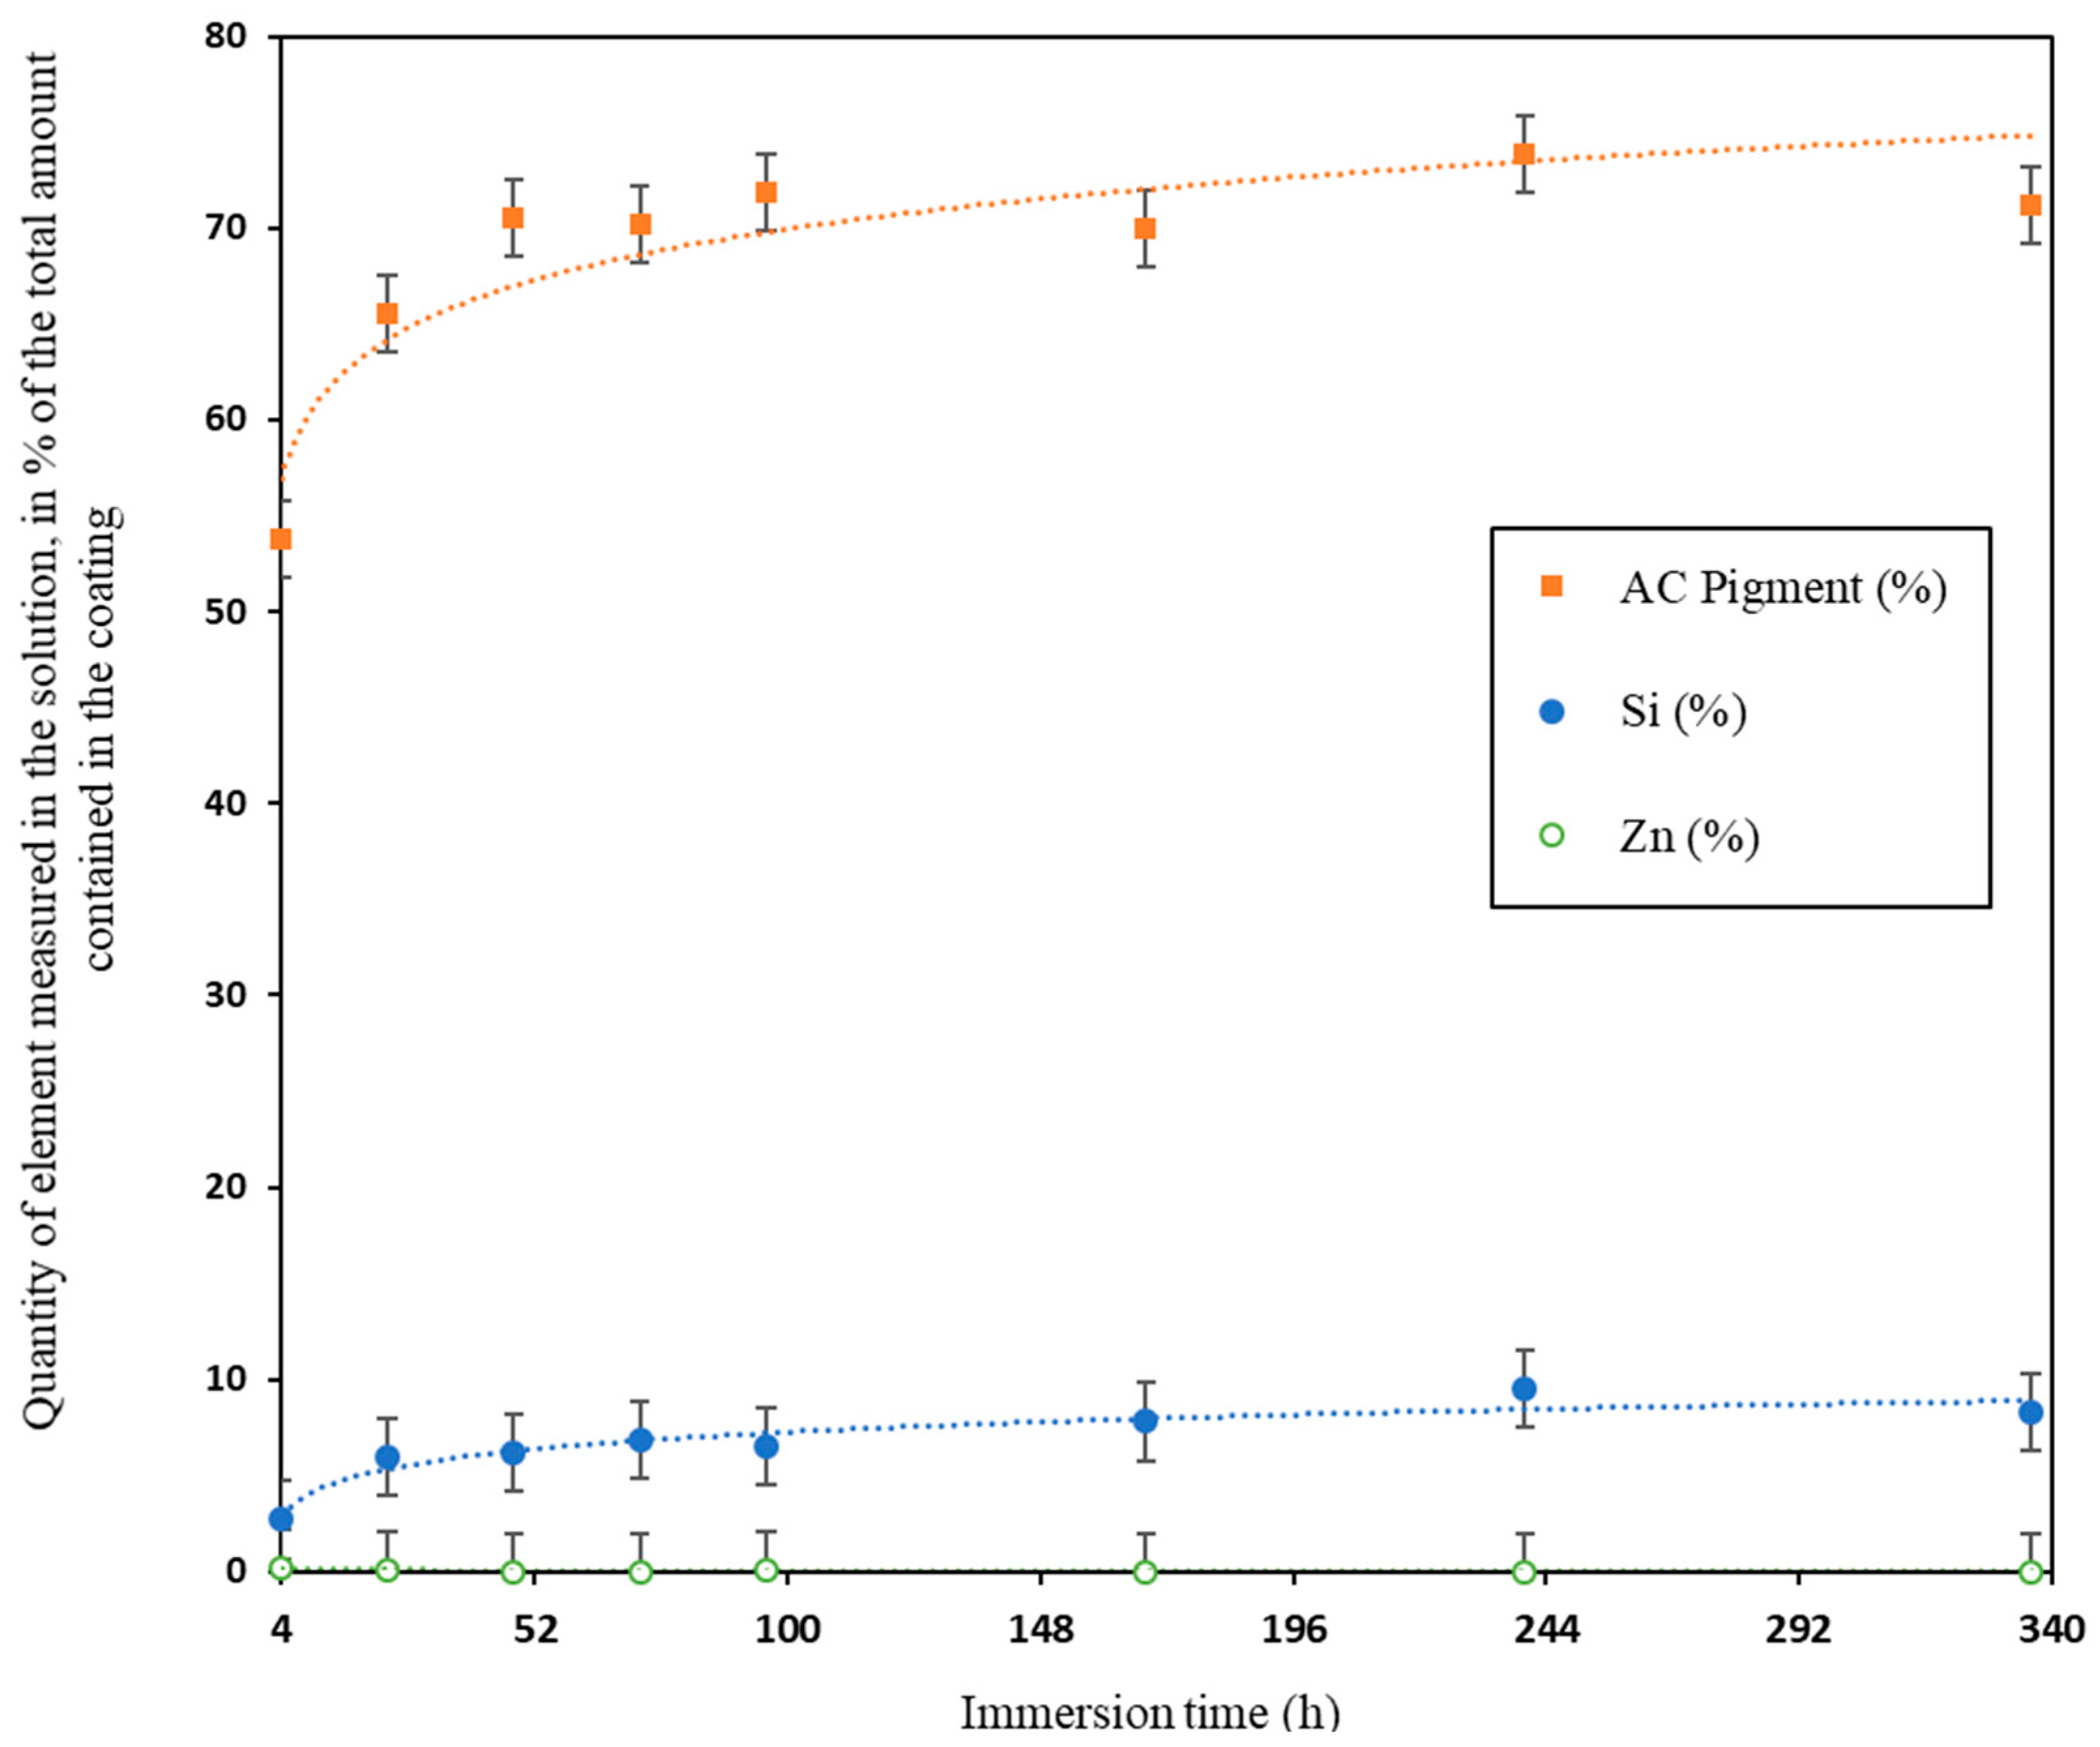
3.1. Release Kinetics of Coatings Components
3.2. Corrosion Process Monitoring
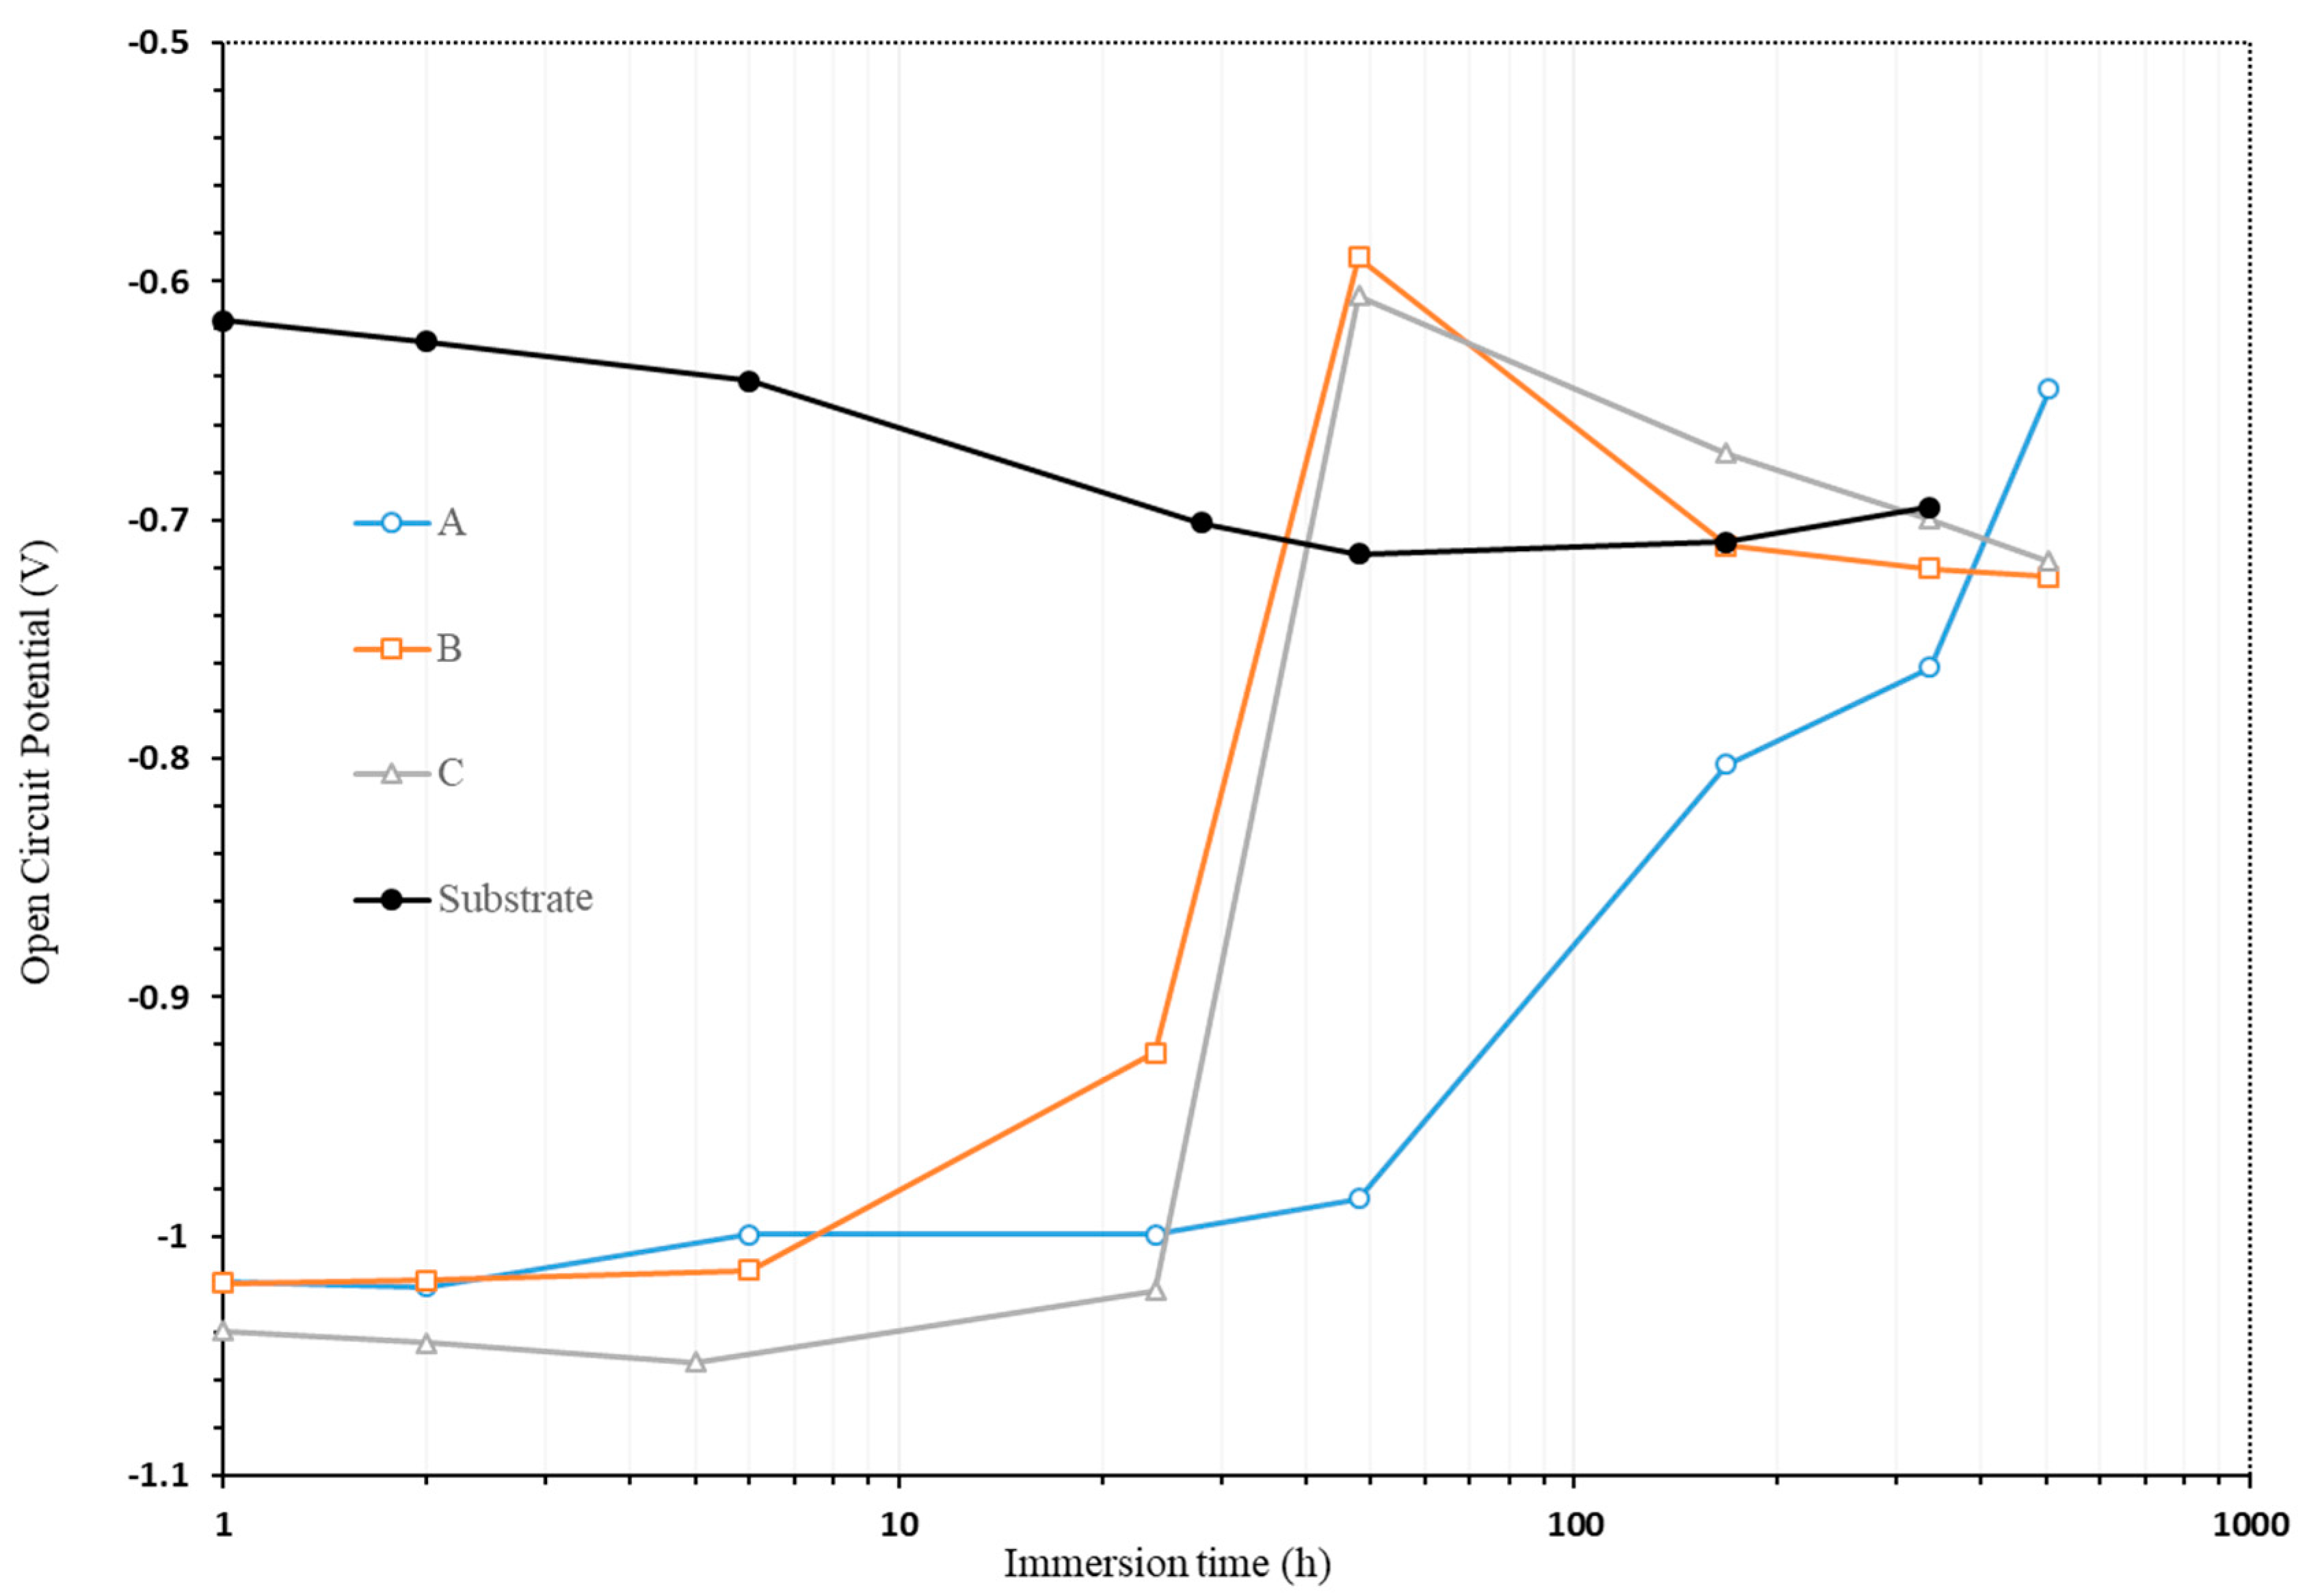
3.2.1. OCP Study
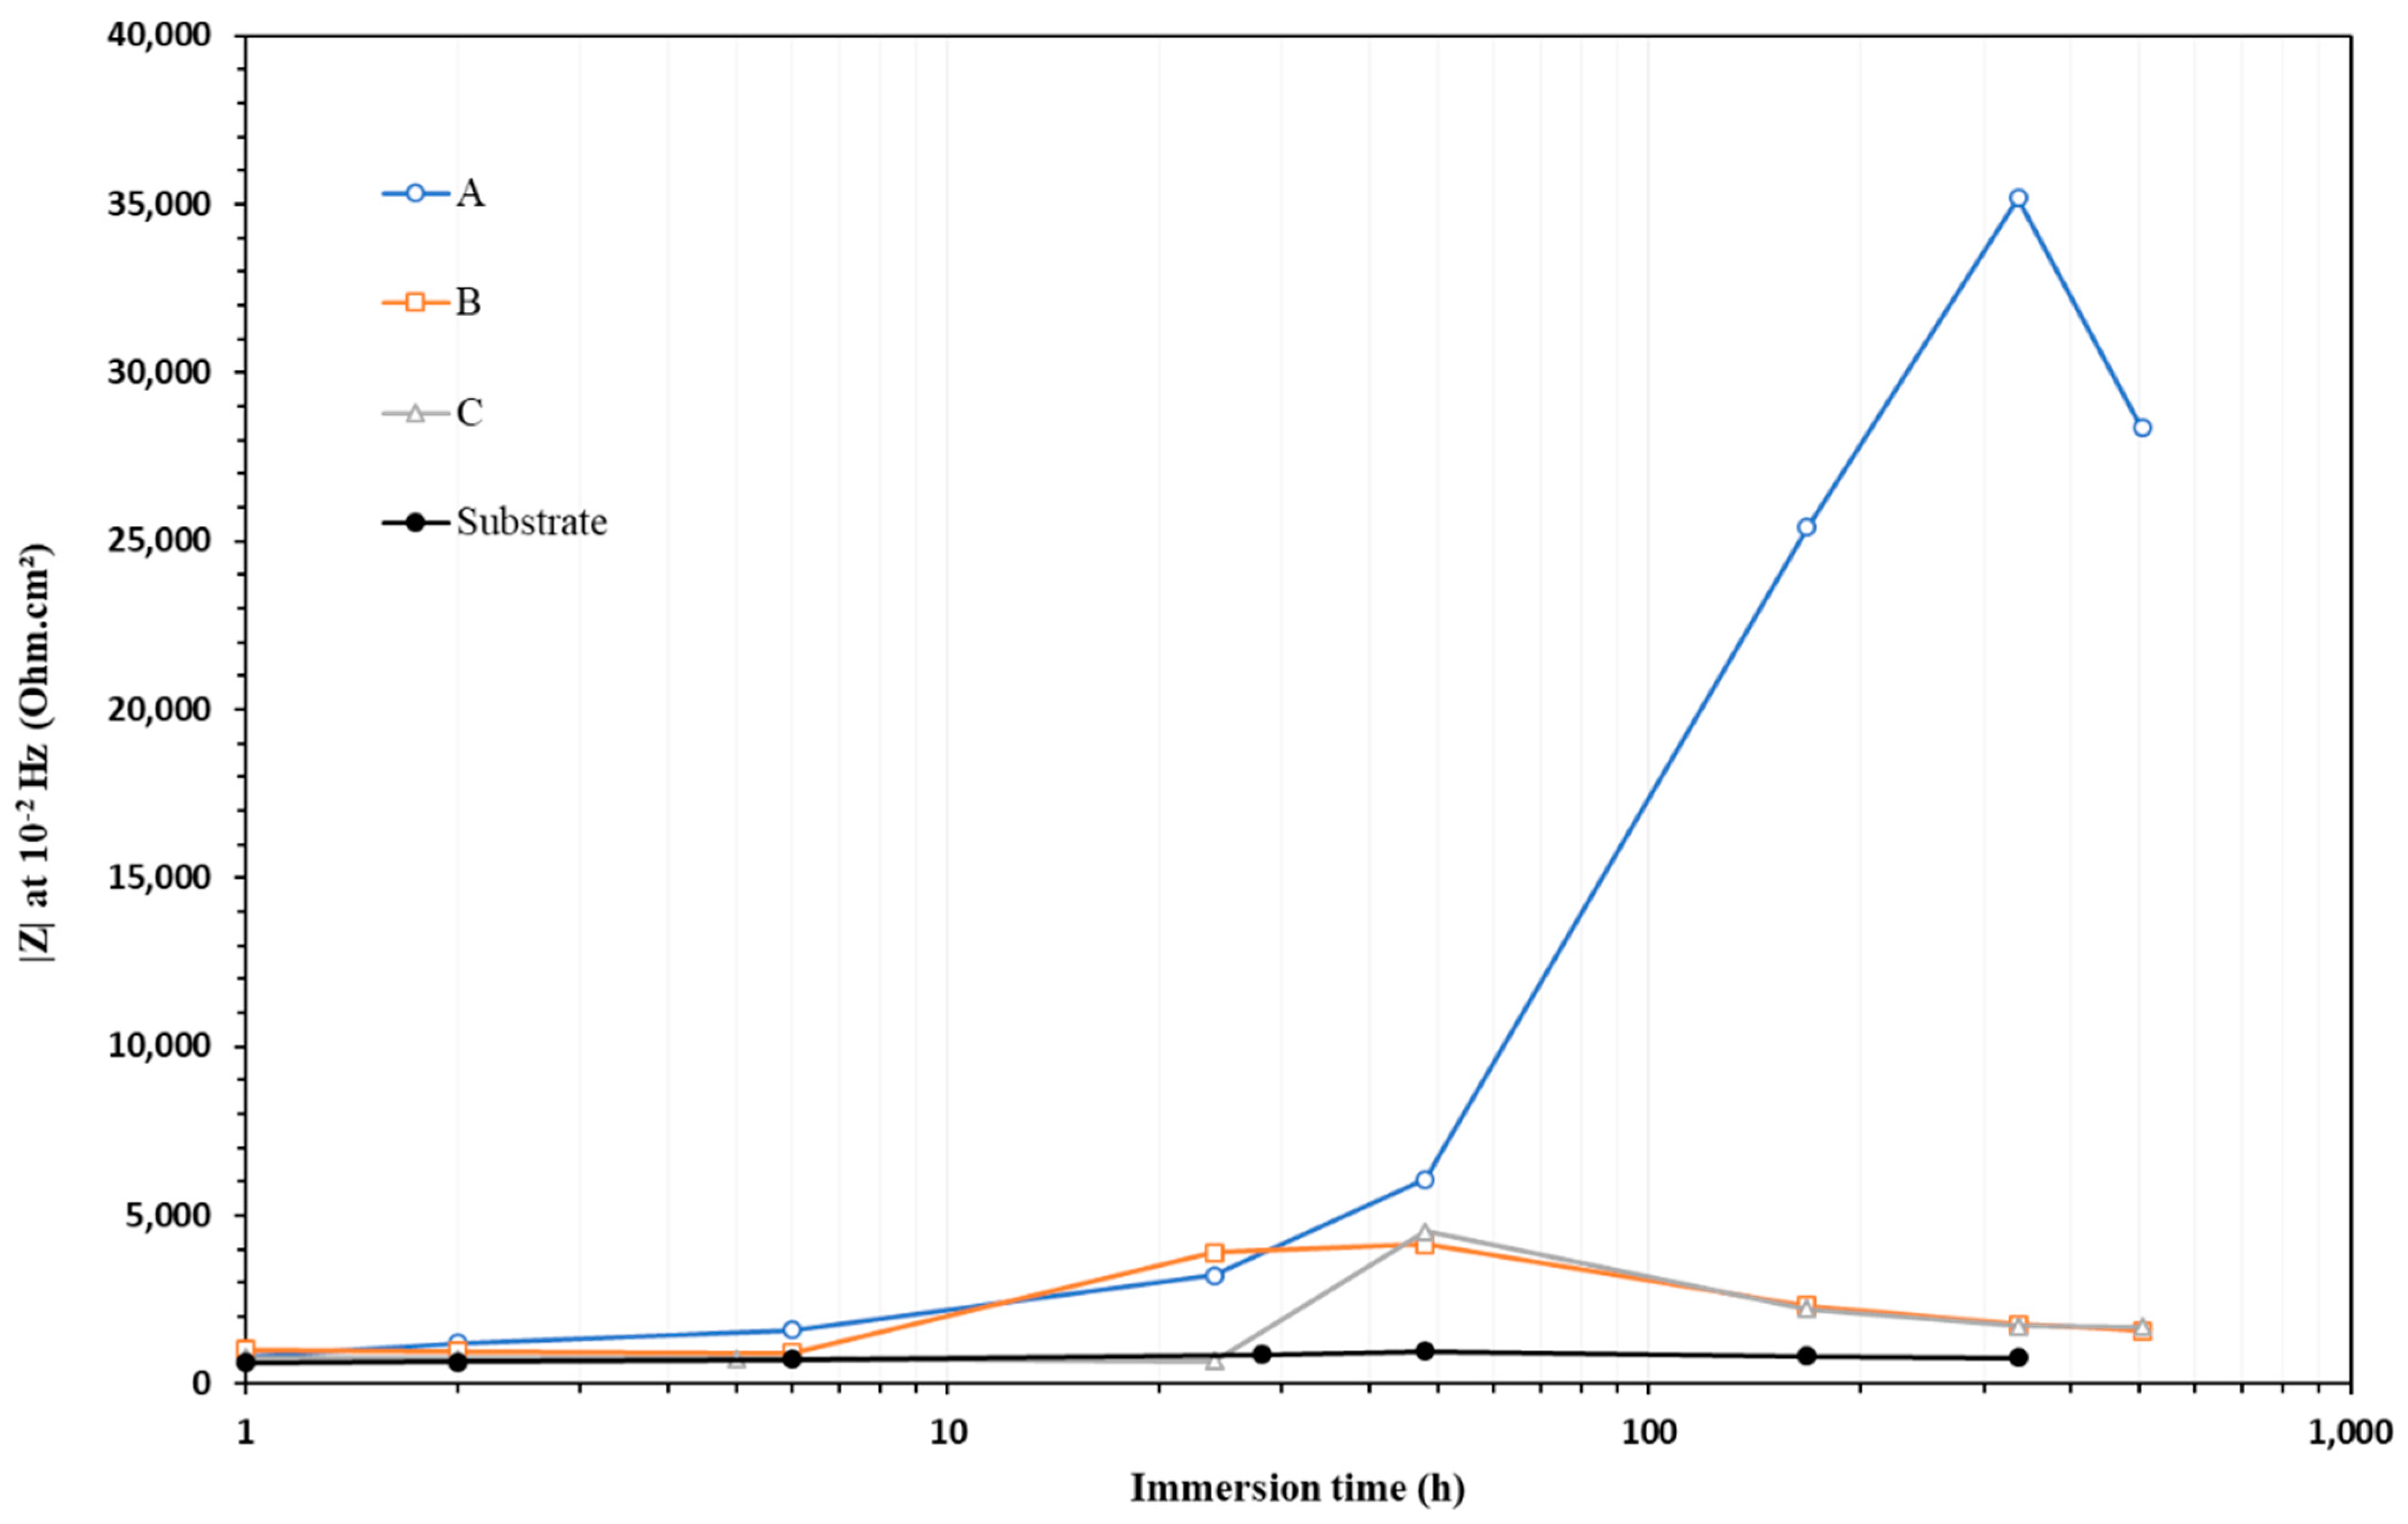
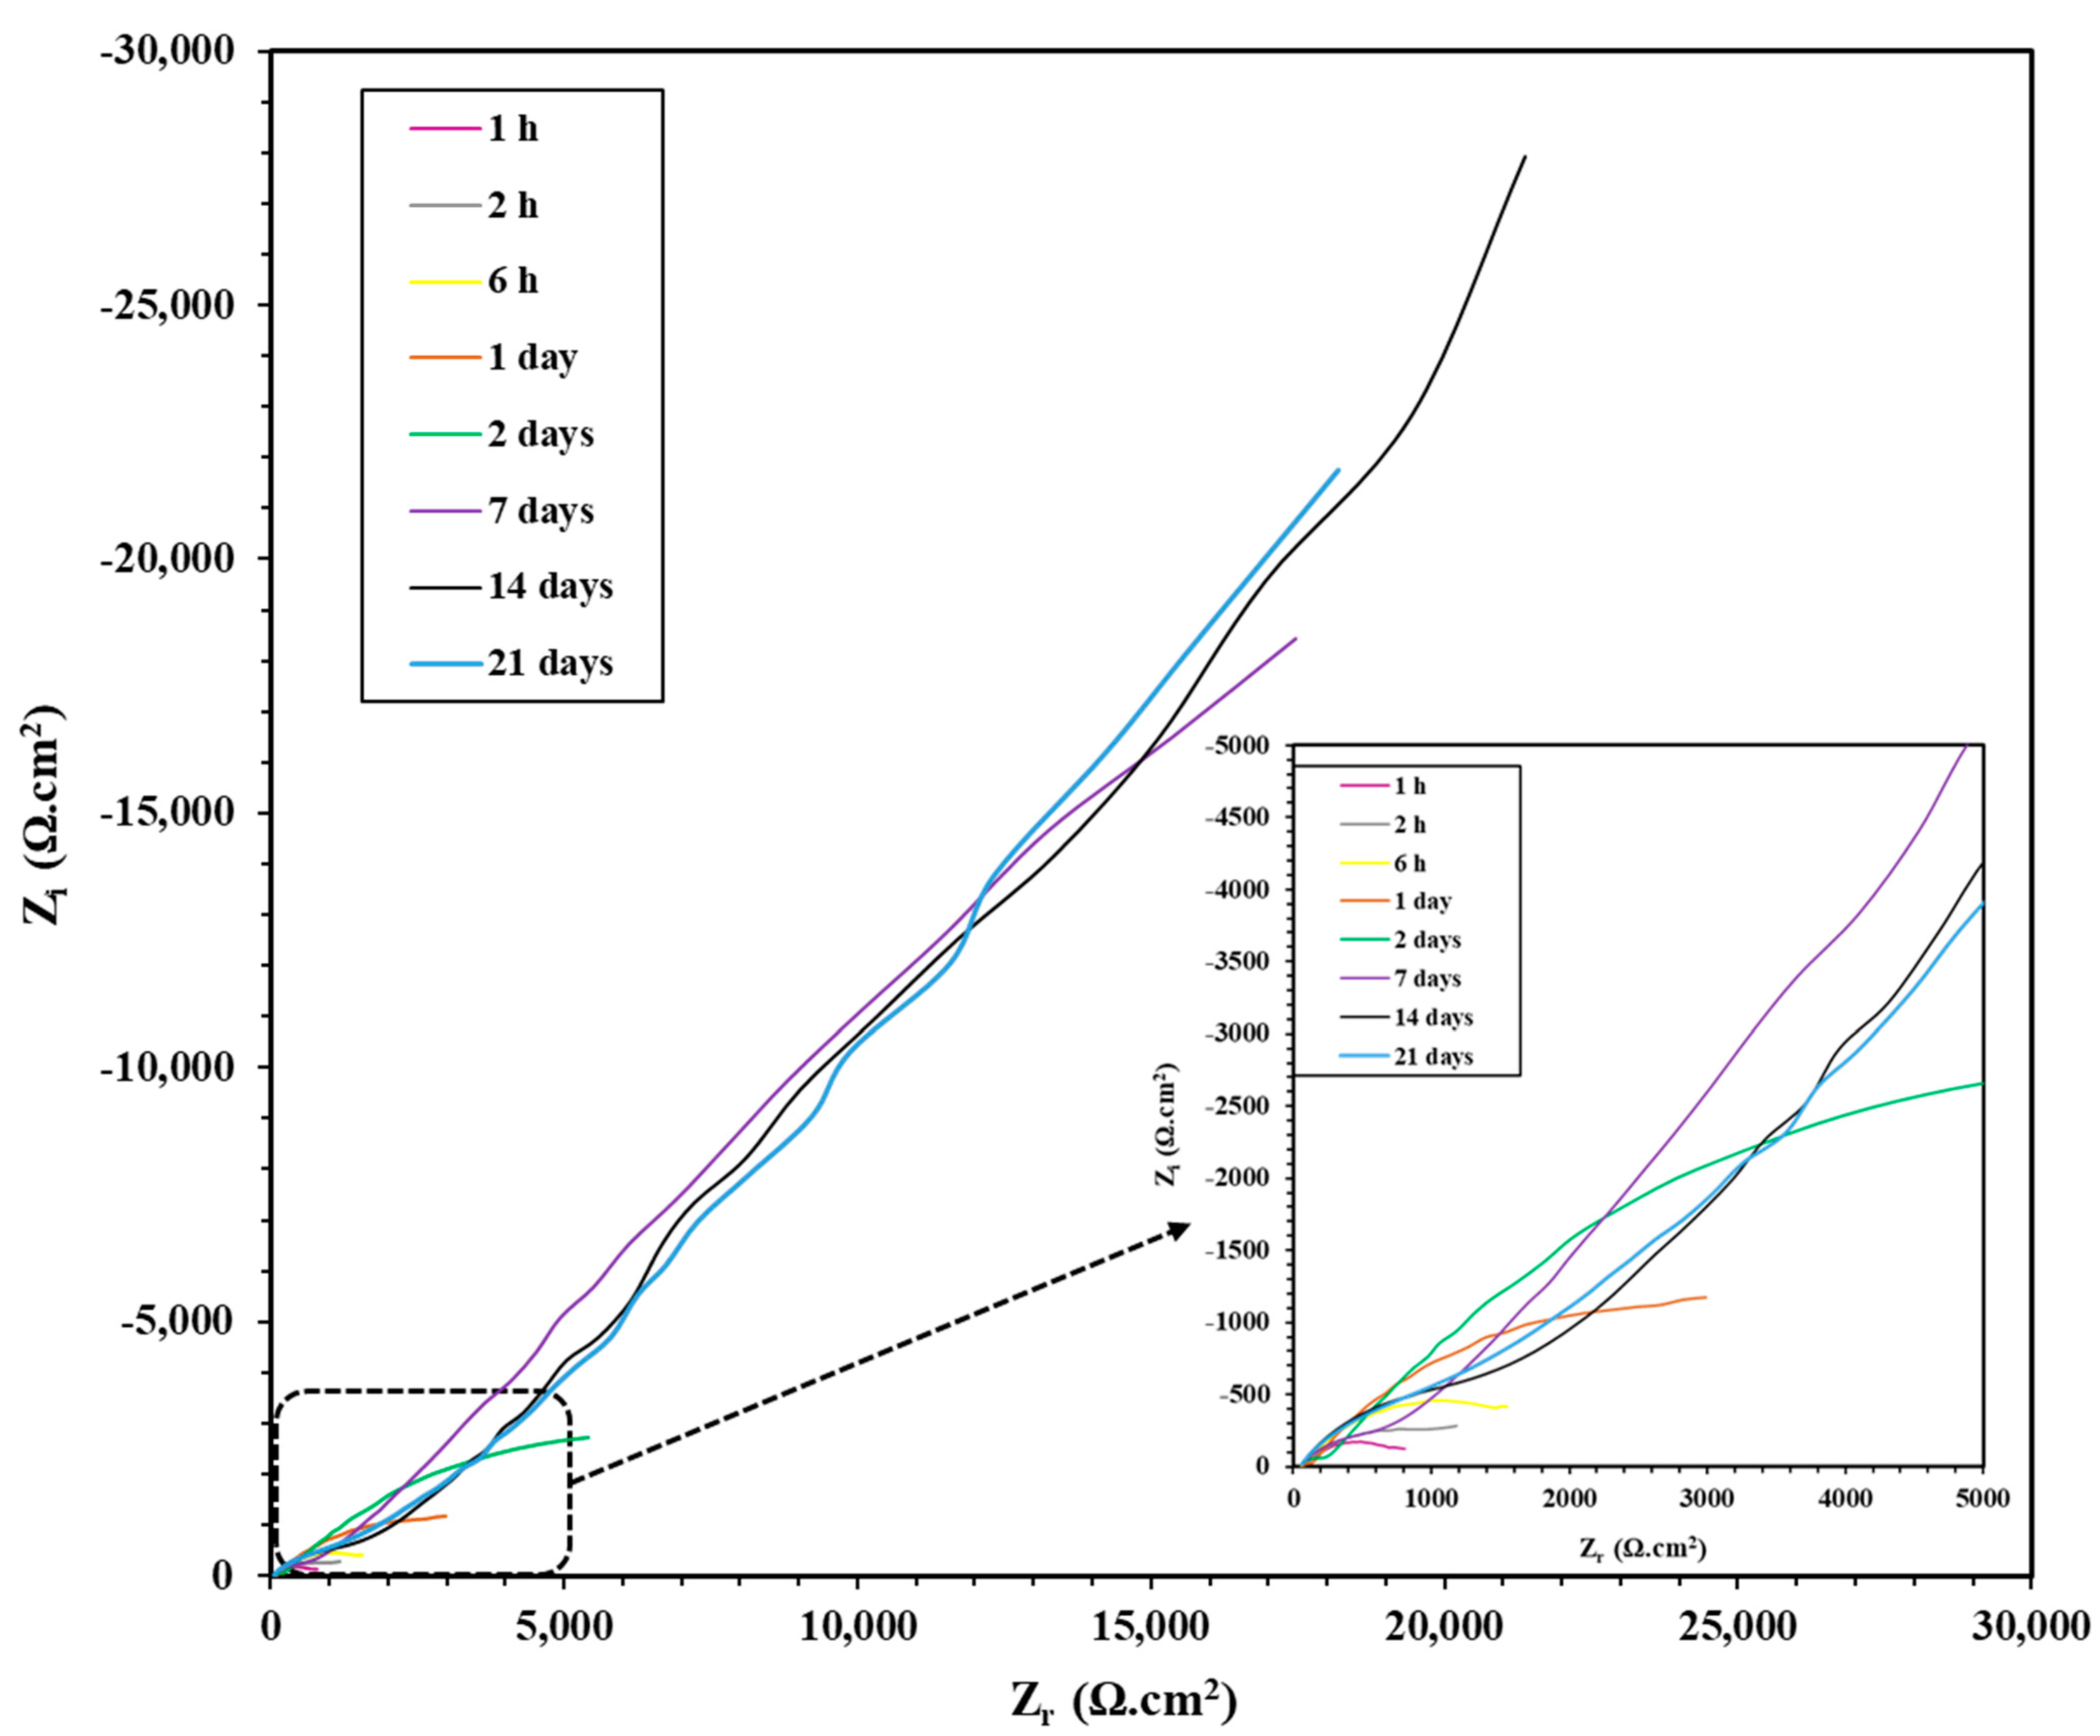
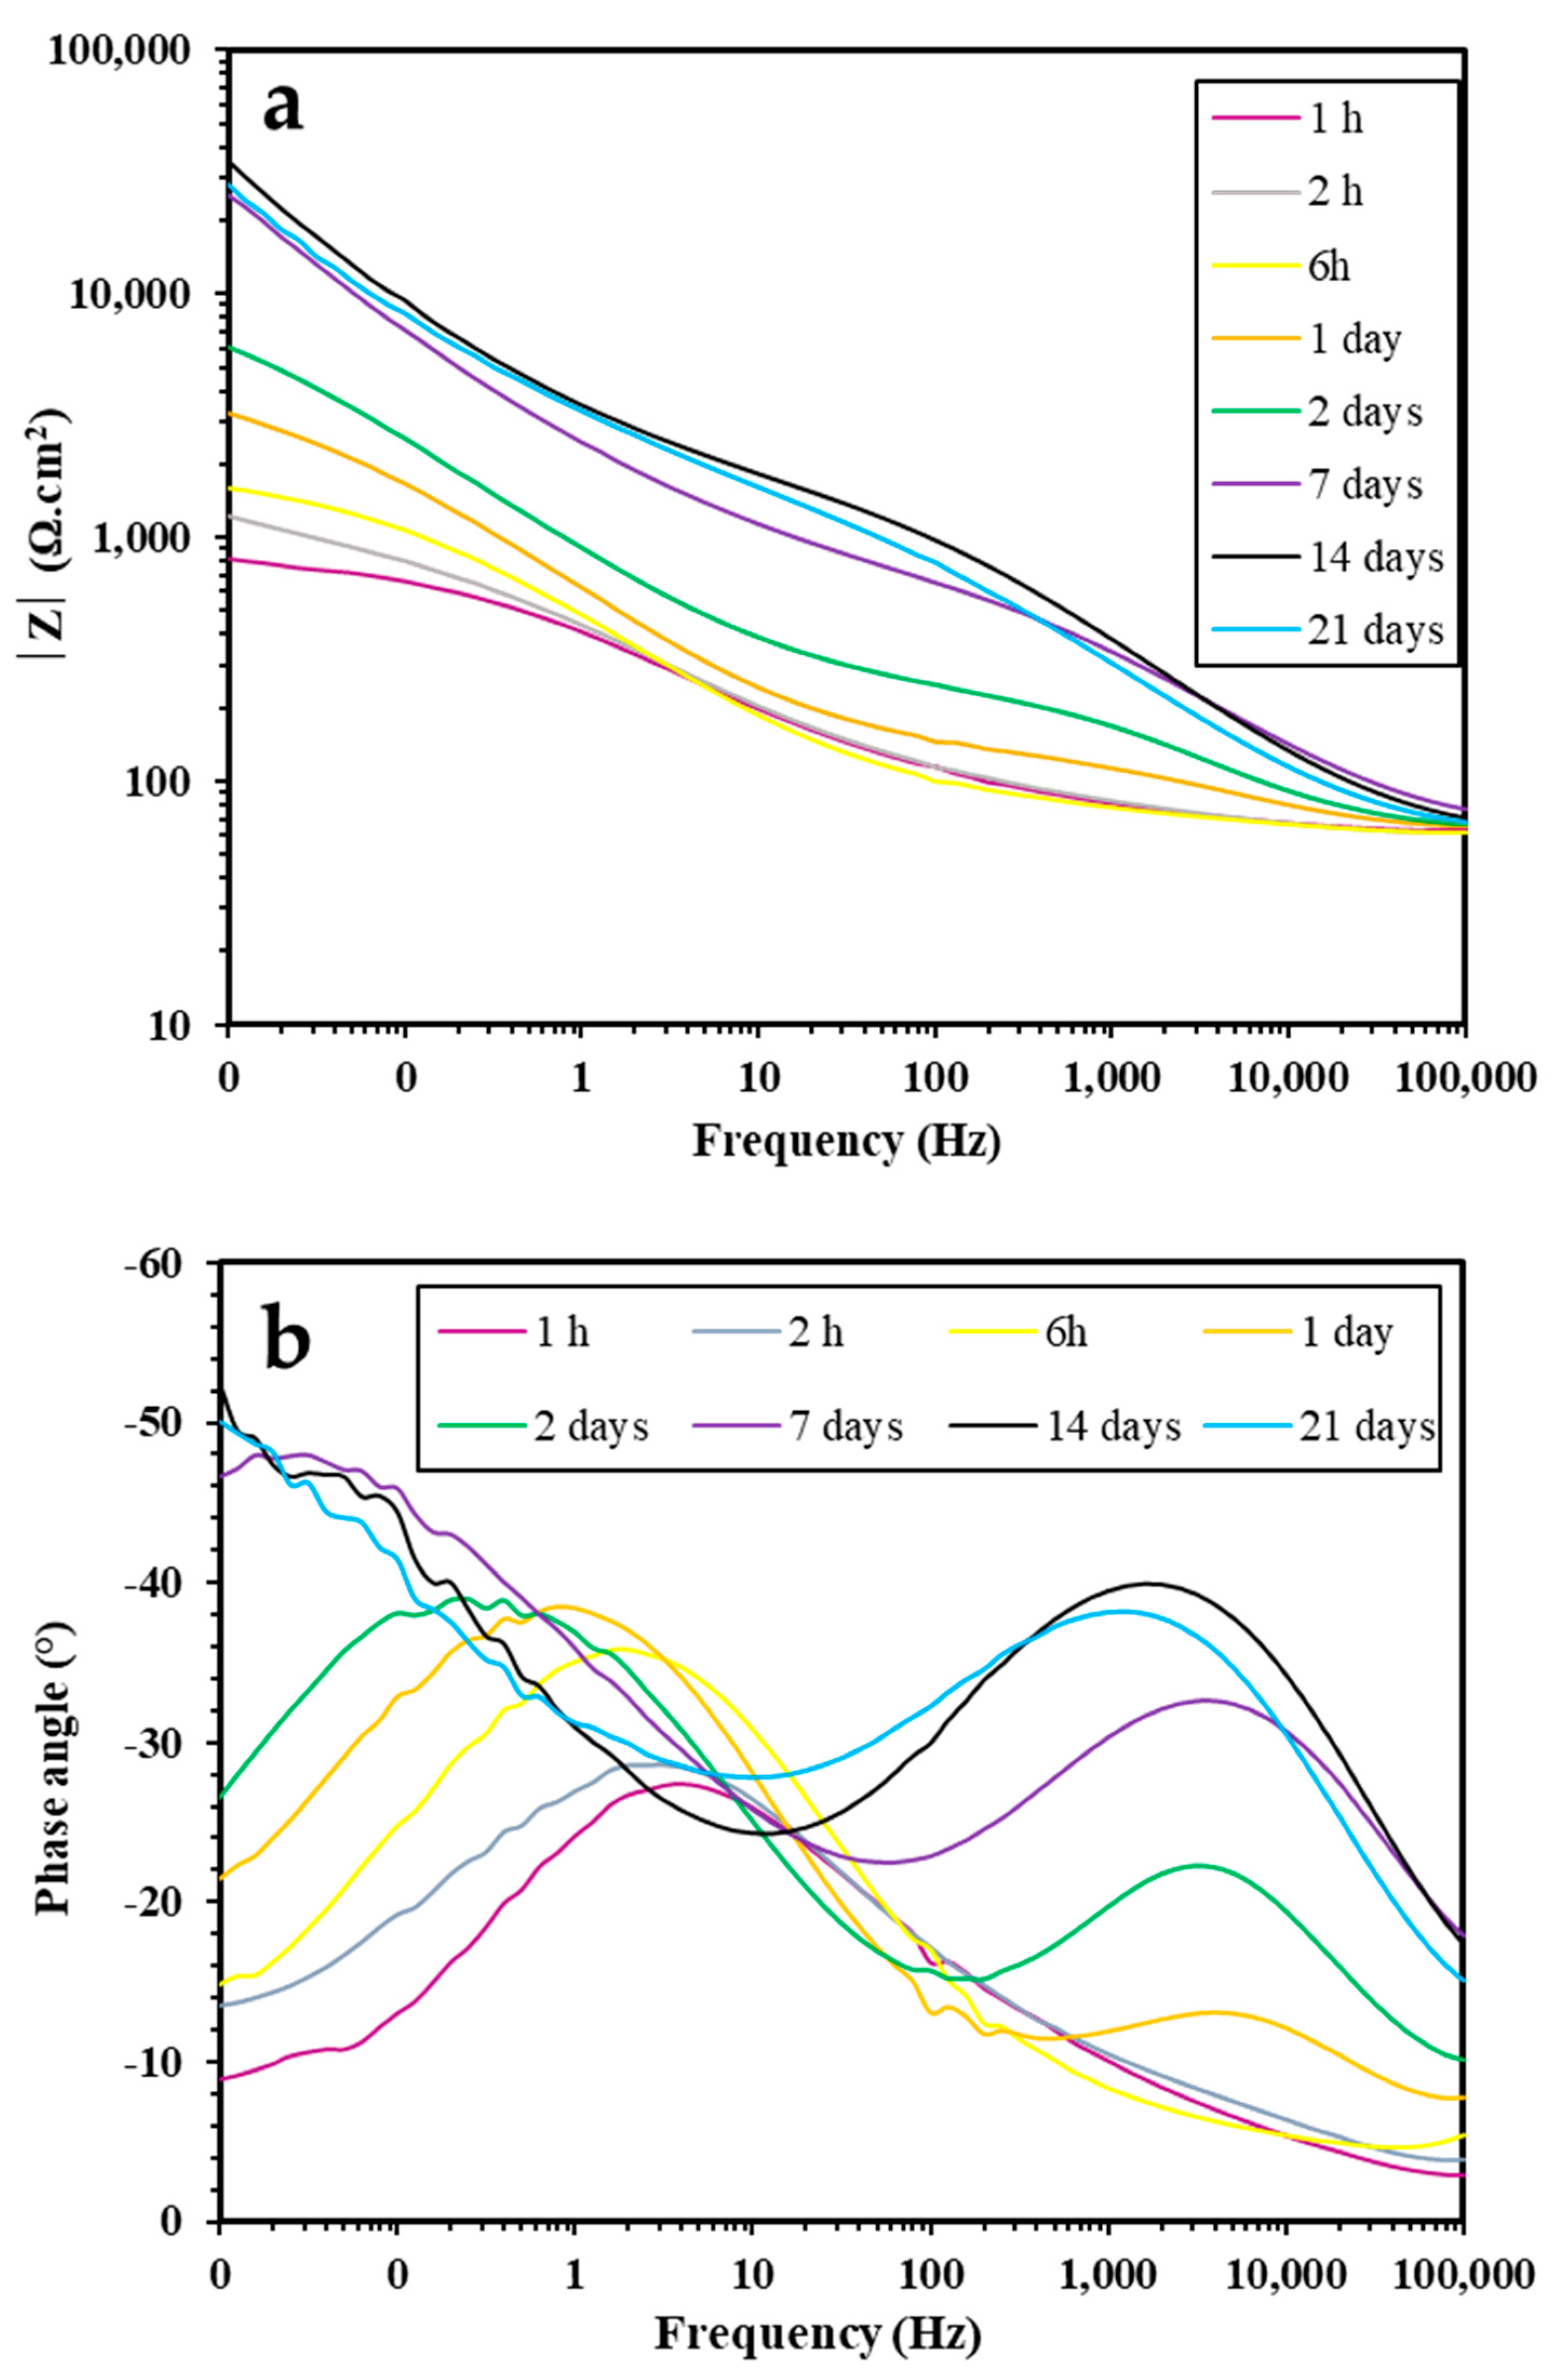
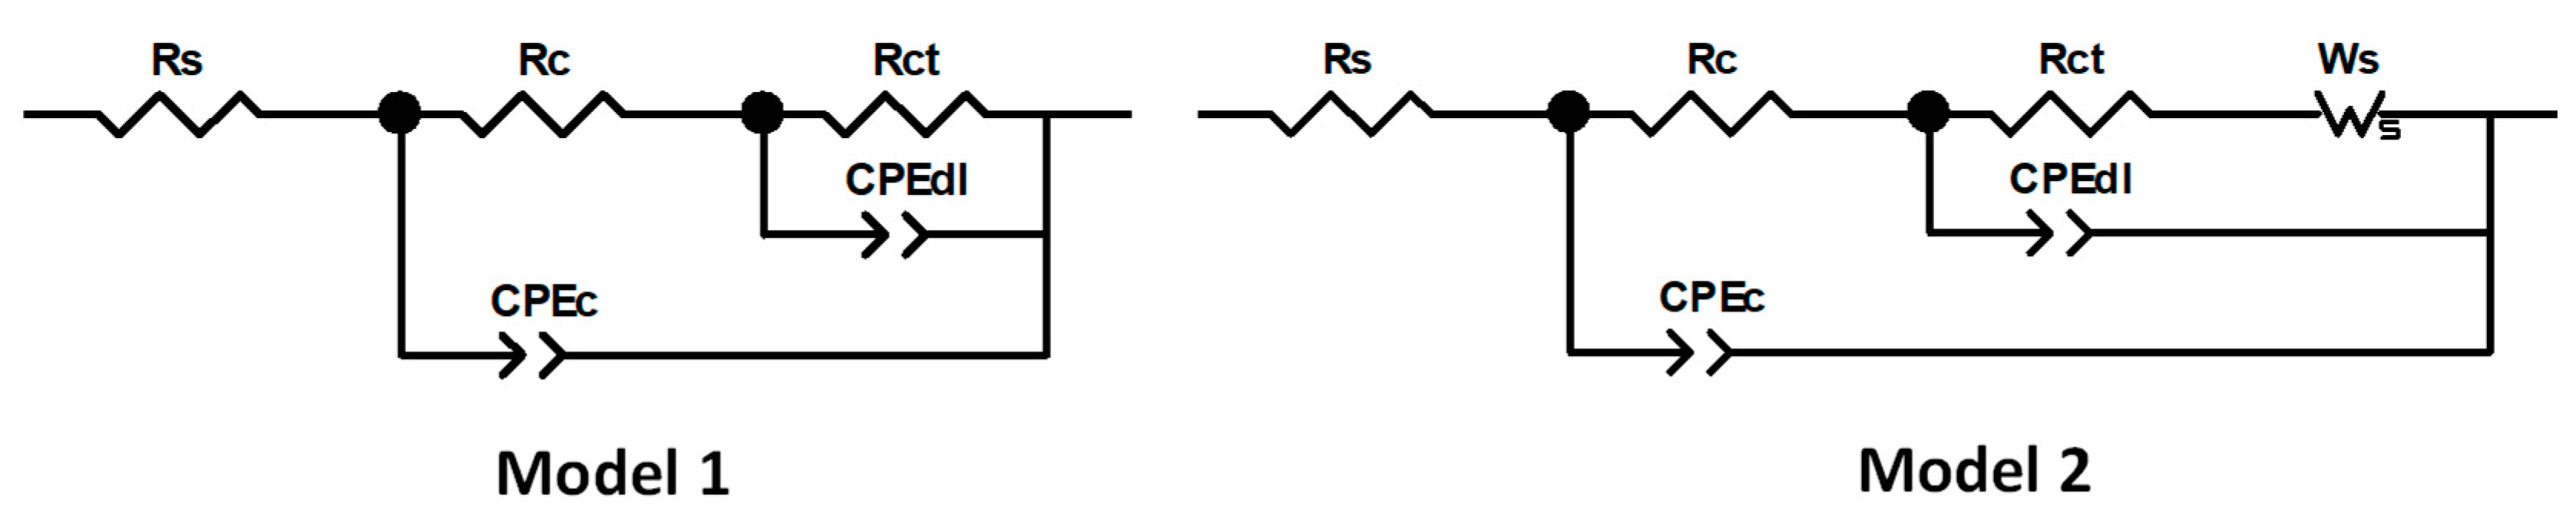
3.2.2. EIS Study
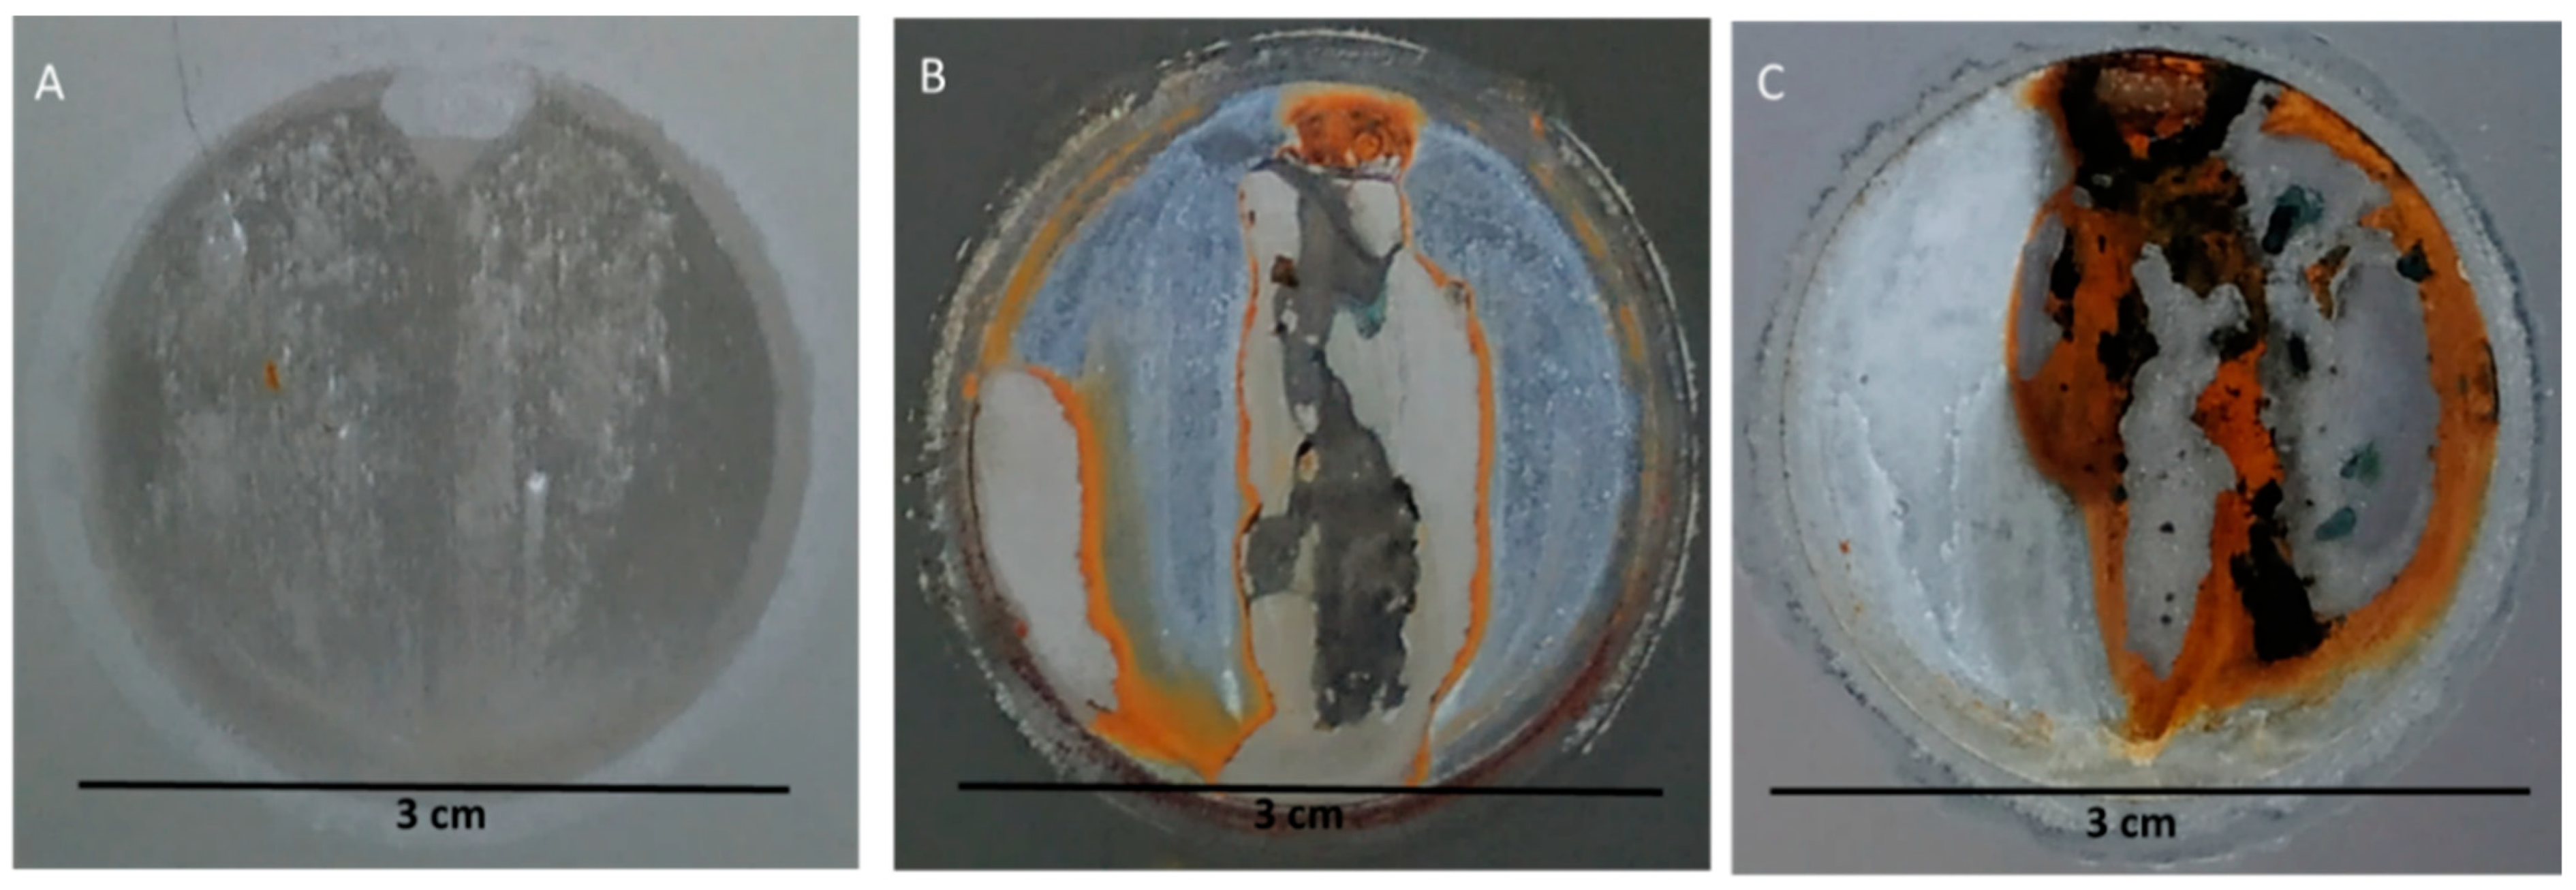
3.2.3. Optical Observation
3.3. Microstructural Characterization
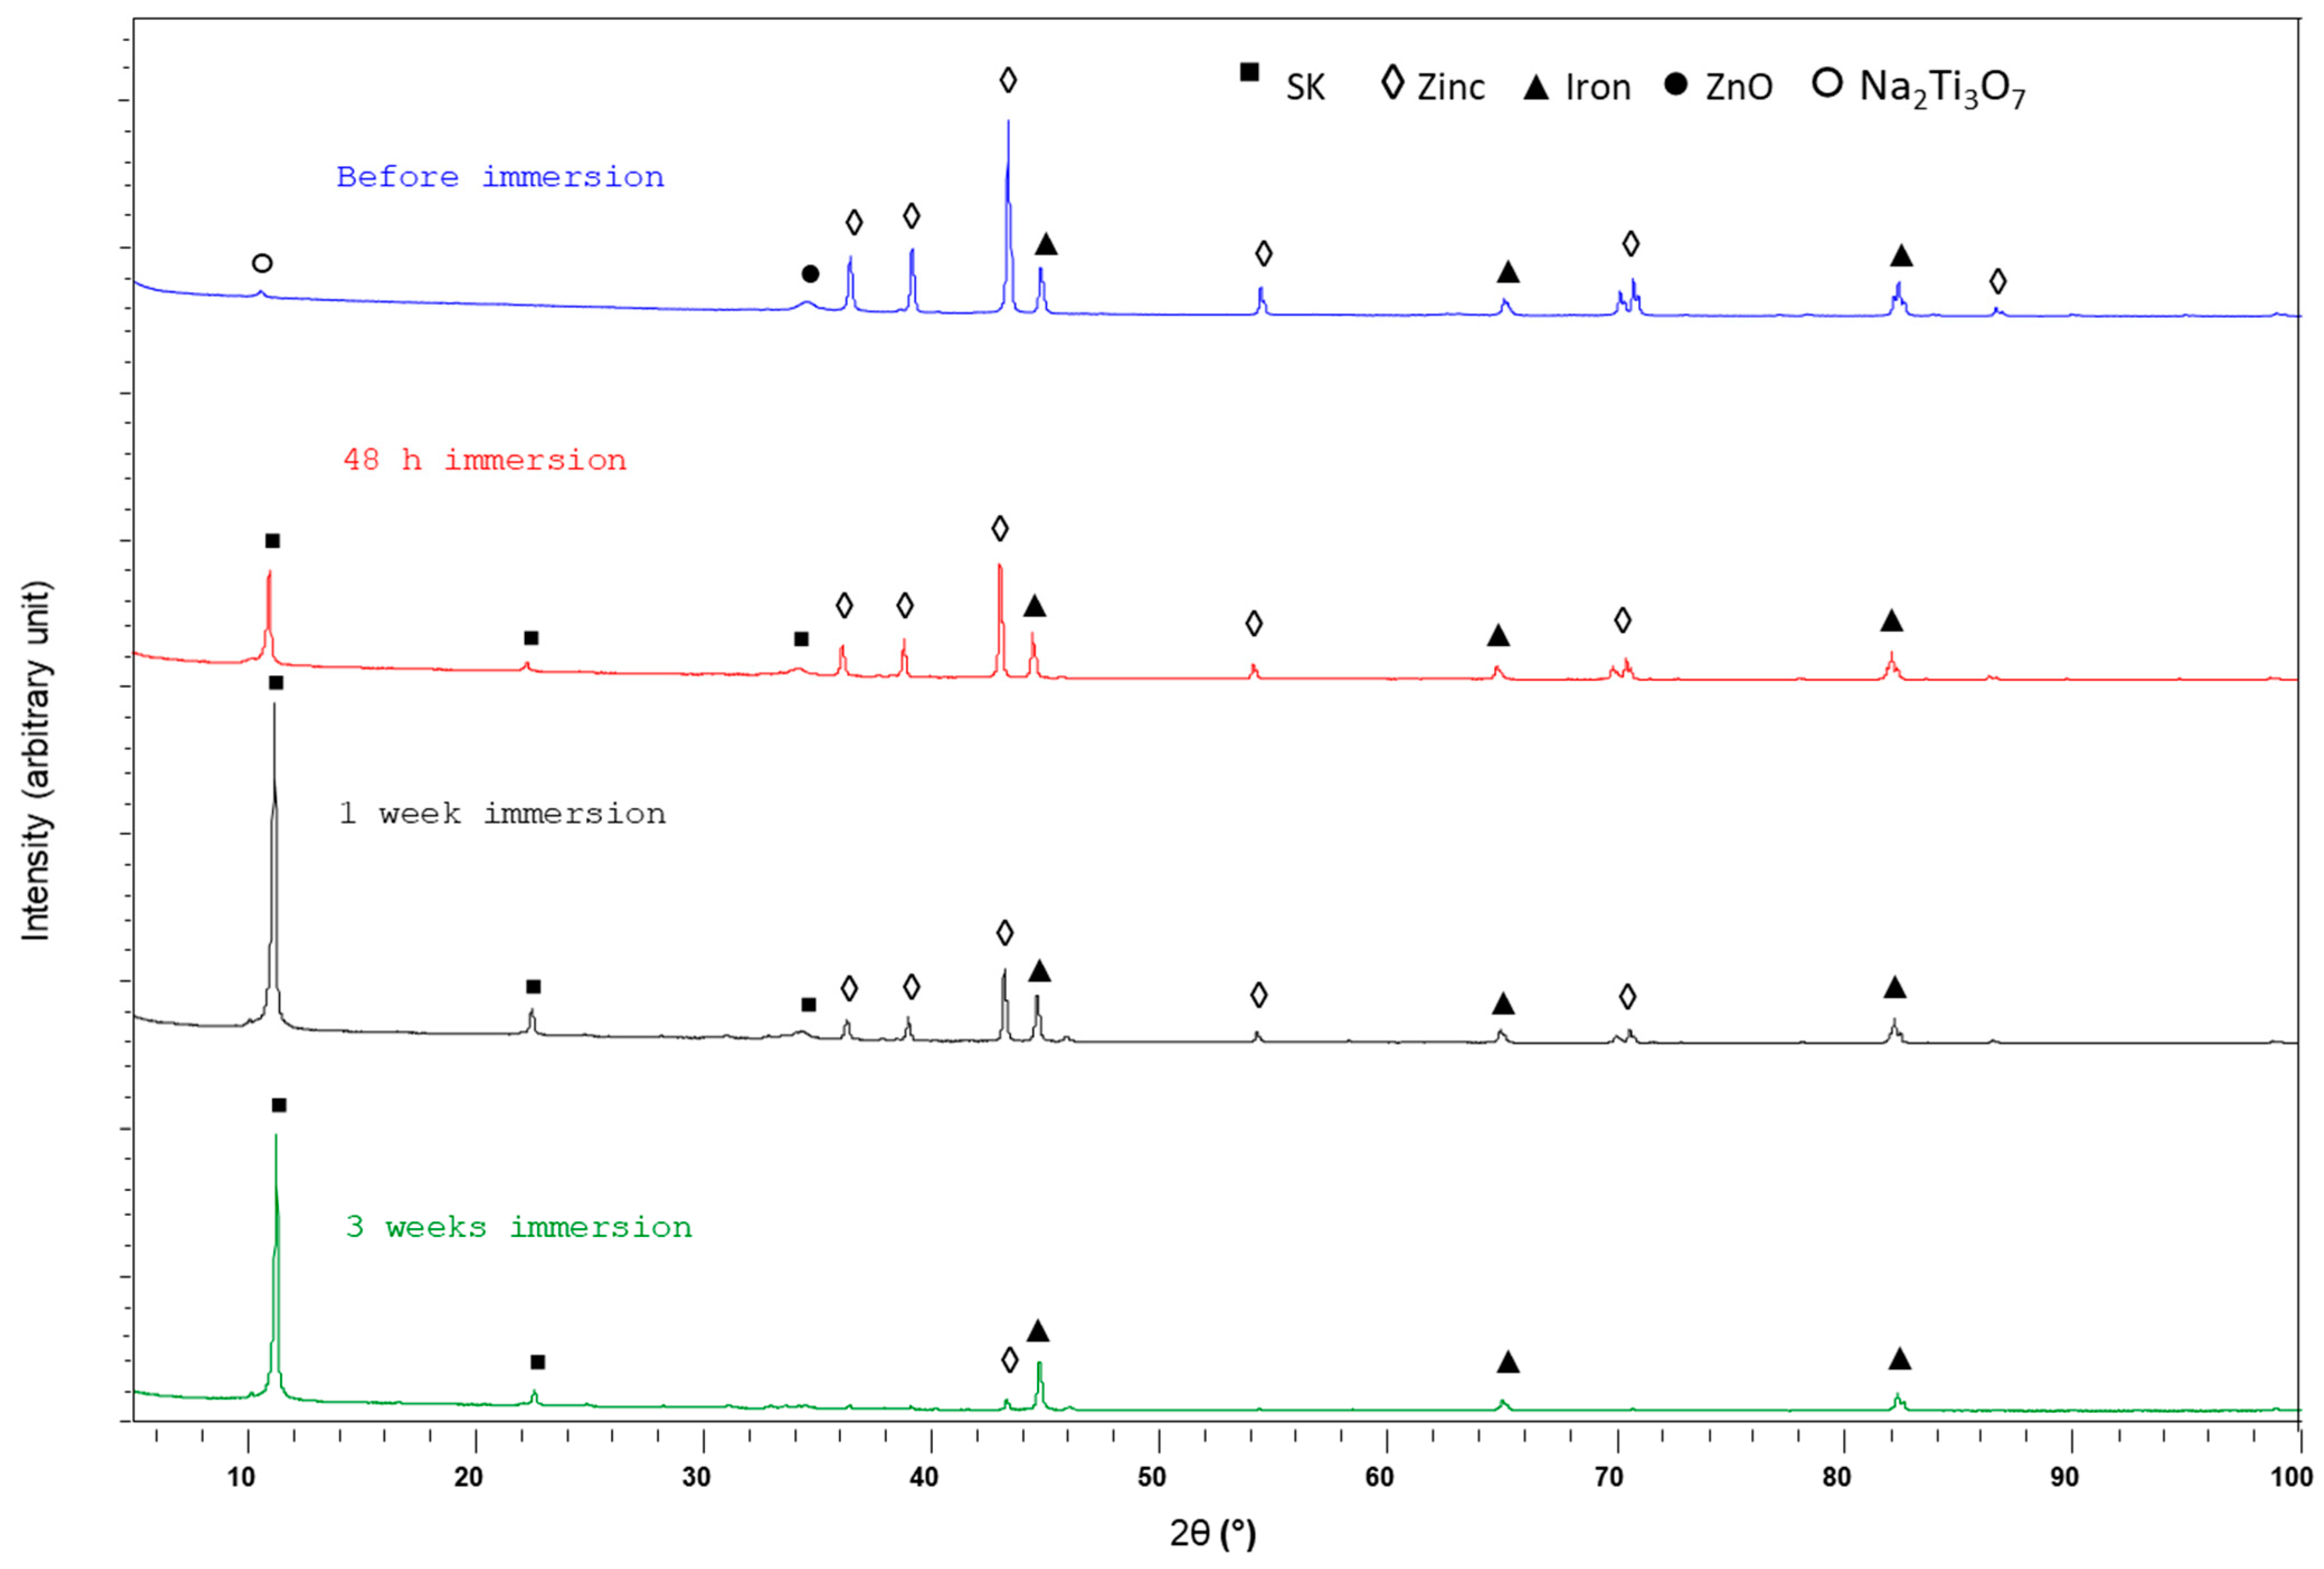
3.3.1. XRD Study
3.3.2. FTIR Study
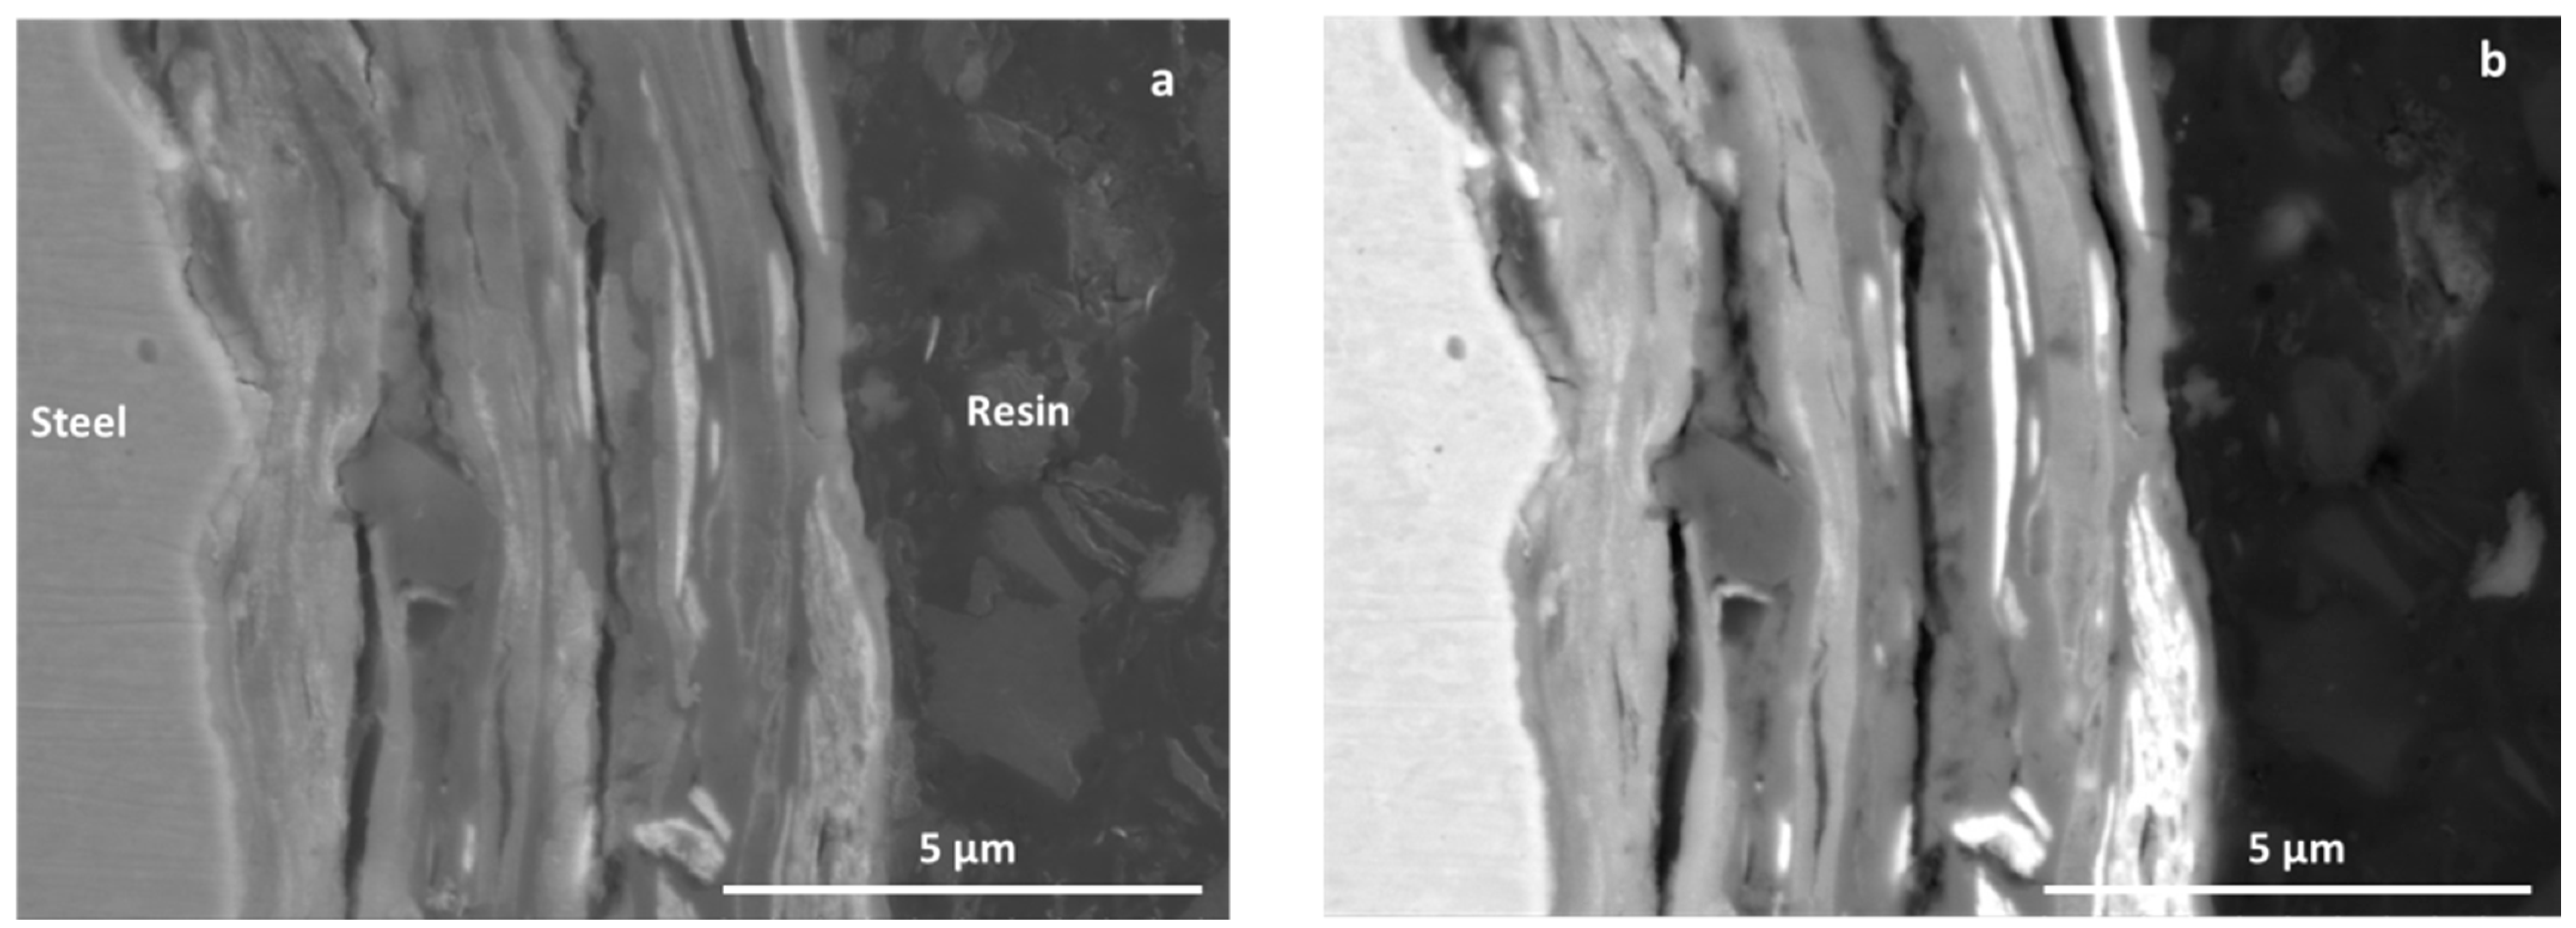
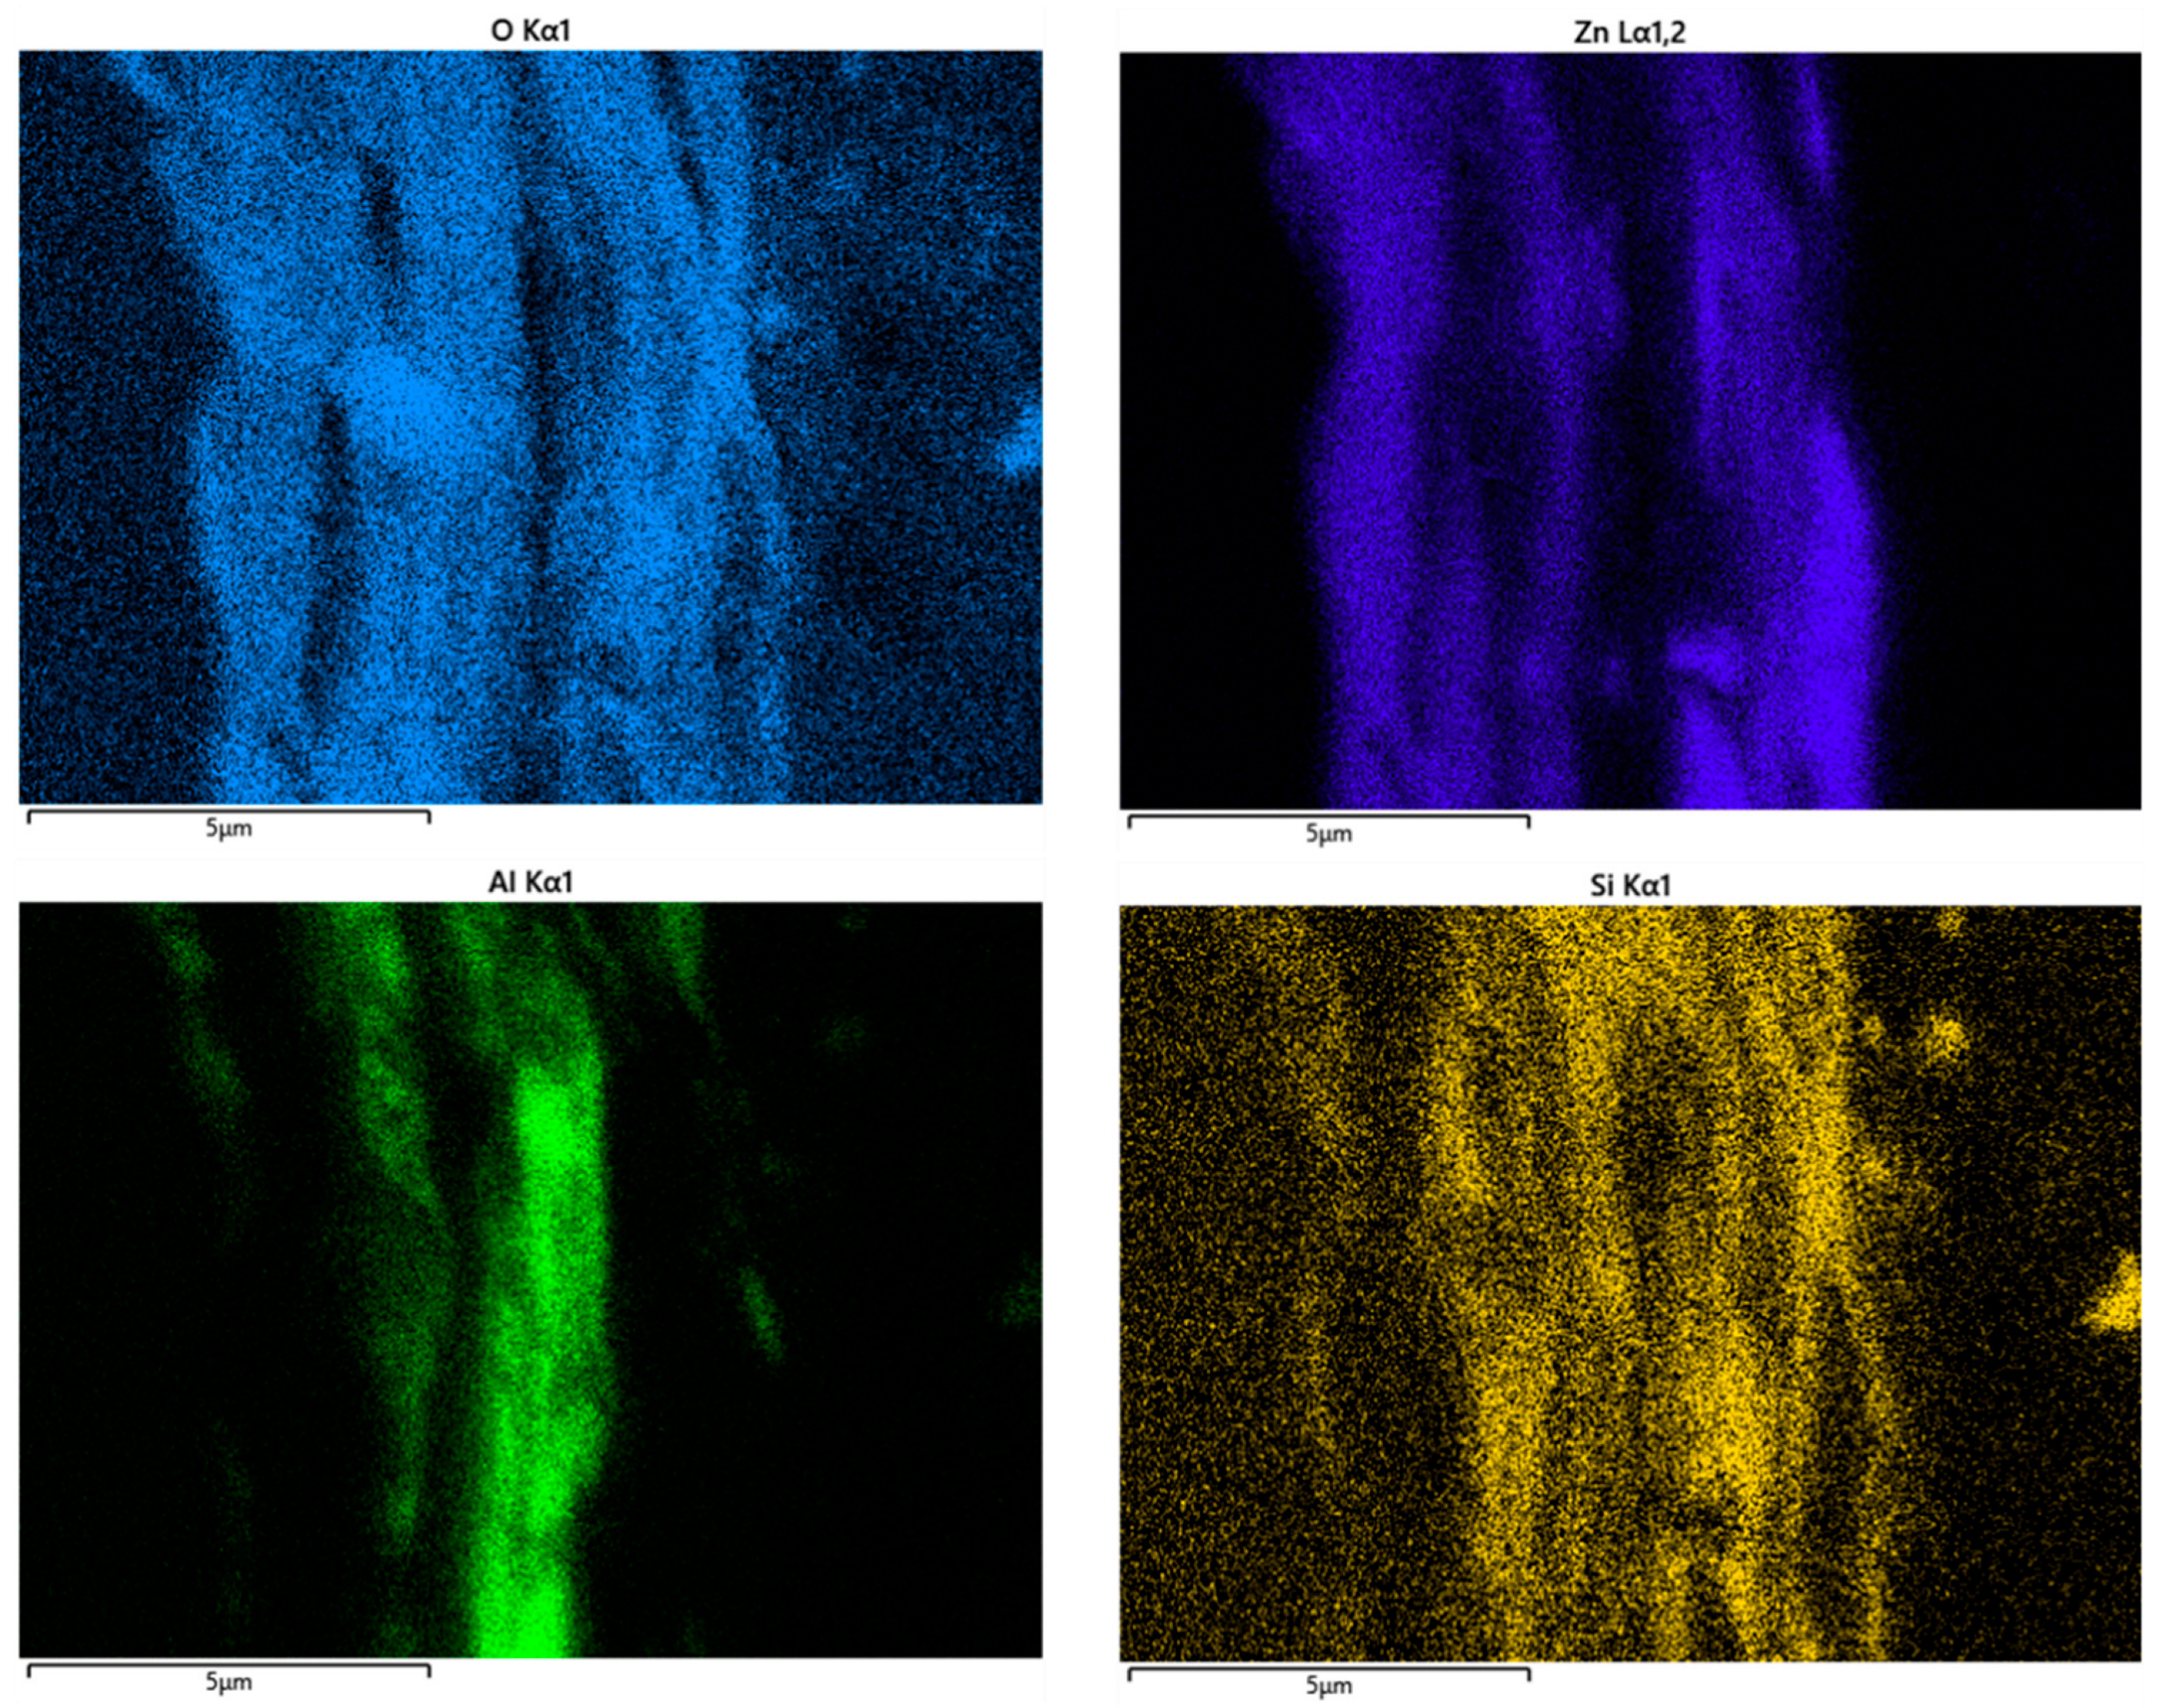
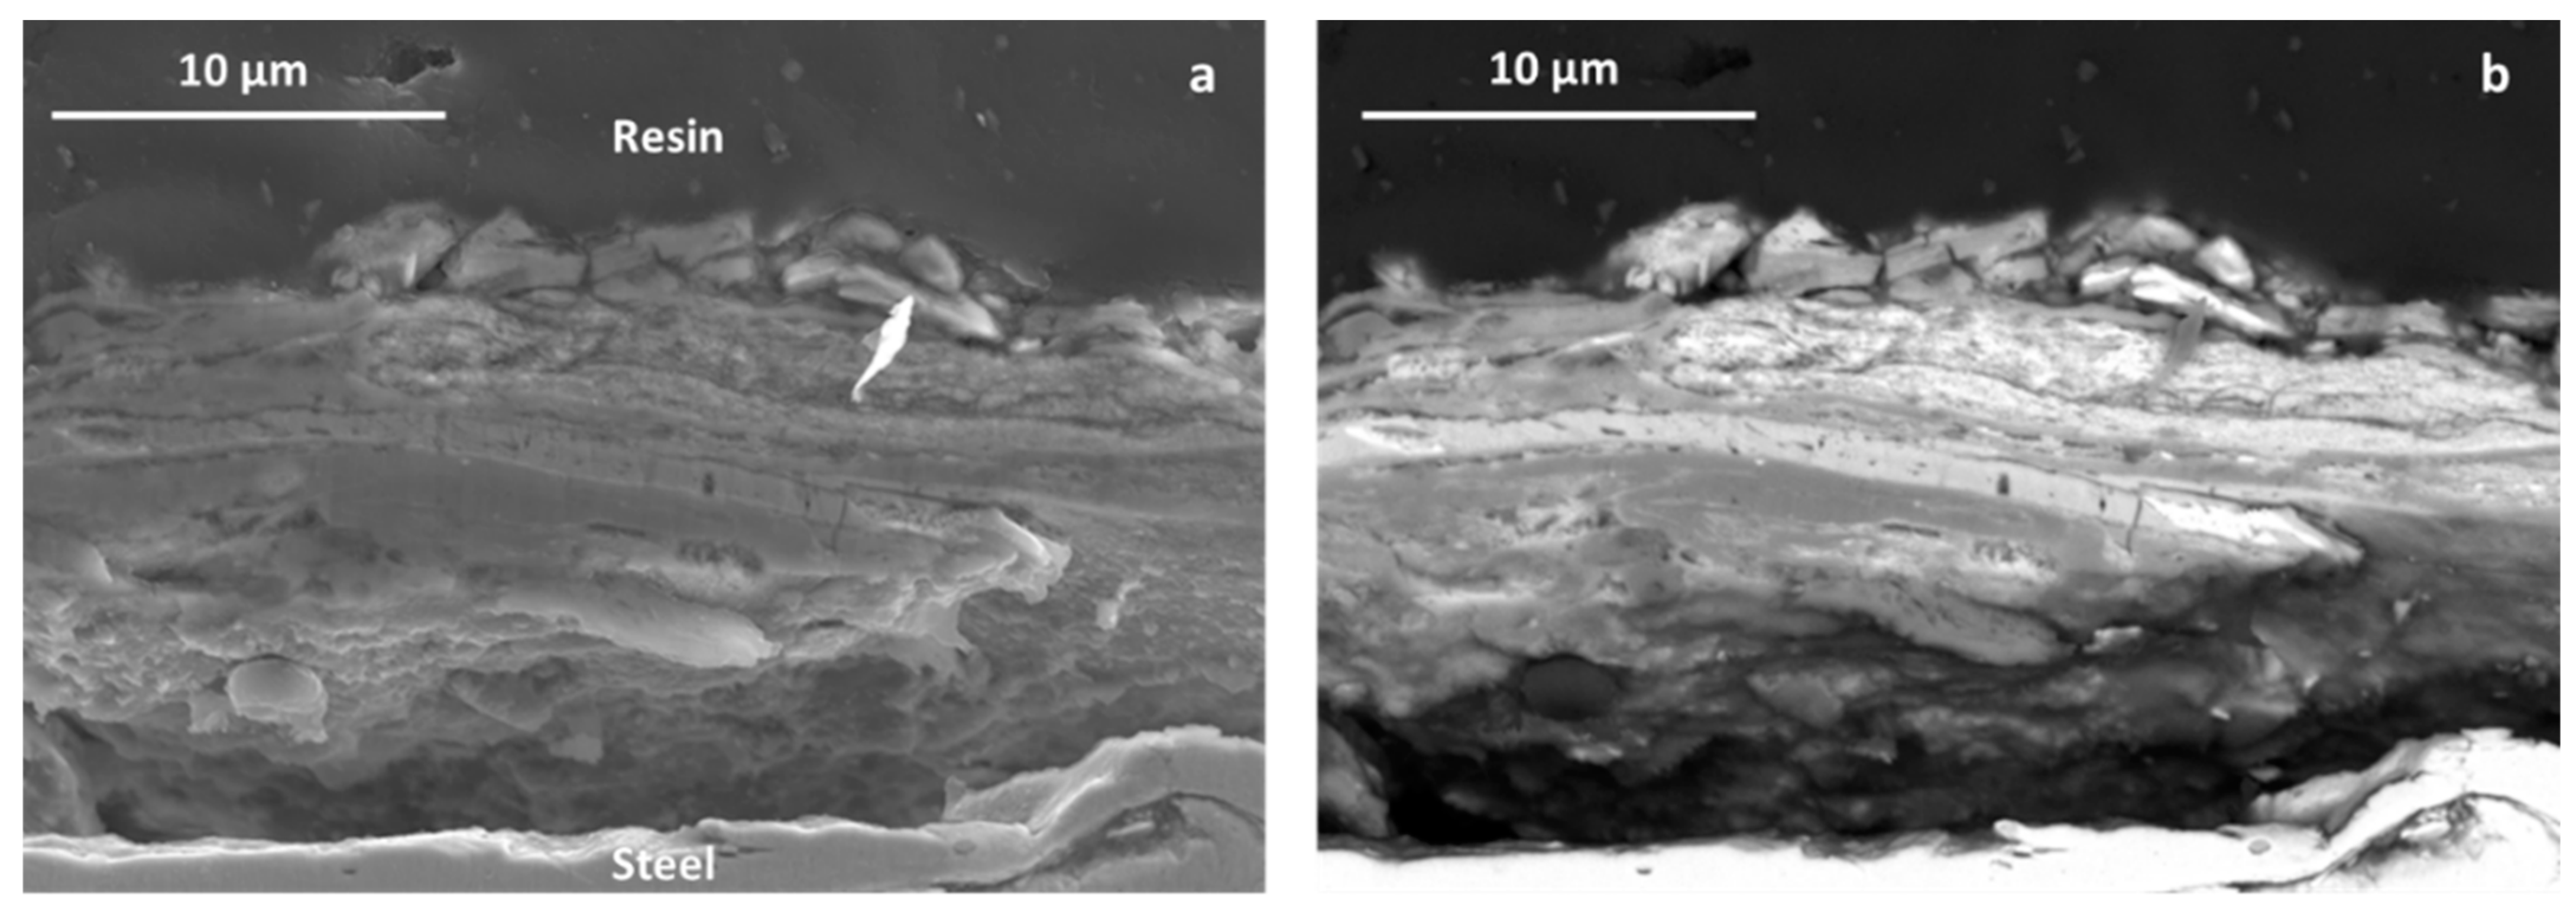
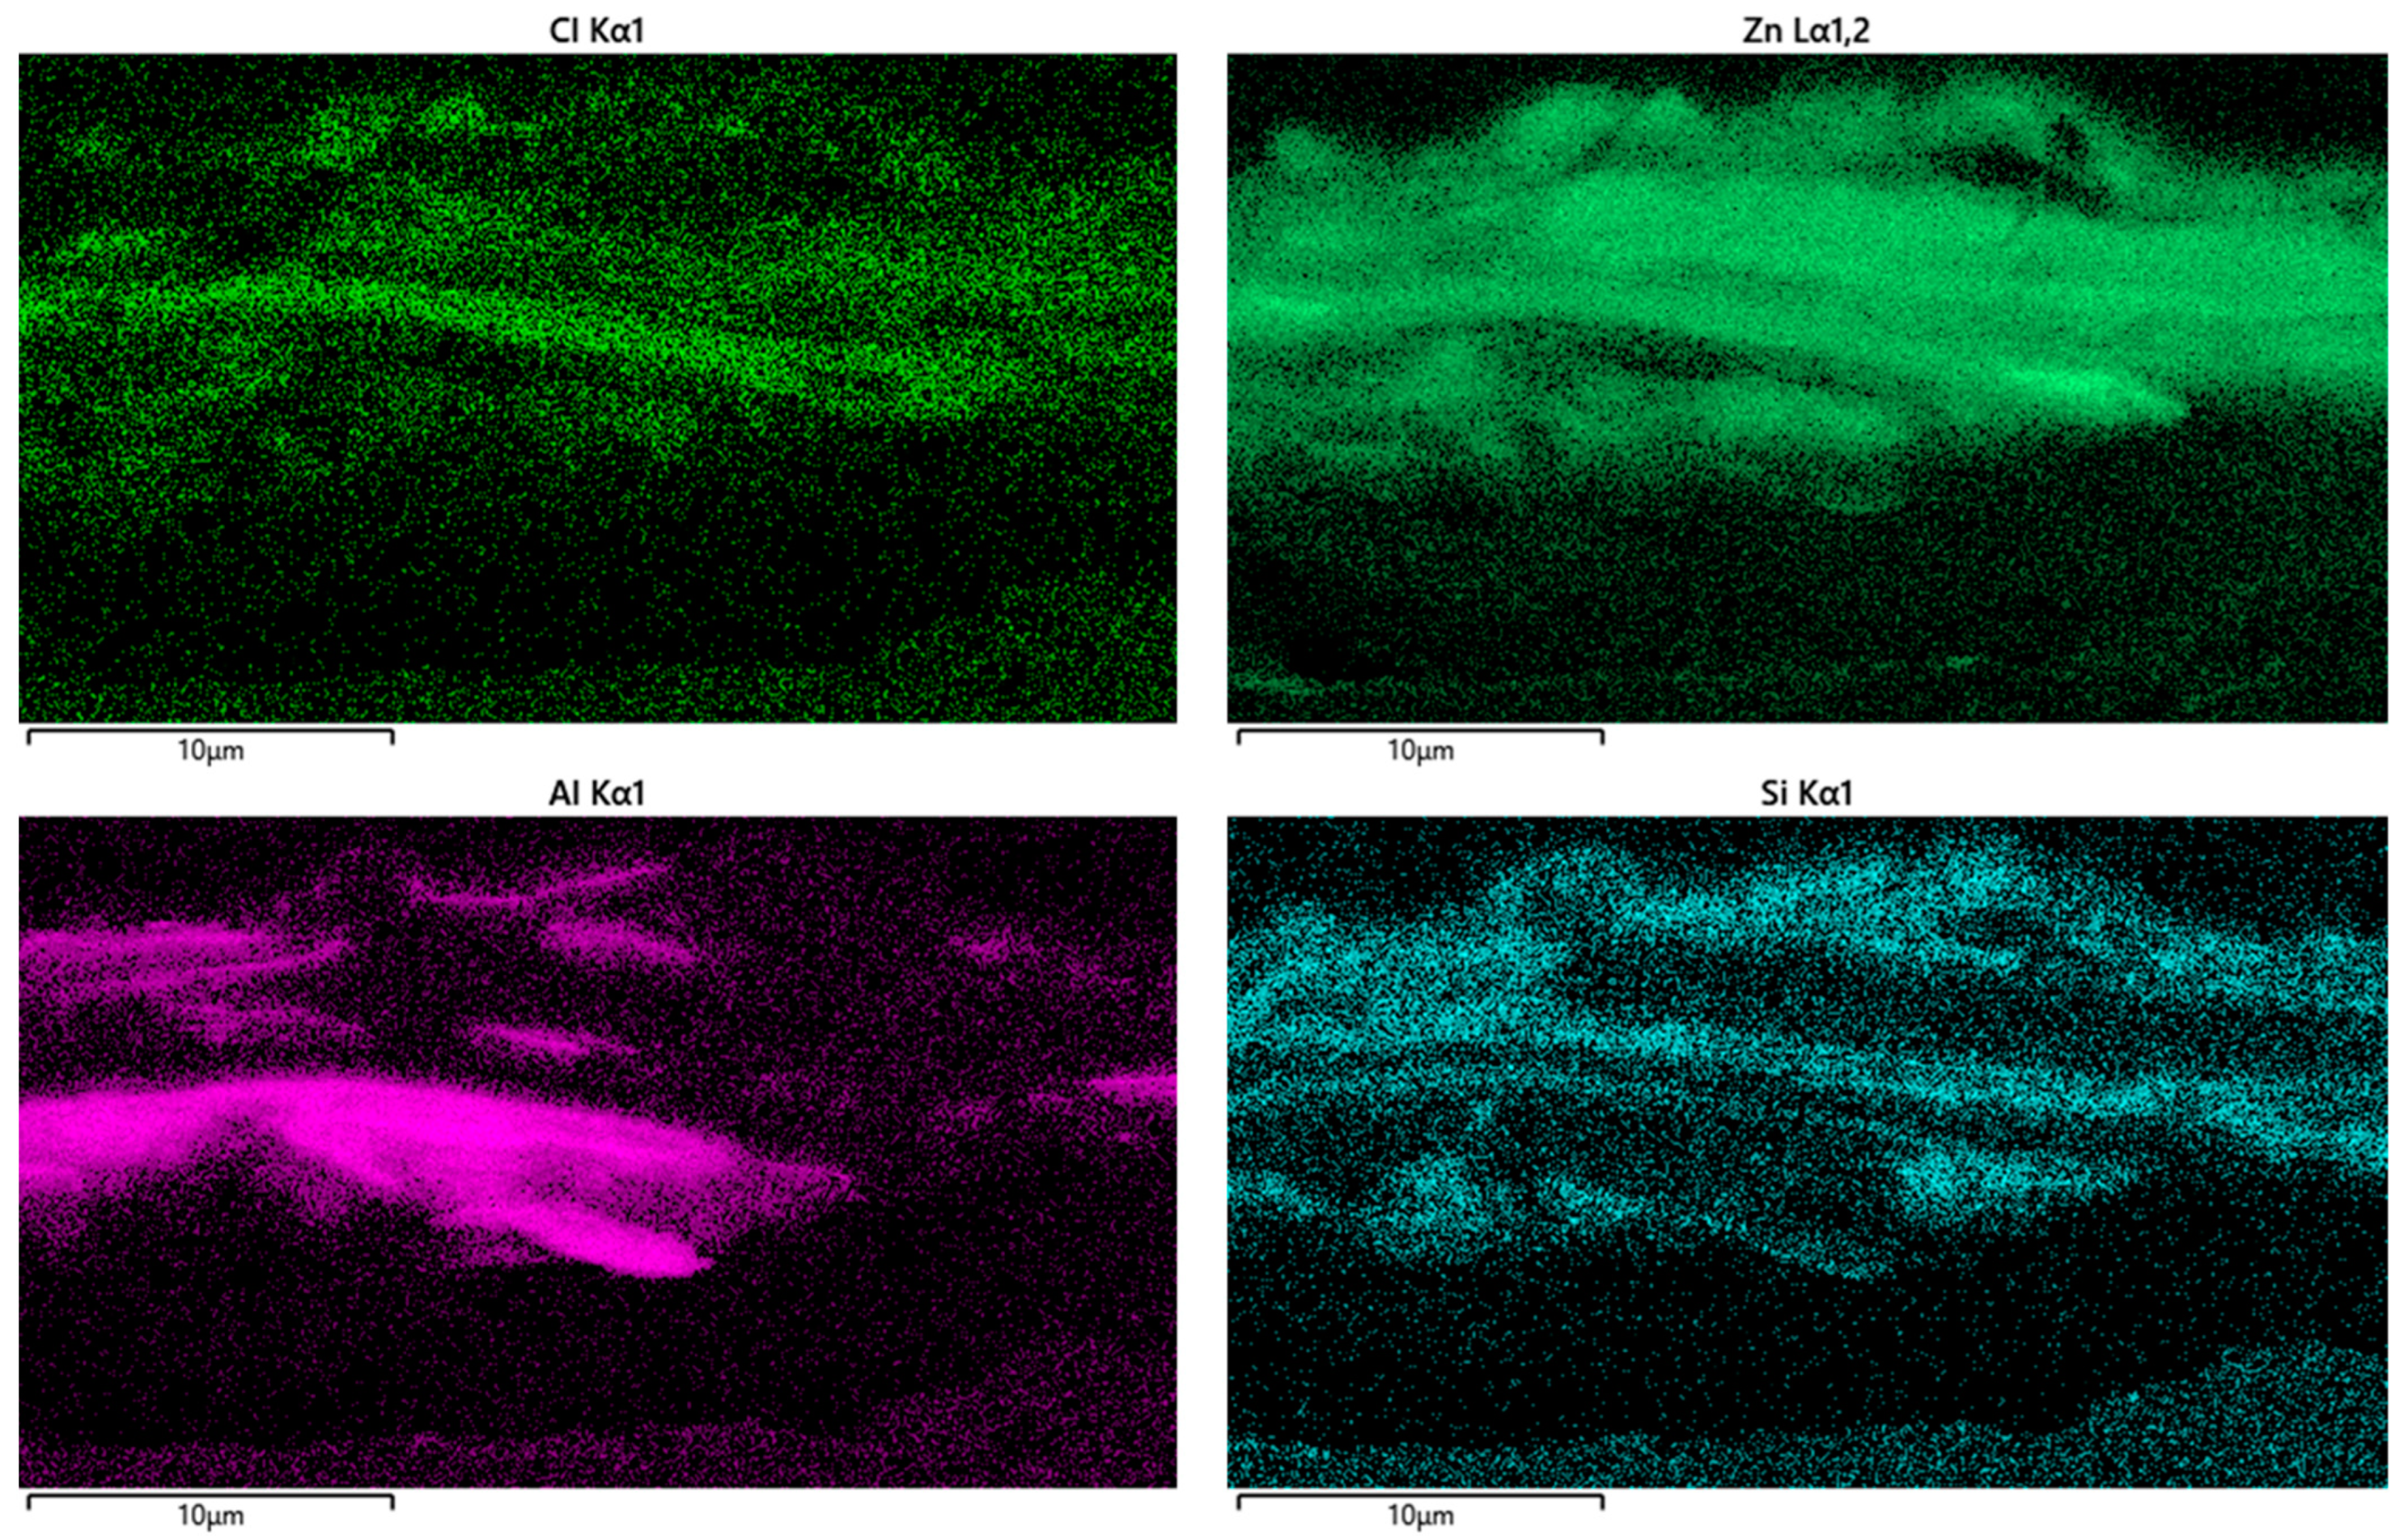
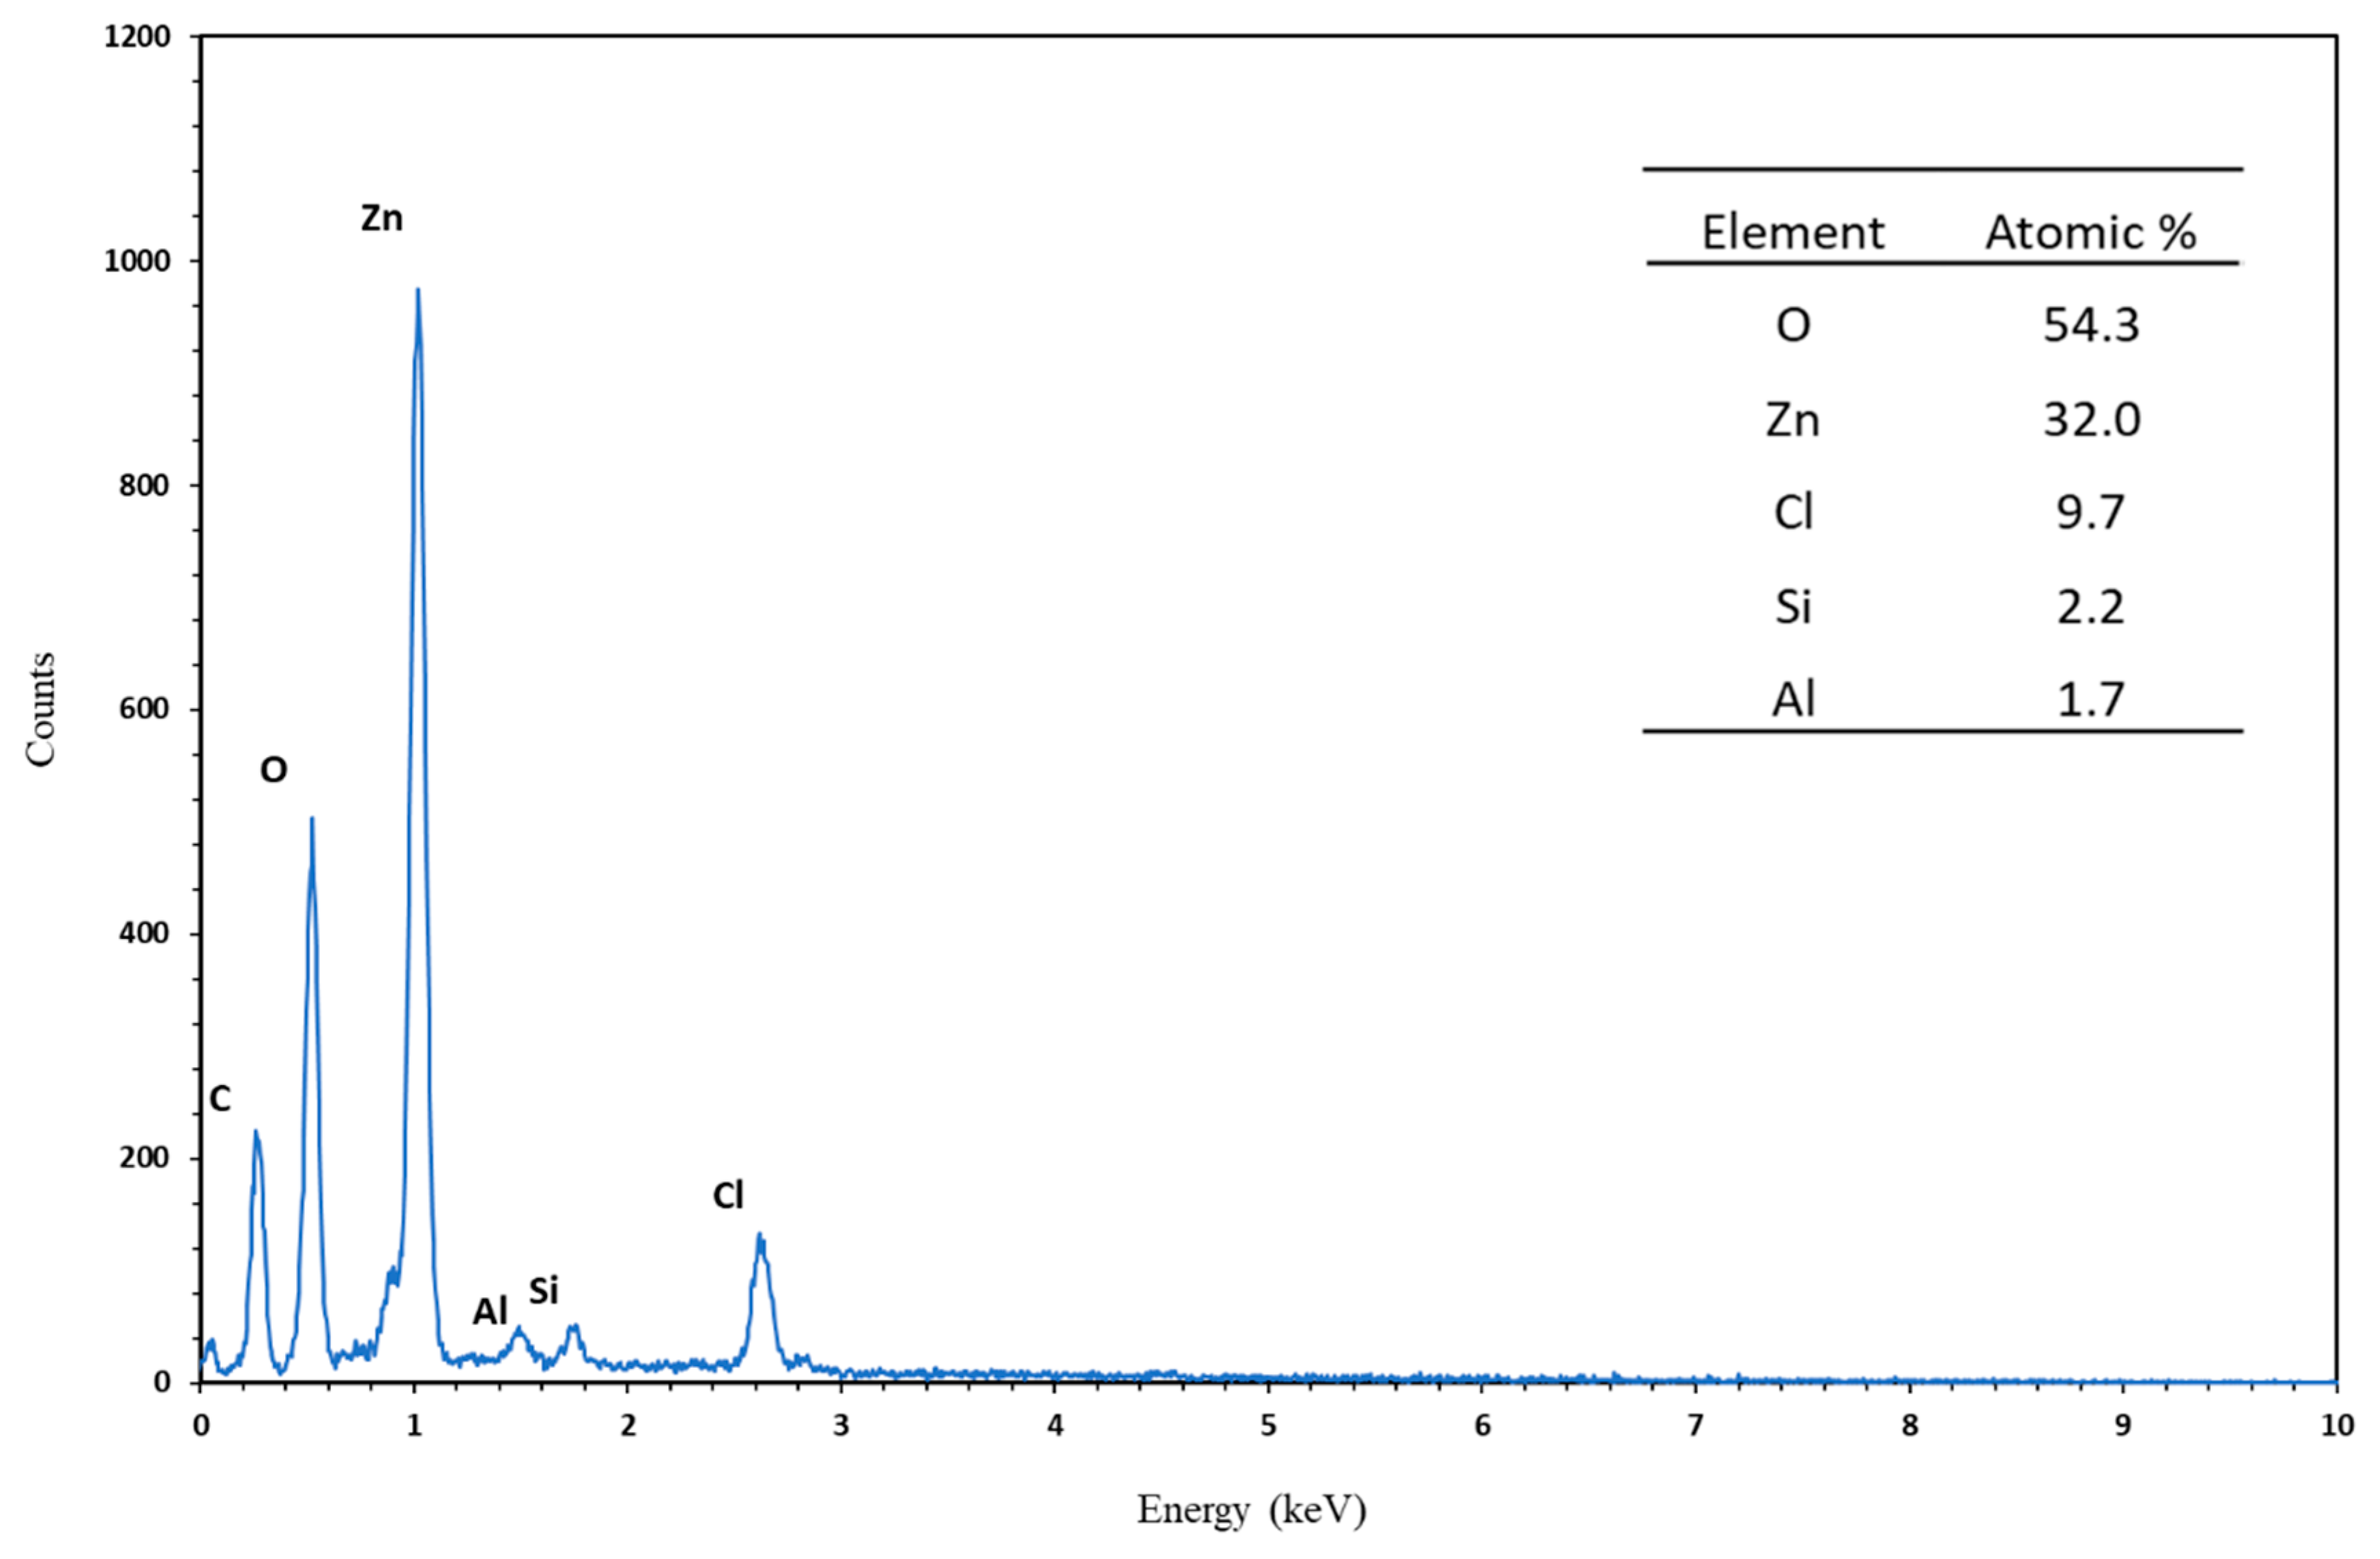
3.3.3. SEM and EDS Studies
4. Conclusions
Supplementary Materials
Author Contributions
Funding
Institutional Review Board Statement
Informed Consent Statement
Data Availability Statement
Acknowledgments
Conflicts of Interest
References
- Mudd, G.M.; Jowitt, S.M.; Werner, T.T. The World’s Lead-Zinc Mineral Resources: Scarcity, Data, Issues and Opportunities. Ore Geol. Rev. 2017, 80, 1160–1190. [Google Scholar] [CrossRef]
- Sverdrup, H.U.; Olafsdottir, A.H.; Ragnarsdottir, K.V. On the Long-Term Sustainability of Copper, Zinc and Lead Supply, Using a System Dynamics Model. Resour. Conserv. Recycl. X 2019, 4, 100007. [Google Scholar] [CrossRef]
- Morcillo, M.; Barajas, R.; Feliu, S.; Bastidas, J.M. A SEM Study on the Galvanic Protection of Zinc-Rich Paints. J. Mater. Sci. 1990, 25, 2441–2446. [Google Scholar] [CrossRef]
- Sørensen, P.A.; Kiil, S.; Dam-Johansen, K.; Weinell, C.E. Anticorrosive Coatings: A Review. J. Coat. Technol. Res. 2009, 6, 135–176. [Google Scholar] [CrossRef]
- Abreu, C.M.; Izquierdo, M.; Keddam, M.; Nóvoa, X.R.; Takenouti, H. Electrochemical Behaviour of Zinc-Rich Epoxy Paints in 3% NaCl Solution. Electrochim. Acta 1996, 41, 2405–2415. [Google Scholar] [CrossRef]
- Park, J.H.; Yun, T.H.; Kim, K.Y.; Song, Y.K.; Park, J.M. The Improvement of Anticorrosion Properties of Zinc-Rich Organic Coating by Incorporating Surface-Modified Zinc Particle. Prog. Org. Coat. 2012, 74, 25–35. [Google Scholar] [CrossRef]
- Feliu, S.; Barajas, R.; Bastidas, J.; Morcillo, M.; Feliu, S. Study of Protection Mechanisms of Zinc-Rich Paints by Electrochemical Impedance Spectroscopy. In Electrochemical Impedance: Analysis and Interpretation; ASTM International: West Conshohocken, PA, USA, 1993; p. 438. [Google Scholar]
- Nagasawa, M.; Okada, N.; Otsuka, N.; Ohtsuka, T. Corrosion Process of Inorganic Zinc-Rich Painted Steel Exposed to a High-Chloride Atmospheric Environment. ISIJ Int. 2018, 58, 316–322. [Google Scholar] [CrossRef]
- Barton, K.; Cullen, M.; Duffy, B. Sol-Gel Chemistry Engineering for Corrosion Protection. In Sol-Gel Materials for Energy, Environment and Electronic Applications; Pillai, S.C., Hehir, S., Eds.; Advances in Sol-Gel Derived Materials and Technologies; Springer International Publishing: Berlin/Heidelberg, Germany, 2017. [Google Scholar]
- Wang, D.; Bierwagen, G.P. Sol-Gel Coatings on Metals for Corrosion Protection. Prog. Org. Coat. 2009, 64, 327–338. [Google Scholar] [CrossRef]
- Wang, X.; Xing, W.; Song, L.; Yang, H.; Hu, Y.; Yeoh, G.H. Fabrication and Characterization of Graphene-Reinforced Waterborne Polyurethane Nanocomposite Coatings by the Sol-Gel Method. Surf. Coat. Technol. 2012, 206, 4778–4784. [Google Scholar] [CrossRef]
- Wint, N.; Wijesinghe, S.L.; Yan, W.; Ong, W.K.; Wu, L.Y.; Williams, G.; McMurray, H.N. The Sacrificial Protection of Steel by Zinc-Containing Sol-Gel Coatings. J. Electrochem. Soc. 2019, 166, C434–C444. [Google Scholar] [CrossRef]
- Figueira, R.B.; Silva, C.J.R.; Pereira, E.V. Organic–Inorganic Hybrid Sol–Gel Coatings for Metal Corrosion Protection: A Review of Recent Progress. J. Coat. Technol. Res. 2014, 12, 1–35. [Google Scholar] [CrossRef]
- Touzin, M.; Béclin, F. Fabrication and Characterization of Composite Sol-Gel Coatings on Porous Ceramic Substrate. J. Eur. Ceram. Soc. 2011, 31, 1661–1667. [Google Scholar] [CrossRef]
- Ma, Z.L.; Li, C.C.; Wei, H.M.; Ding, D.Q. Silica Sol-Gel Anchoring on Aluminum Pigments Surface for Corrosion Resistance Based on Aluminum Oxidized by Hydrogen Peroxide. Dye. Pigment. 2015, 114, 253–258. [Google Scholar] [CrossRef]
- De Damborenea, J.; Pellegri, N.; de Sanctis, O.; Durán, A. Electrochemical Behaviour of SiO2 Sol-Gel Coatings on Stainless Steel. J. Sol-Gel Sci. Technol. 1995, 4, 239–244. [Google Scholar] [CrossRef]
- Zheng, S.; Li, J. Inorganic-Organic Sol Gel Hybrid Coatings for Corrosion Protection of Metals. J. Sol-Gel Sci. Technol. 2010, 54, 174–187. [Google Scholar] [CrossRef]
- Gonzalez, E.; Vejar, N.; Solis, R.; Muñoz, L.; Encinas, M.V.; Paez, M. Sol-Gel Films: Corrosion Protection Coating for Aluminium Alloy. In Sol-Gel Method—Design and Synthesis of New Materials with Interesting Physical, Chemical and Biological Properties; IntechOpen: London, UK, 2019. [Google Scholar]
- Ashrafi-Shahri, S.M.; Ravari, F.; Seifzadeh, D. Smart Organic/Inorganic Sol-Gel Nanocomposite Containing Functionalized Mesoporous Silica for Corrosion Protection. Prog. Org. Coat. 2019, 133, 44–54. [Google Scholar] [CrossRef]
- Tiringer, U.; Durán, A.; Castro, Y.; Milošev, I. Self-Healing Effect of Hybrid Sol-Gel Coatings Based on GPTMS, TEOS, SiO2 Nanoparticles and Ce(NO3)3 Applied on Aluminum Alloy 7075-T6. J. Electrochem. Soc. 2018, 165, C213–C225. [Google Scholar] [CrossRef]
- Alibakhshi, E.; Akbarian, M.; Ramezanzadeh, M.; Ramezanzadeh, B.; Mahdavian, M. Evaluation of the Corrosion Protection Performance of Mild Steel Coated with Hybrid Sol-Gel Silane Coating in 3.5 Wt.% NaCl Solution. Prog. Org. Coat. 2018, 123, 190–200. [Google Scholar] [CrossRef]
- Bierwagen, G.P.; Allahar, K.; Hinderliter, B.; Jung, H. Zn-Rich Coatings Revisited. In Proceedings of the Tri-Service Corrosion Conference, Nashville, TN, USA, 11–15 March 2007. [Google Scholar]
- Feliu, S., Jr.; Morcillo, M.; Feliu, S. Deterioration of Cathodic Protection Action of Zinc-Rich Paint Coatings in Atmospheric Exposure. Corrosion 2001, 57, 591–597. [Google Scholar] [CrossRef]
- Theiler, F. The Rust Preventing Mechanism of Zinc Dust Paints. Corros. Sci. 1974, 14, 405–414. [Google Scholar] [CrossRef]
- Kalendová, A. Effects of Particle Sizes and Shapes of Zinc Metal on the Properties of Anticorrosive Coatings. Prog. Org. Coat. 2003, 46, 324–332. [Google Scholar] [CrossRef]
- Thomas, S.; Birbilis, N.; Venkatraman, M.S.; Cole, I.S. Self-Repairing Oxides to Protect Zinc: Review, Discussion and Prospects. Corros. Sci. 2013, 69, 11–22. [Google Scholar] [CrossRef]
- Gergely, A.; Pászti, Z.; Mihály, J.; Drotár, E.; Török, T. Galvanic Function of Zinc-Rich Coatings Facilitated by Percolating Structure of the Carbon Nanotubes. Part II: Protection Properties and Mechanism of the Hybrid Coatings. Prog. Org. Coat. 2014, 77, 412–424. [Google Scholar] [CrossRef]
- Akbarinezhad, E.; Ebrahimi, M.; Sharif, F.; Ghanbarzadeh, A. Evaluating Protection Performance of Zinc Rich Epoxy Paints Modified with Polyaniline and Polyaniline-Clay Nanocomposite. Prog. Org. Coat. 2014, 77, 1299–1308. [Google Scholar] [CrossRef]
- Shirehjini, F.T.; Danaee, I.; Eskandari, H.; Zarei, D. Effect of Nano Clay on Corrosion Protection of Zinc-Rich Epoxy Coatings on Steel 37. J. Mater. Sci. Technol. 2016, 32, 1152–1160. [Google Scholar] [CrossRef]
- Meroufel, A.; Deslouis, C.; Touzain, S. Electrochemical and Anticorrosion Performances of Zinc-Rich and Polyaniline Powder Coatings. Electrochim. Acta 2008, 53, 2331–2338. [Google Scholar] [CrossRef]
- Gergely, A.; Török, T. Optimally Balanced Active-Passive Corrosion Protection by Zinc-Rich Paint Coatings Featuring Proper Hybrid Formulation with Polypyrrole Modified Carbon Nanotubes. Mater. Sci. Forum 2013, 752, 275–283. [Google Scholar] [CrossRef]
- Gergely, A.; Pászti, Z.; Mihály, J.; Drotár, E.; Török, T. Galvanic Function of Zinc-Rich Coatings Facilitated by Percolating Structure of the Carbon Nanotubes. Part I: Characterization of the Nano-Size Particles. Prog. Org. Coat. 2015, 78, 437–445. [Google Scholar] [CrossRef]
- Arman, S.Y.; Ramezanzadeh, B.; Farghadani, S.; Mehdipour, M.; Rajabi, A. Application of the Electrochemical Noise to Investigate the Corrosion Resistance of an Epoxy Zinc-Rich Coating Loaded with Lamellar Aluminum and Micaceous Iron Oxide Particles. Corros. Sci. 2013, 77, 118–127. [Google Scholar] [CrossRef]
- Jalili, M.; Rostami, M.; Ramezanzadeh, B. An Investigation of the Electrochemical Action of the Epoxy Zinc-Rich Coatings Containing Surface Modified Aluminum Nanoparticle. Appl. Surf. Sci. 2015, 328, 95–108. [Google Scholar] [CrossRef]
- Hoang, N.; Khoa, T.A.; Nhung, L.T.; Phuong, P.M.; Binh, T.D.; Hang, T.T.X.; Van Chi, N.; Nguyen, T.-D. Flake ZnAl Alloy as an Effective Pigment in Silicate Coatings for the Corrosion Protection of Steel. Coatings 2022, 12, 1046. [Google Scholar] [CrossRef]
- Streitberger, H.-J.; Dössel, K.-F.; Werner Thomer, K.; Gehmecker, H.; Wonnemann, H.; Rink, H.-P.; Svejda, P.; Wilke, G.; Merz, P.W.; Burchardt, B.; et al. Automotive Paints and Coatings, 2nd ed.; Streitberger, H.-J., Dössel, K., Eds.; Wiley: Hoboken, NJ, USA, 2008. [Google Scholar]
- Bohm, S.; Holness, R.J.; McMurray, H.N.; Worsley, D.A. Charge Percolation and Sacrificial Protection in Zinc-Rich Organic Coatings. In Proceedings of the Eurocorr’2000, Quenn Mary and Westfield College, London, UK, 10–14 September 2000. [Google Scholar]
- Figueira, R.B.; Fontinha, I.R.; Silva, C.J.R.; Pereira, E.V. Hybrid Sol-Gel Coatings: Smart and Green Materials for Corrosion Mitigation. Coatings 2016, 6, 12. [Google Scholar] [CrossRef]
- Meroufel, A.; Touzain, S. EIS Characterisation of New Zinc-Rich Powder Coatings. Prog. Org. Coat. 2007, 59, 197–205. [Google Scholar] [CrossRef]
- Marchebois, H.; Savall, C.; Bernard, J.; Touzain, S. Electrochemical Behavior of Zinc-Rich Powder Coatings in Artificial Sea Water. Electrochim. Acta 2004, 49, 2945–2954. [Google Scholar] [CrossRef]
- Zhang, L.; Ma, A.; Jiang, J.; Song, D.; Chen, J.; Yang, D. Anti-Corrosion Performance of Waterborne Zn-Rich Coating with Modified Silicon-Based Vehicle and Lamellar Zn (Al) Pigments. Prog. Nat. Sci. Mater. Int. 2012, 22, 326–333. [Google Scholar] [CrossRef]
- Phan, T.T.; Bentiss, F.; Jama, C. Effects of Sol–Gel Process Parameters on the Anticorrosive Performance of Phosphosilicate Hybrid Coatings for Carbon Steel: Structural and Electrochemical Studies. New J. Chem. 2018, 42, 13442–13452. [Google Scholar] [CrossRef]
- Phan, T.T.; Bentiss, F.; Jama, C. Structural and Anticorrosion Performance Characterization of Phosphosilicate Sol–Gel Coatings Prepared from 3-(Trimethoxysilyl) Propyl Methacrylate and Bis [2-(Methacryloyloxy)Ethyl] Phosphate. Prog. Org. Coat. 2015, 89, 123–131. [Google Scholar] [CrossRef]
- Esbayou, M.; Bentiss, F.; Casetta, M.; Nyassi, A.; Jama, C. Optimization of Cold Plasma Process Parameters for Organosilicon Films Deposition on Carbon Steel: Study of the Surface Pretreatment Effect on Corrosion Protection Performance in 3 Wt% NaCl Medium. J. Alloys Compd. 2018, 758, 148–161. [Google Scholar] [CrossRef]
- Jones, D. Principles and Prevention of Corrosion; Pearson: London, UK, 1992. [Google Scholar]
- Hammouda, N.; Chadli, H.; Guillemot, G.; Belmokre, K. The Corrosion Protection Behaviour of Zinc Rich Epoxy Paint in 3% NaCl Solution. Adv. Chem. Eng. Sci. 2011, 1, 51–60. [Google Scholar] [CrossRef]
- Moraga, G.A.; Silva, G.G.; Matencio, T.; Paniago, R.M. Poly(2,5-Dimethoxy Aniline)/Fluoropolymer Blend Coatings to Corrosion Inhibition on Stainless Steel. Synth. Met. 2006, 156, 1036–1042. [Google Scholar] [CrossRef]
- Ouerd, A.; Alemany-Dumont, C.; Normand, B.; Szunerits, S. Reactivity of CoCrMo Alloy in Physiological Medium: Electrochemical Characterization of the Metal/Protein Interface. Electrochim. Acta 2008, 53, 4461–4469. [Google Scholar] [CrossRef]
- Akbarinezhad, E.; Ebrahimi, M.; Faridi, H.R. Corrosion Inhibition of Steel in Sodium Chloride Solution by Undoped Polyaniline Epoxy Blend Coating. Prog. Org. Coat. 2009, 64, 361–364. [Google Scholar] [CrossRef]
- Creus, J.; Idrissi, H.; Mazille, H. Galvanic Corrosion Behaviour of Mild Steel, Al, and Ti in 3%NaCl Solution: Application to PVD Coatings on Steel Substrate. Surf. Eng. 1997, 13, 415–419. [Google Scholar] [CrossRef]
- Yang, J.; Lu, Y.; Guo, Z.; Gu, J.; Gu, C. Corrosion Behaviour of a Quenched and Partitioned Medium Carbon Steel in 3.5 Wt.% NaCl Solution. Corros. Sci. 2018, 130, 64–75. [Google Scholar] [CrossRef]
- Marchebois, H.; Joiret, S.; Savall, C.; Bernard, J.; Touzain, S. Characterization of Zinc-Rich Powder Coatings by EIS and Raman Spectroscopy. Surf. Coat. Technol. 2002, 157, 151–161. [Google Scholar] [CrossRef]
- Bastos, A.C.; Zheludkevich, M.L.; Klüppel, I.; Grundmeier, G.; Ferreira, M.G.S. Modification of Zinc Powder to Improve the Corrosion Resistance of Weldable Primers. Prog. Org. Coat. 2010, 69, 184–192. [Google Scholar] [CrossRef]
- Mahdavian, M.; Attar, M.M. Another Approach in Analysis of Paint Coatings with EIS Measurement: Phase Angle at High Frequencies. Corros. Sci. 2006, 48, 4152–4157. [Google Scholar] [CrossRef]
- Vilche, J.R.; Bucharsky, E.C.; Giúdice, C.A. Application of EIS and SEM to Evaluate the Influence of Pigment Shape and Content in ZRP Formulations on the Corrosion Prevention of Naval Steel. Corros. Sci. 2002, 44, 1287–1309. [Google Scholar] [CrossRef]
- Nguyen, T.Q.; Breitkopf, C. Determination of Diffusion Coefficients Using Impedance Spectroscopy Data. J. Electrochem. Soc. 2018, 165, E826–E831. [Google Scholar] [CrossRef]
- Kittel, J.; Celati, N.; Keddam, M.; Takenouti, H. New Methods for the Study of Organic Coatings by EIS. Prog. Org. Coat. 2001, 41, 93–98. [Google Scholar] [CrossRef]
- McIntyre, J.M.; Pham, H.Q. Electrochemical Impedance Spectroscopy; a Tool for Organic Coatings Optimizations. Prog. Org. Coat. 1996, 27, 201–207. [Google Scholar] [CrossRef]
- Marques, A.G.; Simões, A.M. EIS and SVET Assessment of Corrosion Resistance of Thin Zn-55% Al-Rich Primers: Effect of Immersion and of Controlled Deformation. Electrochim. Acta 2014, 148, 153–163. [Google Scholar] [CrossRef]
- Xing, C.; Wang, W.; Qu, S.; Tang, Y.; Zhao, X.; Zuo, Y. Degradation of Zinc-Rich Epoxy Coating in 3.5% NaCl Solution and Evolution of Its EIS Parameters. J. Coat. Technol. Res. 2021, 18, 843–860. [Google Scholar] [CrossRef]
- Muster, T.H.; Cole, I.S. The Protective Nature of Passivation Films on Zinc: Surface Charge. Corros. Sci. 2004, 46, 2319–2335. [Google Scholar] [CrossRef]
- Song, D.; Wan, H.; Tu, X.; Li, W. A Better Understanding of Failure Process of Waterborne Coating/Metal Interface Evaluated by Electrochemical Impedance Spectroscopy. Prog. Org. Coat. 2020, 142, 105558. [Google Scholar] [CrossRef]
- Zeng, Y.; Kang, L.; Wu, Y.; Wan, S.; Liao, B.; Li, N.; Guo, X. Melamine Modified Carbon Dots as High Effective Corrosion Inhibitor for Q235 Carbon Steel in Neutral 3.5 Wt% NaCl Solution. J. Mol. Liq. 2022, 349, 118108. [Google Scholar] [CrossRef]
- Amirudin, A.; Thierry, D. Application of Electrochemical Impedance Spectroscopy to Study the Atmospheric Corrosion of Painted Metals. Mater. Sci. Forum 1995, 192–194, 317–334. [Google Scholar] [CrossRef]
- Hsu, C.H.; Mansfeld, F. Technical Note: Concerning the Conversion of the Constant Phase Element Parameter Y 0 into a Capacitance. Corrosion 2001, 57, 747–748. [Google Scholar] [CrossRef]
- Bastos, A.C.; Simões, A.M.P. Effect of Deep Drawing on the Performance of Coil-Coatings Assessed by Electrochemical Techniques. Prog. Org. Coat. 2009, 65, 295–303. [Google Scholar] [CrossRef]
- Feliu, S., Jr.; Bastidas, J.M.; Morcillo, M.; Feliu, S. Effect of the Di-Iron Phosphide Conductive Extender on the Protective Mechanisms of Zinc-Rich Coatings. J. Coat. Technol. 1991, 63, 67–72. [Google Scholar]
- Cheng, L.; Liu, C.; Han, D.; Ma, S.; Guo, W.; Cai, H.; Wang, X. Effect of Graphene on Corrosion Resistance of Waterborne Inorganic Zinc-Rich Coatings. J. Alloys Compd. 2019, 774, 255–264. [Google Scholar] [CrossRef]
- Volovitch, P.; Vu, T.N.; Allély, C.; Abdel Aal, A.; Ogle, K. Understanding Corrosion via Corrosion Product Characterization: II. Role of Alloying Elements in Improving the Corrosion Resistance of Zn-Al-Mg Coatings on Steel. Corros. Sci. 2011, 53, 2437–2445. [Google Scholar] [CrossRef]
- Wallinder, I.O.; Leygraf, C.; Karlén, C.; Heijerick, D.; Janssen, C.R. Atmospheric Corrosion of Zinc-Based Materials: Runoff Rates, Chemical Speciation and Ecotoxicity Effects. Corros. Sci. 2001, 43, 809–816. [Google Scholar] [CrossRef]
- Yoo, J.D.; Ogle, K.; Volovitch, P. The Effect of Synthetic Zinc Corrosion Products on Corrosion of Electrogalvanized Steel: I. Cathodic Reactivity under Zinc Corrosion Products. Corros. Sci. 2014, 81, 11–20. [Google Scholar] [CrossRef]
- Salgueiro Azevedo, M.; Allély, C.; Ogle, K.; Volovitch, P. Corrosion Mechanisms of Zn(Mg,Al) Coated Steel: 2. The Effect of Mg and Al Alloying on the Formation and Properties of Corrosion Products in Different Electrolytes. Corros. Sci. 2015, 90, 482–490. [Google Scholar] [CrossRef]
- Wan, B.; Yan, Y.; Huang, R.; Abdala, D.B.; Liu, F.; Tang, Y.; Tan, W.; Feng, X. Formation of Zn-Al Layered Double Hydroxides (LDH) during the Interaction of ZnO Nanoparticles (NPs) with γ-Al2O3. Sci. Total Environ. 2019, 650, 1980–1987. [Google Scholar] [CrossRef] [PubMed]
- Li, L.; Pi, P.; Wen, X.; Cheng, J.; Yang, Z. Optimization of Sol–Gel Coatings on the Surface of Aluminum Pigments for Corrosion Protection. Corros. Sci. 2008, 50, 795–803. [Google Scholar] [CrossRef]
- Gallardo, J.; Galliano, P.; Durán, A. Thermal Evolution of Hybrid Sol-Gel Silica Coatings: A Structural Analysis. J. Sol.-Gel Sci. Technol. 2000, 19, 393–397. [Google Scholar] [CrossRef]
- Persson, D.; Thierry, D.; LeBozec, N.; Prosek, T. In Situ Infrared Reflection Spectroscopy Studies of the Initial Atmospheric Corrosion of Zn-Al-Mg Coated Steel. Corros. Sci. 2013, 72, 54–63. [Google Scholar] [CrossRef]
- Zhu, F.; Zhang, X.; Persson, D.; Thierry, D. In Situ Infrared Reflection Absorption Spectroscopy Studies of Confined Zinc Surfaces Exposed under Periodic Wet-Dry Conditions. Electrochem. Solid-State Lett. 2001, 4, 19–22. [Google Scholar] [CrossRef]
- Prosek, T.; Nazarov, A.; Bexell, U.; Thierry, D.; Serak, J. Corrosion Mechanism of Model Zinc-Magnesium Alloys in Atmospheric Conditions. Corros. Sci. 2008, 50, 2216–2231. [Google Scholar] [CrossRef]
- Nguyen, T.; Byrd, E.; Bentz, D.; Lin, C. In Situ Measurement of Water at the Organic Coating/Substrate Interface. Prog. Org. Coat. 1996, 27, 181–193. [Google Scholar] [CrossRef]
- Haldhar, R.; Parveen Asrafali, S.; Jayprakash Raorane, C.; Periyasamy, T.; Kim, S.C. Performance of Cross-Linked Polymers as a Potential Anticorrosive Coating for Low Carbon Steel in Acidic Condition: Experimental and Computational Studies. J. Mol. Liq. 2022, 360, 119384. [Google Scholar] [CrossRef]
- Mahjoubi, F.Z.; Khalidi, A.; Abdennouri, M.; Barka, N. Zn–Al Layered Double Hydroxides Intercalated with Carbonate, Nitrate, Chloride and Sulphate Ions: Synthesis, Characterisation and Dye Removal Properties. J. Taibah Univ. Sci. 2017, 11, 90–100. [Google Scholar] [CrossRef]
- Seftel, E.M.; Popovici, E.; Mertens, M.; De Witte, K.; Van Tendeloo, G.; Cool, P.; Vansant, E.F. Zn-Al Layered Double Hydroxides: Synthesis, Characterization and Photocatalytic Application. Microporous Mesoporous Mater. 2008, 113, 296–304. [Google Scholar] [CrossRef]


| Element | C | Mn | p | S | Fe |
|---|---|---|---|---|---|
| Content (%) | ≤0.12 | ≤0.6 | ≤0.045 | ≤0.045 | Balance |
| Coating | Zinc (%) | Aluminum (%) | Binder (%) | Other Pigments (%) |
|---|---|---|---|---|
| A | 50 | 5 | 40 | 5 |
| B | 60 | 0 | 35 | 5 |
| C | 50 | 10 | 35 | 5 |
| Time | Rs (Ω·cm2) | Rc (Ω·cm2) | Cc (F·cm−2) | nc | Rct (Ω·cm2) | Cdl (F·cm−2) | ndl | Ws-R (Ω·cm2) | Ws-T (s) | Ws-P | χ2 |
|---|---|---|---|---|---|---|---|---|---|---|---|
| 1 h | 59 | 181 | 5.82 × 10⁻⁵ | 0.44 | 701 | 4.77 × 10⁻⁵ | 0.77 | - | - | - | 6 × 10⁻⁴ |
| 2 h | 56 | 190 | 6.21 × 10⁻⁵ | 0.39 | 1458 | 4.10 × 10⁻⁵ | 0.77 | - | - | - | 3 × 10⁻⁴ |
| 6 h | 55 | 48 | 3.97 × 10⁻⁶ | 0.43 | 2098 | 2.03 × 10⁻⁴ | 0.66 | - | - | - | 7 × 10⁻⁴ |
| 24 h | 58 | 72 | 6.87 × 10⁻⁷ | 0.63 | 4490 | 1.29 × 10⁻³ | 0.57 | - | - | - | 6 × 10⁻⁴ |
| 48 h | 59 | 183 | 6.71 × 10⁻⁷ | 0.64 | 11544 | 1.72 × 10⁻³ | 0.55 | - | - | - | 2 × 10⁻⁴ |
| 7 days | 53 | 749 | 6.10 × 10⁻⁷ | 0.57 | 5373 | 1.13 × 10⁻⁴ | 0.55 | 158,210 | 24.39 | 0.60 | 7 × 10⁻⁵ |
| 14 days | 51 | 1712 | 1.07 × 10⁻⁶ | 0.60 | 1607 | 1.74 × 10⁻⁵ | 0.68 | 93,923 | 59.69 | 0.55 | 3 × 10⁻⁴ |
| 21 days | 52 | 1459 | 1.61 × 10⁻⁶ | 0.59 | 5064 | 4.76 × 10⁻⁵ | 0.57 | 121,580 | 54.33 | 0.59 | 1 × 10⁻⁴ |
| Time | Coating | Rs (Ω·cm2) | Rc (Ω·cm2) | Cc (F·cm−2) | nc | Rct (Ω·cm2) | Cdl (F·cm−2) | ndl | Ws-R (Ω·cm2) | Ws-T (s) | Ws-P | χ2 |
|---|---|---|---|---|---|---|---|---|---|---|---|---|
| 2 h | A | 56 | 190 | 6.21 × 10⁻⁵ | 0.39 | 1458 | 4.10 × 10⁻⁵ | 0.77 | - | - | - | 3 × 10⁻⁴ |
| B | 58 | 20 | 1.16 × 10⁻⁵ | 0.46 | 1214 | 4.25 × 10⁻⁴ | 0.74 | - | - | - | 7 × 10⁻⁴ | |
| C | 59 | 567 | 2.86 × 10⁻⁴ | 0.63 | 262 | 2.96 × 10⁻² | 0.78 | - | - | - | 1 × 10⁻³ | |
| 14 days | A | 51 | 1712 | 1.07 × 10⁻⁶ | 0.60 | 1607 | 1.74 × 10⁻⁵ | 0.68 | 93,923 | 59.69 | 0.55 | 3 × 10⁻⁴ |
| B | 44 | 11 | 1.46 × 10⁻⁸ | 0.35 | 3920 | 3.77 × 10⁻³ | 0.61 | - | - | - | 2 × 10⁻⁴ | |
| C | 56 | 286 | 1.43 × 10⁻³ | 0.66 | 2357 | 1.66 × 10⁻⁴ | 0.98 | - | - | - | 1 × 10⁻³ |
| Coating | SST (h) | Aspect after 21 Days of Immersion | Adhesion |
|---|---|---|---|
| A | 1500 | White-gray | 0 |
| B | 1000 | Gray and red rust | 0 |
| C | 500 | White-gray and red rust | 0 |
Publisher’s Note: MDPI stays neutral with regard to jurisdictional claims in published maps and institutional affiliations. |
© 2022 by the authors. Licensee MDPI, Basel, Switzerland. This article is an open access article distributed under the terms and conditions of the Creative Commons Attribution (CC BY) license (https://creativecommons.org/licenses/by/4.0/).
Share and Cite
Boidot, A.; Gheno, F.; Bentiss, F.; Jama, C.; Vogt, J.-B. Effect of Aluminum Flakes on Corrosion Protection Behavior of Water-Based Hybrid Zinc-Rich Coatings for Carbon Steel Substrate in NaCl Environment. Coatings 2022, 12, 1390. https://doi.org/10.3390/coatings12101390
Boidot A, Gheno F, Bentiss F, Jama C, Vogt J-B. Effect of Aluminum Flakes on Corrosion Protection Behavior of Water-Based Hybrid Zinc-Rich Coatings for Carbon Steel Substrate in NaCl Environment. Coatings. 2022; 12(10):1390. https://doi.org/10.3390/coatings12101390
Chicago/Turabian StyleBoidot, Arthur, Frederic Gheno, Fouad Bentiss, Charafeddine Jama, and Jean-Bernard Vogt. 2022. "Effect of Aluminum Flakes on Corrosion Protection Behavior of Water-Based Hybrid Zinc-Rich Coatings for Carbon Steel Substrate in NaCl Environment" Coatings 12, no. 10: 1390. https://doi.org/10.3390/coatings12101390
APA StyleBoidot, A., Gheno, F., Bentiss, F., Jama, C., & Vogt, J.-B. (2022). Effect of Aluminum Flakes on Corrosion Protection Behavior of Water-Based Hybrid Zinc-Rich Coatings for Carbon Steel Substrate in NaCl Environment. Coatings, 12(10), 1390. https://doi.org/10.3390/coatings12101390