Abstract
Solid biofuels produced from torrefaction have improved coal-like properties in comparison to raw biofuels, yet ensuring uniform product quality is still a challenge. In this study, downstream torrefaction of wood pellets was performed at temperatures between 200 and 270 °C in a rotary kiln reactor to understand the effect of torrefaction temperature on product quality. The torrefied solid biofuel was compared with dedicated fuel properties defined in ISO/TS 17225-8:2016-12. Based on the results, the optimal temperature for downstream torrefaction was found at temperatures of 230 and 250 °C. Above this temperature, the effect of bulk density superimposes not only the increased net calorific value but also values for mechanical durability, amount of fines, and bulk density of the solid biofuel, which were below the thresholds of the fuel standard. Moreover, increasing process temperatures caused higher heavy metal concentrations in torrefied pellets. The composition of condensable and non-condensable fractions of the torr-gas substantially increased between temperatures of 230 and 250 °C and remained on a similar level at higher temperatures. Thus, the utilization of torr-gas for energy recovery purposes and as a precursor for the recovery of valuable chemicals should be balanced with the quality of the solid biofuel in the aforementioned range of torrefaction temperatures to enable the utilization of torrefaction products at further steps.
1. Introduction
The utilization of fossil fuels as the main energy source in most industrialized countries to meet growing energy requirements has caused serious environmental challenges such as global warming [1]. Therefore, increasing the share of renewable sources in global energy production has become an urgent task to accelerate the transition towards a more sustainable future with less fossil fuel dependence and greenhouse gas emissions [2]. Biomass, as sustainable solid fuel producing less CO2 emissions compared to fossil fuels, contributes to approximately 10–14% of total global energy production by holding a potential up to 30–40% by the time 2050, depending on the source [3,4]. It offers a promising solution not only for the production of useful energy but also for energy carriers that can be used in different applications directly or after upgrading [3,5]. However, some of the drawbacks of biomass properties, such as low energy density, high moisture content, poor grindability, low bulk density, and fuel heterogeneity, may cause serious challenges during fuel conditioning, storage, transportation, or further applications. Therefore, it is crucial to improve the characteristics of biomass fuels depending on the selected application areas [6,7].
The torrefaction process, typically performed between 200 and 300 °C in an inert or a low oxidative environment, is a thermochemical conversion technology to produce fuels with enhanced properties with respect to coal-like fuel properties, homogeneity, and grindability [8]. Combining torrefaction with fuel densification processes such as pelleting can lead to superior fuel properties by increasing the flexibility of the fuel supply, which can be used in co-firing and co-gasification applications [9,10]. It can also be possible to avoid specific challenges for co-firing torrefied solid biofuels, such as high power consumption during grinding, low water resistance during outdoor storage, and low energy density in transportation [11]. Additionally, 30% of co-firing with torrefied pellets to substitute raw biomass pellets can enable savings of up to EUR 10.3 million annually [12]. However, there are still some challenges, such as the availability of sustainable feedstocks, high costs of pelleting, and safety aspects (e.g., due to the formation of fine particles during handling and transport) that should be considered.
In general, “upstream” or “downstream” configurations can be selected for the combination of pelleting and torrefaction processes. In the upstream configuration, the torrefaction process is followed by pelleting, whereas in the downstream configuration, pelleting is carried out before the torrefaction process. In the upstream production, higher torrefaction reactor volumes; therefore, higher capital costs are required in addition to the safety concerns due to fine particle generation. In this path, densification of torrefied fuel requires not only an additional binding agent but also 1.5 times higher energy compared to downstream production [13,14]. On the other hand, in the case of downstream production, it may be possible to eliminate the need for additional grinding and generation of fine particles, which is also critical in terms of safety aspects. Moreover, the infrastructure of the current pellet industry, together with its established value chain, can be extended with the integration of a downstream torrefaction process.
However, torrefied pellets have specific drawbacks, especially in terms of their physical-mechanical properties, which can be problematic during fuel handling or transportation. Therefore, ensuring standardized fuel quality, particularly in terms of high mechanical durability and bulk density, is still one of the limitations of downstream production [13,14]. Utilization of torr-gas and other valuable chemicals such as furfural in further steps is also not well-established. In the literature, there are several publications on downstream torrefaction of biomass pellets, as given in Table 1, which mostly focus on the effect of torrefaction temperature, residence time, or torrefaction atmosphere on different aspects such as fuel properties (proximate, ultimate analysis, or calorific value) [15,16,17,18,19,20,21,22], torr-gas analysis [16,23], bulk or energy density [15,16,17,23], grindability [15,18,20], hydrophobicity or water uptake [16,17,20,21], and hardness or durability [17]. Both upstream and downstream torrefaction is still under research, and more commitments are required to ensure economically feasible market uptake.

Table 1.
Summary of lab-scale studies in the literature on downstream torrefaction of biomass pellets (FB: fixed-bed, EF: electrical furnace, FBR: fluidized bed reactor, TR: tube reactor, RK: rotary kiln).
In light of the above considerations, it becomes critical to ensure the standardized product quality and measures for any application of torrefied fuels, especially considering further applications for the substitution of fossil fuels such as coal. However, defining an appropriate quality criterion is one of the major challenges for a broad introduction of torrefied biomass. Within the framework of the SECTOR project, a draft of a standard for thermally treated solid biofuels was proposed [9,12]. Subsequently, the international technical specification ISO/TS 17225-8:2016-12 “Solid biofuels-Fuel specifications and classes-Part 8: Graded thermally treated and densified biomass fuels” was published, which provides a detailed specification of relevant properties of thermally treated fuels (e.g., by torrefaction, steam treatment, and hydrothermal carbonization). Based on different fuel property classes, their use in commercial and industrial energy applications can be facilitated [24].
The main objective of this study was to investigate the effects of the downstream torrefaction process on the quality of solid biofuels by also focusing on the comparison of fuel properties with ISO/TS 17225-8:2016-12 and the torr-gas quality to identify optimal torrefaction process conditions with respect to utilization options of all process products.
2. Materials and Methods
2.1. Materials
For commercial or residential applications, certified wood pellets are market available, e.g., by the ENplus certification system, which covers A1, A2, and B fuel classes for commercial and residential applications as well as I1, I2, and I3 fuel classes for industrial applications. In this study, commercially available ENplus wood pellets with quality class A1 were used as fuel in the torrefaction experiments. The whole batch of wood pellets was homogenized in a paddle mixer (MSX 550), sieved using a 3.15 mm mesh, and then kept in hobbocks prior to experiments. Nitrogen gas with a purity of 99.999% (nitrogen 5.0, DIN EN ISO 14175:N1, Lindegroup- Germany) was used to provide an inert atmosphere during torrefaction experiments. In addition, the test gas mixture of CH4, CO, CO2, H2, N2, C2H6, and C2H4 (Tycczka Industrie-Gase) was used for calibration of the micro-GC. Technical acetone (UN1090, VWR chemicals), distilled water and tar removing solution (Ravenol Teerentferner) was used to clean pipes and vessels from tar residues.
2.2. Torrefaction Experiments
The torrefaction experiments were carried out in a bench-scale rotary kiln (1450 × 1126 × 1290 mm) with an interior volume of 80 L manufactured by Pusch AG (Marienrachdorf, Germany). The schematic diagram of the set-up is displayed in Figure 1. The reactor encompasses a rotating inner shell that is heated indirectly together with a stationary outer carapace, which is around the inner shell and electrically heated. The wood pellets were fed into the reactor, which can be opened by removing the circular head protected by a gasket. The lid is equipped with a thermocouple, pressure measurement devices, a mechanical safety valve, an oxygen measurement/sensor device, and a reaction product exit. The temperature sensor is extended within the kiln’s interior. On the outer surface of the rotary kiln, another temperature sensor that measures the temperature of the outer shell (jacket) is situated. The product outlet was connected to a cooling network, which is linked to the main flue gas system. A programmable multi-channel data logger (Multicon CMC-99/144th) was mounted at one end of the reactor. The collection of the torr-gas condensate was carried out using three stainless steel vessels located at the exit of the reactor. The first condensate vessel was filled with small ceramic molds, while the second vessel had an inner circular steel pipe grid through which the reaction products pass; it was submerged under water at room temperature and was the only actively cooled vessel among the three. The third vessel was not equipped with inserts to collect the condensable liquid. The remaining non-condensable products were released into the chimney. For the analysis of the non-condensable gaseous products (i.e., H2, N2, CO, CH4, CO2, C2H4, and C2H6), a part of the gas stream entering the chimney was analyzed by micro-GC (GCM®Micro Box II model equipment) with a standard 12 bar pressurized carrier gas bottle and optional sample suction pump that was integrated into the machine. Before each torrefaction experiment, calibration was performed. Accordingly, the gas sample was vaporized in the injector and transported with Argon gas as a carrier through a 55 cm long, packed Carbosphere-HT column, and gas products were recorded by a flame ionization detector at the end of the separation column. The deviation of the results was ±1.0%.
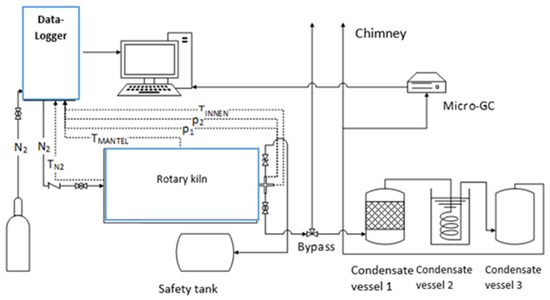
Figure 1.
Schematic of the rotary kiln experimental set-up.
For each torrefaction test, 5 kg of the homogenized wood pellets were placed in the rotary kiln reactor. The flow rate of nitrogen was adjusted to 10 L/min while the rotary kiln speed was set to 5.6 rpm via the data logger. The experiment was started by heating the interior of the rotary kiln from room temperature to the set temperature (Tset) of 105 °C. After the completion of the drying stage, the temperature was further increased from 200 °C to the desired Tset of 230, 250, and 270 °C for the torrefaction stage. During the cooling phase, the temperature was decreased from the desired Tset to room temperature. The rotary motor and the data logger were switched off, followed by turning off the nitrogen supply when the temperature within the reactor was less than 130 °C [26]. Once the rotary kiln’s inner shell temperature reached room temperature, the rotary kiln’s lid was unscrewed, and the torrefied material was collected and weighed using the KERN PCB balance. The torrefied solid products were also analyzed based on the standardized procedures given in Table 2. Afterward, the pellets were ground in a mill and homogenized by a sample riffler before being sent to the laboratory for proximate and ultimate analyses. Moreover, condensate and tar samples were collected in two steps. The first vessel was weighed before and after the experiment. In the first step, liquid components were collected from the first vessel, and 100 mL of this solution was bottled for analysis. The same tank was weighed again without the liquids but with tar-laden ceramic molds and pasty tar on the bottom of the tank, which was used to determine the amount of tar. In the second step, the final condensate vessel was weighed before and after the experiment. Overall, there were two condensate samples that were analyzed for water content and organic compounds such as acetic acid, formic acid, methanol, furfural, etc. (see Table 2). The non-condensable torr-gas fraction was analyzed continuously by using micro-GC via GCM manager software that provided dry gas compositions as chromatograms, Table 2. Finally, the inner walls of the kiln were vacuum cleaned while the condensate vessels and pipes were disassembled and stepwise rinsed with hot water, technical acetone, and tar remover solution.
Table 2.
Overview of the methods and the devices used in this study.
Weighing the mass before and after torrefaction (Δmman) was employed for determining the mass loss taking place at different torrefaction temperatures. The mass and the energy yields were calculated using the following equations:
2.3. Reproducibility of the Torrefaction Experiments
In order to show the repeatability of the torrefaction experiments in a rotary kiln reactor, triplicate tests were carried out for temperatures of 230 and 270 °C. Thus, the standard deviations of these triple experiments were indicated in the graphs and tables within the paper. Figure 2 shows the results of the recorded reactor and set temperatures for triplet experiments performed at 230 °C.
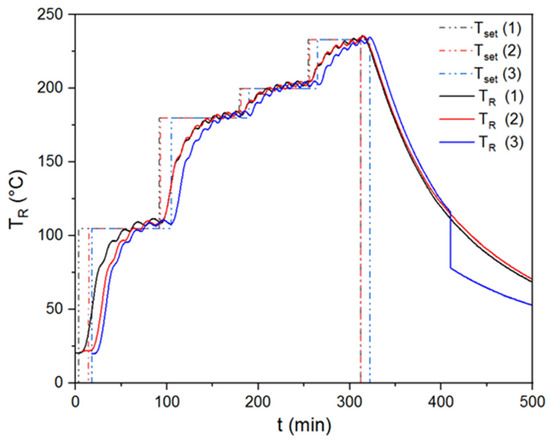
Figure 2.
Repeatability tests for torrefaction experiment performed at 230 °C.
3. Results and Discussion
3.1. Product Yields of Torrefaction
Table 3 shows the average temperature inside the rotary kiln (i.e., reactor temperature, TR) for 20 min, together with the mean, minimum, and maximum deviations inside the rotary kiln reactor listed. The deviations are max. 5 K. Tj indicates the temperature of the stationary outer casing/jacket of the reactor. The temperatures measured inside the rotary kiln (TR) might underestimate the real torrefaction temperature applied to the solid material for the employed setting. Therefore, a different method was applied to determine the torrefaction temperature by considering it as an average of TR and Tj, i.e., (Tj + TR)/2. As can be seen from Table 3, this temperature was much higher than the original set temperatures (Tset) since the reactor was indirectly heated. This caused in wall-particle conduction mode in which heat transfer occurred from the outer casing (jacket) to the inside of the reactor and resulted in this temperature difference. Based on the analysis of the results, this method provided a more realistic indication of the real torrefaction temperature and enabled a better comparison with the results of other authors. It is important to note that set temperatures were used within the manuscript.
Table 3.
Reactor and jacket temperatures of the rotary kiln and the determined mass yield.
The solid, liquid, and gas yields of the torrefaction process, depending on the varying reactor temperature, are displayed in Figure 3a. The torrefaction temperature had a significant influence on the product yields. Thus, the solid product yields showed a decreasing trend as the torrefaction temperature increased. The highest solid yield was 84% at 200 °C, whereas it decreased to 41.1% at the maximum torrefaction temperature of 270 °C. This declining trend in the solid product yield, contrary to increasing torrefaction temperature, can be explained by the thermal breakdown of the main biomass constituents in different temperature ranges, considering that increasing process temperatures enable the decomposition of the polymers present in the samples [8]. Decomposition of hemicellulose takes place relatively in a narrower temperature range within 220–315 °C; therefore, the mass loss at early torrefaction can be attributed to mainly hemicellulose degradation. In parallel with the temperature increase, the rate of mass loss also increases due to additional decomposition of lignin and cellulose that takes place over a wide temperature range above 260 °C [1,20]. Accordingly, cellulose decomposition takes place between 305 and 380 °C, whereas lignin decomposition has a wider temperature range up to 400–500 °C [8]. The loss in the solid product yields in parallel with the increasing torrefaction temperatures favored the liquid and gas product yields as a result of dehydration, initial devolatilization, and/or decarboxylation [28]. The liquid product yield increased from 11.6 to 39.5%, while the gas product yield increased from 4.4 to 19.5% as the torrefaction temperature increased from 200 to 270 °C. In addition, the mass and energy yields of the torrefied fuels subject to different temperatures are displayed in Figure 3b. The mass yield decreased from 80.3 to 39.2%, whereas the energy yield decreased from 85.4 to 59.9% as the torrefaction temperature increased. This decrease in mass and energy yields can be attributed to the substantial removal of hemicelluloses and cellulose from biomass structure as a result of torrefaction [29]. Similar results on the influence of torrefaction temperature on mass and energy yields of the torrefied pellets were also reported by other researchers [30,31].
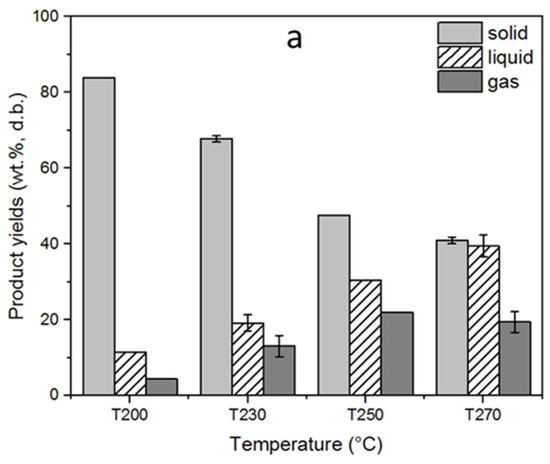
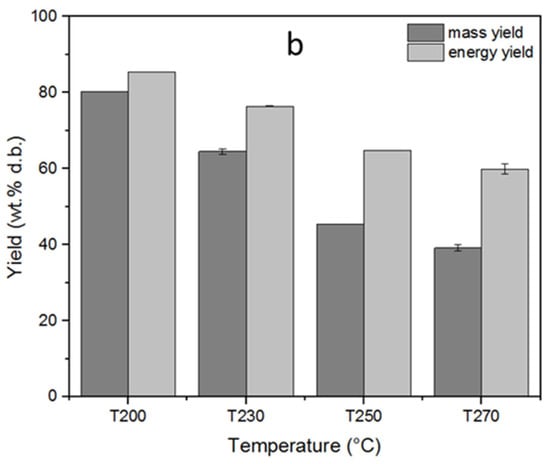
Figure 3.
Influence of the torrefaction temperature on (a) solid, liquid, and gas yields (b) mass and energy yields of torrefaction process. The standard deviations were indicated for triple analyses carried out for T230 and T270.
3.2. Characteristics of Condensable and Non-Condensable Torr-Gas
The gaseous product from the torrefaction process, also known as “torr-gas” consists of different condensable and non-condensable compounds. Its composition mainly depends on the type of the selected fuel and the process parameters [32]. As given in Table 4, the condensable fraction of torr-gas contained water and trace amounts of other compounds such as acids, aldehydes, and alcohols. Water was the major component (83–89 wt.%) due to initial moisture removal during the early stages of torrefaction, followed by the thermal degradation of hydroxyl groups from biomass structure [31]. Moreover, acetic acid was the second most abundant compound in the torr-gas, which is one of the main products of the decomposition of xylose units in the hemicellulose [28]. Its amount increased up to 10 wt.% in parallel with increasing process temperature. The fraction of other compounds, such as formic acid, propionic acid, methanol, and furfural, was found to be less than 3 wt.%. It is important to note that oxygen-containing compounds such as acids are generally known as undesirable due to their corrosive nature [17]. The condensable fraction can be applied as precursors for different chemicals. For instance, acetic acid can be used for the production of VAM (vinyl acetate monomer), which is used for the production of paints, coatings, and adhesives, while formic acid is crucial for dyeing and tanning processes in leather manufacturing. Furfural can directly replace crude-oil-based organics for the production of adhesives, resins, polymers, and pharmaceuticals [33]. However, possible side products are rather organic bulk chemicals with low margins.
Table 4.
Composition of condensable compounds in torr-gas (wt.%). Numbers in parentheses indicate the standard deviations for triple analyses.
The non-condensable fraction of torr-gas, on the other hand, consisted of mainly CO2, CO, CH4, and H2. As given in Table 5, the torrefaction temperature directly affected CO and CO2 production. The main gas fraction was CO2 at the lowest torrefaction temperature. The increasing torrefaction temperature favored CO production, which is in accordance with the studies by Ferro et al. and Chang et al. [34,35]. Based on the literature, it can be proposed that the oxygen removal took place primarily via decarboxylation reactions of acid carboxyl groups in hemicellulose, which then shifted towards decarbonylation of basic carbonyl compounds as the temperature increased [16]. This increased the ratio of CO/CO2 ratio in parallel with the torrefaction temperature, which is in line with the literature [16]. The number of other gases, such as H2 and CH4, was found to be relatively small. Considering that torr-gas include H2, CO, and CH4, it can be combusted to provide heat for drying and torrefaction reactor. Bergman et al. investigated the calorific value of torr-gas experimentally and reported that it ranges between 5.3 and 16.2 MJ/Nm3, which is relatively low since the water content was high [36,37]. Their results were comparable with syngas (4–7 MJ/Nm3) from air-blown biomass gasification and to syngas from indirectly heated gasification (15–20 MJ/Nm3) processes [28,36,37].
Table 5.
The composition of condensable compounds in torr-gas (wt.%). Numbers in parentheses indicate the standard deviations for triple analyses.
3.3. Impact of Torrefaction Process on the Properties of Selected Wood Pellet Quality
In addition to the non-condensable and condensable fraction of the torr-gas, the torrefaction process significantly affects the physical-mechanical and chemical properties of the solid biofuel. Figure 4 shows the torrefied biomass pellets obtained from the torrefaction process at temperatures between 200 and 270 °C. It can be seen that the pellets maintained their initial shape after torrefaction within the whole investigated temperature range. It is also possible to observe the color shift from light to darker brown in the obtained products as the torrefaction temperature increased gradually. Some other researchers also concluded similar results regarding the darkened color of the torrefied pellets with increasing process temperature [5,19,21,31,38]. It was reported in the literature that the color change takes place between 150 and 300 °C due to chemical changes caused by several reactions such as decomposition, oxidation, cross-linking, condensation, and enzyme-mediated reactions within the biomass structure [29]. Wang et al. reported that color change with the torrefaction temperature could be the indicator of the conversion of acid-soluble lignin compounds in the wood due to thermal treatment [5].
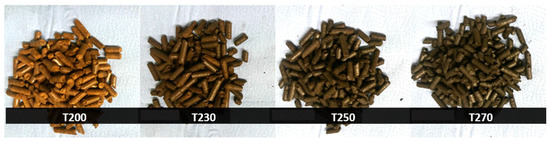
Figure 4.
Torrefied wood pellets obtained from torrefaction process.
According to the ultimate analysis results listed in Table 6, raw wood pellets were characterized by the lowest carbon content of 51.4 wt.% d.b. In comparison to the torrefied pellets, as the torrefaction temperature increased from 200 to 270 °C, the carbon content of the fuel also increased. The results also revealed that oxygen content decreased with increased torrefaction temperature due to deoxygenation in the forms of H2O, CO, or CO2, which was shown in the previous section [15]. The hydrogen content of the torrefied pellets showed slight deviations compared to raw wood pellets. Similar results were reported in the literature by discussing that higher temperatures resulted in higher carbon in biomass along with a corresponding decrease in oxygen and hydrogen [5,21,38]. Accordingly, O/C and H/C ratios were also affected and showed declining trends. These changes in O/C and H/C ratios led to shifts in the Van Krevelen diagram, as illustrated in Figure 5. Accordingly, sample T230 was characterized by peat-like properties, while samples T250 and T270 had lignite and coal-like properties, respectively.
Table 6.
The results of fuel analyses in comparison with the threshold values given in the product standard ISO 17225-2 for wood pellets and ISO/TS 17225-8 for torrefied biomass [24,41]. Numbers in parenthesis indicate the standard deviations for triple analyses. * as received ** Energy density was calculated based on using net calorific value and bulk density based on as received basis [41]. Abbreviations: A1: raw biomass pellet in ISO/TS-17225-2, TW1a: thermally treated and densified biomass with calorific value ≥ 21 MJ/kg (as received) in ISO/TS-17225-8, TW1b: thermally treated and densified biomass with calorific value ≥ 16.9 MJ/kg (as received) in ISO/TS-17225-8, n.d. not detected. As, Hg and Ni were not analyzed. For Pb measurement b.l.d. (below limit of detection) refers to 42.4 mg/kg.
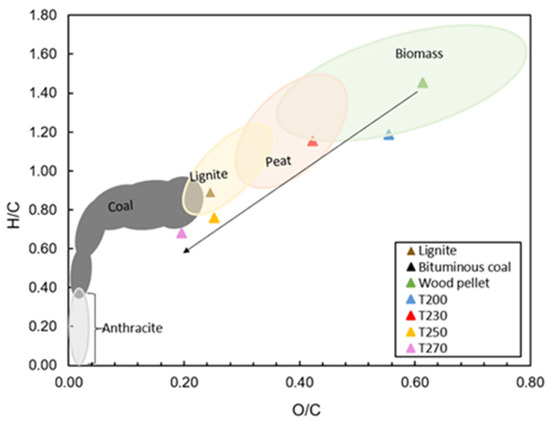
Figure 5.
The van Krevelen diagram of atomic H/C versus O/C for untreated and torrefied pellets (calculations were carried out with values based on dry basis).
Furthermore, the results of physical, chemical, and mechanical analyses are listed in Table 6. The properties of the wood pellets are in a comparable range to average values for wood pellet assortments found in the literature [39]. The wood pellets are characterized by the moisture of 5.22 wt.%, whereas the torrefied pellets are characterized by lower moisture between 0.13 and 0.82 wt.% due to moisture removal during the early stage of the torrefaction process at around 110 °C [1]. Additionally, there was no moisture uptake in the torrefied pellets. The raw wood pellet is characterized by higher volatile matter, while the torrefaction process decreased the volatile matter of the thermally treated pellets with increasing process temperature. This can be explained by the decomposition of dominant hemicellulose at temperatures between 250 and 300 °C, together with the slight decomposition of lignin and cellulose, which could be attributed to the release of volatile matter [1]. Therefore, the volatile matter of thermally treated pellets was found to be closer to the ones of coal, varying between 15 and 30 wt.% [9]. Correspondingly, the fixed carbon content of the torrefied pellets increased up to 57.87 wt.% with increasing torrefaction temperature. The net calorific value of raw wood pellets was 18 MJ/kg on an as-received basis. The loss of relatively more oxygen and hydrogen during torrefaction enabled the production of fuels with higher carbon content and, therefore, higher calorific values. The higher net calorific values of the torrefied fuels produced at 250 and 270 °C are comparable to the net calorific value of coal varying between 25 and 35 MJ/kg (d.b.), which is an important improvement in fuel properties considering further potential applications [19,29,31,40].
3.4. Comparison with ISO Standards
In ISO 17225-2 [41], the classified quality for the use of wood pellets in residential, small commercial, and public buildings as well as industrial energy generation applications are defined as A1, while in ISO/TS-17225-8 [24], property classes for thermally treated and densified biomass fuels for commercial and industrial use were specified depending on the net calorific value (i.e., ≥21 MJ/kg for TW1a and Q ≥ 16.9 MJ/kg for TW1b, as received basis). Accordingly, T200 is classified as TW1b, whereas T230, T250, and T270 are classified as TW1a. The fuel properties of wood and torrefied wood pellets are compared with the relevant ISO standards, as in Table 6.
The non-torrefied wood pellets fulfilled the thresholds of ISO 17225-2:2021-05 [41] in terms of the analyzed physical-mechanical and chemical properties (except for chlorine). The comparison of torrefied pellets with ISO/TS-17225-8:2016-12 [24] showed that the fuels fulfilled the minimum requirements for moisture, ash, and net calorific value. However, torrefied pellets may not comply with requirements of the technical specification in terms of mechanical durability except for pellets torrefied at 200 °C (i.e., sample T200). The torrefied solid biofuels may also not comply with the thresholds for bulk density, which substantially decreased below 400 kg/m3 (for T270) as the torrefaction temperature is increased. This could be explained by the release of the volatiles from the organic fuel matrix, which causes a porous structure, thus lowering the remaining bulk density [15]. With respect to the number of fines, all torrefied wood pellets were below the thresholds defined in the technical specification. The formation and expansion of cracks in pellets can be directly associated with increased porosity [42]. However, although the bulk density can be lowered substantially with increasing torrefaction temperature, values for the number of fines and the mechanical durability are still relatively close to the thresholds defined in the technical specification. Based on the obtained bulk density and calorific value, the energy density of the fuels was also calculated and listed in Table 6. The energy density of the non-torrefied wood pellets was 11.7 GJ/m3, and although it increased slightly up to 12.24 GJ/m3 at a torrefaction temperature of 230 °C, there is a significant decrease with higher torrefaction temperatures. Thus, according to Yu et al. [15], the effect of decreased bulk density superimposes the increased net calorific value at higher torrefaction temperatures, see Figure 3b. As can be seen in Table 6, the increase in the torrefaction temperature may also result in an increased concentration of heavy metals (i.e., Cd, Cr, Cu, and Zn) as well as other ash-forming elements (i.e., Ca, K, Mg, Na, and P) relevant for ash melting and particulate matter formation [43,44,45]. However, it was observed that all torrefied fuels comply with the thresholds in the given standard, except the Cl and Cd contents. For Cl, including raw biomass pellets, any of the torrefied pellets could not ensure the minimum defined thresholds, while for Cd, only torrefied pellets at 270 °C could not ensure the given product quality.
4. Summary and Conclusions
Based on the results, an optimal range for downstream torrefaction is found at mild temperatures of approx. 230 °C (in reality, at around ~250 °C as explained in Section 2.3), considering the quality of the solid biofuels as well as the yield and composition of the condensable and non-condensable fractions of the torr-gas. Above this temperature, although the net calorific value increased mechanical durability, the number of fines and bulk density of the solid biofuels were below the thresholds of the fuel standard, which might result in transportation and safety challenges. Furthermore, the torrefied wood pellets fulfilled the requirements for moisture, ash content, and net calorific value. Moreover, the thresholds for heavy metals were met, except for Cl, which was found higher than the thresholds of not only torrefied wood pellets but also of raw biomass pellets. Pellets torrefied at 270 °C could not comply with the given Cd threshold. It was observed that the increasing torrefaction temperature caused higher concentrations of heavy metals and other ash-forming elements such as Ca, K, Mg, Na, and P.
Therefore, in conclusion, fuel standardization should address the effect of torrefaction degree on the concentration of heavy metals but also ash content, e.g., by relating their values on an energy basis. However, it is important to note that the process conditions and results discussed here are valid for the torrefaction of high-quality wood pellets. Further investigations are necessary for fuel pellets with challenging initial properties such as waste wood or non-woody biomass assortments. Moreover, the optimization of the pelleting process with respect to the initial physical-mechanical fuel properties would positively affect the downstream torrefaction of the densified material and, consequently, the quality of the torrefied solid biofuels. Thus, the utilization of torr-gas for energy recovery purposes and as a precursor for the recovery of valuable chemicals should be balanced with the quality of the solid biofuel in the aforementioned range of torrefaction temperatures to enable profitable business cases in the future.
Author Contributions
Conceptualization, Ö.M. and T.Z.; methodology, P.R. and T.Z.; validation, P.R. and T.Z.; formal analysis, P.R., Ö.M. and T.Z.; investigation, P.R.; data curation, Ö.M. and T.Z.; writing—original draft preparation, Ö.M.; writing—review and editing, Ö.M., P.R. and T.Z.; visualization, Ö.M.; supervision, T.Z.; project administration, T.Z.; funding acquisition, T.Z. All authors have read and agreed to the published version of the manuscript.
Funding
This study was funded by the German Ministry of Food and Agriculture (BMEL) on behalf of a decision of the German Bundestag.
Data Availability Statement
Not applicable.
Acknowledgments
The authors would like to acknowledge Annett Pollex for her laboratory support as well as the technical support of the technicians of the combustion laboratory at DBFZ during torrefaction experiments.
Conflicts of Interest
The authors declare no conflict of interest.
Abbreviations
| A1 | raw biomass pellet in ISO/TS-17225-2 |
| b.d.l. | below detection limit |
| d.b. | dry basis |
| DIN | Deutsches Institut für Normung |
| GC | gas chromatography |
| ISO | International Organization for Standardization |
| ISO/TS | International Organization for Standardization/Technical Specification |
| LHV | lower heating value |
| n.d. | not detected |
| NCV | net calorific value |
| PM | particulate matter |
| t | time, min |
| T200 | set-up temperature at 200 °C |
| T230 | set-up temperature at 230 °C |
| T250 | set-up temperature at 250 °C |
| T270 | set-up temperature at 270 °C |
| Tj | temperature of the jacket, °C |
| TR | temperature of the reactor, °C |
| Tset | set temperature, °C |
| TW1a | thermally treated and densified biomass with calorific value ≥ 21 MJ/kg (as received) in ISO/TS-17225-8 |
| TW1b | thermally treated and densified biomass with calorific value ≥ 16.9 MJ/kg (as received) in ISO/TS-17225-8 |
| wt. | weight |
| Δmman | mass loss by weighing of mass manually before and after torrefaction |
References
- Acharya, B.; Sule, I.; Dutta, A. A review on advances of torrefaction technologies for biomass processing. Biomass Convers. Biorefinery 2012, 2, 349–369. [Google Scholar] [CrossRef]
- United Nations. Renewable energy—Powering a Safer Future. Available online: https://www.un.org/en/climatechange/raising-ambition/renewable-energy (accessed on 22 August 2022).
- Rosillo-Calle, F. A review of biomass energy—Shortcomings and concerns. J. Chem. Technol. Biotechnol. 2016, 91, 1933–1945. [Google Scholar] [CrossRef]
- Wannapeera, J.; Fungtammasan, B.; Worasuwannarak, N. Effects of temperature and holding time during torrefaction on the pyrolysis behaviors of woody biomass. J. Anal. Appl. Pyrolysis 2011, 92, 99–105. [Google Scholar] [CrossRef]
- Wang, L.; Riva, L.; Skreiberg, Ø.; Khalil, R.; Bartocci, P.; Yang, Q.; Yang, H.; Wang, X.; Chen, D.; Rudolfsson, M.; et al. Effect of Torrefaction on Properties of Pellets Produced from Woody Biomass. Energy Fuels 2020, 34, 15343–15354. [Google Scholar] [CrossRef]
- Gong, C.; Bryant, N.; Meng, X.; Bhagia, S.; Pu, Y.; Xin, D.; Bender Koch, C.; Felby, C.; Thygesen, L.G.; Ragauskas, A.; et al. Double bonus: Surfactant-assisted biomass pelleting benefits both the pelleting process and subsequent enzymatic saccharification of the pretreated pellets. Green Chem. 2021, 23, 1050–1061. [Google Scholar] [CrossRef]
- Kylili, A.; Christoforou, E.; Fokaides, P.A. Environmental evaluation of biomass pelleting using life cycle assessment. Biomass Bioenergy 2016, 84, 107–117. [Google Scholar] [CrossRef]
- Gaitán-Álvarez, J.; Moya, R.; Puente-Urbina, A.; Rodriguez-Zúñiga, A. Thermogravimetric, Devolatilization Rate, and Differential Scanning Calorimetry Analyses of Biomass of Tropical Plantation Species of Costa Rica Torrefied at Different Temperatures and Times. Energies 2018, 11, 696. [Google Scholar] [CrossRef]
- Thrän, D.; Witt, J.; Schaubach, K.; Kiel, J.; Carbo, M.; Maier, J.; Ndibe, C.; Koppejan, J.; Alakangas, E.; Majer, S.; et al. Moving torrefaction towards market introduction—Technical improvements and economic-environmental assessment along the overall torrefaction supply chain through the SECTOR project. Biomass Bioenergy 2016, 89, 184–200. [Google Scholar] [CrossRef]
- García, R.; Gil, M.V.; González-Vázquez, M.P.; Rubiera, F.; Pevida, C. Biomass Pelletization: Contribution to Renewable Power Generation Scenarios. In Production of Materials from Sustainable Biomass Resources; Biofuels and Biorefineries; Fang, Z., Smith, R., Jr., Tian, X.F., Eds.; Springer: Berlin/Heidelberg, Germany, 2019; p. 9. [Google Scholar]
- Zanzi, R.; Majari, M.; Björnbom, E. Biomass pre-treatment by torrefaction. In Proceedings of the 16th European Biomass Conference and Exhibition, Valencia, Spain, 2–6 June 2008. [Google Scholar]
- SECTOR- Production of Solid Sustainable Energy Carriers from Biomass by Means of Torrefaction. Available online: https://www.sector-project.eu/home.1.0.html (accessed on 14 March 2022).
- Ghiasi, B.; Kumar, L.; Furubayashi, T.; Lim, C.J.; Bi, X.; Soo Kim, C.; Sokhansanj, S. Densified biocoal from woodchips: Is it better to do torrefaction before or after densification? Appl. Energy 2014, 134, 133–142. [Google Scholar] [CrossRef]
- Kumar, L.; Koukoulas, A.A.; Mani, S.; Satyavolu, J. Integrating Torrefaction in the Wood Pellet Industry: A Critical Review. Energy Fuels 2017, 31, 37–54. [Google Scholar] [CrossRef]
- Yu, S.; Park, J.; Kim, M.; Kim, H.; Ryu, C.; Lee, Y.; Yang, W.; Jeong, Y.-G. Improving Energy Density and Grindability of Wood Pellets by Dry Torrefaction. Energy Fuels 2019, 33, 8632–8639. [Google Scholar] [CrossRef]
- Manouchehrinejad, M.; Mani, S. Torrefaction after pelletization (TAP): Analysis of torrefied pellet quality and co-products. Biomass Bioenergy 2018, 118, 93–104. [Google Scholar] [CrossRef]
- Brachi, P.; Chirone, R.; Miccio, M.; Ruoppolo, G. Fluidized Bed Torrefaction of Commercial Wood Pellets: Process Performance and Solid Product Quality. Energy Fuels 2018, 32, 9459–9469. [Google Scholar] [CrossRef]
- Lee, Y.; Yang, W.; Chae, T.; Kang, B.; Park, J.; Ryu, C. Comparative Characterization of a Torrefied Wood Pellet under Steam and Nitrogen Atmospheres. Energy Fuels 2018, 32, 5109–5114. [Google Scholar] [CrossRef]
- Liu, X.; Yao, Z.; Zhao, L.; Song, J.; Jia, J. Torrefaction of Sorghum Straw Pellets in a Stationary Reactor with a Feeding Screw. Energy Fuels 2020, 34, 5997–6007. [Google Scholar] [CrossRef]
- Onsree, T.; Tippayawong, N. Torrefaction of Maize Residue Pellets with Dry Flue Gas. Bioenergy Res. 2020, 13, 358–368. [Google Scholar] [CrossRef]
- Park, S.; Kim, S.J.; Oh, K.C.; La Cho, H.; Kim, M.J.; Jeong, I.S.; Lee, C.G.; Kim, D.H. Characteristic Analysis of Torrefied Pellets: Determining Optimal Torrefaction Conditions for Agri-Byproduct. Energies 2020, 13, 423. [Google Scholar] [CrossRef]
- Yılgın, M.; Duranay, N.; Pehlivan, D. Torrefaction and combustion behaviour of beech wood pellets. J. Therm. Anal. Calorim. 2019, 138, 819–826. [Google Scholar] [CrossRef]
- Nam, S.B.; Park, Y.S.; Kim, D.J.; Gu, J.H. Torrefaction Reaction Characteristic of Various Biomass Waste on Pilot Scale of Torrefaction Reaction System. Procedia Environment. Sci. 2016, 35, 890–894. [Google Scholar] [CrossRef]
- International Organisation for Standardardisation. Solid biofuels—Fuel specifications and classes—Part 8: Graded thermally treated and densified biomass fuels ISO/DIS 17225-8:2016, 2016 (ISO/DIS 17225-8:2016). Available online: https://www.iso.org/standard/71915.html (accessed on 14 March 2022).
- Chen, W.-H.; Zhuang, Y.-Q.; Liu, S.-H.; Juang, T.-T.; Tsai, C.-M. Product characteristics from the torrefaction of oil palm fiber pellets in inert and oxidative atmospheres. Bioresour. Technol. 2016, 199, 367–374. [Google Scholar] [CrossRef]
- Zeng, T. Standard Operating Procedures of Rotary Kiln, Internal Test Stand Documentation DBFZ. Leipzig 2015.
- Liebetrau, J. Measurement Toolkit Biogas: Methods for the determination of analytical and process parameters describing the biogas area. DBFZ 2013. Available online: https://www.energetische-biomassenutzung.de (accessed on 12 April 2022).
- Tumuluru, J.S.; Sokhansanj, S.; Hess, J.R.; Wright, C.; Boardman, R.D. A Review on Biomass Torrefaction Process and Product Properties for Energy Applications. Ind. Biotechnol. 2011, 7, 384–401. [Google Scholar] [CrossRef]
- Chen, W.-H.; Lin, B.-J.; Lin, Y.-Y.; Chu, Y.-S.; Ubando, A.T.; Show, P.L.; Ong, H.C.; Chang, J.-S.; Ho, S.-H.; Culaba, A.B.; et al. Progress in biomass torrefaction: Principles, applications and challenges. Prog. Energy Combust. Sci. 2021, 82, 100887. [Google Scholar] [CrossRef]
- Yoshida, T.; Nomura, T.; Gensai, H.; Watada, H.; Sano, T.; Ohara, S. Upgraded Pellet Making by Torrefaction—Torrefaction of Japanese Wood Pellets. J. Sustain. Bioenergy Syst. 2015, 5, 82–85. [Google Scholar] [CrossRef][Green Version]
- Manouchehrinejad, M.; van Giesen, I.; Mani, S. Grindability of torrefied wood chips and wood pellets. Fuel Process. Technol. 2018, 182, 45–55. [Google Scholar] [CrossRef]
- van der Stelt, M.J.C.; Gerhauser, H.; Kiel, J.H.A.; Ptasinski, K.J. Biomass upgrading by torrefaction for the production of biofuels: A review. Biomass Bioenergy 2011, 31, 3458. [Google Scholar] [CrossRef]
- Tumuluru, J.S.; Sokhansanj, S.; Wright, C.T.; Boardman, R.D. Biomass Torrefaction Process Review and Moving Bed Torrefaction System Model Development; Report Prepared for U.S. Energy Department, Idaho National Laboratory (INL) and Oak Ridge National Laboratory; Technical Report No. US201212%%980; U.S. Department of Energy: Oak Ridge, TN, USA, 2010. [Google Scholar] [CrossRef]
- Ferro Tito, D.; Vigouroux, V.; Grimm, A.; Zanzi, R. Torrefaction of agricultural and forest residues. In Proceedings of the Torrefaction of Agricultural and Forest Residues, Conference Cubasolar, Guantánamo, Cuba, 12–16 April 2004. [Google Scholar]
- Hang, S.; Zhao, Z.; Zheng, A.; He, F.; Huang, Z.; Li, H. Characterization of Products from Torrefaction of Sprucewood and Bagasse in an Auger Reactor. Energy Fuels 2012, 26, 7009–7017. [Google Scholar]
- Bergman, P.C.A.; Boersma, A.R.; Zwart, R.W.R.; Kiel, J.H.A. Torrefaction for Biomass Co-Firing in Existing Coal-Fired Power Stations; Energy Research Center of The Netherlands: Petten, The Netherlands, 2005. [Google Scholar]
- Bergman, P.C.A. Combined Torrefaction and Pelletisation: The TOP Process; Technical Report; ECN Biomass: Pettem, The Netherlands, 2005. Available online: https://www.osti.gov/etdeweb/biblio/20653915 (accessed on 18 September 2022).
- Zhang, Y.; Chen, F.; Chen, D.; Cen, K.; Zhang, J.; Cao, X. Upgrading of biomass pellets by torrefaction and its influence on the hydrophobicity, mechanical property, and fuel quality. Biomass Conv. Bioref. 2020, 40, 153. [Google Scholar] [CrossRef]
- Pollex, A.; Zeng, T.; Khalsa, J.; Erler, U.; Schmersahl, R.; Schön, C.; Kuptz, D.; Lenz, V.; Nelles, M. Content of potassium and other aerosol forming elements in commercially available wood pellet batches. Fuel 2018, 232, 384–394. [Google Scholar] [CrossRef]
- Nunes, L.J.R.; Matias, J.C.O.; Catalão, J.P.S. A review on torrefied biomass pellets as a sustainable alternative to coal in power generation. Renew. Sustain. Energy Rev. 2014, 40, 153–160. [Google Scholar] [CrossRef]
- International Organisation for Standardardisation. Solid Biofuels-Fuel Specifications and Classes-Part 2: Graded Wood Pellets, 2nd ed.; Berlin, V., Ed.; DIN Deutsches Institut für Normung e; Beuth Verlag GmbH: Berlin, Germany, 2021; Available online: http://www.beuth.de/ (accessed on 14 March 2022).
- Cutz, L.; Tiringer, U.; Gilvari, H.; Schott, D.; Mol, A.; de Jong, W. Microstructural degradation during the storage of biomass pellets. Commun. Mater. 2021, 2, 16013. [Google Scholar] [CrossRef]
- Zeng, T.; Weller, N.; Pollex, A.; Lenz, V. Blended biomass pellets as fuel for small scale combustion appliances: Influence on gaseous and total particulate matter emissions and applicability of fuel indices. Fuel 2016, 184, 689–700. [Google Scholar] [CrossRef]
- Zeng, T.; Pollex, A.; Weller, N.; Nelles, M. Blended biomass pellets as fuel for small scale combustion appliances: Effect of blending on slag formation in the bottom ash and pre-evaluation options. Fuel 2018, 212, 108–116. [Google Scholar] [CrossRef]
- Dizaji, H.B.; Zeng, T.; Hölzig, H.; Bauer, J.; Klöß, G.; Enke, D. Ash transformation mechanism during combustion of rice husk and rice straw. Fuel 2022, 307, 121768. [Google Scholar] [CrossRef]


Publisher’s Note: MDPI stays neutral with regard to jurisdictional claims in published maps and institutional affiliations. |
© 2022 by the authors. Licensee MDPI, Basel, Switzerland. This article is an open access article distributed under the terms and conditions of the Creative Commons Attribution (CC BY) license (https://creativecommons.org/licenses/by/4.0/).