
Adaptable Process Design as a Key for Sustainability Upgrades in Wastewater Treatment: Comparative Study on the Removal of Micropollutants by Advanced Oxidation and Granular Activated Carbon Processing at a German Municipal Wastewater Treatment Plant


Abstract

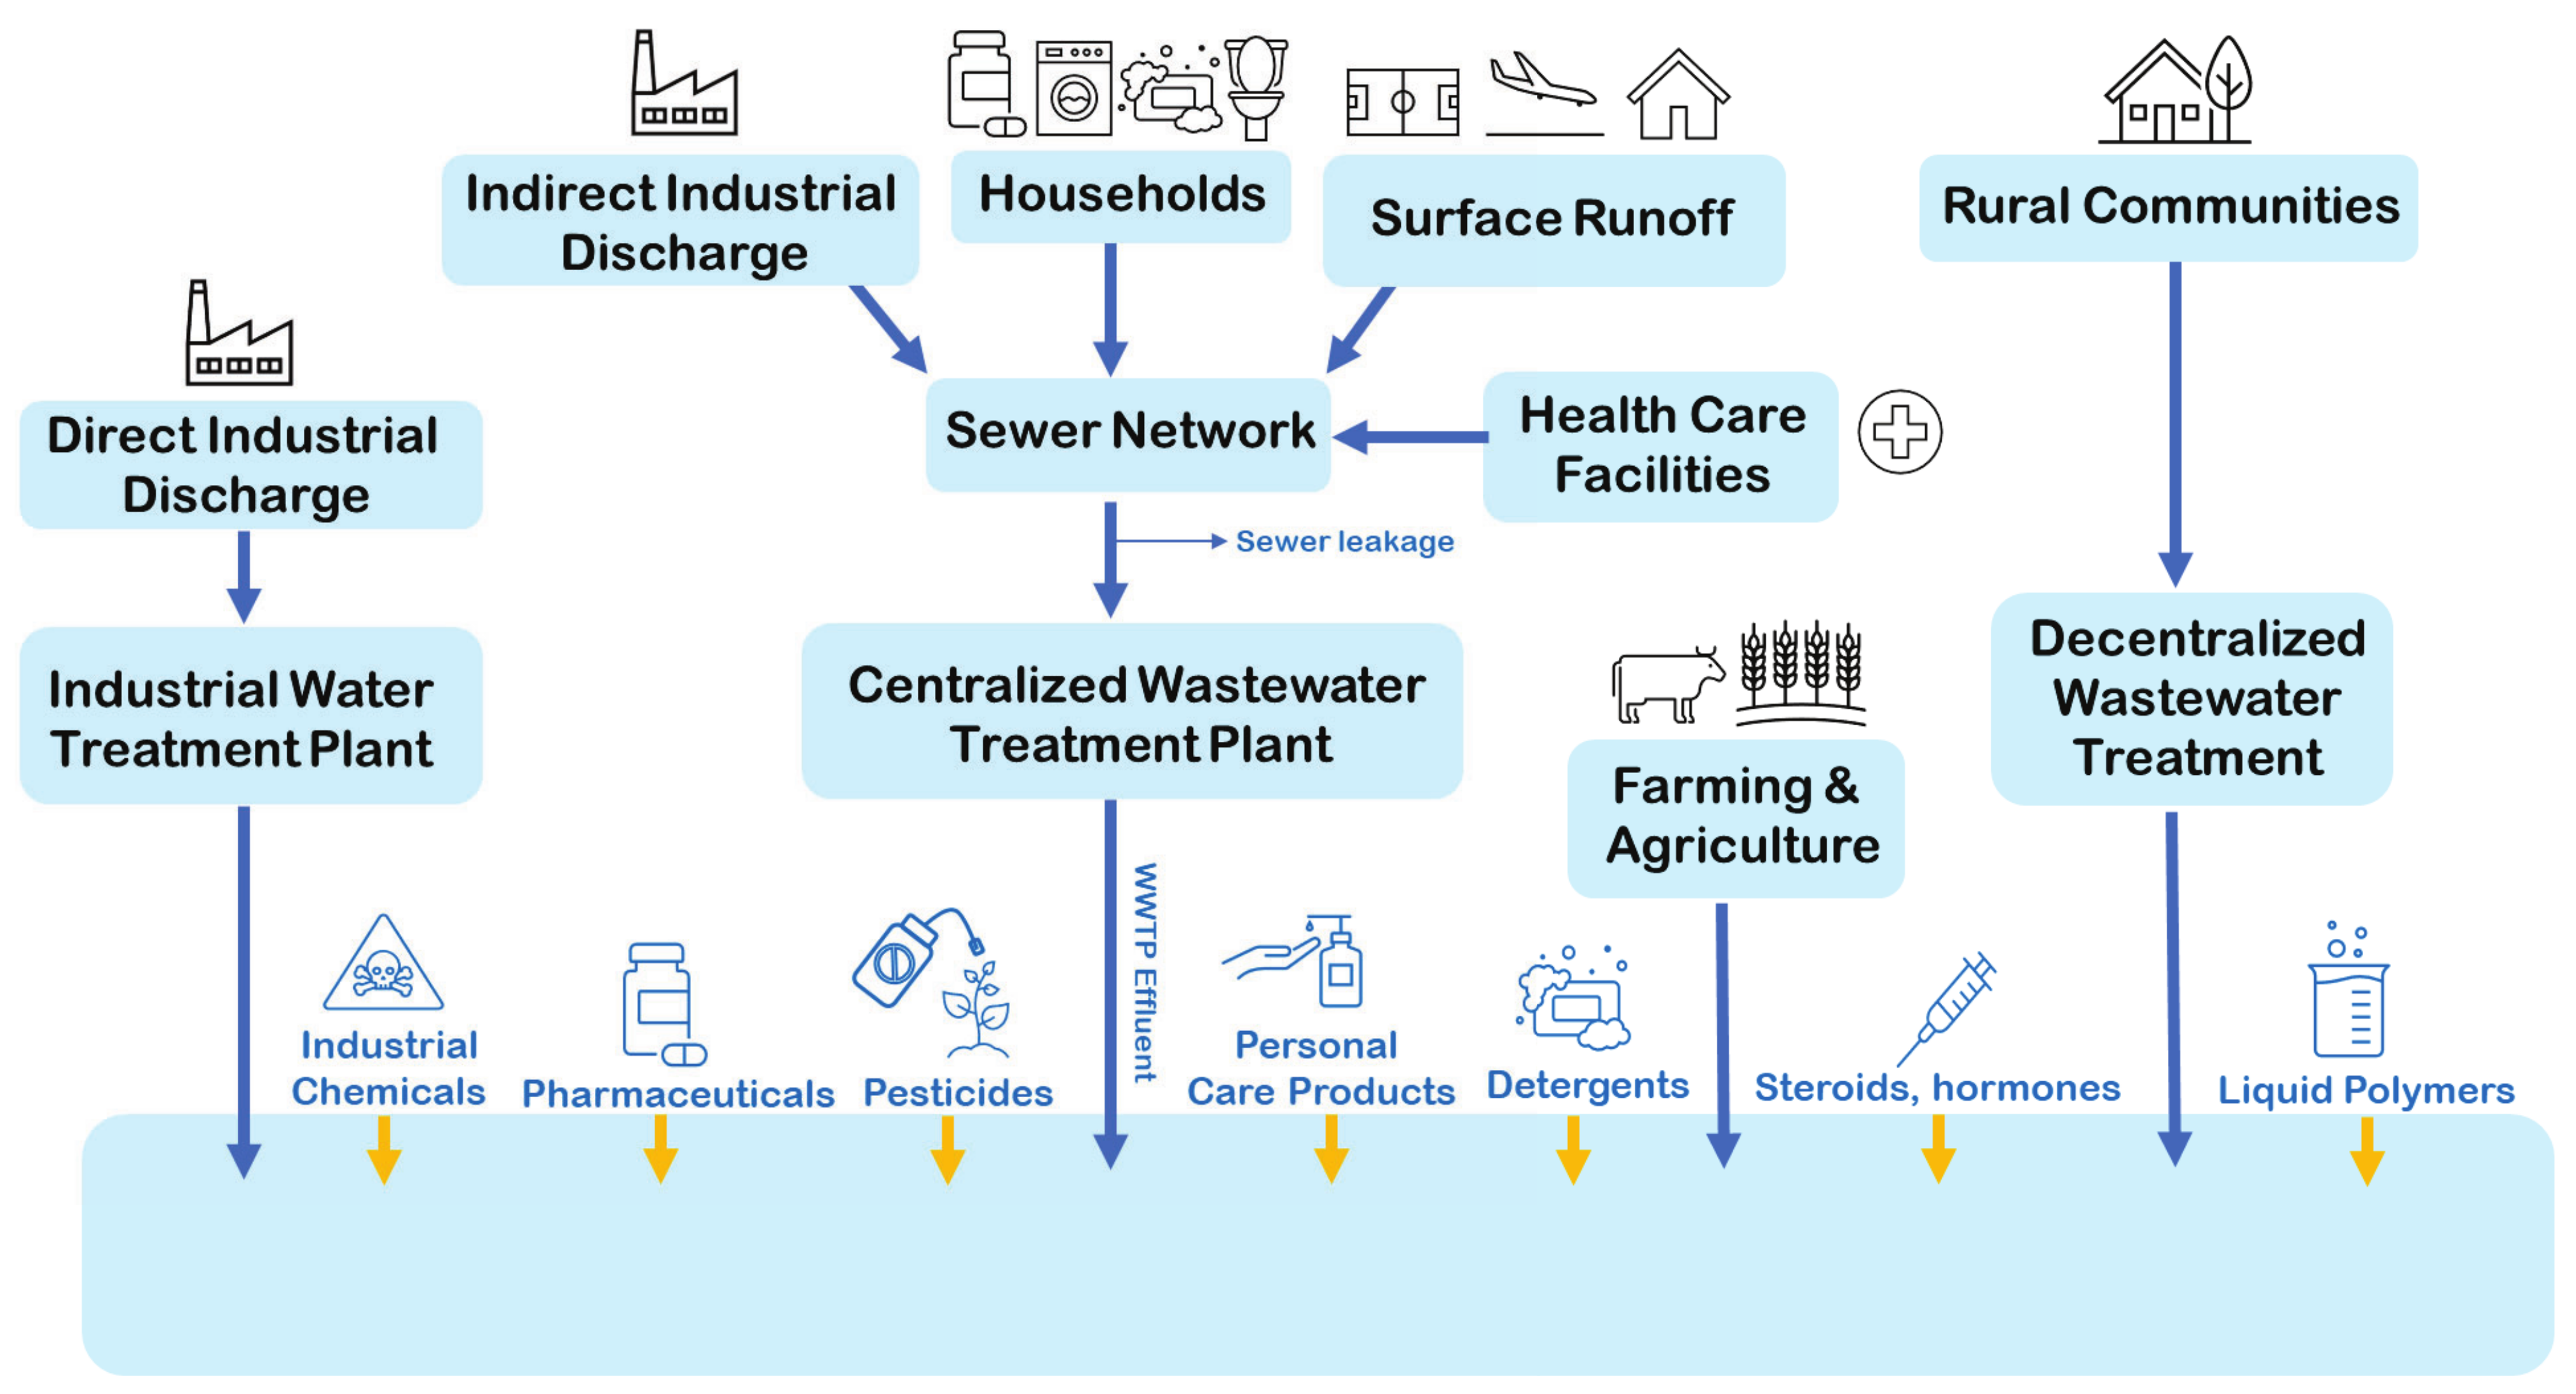
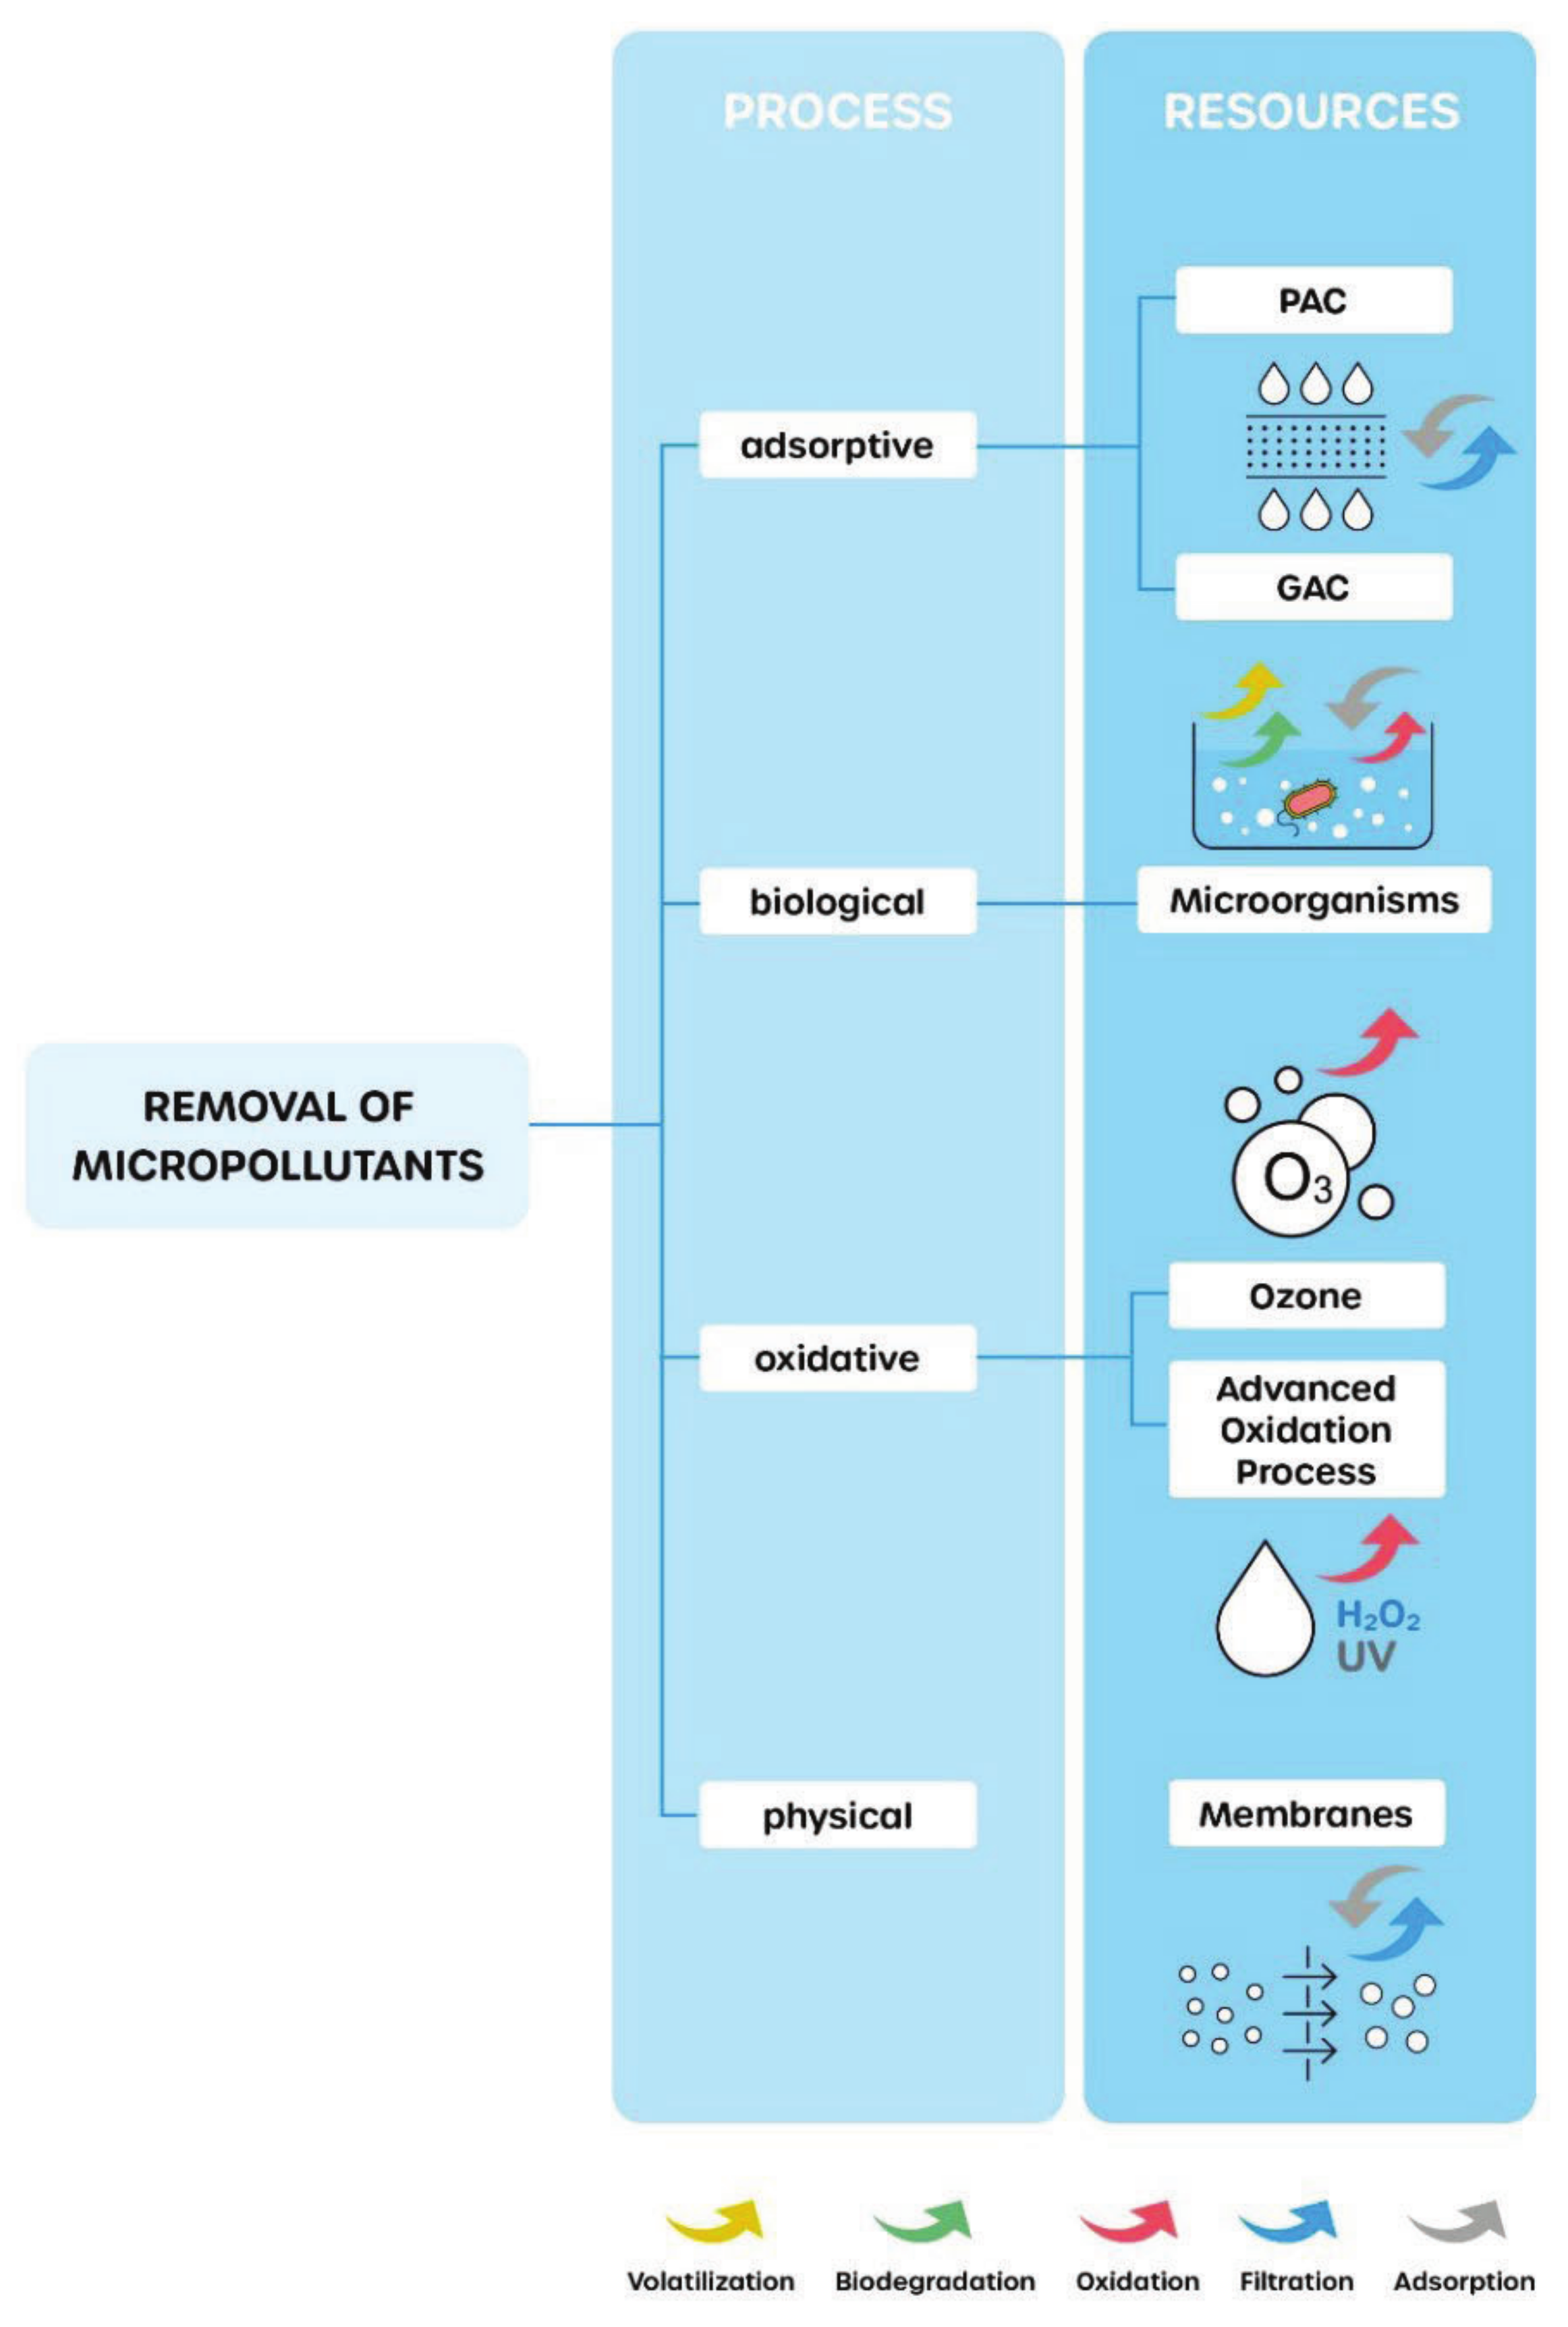
1. Introduction

2. Materials and Methods
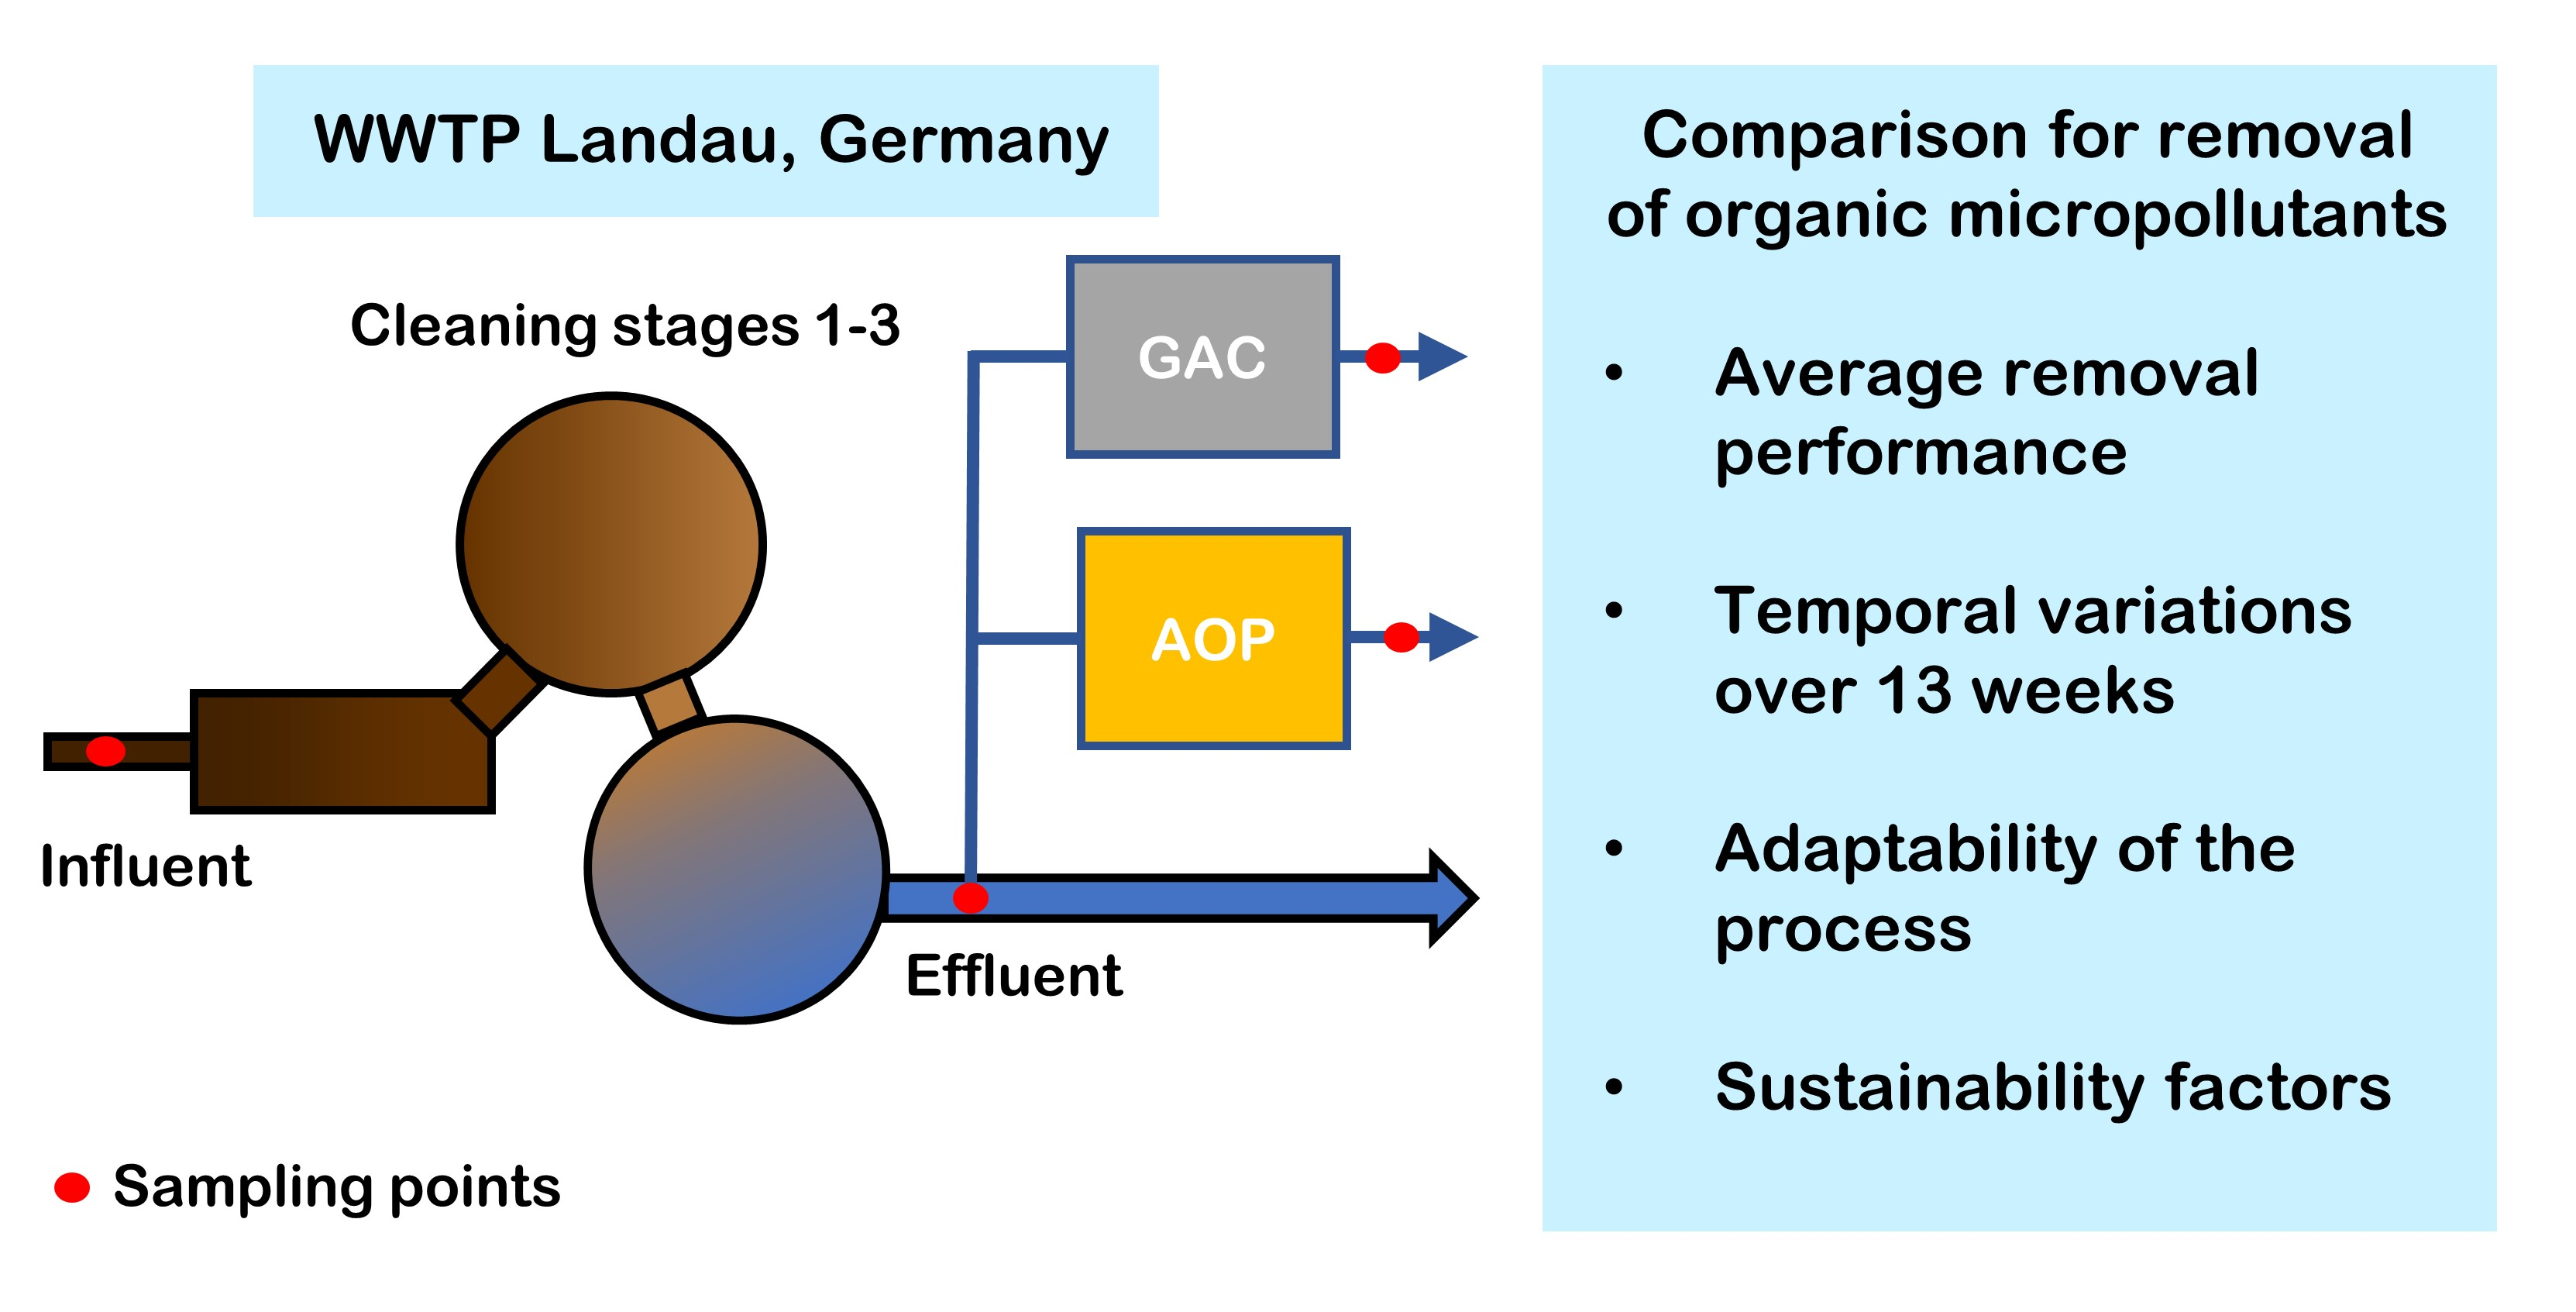
2.1. Study Area
2.2. Advanced Oxidation Process
2.3. Granular Activated Carbon Technology
2.4. SAC Measurements
2.5. Sampling Process, Sample Preparation, and Target Analytics
3. Results
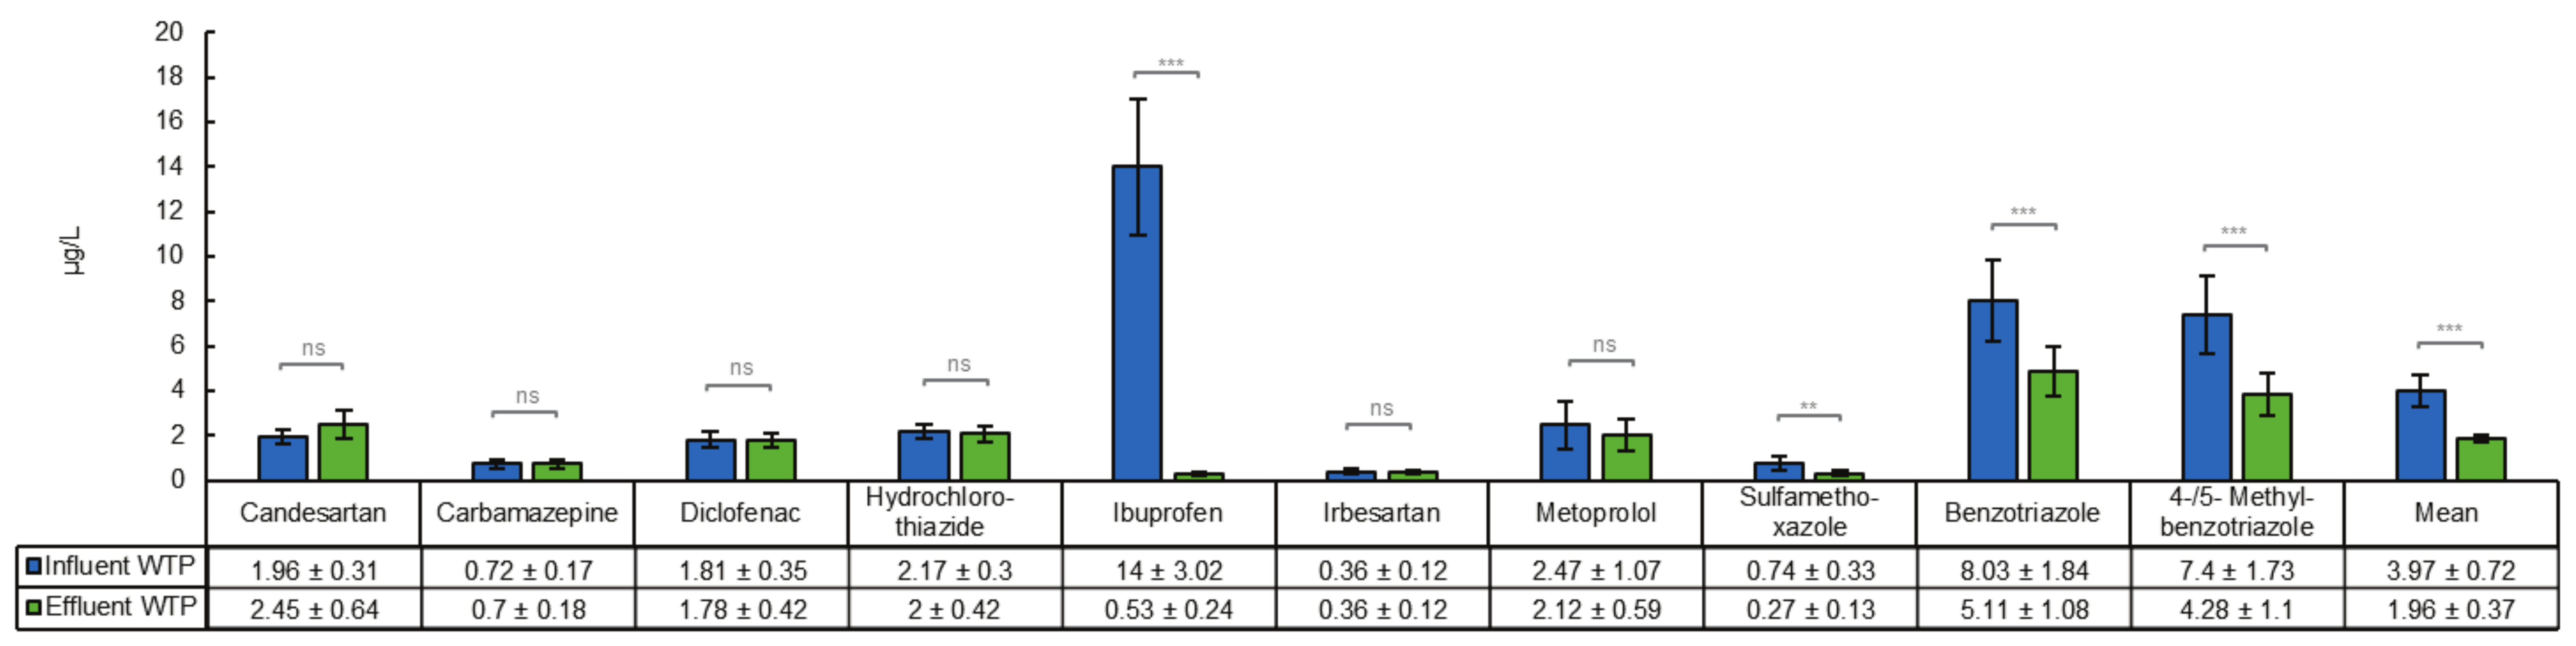
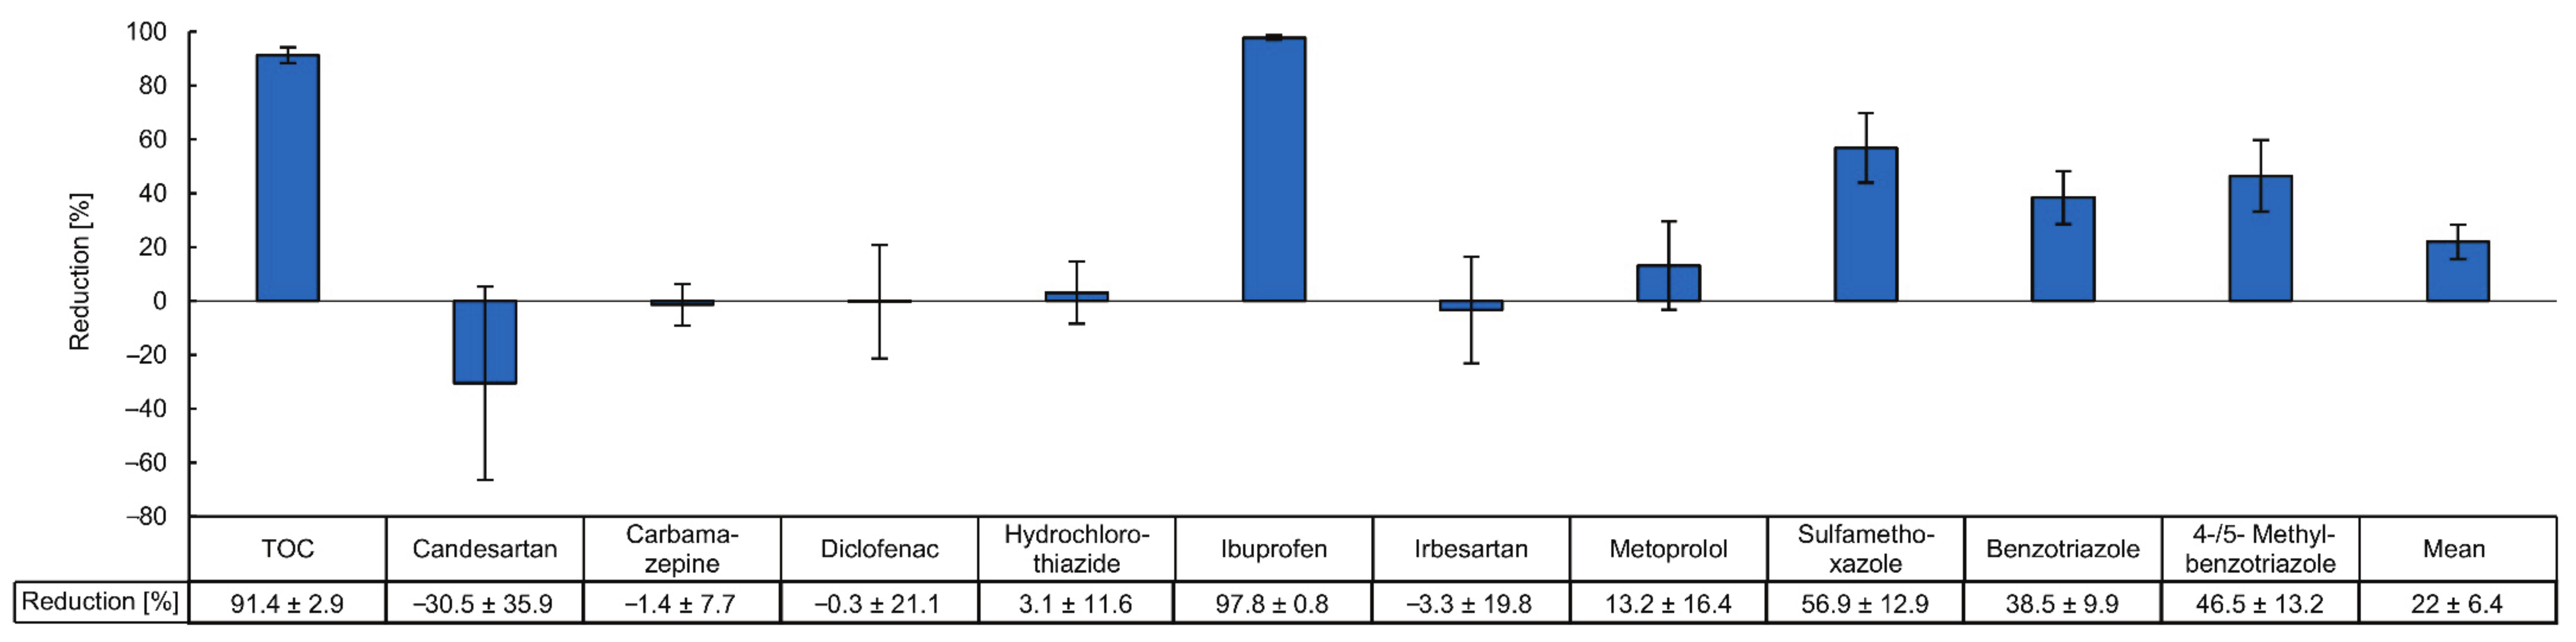
3.1. Removal of Organic Micropllutants in a Tertiary Treatment Process
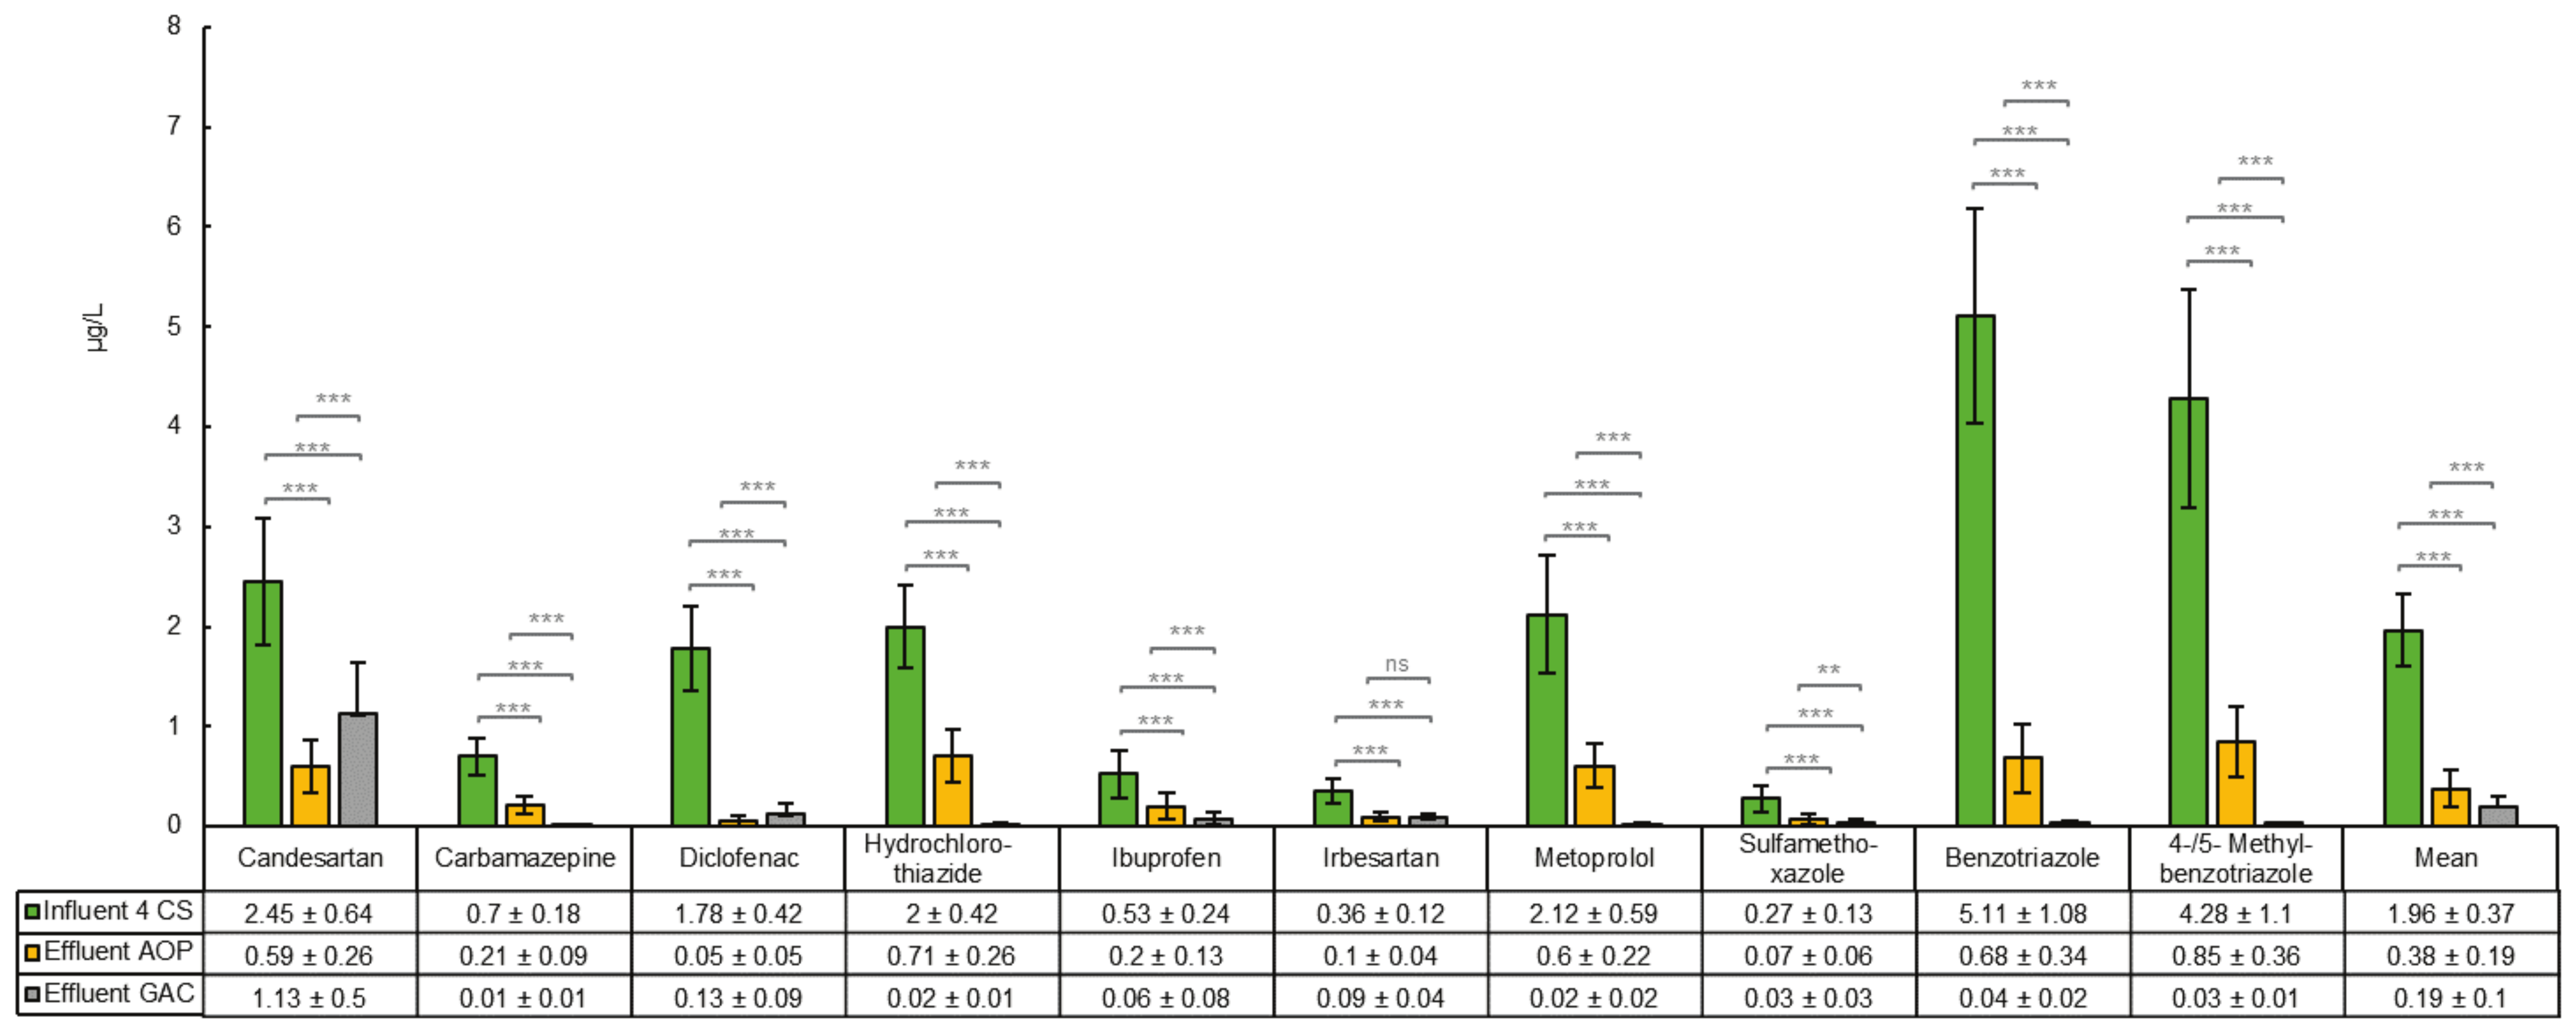
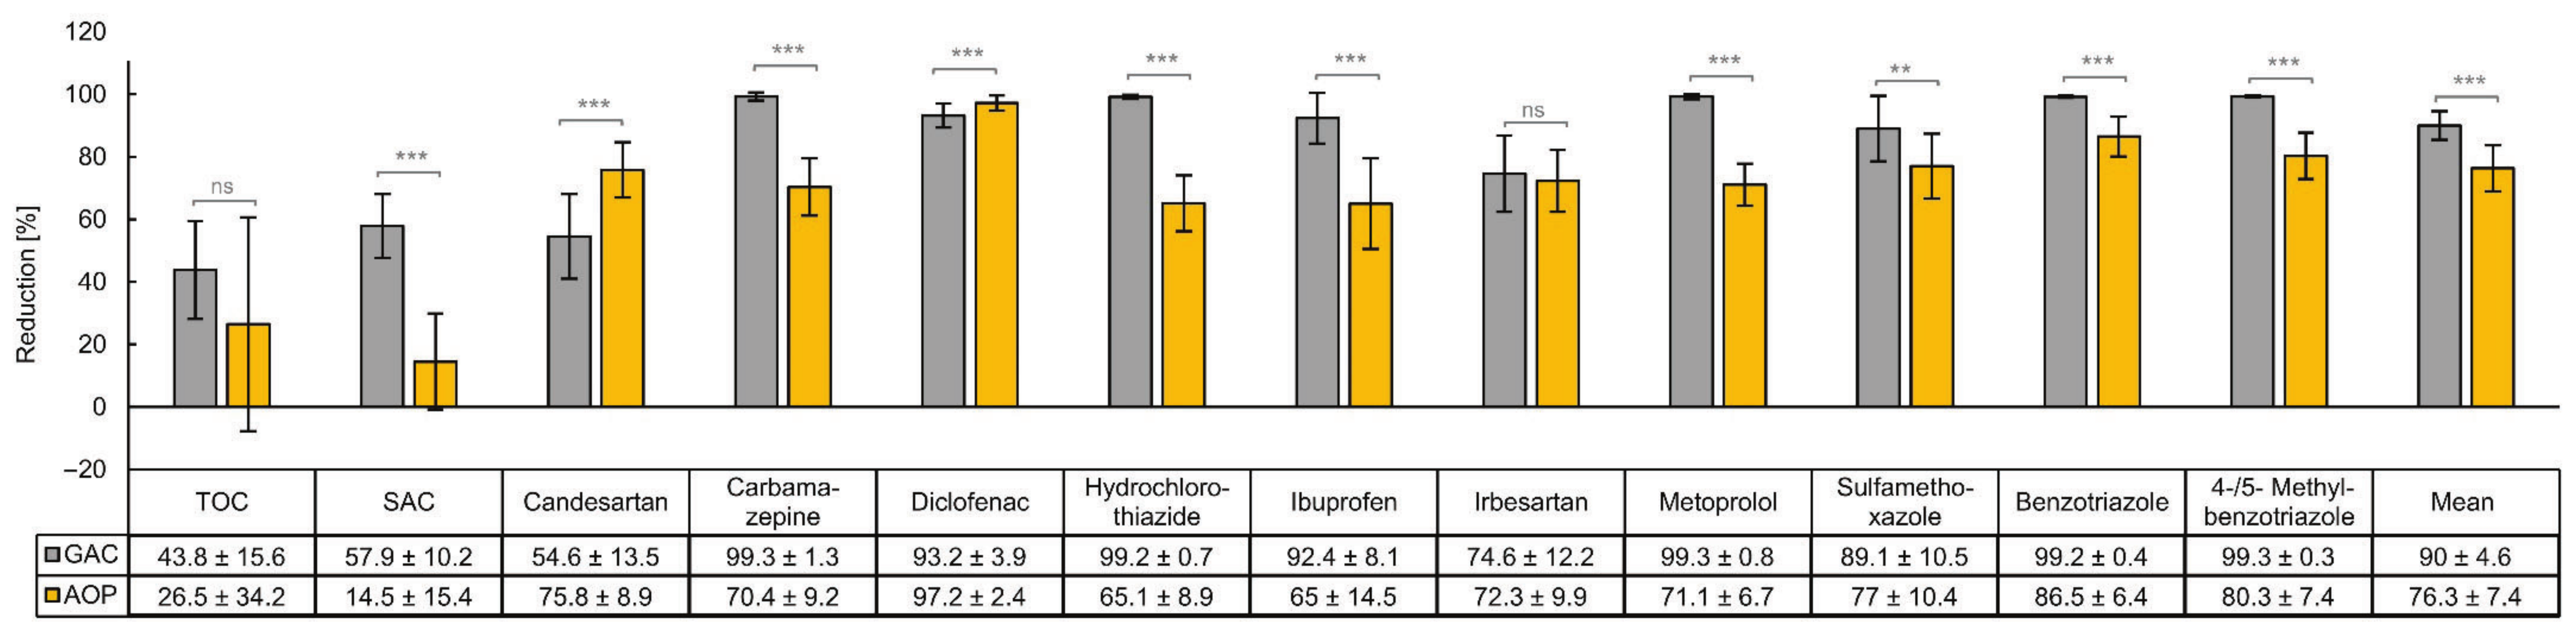
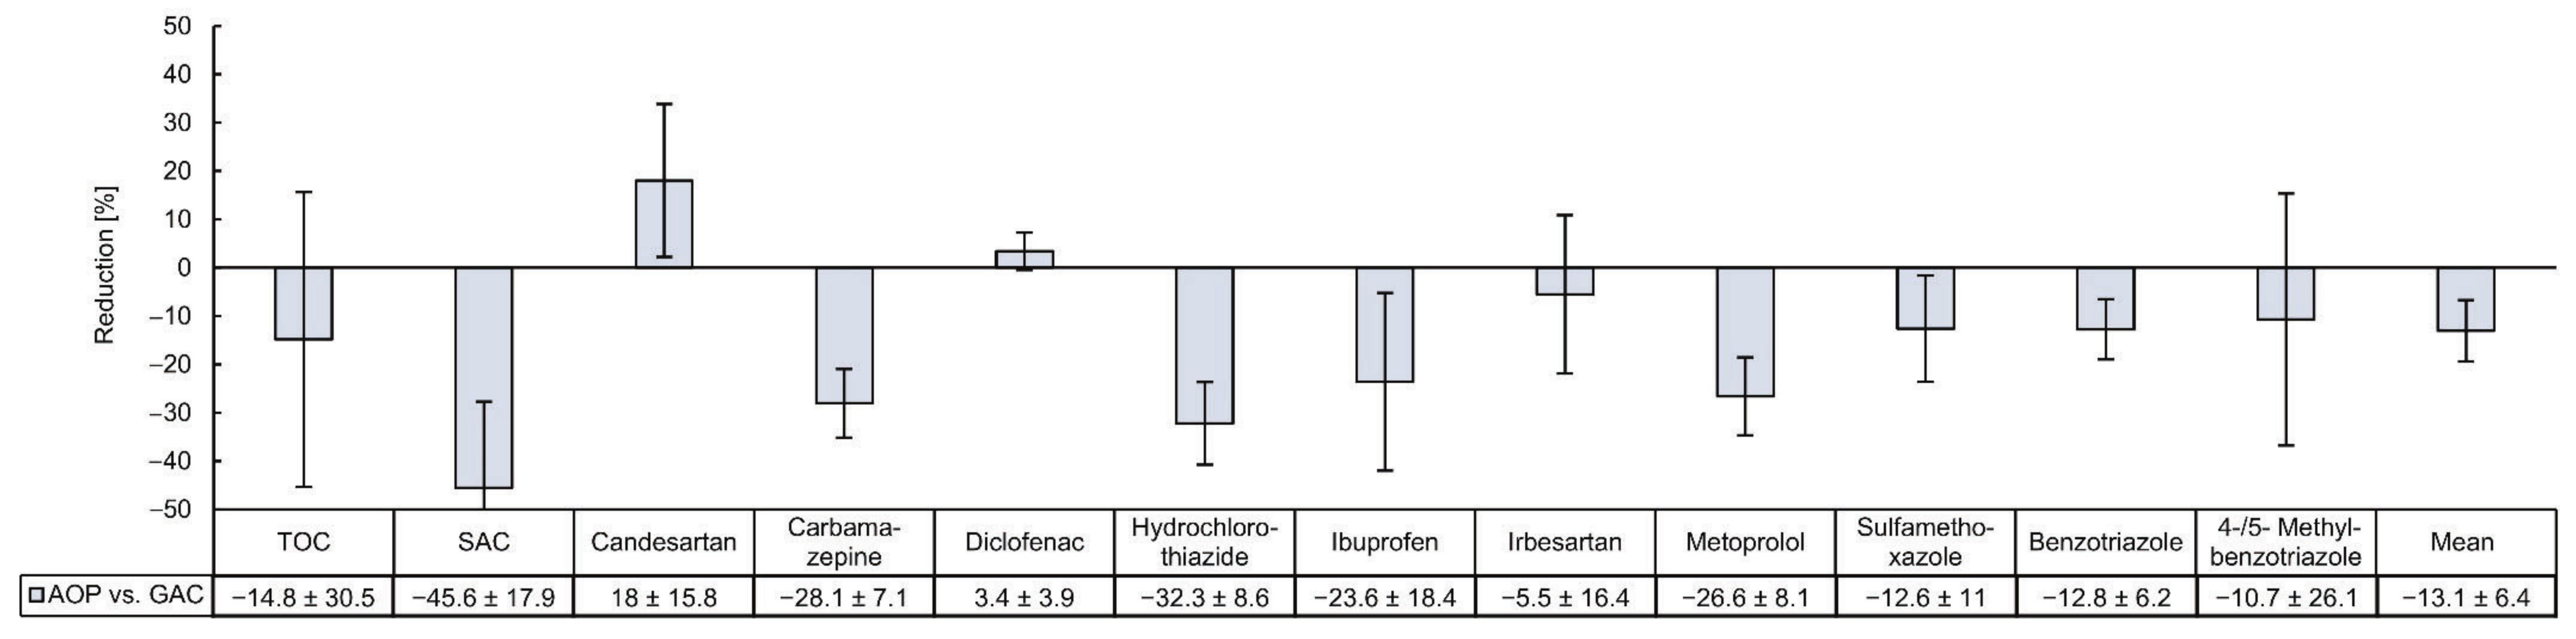
3.2. Comparison of the Removal Efficiencies of Organic Micropllutants by GAC and AOP
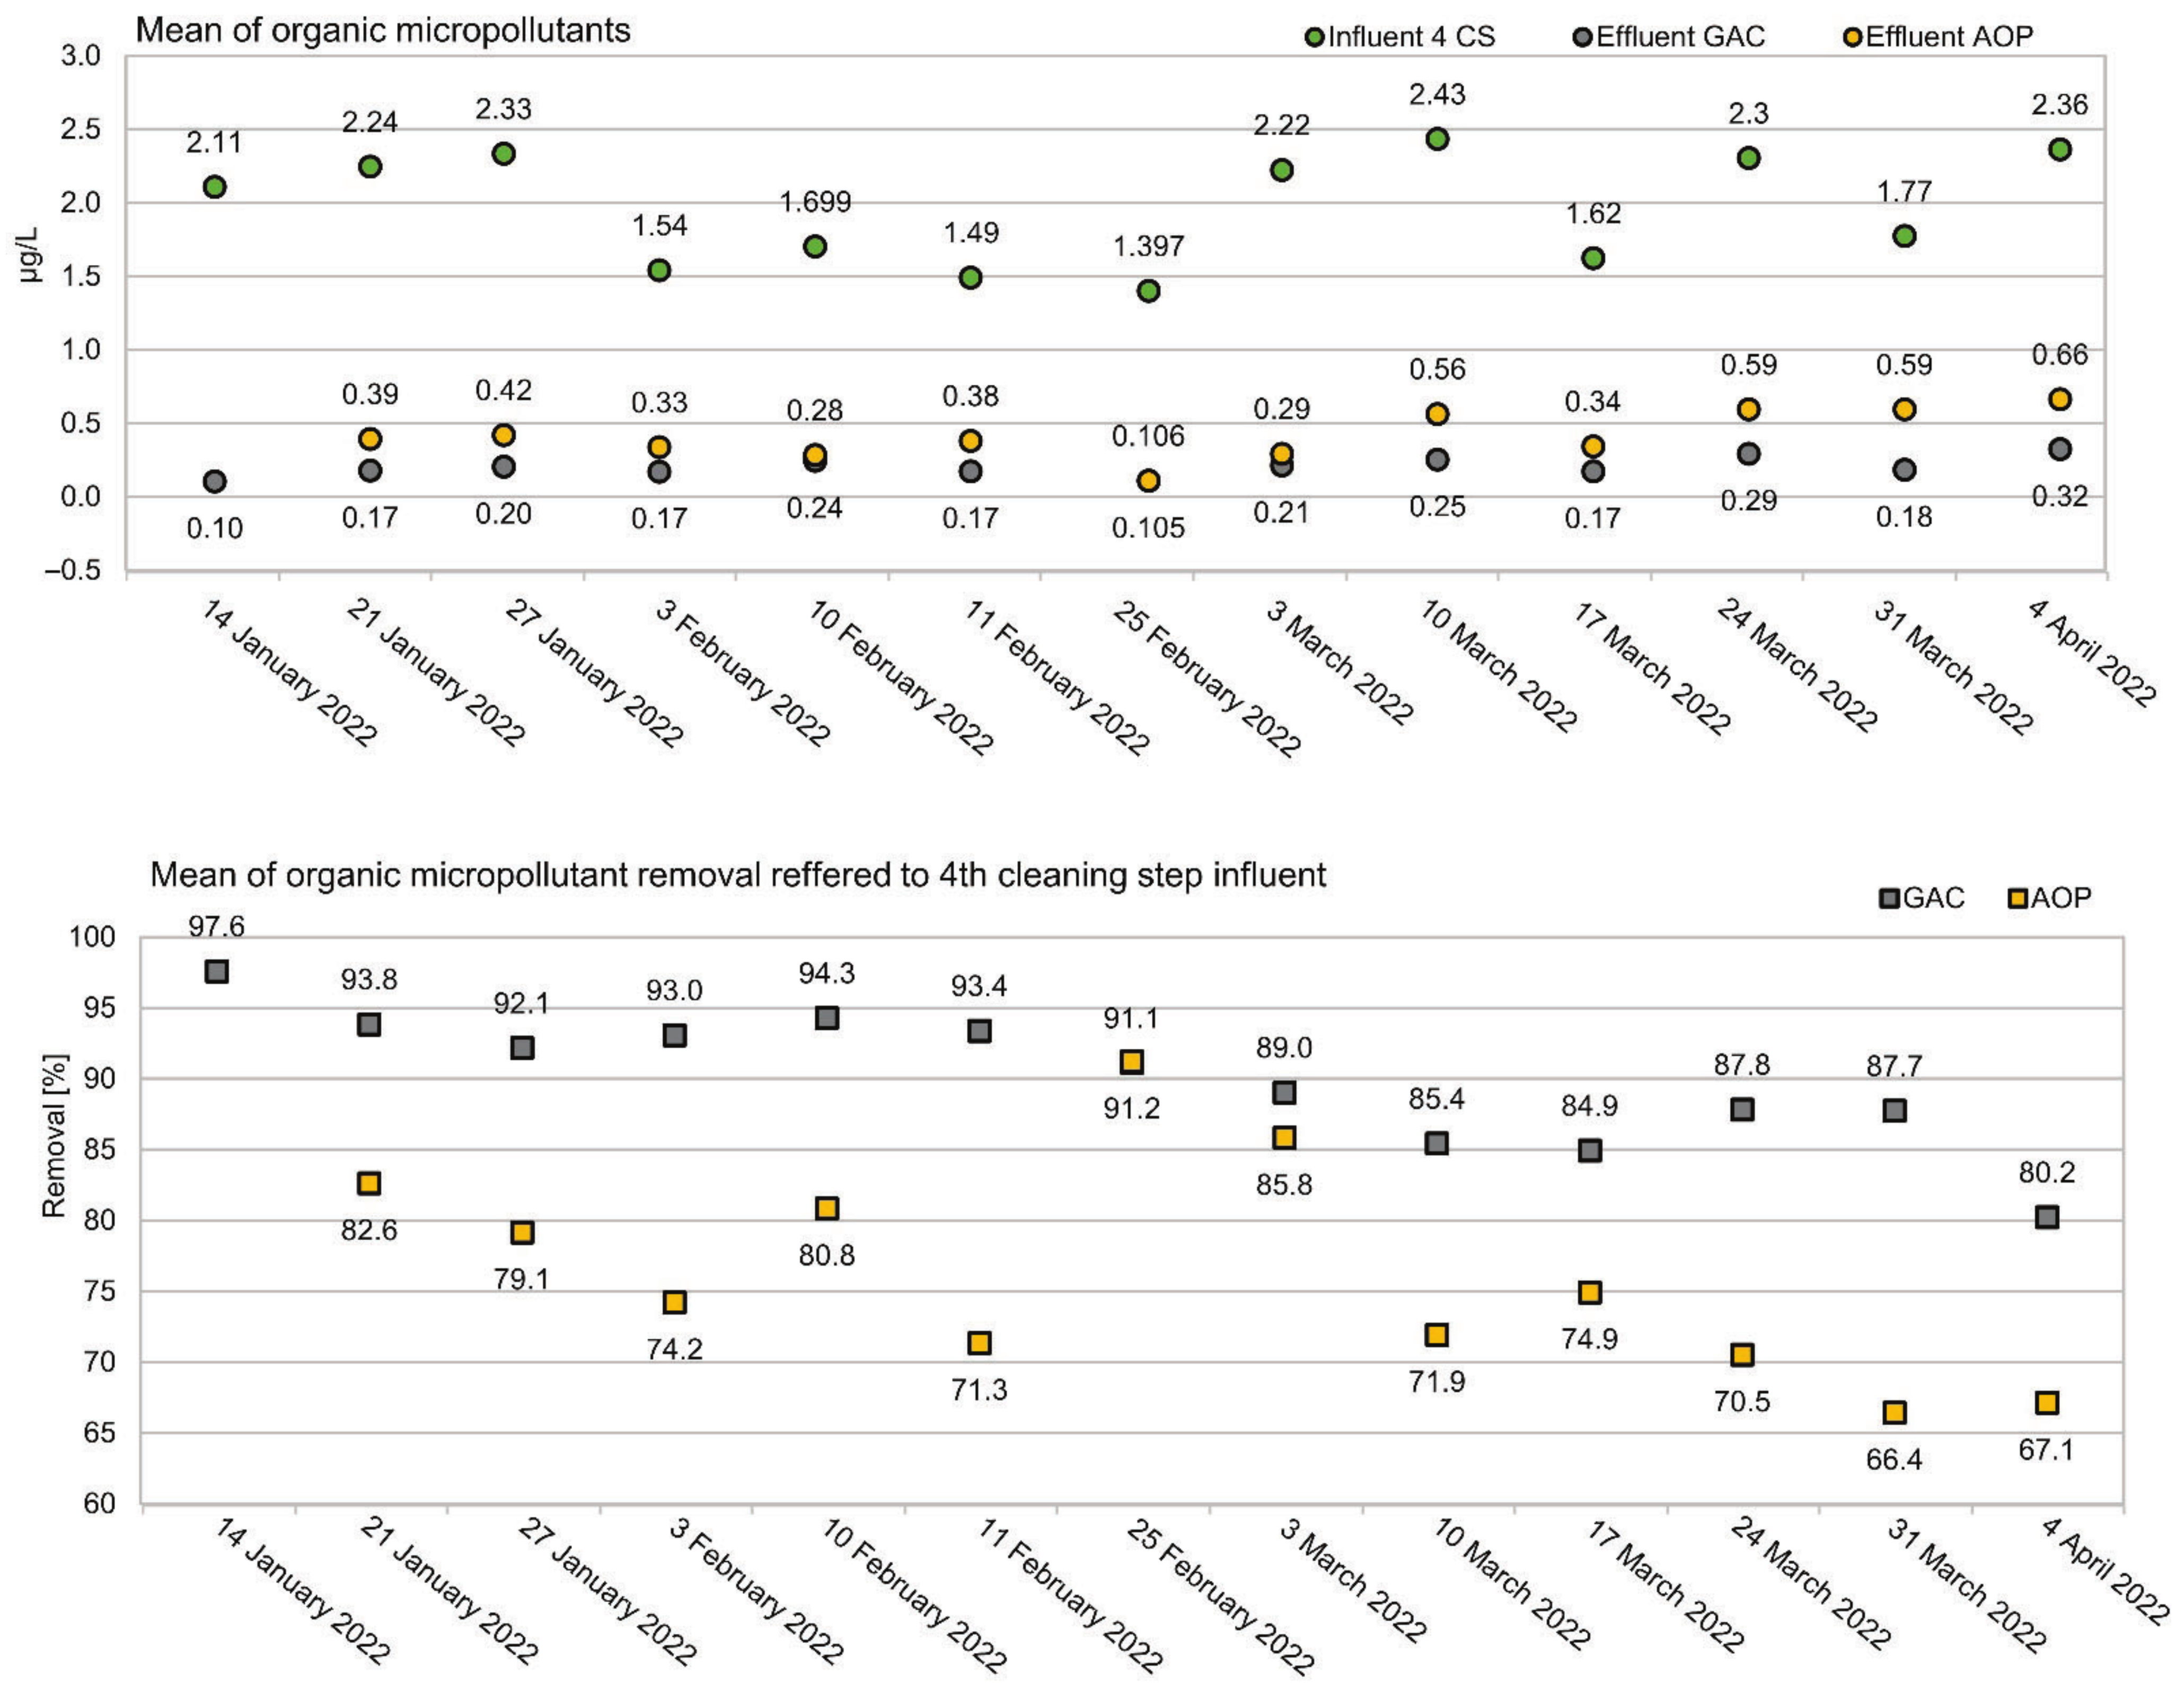
3.3. Temporal Variations of Removal Performance
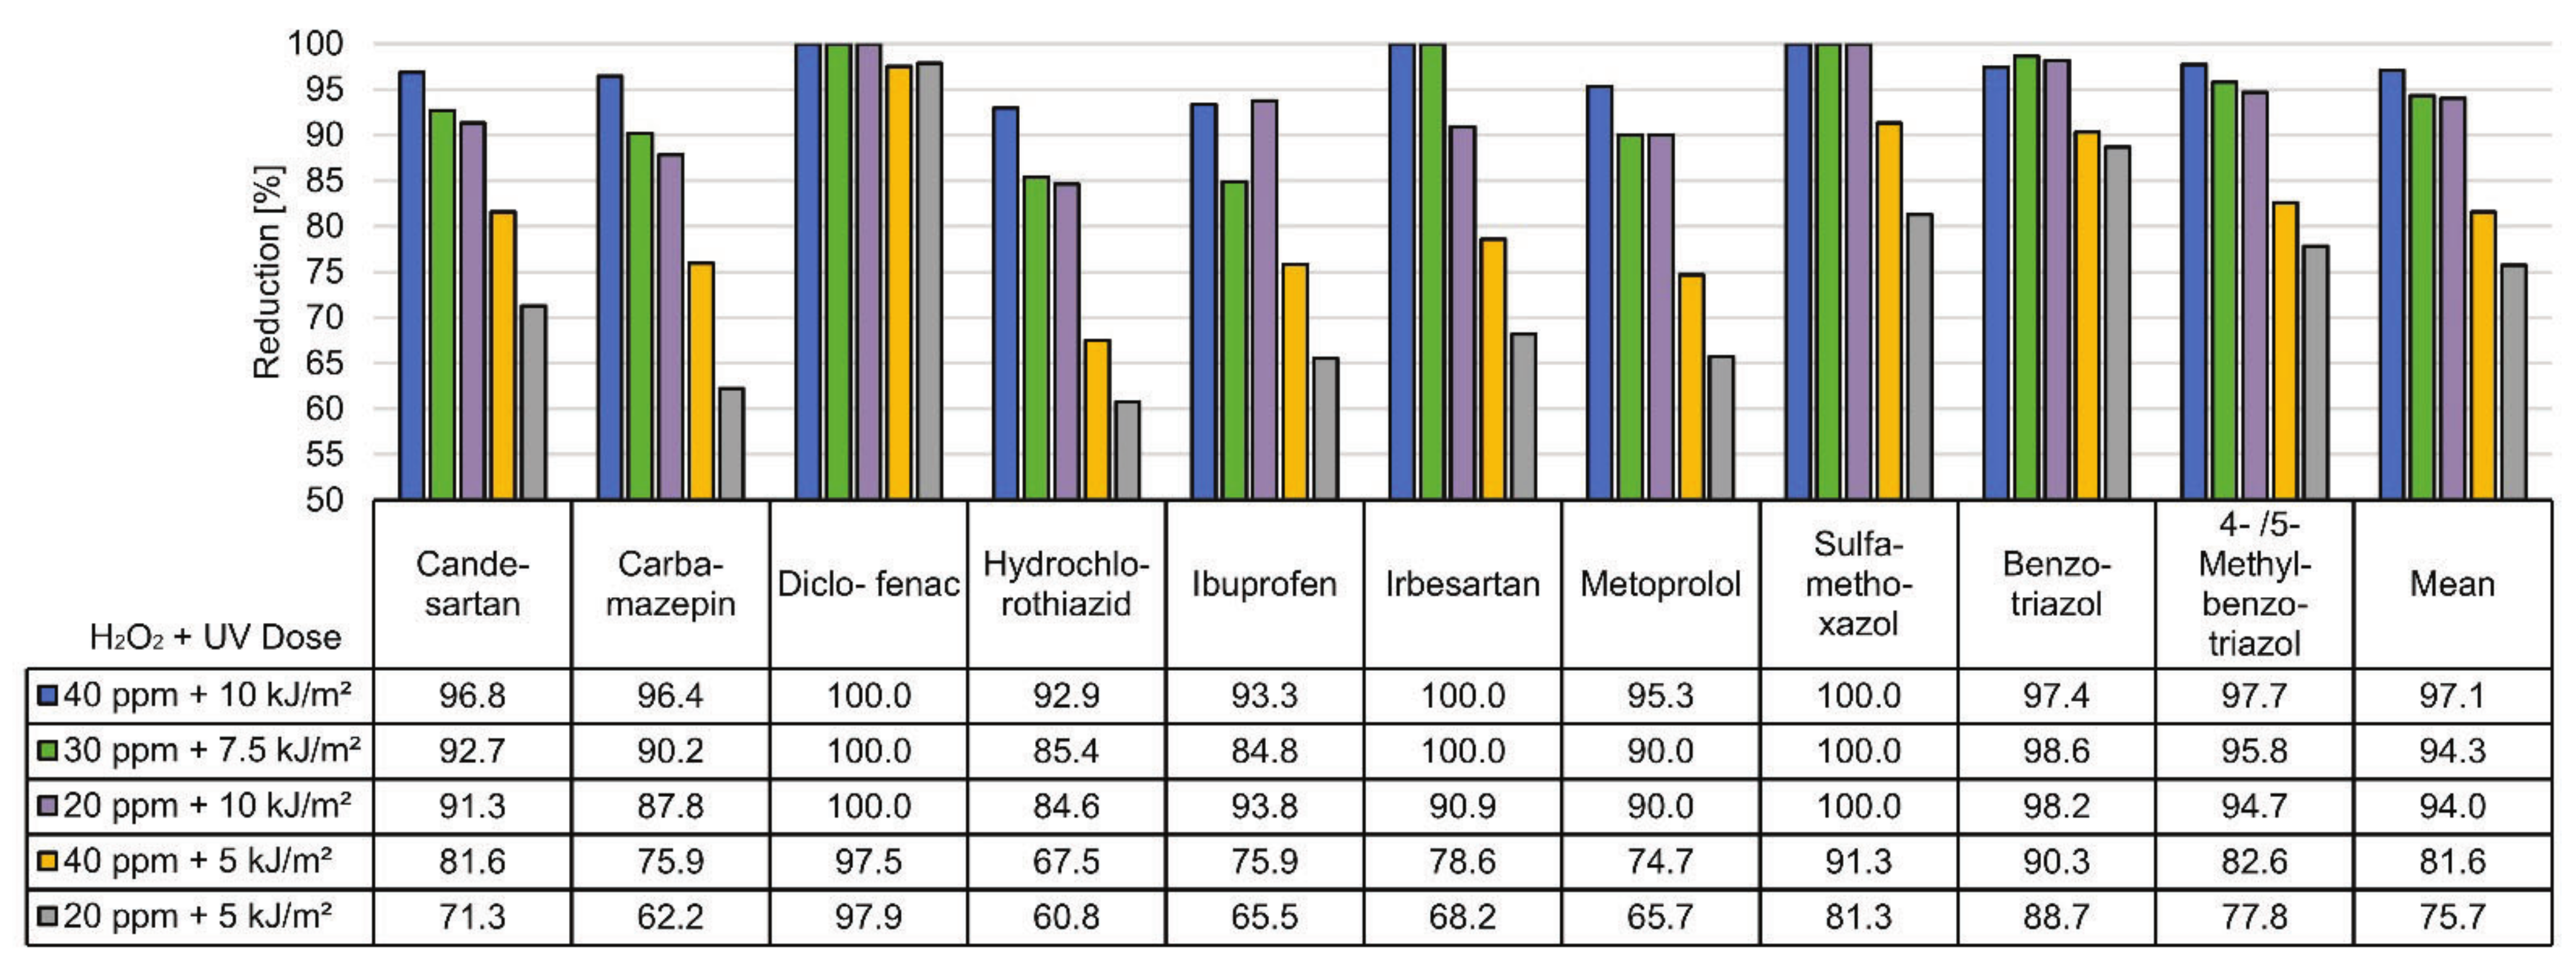
3.4. Dose–Response Testing of the AOP Process
4. Discussion
4.1. Removal of Organic Micropllutants in a Tertiary Treatment Process
4.2. Comparing the Removal of Organic Micropllutants by GAC and AOP
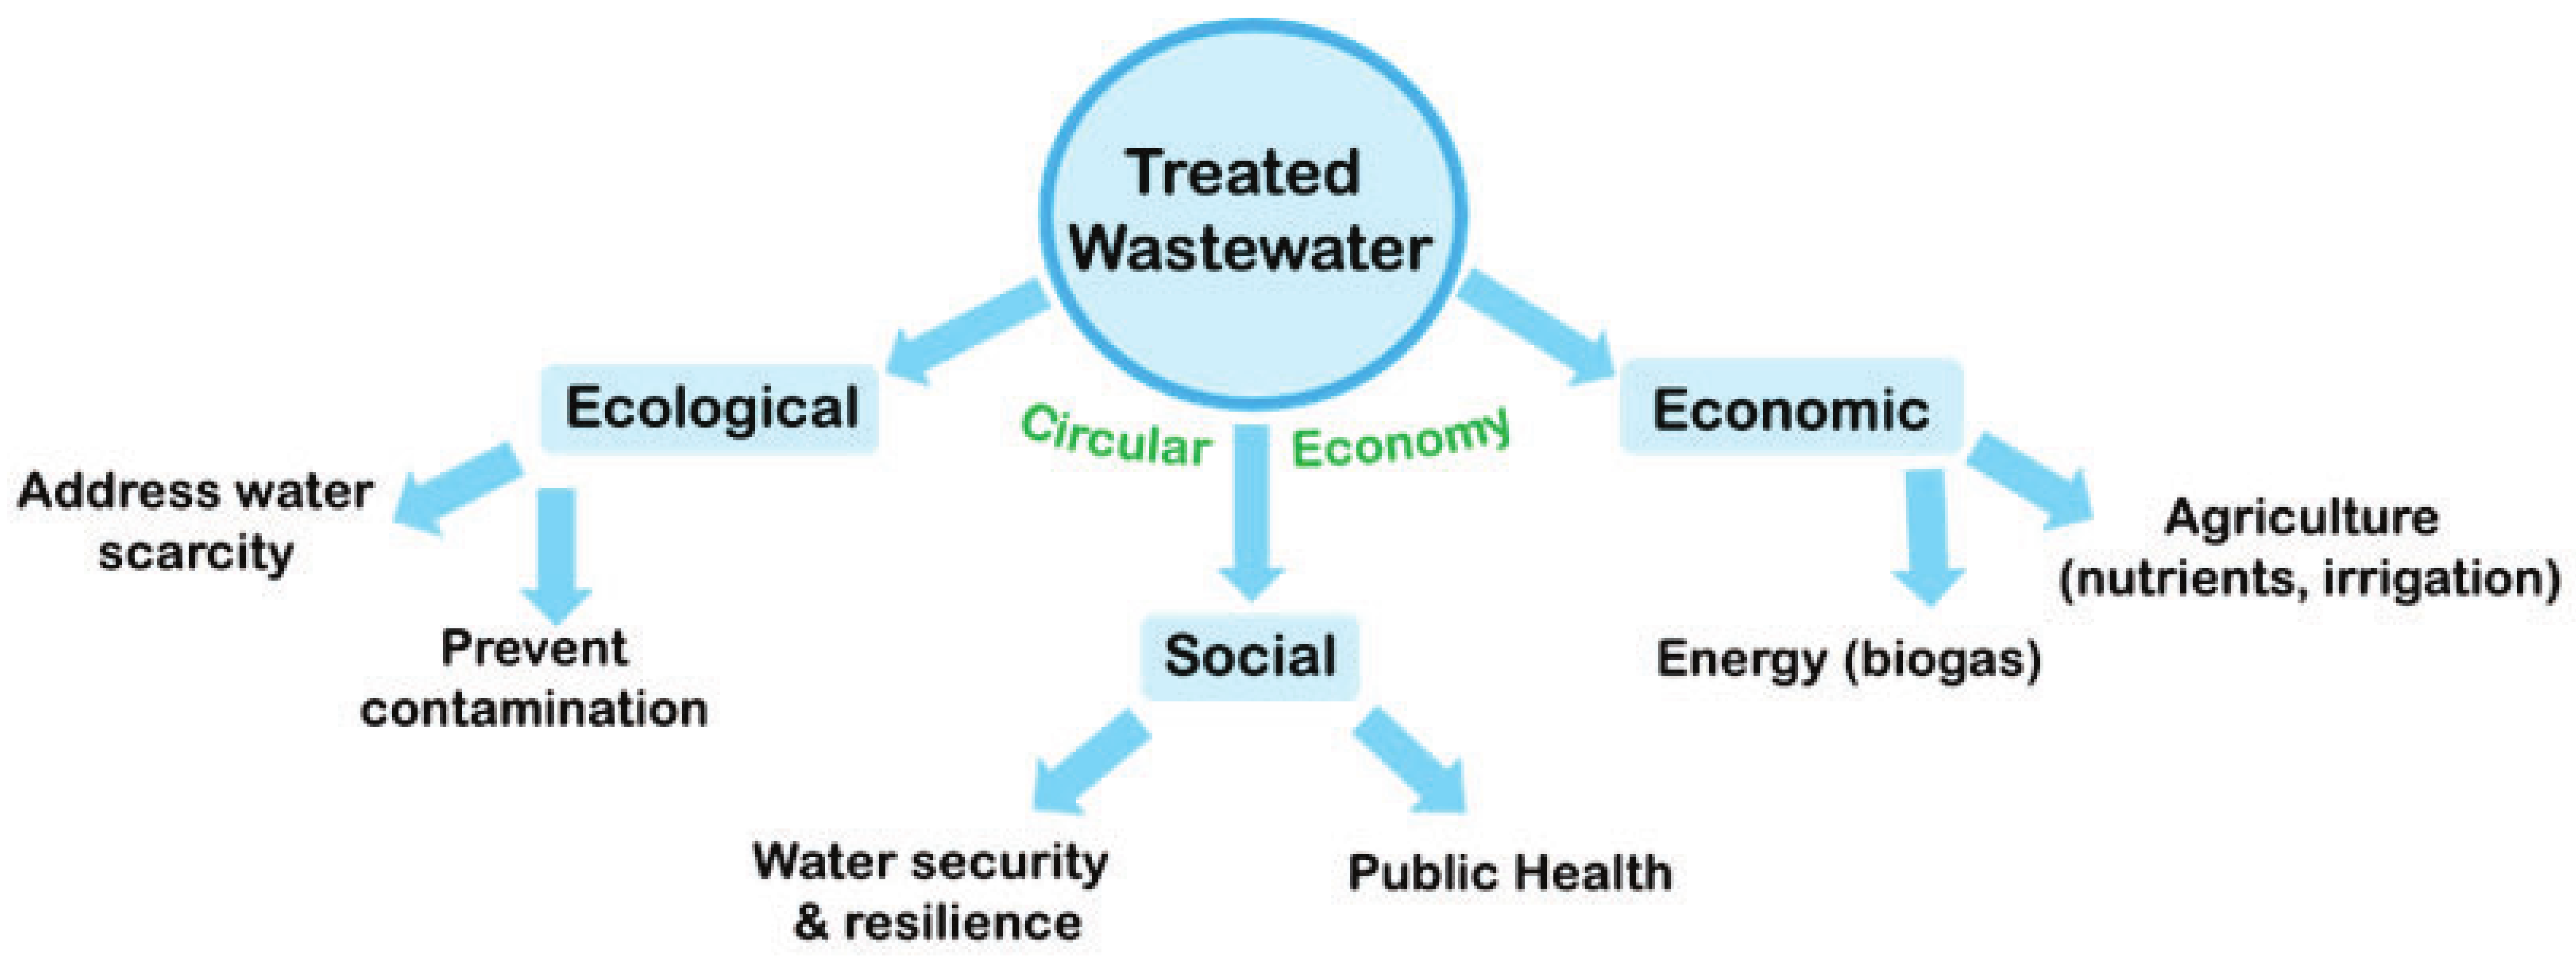
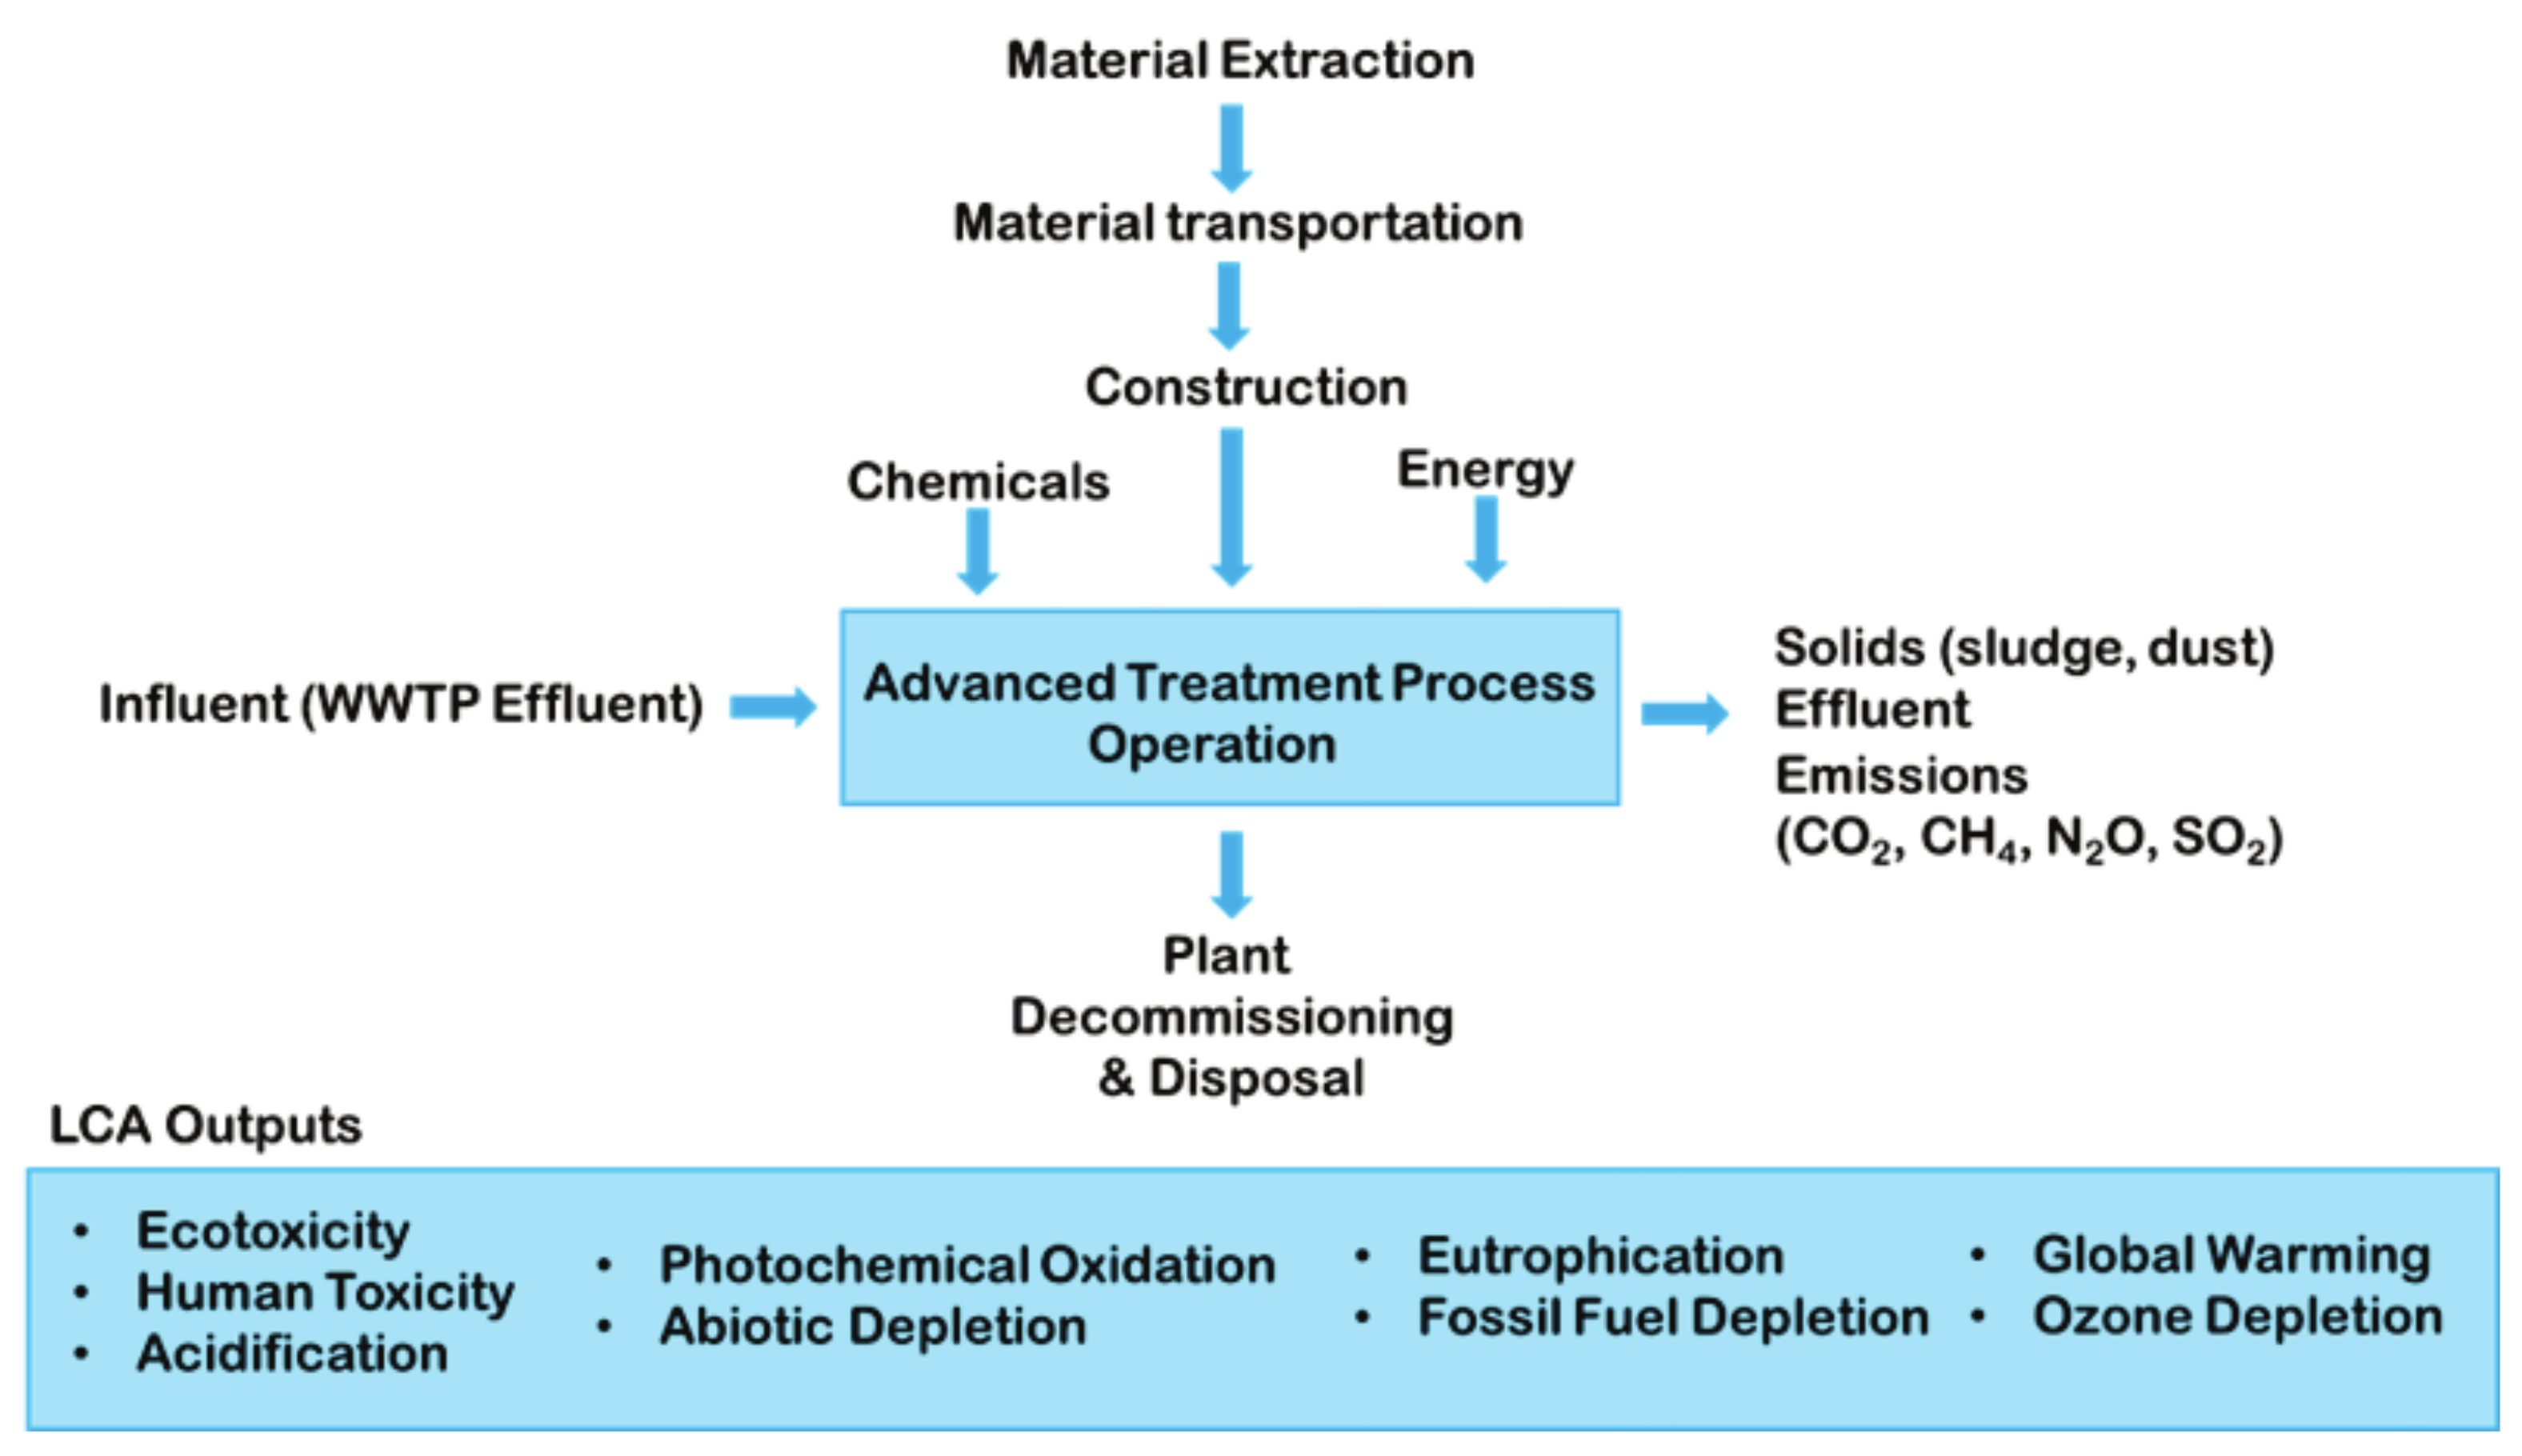
4.3. Sustainable Process Analysis
5. Conclusions
Supplementary Materials
Author Contributions
Funding
Institutional Review Board Statement
Informed Consent Statement
Data Availability Statement
Acknowledgments
Conflicts of Interest
Abbreviations
| CS | fourth cleaning stage |
| AOP | advanced oxidation process |
| GAC | granular activated carbon |
| GHG | Greenhouse gas |
| LCA | Life Cycle Assessments |
| n.s. | not significant |
| PFAS | poly- and perfluoroalkyl substances |
| SAC | spectra absorption coefficient at 254 nm |
| TOC | total organic carbon |
| UV | ultraviolet light |
| WWTP | wastewater treatment plant |
References
- United Nations Environment Programme. Sick Water? The Central Role of Wastewater Management in Sustainable Development: A Rapid Response Assessment; UNEP/GRID-Arendal: Arendal, Norway, 2010; ISBN 978-82-7701-075-5. [Google Scholar]
- Alabaster, G.; Johnston, R.; Thevenon, F.; Shantz, A. Progress on Wastewater Treatment Global Status and Acceleration Needs for SDG Indicator 6.3.1; UN-Habitat: Nairobi, Kenya; WHO: Geneva, Switzerland, 2021. [Google Scholar]
- Crutchik, D.; Campos, J.L. Municipal Wastewater Reuse: Is it a Competitive Alternative to Seawater Desalination? Sustainability 2021, 13, 6815. [Google Scholar] [CrossRef]
- Bixio, D.; Thoeye, C.; Koning, J.d.; Joksimovic, D.; Savic, D.; Wintgens, T.; Melin, T. Wastewater reuse in Europe. Desalination 2006, 187, 89–101. [Google Scholar] [CrossRef]
- Takeuchi, H.; Tanaka, H. Water reuse and recycling in Japan—History, current situation, and future perspectives. Water Cycle 2020, 1, 1–12. [Google Scholar] [CrossRef]
- Ofori, S.; Puškáčová, A.; Růžičková, I.; Wanner, J. Treated wastewater reuse for irrigation: Pros and cons. Sci. Total Environ. 2021, 760, 144026. [Google Scholar] [CrossRef]
- Han, N.; Zhang, J.; Hoang, M.; Gray, S.; Xie, Z. A review of process and wastewater reuse in the recycled paper industry. Environ. Technol. Innov. 2021, 24, 101860. [Google Scholar] [CrossRef]
- Mateo-Sagasta, J.; Raschid-Sally, L.; Thebo, A. Global Wastewater and Sludge Production, Treatment and Use. In Wastewater; Drechsel, P., Qadir, M., Wichelns, D., Eds.; Springer: Dordrecht, The Netherlands, 2015; pp. 15–38. ISBN 978-94-017-9544-9. [Google Scholar]
- Krishnamoorthy, N.; Dey, B.; Unpaprom, Y.; Ramaraj, R.; Maniam, G.P.; Govindan, N.; Jayaraman, S.; Arunachalam, T.; Paramasivan, B. Engineering principles and process designs for phosphorus recovery as struvite: A comprehensive review. J. Environ. Chem. Eng. 2021, 9, 105579. [Google Scholar] [CrossRef]
- Peccia, J.; Zulli, A.; Brackney, D.E.; Grubaugh, N.D.; Kaplan, E.H.; Casanovas-Massana, A.; Ko, A.I.; Malik, A.A.; Wang, D.; Wang, M.; et al. Measurement of SARS-CoV-2 RNA in wastewater tracks community infection dynamics. Nat. Biotechnol. 2020, 38, 1164–1167. [Google Scholar] [CrossRef]
- European Commission. Urban Waste Water Directive Overview. Available online: https://ec.europa.eu/environment/water/water-urbanwaste/index_en.html (accessed on 14 July 2022).
- Federal Ministry for Environment Nature Conservation and Nuclear Safety. Available online: https://www.bmuv.de/en/topics/water-resources-waste/water-management/wastewater (accessed on 14 July 2022).
- Luo, Y.; Guo, W.; Ngo, H.H.; Nghiem, L.D.; Hai, F.I.; Zhang, J.; Liang, S.; Wang, X.C. A review on the occurrence of micropollutants in the aquatic environment and their fate and removal during wastewater treatment. Sci. Total Environ. 2014, 473–474, 619–641. [Google Scholar] [CrossRef]
- Nowotny, N.; Epp, B.; von Sonntag, C.; Fahlenkamp, H. Quantification and modeling of the elimination behavior of ecologically problematic wastewater micropollutants by adsorption on powdered and granulated activated carbon. Environ. Sci. Technol. 2007, 41, 2050–2055. [Google Scholar] [CrossRef]
- Margot, J.; Kienle, C.; Magnet, A.; Weil, M.; Rossi, L.; de Alencastro, L.F.; Abegglen, C.; Thonney, D.; Chèvre, N.; Schärer, M.; et al. Treatment of micropollutants in municipal wastewater: Ozone or powdered activated carbon? Sci. Total Environ. 2013, 461–462, 480–498. [Google Scholar] [CrossRef]
- Athing, M.; Braue, F.; Duffek, A.; Ebert, I.; Eckhardt, A.; Hassold, E.; Helmecke, M.; Kirst, I.; Krause, B.; Lepom, P.; et al. Recommendations for Reducing Micropollutants in Waters; Umweltbundesamt: Dessau-Roßlau, Germany, 2018. [Google Scholar]
- Gautam, K.; Anbumani, S. Ecotoxicological effects of organic micro-pollutants on the environment. In Current Developments in Biotechnology and Bioengineering; Elsevier: Amsterdam, The Netherlands, 2020; pp. 481–501. ISBN 9780128195949. [Google Scholar]
- Rogowska, J.; Cieszynska-Semenowicz, M.; Ratajczyk, W.; Wolska, L. Micropollutants in treated wastewater. Ambio 2020, 49, 487–503. [Google Scholar] [CrossRef]
- Gosset, A.; Polomé, P.; Perrodin, Y. Ecotoxicological risk assessment of micropollutants from treated urban wastewater effluents for watercourses at a territorial scale: Application and comparison of two approaches. Int. J. Hyg. Environ. Health 2020, 224, 113437. [Google Scholar] [CrossRef]
- Kokkinos, P.; Mantzavinos, D.; Venieri, D. Current Trends in the Application of Nanomaterials for the Removal of Emerging Micropollutants and Pathogens from Water. Molecules 2020, 25, 2016. [Google Scholar] [CrossRef]
- Rashid, R.; Shafiq, I.; Akhter, P.; Iqbal, M.J.; Hussain, M. A state-of-the-art review on wastewater treatment techniques: The effectiveness of adsorption method. Environ. Sci. Pollut. Res. 2021, 28, 9050–9066. [Google Scholar] [CrossRef]
- Kårelid, V.; Larsson, G.; Björlenius, B. Pilot-scale removal of pharmaceuticals in municipal wastewater: Comparison of granular and powdered activated carbon treatment at three wastewater treatment plants. J. Environ. Manag. 2017, 193, 491–502. [Google Scholar] [CrossRef]
- Derco, J.; Gotvajn, A.Ž.; Čižmárová, O.; Dudáš, J.; Sumegová, L.; Šimovičová, K. Removal of Micropollutants by Ozone-Based Processes. Processes 2021, 9, 1013. [Google Scholar] [CrossRef]
- Mishra, S.; Singh, R.P.; Rout, P.K.; Das, A.P. Membrane bioreactor (MBR) as an advanced wastewater treatment technology for removal of synthetic microplastics. In Development in Wastewater Treatment Research and Processes; Elsevier: Amsterdam, The Netherlands, 2022; pp. 45–60. ISBN 9780323855839. [Google Scholar]
- Jones, O.A.H.; Green, P.G.; Voulvoulis, N.; Lester, J.N. Questioning the excessive use of advanced treatment to remove organic micropollutants from wastewater. Environ. Sci. Technol. 2007, 41, 5085–5089. [Google Scholar] [CrossRef]
- Joss, A.; Siegrist, H.; Ternes, T.A. Are we about to upgrade wastewater treatment for removing organic micropollutants? Water Sci. Technol. 2008, 57, 251–255. [Google Scholar] [CrossRef]
- Lim, S.; Shi, J.L.; von Gunten, U.; McCurry, D.L. Ozonation of organic compounds in water and wastewater: A critical review. Water Res. 2022, 213, 118053. [Google Scholar] [CrossRef]
- Oturan, M.A.; Aaron, J.-J. Advanced Oxidation Processes in Water/Wastewater Treatment: Principles and Applications. A Review. Crit. Rev. Environ. Sci. Technol. 2014, 44, 2577–2641. [Google Scholar] [CrossRef]
- Kruithof, J.C.; Kamp, P.C.; Martijn, B.J. UV/H2O2 Treatment: A Practical Solution for Organic Contaminant Control and Primary Disinfection. Ozone Sci. Eng. 2007, 29, 273–280. [Google Scholar] [CrossRef]
- Wang, F.; van Halem, D.; Liu, G.; Lekkerkerker-Teunissen, K.; van der Hoek, J.P. Effect of residual H2O2 from advanced oxidation processes on subsequent biological water treatment: A laboratory batch study. Chemosphere 2017, 185, 637–646. [Google Scholar] [CrossRef] [PubMed]
- SUEZ Water A/S. Micropollutants Anticipating Future Challenges. Available online: https://www.suez.com/-/media/suez-global/files/dk/brochures/brochure-micropollutants-anticipating-future-challenges.pdf?open=true (accessed on 8 September 2022).
- Ghimire, U.; Sarpong, G.; Gude, V.G. Transitioning Wastewater Treatment Plants toward Circular Economy and Energy Sustainability. ACS Omega 2021, 6, 11794–11803. [Google Scholar] [CrossRef]
- Padilla-Rivera, A.; Morgan-Sagastume, J.M.; Güereca-Hernández, L.P. Sustainability Assessment of Wastewater Systems: An Environmental and Economic Approach. J. Environ. Prot. 2019, 10, 241–259. [Google Scholar] [CrossRef]
- Padrón-Páez, J.I.; Almaraz, S.D.-L.; Román-Martínez, A. Sustainable wastewater treatment plants design through multiobjective optimization. Comput. Chem. Eng. 2020, 140, 106850. [Google Scholar] [CrossRef]
- Entsorgungs- und Wirtschaftsbetrieb Landau. Kläranlage. Available online: https://www.ew-landau.de/Abwasser/Kläranlage/ (accessed on 14 July 2022).
- Kompetenzzentrum Spurenstoffe Baden-Württemberg. Handlungsempfehlungen für die Vergleichskontrolle und den Betrieb von Verfahrenstechniken zur Gezielten Spurenstoffelimination. Available online: https://koms-bw.de/cms/content/media/KomS_Handlungsempfehlung_Stand_07.2018_korrigiert.pdf (accessed on 8 September 2022).
- Sari, S.; Ozdemir, G.; Yangin-Gomec, C.; Zengin, G.E.; Topuz, E.; Aydin, E.; Pehlivanoglu-Mantas, E.; Okutman Tas, D. Seasonal variation of diclofenac concentration and its relation with wastewater characteristics at two municipal wastewater treatment plants in Turkey. J. Hazard. Mater. 2014, 272, 155–164. [Google Scholar] [CrossRef]
- Vieno, N.M.; Tuhkanen, T.; Kronberg, L. Seasonal variation in the occurrence of pharmaceuticals in effluents from a sewage treatment plant and in the recipient water. Environ. Sci. Technol. 2005, 39, 8220–8226. [Google Scholar] [CrossRef]
- Margot, J.; Rossi, L.; Barry, D.A.; Holliger, C. A review of the fate of micropollutants in wastewater treatment plants. WIREs Water 2015, 2, 457–487. [Google Scholar] [CrossRef]
- Bayer, A.; Asner, R.; Schüssler, W.; Kopf, W.; Weiß, K.; Sengl, M.; Letzel, M. Behavior of sartans (antihypertensive drugs) in wastewater treatment plants, their occurrence and risk for the aquatic environment. Environ. Sci. Pollut. Res. 2014, 21, 10830–10839. [Google Scholar] [CrossRef]
- Wolff, D.; Krah, D.; Dötsch, A.; Ghattas, A.-K.; Wick, A.; Ternes, T.A. Insights into the variability of microbial community composition and micropollutant degradation in diverse biological wastewater treatment systems. Water Res. 2018, 143, 313–324. [Google Scholar] [CrossRef]
- Gao, H.; LaVergne, J.M.; Carpenter, C.M.G.; Desai, R.; Zhang, X.; Gray, K.; Helbling, D.E.; Wells, G.F. Exploring co-occurrence patterns between organic micropollutants and bacterial community structure in a mixed-use watershed. Environ. Sci. Process. Impacts 2019, 21, 867–880. [Google Scholar] [CrossRef] [PubMed]
- Helbling, C.; Abanilla, M.; Lee, L.; Karbhari, V.M. Issues of variability and durability under synergistic exposure conditions related to advanced polymer composites in the civil infrastructure. Compos. Part A Appl. Sci. Manuf. 2006, 37, 1102–1110. [Google Scholar] [CrossRef]
- Aymerich, I.; Acuña, V.; Ort, C.; Rodríguez-Roda, I.; Corominas, L. Fate of organic microcontaminants in wastewater treatment and river systems: An uncertainty assessment in view of sampling strategy, and compound consumption rate and degradability. Water Res. 2017, 125, 152–161. [Google Scholar] [CrossRef] [PubMed]
- Mehta, S.; Shah, R.P.; Priyadarshi, R.; Singh, S. LC and LC-MS/TOF studies on stress degradation behaviour of candesartan cilexetil. J. Pharm. Biomed. Anal. 2010, 52, 345–354. [Google Scholar] [CrossRef]
- Luongo, G.; Saviano, L.; Libralato, G.; Guida, M.; Siciliano, A.; Previtera, L.; Di Fabio, G.; Zarrelli, A. Secondary Effects of Hypochlorite Treatment on the Emerging Pollutant Candesartan: The Formation of Degradation Byproducts and Their Toxicological Profiles. Molecules 2021, 26, 3422. [Google Scholar] [CrossRef]
- Yang, X.; Flowers, R.C.; Weinberg, H.S.; Singer, P.C. Occurrence and removal of pharmaceuticals and personal care products (PPCPs) in an advanced wastewater reclamation plant. Water Res. 2011, 45, 5218–5228. [Google Scholar] [CrossRef]
- Östman, M.; Björlenius, B.; Fick, J.; Tysklind, M. Effect of full-scale ozonation and pilot-scale granular activated carbon on the removal of biocides, antimycotics and antibiotics in a sewage treatment plant. Sci. Total Environ. 2019, 649, 1117–1123. [Google Scholar] [CrossRef]
- Kim, I.; Yamashita, N.; Tanaka, H. Performance of UV and UV/H2O2 processes for the removal of pharmaceuticals detected in secondary effluent of a sewage treatment plant in Japan. J. Hazard. Mater. 2009, 166, 1134–1140. [Google Scholar] [CrossRef]
- Wols, B.A.; Harmsen, D.J.H.; van Remmen, T.; Beerendonk, E.F.; Hofman-Caris, C.H.M. Design aspects of UV/H2O2 reactors. Chem. Eng. Sci. 2015, 137, 712–721. [Google Scholar] [CrossRef]
- Zhan, L.; Li, W.; Liu, L.; Han, T.; Li, M.; Qiang, Z. Degradation of micropolluants in flow-through VUV/UV/H2O2 reactors: Effects of H2O2 dosage and reactor internal diameter. J. Environ. Sci. 2021, 110, 28–37. [Google Scholar] [CrossRef]
- De Boer, S.; González-Rodríguez, J.; Conde, J.J.; Moreira, M.T. Benchmarking tertiary water treatments for the removal of micropollutants and pathogens based on operational and sustainability criteria. J. Water Process Eng. 2022, 46, 102587. [Google Scholar] [CrossRef]
- Kunacheva, C.; Fujii, S.; Tanaka, S.; Seneviratne, S.T.M.L.D.; Lien, N.P.H.; Nozoe, M.; Kimura, K.; Shivakoti, B.R.; Harada, H. Worldwide surveys of perfluorooctane sulfonate (PFOS) and perfluorooctanoic acid (PFOA) in water environment in recent years. Water Sci. Technol. 2012, 66, 2764–2771. [Google Scholar] [CrossRef] [PubMed]
- Thompson, J.; Eaglesham, G.; Reungoat, J.; Poussade, Y.; Bartkow, M.; Lawrence, M.; Mueller, J.F. Removal of PFOS, PFOA and other perfluoroalkyl acids at water reclamation plants in South East Queensland Australia. Chemosphere 2011, 82, 9–17. [Google Scholar] [CrossRef] [PubMed]
- Huang, J.; Wang, X.; Pan, Z.; Li, X.; Ling, Y.; Li, L. Efficient degradation of perfluorooctanoic acid (PFOA) by photocatalytic ozonation. Chem. Eng. J. 2016, 296, 329–334. [Google Scholar] [CrossRef]
- Sonmez Baghirzade, B.; Zhang, Y.; Reuther, J.F.; Saleh, N.B.; Venkatesan, A.K.; Apul, O.G. Thermal Regeneration of Spent Granular Activated Carbon Presents an Opportunity to Break the Forever PFAS Cycle. Environ. Sci. Technol. 2021, 55, 5608–5619. [Google Scholar] [CrossRef]
- Cantoni, B.; Turolla, A.; Wellmitz, J.; Ruhl, A.S.; Antonelli, M. Perfluoroalkyl substances (PFAS) adsorption in drinking water by granular activated carbon: Influence of activated carbon and PFAS characteristics. Sci. Total Environ. 2021, 795, 148821. [Google Scholar] [CrossRef]
- Arias Espana, V.A.; Mallavarapu, M.; Naidu, R. Treatment technologies for aqueous perfluorooctanesulfonate (PFOS) and perfluorooctanoate (PFOA): A critical review with an emphasis on field testing. Environ. Technol. Innov. 2015, 4, 168–181. [Google Scholar] [CrossRef]
- Benstöm, F. Granular Activated Carbon for the Elimination of Organic Micropollutants form Municipal Wastewater; RWTH Aachen University: Aachen, Germany, 2017. [Google Scholar]
- Hofman-Caris, C.; Harmsen, D.; Wols, J.B.; van Pol, W.; Knol, T.; van Remmen, T.; Hofman, J. Energy Efficient UV/H2O2 Processes for Conversion of Pharmaceuticals in Drinking Water: Effect of Water Quality. Available online: https://purehost.bath.ac.uk/ws/portalfiles/portal/126999015/Paper_Aachen_2015_.pdf (accessed on 14 July 2022).
- Mehling, S.; Schnabel, T.; Londong, J. Behavior of matrix parameters and their correlation to micro-pollutant degradation during treatment of real wastewater by carrier-bound photocatalytic ozonation. Water Sci. Technol. 2022, 85, 1964–1980. [Google Scholar] [CrossRef]
- Chon, K.; Salhi, E.; von Gunten, U. Combination of UV absorbance and electron donating capacity to assess degradation of micropollutants and formation of bromate during ozonation of wastewater effluents. Water Res. 2015, 81, 388–397. [Google Scholar] [CrossRef]
- Ratola, N.; Cincinelli, A.; Alves, A.; Katsoyiannis, A. Occurrence of organic microcontaminants in the wastewater treatment process. A mini review. J. Hazard. Mater. 2012, 239–240, 1–18. [Google Scholar] [CrossRef]
- Mousel, D.; Palmowski, L.; Pinnekamp, J. Energy demand for elimination of organic micropollutants in municipal wastewater treatment plants. Sci. Total Environ. 2017, 575, 1139–1149. [Google Scholar] [CrossRef] [PubMed]
- Argoti, A.; Orjuela, A.; Narváez, P.C. Challenges and opportunities in assessing sustainability during chemical process design. Curr. Opin. Chem. Eng. 2019, 26, 96–103. [Google Scholar] [CrossRef]
- Yenkie, K.M. Integrating the three E’s in wastewater treatment: Efficient design, economic viability, and environmental sustainability. Curr. Opin. Chem. Eng. 2019, 26, 131–138. [Google Scholar] [CrossRef]
- Igos, E.; Benetto, E.; Venditti, S.; Kohler, C.; Cornelissen, A.; Moeller, R.; Biwer, A. Is it better to remove pharmaceuticals in decentralized or conventional wastewater treatment plants? A life cycle assessment comparison. Sci. Total Environ. 2012, 438, 533–540. [Google Scholar] [CrossRef]
- Igos, E.; Benetto, E.; Venditti, S.; Köhler, C.; Cornelissen, A. Comparative and integrative environmental assessment of advanced wastewater treatment processes based on an average removal of pharmaceuticals. Water Sci. Technol. 2013, 67, 387–394. [Google Scholar] [CrossRef]
- Li, Y.; Zhang, S.; Zhang, W.; Xiong, W.; Ye, Q.; Hou, X.; Wang, C.; Wang, P. Life cycle assessment of advanced wastewater treatment processes: Involving 126 pharmaceuticals and personal care products in life cycle inventory. J. Environ. Manag. 2019, 238, 442–450. [Google Scholar] [CrossRef]
- Remy, C.; Miehe, U.; Lesjean, B.; Bartholomäus, C. Comparing environmental impacts of tertiary wastewater treatment technologies for advanced phosphorus removal and disinfection with life cycle assessment. Water Sci. Technol. 2014, 69, 1742–1750. [Google Scholar] [CrossRef]
- Rahman, S.M.; Eckelman, M.J.; Onnis-Hayden, A.; Gu, A.Z. Comparative Life Cycle Assessment of Advanced Wastewater Treatment Processes for Removal of Chemicals of Emerging Concern. Environ. Sci. Technol. 2018, 52, 11346–11358. [Google Scholar] [CrossRef]
- Eggen, R.I.L.; Hollender, J.; Joss, A.; Schärer, M.; Stamm, C. Reducing the discharge of micropollutants in the aquatic environment: The benefits of upgrading wastewater treatment plants. Environ. Sci. Technol. 2014, 48, 7683–7689. [Google Scholar] [CrossRef]
- Zepon Tarpani, R.R.; Azapagic, A. Life cycle environmental impacts of advanced wastewater treatment techniques for removal of pharmaceuticals and personal care products (PPCPs). J. Environ. Manag. 2018, 215, 258–272. [Google Scholar] [CrossRef]
- Gretzschel, O.; Schäfer, M.; Steinmetz, H.; Pick, E.; Kanitz, K.; Krieger, S. Advanced Wastewater Treatment to Eliminate Organic Micropollutants in Wastewater Treatment Plants in Combination with Energy-Efficient Electrolysis at WWTP Mainz. Energies 2020, 13, 3599. [Google Scholar] [CrossRef]
- Hasanpour, M.; Hatami, M. Photocatalytic performance of aerogels for organic dyes removal from wastewaters: Review study. J. Mol. Liq. 2020, 309, 113094. [Google Scholar] [CrossRef]
- Hasanpour, M.; Hatami, M. Application of three dimensional porous aerogels as adsorbent for removal of heavy metal ions from water/wastewater: A review study. Adv. Colloid Interface Sci. 2020, 284, 102247. [Google Scholar] [CrossRef]
- Schuhen, K.; Hiller, C.; Schober, D.; Richter, W.M.; Duchscherer, M.; Lamour, Y. Wastewater sanitation, drinking water treatment and groundwater remediation: New concepts, new materials and new application-oriented solutions for clean water–worldwide. Water Solut. 2016, 1, 46–54. [Google Scholar]
- Baresel, C.; Ek, M.; Ejhed, H.; Allard, A.-S.; Magnér, J.; Dahlgren, L.; Westling, K.; Wahlberg, C.; Fortkamp, U.; Söhr, S.; et al. Sustainable treatment systems for removal of pharmaceutical residues and other priority persistent substances. Water Sci. Technol. 2019, 79, 537–543. [Google Scholar] [CrossRef] [PubMed]
- Jeswani, H.K.; Gujba, H.; Brown, N.W.; Roberts, E.P.L.; Azapagic, A. Removal of organic compounds from water: Life cycle environmental impacts and economic costs of the Arvia process compared to granulated activated carbon. J. Clean. Prod. 2015, 89, 203–213. [Google Scholar] [CrossRef]


| Parameter | Test Procedure |
|---|---|
| pH | DIN 38404-C 4: 1976-12 |
| Electrical conductivity (at 25 °C) | DIN EN 27888-C 8: 1993-11 |
| TOC | DIN EN ISO 10523-C 5: 2012-04 |
| Candesartan | LAM-MLC.M.0051: 2015-08 * |
| Carbamazepine | LAM-MLC.M.0051: 2015-08 * |
| Diclofenac | LAM-MLC.M.0051: 2015-08 * |
| Hydrochlorothiazide | LAM-MLC.M.0051: 2015-08 * |
| Ibuprofen | LAM-MLC.M.0051: 2015-08 * |
| Irbesartan | LAM-MLC.M.0051: 2015-08 * |
| Metoprolol | LAM-MLC.M.0051: 2015-08 * |
| Sulfamethoxazole | LAM-MLC.M.0051: 2015-08 * |
| Benzotriazole | LAM-MLC.M.0051: 2015-08 * |
| Sum of 4- and 5-methylbenzotriazole | LAM-MLC.M.0051: 2015-08 * |
| AOP | GAC | |
|---|---|---|
| Micropollutant removal efficiency | ||
| Energy demand | ||
| Adaptability | ||
| Waste amount | ||
| CAPEX | ||
| OPEX | ||
| Energy for reagent (H2O2 or activated carbon production) |
| H2O2 (ppm) | 20 | 30 | 40 | |
|---|---|---|---|---|
| UV (kJ/m2) | 5 | 10 | 7.5 | 5 |
| H2O2 (kg/m3) | 0.02 | 0.02 | 0.03 | 0.04 |
| H2O2 (EUR/m3) | € 0.015 | € 0.015 | € 0.022 | € 0.029 |
| Energy kWh/m3 | 0.27 | 0.54 | 0.41 | 0.27 |
| Energy (EUR/m3) | € 0.08 | € 0.16 | € 0.12 | € 0.08 |
| Total Energy for AOP for 1 year (MWh/year) | 986 | 1973 | 1498 | 986 |
Publisher’s Note: MDPI stays neutral with regard to jurisdictional claims in published maps and institutional affiliations. |
© 2022 by the authors. Licensee MDPI, Basel, Switzerland. This article is an open access article distributed under the terms and conditions of the Creative Commons Attribution (CC BY) license (https://creativecommons.org/licenses/by/4.0/).
Share and Cite
Sturm, M.T.; Myers, E.; Schober, D.; Thege, C.; Korzin, A.; Schuhen, K. Adaptable Process Design as a Key for Sustainability Upgrades in Wastewater Treatment: Comparative Study on the Removal of Micropollutants by Advanced Oxidation and Granular Activated Carbon Processing at a German Municipal Wastewater Treatment Plant. Sustainability 2022, 14, 11605. https://doi.org/10.3390/su141811605
Sturm MT, Myers E, Schober D, Thege C, Korzin A, Schuhen K. Adaptable Process Design as a Key for Sustainability Upgrades in Wastewater Treatment: Comparative Study on the Removal of Micropollutants by Advanced Oxidation and Granular Activated Carbon Processing at a German Municipal Wastewater Treatment Plant. Sustainability. 2022; 14(18):11605. https://doi.org/10.3390/su141811605
Chicago/Turabian StyleSturm, Michael Toni, Erika Myers, Dennis Schober, Clara Thege, Anika Korzin, and Katrin Schuhen. 2022. "Adaptable Process Design as a Key for Sustainability Upgrades in Wastewater Treatment: Comparative Study on the Removal of Micropollutants by Advanced Oxidation and Granular Activated Carbon Processing at a German Municipal Wastewater Treatment Plant" Sustainability 14, no. 18: 11605. https://doi.org/10.3390/su141811605
APA StyleSturm, M. T., Myers, E., Schober, D., Thege, C., Korzin, A., & Schuhen, K. (2022). Adaptable Process Design as a Key for Sustainability Upgrades in Wastewater Treatment: Comparative Study on the Removal of Micropollutants by Advanced Oxidation and Granular Activated Carbon Processing at a German Municipal Wastewater Treatment Plant. Sustainability, 14(18), 11605. https://doi.org/10.3390/su141811605